external trade statistics timor leste · ministerio das finanças monthly reports october, 2018...
TRANSCRIPT

Ministerio das Finanças
MONTHLY REPORTS October, 2018
EXTERNAL TRADE STATISTICS TIMOR-LESTE
Sr. Cristino Gusmão Director Nacional Economia Estatistica e Social No. Telp: +(670) 77230127 Direcção Geral de Estatística Rua de Caicoli, Dili, PO Box 10 Telefone: +(670) 3311348 email: [email protected]
www.statistics.gov.tl
i MONTHLY EXTERNAL TRADE STATISTICS, OCTOBER 2018
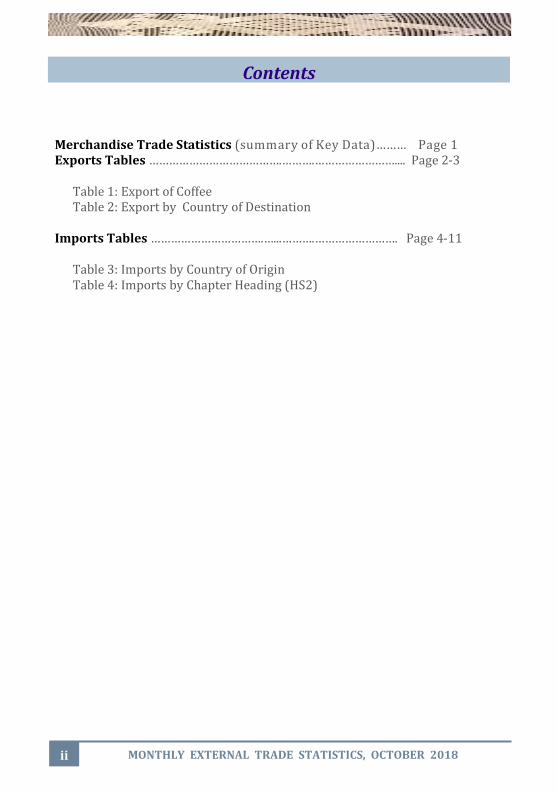
Merchandise Trade Statistics (summary of Key Data)……… Page 1 Exports Tables ………………………………….……….…………………….... Page 2-3
Table 1: Export of Coffee Table 2: Export by Country of Destination
Imports Tables …………………………….…...……….……………………. Page 4-11
Table 3: Imports by Country of Origin Table 4: Imports by Chapter Heading (HS2)
Contents
ii MONTHLY EXTERNAL TRADE STATISTICS, OCTOBER 2018
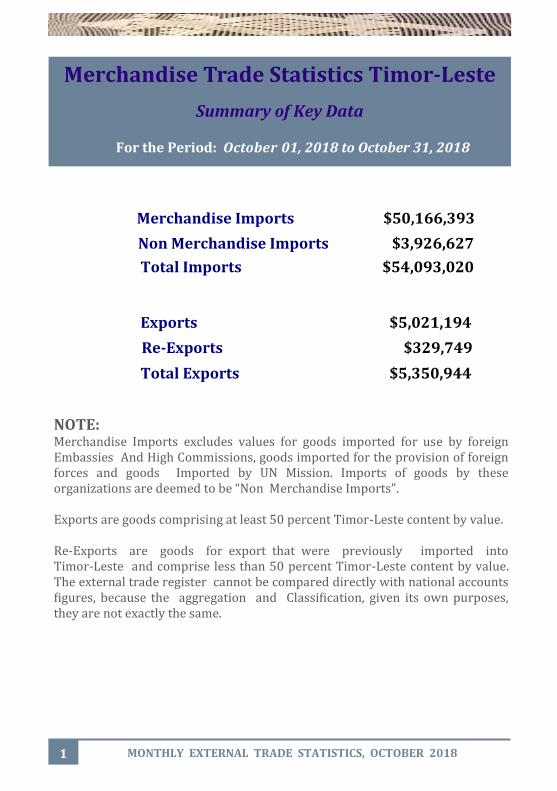
Merchandise Imports $50,166,393
Non Merchandise Imports $3,926,627
Total Imports $54,093,020
Exports $5,021,194
Re-Exports $329,749
Total Exports $5,350,944
NOTE: Merchandise Imports excludes values for goods imported for use by foreign Embassies And High Commissions, goods imported for the provision of foreign forces and goods Imported by UN Mission. Imports of goods by these organizations are deemed to be “Non Merchandise Imports". Exports are goods comprising at least 50 percent Timor-Leste content by value. Re-Exports are goods for export that were previously imported into Timor-Leste and comprise less than 50 percent Timor-Leste content by value. The external trade register cannot be compared directly with national accounts figures, because the aggregation and Classification, given its own purposes, they are not exactly the same.
Merchandise Trade Statistics Timor-Leste
Summary of Key Data
For the Period: October 01, 2018 to October 31, 2018
1 MONTHLY EXTERNAL TRADE STATISTICS, OCTOBER 2018
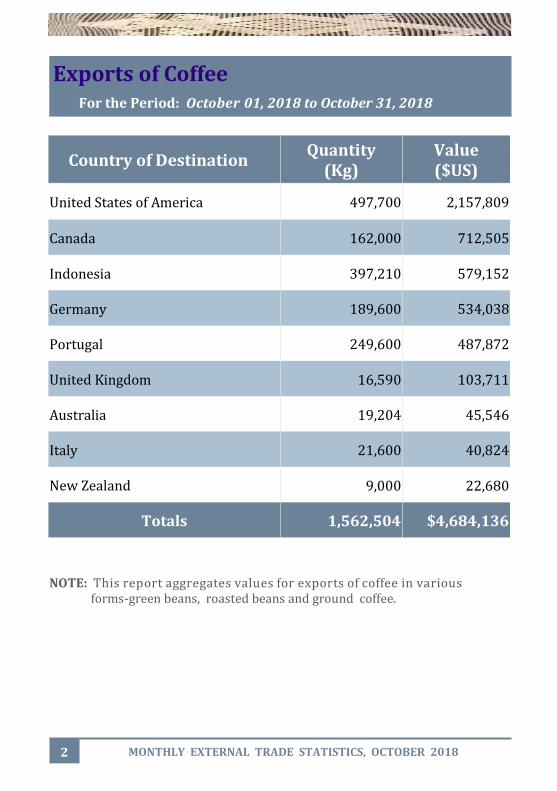
Exports of Coffee For the Period: October 01, 2018 to October 31, 2018
Country of Destination Quantity
(Kg) Value ($US)
United States of America 497,700 2,157,809
Canada 162,000 712,505
Indonesia 397,210 579,152
Germany 189,600 534,038
Portugal 249,600 487,872
United Kingdom 16,590 103,711
Australia 19,204 45,546
Italy 21,600 40,824
New Zealand 9,000 22,680
Totals 1,562,504 $4,684,136
NOTE: This report aggregates values for exports of coffee in various forms-green beans, roasted beans and ground coffee.
2 MONTHLY EXTERNAL TRADE STATISTICS, OCTOBER 2018
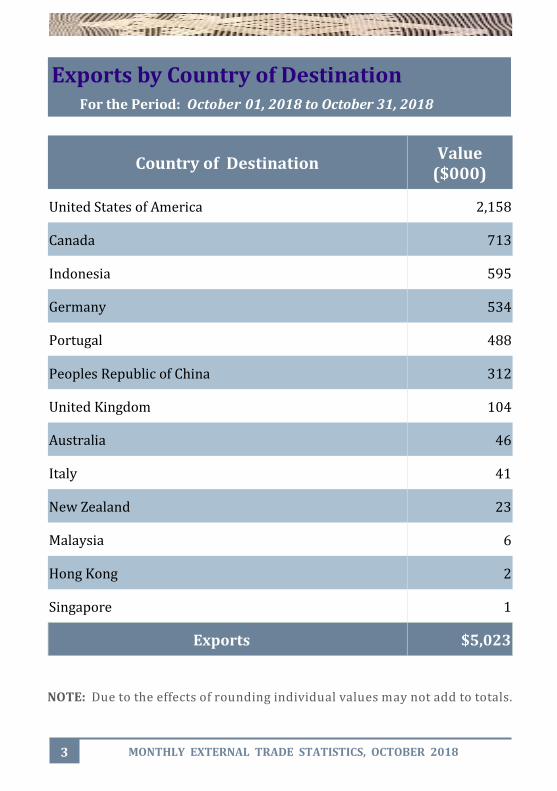
Country of Destination Value
($000)
United States of America 2,158
Canada 713
Indonesia 595
Germany 534
Portugal 488
Peoples Republic of China 312
United Kingdom 104
Australia 46
Italy 41
New Zealand 23
Malaysia 6
Hong Kong 2
Singapore 1
Exports $5,023
NOTE: Due to the effects of rounding individual values may not add to totals.
Exports by Country of Destination For the Period: October 01, 2018 to October 31, 2018
3 MONTHLY EXTERNAL TRADE STATISTICS, OCTOBER 2018
Continue...
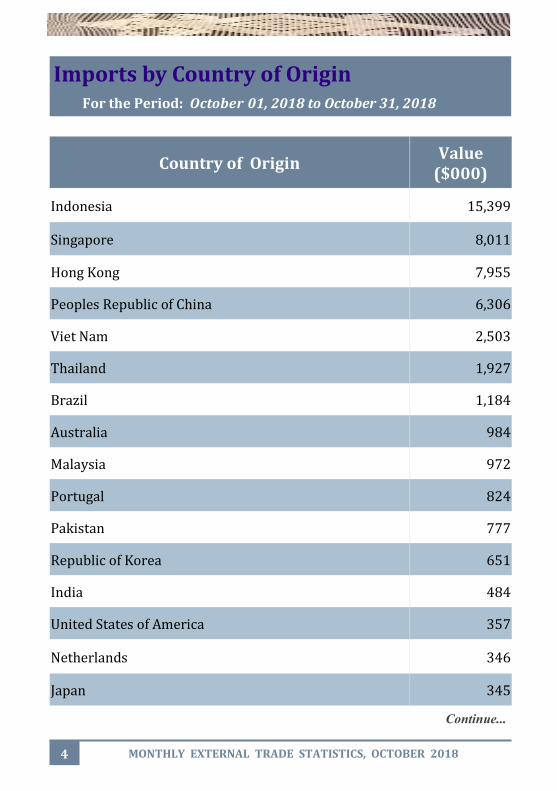
Country of Origin Value
($000)
Indonesia 15,399
Singapore 8,011
Hong Kong 7,955
Peoples Republic of China 6,306
Viet Nam 2,503
Thailand 1,927
Brazil 1,184
Australia 984
Malaysia 972
Portugal 824
Pakistan 777
Republic of Korea 651
India 484
United States of America 357
Netherlands 346
Japan 345
Imports by Country of Origin For the Period: October 01, 2018 to October 31, 2018
4 MONTHLY EXTERNAL TRADE STATISTICS, OCTOBER 2018
Continue...
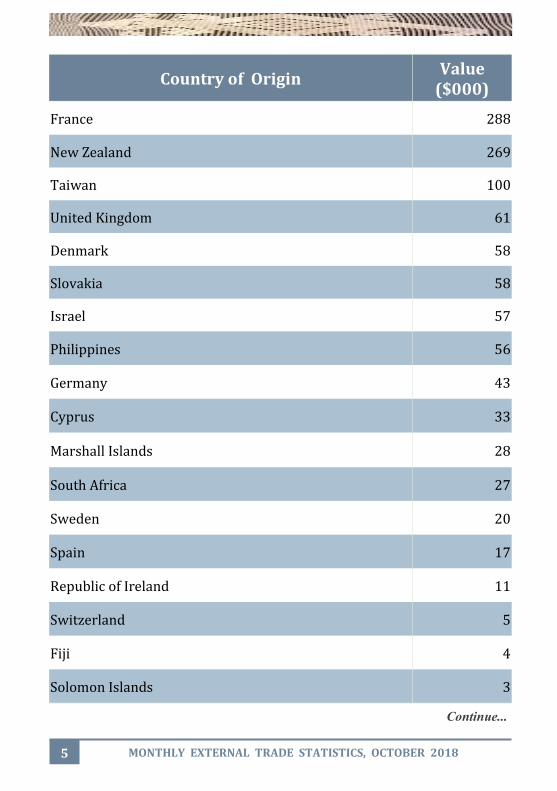
Country of Origin Value
($000)
France 288
New Zealand 269
Taiwan 100
United Kingdom 61
Denmark 58
Slovakia 58
Israel 57
Philippines 56
Germany 43
Cyprus 33
Marshall Islands 28
South Africa 27
Sweden 20
Spain 17
Republic of Ireland 11
Switzerland 5
Fiji 4
Solomon Islands 3
5 MONTHLY EXTERNAL TRADE STATISTICS, OCTOBER 2018
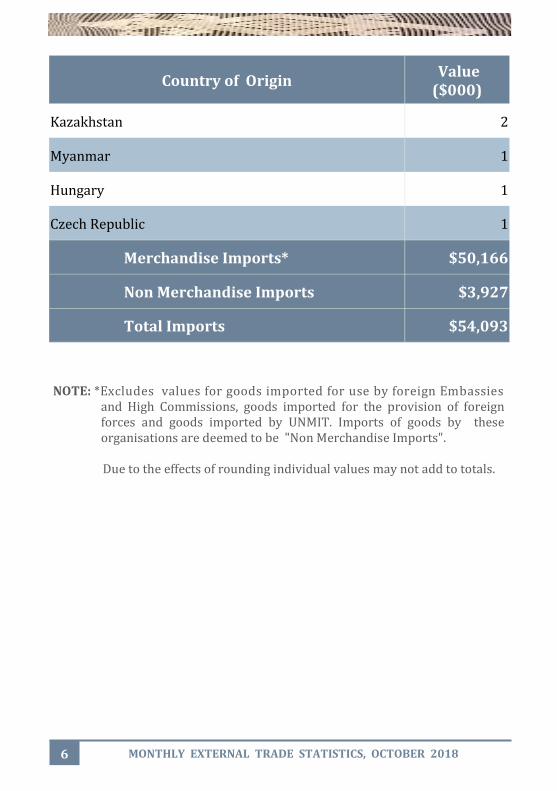
Country of Origin Value ($000)
Kazakhstan 2
Myanmar 1
Hungary 1
Czech Republic 1
Merchandise Imports* $50,166
Non Merchandise Imports $3,927
Total Imports $54,093
NOTE: *Excludes values for goods imported for use by foreign Embassies and High Commissions, goods imported for the provision of foreign forces and goods imported by UNMIT. Imports of goods by these organisations are deemed to be "Non Merchandise Imports".
Due to the effects of rounding individual values may not add to totals.
6 MONTHLY EXTERNAL TRADE STATISTICS, OCTOBER 2018

HS Chapter
HS Description Value
($000)
02 Meat and edible meat offal 2,310
03 Fish and crustaceans, mollusks and other aquatic invertebrates
195
04 Dairy produce, birds' eggs, natural honey, edible products of animal origin, not elsewhere specified or included
1,121
05 Animal originated products, not elsewhere specified or included 2
07 Vegetables and certain roots and tubers, edible 46
08 Fruit and nuts, edible, peel of citrus fruit or melons 154
09 Coffee, tea, mate and spices 215
10 Cereals 4,166
11 Products of the milling industry, malt, starches, inulin, wheat gluten
398
12 Oil seeds and oleaginous fruits, miscellaneous grains, seeds and fruit, industrial or medicinal plants, straw etc.
23
13 Lac; gums, resins and other vegetable saps and extracts 1
14 Vegetable plaiting materials; vegetable products not else-where specified or included
4
15 Animal or vegetable fats and oils and their cleavage prepared animal fats, animal or vegetable waxes products
1,106
16 Meat, fish or crustaceans, mollusks or other aquatic invertebrates, preparations thereof
268
17 Sugars and sugar confectionery 929
18 Cocoa and cocoa preparations 26
19 Preparations of cereals, flour, starch or milk; pastrycooks' products
1,768
Continue...
Imports by Chapter Heading (HS2) For the Period: October 01, 2018 to October 31, 2018
7 MONTHLY EXTERNAL TRADE STATISTICS, OCTOBER 2018
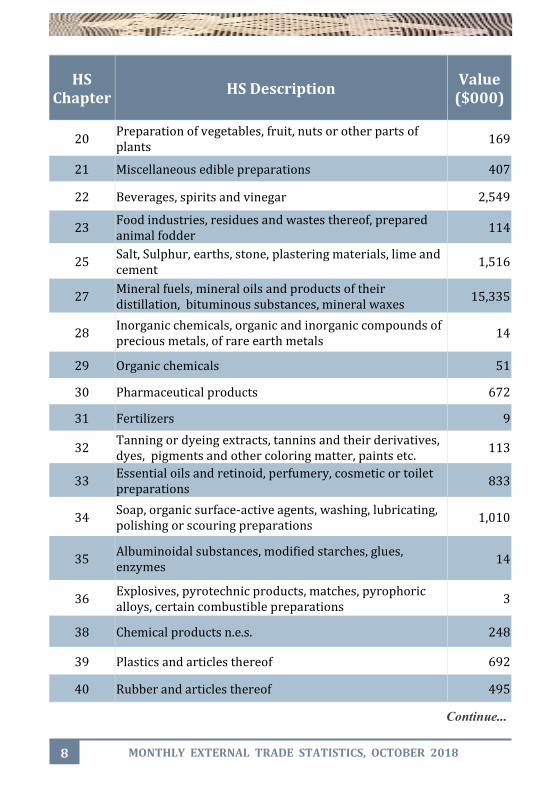
HS Chapter
HS Description Value
($000)
20 Preparation of vegetables, fruit, nuts or other parts of plants
169
21 Miscellaneous edible preparations 407
22 Beverages, spirits and vinegar 2,549
23 Food industries, residues and wastes thereof, prepared animal fodder
114
25 Salt, Sulphur, earths, stone, plastering materials, lime and cement
1,516
27 Mineral fuels, mineral oils and products of their distillation, bituminous substances, mineral waxes
15,335
28 Inorganic chemicals, organic and inorganic compounds of precious metals, of rare earth metals
14
29 Organic chemicals 51
30 Pharmaceutical products 672
31 Fertilizers 9
32 Tanning or dyeing extracts, tannins and their derivatives, dyes, pigments and other coloring matter, paints etc.
113
33 Essential oils and retinoid, perfumery, cosmetic or toilet preparations
833
34 Soap, organic surface-active agents, washing, lubricating, polishing or scouring preparations
1,010
35 Albuminoidal substances, modified starches, glues, enzymes
14
36 Explosives, pyrotechnic products, matches, pyrophoric alloys, certain combustible preparations
3
38 Chemical products n.e.s. 248
39 Plastics and articles thereof 692
40 Rubber and articles thereof 495
Continue...
8 MONTHLY EXTERNAL TRADE STATISTICS, OCTOBER 2018
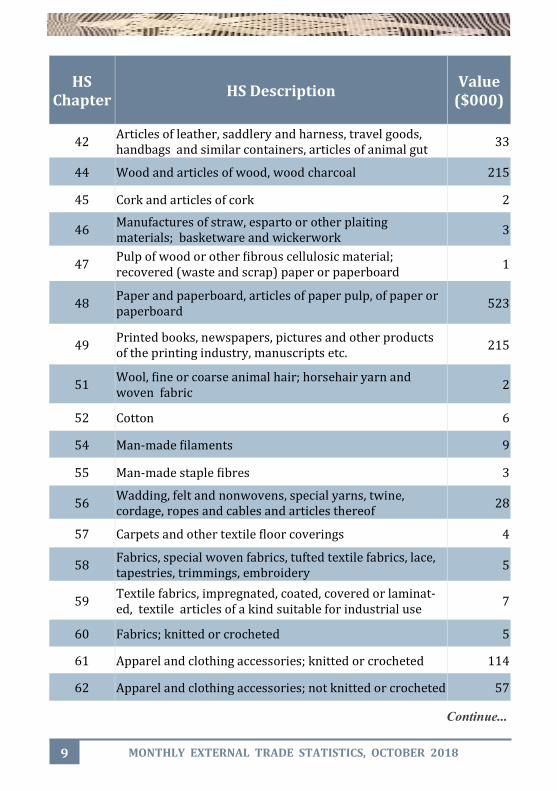
Continue...
HS Chapter
HS Description Value
($000)
42 Articles of leather, saddlery and harness, travel goods, handbags and similar containers, articles of animal gut
33
44 Wood and articles of wood, wood charcoal 215
45 Cork and articles of cork 2
46 Manufactures of straw, esparto or other plaiting materials; basketware and wickerwork
3
47 Pulp of wood or other fibrous cellulosic material; recovered (waste and scrap) paper or paperboard
1
48 Paper and paperboard, articles of paper pulp, of paper or paperboard
523
49 Printed books, newspapers, pictures and other products of the printing industry, manuscripts etc.
215
51 Wool, fine or coarse animal hair; horsehair yarn and woven fabric
2
52 Cotton 6
54 Man-made filaments 9
55 Man-made staple fibres 3
56 Wadding, felt and nonwovens, special yarns, twine, cordage, ropes and cables and articles thereof
28
57 Carpets and other textile floor coverings 4
58 Fabrics, special woven fabrics, tufted textile fabrics, lace, tapestries, trimmings, embroidery
5
59 Textile fabrics, impregnated, coated, covered or laminat-ed, textile articles of a kind suitable for industrial use
7
60 Fabrics; knitted or crocheted 5
61 Apparel and clothing accessories; knitted or crocheted 114
62 Apparel and clothing accessories; not knitted or crocheted 57
9 MONTHLY EXTERNAL TRADE STATISTICS, OCTOBER 2018

Continue...
HS Chapter
HS Description Value
($000)
63 Textiles, made up articles; sets; worn clothing and worn textile articles; rags
474
64 Footwear; gaiters and the like; parts of such articles 310
65 Headgear and parts thereof 24
66 Umbrellas, sun umbrellas, walking-sticks, seat sticks, whips, riding crops, and parts thereof
4
67 Feathers and down, prepared; and articles made of feath-er or of down; artificial flowers; articles of human hair
8
68 Stone, plaster, cement, asbestos, mica or similar materials, articles thereof
45
69 Ceramic products 337
70 Glass and glassware 81
71 Natural, cultured pearls; precious, semi-precious stones; precious metals, metals clad with precious metal etc.
1
72 Iron and steel 412
73 Iron or steel articles 805
74 Copper and articles thereof 8
75 Nickel and articles thereof 3
76 Aluminum and articles thereof 60
78 Lead and articles thereof 54
79 Zinc and articles thereof 29
82 Tools, implements, cutlery, spoons and forks, of base metal; parts thereof, of base metal
75
83 Metal; miscellaneous products of base metal 105
10 MONTHLY EXTERNAL TRADE STATISTICS, OCTOBER 2018
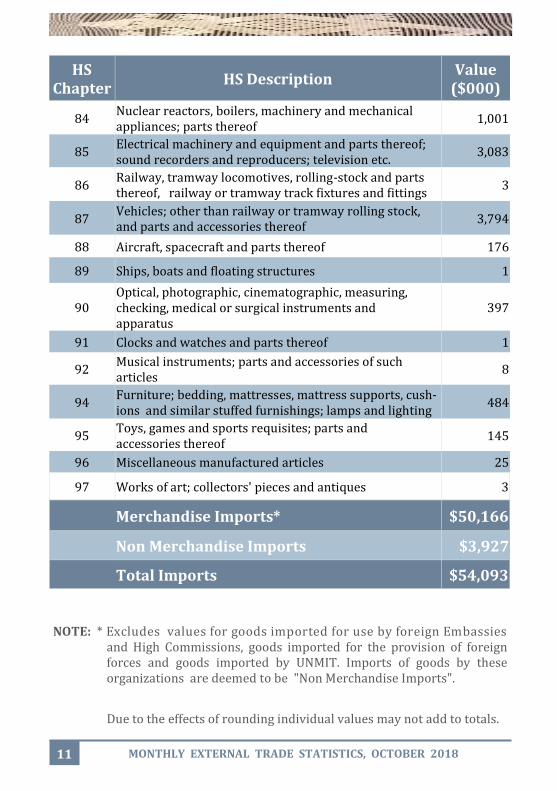
HS Chapter
HS Description Value
($000)
84 Nuclear reactors, boilers, machinery and mechanical appliances; parts thereof
1,001
85 Electrical machinery and equipment and parts thereof; sound recorders and reproducers; television etc.
3,083
86 Railway, tramway locomotives, rolling-stock and parts thereof, railway or tramway track fixtures and fittings
3
87 Vehicles; other than railway or tramway rolling stock, and parts and accessories thereof
3,794
88 Aircraft, spacecraft and parts thereof 176
89 Ships, boats and floating structures 1
90 Optical, photographic, cinematographic, measuring, checking, medical or surgical instruments and apparatus
397
91 Clocks and watches and parts thereof 1
92 Musical instruments; parts and accessories of such articles
8
94 Furniture; bedding, mattresses, mattress supports, cush-ions and similar stuffed furnishings; lamps and lighting
484
95 Toys, games and sports requisites; parts and accessories thereof
145
96 Miscellaneous manufactured articles 25
97 Works of art; collectors' pieces and antiques 3
Merchandise Imports* $50,166
Non Merchandise Imports $3,927
Total Imports $54,093
11 MONTHLY EXTERNAL TRADE STATISTICS, OCTOBER 2018
NOTE: * Excludes values for goods imported for use by foreign Embassies and High Commissions, goods imported for the provision of foreign forces and goods imported by UNMIT. Imports of goods by these organizations are deemed to be "Non Merchandise Imports".
Due to the effects of rounding individual values may not add to totals.

Direcção Geral de Estatística Rua de Caicoli, Po Box 10 Dili, Timor-Leste www.statistics.gov.tl [email protected]