external trade statistics timor leste · ministerio das finanças monthly reports september, 2018...
TRANSCRIPT
Ministerio das Finanças
MONTHLY REPORTS September, 2018
EXTERNAL TRADE STATISTICS TIMOR-LESTE
Sr. Cristino Gusmão Director Nacional Economia Estatistica e Social No. Telp: +(670) 77230127 Direcção Geral de Estatística Rua de Caicoli, Dili, PO Box 10 Telefone: +(670) 3311348 email: [email protected]
www.statistics.gov.tl
i MONTHLY EXTERNAL TRADE STATISTICS, SEPTEMBER 2018
Merchandise Trade Statistics (summary of Key Data)……… Page 1 Exports Tables ………………………………….……….…………………….... Page 2-3
Table 1: Export of Coffee Table 2: Export by Country of Destination
Imports Tables …………………………….…...……….……………………. Page 4-11
Table 3: Imports by Country of Origin Table 4: Imports by Chapter Heading (HS2)
Contents
ii MONTHLY EXTERNAL TRADE STATISTICS, SEPTEMBER 2018
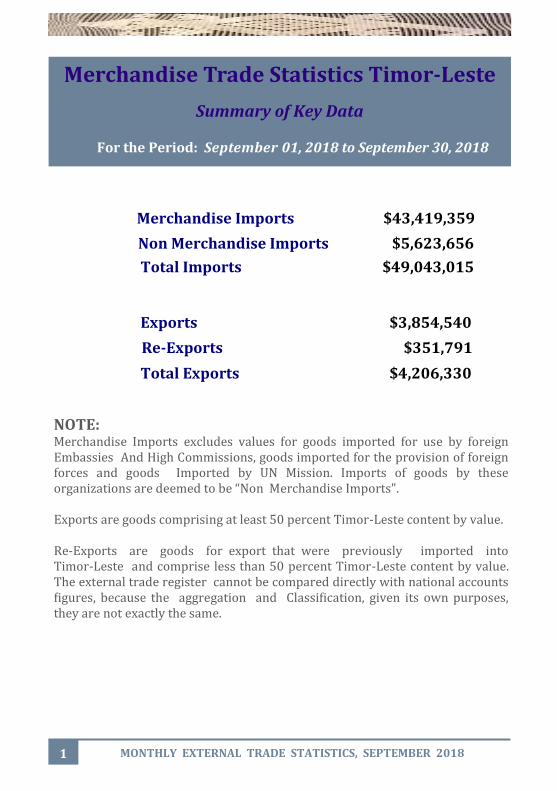
Merchandise Imports $43,419,359
Non Merchandise Imports $5,623,656
Total Imports $49,043,015
Exports $3,854,540
Re-Exports $351,791
Total Exports $4,206,330
NOTE: Merchandise Imports excludes values for goods imported for use by foreign Embassies And High Commissions, goods imported for the provision of foreign forces and goods Imported by UN Mission. Imports of goods by these organizations are deemed to be “Non Merchandise Imports". Exports are goods comprising at least 50 percent Timor-Leste content by value. Re-Exports are goods for export that were previously imported into Timor-Leste and comprise less than 50 percent Timor-Leste content by value. The external trade register cannot be compared directly with national accounts figures, because the aggregation and Classification, given its own purposes, they are not exactly the same.
Merchandise Trade Statistics Timor-Leste
Summary of Key Data
For the Period: September 01, 2018 to September 30, 2018
1 MONTHLY EXTERNAL TRADE STATISTICS, SEPTEMBER 2018
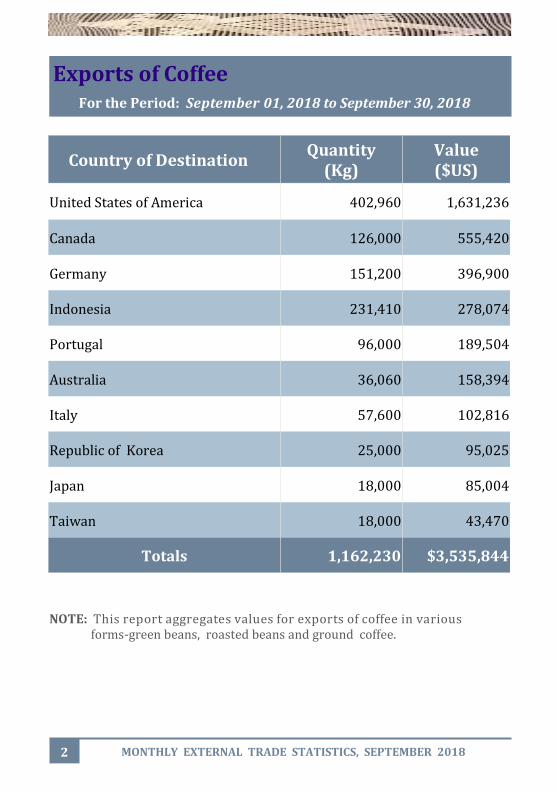
Exports of Coffee For the Period: September 01, 2018 to September 30, 2018
Country of Destination Quantity
(Kg) Value ($US)
United States of America 402,960 1,631,236
Canada 126,000 555,420
Germany 151,200 396,900
Indonesia 231,410 278,074
Portugal 96,000 189,504
Australia 36,060 158,394
Italy 57,600 102,816
Republic of Korea 25,000 95,025
Japan 18,000 85,004
Taiwan 18,000 43,470
Totals 1,162,230 $3,535,844
NOTE: This report aggregates values for exports of coffee in various forms-green beans, roasted beans and ground coffee.
2 MONTHLY EXTERNAL TRADE STATISTICS, SEPTEMBER 2018
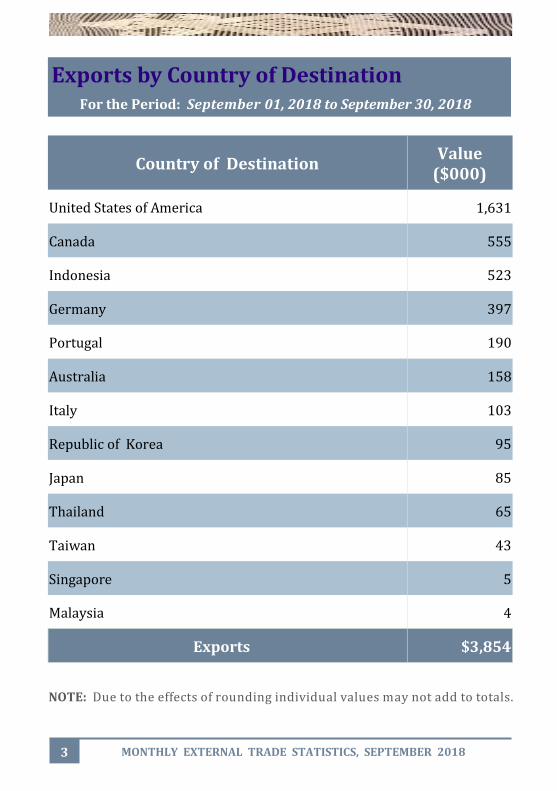
Country of Destination Value
($000)
United States of America 1,631
Canada 555
Indonesia 523
Germany 397
Portugal 190
Australia 158
Italy 103
Republic of Korea 95
Japan 85
Thailand 65
Taiwan 43
Singapore 5
Malaysia 4
Exports $3,854
NOTE: Due to the effects of rounding individual values may not add to totals.
Exports by Country of Destination For the Period: September 01, 2018 to September 30, 2018
3 MONTHLY EXTERNAL TRADE STATISTICS, SEPTEMBER 2018
Continue...
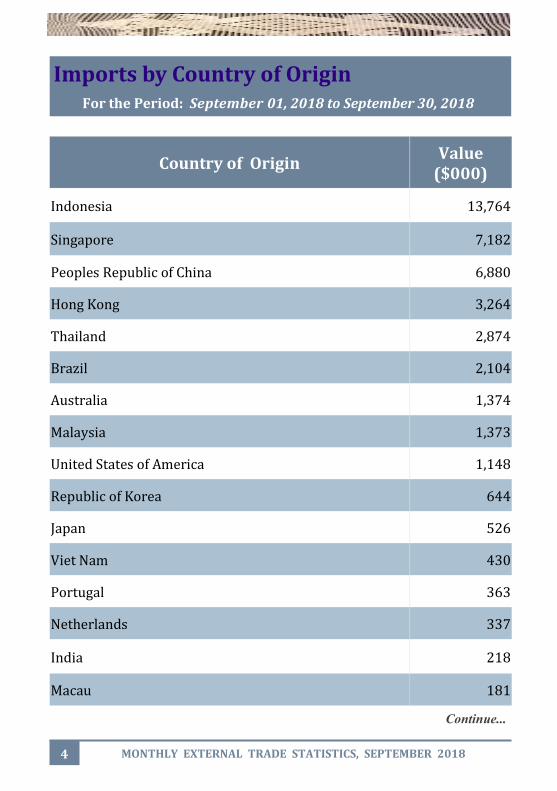
Country of Origin Value
($000)
Indonesia 13,764
Singapore 7,182
Peoples Republic of China 6,880
Hong Kong 3,264
Thailand 2,874
Brazil 2,104
Australia 1,374
Malaysia 1,373
United States of America 1,148
Republic of Korea 644
Japan 526
Viet Nam 430
Portugal 363
Netherlands 337
India 218
Macau 181
Imports by Country of Origin For the Period: September 01, 2018 to September 30, 2018
4 MONTHLY EXTERNAL TRADE STATISTICS, SEPTEMBER 2018
Continue...
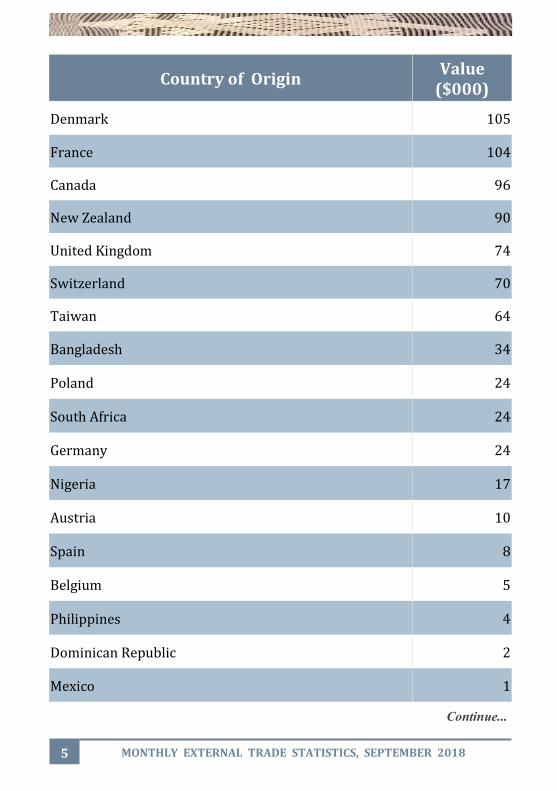
Country of Origin Value
($000)
Denmark 105
France 104
Canada 96
New Zealand 90
United Kingdom 74
Switzerland 70
Taiwan 64
Bangladesh 34
Poland 24
South Africa 24
Germany 24
Nigeria 17
Austria 10
Spain 8
Belgium 5
Philippines 4
Dominican Republic 2
Mexico 1
5 MONTHLY EXTERNAL TRADE STATISTICS, SEPTEMBER 2018
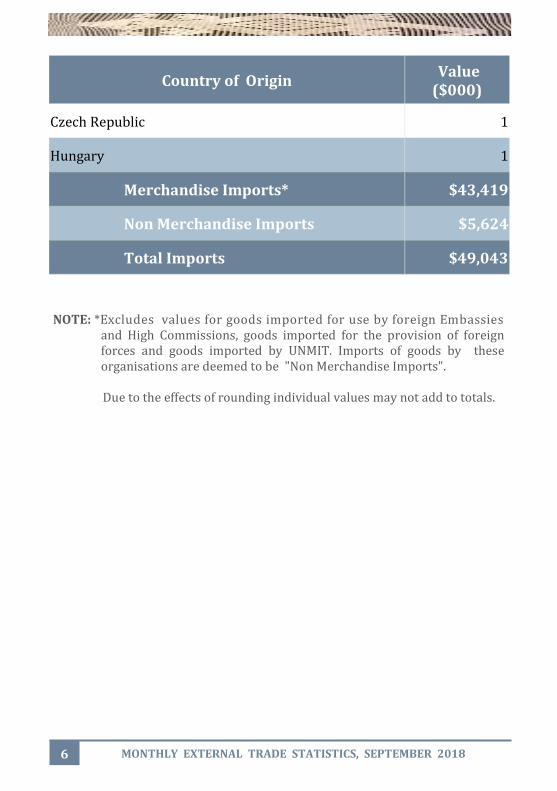
Country of Origin Value ($000)
Czech Republic 1
Hungary 1
Merchandise Imports* $43,419
Non Merchandise Imports $5,624
Total Imports $49,043
NOTE: *Excludes values for goods imported for use by foreign Embassies and High Commissions, goods imported for the provision of foreign forces and goods imported by UNMIT. Imports of goods by these organisations are deemed to be "Non Merchandise Imports".
Due to the effects of rounding individual values may not add to totals.
6 MONTHLY EXTERNAL TRADE STATISTICS, SEPTEMBER 2018
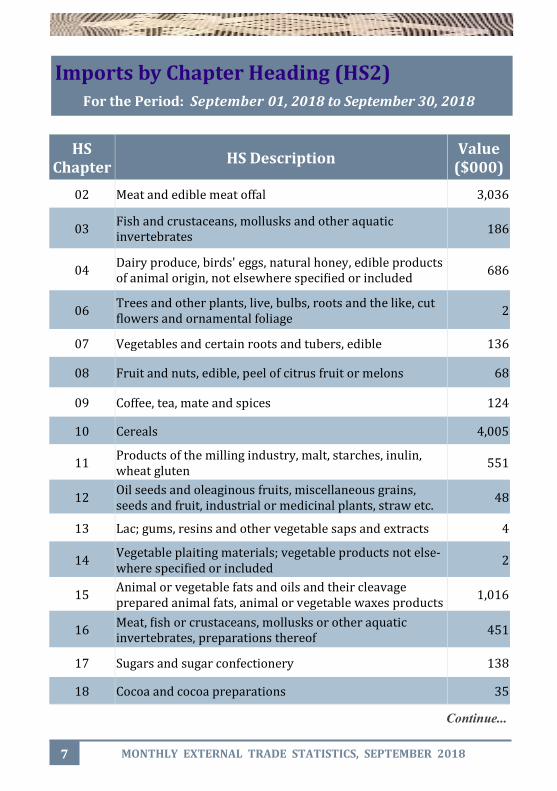
HS Chapter
HS Description Value
($000)
02 Meat and edible meat offal 3,036
03 Fish and crustaceans, mollusks and other aquatic invertebrates
186
04 Dairy produce, birds' eggs, natural honey, edible products of animal origin, not elsewhere specified or included
686
06 Trees and other plants, live, bulbs, roots and the like, cut flowers and ornamental foliage
2
07 Vegetables and certain roots and tubers, edible 136
08 Fruit and nuts, edible, peel of citrus fruit or melons 68
09 Coffee, tea, mate and spices 124
10 Cereals 4,005
11 Products of the milling industry, malt, starches, inulin, wheat gluten
551
12 Oil seeds and oleaginous fruits, miscellaneous grains, seeds and fruit, industrial or medicinal plants, straw etc.
48
13 Lac; gums, resins and other vegetable saps and extracts 4
14 Vegetable plaiting materials; vegetable products not else-where specified or included
2
15 Animal or vegetable fats and oils and their cleavage prepared animal fats, animal or vegetable waxes products
1,016
16 Meat, fish or crustaceans, mollusks or other aquatic invertebrates, preparations thereof
451
17 Sugars and sugar confectionery 138
18 Cocoa and cocoa preparations 35
Continue...
Imports by Chapter Heading (HS2) For the Period: September 01, 2018 to September 30, 2018
7 MONTHLY EXTERNAL TRADE STATISTICS, SEPTEMBER 2018
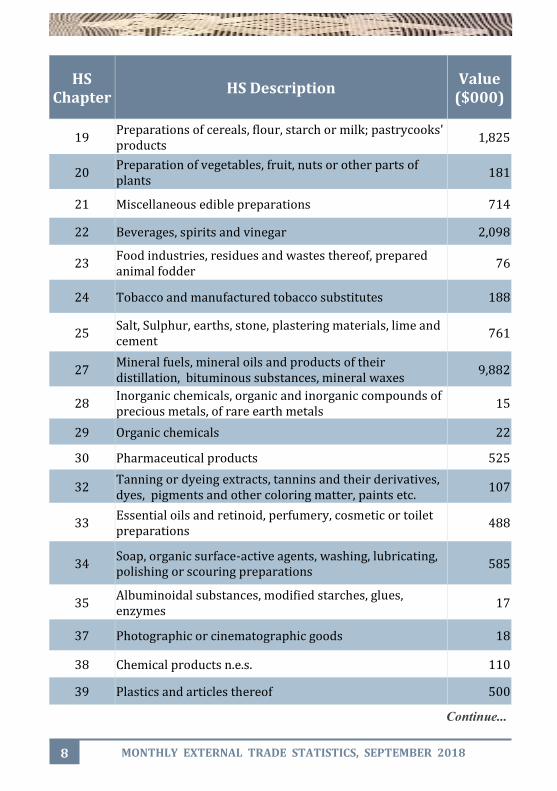
HS Chapter
HS Description Value
($000)
19 Preparations of cereals, flour, starch or milk; pastrycooks' products
1,825
20 Preparation of vegetables, fruit, nuts or other parts of plants
181
21 Miscellaneous edible preparations 714
22 Beverages, spirits and vinegar 2,098
23 Food industries, residues and wastes thereof, prepared animal fodder
76
24 Tobacco and manufactured tobacco substitutes 188
25 Salt, Sulphur, earths, stone, plastering materials, lime and cement
761
27 Mineral fuels, mineral oils and products of their distillation, bituminous substances, mineral waxes
9,882
28 Inorganic chemicals, organic and inorganic compounds of precious metals, of rare earth metals
15
29 Organic chemicals 22
30 Pharmaceutical products 525
32 Tanning or dyeing extracts, tannins and their derivatives, dyes, pigments and other coloring matter, paints etc.
107
33 Essential oils and retinoid, perfumery, cosmetic or toilet preparations
488
34 Soap, organic surface-active agents, washing, lubricating, polishing or scouring preparations
585
35 Albuminoidal substances, modified starches, glues, enzymes
17
37 Photographic or cinematographic goods 18
38 Chemical products n.e.s. 110
39 Plastics and articles thereof 500
Continue...
8 MONTHLY EXTERNAL TRADE STATISTICS, SEPTEMBER 2018
Continue...
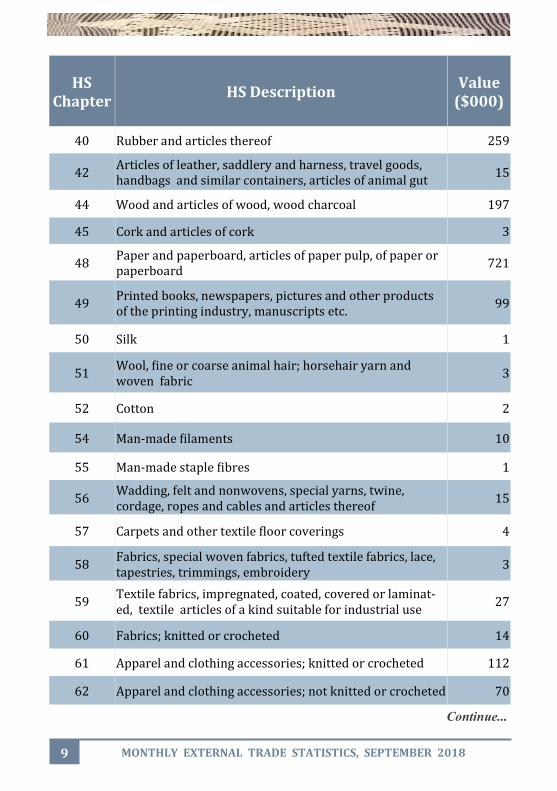
HS Chapter
HS Description Value
($000)
40 Rubber and articles thereof 259
42 Articles of leather, saddlery and harness, travel goods, handbags and similar containers, articles of animal gut
15
44 Wood and articles of wood, wood charcoal 197
45 Cork and articles of cork 3
48 Paper and paperboard, articles of paper pulp, of paper or paperboard
721
49 Printed books, newspapers, pictures and other products of the printing industry, manuscripts etc.
99
50 Silk 1
51 Wool, fine or coarse animal hair; horsehair yarn and woven fabric
3
52 Cotton 2
54 Man-made filaments 10
55 Man-made staple fibres 1
56 Wadding, felt and nonwovens, special yarns, twine, cordage, ropes and cables and articles thereof
15
57 Carpets and other textile floor coverings 4
58 Fabrics, special woven fabrics, tufted textile fabrics, lace, tapestries, trimmings, embroidery
3
59 Textile fabrics, impregnated, coated, covered or laminat-ed, textile articles of a kind suitable for industrial use
27
60 Fabrics; knitted or crocheted 14
61 Apparel and clothing accessories; knitted or crocheted 112
62 Apparel and clothing accessories; not knitted or crocheted 70
9 MONTHLY EXTERNAL TRADE STATISTICS, SEPTEMBER 2018
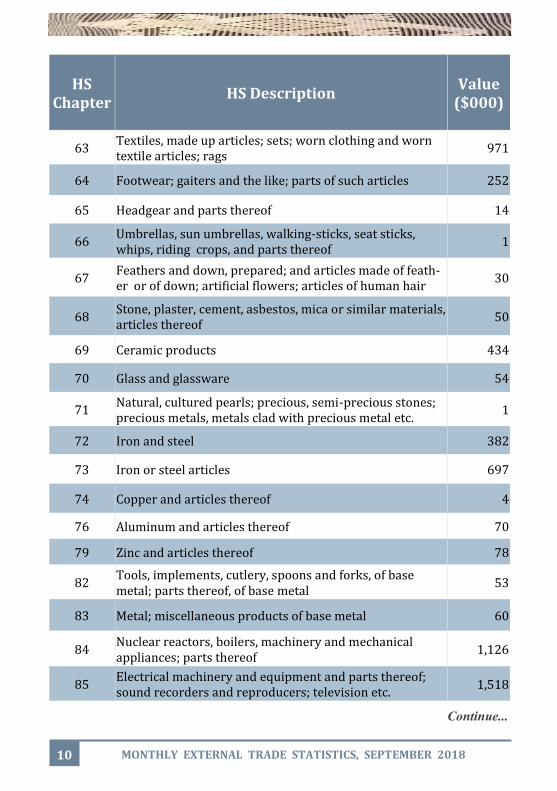
Continue...
HS Chapter
HS Description Value
($000)
63 Textiles, made up articles; sets; worn clothing and worn textile articles; rags
971
64 Footwear; gaiters and the like; parts of such articles 252
65 Headgear and parts thereof 14
66 Umbrellas, sun umbrellas, walking-sticks, seat sticks, whips, riding crops, and parts thereof
1
67 Feathers and down, prepared; and articles made of feath-er or of down; artificial flowers; articles of human hair
30
68 Stone, plaster, cement, asbestos, mica or similar materials, articles thereof
50
69 Ceramic products 434
70 Glass and glassware 54
71 Natural, cultured pearls; precious, semi-precious stones; precious metals, metals clad with precious metal etc.
1
72 Iron and steel 382
73 Iron or steel articles 697
74 Copper and articles thereof 4
76 Aluminum and articles thereof 70
79 Zinc and articles thereof 78
82 Tools, implements, cutlery, spoons and forks, of base metal; parts thereof, of base metal
53
83 Metal; miscellaneous products of base metal 60
84 Nuclear reactors, boilers, machinery and mechanical appliances; parts thereof
1,126
85 Electrical machinery and equipment and parts thereof; sound recorders and reproducers; television etc.
1,518
10 MONTHLY EXTERNAL TRADE STATISTICS, SEPTEMBER 2018
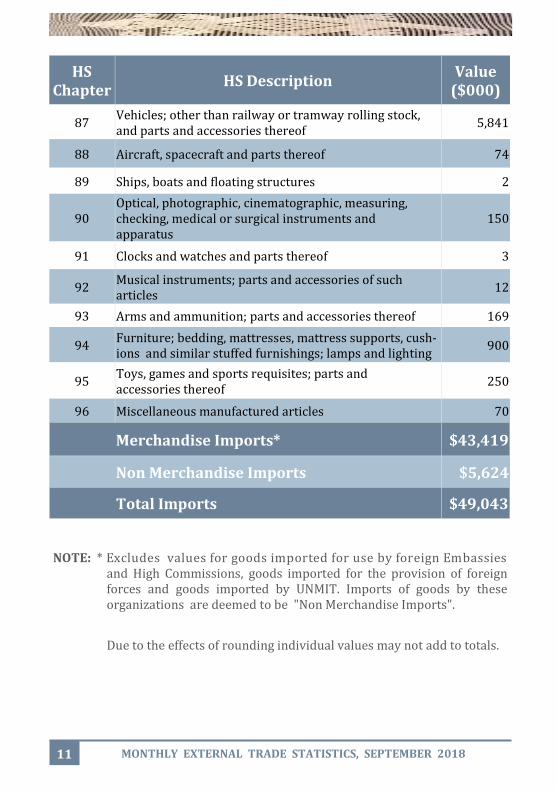
HS Chapter
HS Description Value
($000)
87 Vehicles; other than railway or tramway rolling stock, and parts and accessories thereof
5,841
88 Aircraft, spacecraft and parts thereof 74
89 Ships, boats and floating structures 2
90 Optical, photographic, cinematographic, measuring, checking, medical or surgical instruments and apparatus
150
91 Clocks and watches and parts thereof 3
92 Musical instruments; parts and accessories of such articles
12
93 Arms and ammunition; parts and accessories thereof 169
94 Furniture; bedding, mattresses, mattress supports, cush-ions and similar stuffed furnishings; lamps and lighting
900
95 Toys, games and sports requisites; parts and accessories thereof
250
96 Miscellaneous manufactured articles 70
Merchandise Imports* $43,419
Non Merchandise Imports $5,624
Total Imports $49,043
11 MONTHLY EXTERNAL TRADE STATISTICS, SEPTEMBER 2018
NOTE: * Excludes values for goods imported for use by foreign Embassies and High Commissions, goods imported for the provision of foreign forces and goods imported by UNMIT. Imports of goods by these organizations are deemed to be "Non Merchandise Imports".
Due to the effects of rounding individual values may not add to totals.
Direcção Geral de Estatística Rua de Caicoli, Po Box 10 Dili, Timor-Leste www.statistics.gov.tl [email protected]