extracting insights 2014
TRANSCRIPT
EXTRACTING INSIGHTSAN OVERVIEW OF THE PERFORMANCE AND PROSPECTS OF AIM MINING COMPANIES
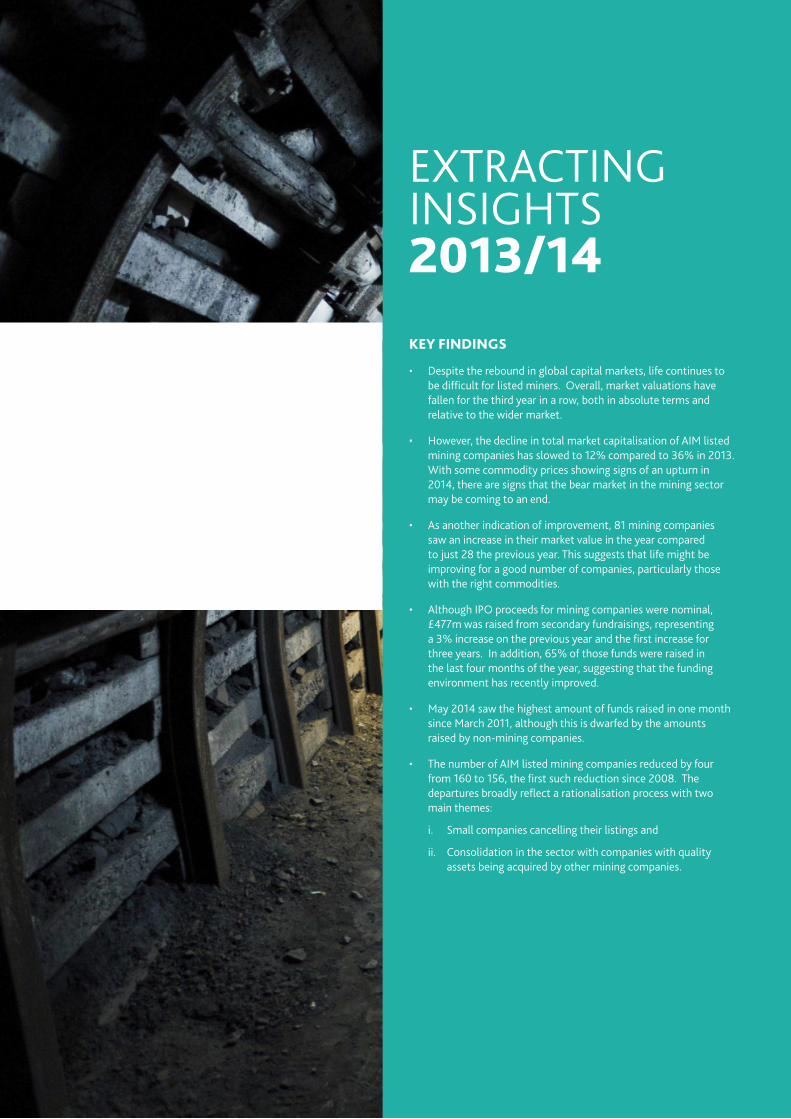
KEY FINDINGS
• Despite the rebound in global capital markets, life continues to be difficult for listed miners. Overall, market valuations have fallen for the third year in a row, both in absolute terms and relative to the wider market.
• However, the decline in total market capitalisation of AIM listed mining companies has slowed to 12% compared to 36% in 2013. With some commodity prices showing signs of an upturn in 2014, there are signs that the bear market in the mining sector may be coming to an end.
• As another indication of improvement, 81 mining companies saw an increase in their market value in the year compared to just 28 the previous year. This suggests that life might be improving for a good number of companies, particularly those with the right commodities.
• Although IPO proceeds for mining companies were nominal, £477m was raised from secondary fundraisings, representing a 3% increase on the previous year and the first increase for three years. In addition, 65% of those funds were raised in the last four months of the year, suggesting that the funding environment has recently improved.
• May 2014 saw the highest amount of funds raised in one month since March 2011, although this is dwarfed by the amounts raised by non-mining companies.
• The number of AIM listed mining companies reduced by four from 160 to 156, the first such reduction since 2008. The departures broadly reflect a rationalisation process with two main themes:
i. Small companies cancelling their listings and
ii. Consolidation in the sector with companies with quality assets being acquired by other mining companies.
EXTRACTING INSIGHTS
BDO LLP | EXTRACTING INSIGHTS 2013/14
Market performance – Real divergence
2
Numbers consolidating 6
Market capitalisation – Continuing reduction
8
Main movers 10
Funding – Signs of promise?
12
Conclusion – Green shoots?
14
CONTENTS
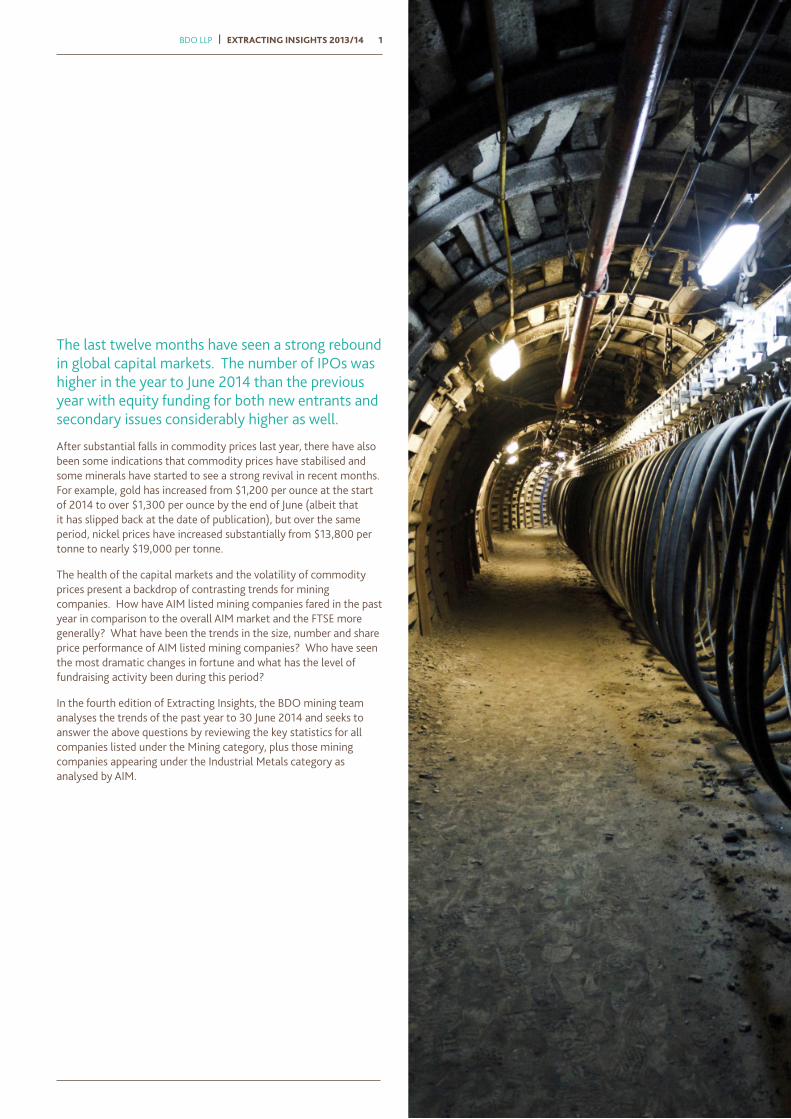
The last twelve months have seen a strong rebound in global capital markets. The number of IPOs was higher in the year to June 2014 than the previous year with equity funding for both new entrants and secondary issues considerably higher as well.
After substantial falls in commodity prices last year, there have also been some indications that commodity prices have stabilised and some minerals have started to see a strong revival in recent months. For example, gold has increased from $1,200 per ounce at the start of 2014 to over $1,300 per ounce by the end of June (albeit that it has slipped back at the date of publication), but over the same period, nickel prices have increased substantially from $13,800 per tonne to nearly $19,000 per tonne.
The health of the capital markets and the volatility of commodity prices present a backdrop of contrasting trends for mining companies. How have AIM listed mining companies fared in the past year in comparison to the overall AIM market and the FTSE more generally? What have been the trends in the size, number and share price performance of AIM listed mining companies? Who have seen the most dramatic changes in fortune and what has the level of fundraising activity been during this period?
In the fourth edition of Extracting Insights, the BDO mining team analyses the trends of the past year to 30 June 2014 and seeks to answer the above questions by reviewing the key statistics for all companies listed under the Mining category, plus those mining companies appearing under the Industrial Metals category as analysed by AIM.
BDO LLP | EXTRACTING INSIGHTS 2013/14 1
EXTRACTING INSIGHTS 2013/14 | BDO LLP2
MARKET PERFORMANCE REAL DIVERGENCE
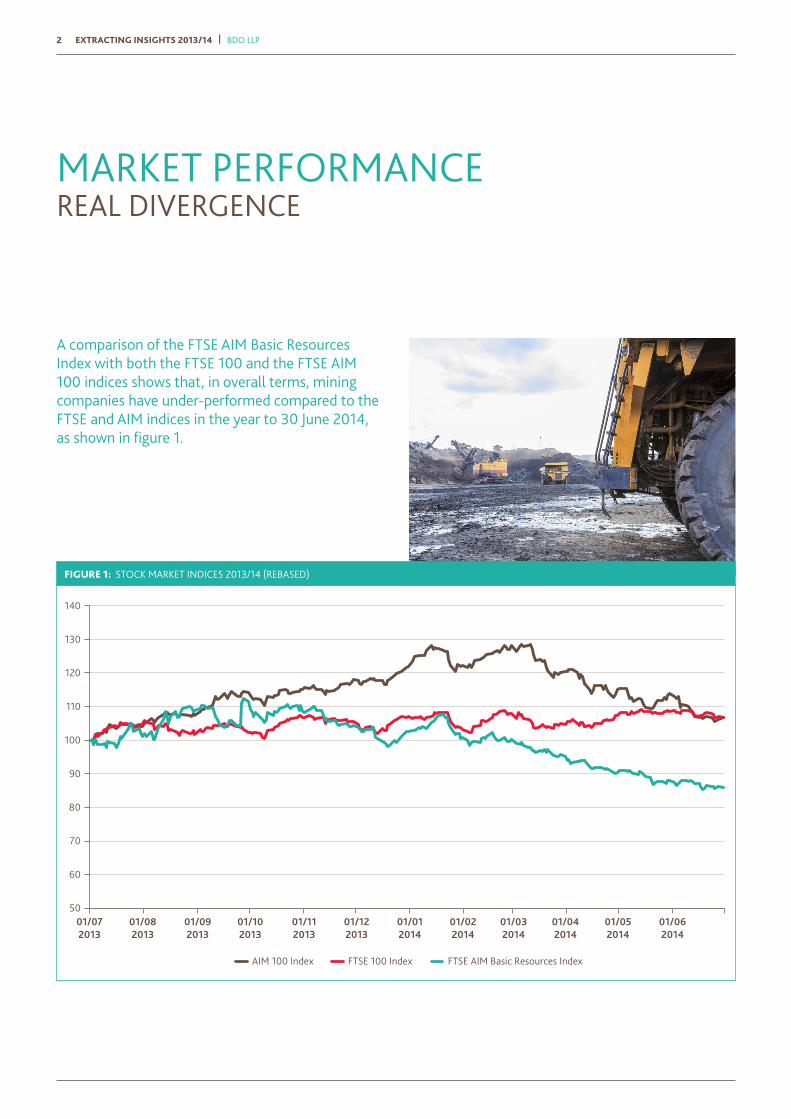
A comparison of the FTSE AIM Basic Resources Index with both the FTSE 100 and the FTSE AIM 100 indices shows that, in overall terms, mining companies have under-performed compared to the FTSE and AIM indices in the year to 30 June 2014, as shown in figure 1.
5001/072013
01/082013
01/092013
01/102013
01/112013
01/122013
01/012014
01/022014
01/032014
01/042014
01/052014
01/062014
60
70
80
90
100
110
120
130
140
AIM 100 Index FTSE 100 Index FTSE AIM Basic Resources Index
FIGURE 1: STOCK MARKET INDICES 2013/14 (REBASED)
BDO LLP | EXTRACTING INSIGHTS 2013/14 3
01/072013
01/082013
01/092013
01/102013
01/112013
01/122013
01/012014
01/022014
01/032014
01/042014
01/052014
01/062014
60
70
80
90
100
110
120
130
140
150
160
GoldNickel Copper AIM Basic Resources
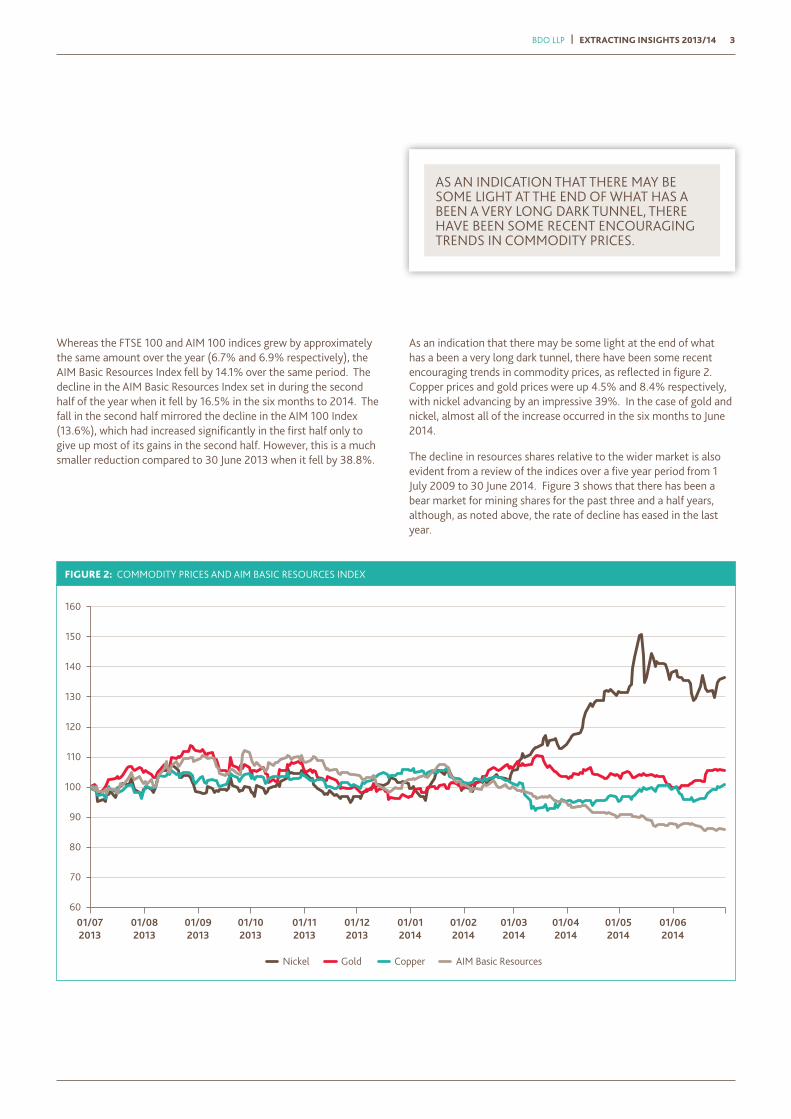
FIGURE 2: COMMODITY PRICES AND AIM BASIC RESOURCES INDEX
Whereas the FTSE 100 and AIM 100 indices grew by approximately the same amount over the year (6.7% and 6.9% respectively), the AIM Basic Resources Index fell by 14.1% over the same period. The decline in the AIM Basic Resources Index set in during the second half of the year when it fell by 16.5% in the six months to 2014. The fall in the second half mirrored the decline in the AIM 100 Index (13.6%), which had increased significantly in the first half only to give up most of its gains in the second half. However, this is a much smaller reduction compared to 30 June 2013 when it fell by 38.8%.
As an indication that there may be some light at the end of what has a been a very long dark tunnel, there have been some recent encouraging trends in commodity prices, as reflected in figure 2. Copper prices and gold prices were up 4.5% and 8.4% respectively, with nickel advancing by an impressive 39%. In the case of gold and nickel, almost all of the increase occurred in the six months to June 2014.
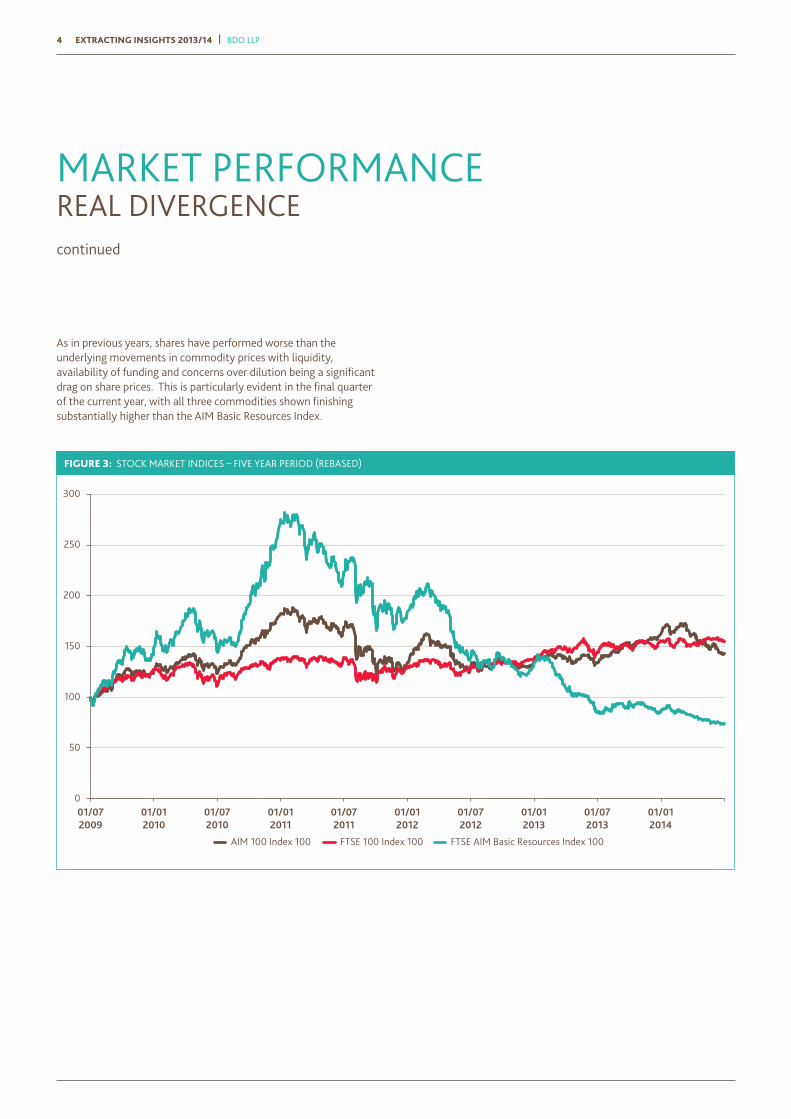
The decline in resources shares relative to the wider market is also evident from a review of the indices over a five year period from 1 July 2009 to 30 June 2014. Figure 3 shows that there has been a bear market for mining shares for the past three and a half years, although, as noted above, the rate of decline has eased in the last year.
AS AN INDICATION THAT THERE MAY BE SOME LIGHT AT THE END OF WHAT HAS A BEEN A VERY LONG DARK TUNNEL, THERE HAVE BEEN SOME RECENT ENCOURAGING TRENDS IN COMMODITY PRICES.
EXTRACTING INSIGHTS 2013/14 | BDO LLP4
MARKET PERFORMANCE REAL DIVERGENCEcontinued
As in previous years, shares have performed worse than the underlying movements in commodity prices with liquidity, availability of funding and concerns over dilution being a significant drag on share prices. This is particularly evident in the final quarter of the current year, with all three commodities shown finishing substantially higher than the AIM Basic Resources Index.
01/072009
01/072010
01/072011
01/072012
01/072013
0
50
100
150
200
250
300
AIM 100 Index 100 FTSE 100 Index 100 FTSE AIM Basic Resources Index 100
01/012010
01/012011
01/012012
01/012013
01/012014
FIGURE 3: STOCK MARKET INDICES – FIVE YEAR PERIOD (REBASED)
EXTRACTING INSIGHTS 2013/14 | BDO LLP6
NUMBERS CONSOLIDATING
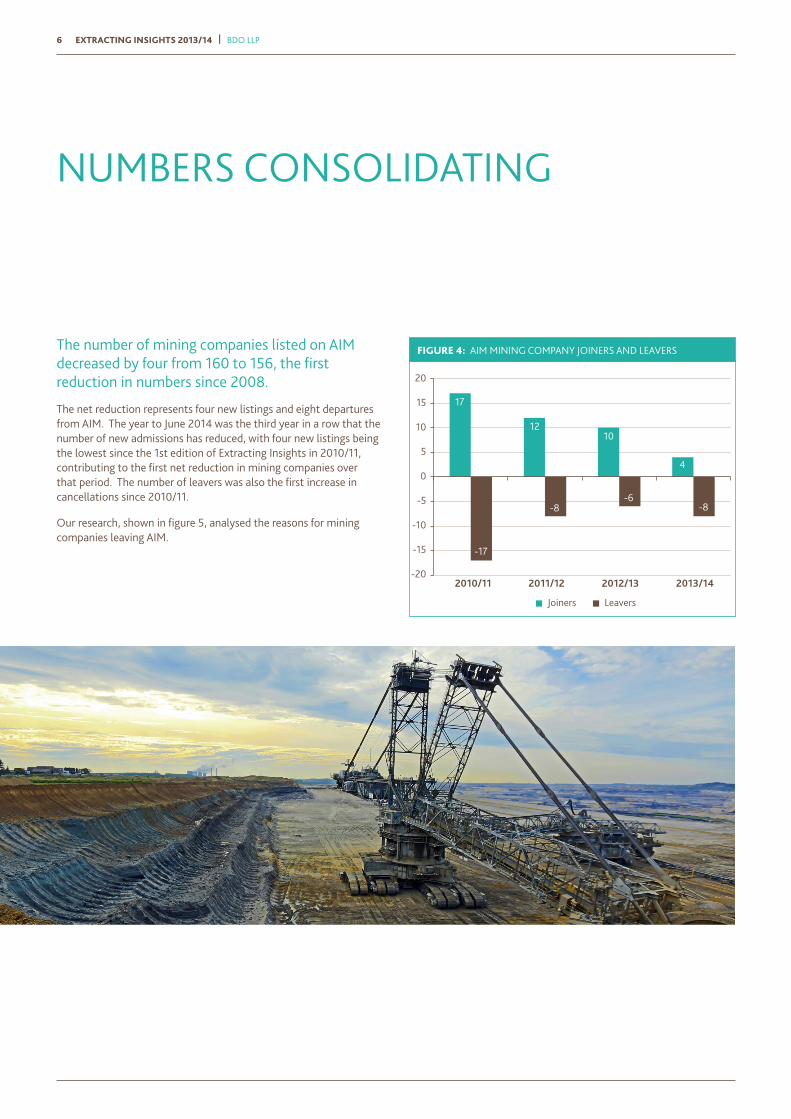
The number of mining companies listed on AIM decreased by four from 160 to 156, the first reduction in numbers since 2008.
The net reduction represents four new listings and eight departures from AIM. The year to June 2014 was the third year in a row that the number of new admissions has reduced, with four new listings being the lowest since the 1st edition of Extracting Insights in 2010/11, contributing to the first net reduction in mining companies over that period. The number of leavers was also the first increase in cancellations since 2010/11.
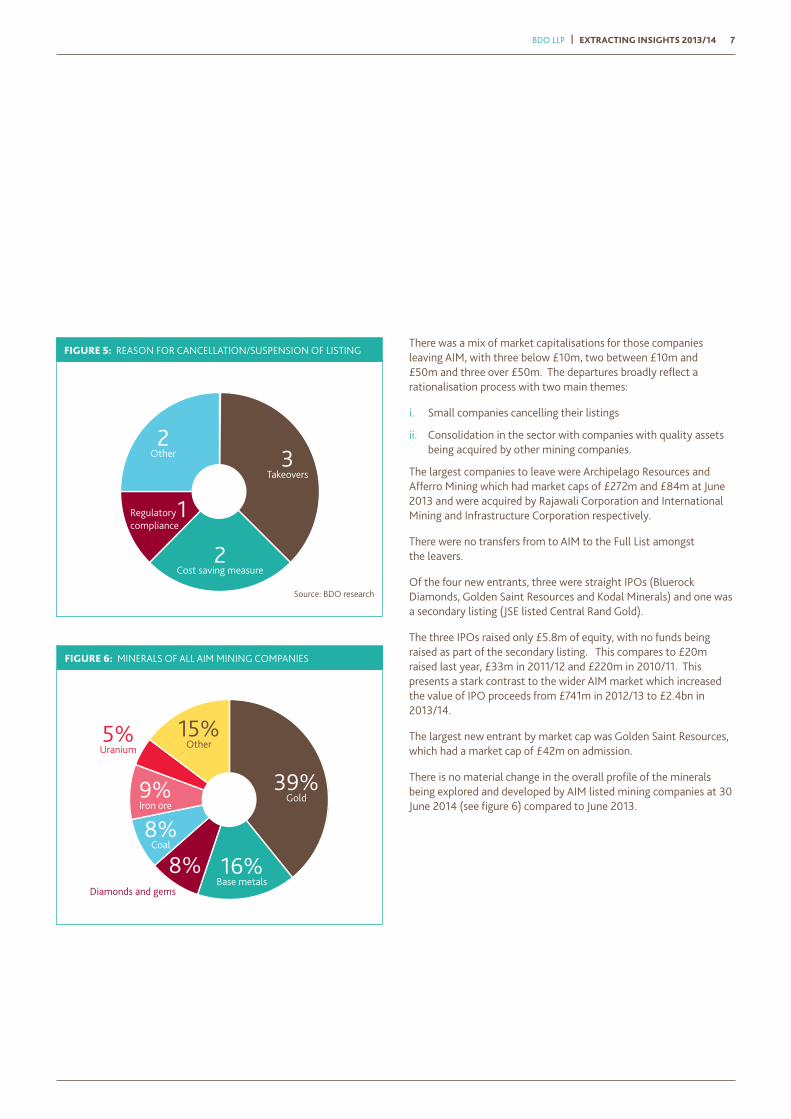
Our research, shown in figure 5, analysed the reasons for mining companies leaving AIM.
20
-20
-15
-10
-5
0
5
10
15
2010/11
17
1210
4
-8-6
-8
-17
2011/12 2012/13 2013/14
Joiners Leavers
FIGURE 4: AIM MINING COMPANY JOINERS AND LEAVERS
BDO LLP | EXTRACTING INSIGHTS 2013/14 7
2
1Regulatorycompliance
Cost saving measure
Takeovers
Other 3
2
FIGURE 5: REASON FOR CANCELLATION/SUSPENSION OF LISTING
Source: BDO research
39%Gold
16%Base metals
8%Coal
9%Iron ore
15%Other5%
Uranium
8%Diamonds and gems
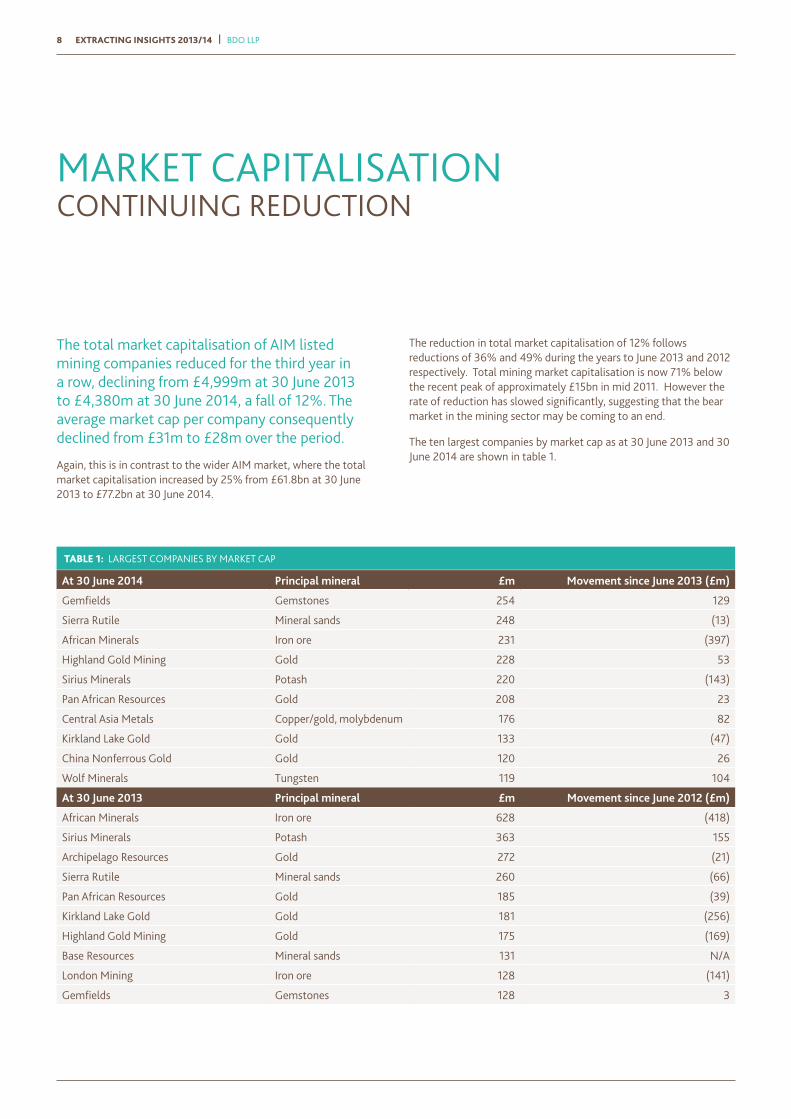
FIGURE 6: MINERALS OF ALL AIM MINING COMPANIES
There was a mix of market capitalisations for those companies leaving AIM, with three below £10m, two between £10m and £50m and three over £50m. The departures broadly reflect a rationalisation process with two main themes:
i. Small companies cancelling their listings
ii. Consolidation in the sector with companies with quality assets being acquired by other mining companies.
The largest companies to leave were Archipelago Resources and Afferro Mining which had market caps of £272m and £84m at June 2013 and were acquired by Rajawali Corporation and International Mining and Infrastructure Corporation respectively.
There were no transfers from to AIM to the Full List amongst the leavers.
Of the four new entrants, three were straight IPOs (Bluerock Diamonds, Golden Saint Resources and Kodal Minerals) and one was a secondary listing (JSE listed Central Rand Gold).
The three IPOs raised only £5.8m of equity, with no funds being raised as part of the secondary listing. This compares to £20m raised last year, £33m in 2011/12 and £220m in 2010/11. This presents a stark contrast to the wider AIM market which increased the value of IPO proceeds from £741m in 2012/13 to £2.4bn in 2013/14.
The largest new entrant by market cap was Golden Saint Resources, which had a market cap of £42m on admission.
There is no material change in the overall profile of the minerals being explored and developed by AIM listed mining companies at 30 June 2014 (see figure 6) compared to June 2013.
EXTRACTING INSIGHTS 2013/14 | BDO LLP8
MARKET CAPITALISATION CONTINUING REDUCTION
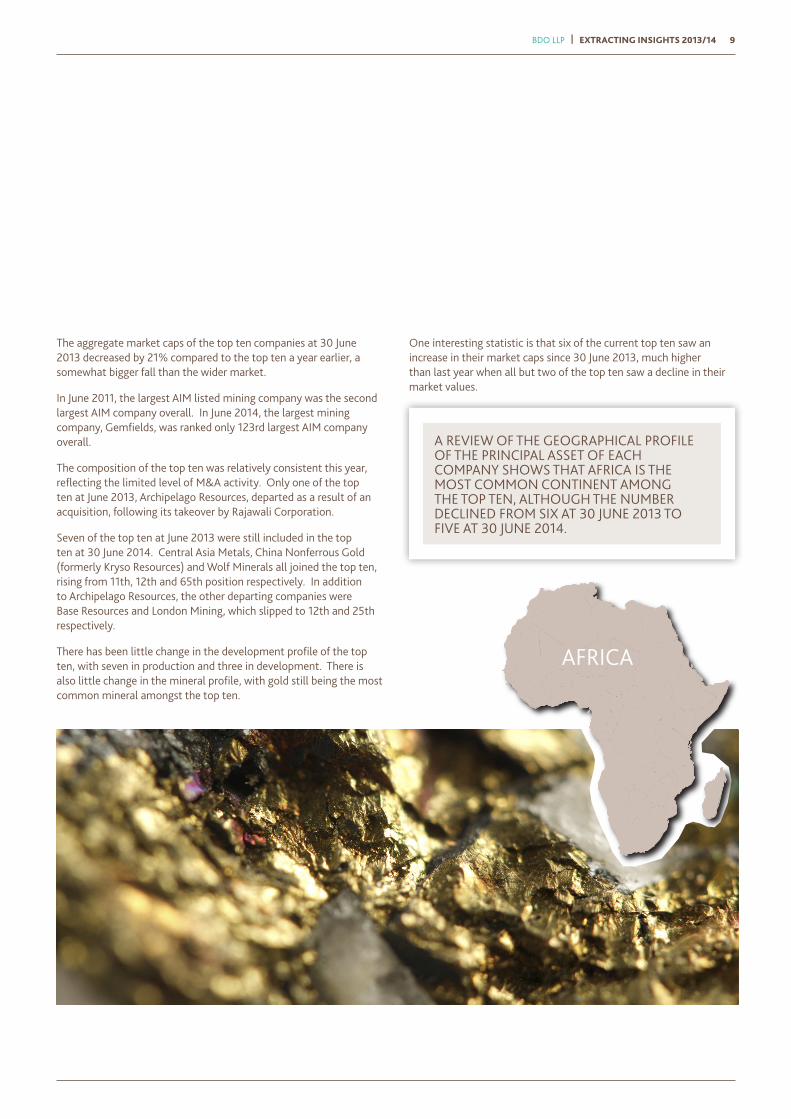
The total market capitalisation of AIM listed mining companies reduced for the third year in a row, declining from £4,999m at 30 June 2013 to £4,380m at 30 June 2014, a fall of 12%. The average market cap per company consequently declined from £31m to £28m over the period.
Again, this is in contrast to the wider AIM market, where the total market capitalisation increased by 25% from £61.8bn at 30 June 2013 to £77.2bn at 30 June 2014.
The reduction in total market capitalisation of 12% follows reductions of 36% and 49% during the years to June 2013 and 2012 respectively. Total mining market capitalisation is now 71% below the recent peak of approximately £15bn in mid 2011. However the rate of reduction has slowed significantly, suggesting that the bear market in the mining sector may be coming to an end.
The ten largest companies by market cap as at 30 June 2013 and 30 June 2014 are shown in table 1.
At 30 June 2014 Principal mineral £m Movement since June 2013 (£m)
Gemfields Gemstones 254 129
Sierra Rutile Mineral sands 248 (13)
African Minerals Iron ore 231 (397)
Highland Gold Mining Gold 228 53
Sirius Minerals Potash 220 (143)
Pan African Resources Gold 208 23
Central Asia Metals Copper/gold, molybdenum 176 82
Kirkland Lake Gold Gold 133 (47)
China Nonferrous Gold Gold 120 26
Wolf Minerals Tungsten 119 104
At 30 June 2013 Principal mineral £m Movement since June 2012 (£m)
African Minerals Iron ore 628 (418)
Sirius Minerals Potash 363 155
Archipelago Resources Gold 272 (21)
Sierra Rutile Mineral sands 260 (66)
Pan African Resources Gold 185 (39)
Kirkland Lake Gold Gold 181 (256)
Highland Gold Mining Gold 175 (169)
Base Resources Mineral sands 131 N/A
London Mining Iron ore 128 (141)
Gemfields Gemstones 128 3
TABLE 1: LARGEST COMPANIES BY MARKET CAP
BDO LLP | EXTRACTING INSIGHTS 2013/14 9
A REVIEW OF THE GEOGRAPHICAL PROFILE OF THE PRINCIPAL ASSET OF EACH COMPANY SHOWS THAT AFRICA IS THE MOST COMMON CONTINENT AMONG THE TOP TEN, ALTHOUGH THE NUMBER DECLINED FROM SIX AT 30 JUNE 2013 TO FIVE AT 30 JUNE 2014.
The aggregate market caps of the top ten companies at 30 June 2013 decreased by 21% compared to the top ten a year earlier, a somewhat bigger fall than the wider market.
In June 2011, the largest AIM listed mining company was the second largest AIM company overall. In June 2014, the largest mining company, Gemfields, was ranked only 123rd largest AIM company overall.
The composition of the top ten was relatively consistent this year, reflecting the limited level of M&A activity. Only one of the top ten at June 2013, Archipelago Resources, departed as a result of an acquisition, following its takeover by Rajawali Corporation.
Seven of the top ten at June 2013 were still included in the top ten at 30 June 2014. Central Asia Metals, China Nonferrous Gold (formerly Kryso Resources) and Wolf Minerals all joined the top ten, rising from 11th, 12th and 65th position respectively. In addition to Archipelago Resources, the other departing companies were Base Resources and London Mining, which slipped to 12th and 25th respectively.
There has been little change in the development profile of the top ten, with seven in production and three in development. There is also little change in the mineral profile, with gold still being the most common mineral amongst the top ten.
One interesting statistic is that six of the current top ten saw an increase in their market caps since 30 June 2013, much higher than last year when all but two of the top ten saw a decline in their market values.
AFRICA
EXTRACTING INSIGHTS 2013/14 | BDO LLP10 BDO LLP | EXTRACTING INSIGHTS 2013/14
MAIN MOVERS
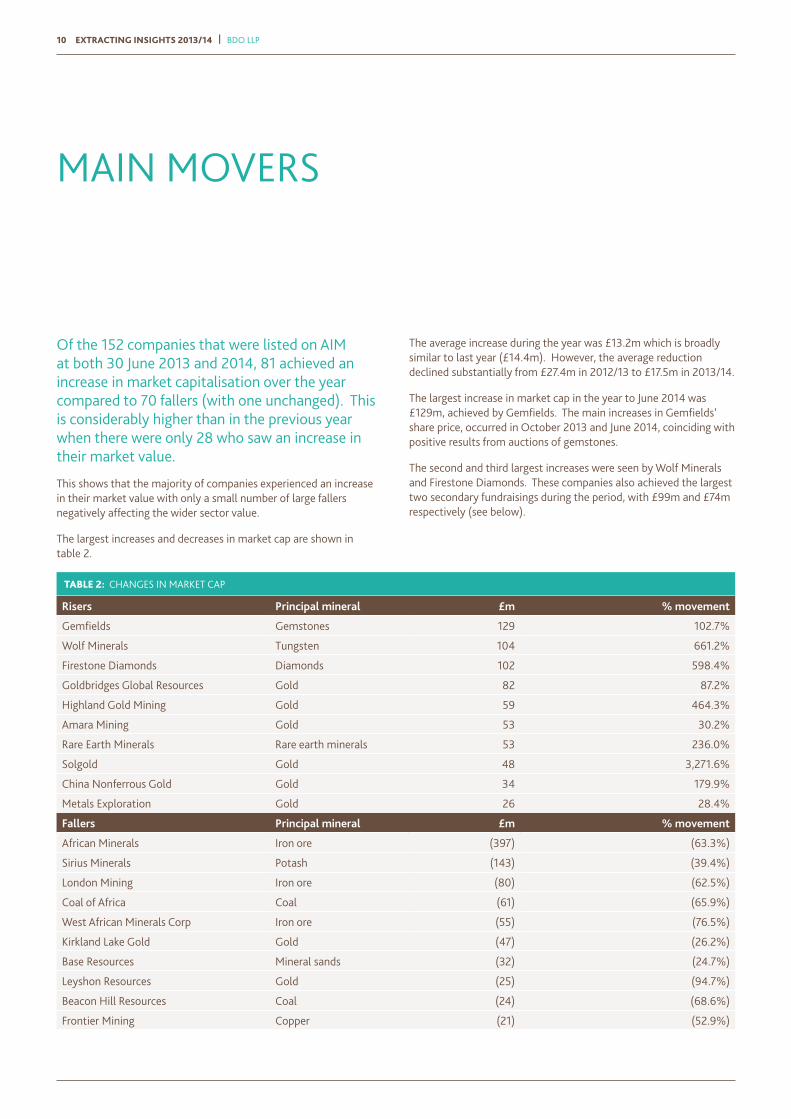
Of the 152 companies that were listed on AIM at both 30 June 2013 and 2014, 81 achieved an increase in market capitalisation over the year compared to 70 fallers (with one unchanged). This is considerably higher than in the previous year when there were only 28 who saw an increase in their market value.
This shows that the majority of companies experienced an increase in their market value with only a small number of large fallers negatively affecting the wider sector value.
The largest increases and decreases in market cap are shown in table 2.
Risers Principal mineral £m % movement
Gemfields Gemstones 129 102.7%
Wolf Minerals Tungsten 104 661.2%
Firestone Diamonds Diamonds 102 598.4%
Goldbridges Global Resources Gold 82 87.2%
Highland Gold Mining Gold 59 464.3%
Amara Mining Gold 53 30.2%
Rare Earth Minerals Rare earth minerals 53 236.0%
Solgold Gold 48 3,271.6%
China Nonferrous Gold Gold 34 179.9%
Metals Exploration Gold 26 28.4%
Fallers Principal mineral £m % movement
African Minerals Iron ore (397) (63.3%)
Sirius Minerals Potash (143) (39.4%)
London Mining Iron ore (80) (62.5%)
Coal of Africa Coal (61) (65.9%)
West African Minerals Corp Iron ore (55) (76.5%)
Kirkland Lake Gold Gold (47) (26.2%)
Base Resources Mineral sands (32) (24.7%)
Leyshon Resources Gold (25) (94.7%)
Beacon Hill Resources Coal (24) (68.6%)
Frontier Mining Copper (21) (52.9%)
TABLE 2: CHANGES IN MARKET CAP
The average increase during the year was £13.2m which is broadly similar to last year (£14.4m). However, the average reduction declined substantially from £27.4m in 2012/13 to £17.5m in 2013/14.
The largest increase in market cap in the year to June 2014 was £129m, achieved by Gemfields. The main increases in Gemfields’ share price, occurred in October 2013 and June 2014, coinciding with positive results from auctions of gemstones.
The second and third largest increases were seen by Wolf Minerals and Firestone Diamonds. These companies also achieved the largest two secondary fundraisings during the period, with £99m and £74m respectively (see below).
BDO LLP | EXTRACTING INSIGHTS 2013/14 11
Unlike last year when all but one of the largest risers were exploration and development companies, there was an even split of production and development companies for the largest risers. Similarly, there was also an even split of production and development companies for the largest fallers.
Five of the top six fallers were also in the top ten fallers in the previous year, with all but one being in production. This reinforces our observation last year that production companies are potentially the most vulnerable to a downturn in market sentiment and that this can continue for a sustained period.
Gold was the most common mineral among the largest risers with six out ten. There was a reasonable spread of minerals among the largest fallers, although for the third year in a row there were more iron ore companies in the top ten fallers than any other mineral reflecting the continuing weakness in iron ore prices.
THE MAJORITY OF COMPANIES EXPERIENCED AN INCREASE IN THEIR MARKET VALUE.
EXTRACTING INSIGHTS 2013/14 | BDO LLP12
FUNDING SIGNS OF PROMISE?
The amount raised by further issues in 2013/14 of £477m was 3% up on the previous year's amount of £465m. This was the first increase since the year to June 2011 and represents a welcome end to the downward trend in fund raising over the past few years.
If only those raising more than £1m are taken into account (i.e. ignoring small amounts raised through the exercise of share warrants etc), 57 companies raised finance through further issues of shares at an average of £7.9m per company. This compares to 52 companies (2011/12: 56) which raised an average of £8.8m in 2012/13 (2011/12: £10.5m).
The ten largest amounts raised during the year are set out in table 3.
Principal mineral £m
Wolf Minerals Tungsten 99
Firestone Diamonds Diamonds 74
Sirius Minerals Potash 43
Aureus Mining Gold 19
Amara Mining Gold 18
Sable Mining Africa Coal and iron ore 17
Metals Exploration Gold 15
Goldbridges Global Resources Gold 14
Kefi Minerals Gold 10
Vatukoula Gold Mines Gold 9
TABLE 3: TEN LARGEST FURTHER ISSUES
BDO LLP | EXTRACTING INSIGHTS 2013/14 13
The largest fundraising was by Wolf Minerals which completed in May 2014. These proceeds were raised to continue the development of the Hemerdon project in Devon (UK), as well as to repay existing debt facilities and provide working capital.
The Firestone Diamonds fundraising, the vast majority of which was completed in May 2014, was to fund the building and commissioning of the main treatment plant and supporting infrastructure at its Liqhobong Diamond Mine in Lesotho. The money was raised in conjunction with a debt fundraising, resulting in a total of £137m for the Liqhobong project.
The fundraisings by Wolf Minerals and Firestone Diamonds were substantially higher than the largest further issues in the year to June 2012 and 2013 of £66m and £52m respectively. This suggests that, for companies with good assets and compelling investment stories, there are signs of a return of large scale investment in the mining sector.
The Sirius Minerals proceeds funds were raised in March 2014 to fund a definitive feasibility study and give it the ability to accelerate detailed engineering and design work for the York Potash project in North Yorkshire (UK).
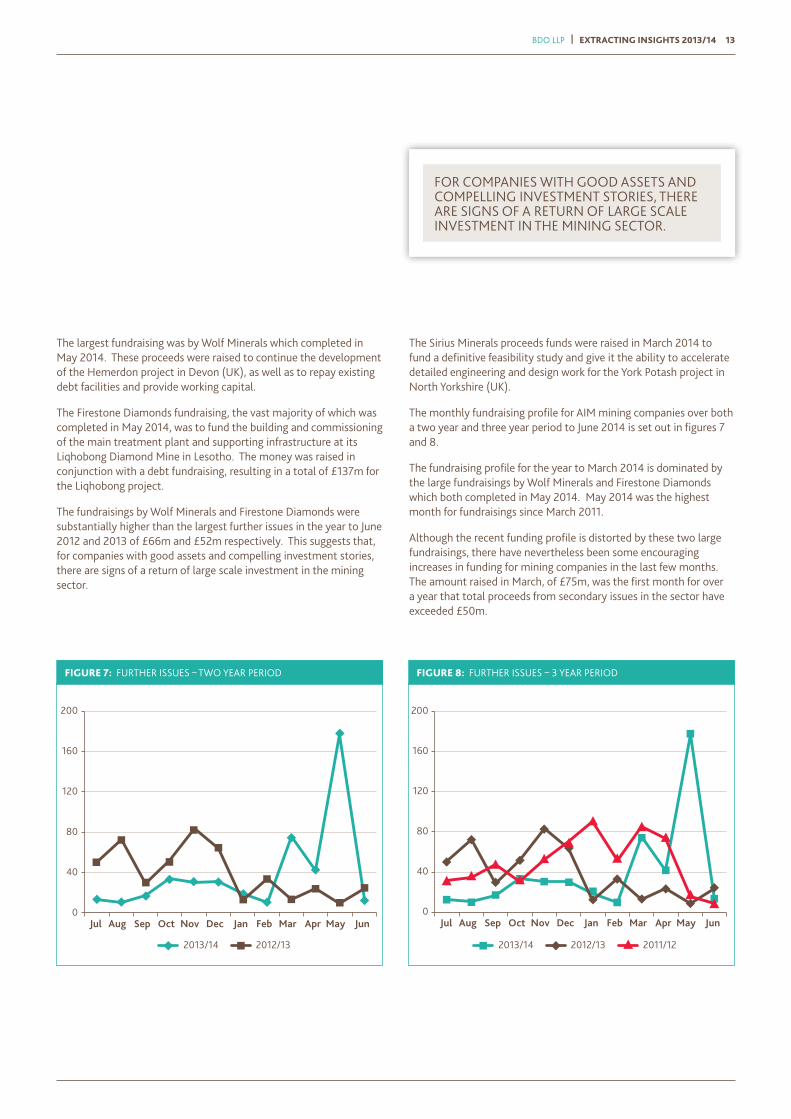
The monthly fundraising profile for AIM mining companies over both a two year and three year period to June 2014 is set out in figures 7 and 8.
The fundraising profile for the year to March 2014 is dominated by the large fundraisings by Wolf Minerals and Firestone Diamonds which both completed in May 2014. May 2014 was the highest month for fundraisings since March 2011.
Although the recent funding profile is distorted by these two large fundraisings, there have nevertheless been some encouraging increases in funding for mining companies in the last few months. The amount raised in March, of £75m, was the first month for over a year that total proceeds from secondary issues in the sector have exceeded £50m.
0Jul JunMayAprMarFebJanDecNovOctSepAug
40
80
120
160
200
2013/14 2012/13
Jul JunMayAprMarFebJanDecNovOctSepAug
200
160
120
80
40
0
2013/14 2012/13 2011/12
FIGURE 7: FURTHER ISSUES – TWO YEAR PERIOD FIGURE 8: FURTHER ISSUES – 3 YEAR PERIOD
FOR COMPANIES WITH GOOD ASSETS AND COMPELLING INVESTMENT STORIES, THERE ARE SIGNS OF A RETURN OF LARGE SCALE INVESTMENT IN THE MINING SECTOR.
EXTRACTING INSIGHTS 2013/14 | BDO LLP14
CONCLUSION GREEN SHOOTS?
Despite the continuing difficult market conditions, there are some tangible signs that the mining cycle may be starting to turn. The decline in the market value of AIM mining companies was the slowest since the sector downturn started three years ago.
Without suggesting that life is in any way easier, 53% of AIM companies saw their market capitalisation increase in the year, with a number seeing a substantial increase.
Some commodity prices have increased in 2014, with certain minerals such as nickel seeing robust growth in recent months and, although IPO proceeds for mining companies were very low during the year, proceeds of £477m from secondary issues represented the first increase for three years. With most of those proceeds being raised in the last four months of the year, and May 2014 registering the highest amount of funds raised in one month since March 2011, recent funding trends are more encouraging.
The secondary fundraises for Wolf Minerals and Firestone Diamonds of £99m and £74m were the largest such transactions for three years, suggesting that an appetite for large scale investment in the mining sector may be returning. However, the funding environment remains challenging, with investors focussing on good assets and compelling investment stories.
EXTRACTING INSIGHTS 2013/14 | BDO LLP16
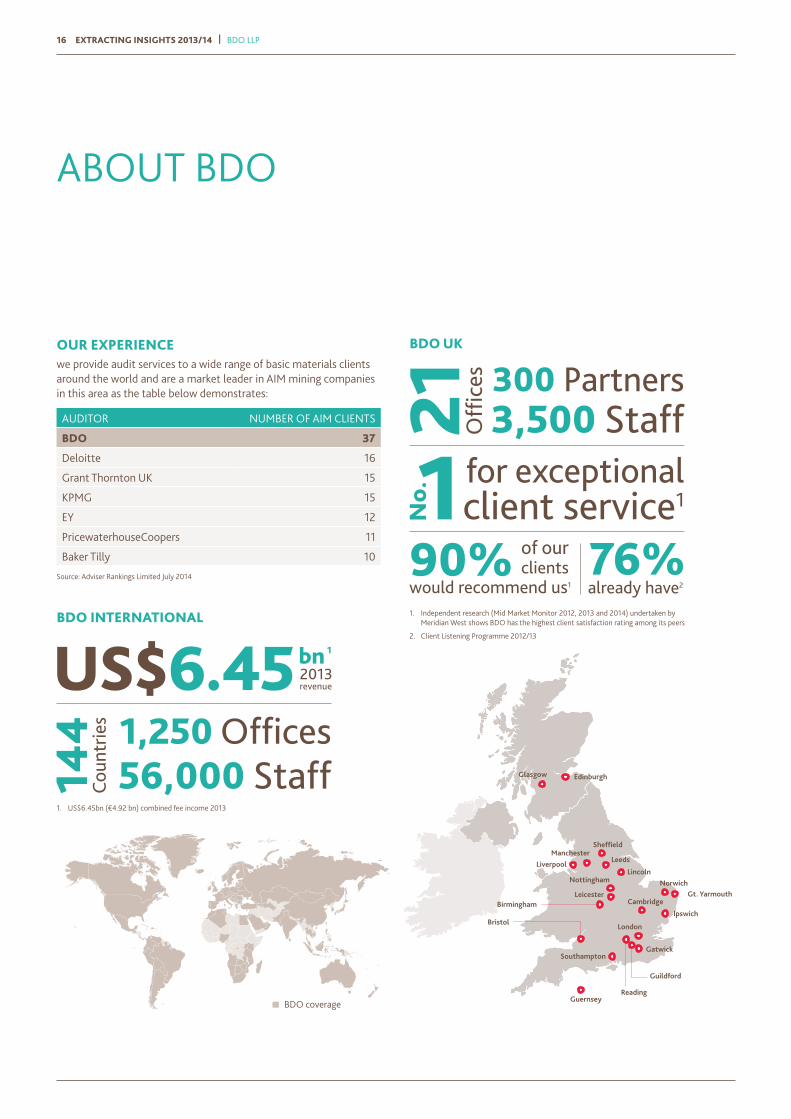
OUR EXPERIENCEwe provide audit services to a wide range of basic materials clients around the world and are a market leader in AIM mining companies in this area as the table below demonstrates:
ABOUT BDO
BDO UK
1. Independent research (Mid Market Monitor 2012, 2013 and 2014) undertaken by Meridian West shows BDO has the highest client satisfaction rating among its peers
2. Client Listening Programme 2012/13
BDO INTERNATIONAL
1. US$6.45bn (€4.92 bn) combined fee income 2013
BDO coverageBDO coverage
Edinburgh
Leeds
Sheffield
Lincoln
Cambridge
Ipswich
NorwichGt. Yarmouth
LiverpoolManchester
Guernsey
London
Reading
Guildford
Gatwick
Glasgow
Bristol
Birmingham
Nottingham
Leicester
Southampton
AUDITOR NUMBER OF AIM CLIENTS
BDO 37
Deloitte 16
Grant Thornton UK 15
KPMG 15
EY 12
PricewaterhouseCoopers 11
Baker Tilly 10
Source: Adviser Rankings Limited July 2014
This publication has been carefully prepared, but it has been written in general terms and should be seen as broad guidance only. The publication cannot be relied upon to cover specific situations and you should not act, or refrain from acting, upon the information contained therein without obtaining specific professional advice. Please contact BDO LLP to discuss these matters in the context of your particular circumstances. BDO LLP, its partners, employees and agents do not accept or assume any liability or duty of care for any loss arising from any action taken or not taken by anyone in reliance on the information in this publication or for any decision based on it.
BDO LLP, a UK limited liability partnership registered in England and Wales under number OC305127, is a member of BDO International Limited, a UK company limited by guarantee, and forms part of the international BDO network of independent member firms. A list of members' names is open to inspection at our registered office, 55 Baker Street, London W1U 7EU. BDO LLP is authorised and regulated by the Financial Conduct Authority to conduct investment business.
BDO is the brand name of the BDO network and for each of the BDO Member Firms.
BDO Northern Ireland, a partnership formed in and under the laws of Northern Ireland, is licensed to operate within the international BDO network of independent member firms.
© September 2014 BDO LLP. All rights reserved.
www.bdo.co.uk
HB0
6653
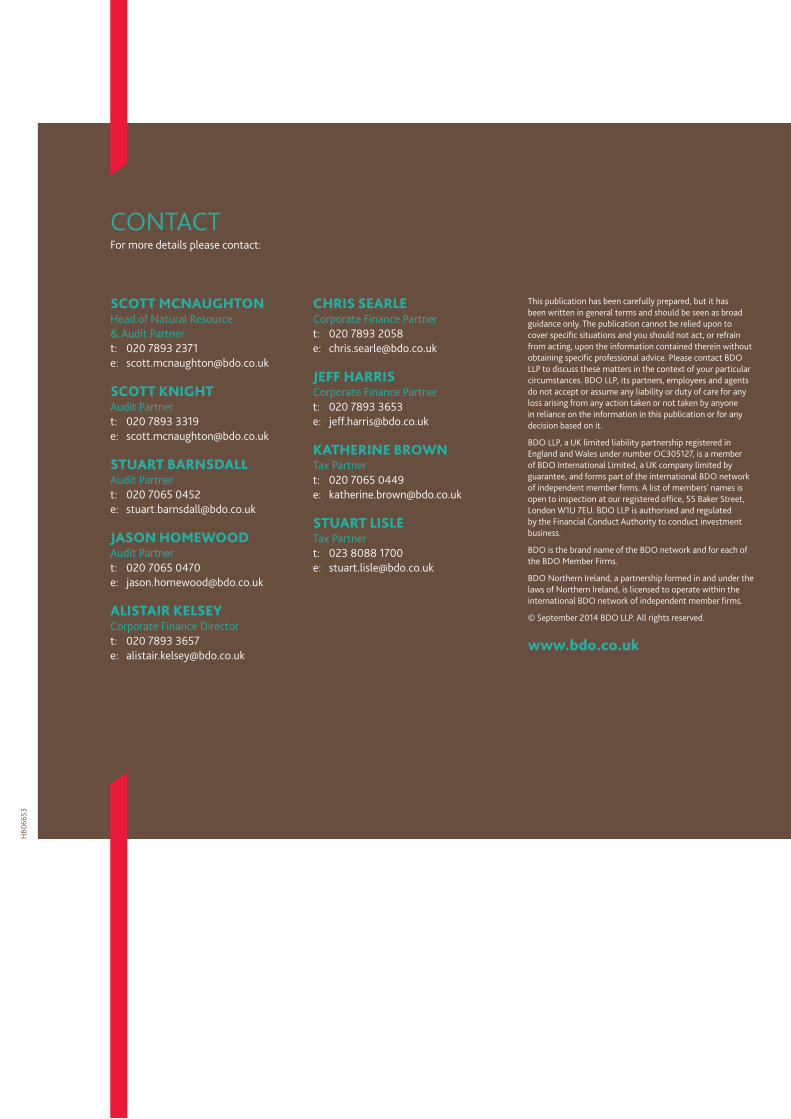
CONTACTFor more details please contact:
SCOTT MCNAUGHTON Head of Natural Resource & Audit Partnert: 020 7893 2371e: [email protected]
SCOTT KNIGHT Audit Partnert: 020 7893 3319e: [email protected]
STUART BARNSDALLAudit Partnert: 020 7065 0452e: [email protected]
JASON HOMEWOODAudit Partnert: 020 7065 0470e: [email protected]
ALISTAIR KELSEY Corporate Finance Directort: 020 7893 3657e: [email protected]
CHRIS SEARLECorporate Finance Partnert: 020 7893 2058e: [email protected]
JEFF HARRISCorporate Finance Partnert: 020 7893 3653e: [email protected]
KATHERINE BROWNTax Partnert: 020 7065 0449e: [email protected]
STUART LISLETax Partnert: 023 8088 1700e: [email protected]