extraction kinetics, physicochemical and functional
TRANSCRIPT

Mississippi State University Mississippi State University
Scholars Junction Scholars Junction
Theses and Dissertations Theses and Dissertations
12-14-2018
Extraction Kinetics, Physicochemical and Functional Properties of Extraction Kinetics, Physicochemical and Functional Properties of
Proteins Isolated from Channel Catfish (Ictalurus Punctatus) By-Proteins Isolated from Channel Catfish (Ictalurus Punctatus) By-
Products Products
Yuqing Tan
Follow this and additional works at: https://scholarsjunction.msstate.edu/td
Recommended Citation Recommended Citation Tan, Yuqing, "Extraction Kinetics, Physicochemical and Functional Properties of Proteins Isolated from Channel Catfish (Ictalurus Punctatus) By-Products" (2018). Theses and Dissertations. 2195. https://scholarsjunction.msstate.edu/td/2195
This Dissertation - Open Access is brought to you for free and open access by the Theses and Dissertations at Scholars Junction. It has been accepted for inclusion in Theses and Dissertations by an authorized administrator of Scholars Junction. For more information, please contact [email protected].

Template C v3.0 (beta): Created by J. Nail 06/2015
Extraction kinetics, physicochemical and functional properties of proteins isolated from
Channel catfish (Ictalurus punctatus) by-products
By
TITLE PAGE
Yuqing Tan
A Dissertation
Submitted to the Faculty of
Mississippi State University
in Partial Fulfillment of the Requirements
for the Degree of Doctor of Philosophy
in Food Science and Technology
in the Department of Food Science, Nutrition and Health Promotion
Mississippi State, Mississippi
December 2018

Copyright by
COPYRIGHT PAGE
Yuqing Tan
2018
Extraction kinetics, physicochemical and functional properties of proteins isolated from
Channel catfish (Ictalurus punctatus) by-products
By
APPROVAL PAGE
Yuqing Tan
Approved:
____________________________________
Sam K. C. Chang
(Major Professor)
____________________________________
Peter J. Bechtel
(Committee Member)
____________________________________
Ramakrishna Nannapaneni
(Committee Member)
____________________________________
Jiaxu Li
(Committee Member)
____________________________________
Marion W. Evans, Jr.
(Graduate Coordinator)
____________________________________
George M. Hopper
Dean
College of Agriculture and Life Sciences

Name: Yuqing Tan
ABSTRACT
Date of Degree: December 14, 2018
Institution: Mississippi State University
Major Field: Food Science and Technology
Select Appropriate Title: Add the name(s) of the person(s) heading your committee.
Title of Study: Extraction kinetics, physicochemical and functional properties of proteins
isolated from Channel catfish (Ictalurus punctatus) by-products
Pages in Study 205
Candidate for Degree of Doctor of Philosophy
Channel catfish raising is an important aquaculture in the United States.
Mississippi ranks No.1 in catfish production for continuous 4 years. However, catfish
fillet processing generates huge amount of by-products, including heads, bone frames,
visceras and skins, which contain significant amount of proteins. Removing and
utilization of proteins from the by-product would add value to the catfish industry.
Collagen was extracted from catfish skin by: (1) acid extraction; (2)
homogenization-aided; and (3) pepsin-aided extraction methods. Kinetic analysis of the
extraction was performed. SDS-PAGE was performed to analysis the composition of
proteins in collagens extracted under different conditions. Collages extracted by three
methods was characterized by solubility test, zeta potential, circular dichroism and gel
strength. Protein recovery rate from minced skin extracted with pH 2.4 HCl containing
23.6 KU/g pepsin was the highest (64.19%).
Papain, ficin, bromelain, neutrase, alcalase, protamex, novo-pro D and
thermolysin were used for the hydrolysis of the mixture of heads and frames. Proteolytic
activities of these proteases were examined using AzocollTM as a standard substrate.

Degree of hydrolysis (DH) of hydrolysates and enzyme reaction kinetics were
investigated. Results indicated that thermolysin had the highest activity (82.9×10⁷
AzU/g) at 50 °C when using AzocollTM as the substrate. Ficin (80 AzU/g) was the most
efficient in hydrolyzing the proteins in the ground catfish by-product (DH reaching
71.88%) in 120 min at 30°C among all the enzymes. Thermolysin could be used for
industries to hydrolyze protein by-products in terms of hydrolysis efficiency and
economy. The hydrolysis curves fit the Peleg model very well, all with R2 higher than
0.91.
Myofibrillar proteins were extracted from the mixture of heads and frames with
different pH conditions, and made into protein gels. Transglutaminase (TGase) was
incorporated to improve the gel structure. Solubility and secondary structures of extracted
myofibrillar proteins were studied. Gelling properties of the protein sol were studied by
dynamic rheological measurement. Physicochemical, textural and thermal properties of
protein gels treated with TGase were investigated. Protein pattern changes of TGase
treated protein gel was studied by SDS-PAGE. Results indicated that alpha-helicity of
myofibrillar proteins decreased with extraction pH over 9. Storage modulus (G’) of
protein sol decreased as the increase of extraction pH. Rheological measurement of
TGase treated protein sol showed that excessive TGase could weaken the gel structure.
This study provides systematic information for the catfish fillet processing industry to
utilize the by-products.
Keywords: Channel catfish, by-products, collagen, extraction kinetics, hydrolysis,
myofibrillar proteins, secondary structure, protein gel.

ii
DEDICATION
I would like to dedicate this dissertation to my parent, Baosheng Tan and Suhua
Xie; my parents in-law, Dr. Qinghai Meng and Lijun Zhao for their endless love, support,
and understanding that make my graduate work a reality. And gratitude also to my
special lab-mate: my husband, Dr. Shi Meng, who at various occasions stood by me,
supporting and helped me to proceed forward.

iii
ACKNOWLEDGEMENTS
I would like to express deepest gratitude to my major advisor, Dr. Sam K.C.
Chang, a world-renowned professor, for accepting me into his research group. His deep
involvement and invaluable comments throughout my graduate study are greatly
appreciated, and his hard-working spirit and serious attitude will always be an excellent
role model for my work and study later on. Special gratitude also goes to Dr. Chang’s
wife, Mrs. Chiu-Ie Chang for her caring during my graduate study.
I also like to express sincere appreciation to my other graduate committee
members, Dr. Peter Bechtel, Dr. Jiaxu Li, and Dr. Ramakrishna Nannapaneni for their
helpful suggestions, equipment support, help on ordering chemicals, and the interest they
have maintained in this research.
I would also like to express appreciation to Dr. Rivers Orion at Institute for
Imaging and Analytical Technologies, Mississippi State University, for his help and
training to conduct scanning electron microscope experiment.
I would like to recognize the Mississippi Agricultural and Forestry Experiment
Station, USDA-ARS SCA No. 58-402-2729, USDA-NIFA AFRI 20186702228050 and
USDA-NIFA AFRI 20176701426264 contributed funding for providing my tuition, and
stipend in addition to research chemicals/supplies.
I appreciated Mr. Parker Lee (Country Select Catfish Co., Isola, MS) for his help
and the donation of catfish and by-products.

iv
I also wish to extend my deep thanks to our lab members Dr. Yan Zhang, Mr. Yin
Zhang, Dr. Yuwei Wu and Mr. Ruiqi Chen for their help and support.
My gratitude goes to all my good friends in Starkville, Dr. Lei Cao, Dr. Hsin-Yi
Lu, Dr. Xue Zhang, Dr. Li Zhang, Mr. Yin Zhang, Dr. Yan Zhang, Dr. Yuwei Wu and
Mr. Wenjie Shao. They have never hesitated to help, encourage, and support me. I am so
grateful to have such sincere friendship during my graduate study.
My gratitude also goes to my close friends in China, Qian Liao, Lan Yu, and
Wencheng Zeng, for their encouragement and unconditional support.
Finally, I would also like to express my appreciation to the department staff, Ms.
Donna Bland, Ms. Mary Mandol, Ms. Jessica Rahim, and Ms. Kerri Kelly for their kind
help and support.

v
TABLE OF CONTENTS
DEDICATION ................................................................................................................ii
ACKNOWLEDGEMENTS ........................................................................................... iii
LIST OF TABLES .......................................................................................................... x
LIST OF FIGURES ........................................................................................................ xi
CHAPTER
I. INTRODUCTION ............................................................................................. 1
II. LITERATURE REVIEW .................................................................................. 6
2.1 Aquaculture in the United State .............................................................. 6 2.2 Overview of catfish production .............................................................. 6
2.3 Overview of sales and consumption in US. ............................................ 7 2.3.1 Catfish sales in US ........................................................................... 7
2.3.2 Catfish consumption in the US ......................................................... 8 2.4 Catfish fillet processing.......................................................................... 9
2.4.1 Removal of skin, heads, frames and gut ............................................ 9 2.4.2 By-products from catfish fillet processing ........................................ 9
2.5 Overview of catfish by-products .......................................................... 11 2.6 Fish skin .............................................................................................. 12
2.6.1 Extraction and characterization of collagen .................................... 13 2.6.1.1 Extraction method .................................................................... 13
2.6.1.2 Secondary structure of collagen ................................................ 14 2.6.1.3 3-D structure of collagen .......................................................... 17
2.6.1.4 Peptide mapping and amino acid composition of collagen ........ 18 2.6.1.5 Fourier transform infrared spectrum of collagen ....................... 19
2.6.1.6 Solubility of extracted collagen ................................................ 21 2.6.1.7 Gel strength of collagen-induced gel ......................................... 22
2.7 Heads and frames ................................................................................. 23 2.7.1 Overview ....................................................................................... 23
2.7.2 Hydrolysis of by-products .............................................................. 23 2.7.3 Proteolytic activity determination ................................................... 25
2.7.4 Emulsion properties of by-product hydrolysates ............................. 26 2.7.5 Antioxidant activity of fish protein hydrolysates............................. 26

vi
2.7.6 Angiotensin-converting enzyme (ACE) inhibition activity of
fish protein hydrolysates................................................................. 27
2.7.7 Dipeptidyl peptidase IV (DPP- IV) inhibition activity of fish
protein hydrolysates ....................................................................... 27
2.8 Overview of viscera ............................................................................. 28 2.9 Surimi .................................................................................................. 29
2.9.1 Historical review of surimi ............................................................. 29 2.9.2 Manufacture of surimi .................................................................... 29
2.9.3 Manufacture of fish ball ................................................................. 30 2.9.4 Protein component of surimi (washed fish meat mince) .................. 31
2.9.5 Myofibrillar proteins extraction method ......................................... 33 2.9.5.1 Alkaline extraction ................................................................... 33
2.9.5.2 Salt extraction .......................................................................... 33 2.9.5.3 Acid extraction ......................................................................... 34
2.9.5.4 Extraction temperature ............................................................. 34 2.9.6 Gelation chemistry ......................................................................... 35
2.9.7 Microstructure of surimi and surimi like products .......................... 36
III. ISOLATION AND CHARACTERIZATION OF COLLAGEN
EXTRACTED FROM CHANNEL CATFISH (ICTALURUS
PUNCTATUS) SKIN ...................................................................................... 39
3.1 Abstract ............................................................................................... 39 3.2 Introduction ......................................................................................... 40
3.3 Materials and methods ......................................................................... 41 3.3.1 Materials ........................................................................................ 41
3.3.2 Chemicals ...................................................................................... 41 3.3.3 Proximate analysis ......................................................................... 42
3.3.4 Extraction of collagen with acids (ASC) ......................................... 42 3.3.5 Extraction of collagen with homogenization-aided (HSC)
method ........................................................................................... 43 3.3.6 Extraction of collagen with pepsin and homogenization aided
(PHSC) method .............................................................................. 43 3.3.7 Kinetic analysis of collagen extraction ........................................... 44
3.3.8 Sodium-dodecyl-sulfate polyacrylamide gel electrophoresis
(SDS-PAGE) .................................................................................. 44
3.3.9 Effect of pH on solubility ............................................................... 45 3.3.10 Effect of NaCl on solubility ............................................................ 45
3.3.11 Zeta (ζ) potential ............................................................................ 45 3.3.12 Circular dichroism (CD) ................................................................. 46
3.3.13 Differential scanning calorimetry (DSC) ........................................ 46 3.3.14 Gel strength .................................................................................... 47
3.3.15 Statistical analysis .......................................................................... 47 3.4 Results and discussion ......................................................................... 47
3.4.1 Proximate analysis of catfish skin ................................................... 47 3.4.2 Collagen extracted with acids and proximate analysis..................... 48

vii
3.4.3 Collagen extraction-aided by homogenization with or without
pepsin ............................................................................................ 49
3.4.4 Kinetic analysis of collagen extraction ........................................... 53 3.4.5 SDS-PAGE of collagen extracted with different conditions ............ 60
3.4.6 Effect of pH and NaCl on collagen solubility ................................. 64 3.4.6.1 Effect of pH on collagen solubility ........................................... 64
3.4.6.2 Effect of NaCl on collagen solubility ........................................ 64 3.4.7 Zeta (ζ) potential ............................................................................ 66
3.4.8 Circular dichroism (CD) ................................................................. 68 3.4.9 Differential scanning calorimetry (DSC) ........................................ 68
3.4.10 Gel strength .................................................................................... 73 3.5 Conclusion ........................................................................................... 73
3.6 Research diagram in proposal .............................................................. 75
IV. COMPARING THE KINETIC OF THE HYDROLYSIS OF BY-
PRODUCT FROM CHANNEL CATFISH (ICTALURUS
PUNCTATUS) FILLET PROCESSING BY EIGHT PROTEASES ................ 76
4.1 Abstract ............................................................................................... 76 4.2 Introduction ......................................................................................... 77
4.3 Material and methods ........................................................................... 78 4.3.1 Materials ........................................................................................ 78
4.3.2 Chemicals ...................................................................................... 78 4.3.3 Proteolytic activity determination by using Azocoll as
substrate ......................................................................................... 79 4.3.4 Proteolytic activity determination by using Azocasein as
substrate ......................................................................................... 80 4.3.5 Enzymatic hydrolysis ..................................................................... 80
4.3.6 Proximate analysis ......................................................................... 81 4.3.7 Determination of the degree of hydrolysis (DH) using
trinitrobenzenesulfonic acid (TNBS) method .................................. 81 4.3.8 Kinetic analysis of hydrolysis processing ....................................... 82
4.3.9 Calculated price of proteases activity and cost to reach 15 and
20% DH ......................................................................................... 83
4.3.10 Sodium-dodecyl-sulfate gel electrophoresis (SDS-PAGE) .............. 83 4.3.11 Emulsion capacities ........................................................................ 83
4.3.12 Foaming capacities ......................................................................... 84 4.3.13 Oxygen radical absorbing capacity (ORAC) of selected
hydrolysates ................................................................................... 85 4.3.14 Radical DPPH scavenging activity of selected hydrolysates ........... 86
4.3.15 Angiotensin-converting enzyme (ACE) inhibition assay ................. 86 4.3.16 DPP-IV inhibition assay ................................................................. 87
4.3.17 Statistical analysis .......................................................................... 88 4.4 Results and discussion ......................................................................... 88
4.4.1 Proximate analysis ......................................................................... 88

viii
4.4.2 Determination of proteolytic activity by using Azocoll and
Azocasein as substrate .................................................................... 89
4.4.3 Degree of hydrolysis of catfish protein hydrolysates ....................... 94 4.4.4 Kinetic analysis of hydrolysis processing ..................................... 112
4.4.5 Predicted cost of protease for approaching certain DH .................. 117 4.4.6 Sodium-dodecyl-sulfate gel electrophoresis (SDS-PAGE) ............ 118
4.4.7 Emulsion capacity and stability .................................................... 132 4.4.8 Foaming capacity and stability ..................................................... 136
4.4.9 Antioxidant activity of selected hydrolysates ................................ 137 4.4.10 ACE inhibition assay .................................................................... 145
4.4.11 DPP-IV inhibition assay ............................................................... 146 4.4.12 Protein recovery rate of hydrolysates with good
functionalities............................................................................... 150 4.5 Conclusion ......................................................................................... 151
4.6 Research diagram in proposal ............................................................ 153
V. EFFECT OF EXTRACTION PH AND TRANSGLUTAMINASE
CROSS-LINKING ON PHYSICOCHEMICAL AND TEXTURAL
CHANGES IN MYOFIBRILLAR PROTEINS EXTRACTED FROM
CHANNEL CATFISH BY-PRODUCTS....................................................... 154
5.1 Abstract ............................................................................................. 154
5.2 Introduction ....................................................................................... 155 5.3 Materials and methods ....................................................................... 156
5.3.1 Materials ...................................................................................... 156 5.3.2 Chemicals .................................................................................... 157
5.3.3 Myofibrillar protein extraction ..................................................... 157 5.3.4 Circular dichroism (CD) ............................................................... 157
5.3.5 Effect of pH on solubility of extracted myofibrillar proteins ......... 158 5.3.6 Production of protein gel and transglutaminase treatment ............. 158
5.3.7 Dynamic rheological measurement ............................................... 159 5.3.8 Differential scanning calorimetry (DSC) ...................................... 160
5.3.9 Textural analysis and cooking loss ............................................... 160 5.3.10 Color ............................................................................................ 160
5.3.11 SDS-PAGE analysis ..................................................................... 161 5.3.12 Scanning electron microscopy (SEM)........................................... 161
5.3.13 Statistical analysis ........................................................................ 162 5.4 Results and discussion ....................................................................... 162
5.4.1 Yield of extracted myofibrillar proteins ........................................ 162 5.4.2 Circular dichroism of extracted myofibrillar proteins.................... 163
5.4.3 Effect of pH on solubility of extracted myofibrillar proteins ......... 165 5.4.4 Rheological properties of protein gel made from extracted
myofibrillar proteins treated with and without
transglutaminase .......................................................................... 167
5.4.5 Differential scanning calorimetry ................................................. 171

ix
5.4.6 Penetration test, cooking loss and color of transglutaminase
treated protein gels ....................................................................... 173
5.4.7 SDS-PAGE of TGase-treated protein gel ...................................... 177 5.4.8 Scanning electron microscopy ...................................................... 178
5.5 Conclusion ......................................................................................... 181
VI. SUMMARY OF ACHIEVEMENTS, LIMITATIONS AND FUTURE
WORK .......................................................................................................... 182
6.1 Summary ........................................................................................... 182
6.2 Limitations and future work ............................................................... 183
REFERENCES............................................................................................................ 185

x
LIST OF TABLES
3.1 Kinetic constant and R2 for hydroxyproline recovery rate under
different extraction conditions. ................................................................... 59
4.1 Proximate analysis of the mixture of catfish heads and frames
(w:w=3:2). .................................................................................................. 89
4.2 Activity and cost of eight types of proteases. ............................................... 92
4.3 Hydrolysis kinetics of 8 enzymes at different temperatures and
enzyme concentrations. ............................................................................. 113
4.4 Calculated enzyme activity and cost to reach 15 and 20% DH when
hydrolyzing catfish by-product at pH 7.2. ................................................. 121
4.5 ORAC values (µmol TE/g) of selected catfish by-products
hydrolysates hydrolyzed under different conditions. ................................. 143
4.6 DPPH values (µmol TE/g) of selected catfish by-products
hydrolysates hydrolyzed under different conditions. ................................. 144
4.7 IC50 values (mg/mL) of catfish by-products hydrolysates hydrolyzed
under different conditions against angiotensin-converting enzyme. ........... 148
4.8 IC50 values (mg/mL) of selected catfish by-products hydrolysates
hydrolyzed under different conditions against DPP-IV. ............................. 149
4.9 Protein recovery rate (%) of hydrolysates with good functionalities. ......... 152
5.1 Textural analysis, cooking loss and color of TGase treated protein
gels. .......................................................................................................... 176

xi
LIST OF FIGURES
2.1 Annual catfish sales in the United States from 2010 to 2016 (USDA,
2010, 2011, 2012, 2013, 2014, 2015 & 2016). .............................................. 8
2.2 Top ten seafood consumed in the United States (National Fisheries
Institute, 2017).............................................................................................. 9
2.3 Catfish fillet processing. ............................................................................. 10
2.4 By-products from catfish fillet processing plant. ......................................... 11
2.5 SDS-PAGE patterns of collagen extracted from the skin of bigeye
snapper with acid pre-swelling process, followed by the treatment
with bigeye snapper pepsin (BSP) or porcine pepsin (PP) at 20
KUnits/g defattd skin for different times (Nalinanon, Benjakul,
Visessanguan, & Kishimura, 2007). ............................................................ 14
2.6 CD spectra of bone (a) and scale (b) collagen (Ogawa, Portier,
Moody, Bell, Schexnayder & Losso,2004). ... Error! Bookmark not defined.
2.7 CD spectra of triple helix. ........................................................................... 17
2.8 3-D structure of collagen (Goodsell, Dutta, Zardecki, Voigt, Berman
& Burley, 2000). ......................................................................................... 18
2.9 Peptide mapping of collagen from calf (lane 2) and grass carp (lane 3)
skin (Zhang, Liu, Li, Shi, Miao, & Wu, 2007)............................................. 19
2.10 UV-Vis spectra of pepsin-soluble collagen (Liu, Li, & Guo, 2007). ............ 20
2.11 Fourier transform infrared spectrum of acid-solubilized collagen of
Channel catfish skin (Liu, Li & Guo, 2007). ............................................... 21
2.12 Flow chart of surimi manufacturing (Park, 2013). ....................................... 30
2.13 Processing flow diagram of fish ball (Park, 2013). ...................................... 31
2.14 SDS-PAGE gel of sarcoplasmic proteins extracted from sea bass
(Ladrat, Verrez-Bagnis, Noël, & Fleurence, 2003) ...................................... 32

xii
2.15 Head induced gel formation of myosin monomer. ....................................... 35
2.16 Microstructure of hairtail surimi proteins (Hu, et al., 2018). ........................ 37
2.17 Microstructure of transglutaminase-treated threadfin bream surimi
gel. ............................................................................................................. 37
2.18 Microstructure of Alaska Pollock surimi treated with different
deacetylation of Konjac glucomannan (Zhang, Xue, Li, Wang, &
Xue, 2015). ................................................................................................. 38
3.1 Hydroxyproline recovery rate of collagen extracted with different
acids. .......................................................................................................... 52
3.2 Hydroxyproline recovery rate of collagen extracted with different
acids at pH 2.6. ............................................. Error! Bookmark not defined.
3.3 SDS-PAGE gels of collagens extracted with various acid extractions. ........ 62
3.4 SDS-PAGE gel of collagens extracted with different concentrations
of pepsin. .................................................................................................... 63
3.5 Effect of pH and NaCl on collagen solubility. ............................................. 66
3.6 Physical and structural characterizations of extracted collagen. ................... 70
3.7 Research diagram of utilization of catfish skin and characterization of
collagen extracted from catfish skin. ........................................................... 75
4.1 Enzymatic hydrolysis of catfish by-product (mixture of frames and
heads) with papain under different temperature and varying activity
units (AzU/g of protein in substrate). .......................................................... 96
4.2 Enzyme hydrolysis of catfish by-product (mixture of frames and
heads) with ficin under different temperature and varying activity
units (AzU/g of protein in substrate). .......................................................... 98
4.3 Enzyme hydrolysis of catfish by-product (mixture of frames and
heads) with bromelain under different temperature and varying
activity units (AzU/g of protein in substrate). ............................................ 100
4.4 Enzyme hydrolysis of catfish by-product (mixture of frames and
heads) with neutrase under different temperature and varying activity
units (AzU/g of protein in substrate). ........................................................ 102
xiii
4.5 Enzyme hydrolysis of catfish by-product (mixture of frames and
heads) with alcalase under different temperature and varying activity
units (AzU/g of protein in substrate). ........................................................ 104
4.6 Enzyme hydrolysis of catfish by-product (mixture of frames and
heads) with protamex under different temperature and varying
activity units (AzU/g of protein in substrate). ............................................ 106
4.7 Enzyme hydrolysis of catfish by-product (mixture of frames and
heads) with Novo-ProD under different temperature and varying
activity units (AzU/g of protein in substrate). ............................................ 108
4.8 Enzyme hydrolysis of catfish by-product (mixture of frames and
heads) with thermolysin under different temperature and varying
activity units (AzU/g of protein in substrate). ............................................ 110
4.9 Catfish protein and peptide pattern changes upon Protamex hydrolysis
at 50°C. .................................................................................................... 125
4.10 Catfish protein and peptide pattern changes upon Novo-proD
hydrolysis at 60°C. ................................................................................... 126
4.11 Catfish protein and peptide pattern changes upon Papain hydrolysis at
40°C. ........................................................................................................ 127
4.12 Catfish protein and peptide pattern changes upon Acalase hydrolysis
at 30°C. .................................................................................................... 128
4.13 Catfish protein and peptide pattern changes upon Neutrase hydrolysis
at 30°C. .................................................................................................... 129
4.14 Catfish protein and peptide pattern changes upon Thermolysin
hydrolysis at 50°C. ................................................................................... 130
4.15 Catfish protein and peptide pattern changes upon ficin hydrolysis at
60°C. ........................................................................................................ 131
4.16 Emulsifying activity index (EAI) and emulsion stability index (ESI)
of catfish by-products hydrolysates prepared using Novo-ProD (A
and B) and thermolysin (C and D) at 30 and 60°C, respectively. ............... 134
4.17 Foaming property and stability of catfish by-products hydrolysates. ......... 139
4.18 Research diagram of utilization of catfish by-product for making
protein hydrolysates. ................................................................................. 153

xiv
5.1 Circular dichroism spectrum of myofibrillar proteins extracted under
different pH. ............................................................................................. 165
5.2 Effect of pH on the solubility of myofibrillar proteins extracted under
different pH. ............................................................................................. 167
5.3 Storage modulus (G’) of protein sol made from myofibrillar proteins
extracted under different pH. .................................................................... 170
5.4 Storage modulus (G’) of transglutaminase treated protein sol made
from myofibrillar proteins extracted from catfish by-products
(mixture of frames and heads). .................................................................. 171
5.5 Differential scanning calorimetry thermograms of transglutaminase-
treated protein gels made from myofibrillar proteins extracted from
catfish by-products. .................................................................................. 173
5.6 SDS-PAGE gel of proteins extracted from catfish by-products, and
TGase- treated protein gel. ........................................................................ 178
5.7 Scanning electron microscopy images of TGase-treated protein gels. ........ 180
5.8 Pictures of commercial fish ball and protein gels made from catfish
by-products with (1 U/g) and without transglutaminase treatment. ............ 181

1
CHAPTER I
INTRODUCTION
Channel catfish (Ictalurus punctatus) raising is the most important aquaculture in
the United States. Channel catfish is a warm water species, native to major Mississippi
river and Gulf Coast streams in the central and southern areas of United State.
Mississippi State ranks No.1 in catfish production with annual production of $214 million
in 2017 (MSU extension data). Catfish fillet production is vital to the success of the
economy of Southern states including Alabama, Louisiana and Arkansas. The major by-
products from the fillet processing plants are heads, bone frames, and skins. Large
number of by-products (around 60% of whole catfish) generated from the catfish fillet
processing are regarded as waste and sold to local farmers for only 2 cents per pound.
Moreover, the waste from the fillet processing plants must be disposed, which otherwise,
would create environmental pollution. Therefore, to find a way to utilize by-products is
imperative.
Channel catfish skin accounts for about 10-15% of the by-products (3-6% of the
whole fish weight) (based on our preliminary study) and can be used as a potential
collagen source. Collagen is a long cylindrical protein, and is the major component that
contributes to the unique physiological function of connective tissues in the skin.
Commercial gelatin is usually extracted from porcine skins and bones. However, it is not
acceptable by Judaism and Islam due to religious restrictions (Nalinanon, Benjakul,

2
Visessanguan, & Kishimura, 2007). In addition, collagen extracted from bovine might be
contaminated with bovine spongiform encephalopathy (Choi & Regenstein, 2000).
Therefore, aquatic sources for collagen production are a substitution for mammalian
sources even though the yield of collagen from aquatic sources is much lower than that
from mammalian sources. However, the yield of collagen extracted from fish skin has
been greatly improved in recent years (Gómez-Guillén, Giménez, López-Caballero, &
Montero, 2011). More and more studies about different alternative sources and new
functionalities of collagen have been reported in the last 10 to15 years. However, most
studies used a single set of extraction conditions. There is a lack of a systematic approach
for collagen extraction, particularly for catfish collagen extraction. The extraction yield
of collagen from fish skins still remains low, and the extraction methods are of little
practical significance to the food industries since most of them require long time, high
energy input and dialysis processing. In addition, no systematic kinetic analysis of
extraction yield has been performed.
The by-products (mostly heads and bone frames) are an excellent source of
protein (42.7% protein, db) with high nutritive value, which can be processed into value-
added food products or ingredients with desirable functional and nutritional properties
(Gehring, Gigliotti, Moritz, Tou, & Jaczynski, 2011; Gehring, Davenport, & Jaczynski,
2009). Because of the steady increase in world population, global need of protein source
is increasing rapidly (Tilman, Balzer, Hill, & Befort, 2011). Catfish protein isolated from
by-products can help alleviate world protein shortage problem, and hence help reduce
problems associated with world hunger and malnutrition. Successful utilization of the by-
product as a protein hydrolysate may increase aquaculture profitability and sustainability.

3
Protein hydrolysates have been made from various fish species by bacterial
fermentation (Kristinsson & Rasco, 2000a; Sodini, Lucas, Tissier, & Corrieu, 2005) or by
enzymatic hydrolysis (Hathwar, Bijinu, Rai, & Narayan, 2011; Nilsang, Lertsiri,
Suphantharika, & Assavanig, 2005). Flavourzyme™ and Kojizyme™ have been used for
hydrolyzing tuna processing by-product (Nilsang, Lertsiri, Suphantharika, & Assavanig,
2005). Alcalase and neutrase have been utilized for hydrolyzing pacific whiting solid
waste and capelin (Benjakul & Morrissey, 1997; Shahidi, Han, & Synowiecki, 1995).
Plant proteases such as papain, ficin and bromelain have also been used for hydrolyzing
fish protein (Beddows & Ardeshir, 1979; Salampessy, Phillips, Seneweera, &
Kailasapathy, 2010). Early research intention is to use the fish hydrolysate for feed.
Recently, hydrolysates of fish protein have been found to possess antioxidant activity
(Halldorsdottir, Kristinsson, Sveinsdottir, Thorkelsson, & Hamaguchi, 2013; Mendis,
Rajapakse, & Kim, 2005), antiproliferative activity (Hsu, Chan, & Jao, 2011) and
Angiotensin-I converting enzymes (ACE) inhibition activity, which can prevent
hypertension (Nakajima, Yoshie-Stark, & Ogushi, 2009; Raghavan & Kristinsson, 2009),
and most of the studies have focused on improving the degree of hydrolysis and
antioxidant activity. However, no literature has reported the hydrolysis of Channel catfish
by-product by using proteases.
Traditionally, surimi is made from fish meat of both salt and fresh water origins.
China is the first country to produce fish ball dating back to year 220 BC (Park, 2013). In
the United States, crabsticks are made from Alaska Pollock or Pacific Whiting after
extensive washing. However, Channel catfish has never been used commercially to make
surimi or surimi-like products since it has higher value in the form of fillet. Using Alaska

4
pollock, Pacific whiting and Pacific hake meat to make surimi products such as fish ball,
fish cake and fish tofu have been studied thoroughly (Jenkelunas & Chan, 2018; Moon,
Yoon, & Park, 2017). Protein isolate from catfish fillet has been extracted by acid and
alkaline extraction methods and made into protein gel (Davenport & Kristinsson, 2011).
However, such protein extracted from catfish fillet has remained only in the stage of
research since using fillet to make surimi is cost prohibitive. In addition, the nativity of
the proteins is affected by the extraction/processing technology that imposes shearing
force during grinding and mixing, and degradation by endogenous hydrolytic enzymes,
which need to be controlled by cooling or the use of protease inhibitors. It is a challenge
to maximize processing yield and the quality of protein end-products from less desirable
raw materials such as fish by-products. Research for making food-grade products from
the by-products is still in its infancy.
Overall, catfish by-products have the potential to be processed into value added
products, for both increasing profitability and decreasing environmental pollution. An
economic analysis of producing surimi from catfish by-products shows that if extraction
rate is larger than 20% of the frame, the extraction would be commercially feasible
(McAlpin, Dillard, Kim, & Montanez, 1994). However, no comprehensive study on
utilization of catfish by-products has been reported. This study will provide a systematic
information for the catfish fillet processing industry to utilize the processing by-products.
The objectives of the present study are: (1) to use a systematic approach to
optimize the collagen extraction condition and modify the extraction method to recover
the maximum yield, (2) to characterize the properties of collagen extracted with different
extraction conditions; (3) to investigate the kinetics of the enzymatic hydrolysis of

5
proteins in catfish heads and frames, (4) to study the functional properties of enzymatic
hydrolysates, (5) to study the secondary structure changes of myofibrillar proteins
extracted under different pH, (6) to understand the physicochemical, textural and thermal
properties of the protein gel made from proteins extracted from catfish by-products, and
(7) to study the effect of transglutaminase on protein gels.

6
CHAPTER II
LITERATURE REVIEW
2.1 Aquaculture in the United State
Aquaculture is one of the most important compositions of US agriculture. Interest
in aquaculture is rising because the decreasing in the wild catch of many animal species.
US aquaculture’s estimated sales was $1.37 billion in the year of 2013 (USDA, 2013).
Catfish and trout are the major products. Most of the trout grown for food are located in
Idaho, which accounts for over 75% of the total trout production. And southern states like
Mississippi, Alabama, Louisiana and Arkansas are the major states for catfish
aquaculture. Mississippi state ranks number one in catfish production for over 20 years
(USDA, 1997-2018).
2.2 Overview of catfish production
Channel catfish farming in the Southern region is the most important warm water
aquaculture in the United State. Mississippi ranks number one in US catfish production,
which had dramatically reduced in the last 10 years due to a continuous reduction in
profitability which was caused by the increases in feed cost, and the fierce international
competition of catfish import from Vietnam. Despite the decline, catfish farming and
fillet processing industries remain as an important agricultural and food industry, and
their existence is vital to the success of the rural economy since they provide employment
opportunities to many low-income families on top of profitability to the growers. A small

7
catfish fillet processing plant can easily employ more than 250 workers. Therefore, value-
added utilization of the by-products is of a top and urgent priority to enhance the survival
of the US catfish industry.
Catfish has never been used commercially to make surimi products since it has
higher value in the form of fillet. Catfish fillet has been studied to make protein isolate by
acid and alkaline extractions, and the protein isolate was used for protein gel making
(Davenport & Kristinsson, 2011). However, such surimi or surimi-like product made
from catfish fillet has remained only in the stage of research since using fillet to make
surimi is cost prohibitive.
2.3 Overview of sales and consumption in US.
2.3.1 Catfish sales in US
Catfish productions and sales reached to $379 million in 2017 (USDA, 2018). The
combined production and sales in the southeastern states, including Alabama ($114
million), Arkansas ($20.6 million), Mississippi ($214 million), and Texas ($15.6 million),
all of which account for over 96% of the U.S. catfish production and sales in 2017
(USDA, 2018). Similar sales data were observed in the past five years. Figure 2.1
indicated the total catfish sales from 2010 to 2016.

8
Figure 2.1 Annual catfish sales in the United States from 2010 to 2016 (USDA, 2010,
2011, 2012, 2013, 2014, 2015 & 2016).
2.3.2 Catfish consumption in the US
During the past decade, shrimp is the most preferred seafood in the US. However,
catfish dropped from sixth to ninth place from 2007 to 2016. Figure 2.2 indicated the top
ten seafood consumed in the United States from 2007 to 2016. Shrimp, salmon and
canned tuna were the top three during the past decade. In addition, Alaska pollock and
tilapia are more preferred than catfish during the past ten years. Moreover, pangusius and
cod are more preferred than catfish from 2013 to 2016. These observations indicated that
the preference for seafood have been changed over the last decade in the United States,
and catfish fillet is not as preferred as before.

9
Figure 2.2 Top ten seafood consumed in the United States (National Fisheries
Institute, 2017).
2.4 Catfish fillet processing
2.4.1 Removal of skin, heads, frames and gut
In the catfish fillet processing plant, head and skin are first removed, and then the
knife will cut upward to obtain the fillet. Figure 2.3 shows the processing of catfish fillet
processing. The by-products, including heads, frames, skins, and viscera are regarded as
waste after fillet processing.
2.4.2 By-products from catfish fillet processing
Based on the US dietary preference, fish heads, frames, skins and viscera are not
acceptable to the consumers. However, depending on the type of fish, these parts can be
processed into foods and have been very popular in Asia for a long period of time. The
picture of by-products from catfish fillet processing are shown in Figure 2.4.

10
Figure 2.3 Catfish fillet processing.

11
Figure 2.4 By-products from catfish fillet processing plant.
A1 and A2: Catfish head; B: catfish skin; C1 and C2: catfish frame. (Photos are
contributed by Dr. Sam K.C. Chang).
2.5 Overview of catfish by-products
Catfish (approximately $1 per lb of the fresh fish supply) fillet processing
generates by-products, which are generally sold to rendering plants at 2 cents/lb, to
produce fish meal. The entire catfish aquaculture harvested 320.174 million pounds of
live catfish in 2016 (USDA, 2017). In catfish fillet processing, approximately 60% of the
whole catfish is the by-product, which would translate into more than 190 million pounds
of by-products. Since Mississippi growers produced 54% of all live catfish sales, catfish
processing by-products in 2016 was more than 100 million pounds.
An in-depth characterization of the physical and biochemical properties of the
catfish by-products as affected by processing and engineering methods has not been
researched. Such characterization is needed for scale-up production. The fish by-products
can undergo rapid changes (autolysis by endogenous proteases) to negatively affect the

12
quality and yield of the extracted proteins. Component fractionation (based on water
solubility, pH and salt concentrations) and understanding the molecular and biological
characteristics of the fractions are of the primary importance for developing novel
integrated technologies for the complete utilization of the catfish by-products.
2.6 Fish skin
Channel catfish skin accounts for about 3-6% of the whole fish weight (10-15%
of the by-products). Collagen is the major components of skin and contributes to the
unique physiological function of connective tissue in the skin. The skin contains mostly
connective proteins (collagen) and fat. Collagen had been isolated from fish skin and
scale by researchers (Chen, Li, Yi, Xu, Gao, & Hong, 2016; Chen, et al., 2016; Duan,
Zhang, Du, Yao, & Konno, 2009; Huang, Kuo, Wu, & Tsai, 2016). Collagen is
traditionally extracted from the mammalian sources such as porcine and bovine; however,
it is not acceptable by Judaism and Islam due to religious restrictions (Nalinanon,
Benjakul, Visessanguan, & Kishimura, 2007). Therefore, aquatic sources for collagen
production are a substitution for the mammalian sources even though the yield of
collagen from aquatic sources is much lower than that from mammalian sources.
Fortunately, the yield of collagen extracted from fish skin has been greatly improved in
the recent years (Gómez-Guillén, Giménez, López-Caballero, & Montero, 2011).
Researchers have reported that around 50% of collagen can be isolated from fish skin,
and 45% of collagen from fish bones (Nagai & Suzuki, 2000).
13
2.6.1 Extraction and characterization of collagen
2.6.1.1 Extraction method
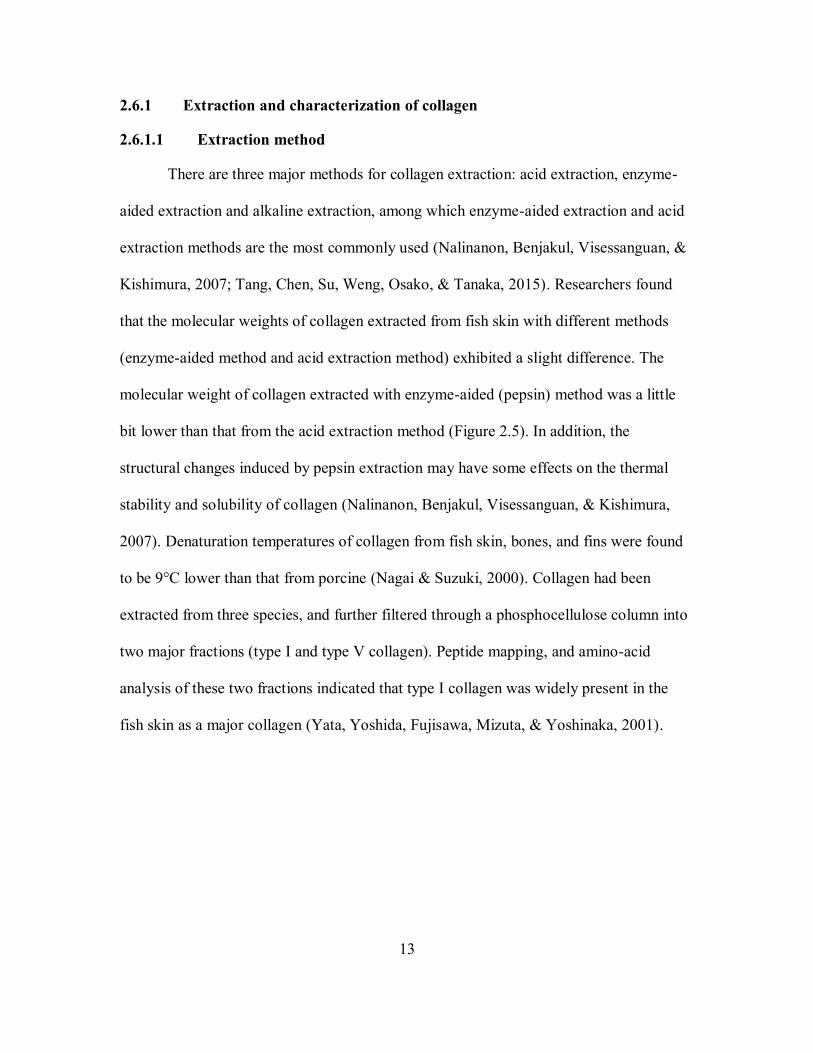
There are three major methods for collagen extraction: acid extraction, enzyme-
aided extraction and alkaline extraction, among which enzyme-aided extraction and acid
extraction methods are the most commonly used (Nalinanon, Benjakul, Visessanguan, &
Kishimura, 2007; Tang, Chen, Su, Weng, Osako, & Tanaka, 2015). Researchers found
that the molecular weights of collagen extracted from fish skin with different methods
(enzyme-aided method and acid extraction method) exhibited a slight difference. The
molecular weight of collagen extracted with enzyme-aided (pepsin) method was a little
bit lower than that from the acid extraction method (Figure 2.5). In addition, the
structural changes induced by pepsin extraction may have some effects on the thermal
stability and solubility of collagen (Nalinanon, Benjakul, Visessanguan, & Kishimura,
2007). Denaturation temperatures of collagen from fish skin, bones, and fins were found
to be 9°C lower than that from porcine (Nagai & Suzuki, 2000). Collagen had been
extracted from three species, and further filtered through a phosphocellulose column into
two major fractions (type I and type V collagen). Peptide mapping, and amino-acid
analysis of these two fractions indicated that type I collagen was widely present in the
fish skin as a major collagen (Yata, Yoshida, Fujisawa, Mizuta, & Yoshinaka, 2001).

14
Figure 2.5 SDS-PAGE patterns of collagen extracted from the skin of bigeye snapper
with acid pre-swelling process, followed by the treatment with bigeye
snapper pepsin (BSP) or porcine pepsin (PP) at 20 KUnits/g defattd skin
for different times (Nalinanon, Benjakul, Visessanguan, & Kishimura,
2007).
2.6.1.2 Secondary structure of collagen
Up to 27 types of collagen have been identified, and type I collagen exists the
most widely in the connective tissues. Total molecular mass of collagen is about 300
KDa with each chain has a molecular mass of about 100 KDa, and it has a wide range of
applications in pharmaceutical, leather, biomedical and film industries (Ogawa, Portier,
Moody, Bell, Schexnayder, & Losso, 2004).
Circular dichroism (CD) spectra of collagen extracted from black drum and
sheepshead seabream with acid and pepsin-aided methods were reported by Ogawa and
coworkers. They found native collagen from bones gave a characteristic CD spectrum
with a positive extreme at 220 nm and a negative peak appeared at 197–199 nm (Figure
2.6a). Slight deviations in ellipticity were observed among the four measured collagen,
suggesting that there was a minor discrepancy in molecular structures. On the other hand,

15
scale collagens showed similar secondary structures, as seen in Figure 2.6b, denoting a
positive extreme at 220 nm and a negative peak at 198 nm (Ogawa, Portier, Moody, Bell,
Schexnayder, & Losso, 2004). Greenfield (2006) has reported the triple helix structure of
collagen and denatured collagen using circular dichroism (Figure 2.7). α-Helical proteins
have negative peaks at 222 nm and 208 nm and a positive band at 193 nm (line 4),
whereas disordered proteins (line 5) have very low ellipticity above 210 nm and negative
peaks near 195 nm.
Figure 2.6 CD spectra of bone (a) and scale (b) collagen (Ogawa, Portier, Moody,
Bell, Schexnayder & Losso,2004).
CD spectra were taken at 15°C. Filled diamond: black drum acid soluble collagen;
unfilled diamond: black drum pepsin soluble collagen; filled triangle, sheepshead acid
soluble collagen; unfilled triangle: sheepshead pepsin soluble collagen (Ogawa, Portier,
Moody, Bell, Schexnayder, & Losso, 2004).

16
Figure 2.6 (continued)
CD spectra were taken at 15°C. Filled diamond: black drum acid soluble collagen;
unfilled diamond: black drum pepsin soluble collagen; filled triangle, sheepshead acid
soluble collagen; unfilled triangle: sheepshead pepsin soluble collagen (Ogawa, Portier,
Moody, Bell, Schexnayder, & Losso, 2004).

17
Figure 2.7 CD spectra of triple helix.
(4) triple helix structure of collagen and (5) denatured collagens (Greenfield, 2006).
2.6.1.3 3-D structure of collagen
Collagen is a long cylindrical protein, and Type I collagen is made up of three
polypeptide chains, two of the polypeptides are designated α1, and α1 bonded to another
chain to form a third chain α2 through hydrogen bonds. The 3-D structure of collagen is
shown in Figure 2.8. Peptides in the telopeptide region could be cleaved by pepsin with
limited pepsin concentration, and the cross-linked molecules at the telopeptide region can
be cleaved by pepsin but without damage the triple helix structure of collagen (Liu, Li,
Miao & Wu, 2009).
18
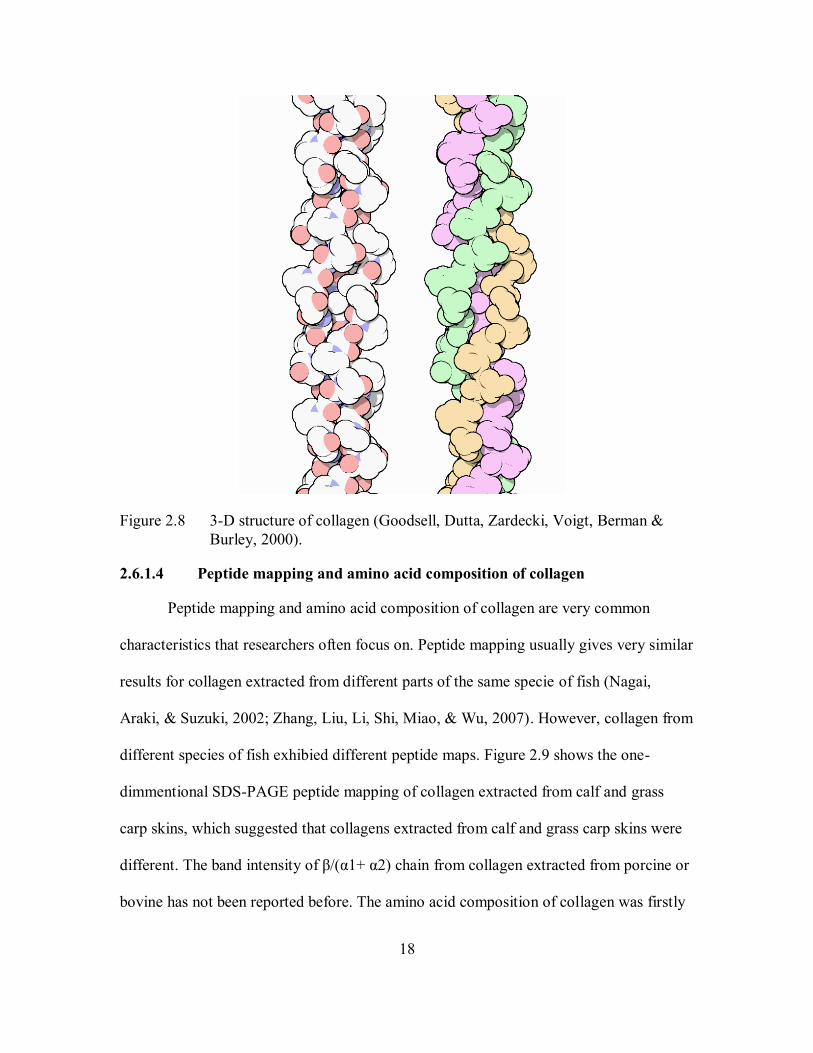
Figure 2.8 3-D structure of collagen (Goodsell, Dutta, Zardecki, Voigt, Berman &
Burley, 2000).
2.6.1.4 Peptide mapping and amino acid composition of collagen
Peptide mapping and amino acid composition of collagen are very common
characteristics that researchers often focus on. Peptide mapping usually gives very similar
results for collagen extracted from different parts of the same specie of fish (Nagai,
Araki, & Suzuki, 2002; Zhang, Liu, Li, Shi, Miao, & Wu, 2007). However, collagen from
different species of fish exhibied different peptide maps. Figure 2.9 shows the one-
dimmentional SDS-PAGE peptide mapping of collagen extracted from calf and grass
carp skins, which suggested that collagens extracted from calf and grass carp skins were
different. The band intensity of β/(α1+ α2) chain from collagen extracted from porcine or
bovine has not been reported before. The amino acid composition of collagen was firstly

19
reported back to the year of 1955 (Eastoe, 1955). The major amino acid is glycine and the
amino acid composition exhibits slight differences due to different speices (Muyonga,
Cole, & Duodu, 2004a; Piez & Gross, 1960). In addition, hydroxyproline is a major
component of collagen and plays a key role in the stability of the triple helix structure of
collagen. It can be used as an indicator to determine the amount of collagen.
Figure 2.9 Peptide mapping of collagen from calf (lane 2) and grass carp (lane 3) skin
(Zhang, Liu, Li, Shi, Miao, & Wu, 2007).
2.6.1.5 Fourier transform infrared spectrum of collagen
UV-Vis absorption sepectra and fourier transform infared spectroscopy were also
applied to fish skin collagen to study the absorption characteritics and spectra. The UV-
Vis spectra of pepsin-solublized collagen is shown in Figure 2.10, the biggest absorption
of the skin collagen of catfish was obtained near 232 nm (Liu, Li, & Guo, 2007).

20
Spectrometer simultaneously collects high spectral resolution data over a wide spectral
range. Figure 2.11 shows the fourier transform infrared spectroscopy of the acid-
solublized collagen from the catfish skin, and it is similar to other species collagens
(Muyonga, Cole, & Duodu, 2004b).
Figure 2.10 UV-Vis spectra of pepsin-soluble collagen (Liu, Li, & Guo, 2007).

21
Figure 2.11 Fourier transform infrared spectrum of acid-solubilized collagen of
Channel catfish skin (Liu, Li & Guo, 2007).
2.6.1.6 Solubility of extracted collagen
Collagen solubility is an important characteristic that researchers often focus on.
It has been reported that the pI of collagen varies from 6 to 9 (Foegeding, Lanier, &
Hultin, 1996). Collagen extracted with pepsin from bigeye snapper has been reported to
have the highest solubility at pH 5 (Nalinanon, Benjakul, Visessanguan, & Kishimura,
2007). The solubilities of collagen extracted from the skins of bigeye snapper, striped
catfish, and brownstripe red snapper (Jongjareonrak, Benjakul, Visessanguan, Nagai, &
Tanaka, 2005; Kittiphattanabawon, Benjakul, Visessanguan, Nagai, & Tanaka, 2005; P
Montero, Gómez-Guillén, & Borderıas, 1999; Singh, Benjakul, Maqsood, & Kishimura,
2011) decrease with the increasing concentration of sodium chloride. When a higher
concentration of sodium chloride (> 3%) is present, an increasing ionic strength might
lead to a reduction of protein solubility by increasing the interactions between protein

22
chains. Thus, the solubility of protein might be decreased by salting out effect via
increasing hydrophobic interaction and aggregation.
2.6.1.7 Gel strength of collagen-induced gel
Gel strength is one of the most important indexes for collagen quality and it could
be classified into 3 levels: low (<150 g), medium (150-220 g) and high (220-300 g) gel
strength (Johnston-Bank, 1983). The strength of the collagen-converted gel with the same
concentration have been reported for red tilapia skin (128.11 g) (Jamilah & Harvinder,
2002), Atlantic salmon (108 g), cod (71 g) (Arnesen & Gildberg, 2007), young and adult
Nile perch skins (222 and 229 g, respectively), young and adult Nile perch bone (179 and
134 g, respectively) (Muyonga, Cole, & Duodu, 2004b), shortfin scad (177 g) (Cheow,
Norizah, Kyaw, & Howell, 2007), and tilapia scale (157- 260 g) (Huang, Kuo, Wu, &
Tsai, 2016). Commercial pork skin gelatin showed higher gel strength than that of catfish
skin (Avena‐Bustillos et al., 2006). The discrepancy in gel strength among species might
be due to the different amino acid composition and molecular size of protein chains
(Muyonga, Cole, & Duodu, 2004b). When gel strength was measured at low temperature
(< 10 °C), some short chain peptides present in low viscosity gelatins tend to strengthen
the gel (Montero & Gómez-Guillén, 2000). In addition, the thermal shrinkage,
denaturation temperature of collagen and melting temperature of gelatins isolated from
cold-water fish are significantly lower than those from fish living in warm waters. The
reason of the differences might be due to a lower degree of proline hydroxylation of cold-
water fish collagen (Gilsenan & Ross-Murphy, 2000).

23
2.7 Heads and frames
2.7.1 Overview
The by-products (mostly heads and bone frames) are an excellent source of
protein (42.7% protein, db) with high nutritive value, and the protein can be processed
into value-added food products or ingredients with desirable functional and nutritional
properties (Gehring, Gigliotti, Moritz, Tou, & Jaczynski, 2011; Gehring, Davenport, &
Jaczynski, 2009). However, heads and frames are not collected separately in some fillet
processing plants, and therefore, to develop a collection logistics of heads and frames is
essential to help industries utilize the rich proteins in these by-products. At the meantime,
heads and frames are the rich sources of calcium. Calcium based powder had been
produced from Alaska pollack bones (Choi, Kim & Kim, 1998).
2.7.2 Hydrolysis of by-products
Many researchers have focused research on the hydrolysis of aquaculture by-
products for reducing environmental pollution consideration. Protein hydrolysates have
been made from various fish species by bacterial fermentation (Kristinsson & Rasco,
2000a; Sodini, Lucas, Tissier, & Corrieu, 2005) or by enzymatic hydrolysis (Hathwar,
Bijinu, Rai, & Narayan, 2011; Nilsang, Lertsiri, Suphantharika, & Assavanig, 2005).
Flavourzyme™ and Kojizyme™ have been used for hydrolyzing tuna processing liquid
waste (fish soluble concentrate) (Nilsang, Lertsiri, Suphantharika, & Assavanig, 2005).
Alcalase and neutrase have been utilized for hydrolyzing pacific whiting solid waste and
capelin (Benjakul & Morrissey, 1997; Shahidi, Han, & Synowiecki, 1995). Plant
proteases such as papain, ficin and bromelain have also been used for hydrolyzing
leatherjacket proteins (Salampessy, Phillips, Seneweera, & Kailasapathy, 2010). Early

24
research goal was to use the fish hydrolysates for pet feed. Recently, hydrolysates of
herring proteins have been found to possess antioxidant activity (Halldorsdottir,
Kristinsson, Sveinsdottir, Thorkelsson, & Hamaguchi, 2013; Mendis, Rajapakse, & Kim,
2005), antiproliferative activity (Hsu, Chan, & Jao, 2011) and angiotensin-I converting
enzymes (ACE) inhibitory activity, which can prevent hypertension (Nakajima, Yoshie-
Stark, & Ogushi, 2009; Raghavan & Kristinsson, 2009). However, most of the studies
have focused on improving the degree of hydrolysis and antioxidant activity.
The most important control points of hydrolyzing fish by-products are the degree
of hydrolysis and bitterness, which usually caused by some specific amino acids such as
tryptophan and hydrophobic amino acids. Therefore, to help reach a high degree of
hydrolysis and low level of bitterness, different enzymes have been used to hydrolyze
fish by-products such as Flavourzyme and Kojizyme. It was found that Kojizyme
enhanced the formation of bitterness during hydrolysis whereas Flavourzyme did not
(Nilsang, Lertsiri, Suphantharika, & Assavanig, 2005). The protein content of
hydrolysate fermented with Flavourzyme was found to be higher than that with Kojizyme
(Nilsang, Lertsiri, Suphantharika, & Assavanig, 2005). Flavourzyme and savorase have
been used to hydrolyze red hake by-products, and the results showed that the addition of
sodium chloride and sodium tripolyphosphate (STPP) improved the flavor quality and
limited the bitterness and off-flavor (Imm & Lee, 1999). Alcalase was used for
fermentation of tuna by-products, and a linear relationship was found between enzyme
concentration and the degree of hydrolysis (Guerard, Dufosse, Broise, & Binet, 2001).
In areas of whole fish waste utilization, protein hydrolysates have been made by
bacterial fermentation (Murthy, Rai, & Bhaskar, 2014) or by enzymatic hydrolysis

25
(Mackie, 1974). Papain and alcalase have been used to hydrolyze fish proteins (Amiza,
Nurul Ashikin, & Faazaz, 2011; Hoyle & Merritt, 1994). Other examples of protein
hydrolysates include hydrolysates from sardine waste by pepsin (Benhabiles, et al.,
2012), from croaker waste by fungal protease and alcalase (Hathwar, Bijinu, Rai, &
Narayan, 2011) and from fish bones by Bacillus protease (Kumar & Bhalla, 2003).
Pepsin hydrolyzed fish peptides can be reformed into plastein gel (Onoue & Riddle,
1973).
2.7.3 Proteolytic activity determination
The proteolytic activity of each protease varies significantly, which is not
surprising because that proteases (derived from different sources) are expected to have
different proteolytic activities. Most of the proteases were obtained with different
proteolytic activity. However, the proteolytic activity of each protease is determined at
the optimal reaction conditions. In the literature, the substrate used for determining the
proteolytic activity is not the same, which makes it difficult to compare the effect of the
protease across various reported studies.
Some studies report the activities of the added proteases on the basis of
proteolytic activity are based on the activity provided by manufacturer (Benjakul &
Morrissey, 1997), and did not adjust the protease to the same proteolytic activity level. In
addition, the proteolytic activity has been determined using different conditions and
different substrates. Different hydrolysis conditions usually lead to different proteolytic
activity, and substrate specificity influences the protease efficiency as well.

26
2.7.4 Emulsion properties of by-product hydrolysates
Protein hydrolysates with a low degree of hydrolysis could be used as an
emulsifier in some cases. Hydrolysis influences the molecular size, hydrophobicity and
polarity of the hydrolysates (Kristinsson & Rasco, 2000a). And the characteristics of
hydrolysates would affect the functional properties and have the applications as food
ingredients directly (Kristinsson & Rasco, 2000a). Protein hydrolysates usually exhibited
better solubility over a wide range of pH, and this brings a useful characteristic for food
applications. In addition, hydrolysis also affects emulsifying and foaming properties of
the hydrolysates. A high degree of hydrolysis produces a negative effect on emulsifying
and foaming properties (Kristinsson & Rasco, 2000a). Good emulsion and foaming
properties of fish protein hydrolysates derived from sardine, salmon, and yellow strip
were observed when the degree of hydrolysis is low (Quaglia & Orban, 1990; Gbogouri,
Linder, Fanni, & Parmentier, 2004; Klompong, Benjakul, Kantachote, & Shahidi, 2007).
2.7.5 Antioxidant activity of fish protein hydrolysates
Hydrolysates of proteins are peptides with different molecular mass, and
hydrolysates of sardine and horse mackerel muscle proteins have been found to possess
antioxidant activity (Morales-Medina, Tamm, Guadix, Guadix, & Drusch, 2016).
Enzymatic hydrolysates of purple sea urchin gonad have been reported to have the ability
of scavenging DPPH radical (Qin et al., 2011). Some studies indicated that the
antioxidant activity of protein hydrolysates was positively correlated with the degree of
hydrolysis of the hydrolysates (Dong, Zeng, Wang, Liu, Zhao & Yang, 2008; Klompong,
Benjakul, Kantachote & Shahidi, 2007). Hydrolysates with higher degree of hydrolysis
have been expected to expose more hydrophobic amino acid residue side chain groups
27
and easier accessed by radical (Qin et al., 2011). The exposed hydrophobic amino acid
side chain groups would accelerate electron transfer from peptides to radical, and then
make the radical more stabilized.
2.7.6 Angiotensin-converting enzyme (ACE) inhibition activity of fish protein
hydrolysates
Angiotensin-converting enzyme (ACE), is a central component of the renin-
angiotensin system (RAS), which controls blood pressure by regulating the volume of
fluids in the body. It converts the hormone angiotensin I to the active vasoconstrictor
angiotensin II. Therefore, ACE indirectly increases blood pressure by causing blood
vessels to constrict. Hydrolysates of leatherjacket muscle protein exhibited angiotensin-I
converting enzymes (ACE) inhibition activity (Salampessy, Reddy, Phillips, &
Kailasapathy, 2017). Sardine by-product hydrolysates have been reported to have ACE
inhibition capacity with IC50 values up to 7.4 mg/mL (Bougatef et al., 2008). However,
no positive control was reported in the above literature. Regarding to the relationship
between peptides structure and ACE inhibitory activity, peptides had Pro, Phe, or Tyr at
the C-terminus, and Val and Ile at the N-terminus exhibited potent inhibitory activity
against ACE (Tsai, Chen & Pan, 2008).
2.7.7 Dipeptidyl peptidase IV (DPP- IV) inhibition activity of fish protein
hydrolysates
Dipeptidyl peptides IV (DPP-IV) plays a critical role in maintaining glucose
homeostasis. It is responsible for inactivating incretins, such as glucose-dependent
insulinotropic polypeptide (GIP) and glucagon-like peptide-1 (GLP-1). Secretion of these
two intestinal hormones is triggered by food intake. After DPP-IV was blocked by

28
inhibitor, the increased incretin level will inhibit glucagon release, which in turn
increases insulin secretion, decreases gastric emptying, and decreases blood glucose level
(Deacon, 2018). Two peptides Gly-Pro-Ala-Glu and Gly-Pro-Gly-Ala have been purified
from Atlantic salmon skin gelatin hydrolysates and exhibited potent DPP-IV inhibition
activity (IC50 = 49.6 and 41.9 μM, respectively) (Li-Chan, Hunag, Jao, Ho & Hsu, 2012).
Barbel muscle hydrolysates have been separated by HPLC into 5 fractions and two of
them showed DPP-IV inhibition activity with IC50 = 1.09 and 0.21 mg/mL, respectively.
Numerous peptides showed DPP-IV inhibitory activity have been reported in literature
(Le Maux, Nongonierma, Murray, Kelly, & FitzGerald, 2015; Nongonierma, Paolella,
Mudgil, Maqsood & FitzGerald, 2018). However, the inhibitory mechanism is remained
unclear.
2.8 Overview of viscera
Channel catfish by-product viscera has been used to extract fish oil and proteases
(Jiang, Lu, Liao, Lin, Wen & Jiang, 2009; Bougatef et al., 2008). Proteinases were
successfully isolated from Atlantic cod, cod stomach has been reported to be contained
about 2 g pepsin/kg of stomach, and the intestine contained about 1 g trypsin like
enzymes (such as trypsin, chymotrypsin and elastase) (Gildberg, 1992). Carp viscera had
been fermented and fish oil was extracted from the fermentation products, and the quality
of the extracted oil has been studied. The results indicated that the acid value of the
extracted oil was increased with the extend of fermentation time (Rai, Swapna, Bhaskar,
Halami & Sachindra, 2010).

29
2.9 Surimi
2.9.1 Historical review of surimi
Traditionally, surimi is made from fish meat of both salt and fresh water origins.
China is the first country to produce fish ball, dated back to year 220 BC (Park, 2013).
Surimi is refined fish myofibrillar proteins produced via step-by-step washing process.
Surimi processing equipment was first introduced at the end of the World War II
in 1945, and the production volume started to rise after that. With Magnuson Act on
1976, United States began the surimi production with Alaska pollock as the raw material.
There are 17-land based surimi processing plants that have been built since 1984 in US
(Park, Nozaki, Suzuki, & Beliveau, 2013).
2.9.2 Manufacture of surimi
Mechanical fish meat separator is used for deboning. The flesh is minced and then
washed and dewatered. Before the final dewatering step, impurities and pigments such as
skin, small scales and pin bones were removed by a refiner. Screw press was then to
remove extra water of minced meat, the moisture of the minced meat was adjusted to
80%-84%. Addition of cryoprotectant would protects the surimi from freezing induced
protein denaturation and aggregation. Figure 2.12 shows the flow chart of surimi
manufacturing.

30
Figure 2.12 Flow chart of surimi manufacturing (Park, 2013).
2.9.3 Manufacture of fish ball
Fish ball is a popular food in the southeast of Asia, and have different names in
different countries: Yuwan in China, Bebola Ikan in Indonesia and Malaysia, Look Chin
Pla in Thailand (Park, 2013). The raw material for making fish ball is minced fish meat.
Salt is added during chopping and usually 3-5% by weight (Kok, Thawornchinsombut &
Park, 2013). Once chopping is finished, the paste is transferred to a forming machine to
produce fish ball. Figure 2.13 shows the flow chart of fish ball manufacturing.

31
Figure 2.13 Processing flow diagram of fish ball (Park, 2013).
2.9.4 Protein component of surimi (washed fish meat mince)
The proteins in minced meat including myofibrillar proteins and less sarcoplasmic
proteins. The predominant protein is myosin (55-60% of total myofibrillar proteins) and
actin comprises 15-30% of the total myofibrillar proteins. Myosin contributes the most to
the gelation and water binding. However, myosin binds with actin tightly postmortem and
resulting in a complex protein actomyosin. Therefore, actomyosin is the predominant

32
protein in the surimi products. Other proteins related with myosin or actin including
tropomyosin, troponin complexes actinins, titin, nebulin, M-proteins and C-proteins
(Asghar & Pearson, 1980).
In addition, sarcoplasmic proteins contain many proteases, which involved in
muscle metabolism. SDS-PAGE of fish sarcoplasmic proteins showed that the protein
bands of sarcoplasmic proteins range from 12 to 97 KDa and as shown in Figure 2.14
(Ladrat, Verrez-Bagnis, Noël, & Fleurence, 2003). And it is less pH dependent than that
of myofibrillar proteins which exhibit a U-shaped solubility curve with the lowest
solubility observed at pH 5.5 (Tadpitchayangkoon, Park, & Yongsawatdigul, 2010).
Figure 2.14 SDS-PAGE gel of sarcoplasmic proteins extracted from sea bass (Ladrat,
Verrez-Bagnis, Noël, & Fleurence, 2003)
Left lane: marker; Right lane: sarcoplasmic proteins.
33
2.9.5 Myofibrillar proteins extraction method
2.9.5.1 Alkaline extraction
Fish protein extraction/solubilization by varying pH’s has been reviewed
(Kristinsson, Lanier, Halldorsdottir, Geirsdottir, & Park, 2013; Lansdowne, Beamer,
Jaczynski, & Matak, 2009; Nolsøe & Undeland, 2009). Different fish species and their
by-products respond differently to salt or alkaline extraction process due to differences in
raw material’s physical, chemistry and biological properties. Furthermore, foods are
biomaterials that exist in a biochemically dynamic state. The chemical composition,
quality of the protein and their functionalities continue to the changes during processing
and post-processing handling and storage. Proteins from catfish fillet under alkaline and
acidic conditions and followed by pH 5.5 precipitation (isoelectric precipitation) have
been reported (Davenport & Kristinsson, 2011). The gel of the protein isolated from
catfish fillet under alkaline conditions is firmer than that by acidic extraction method
(Halldórsdóttir, Hamaguchi, Sveinsdóttir, Kristinsson, Bergsson, & Thorkelsson, 2011).
Alkaline extraction is believed to unfold the myosin head structure to become more
hydrophobic which result in a firmer product after cooking. The yield of alkaline-
extracted protein is higher than the traditional surimi making method since alkaline
extraction also extracts sarcoplasmic proteins, which are water-soluble and washed off by
the traditional mincing and the extensive water-washing process (Kristinsson, Lanier,
Halldorsdottir, Geirsdottir, & Park, 2013).
2.9.5.2 Salt extraction
It is well known that functional proteins could be extracted from animal sources
or plant seeds by salt solutions. Extraction rate depends on several factors, including

34
solvent/solid mass ratio, salt concentration and stirring/blending method. Water-soluble
sarcoplasmic proteins can be extracted with repeated washing of homogenized fish with
water or dilute salt solution of less than 0.15 M NaCl (Kristinsson, Lanier, Halldorsdottir,
Geirsdottir, & Park, 2013), at which myofibrillar proteins are remain insoluble.
2.9.5.3 Acid extraction
Acid extraction (pH 2.5) method have been tested to extract proteins from
Channel catfish muscle, and no hydrolytic break down was observed during low pH
extraction. Results showed that acid extraction method produced more denaturation of
proteins, and the protein gel made from acid-extracted proteins shows significantly higher
whiteness than that of alkaline extraction. Moreover, alkaline-extraction recovers more
heme proteins than that of acid extraction (Kristinsson, Theodore, Demir, & Ingadottir,
2005).
2.9.5.4 Extraction temperature
Protein functionalities could be better retained if more native molecular structure
or extracted proteins remained after extraction process. Study has shown that bovine
muscle stored at 37°C promoted a quicker protein degradation in myofibrillar proteins
than that stored at 4°C (Yates, Dutson, Caldwell, & Carpenter, 1983). Therefore, protein
extraction should be conducted under low temperature to prevent degradation of
myofibrillar proteins (Yates, Dutson, Caldwell, & Carpenter, 1983). Moreover, fish
digestive proteases such as pepsin and pancreatin would break down the proteins at 37°C,
and low temperature would decrease the activities of these proteases.

35
2.9.6 Gelation chemistry
Previous study indicated that myosin contributes the most to gel formation and
water holding in cooked meat products. Single myosin molecule should be the first
released from muscle during chopping with salt. Salt could boost the solubilization of
myosin. Figure 2.15 shows the gel formation of myosin monomer. Aggregation of
myosin molecules during heating is initiated by disulfide cross-linking of denatured head
region of myosin, and continuous heating caused the unfolding of the tail portion of the
myosin (Yasui & Samejima, 1990).
Figure 2.15 Head induced gel formation of myosin monomer.
(a) Unheated myosin monomer; (b) formation of cluster in the early heating stage; (c)
Daisy wheel formation of myosin; (d) denaturation of tail portions; (e) clusters bound
through denatured tails; (f) gel network formation. (Park, 2013; Iwasaki, Noshiroya,
Saitoh, Okano, & Yamamoto, 2006).
36
2.9.7 Microstructure of surimi and surimi like products
Microstructure of fish surimi gel has been studied 15 years. Filamentous structure
of Walleye Pollock surimi gel was observed (Kubota, Tamura, Morioka, & Itoh, 2003).
Scanning electron microscopy with high magnification has been used to study the
microstructure of hairtail surimi proteins and the graph is shown in Figure 2.16 (Hu, et
al., 2018), which shows a discontinuous network with large grooves and holes.
Transglutaminase has been used to improve the threadfin bream surimi gel quality, and
the microstructure of transglutaminase-treated threadfin bream surimi gel is shown in
Figure 2.17 (Kaewudom, Benjakul, & Kijroongrojana, 2013), which shows myofibrillar
proteins could form a more compact and denser gel network with transglutaminase
treatment. Different deacetylations of Konjac glucomannan have been used to improve
the network of Alaska Pollock surimi gel, and microstructure of treated gel is shown in
Figure 2.18. The gel with Konjac glucomannan-treated (Day 0) shows a denser and more
uniform network structure than that of the control, and the gel shows more compact and
with smaller holes in the network when the deacetylation of Konjac glucomannan
increased (Day 2 and Day 3) (Zhang, Xue, Li, Wang, & Xue, 2015).

37
Figure 2.16 Microstructure of hairtail surimi proteins (Hu, et al., 2018).
Figure 2.17 Microstructure of transglutaminase-treated threadfin bream surimi gel.
(a) untreated surimi gel; (b) transglutaminase treated (1.2 U/g) surimi gel (Kaewudom,
Benjakul, & Kijroongrojana, 2013).

38
Figure 2.18 Microstructure of Alaska Pollock surimi treated with different
deacetylation of Konjac glucomannan (Zhang, Xue, Li, Wang, & Xue,
2015).
Da0: surimi treated with Konjac glucomannan for 0 day. Da2: surimi treated with Konjac
glucomannan for 2 days. Da3: surimi treated with Konjac glucomannan for 3 days.
39
CHAPTER III
ISOLATION AND CHARACTERIZATION OF COLLAGEN EXTRACTED FROM
CHANNEL CATFISH (ICTALURUS PUNCTATUS) SKIN
3.1 Abstract
Channel catfish skin is a by-product from catfish fillet production. Collagen was
extracted from catfish skins by: (1) acid extraction; (2) homogenization-aided; and (3)
pepsin-aided extraction methods. Kinetic analysis of the extraction was performed. SDS-
PAGE was carried out for all collagens extracted under different conditions. Protein
solubility, zeta potential, circular dichroism and gel strength of collagen extracted by
three methods were studied to determine optimal conditions. Hydroxyproline recovery
rate from minced skins extracted with pH 2.4 HCl containing 23.6 KU/g pepsin was the
highest (64.19%, db). SDS-PAGE showed that collagens extracted with different
methods had different proteins ratio patterns, even though the molecular mass of collagen
subunits was similar, 123 and 113 KDa for α1 and α2 chains, 226 KDa for β chain and
338.5 KDa for γ chain, respectively. Acid solubilized collagen, homogenization aided
solubilized collagen and pepsin homogenization solubilized collagen were made into gel,
the gel strength were 223.13, 220.48 and 73.59 ɡ, respectively. Channel catfish skin
collagens were typical type-I collagen and could have applications in food, medical and
cosmetic industries.
Key words: Channel catfish skin, collagen, homogenization, pepsin, kinetic analysis

40
3.2 Introduction
Collagen is a long cylindrical protein, it is the major protein in the skin and
contributes to the unique physiological function of the connective tissue. Up to 27 types
of collagens have been identified, and Type-I collagen exists the most widely in the
connective tissues. Type-I collagen is made up of three polypeptide chains, two of the
polypeptides are designated α1 chain, and α1 chain bonded to another chain to form a
third chain α2 through hydrogen bond. Total molecular mass of collagen is about 300
KDa with each chain has a molecular mass of about 100 KDa, and it has a wide range of
applications in the pharmaceutical, leather, biomedical and film industries (Ogawa,
Portier, Moody, Bell, Schexnayder, & Losso, 2004). Collagen usually extracted from
porcine skins and bones, however, it is not acceptable by Judaism and Islam due to
religious restrictions (Nalinanon, Benjakul, Visessanguan, & Kishimura, 2007). In
addition, collagen extracted from bovine might be contaminated with bovine spongiform
encephalopathy (BSE) (Choi & Regenstein, 2000). Therefore, collagen isolated from
aquatic sources is a substitution for mammalian sources even though the yield of the
collagen from aquatic sources is around 2-4 times lower than that from mammalian
sources. However, the yield of collagen extracted from fish skin was greatly improved in
recent years (Gómez-Guillén, Giménez, López-Caballero, & Montero, 2011).
Researchers have reported that around 50% of collagen in fish skin, and 45% in fish bone
(Nagai & Suzuki, 2000) can be isolated.
Channel catfish aquaculture is an important aquaculture in the United States, and
Mississippi State ranks No. 1 in catfish production with annual production of $214
million in 2017 (USDA, 2018). Catfish fillet processing contributes to the vitality of the

41
local economy. The fish skins account for about 10-15% of the by-products (3-6% of
whole fish weight) and can be used as a potential collagen source. More and more
studies about different alternative sources and new functionalities of collagen had been
reported in the last 10 to15 years. However, most studies used a single set of solvent
conditions for extraction. There is a lack of a systematic approach for collagen extraction,
particularly for catfish collagen extractions. And the reported yield of the collagen from
fish skins remained low, and therefore, the extraction methods have less practical
applications for the food industries since most of them require long time, high energy
input and dialysis processing. In addition, no systematic kinetic analysis of extraction
yield has been performed. Our objectives were to use a systematic approach to optimize
the extraction conditions and modify the extraction method to recover the maximum
yield, and to characterize the physical-chemical properties and gel strength of the
collagen extracted by different extraction conditions.
3.3 Materials and methods
3.3.1 Materials
Catfish skin was collected from a local catfish fillet processing (Country Select,
Isola, MS). The catfish skin was buried in crushed ice during transportation to our
laboratory and stored at -80°C until use.
3.3.2 Chemicals
All chemicals, reagents and porcine gastric pepsin (EC 3.4.23.1) were of the
analytical grade and obtained from the Sigma-Aldrich Chemical Company (St. Louis,
MO, U.S.A).

42
3.3.3 Proximate analysis
Moisture, protein, ash and total fat content were determined by the AOAC
International methods 934.01, 955.04, 942.05 and 2003.06, respectively (AOAC
International, 2012). A conversion factor of 5.4 was used for calculating the crude protein
content from nitrogen content. The hydroxyproline content in skin material and extracted
collagen was determined according to the method of Bergman and Loxley (Bergman &
Loxley, 1963). The hydroxyproline recovery rate (%) was obtained by the following
equation:
Hydroxyproline recovery rate(%) = hydroxyproline content in extracted collagen sample
hydroxyproline content in skin material×
100% (3.1)
3.3.4 Extraction of collagen with acids (ASC)
Catfish skins were pretreated by washing with iced water containing 1% NaCl
(1:6 W/V) and ground into small pieces, then passed through a 35-mesh sieve. Different
size of skins was obtained by passed the ground skin through series size of sieve (5 mesh,
10 mesh, 18 mesh and 35 mesh). One hundred grams of catfish skins were mixed with 4
different acids (acetic acid, hydrochloric acid, citric acid and lactic acid, W:V = 1:50)
with varying pH’s (1.8, 2.1, 2.4, 2.7 and 3.0), and shaken for 48 hr (100 rpm) using an
orbital shaker at 4°C, then centrifuged at 15000 ɡ for 20 min at 4°C to collect the
supernatant, the residue was re-extracted with the corresponding acid (W/V = 1:50) for
another 12 hr. After the desire time was achieved, the mixture was centrifuged at the
same conditions, the supernatant was combined and salted out by adding NaCl to a final
concentration of 0.9 M (Ogawa, Portier, Moody, Bell, Schexnayder, & Losso, 2004), the
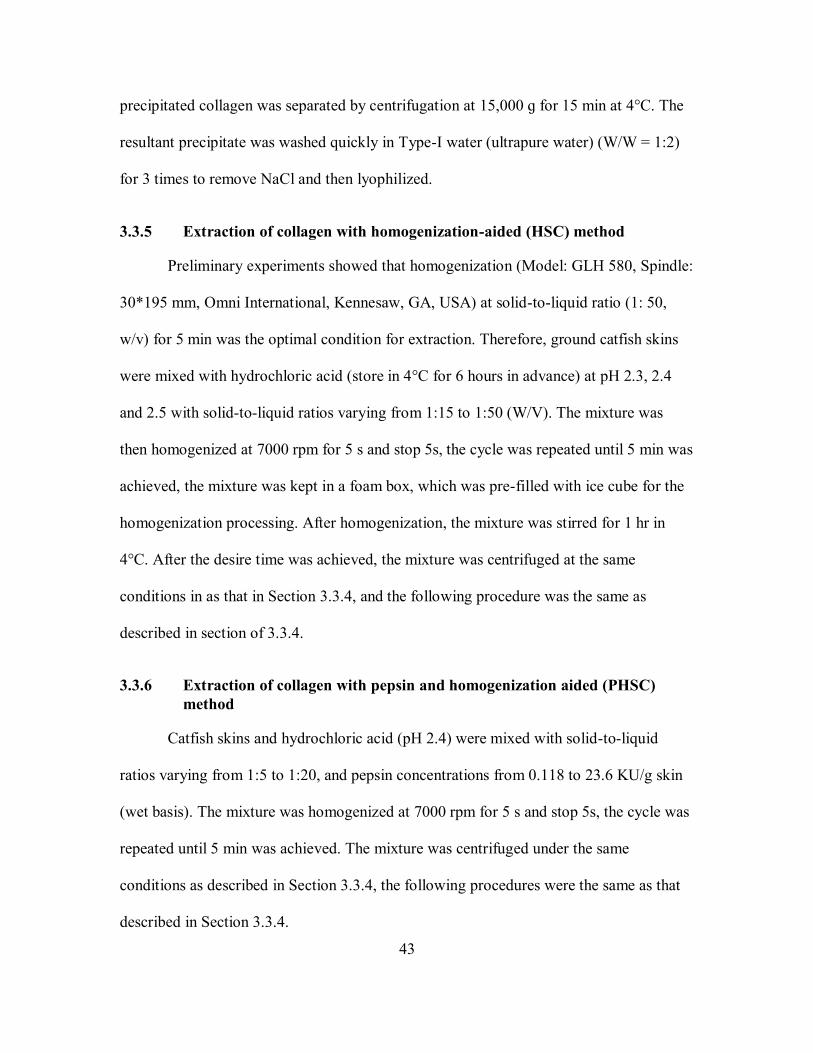
43
precipitated collagen was separated by centrifugation at 15,000 ɡ for 15 min at 4°C. The
resultant precipitate was washed quickly in Type-I water (ultrapure water) (W/W = 1:2)
for 3 times to remove NaCl and then lyophilized.
3.3.5 Extraction of collagen with homogenization-aided (HSC) method
Preliminary experiments showed that homogenization (Model: GLH 580, Spindle:
30*195 mm, Omni International, Kennesaw, GA, USA) at solid-to-liquid ratio (1: 50,
w/v) for 5 min was the optimal condition for extraction. Therefore, ground catfish skins
were mixed with hydrochloric acid (store in 4°C for 6 hours in advance) at pH 2.3, 2.4
and 2.5 with solid-to-liquid ratios varying from 1:15 to 1:50 (W/V). The mixture was
then homogenized at 7000 rpm for 5 s and stop 5s, the cycle was repeated until 5 min was
achieved, the mixture was kept in a foam box, which was pre-filled with ice cube for the
homogenization processing. After homogenization, the mixture was stirred for 1 hr in
4°C. After the desire time was achieved, the mixture was centrifuged at the same
conditions in as that in Section 3.3.4, and the following procedure was the same as
described in section of 3.3.4.
3.3.6 Extraction of collagen with pepsin and homogenization aided (PHSC)
method
Catfish skins and hydrochloric acid (pH 2.4) were mixed with solid-to-liquid
ratios varying from 1:5 to 1:20, and pepsin concentrations from 0.118 to 23.6 KU/g skin
(wet basis). The mixture was homogenized at 7000 rpm for 5 s and stop 5s, the cycle was
repeated until 5 min was achieved. The mixture was centrifuged under the same
conditions as described in Section 3.3.4, the following procedures were the same as that
described in Section 3.3.4.

44
3.3.7 Kinetic analysis of collagen extraction
All extraction curves could be described by the model developed by Peleg (Peleg,
1988):
𝐶(𝑡) = 𝐶(0) +𝑡
𝐾1+𝐾2·𝑡 (3.2)
Where C(t) (%) is the hydroxyproline recovery rate at time t, t is the extraction time
(hours), C0 (%) is the hydroxyproline recovery rate at time t = 0, K1 is Peleg’s rate
constant and K2 is Peleg’s capacity constant. C0 in all experimental was zero, the above
equation was rearranged in the following form:
𝐶(𝑡) =𝑡
𝐾1+𝐾2·𝑡 (3.3)
The Peleg’s rate constant K1 relates to extraction rate (B0) at the very beginning :
𝐵0 =1
𝐾1 (3.4)
The Peleg’s capacity constant K2 relates to maximum of hydroxyproline recovery rate.
When t → ∞, the following equation describes the relations between hydroxyproline
recovery rate and K2 constant:
C|t → ∞ =1
𝐾2 (3.5)
Therefore, equation (1) can be transformed to a linear relationship in the following form:
𝑡
𝐶(𝑡)−𝐶(0)= 𝐾1 + 𝐾2𝑡 (3.6)
3.3.8 Sodium-dodecyl-sulfate polyacrylamide gel electrophoresis (SDS-PAGE)
SDS-PAGE was carried out according to the method of Laemmli (1970).
Collagen samples were dissolved in 0.02 M sodium phosphate (pH 7.2) containing 0.5 M
urea. Electrophoresis was performed on a 6% resolving gel with a 4% stacking gel on the

45
top layer. Proteins were stained with 0.1% Commassie Brilliant Blue R-250 dissolved in
water, methanol and acetic acid (9:9:2, v/v/v) for 30 min, then destained using a solution
containing water, methanol and acetic acid (17:1:2, v/v/v). For the quantification of α and
β chains, gels were scanned and analyzed by a Molecular Imager (Bio-Rad Chemidoc™
XRS+, Hercules, CA, USA) equipped with Image Lab™Analysis Software (version 5.2).
3.3.9 Effect of pH on solubility
Collagens extracted with different conditions were dissolved in 0.5 M acetic acid
to obtain a final concentration of 3 mg/mL. The pH of protein solution was adjusted with
2 mol/L HCl or 2 mol/L NaOH to 1 to 10. The solution was centrifuged at 10,000 ɡ for
20 min at 4°C. Protein content in the supernatant was determined by the method of
Bradford (1976).
3.3.10 Effect of NaCl on solubility
Collagens extracted with different conditions were dissolved in 0.5 M acetic acid
to obtain a final concentration of 6 mg/mL. Five milliliters of protein solution were
mixed with 5 mL of 0.5 M acetic acid containing a series of the concentrations of NaCl to
make a final concentration of 0%, 1%, 2%, 3%, 4%, 5% and 6%, respectively. Protein
solutions were centrifuged at 10,000 ɡ for 20 min at 4°C. The protein concentration in the
supernatant was determined by the method of Bradford (1976).
3.3.11 Zeta (ζ) potential
Collagens extracted by the above three methods with optimal conditions were
used. Zeta potential of collagen samples was determined by a Zeta potential analyzer
(Zetasizer Nano ZS90, Malvern Instr., UK). Collagen extracted with different conditions

46
were dissolved in 0.1 M acetic acid to make a final concentration of 1 mg/mL. One
milliliter of collagen solution was transferred to a capillary cell, and the pH of the
collagen solutions was adjusted to 2-6, using 1 M nitric acid or 1 M KOH. The Zeta
potential of each solution was measured in triplicate.
3.3.12 Circular dichroism (CD)
Collagen extracted by the above three methods with optimal conditions was used.
The prepared collagen samples were dissolved in 0.1 M acetic acid and diluted to a
concentration of 0.2 mg/mL with 0.1 M acetic acid solution. CD was measured using a
Jasco 810 spectropolarimeter (Jasco International Co., Easton, MD) with a Peltier
jacketed software-controlled multiple cuvette holder. The CD spectra of the samples were
measured using a 0.1 cm path length quartz cell for far-UV measurement. The spectrum
was recorded from 190-250 nm in 0.1 nm steps with response times of 1 s. Five scans
were averaged for each sample.
3.3.13 Differential scanning calorimetry (DSC)
Collagen extracted by the above three methods with optimal conditions was used.
Differential scanning calorimetry of collagen was run according to the method reported
previously with some modifications (Singh, Benjakul, Maqsood, & Kishimura, 2011).
Collagen was rehydrated by 0.05 M acetic acid at a solid to liquid ratio of 1:40 (w/v). The
mixtures were allowed to stand at 4°C for 2 days. DSC was carried out using a
differential scanning calorimetry (Perkin Elmer, Model DSC8000, Norwalk, CA, USA).
Forty µL of samples were accurately pipetted into an aluminum pan and sealed, and an
empty pan was used as reference. The sample was scanned at 1°C/min over the range of

47
20-50°C in a nitrogen atmosphere.
3.3.14 Gel strength
The bloom strength of collagen extracted by the above three methods with
optimal conditions was determined according to the British standard BS 757 (BSI, 1975).
The gels were formed in a standard bloom bottle by mixing 7.5 g of dry collagen samples
with 105 mL distilled water (6.67%, W/V), and stir for 1 hr, then brought to 60°C in a
water bath for 30 min, then were cooled down in a 4°C refrigerator for 12-16 hr to form
gels. Bloom gel strength was determined using a TA.XTplus Texture Analyzer (Stable
Microsystems, Godalming, Surrey, UK), equipped with a 0.5 inch diameter plunger with
cross-head speed of 0.5 mm/s. The standard glass bloom bottle was placed on the center
of the stage. The maximum force (ɡ) was determined when the plunger penetrated into 4
mm of the gel. Three replications were averaged for each collagen sample.
3.3.15 Statistical analysis
Experiments were performed based on a completely randomized design.
Extraction was performed in triplicate. Data were analyzed by ANOVA using 2015 SAS
(version 9.3, SAS Inc., Cary, NC, USA). Duncan’s multiple range test was carried out to
determine any significant differences among various extraction conditions using p=0.05.
3.4 Results and discussion
3.4.1 Proximate analysis of catfish skin
Several studies had reported the protein content in fish skin, Nile perch skin
contained 21.6% protein (Muyonga, Cole, & Duodu, 2004a) and bigeye snapper skin
possessed 32% of protein (Kittiphattanabawon, Benjakul, Visessanguan, Nagai, &

48
Tanaka, 2005) on a dry basis. Protein content in catfish skin was determined in this study
by the Kjeldahl method and a conversion factor of 5.4 was used. The protein content in
catfish skin was 28.88% based on the wet weight basis, and 81.21% on the dry weight
basis, which is comparable to the above fish species. Lipid, ash and carbohydrate
contents in catfish skin are 14.29%, 1.88% and 2.62% (dry weight basis), respectively.
Theoretically, the collagen yield should not be higher than the total protein content in
catfish skin. Taking the energy, solvent and time input into consideration, an extraction
method with lower energy input and high yield is expected by the food industries.
3.4.2 Collagen extracted with acids and proximate analysis
In most studies, 0.1 M acetic acid (Liu, et al., 2015; Nagai & Suzuki, 2000) or 0.5
M acetic acid (Chen, Li, Yi, Xu, Gao, & Hong, 2016; Kittiphattanabawon, Benjakul,
Visessanguan, Nagai, & Tanaka, 2005; Muyonga, Cole, & Duodu, 2004a; Nagai, Araki,
& Suzuki, 2002) were used to extract skin collagen. In the current study, different acids,
liquid-to-solid ratios and pH’s were used to extract catfish skin collagen to search for the
extraction conditions for optimal yield and quality. The yield of collagen extracted with
different acids was expressed as hydroxyproline recovery rate (%), and results are shown
in Figure 3.1 (A). The hydroxyproline recovery rate from the minced skin extracted with
pH 2.4 hydrochloric acid was the highest (42.36%) followed by extraction with pH 2.7
acetic acid (39.45%). Lactic acid and citric acid are less effective in terms of
hydroxyproline recovery rates. And this observation was in conflict with the report,
which claimed that HCl was the least effective solvent for collagen extraction from cod
skin (Skierka & Sadowska, 2007). The reason might be that different concentrations
(0.15 M HCl) of acids were used to extract collagen from cod skin, and that the pH of the

49
mixture was not maintained the same as the beginning pH, which tended to change over
the time of extraction.
Collagen was successfully isolated from several fish species with the yields
ranging from 2% to 51.4% (Chen, Li, Yi, Xu, Gao, & Hong, 2016; Liu, Li, & Guo, 2007;
Nagai, Araki, & Suzuki, 2002; Kittiphattanabawon, Benjakul, Visessanguan, Nagai, &
Tanaka, 2005; Ogawa, Moody, Portier, Bell, Schexnayder, & Losso, 2003; Duan, Zhang,
Du, Yao, & Konno, 2009; Nagai, Yamashita, Taniguchi, Kanamori, & Suzuki, 2001;
Nagai & Suzuki, 2000). However, due to the impurity of the extracted collagen, some of
the reported yields might be higher than the true value. Even though extractions for
collagen from fish skins have been reported in several studies, most of them used a single
set of extraction conditions. A systematic approach for collagen extraction, particularly
for catfish collagen extractions was lacking, and therefore making comparison between
our and reported studies difficult.
3.4.3 Collagen extraction-aided by homogenization with or without pepsin
Since pH 2.4 HCl gave the highest hydroxyproline recovery rate from
experiments conducted in Section 3.4.2, therefore, the pH interval was further decreased
to investigate the optimal pH in this step. The results of hydroxyproline recovery rate of
collagen extracted with homogenization-aided method are shown in Figure 3.1 (B). The
hydroxyproline recovery rate from minced skin extracted with pH 2.4 hydrochloric acid
at the solid-to-liquid ratio of 1:50 (W/V) was the highest (60.38%) but with no significant
differences from that extracted by pH 2.4 hydrochloric acid at the solid-to-liquid ratio of
1:40 (w/v) (57.68%). Taking the solvent input into consideration, extraction conditions of
pH 2.4 hydrochloric acid and the solid-to-liquid ratio of 1:40 (w/v) were optimal

50
conditions for scaling up in the food industries. Studies had reported collagen extracted
with homogenization-aided method. Collagen from Plaice skin was extracted with
homogenization-aided method in 0.2 and 0.4 M NaCl solution. Unfortunately, no yield
data were provided in this study (Montero, Alvarez, Marti, & Borderias, 1995). An
extrusion-hydro extraction method had been used to extract collagen from tilapia’s scale
with an yield of 16.9% (wet basis) (Huang, Kuo, Wu, & Tsai, 2016).
Peptides in the telopeptide region can be cleaved by pepsin, with the limited
concentrations of pepsin, the cross-linked molecules at the telopeptide region can be
cleaved by pepsin but without altering the triple helix structure of collagen (Liu, Li,
Miao, & Wu, 2009). Therefore, the extraction of collagen partly cleaved by pepsin gave a
higher yield (Chen, et al., 2016; Nagai & Suzuki, 2002; Nagai, Yamashita, Taniguchi,
Kanamori, & Suzuki, 2001; Tang, Chen, Su, Weng, Osako, & Tanaka, 2015; Zhang, Liu,
Li, Shi, Miao, & Wu, 2007). Although pepsin had been used widely for the collagen
extraction, most researchers reported the additions of pepsin on a weight basis instead of
enzyme activity unit basis (Chen, et al., 2016; Liu, Li, & Guo, 2007; Nalinanon,
Benjakul, Visessanguan, & Kishimura, 2007; Veeruraj, Arumugam, Ajithkumar, &
Balasubramanian, 2015; Zhang, Liu, Li, Shi, Miao, & Wu, 2007). However, only one
report used enzyme activities for calculating pepsin concentration (Nalinanon, Benjakul,
Visessanguan, & Kishimura, 2007) for collagen extraction from the Bigeye snapper skin.
Results of hydroxyproline recovery rates of collagen extracted with different
concentrations of pepsin and liquid-to-solid ratios are shown in Figure 3.1 (C). The
hydroxyproline recovery rate from minced skin extracted with pH 2.4 hydrochloric acid
at the solid-to-liquid ratio of 1:30 (W/V) with pepsin content 23.6 KU/g was the highest
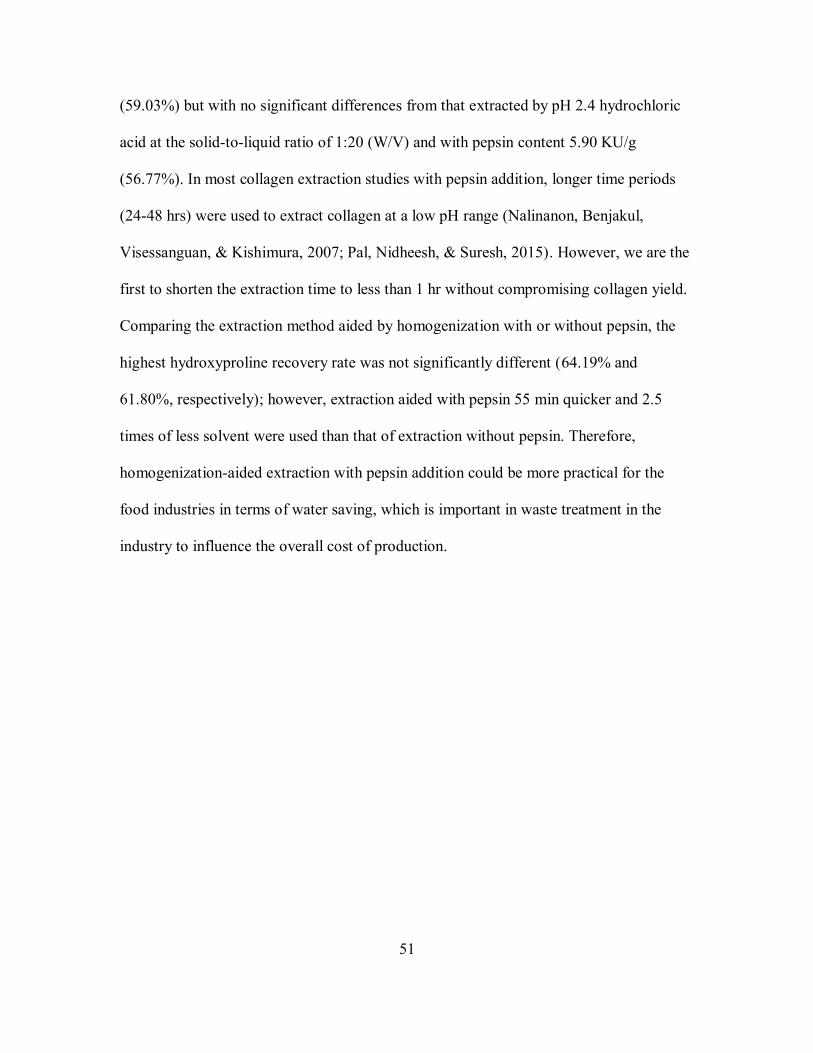
51
(59.03%) but with no significant differences from that extracted by pH 2.4 hydrochloric
acid at the solid-to-liquid ratio of 1:20 (W/V) and with pepsin content 5.90 KU/g
(56.77%). In most collagen extraction studies with pepsin addition, longer time periods
(24-48 hrs) were used to extract collagen at a low pH range (Nalinanon, Benjakul,
Visessanguan, & Kishimura, 2007; Pal, Nidheesh, & Suresh, 2015). However, we are the
first to shorten the extraction time to less than 1 hr without compromising collagen yield.
Comparing the extraction method aided by homogenization with or without pepsin, the
highest hydroxyproline recovery rate was not significantly different (64.19% and
61.80%, respectively); however, extraction aided with pepsin 55 min quicker and 2.5
times of less solvent were used than that of extraction without pepsin. Therefore,
homogenization-aided extraction with pepsin addition could be more practical for the
food industries in terms of water saving, which is important in waste treatment in the
industry to influence the overall cost of production.

52
Figure 3.1 Hydroxyproline recovery rate of collagen extracted with different acids.
(A): Hydroxyproline recovery rate of collagen extracted with different acids; (B):
Hydroxyproline recovery rate of collagen extracted by HCl with homogenization aided
method; (C): Hydroxyproline recovery rate of collagen extracted by HCl with pepsin
aided method.
0.00%
5.00%
10.00%
15.00%
20.00%
25.00%
30.00%
35.00%
40.00%
45.00%
1.5 1.8 2.1 2.4 2.7 3 3.3
Hyd
rox
ypro
lin
e re
cover
y ra
te (
%)
pH
Citric acid
HCl
Acetic acid
Lactic acid
A
0.00%
10.00%
20.00%
30.00%
40.00%
50.00%
60.00%
70.00%
10 15 20 25 30 35 40 45 50 55
Hyd
rox
ypro
lin
e re
cover
y ra
te (
%)
Liquid to solid ratio (V/W)
2.3 HCl
2.4 HCl
2.5 HCl
B

53
Figure 3.1 (continued)
Place all detailed caption, notes, reference, legend information, etc here
3.4.4 Kinetic analysis of collagen extraction
Kinetic analysis was carried out for collagen extraction at different extraction
conditions (different acids, pH, liquid to solid ratio, particle size and enzyme
concentration). The Peleg’s model was used for the kinetic analysis. Since most studies
used 0.5 M acetic acid (pH around 2.6) to extract skin collagen, therefore, we compared
four different acids to extract catfish skin collagen at this pH. The effect of different acids
(pH 2.6) on collagen extraction is shown in Figure 3.2 (A). As expected, hydroxyproline
recovery rate showed an overall increasing pattern with time extended. The extraction
curves indicated that hydrochloric acid gave the highest hydroxyproline recovery rate and
the lowest in the case of citric acid extraction. These four types of acids exhibited a sharp
increase in hydroxyproline recovery rates in the first 12 hrs, and then reached a plateau-
like pattern. Figure 3.2 (B-F) showed the effect of pH of HCl, solid-to-liquid ratio
0.00%
10.00%
20.00%
30.00%
40.00%
50.00%
60.00%
70.00%
0.00 5.00 10.00 15.00 20.00 25.00
Hyd
roxyp
roli
ne
reco
ver
y ra
te (
%)
Enzyme concentration (KU/g of skins)
1:5 (V/W)
1:10 (V/W)
1:15 (V/W)
1:20 (V/W)
1:30 (V/W)
C
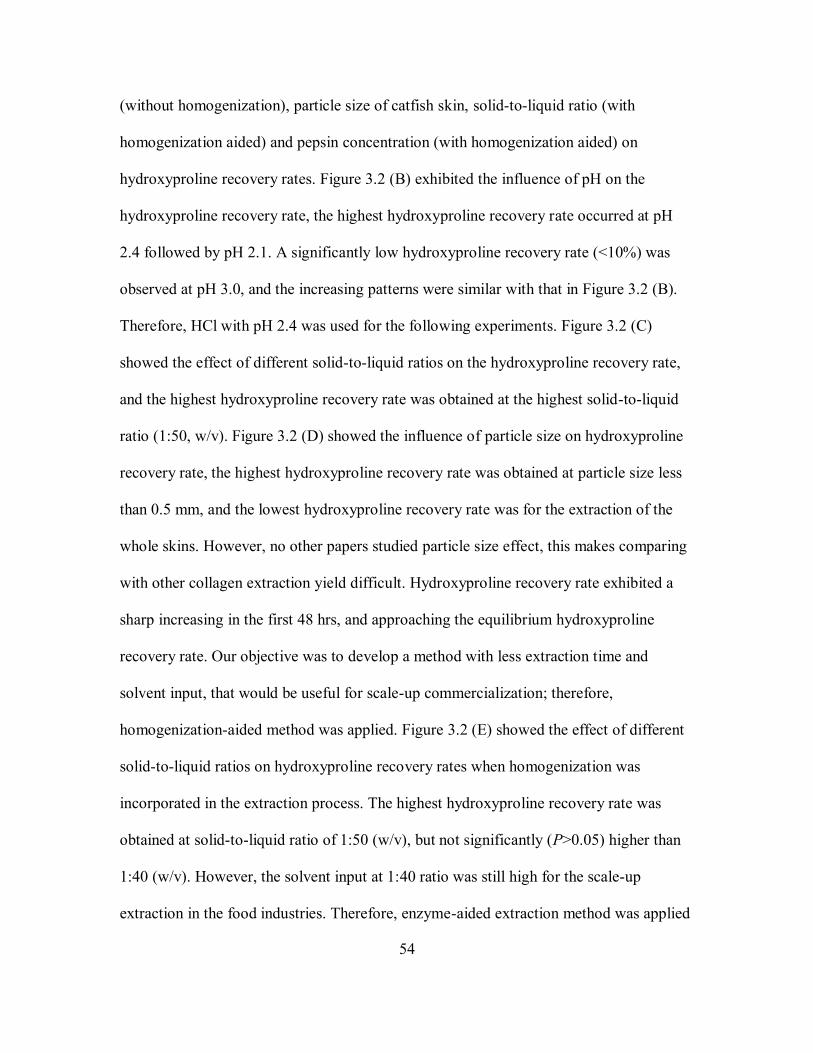
54
(without homogenization), particle size of catfish skin, solid-to-liquid ratio (with
homogenization aided) and pepsin concentration (with homogenization aided) on
hydroxyproline recovery rates. Figure 3.2 (B) exhibited the influence of pH on the
hydroxyproline recovery rate, the highest hydroxyproline recovery rate occurred at pH
2.4 followed by pH 2.1. A significantly low hydroxyproline recovery rate (<10%) was
observed at pH 3.0, and the increasing patterns were similar with that in Figure 3.2 (B).
Therefore, HCl with pH 2.4 was used for the following experiments. Figure 3.2 (C)
showed the effect of different solid-to-liquid ratios on the hydroxyproline recovery rate,
and the highest hydroxyproline recovery rate was obtained at the highest solid-to-liquid
ratio (1:50, w/v). Figure 3.2 (D) showed the influence of particle size on hydroxyproline
recovery rate, the highest hydroxyproline recovery rate was obtained at particle size less
than 0.5 mm, and the lowest hydroxyproline recovery rate was for the extraction of the
whole skins. However, no other papers studied particle size effect, this makes comparing
with other collagen extraction yield difficult. Hydroxyproline recovery rate exhibited a
sharp increasing in the first 48 hrs, and approaching the equilibrium hydroxyproline
recovery rate. Our objective was to develop a method with less extraction time and
solvent input, that would be useful for scale-up commercialization; therefore,
homogenization-aided method was applied. Figure 3.2 (E) showed the effect of different
solid-to-liquid ratios on hydroxyproline recovery rates when homogenization was
incorporated in the extraction process. The highest hydroxyproline recovery rate was
obtained at solid-to-liquid ratio of 1:50 (w/v), but not significantly (P>0.05) higher than
1:40 (w/v). However, the solvent input at 1:40 ratio was still high for the scale-up
extraction in the food industries. Therefore, enzyme-aided extraction method was applied
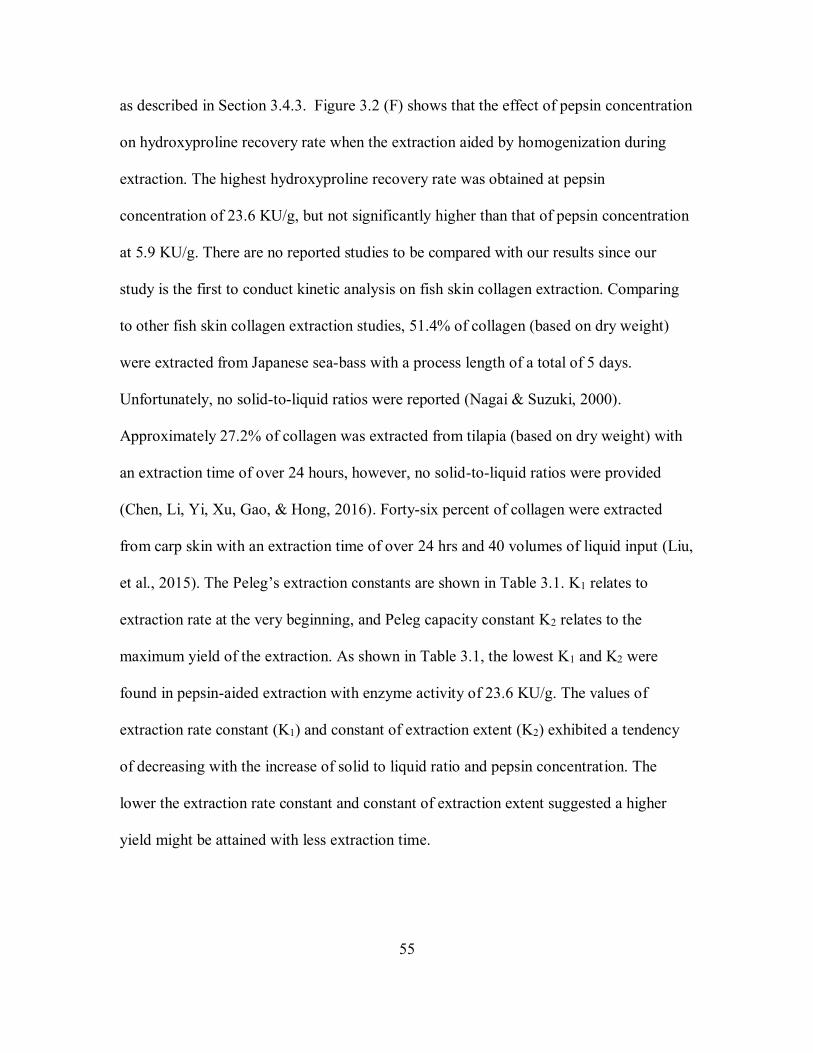
55
as described in Section 3.4.3. Figure 3.2 (F) shows that the effect of pepsin concentration
on hydroxyproline recovery rate when the extraction aided by homogenization during
extraction. The highest hydroxyproline recovery rate was obtained at pepsin
concentration of 23.6 KU/g, but not significantly higher than that of pepsin concentration
at 5.9 KU/g. There are no reported studies to be compared with our results since our
study is the first to conduct kinetic analysis on fish skin collagen extraction. Comparing
to other fish skin collagen extraction studies, 51.4% of collagen (based on dry weight)
were extracted from Japanese sea-bass with a process length of a total of 5 days.
Unfortunately, no solid-to-liquid ratios were reported (Nagai & Suzuki, 2000).
Approximately 27.2% of collagen was extracted from tilapia (based on dry weight) with
an extraction time of over 24 hours, however, no solid-to-liquid ratios were provided
(Chen, Li, Yi, Xu, Gao, & Hong, 2016). Forty-six percent of collagen were extracted
from carp skin with an extraction time of over 24 hrs and 40 volumes of liquid input (Liu,
et al., 2015). The Peleg’s extraction constants are shown in Table 3.1. K1 relates to
extraction rate at the very beginning, and Peleg capacity constant K2 relates to the
maximum yield of the extraction. As shown in Table 3.1, the lowest K1 and K2 were
found in pepsin-aided extraction with enzyme activity of 23.6 KU/g. The values of
extraction rate constant (K1) and constant of extraction extent (K2) exhibited a tendency
of decreasing with the increase of solid to liquid ratio and pepsin concentration. The
lower the extraction rate constant and constant of extraction extent suggested a higher
yield might be attained with less extraction time.

56
Fig
ure
3.2
H
ydro
xypro
line
reco
ver
y r
ate
of
coll
agen e
xtr
acte
d w
ith d
iffe
rent
acid
s at
pH
2.6
.
(A):
Hydro
xypro
line
reco
ver
y r
ate
of
coll
agen e
xtr
acte
d w
ith d
iffe
rent
acid
s at
pH
2.6
; (B
): H
ydro
xypro
line
reco
ver
y r
ate
of
coll
agen e
xtr
acte
d w
ith H
Cl at
dif
fere
nt
pH
.
0.0
0%
5.0
0%
10.0
0%
15.0
0%
20.0
0%
25.0
0%
012
24
36
48
60
72
84
Hydroxyproline recovery rate (%)
Tim
e (h
ours
)
Cit
ric
acid
HC
l
Lac
tic
acid
Ace
tic
acid
A
0.0
0%
5.0
0%
10.0
0%
15.0
0%
20.0
0%
25.0
0%
30.0
0%
012
24
36
48
60
72
84
Hydroxyproline recovery rate (%)
Tim
e (h
ours
)
pH
1.8
pH
2.1
pH
2.4
pH
2.7
pH
3.0
B

57
Fig
ure
3.2
(co
nti
nued
)
(C):
Hydro
xypro
line
reco
ver
y r
ate
of
coll
agen e
xtr
acte
d b
y p
H 2
.4 H
Cl w
ith d
iffe
rent
soli
d t
o l
iqu
id r
atio
(W
/V);
(D
):
Hydro
xypro
line
reco
ver
y r
ate
of
coll
agen e
xtr
acte
d b
y p
H 2
.4 H
Cl (W
/V=
1:5
0)
wit
h d
iffe
rent
skin
par
ticle
siz
e.
0.0
0%
5.0
0%
10.0
0%
15.0
0%
20.0
0%
25.0
0%
30.0
0%
35.0
0%
012
24
36
48
60
72
84
Hydroxyprolinerecovery rate (%)
Tim
e (h
ours
)
1:1
0
1:2
0
1:3
0
1:4
0
1:5
0
C
0.0
0%
5.0
0%
10.0
0%
15.0
0%
20.0
0%
25.0
0%
30.0
0%
012
24
36
48
60
72
84
Hydroxyprolinerecovery rate (%)
Tim
e (h
ours
)
Whole
skin
s
2-4
mm
1-2
mm
0.5
-1 m
m
<0.5
mm
D

58
Fig
ure
3.2
(co
nti
nued
)
(E):
Hydro
xypro
line
reco
ver
y r
ate
of
coll
agen e
xtr
acte
d b
y p
H 2
.4 H
Cl w
ith d
iffe
rent
soli
d t
o l
iqu
id (
W/V
) ra
tio
wit
h
ho
mo
gen
izat
ion a
ided
; (F
): H
ydro
xypro
line
reco
very
rat
e o
f co
llag
en
extr
acte
d b
y p
H 2
.4 H
Cl (W
/V=
1:5
0)
wit
h d
iffe
rent
pep
sin
conce
ntr
atio
n.
0.0
0%
10.0
0%
20.0
0%
30.0
0%
40.0
0%
50.0
0%
60.0
0%
70.0
0%
02
46
8
Hydroxyprolinerecovery rate (%)
Tim
e (h
ours
)
1:1
0
1:2
0
1:3
0
1:4
0
1:5
0
E
0.0
0%
10
.00
%
20
.00
%
30
.00
%
40
.00
%
50
.00
%
60
.00
%
70
.00
%
02
46
8
Hydroxyprolinerecovery rate (%)
Tim
e (h
ours
)
0.1
18 K
U/g
1.1
18 K
U/g
5.9
0 K
U/g
11.8
KU
/g
23.6
KU
/g
F

59
Table 3.1 Kinetic constant and R2 for hydroxyproline recovery rate under different
extraction conditions.
K1 K2 R2
Acid
Citric acid 30.47 7.39 0.989
Lactic acid 20.49 6.74 0.994
Acetic acid 13.91 5.99 0.997
Hydrochloric acid 13.23 5.46 0.996
pH
pH 1.8 38.86 8.16 0.984
pH 2.1 18.69 5.00 0.990
pH 2.4 14.39 3.57 0.987
pH 2.7 26.78 6.78 0.990
pH 3.0 110.03 3671 0.994
Ratio (without homogenization)
1:10 53.59 13.39 0.990
1:20 31.74 7.26 0.988
1:30 20.25 5.29 0.991
1:40 19.33 4.37 0.987
1:50 13.81 3.53 0.987
Particle size
Whole skins 31.39 8.77 0.992
2-4 mm 24.47 7.23 0.992
1-2 mm 19.65 6.30 0.994
0.5-1 mm 18.64 4.52 0.989
<1 mm 15.54 3.73 0.989
Ratio (with homogenization)
1:10 2.49 12.70 0.997
1:20 0.57 3.34 0.998
1:30 0.23 2.12 0.999
1:40 0.15 1.70 0.999
1:50 0.11 1.63 0.999
Pepsin concentration
0.118 KU/g 0.19 1.81 0.999
1.18 KU/g 0.14 1.68 0.999
5.90 KU/g 0.14 1.59 0.999
11.8 KU/g 0.11 1.57 0.999
23.6 KU/g 0.08 1.55 0.999

60
3.4.5 SDS-PAGE of collagen extracted with different conditions
Figures 3.3 and 3.4 show the SDS-PAGE patterns of collagen extracted with
different conditions. All collagen products extracted with different conditions had two
different α chains (α1 and α2) and their cross-linked chains (dimer is referred to as β
chain, trimer is referred to as γ chain). The molecular mass of α1 chain is 123 KDa and
113 KDa for α2 chain. The α1 chain might contain a α3 chain that has a molecular mass
close to α1 chain, resulting a indistinguishable band on a SDS-PAGE gel (Kimura, Zhu,
Matsui, Shijoh, & Takamizawa, 1988). And the molecular mass of the subunit was 226
KDa for β chain and 338 KDa for γ chain, respectively. These values were similar to the
molecular mass of black drum and sheepshead seabream skin collagen (Ogawa, Moody,
Portier, Bell, Schexnayder, & Losso, 2003), carp skin collagen (Duan, Zhang, Du, Yao,
& Konno, 2009) and tilapia skin collagen (Chen, Li, Yi, Xu, Gao, & Hong, 2016).
However, extracted collagens described in the above literature were not from the Channel
catfish species. Channel catfish skin collagen was successfully isolated but with the mass
of the subunits had not been reported (Liu, Li, & Guo, 2007). In addition, skin collagen
of striped catfish was isolated and characterized before, however, no molecular mass of
each subunit was provided (Singh, Benjakul, Maqsood, & Kishimura, 2011). The
existence of two different α chains confirmed that the major collagen from catfish skins
was of the type-I collagen (Sato, 1993). Band intensity ratio of β/(α1+ α2) chains in acid-
solubilized collagen (ASC), homogenization-solubilized collagen (HSC) and pepsin-
homogenization solubilized collagen (PHSC) were 1.94, 1.72 and 0.41, respectively. The
quantity of β chain was higher in acid-extracted collagen than that in pepsin-aided
extracted collagen, in which 55.5% of the β chain of the pepsin-aided extracted collagen

61
degraded into α1 and α2 chains. The reason might be that some β chains were converted to
α chains by pepsin, this observation was similar to the study of skin collagen from
Channel catfish, black drum and sheepshead seabream (Ogawa, Moody, Portier, Bell,
Schexnayder, & Losso, 2003). As mentioned above, pepsin removes the cross-linked
containing telopeptide, and one β chain is converted to two α chains (Sato, Ebihara,
Adachi, Kawashima, Hattori, & Irie, 2000). Since no studies had used homogenization-
aided method to extract fish skin collagen, therefore, our studies presented the first
homogenization effect on catfish collagen extraction yield and quantity.

62
Fig
ure
3.3
S
DS
-PA
GE
gel
s o
f co
llag
ens
extr
acte
d w
ith v
ario
us
acid
extr
acti
ons.
Left
fig
ure
: L
ane
1:
HC
l, p
H 3
extr
acte
d c
oll
agen;
Lane
2:
HC
l, p
H 2
.7 e
xtr
acte
d c
oll
agen;
Lane
3:
HC
l, p
H 2
.4 e
xtr
acte
d c
oll
agen;
Lane
4:
HC
l, p
H 2
.1 e
xtr
acte
d c
oll
agen;
Lane
5:
HC
l, p
H 1
.8 e
xtr
acte
d c
oll
age;
Lane
6:
Ace
tic
acid
, pH
3 e
xtr
acte
d c
oll
agen;
Lane
7:
Ace
tic
acid
, pH
2.7
extr
acte
d c
oll
agen;
Lane
8:
Ace
tic
acid
, pH
2.4
extr
acte
d c
oll
agen;
Lane
9:
Acet
ic a
cid
, pH
2.1
extr
acte
d
coll
agen;
Lane
10:
Ace
tic
acid
, pH
1.8
extr
acte
d c
oll
agen.
Rig
ht
figure
: L
ane
1:
Lac
tic
acid
, pH
3 e
xtr
acte
d c
oll
agen;
Lane
2:
Lac
tic
acid
, pH
2.7
extr
acte
d c
oll
agen;
Lane
3:
Lac
tic
acid
, pH
2.4
extr
acte
d c
oll
agen;
Lane
4:
Lac
tic a
cid
, pH
2.1
extr
acte
d
coll
agen;
Lane
5:
Lac
tic
acid
, pH
1.8
extr
acte
d c
ollag
en;
Lane
6:
Cit
ric
acid
, pH
3 e
xtr
acte
d c
oll
agen;
Lan
e 7:
Cit
ric
acid
, pH
2.7
extr
acte
d c
oll
agen;
Lane
8:
Cit
ric a
cid
, pH
2.4
extr
acte
d c
oll
agen;
Lane
9:
Cit
ric
acid
, pH
2.1
extr
acte
d c
oll
agen;
Lane
10:
Cit
ric
acid
, pH
1.8
extr
acte
d c
oll
agen.

63
Fig
ure
3.4
S
DS
-PA
GE
gel
of
coll
agens
extr
acte
d w
ith d
iffe
rent
conce
ntr
atio
ns
of
pep
sin.
Lane
1:
HC
l at
pH
2.4
, W
/V =
1:5
, ho
mo
gen
izat
ion,
pep
sin c
once
ntr
atio
n 1
18U
/g;
Lane
2:
HC
l at
pH
2.4
, W
/V =
1:5
,
ho
mo
gen
izat
ion,
pep
sin c
oncentr
atio
n 1
180U
/g;
Lan
e 3:
HC
l at
pH
2.4
, W
/V =
1:5
, ho
mo
geniz
atio
n,
pep
sin c
oncentr
atio
n
5900U
/g);
Lane
4:
HC
l at
pH
2.4
, W
/V =
1:5
, ho
mo
gen
izat
ion,
pep
sin c
once
ntr
atio
n 1
1800U
/g;
Lane 5
: H
Cl at
pH
2.4
, W
/V =
1:5
,
ho
mo
gen
izat
ion,
pep
sin c
oncentr
atio
n 2
3600U
/g;
Lane
6:
HC
l at
pH
2.4
, W
/V =
1:2
0,
ho
mo
gen
izat
ion,
pep
sin c
oncentr
atio
n
118U
/g;
Lane
7:
HC
l at
pH
2.4
, W
/V =
1:2
0,
ho
mo
gen
izat
ion,
pep
sin c
once
ntr
atio
n 1
180U
/g;
Lane
8:
HC
l at
pH
2.4
, W
/V =
1:2
0,
ho
mo
gen
izat
ion,
pep
sin c
oncentr
atio
n 5
900U
/g;
Lan
e 9:
HC
l at
pH
2.4
, W
/V =
1:2
0,
ho
mo
geniz
atio
n,
pep
sin c
once
ntr
atio
n
11800U
/g;
Lane
10:
HC
l at
pH
2.4
, W
/V =
1:2
0, hom
ogeniz
atio
n,
pep
sin c
oncentr
atio
n 2
3600U
/g.

64
3.4.6 Effect of pH and NaCl on collagen solubility
3.4.6.1 Effect of pH on collagen solubility
Collagen extracted with pH 2.4 HCl for 48 hrs (ASC), homogenized with pH 2.4
HCl for 5 min (HSC) with (PHSC, pepsin concentration 11.8 KU/g) or without pepsin
were used for solubility characterization. The effect of pH on the solubility of collagen
extracted by different methods is shown in Figure 3.5 (A). ASC, HSC, and PHSC showed
the highest solubility at pH 2 (p < 0.05). All the collagens were solubilized in the low pH
range (1 to 4), and a sharp solubility decrease was observed when pH was higher than 5
(p < 0.05). When the pH was not equal to pI, the net charge of the protein molecules was
larger than zero, therefore, the solubility of the protein was increased by the repulsion
forces between chains. In contrast, when the pH was equal or close to the pI, the total net
charge of the protein molecules approached zero and resulted in precipitation. It had been
reported that the pI of collagen is varied from 6 to 9 (Foegeding, Lanier, & Hultin, 1996).
The minimum solubility of collagen is around pH 6 in the current study, and this
observation was similar with the solubility of collagen from brownstripe red snapper skin
(Jongjareonrak, Benjakul, Visessanguan, Nagai, & Tanaka, 2005). Acid-extracted
collagen exhibited higher solubility than the other two collagens at pH 1 to 4 but with no
significant differences (p < 0.05). However, collagen extracted with pepsin from bigeye
snapper had been reported to have the highest solubility at pH 5 (Nalinanon, Benjakul,
Visessanguan, & Kishimura, 2007), which was closer to the isoelectric point (6 to 9).
3.4.6.2 Effect of NaCl on collagen solubility
Solubility of ASC, HSC and PHSC in 0.5 M acetic acid remained consistent at

65
NaCl concentrations of 0-2% (p > 0.05), and the results are shown in Figure 3.5 (B). A
slight decrease in solubility was observed at 3% NaCl. A sharp decrease was observed
when the concentration of NaCl increased to 4% and above (p < 0.05). Solubility of
collagen extracted from the skin of bigeye snapper, striped catfish, tilapia and brown
stripe red snapper (Jongjareonrak, Benjakul, Visessanguan, Nagai, & Tanaka, 2005;
Kittiphattanabawon, Benjakul, Visessanguan, Nagai, & Tanaka, 2005; P Montero,
Gómez-Guillén, & Borderıas, 1999; Singh, Benjakul, Maqsood, & Kishimura, 2011) also
decreased with the increasing concentration of sodium chloride. When higher
concentration of NaCl (> 3%) was presented, an increasing ionic strength might lead to a
reduction in protein solubility by increasing the interactions between protein chains
(salting out phenomenon). Thus, solubility of protein might be decreased via increasing
hydrophobic interaction and aggregation, in which salt competes with protein molecules
for water. Collagen extracted by the homogenization method with pepsin addition
showed a higher solubility than that isolated from the other two methods, and this
observation was in accordance with the collagen extracted with acid and pepsin from
striped catfish skin (Singh, Benjakul, Maqsood, & Kishimura, 2011). Greater solubility of
PHSC was due to the action of pepsin in altering the collagen structure and altered the
compositions of α, β and γ chains as discussed in Section 3.4.5. Therefore, collagen
extracted by different methods might have slightly different molecular properties.
Comparing Figure 3.3 and Figure 3.4, pepsin-added extraction produced a high band
intensity of α1 and α2 chains, which were derived from the β chain in non-pepsin
extracted collagen (Figure 3.3).

66
Figure 3.5 Effect of pH and NaCl on collagen solubility.
(A): Effect of pH on collagen solubility; (B): Effect of NaCl on collagen solubility.
3.4.7 Zeta (ζ) potential
Zeta potential is used as a factor for determining the physical properties of
colloidal dispersions. It is the e- potential difference between dispersion medium and the
0.00%
10.00%
20.00%
30.00%
40.00%
50.00%
60.00%
70.00%
80.00%
90.00%
100.00%
0 2 4 6 8 10 12
Rel
ativ
e co
llage
n s
olu
bili
ty (%
)
pH
ASC
HSC
PHSC
0.00%
10.00%
20.00%
30.00%
40.00%
50.00%
60.00%
70.00%
80.00%
90.00%
100.00%
0 1 2 3 4 5 6
Rel
ativ
e co
llage
n s
olu
bili
ty (%
)
Concentration of NaCl (% (W/V))
ASC
HSC
PHSC
A
B

67
slipping plane of the dispersed molecules/particles. A high zeta potential will give high
stability to resist aggregation. In contrast, when the zeta potential is small or close to
zero, attractive forces may be larger than repulsion forces, and the dispersion may form
aggregates. The zeta potentials of ASC, HSC and PHSC solutions at different pHs are
shown in the Figure 3.6 (A). The zero-surface net charge of ASC, HSC and PHSC was
observed at pH of 5.34, 5.73 and 5.42, respectively. The total net charge of protein would
be zero when the pH of protein close to isoelectric point (Vojdani, 1996). The results of
the effect of pH on protein solubility indicated that PHSC had the lowest solubility at pH
6, which suggested that the isoelectric point of ASC, HSC and PHSC was around 6.
Thus, the results of zeta potential and solubility test were mutual supportive. And the
differences in surface charge between ASC and HSC might be due to the differences in
acidic and basic amino acid residues, which were likely influenced by the removal of
telopeptides by high-speed homogenization. The zero surface charge of collagen
extracted by acid and pepsin from striped catfish were 4.72 and 5.43, respectively (Singh,
Benjakul, Maqsood, & Kishimura, 2011). This discrepancy in surface charge of acid and
pepsin solubilized collagens might be attributes to the different acidic and basic amino
acid residues, which was more controlled by the removal for telopeptides by pepsin
which discussed in Section 3.4.5 (Sato, Ebihara, Adachi, Kawashima, Hattori, & Irie,
2000). Collagens extracted with acid and pepsin from brown-banded bamboo shark skin
were reported to have a zero surface charge at 6.21 and 6.56, respectively
(Kittiphattanabawon, Benjakul, Visessanguan, Kishimura, & Shahidi, 2010). In this
study, PHSC showed a higher zero surface net charge (pH 5.42) than ASC (pH 5.34), and
this observation was in accordance with other studies described above.

68
3.4.8 Circular dichroism (CD)
CD spectra of collagen extracted with different methods are shown in Figure 3.6
(B). CD spectrum with positive peaks at 221 nm for both ASC and PHSC and 222 nm for
HSC were observed; and negative extreme for HSC and PHSC were observed at 199 nm,
ASC showed a negative extreme at 200 nm. Slight deviations in ellipticity were observed
among the three collagen products extracted with different methods, which indicated that
there was a minor alternation in the structures of these three collagens. The spectra
characteristics in the three collagens are typical of the collagen triple helix structure
(Engel, 1987), which suggested that the triple helical structure of collagen was not
destroyed during extraction processing. CD spectra of collagen extracted from Pagrus
major, oreochromis niloticas, Labeo rihita, Catla scale, eel-fish skin, black drum and
sheepshead seabream skin, bone and scale (Ikoma, Kobayashi, Tanaka, Walsh, & Mann,
2003; Ogawa, Moody, Portier, Bell, Schexnayder, & Losso, 2003; Ogawa, Portier,
Moody, Bell, Schexnayder, & Losso, 2004; Pati, Adhikari, & Dhara, 2010; Veeruraj,
Arumugam, & Balasubramanian, 2013) had been exhibit shown to a similar pattern with
our study.
3.4.9 Differential scanning calorimetry (DSC)
DSC thermograms of collagen extracted by different methods are shown in Figure
3.6 (C). Endothermic peaks with Tmax of collagens extracted by three different method are
ranging from 35.57 to 36.12°C. The ∆H and Tmax of ASC and HSC were slightly higher
than that of PHSC. This might be caused by the different α and β chains composition
since ASC and HSC exhibited higher ratios of β/(α1+ α2) chains (discussed in section
3.5). Higher levels of cross-linkage of collagens were more likely to contribute to the

69
higher Tmax (Singh, Benjakul, Maqsood, & Kishimura, 2011). The results of DSC were
higher than previous report on the collagens extracted from Channel catfish skin (Tmax =
32.5°C) (Liu, Li, & Guo, 2007). The minor differences might be caused by the different
raw materials, the catfish used might be raised in different temperature of water. DSC
was used in the current study. However, denaturation temperature in the cited reference
was determined by monitoring the viscosity change of collagen solution under a
temperature range. Therefore, a different denaturation temperature might have occurred.

70
Fig
ure
3.6
P
hysi
cal and s
truct
ura
l char
acte
riza
tio
ns
of
extr
acte
d c
oll
agen.
(A):
Zet
a (ζ
) pote
nti
al o
f ex
trac
ted c
oll
agen.
-505
10
15
20
25
01
23
45
67
Zeta (ζ) potential (mV)
pH
AS
C
HS
C
PH
SC

71
Fig
ure
3.6
(co
nti
nued
)
(B):
CD
spec
tra
of
coll
agen e
xtr
acte
d w
ith d
iffe
rent
condit
ions.
-50
-40
-30
-20
-100
10
190
200
210
220
230
240
250
CD (mdeg)
Wav
elen
gth
(n
m)
HS
C
PH
SC
AS
C
Den
ature
d

72
Fig
ure
3.6
(co
nti
nued
)
(C):
DS
C t
her
mo
gra
ms
of
AS
C (
acid
so
lubil
ized
co
llag
en),
HS
C (
ho
mo
gen
izat
ion a
ided
so
lubil
ized
co
llag
en)
and H
PS
C (
pep
sin
and h
om
ogen
izat
ion-s
olu
bil
ized
co
llag
en)
fro
m C
han
nel
catf
ish s
kin
dis
per
sed i
n 0
.05 M
ace
tic a
cid
.
02468
10
12
14
16
20
25
30
35
40
45
50
Heat Flow (W/g)
Tem
per
atu
re (
°C)
AS
CH
SC
PH
SC
C
Tm
ax =
36.0
5°C
, Δ
H =
0.6
51
J/g
Tm
ax =
35.5
7°C
, Δ
H =
0.5
64
J/g
Tm
ax =
36.1
2°C
, Δ
H =
0.6
72
J/g

73
3.4.10 Gel strength
Gel strength is one of the most important index for collagen quality and it can be
classified into 3 levels: low (<150 ɡ), medium (150-220 ɡ) and high (220-300 ɡ)
(Johnston-Bank, 1983). The prepared collagen gels were used to test the gel strength, and
ASC, HSC and PHSC exhibited gel strength of 223.13, 220.48 and 73.59 ɡ, respectively.
This result was expected since pepsin-added extraction produced smaller α1 + α2
molecules, which would produce weaker gels. Gel strength of collagen extracted from
tilapia had been reported to be 157 to 260 ɡ at the same concentration (Huang, Kuo, Wu,
& Tsai, 2016). The discrepancy in gel strength among species might be due to the
different amino acid composition and molecular size of protein chains (Muyonga, Cole,
& Duodu, 2004b). When gel strength was measured at low temperature (< 10 °C), some
short chain peptides present in low viscosity gelatins tend to strengthen the gel (Montero
& Gómez-Guillén, 2000). In addition, the thermal shrinkage, denaturation temperature of
collagens and melting temperature of gelatins isolated from cold-water fish had been
reported to be significantly lower than collagens and gelatins from warm water fish, the
reason of the differences might be due to a lower degree of proline hydroxylation of cold-
water fish collagen (Karim & Bhat, 2009).
3.5 Conclusion
In summary, collagens were extracted and characterized from catfish skin
successfully. Hydroxyproline recovery rates from minced catfish skins extracted with pH
2.4 HCl containing 23.6 KU/g pepsin was the highest (64.19%). Kinetic analysis of
collagen extraction yield was performed, and the results showed that the lower the
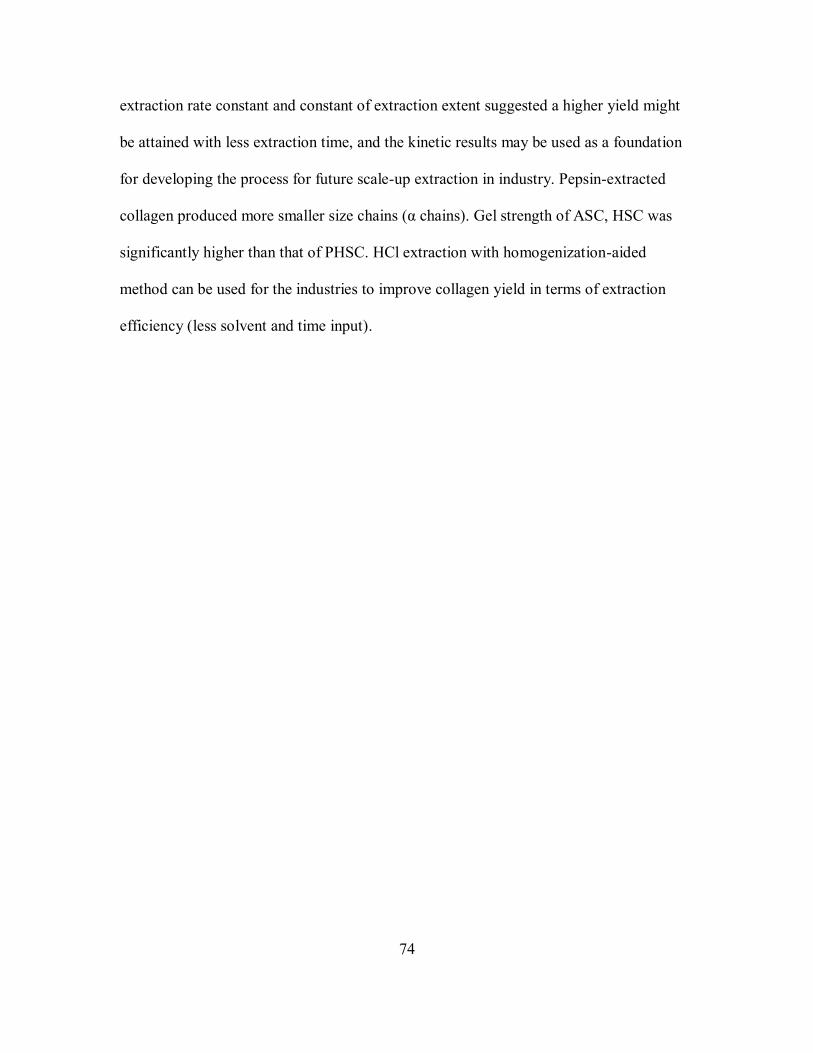
74
extraction rate constant and constant of extraction extent suggested a higher yield might
be attained with less extraction time, and the kinetic results may be used as a foundation
for developing the process for future scale-up extraction in industry. Pepsin-extracted
collagen produced more smaller size chains (α chains). Gel strength of ASC, HSC was
significantly higher than that of PHSC. HCl extraction with homogenization-aided
method can be used for the industries to improve collagen yield in terms of extraction
efficiency (less solvent and time input).

75
3.6 Research diagram in proposal
Research diagram on catfish skin in proposal is shown in Figure 3.7. Future work
and limitation of the current study are discussed in Chapter VI.
Figure 3.7 Research diagram of utilization of catfish skin and characterization of
collagen extracted from catfish skin.

76
CHAPTER IV
COMPARING THE KINETIC OF THE HYDROLYSIS OF BY-PRODUCT FROM
CHANNEL CATFISH (ICTALURUS PUNCTATUS) FILLET PROCESSING BY
EIGHT PROTEASES
4.1 Abstract
Channel catfish (Ictalurus punctatus) by-products (heads and frames) were
collected from local a catfish processing plant. Papain, ficin, bromelain, neutrase,
alcalase, protamex, novo-proD and thermolysin were used for hydrolysis. Proteolytic
activities of those proteases were analyzed by using AzocollTM and Azocasein as
substrates at different hydrolysis temperatures. Proteases cost for reaching certain degree
of hydrolysis was predicted. Degree of hydrolysis (DH) of the hydrolysates and
hydrolysis kinetics were studied. Emulsifying capacities and foaming properties and
stability of selected hydrolysates were evaluated. Results indicated that thermolysin had
the highest activity (8.2×10⁸ Azocoll U/g and 5.6×10⁶ Azocasein U/g) at 70 °C. The
highest DH of the hydrolysates were observed in 120 min with the concentration of 80
AzU/g for all enzymes. Ficin (80 AzU/g) was the most efficient in hydrolyzing the by-
product (DH reaching 71%) in 120 min at 30°C. The hydrolysis curves fit the Peleg’s
model well with R2 higher than 0.91.
Keywords: Channel catfish, protease hydrolysis, kinetic analysis, by-product
77
4.2 Introduction
Channel catfish farming is one of the most important warm water aquaculture in
the United States and is vital to the rural economy. However, in catfish fillet processing,
approximately 60% of the whole catfish (currently the cost is about $1 per lb of the fresh
fish) is the by-product, and has been sold at 2 cents/lb to the local oil rendering plant.
Because of the steady increases in world population, global need for dietary protein
source is increasing rapidly. Catfish protein isolated from the by-product could help to
alleviate protein shortage problem, and hence help to reduce problems associated with
world hunger and malnutrition. Successful utilization of the by-product as a protein
hydrolysate may increase aquaculture profitability and sustainability.
Protein hydrolysates have been made from various fish species by bacterial
fermentation (Kristinsson & Rasco, 2000a; Sodini, Lucas, Tissier, & Corrieu, 2005) or by
enzymatic hydrolysis (Hathwar, Bijinu, Rai, & Narayan, 2011; Nilsang, Lertsiri,
Suphantharika, & Assavanig, 2005). Flavourzyme™ and Kojizyme™ have been used for
hydrolyzing tuna processing by-product (Nilsang, Lertsiri, Suphantharika, & Assavanig,
2005), alcalase and neutrase had been utilized for hydrolyzing Pacific whiting solid waste
and capelin (Benjakul & Morrissey, 1997; Shahidi, Han, & Synowiecki, 1995). Plant
proteases such as papain, ficin and bromelain have also been used for hydrolyzing fish
fillet protein (Beddows & Ardeshir, 1979; Salampessy, Phillips, Seneweera, &
Kailasapathy, 2010). Hydrolysis kinetics of fish proteins have been studied by some
research groups, and the kinetic model they used are different (Kristinsson & Rasco,
2000b; Wu, Du, Jia, & Kuang, 2016). Early research intention is to use the fish
hydrolysate for animal feed. Recently, hydrolysates of sardine and horse mackerel muscle

78
protein have been found to possess antioxidant activity (Morales-Medina, Tamm,
Guadix, Guadix, & Drusch, 2016), and hydrolysates of leatherjacket muscle protein
exhibited angiotensin-I converting enzymes (ACE) inhibition activity (Salampessy,
Reddy, Phillips, & Kailasapathy, 2017), and most of the studies have focused on
improving the degree of hydrolysis in order to improve their antioxidant activity.
However, the hydrolysis of Channel catfish by-products by using multiple proteases and
hydrolysis kinetics have not been reported. In addition, this study is the first to show the
peptide’s pattern changes during protease hydrolysis. The objective of this study was to
investigate the kinetics of the enzymatic hydrolysis of catfish by-product, and to study the
functional properties of the hydrolysates. This study provides important new engineering
information for choosing proteases and processing conditions for optimizing efficiency
and yield.
4.3 Material and methods
4.3.1 Materials
Channel catfish by-products (heads and bone frames) were collected from the
local catfish fillet processing plant (Country Select, Isola, MS), and buried under ice
during transportation and delivered to our laboratory within two hours. All materials were
stored at -80°C until use.
4.3.2 Chemicals
All chemicals were of the analytical grade. Papain, ficin, bromelain and
thermolysin used in this study were obtained from the Sigma-Aldrich Chemical Company

79
(St. Louis, MO, USA). Food grade neutraseTM, alcalaseTM, protamexTM, novo-proD®
were kindly donated by Novozyme Inc. (Franklinton, NC, USA).
4.3.3 Proteolytic activity determination by using Azocoll as substrate
A synthetic substrate AzocollTM was used to evaluate the proteolytic activity of
the proteases according to the previous method with some modifications (Kristinsson &
Rasco, 2000b). Azocoll (50 mg) was mixed with 0.1 M sodium phosphate buffer (pH 7.2)
in a 15 mL centrifuge tube to a final volume of 5 mL and incubated in a water bath at 30,
40, 50, 60 and 70°C, respectively, for 10 min. The reaction was initiated by adding
proteases (20 µL with appropriate dilution). The temperature and pH were maintained the
same as periodically throughout the hydrolysis reaction (adjust the pH every 10 min). The
tubes were incubated for 15 min in the water bath at the corresponding temperature,
inverting the tubes for every 3 min. The reaction was terminated by placing the tubes on
ice for 10 min. The mixture was centrifuged at 10000 g (4 °C) for 3 min to remove the
residue, and the absorbance of the supernatant was measured at 520 nm. The absorbance
was plotted against enzyme quantity for each assay. The results were expressed as
Azocoll unit (AzU) per gram or mL enzyme. One AzU is defined as the amount of
enzyme generating an absorption of 0.1 at 520 nm under the conditions described above.
All assays were carried out in triplicate. Proteolytic activities of catfish heads and bone
frames were determined to check if the substrates contained proteases which hydrolyzed
the proteins at significant level.

80
4.3.4 Proteolytic activity determination by using Azocasein as substrate
In order to provide the reference proteolytic activity of the eight proteases,
proteolytic activity of each protease was determined at the same temperature and pH as
described in section 4.3.3, but Azocasein was used instead of Azocoll. The procedures
were the same as the method reported before (Coêlho, Saturnino, Fernandes, Mazzola,
Silveira, & Tambourgi, 2016).
4.3.5 Enzymatic hydrolysis
Catfish heads and bone frames were grounded using a meat grinder (LEM
Products #32, West Chester, OH) for six cycles and mixed (w/w = 3:2). Distilled water
was added into the mixed by-products (w/v = 1:1) in a 2.5 L plastic bucket, and the pH of
the mixture was adjusted to 7.2. Papain, ficin, bromelain, neutraseTM, alcalaseTM,
protamexTM, novo-pro D® and thermolysin were used for hydrolysis. The reaction was
initiated by adding varying concentrations of enzymes (5, 10, 25, 40, and 80 AzU/g of
protein content in the substrate wasa determined by Kjeldahl analysis) and hydrolyzed for
10, 20, 40, 60 and 120 min at 40, 50, 60 and 70°C for thermolysin and 30, 40, 50 and
60°C for all other proteases. The pH of the mixture was maintained periodically by
adjusting the pH manually to pH 7.2. After the desired time was achieved, the reaction
was terminated by heating the mixture at 85°C for 15 min. The mixture was then
centrifuged at 10000 g for 10 min using a Sorvall rc-5b centrifuge (Dupont, Wilmington,
DE, USA) to remove the residue. The supernatant containing oil, was stored at 4°C for 2
hrs to make the top oil layer solidify for removal. The clear hydrolysates were stored at -
80°C overnight and freeze-dried. The freeze-dried powder was stored at -80°C for further
analysis.

81
4.3.6 Proximate analysis
Proximate analysis of the mixture of heads and frames was conducted. Moisture,
protein, ash and total fat content were determined by the AOAC International methods
934.01, 955.04, 942.05 and 2003.06, respectively (AOAC International, 2012). A
conversion factor of 6.25 was used for calculating the crude protein content from nitrogen
content. Protein content in hydrolysates with good functionalities were determined the
same method (method 955.04), and the protein recovery rate (%) was calculated by
dividing protein content in hydrolysates by protein content in the mixture of heads and
frames. Raw materials were placed in aluminon foil pan and dried in 105°C oven for
about 16 hours, and then stored in desiccator for further analysis. Oven dried samples
were used for protein, lipid and ash content analysis, and then calculated back to wet
weight basis.
4.3.7 Determination of the degree of hydrolysis (DH) using
trinitrobenzenesulfonic acid (TNBS) method
The degree of hydrolysis of the hydrolysates was determined according to the
method reported by Adler-Nissen (Adler-Nissen, 1979). Samples and standards were
dissolved in 1% SDS (sodium dodecyl sulfate) solution in 15 mL centrifuge tube. A
portion of 0.25 mL of the sample solution was added into a test tube, which contained 2
mL 0.02 M sodium phosphate buffer (pH 8.2). Then 2 mL of 0.1%
trinitrobenzenesulfonic acid (TNBS) was added, and the mixture incubated in the dark at
50°C for 1 hr. The reaction was terminated by acidifying with 4 mL of 0.1 N HCl. The
test tubes were allowed to stand for another 20 min to cool. The absorbance was
measured at 340 nm using Thermo Scientific Genesys 10S UV-Vis spectrophotometer

82
(Thermo Scientific, Pittsburgh, PA, USA). L-leucine (0-1 mM) was used to generate a
standard curve.
4.3.8 Kinetic analysis of hydrolysis processing
The degree of hydrolysis of the hydrolysates was plotted against hydrolysis time.
All hydrolysis curves could be described by the model established by Peleg (Peleg, 1988)
with some modifications, protease concentration was incorporated in the equation as
below.
𝐷𝐻 (𝑡) = 𝐷𝐻(0) +𝑡
𝐾1+𝐾2·1
𝐸
(4.1)
Where DH (t) (%) is the degree of hydrolysis at time t, t is the hydrolysis time (min), DH
(0) (%) is the degree of hydrolysis at time t = 0, K1 is Peleg’s rate constant and K2 is
Peleg’s capacity constant. Since DH (0) in all experimental runs was zero, the above
equation could be simplified to the following form:
𝐷𝐻 (𝑡) =𝑡
𝐾1+𝐾2·1
𝐸
(4.2)
Rate constant K1 relates to degree of hydrolysis DH (0) at the very beginning :
DH (0) =1
𝐾1 (4.3)
The capacity constant K2 relates to the maximum of degree of hydrolysis. When t → ∞,
the following equation describes the relations between the degree of hydrolysis and K2
constant:
C|t → ∞ =1
𝐾2 (4.4)
The first equation also could be transformed into a linear relationship in the following
form:

83
𝑡
𝐷𝐻(𝑡)−𝐷𝐻(0)= 𝐾1 + 𝐾2
1
𝐸 (4.5)
4.3.9 Calculated price of proteases activity and cost to reach 15 and 20% DH
Linear relationship was obtained from the above kinetic analysis. Protease activity
and the price of proteases to reach a certain degree of hydrolysis were calculated
according to the linear relationship.
4.3.10 Sodium-dodecyl-sulfate gel electrophoresis (SDS-PAGE)
Electrophoresis was performed according to the method of Laemmli (1970). All
hydrolysates were dissolved in pH 7.2 PBS in 15 mL centrifuge tube. The protein content
was adjusted to 2 mg/mL, then mixed 1:1 (v/v) mixed with the sample buffer containing
2-mercaptoethanol. Electrophoresis was carried out on a 4-25% gradient gel (13 cm x 8
cm) in a BioRad mini-Protean chamber at 60 V for 30 min, followed by 125 V for
90 min. At the end of electrophoresis, gels were stained with 0.1% Commassie Brilliant
Blue R-250 dissolved in a solution containing water, methanol and acetic acid (9:9:2,
v/v/v) for 20 min, and destained using a solution, containing water, methanol and acetic
acid (7:2:1, v/v/v) for 6 hrs. Gels were scanned by a Molecular Imager (Bio-Rad
ChemideocTM XRS+, Hercules, CA, USA), which was equipped with Image LabTM
Analysis Software (version 5.2).
4.3.11 Emulsion capacities
Emulsifying capacities and stability were determined according the previous
method (Pearce & Kinsella, 1978; Cai, Chang & Lunde, 1996). Corn oil and 30 mL of
1% protein solution were mixed together, and the pH was adjusted to 2, 4, 6, 8 and 10,
respectively. The mixture was then homogenized using a homogenizer (Model: GLH

84
580, Spindle: 10*195 mm, Omni International, Kennesaw, GA, USA) at the speed of
10000 rpm for exactly 1 min. Fifty microliters of the emulsion solution was brought to 5
mL of 0.1% SDS solution. The absorbance of the diluted solution was measured at 500
nm with a plate reader (FlexStation 3, Molecular Devices, CA, USA). The absorbance
was measured immediately after emulsion formation and 10 min after the formation. The
emulsifying activity index (EAI) and the emulsion stability index (ESI) were calculated
as the following equation (Pearce & Kinsella, 1978). Soy protein isolate (SPI) was used
as a positive standard. The soy protein isolate was obtained according to our previous
method (Xu, Mukherjee, & Chang, 2018).
EAI (m2/g) =2 ×2.303 × A500
0.25 × protein weight (g) (4.6)
ESI (min) =A0 × Δt
ΔA (4.7)
Where ∆A = A0 – A10, and ∆t = 10 min
4.3.12 Foaming capacities
Foaming capacities and stability of hydrolysates were determined according to the
previous method (Sathe & Salunkhe, 1981). Soy protein isolate (SPI) was used as for
comparison. The soy protein isolate was obtained according to our previous method (Xu,
Mukherjee, & Chang, 2018). Twenty microliters of 0.5% of sample solution were
adjusted to pH 2, 4, 6, 8 and 10, respectively, and homogenized at a speed of 16000 rpm,
using a homogenizer (Model: GLH 580, Spindle: 10*195 mm, Omni International,
Kennesaw, GA, USA) to incorporate the air for 2 min. The whipped sample was then
transferred to a 60 mL cylinder and the total volume was read after 30 s. The foaming
capacity was calculated according to the following equation (Sathe & Salunkhe, 1981):

85
Foaming capacity (%) =𝐴−𝐵
A × 100 (4.8)
Where A is the volume after whipping (mL), B is the volume before whipping (mL).
The whipped sample was allowed to stand at 20 °C for 3 min and the volume of whipped
sample was then recorded. Foam stability was calculated as follows. The foaming
stability was calculated according to the following equation (Sathe & Salunkhe, 1981):
Foaming stability (%) =𝐴−𝐵
A × 100 (4.9)
Where A is the volume after whipping (mL), B is the volume before whipping (mL).
4.3.13 Oxygen radical absorbing capacity (ORAC) of selected hydrolysates
A plate reader (Molecular Devices, CA, USA) equipped with adjustable
fluorescence filters and incubator was used. The ORAC assay was conducted using our
published method (Prior, Wu, & Schaich, 2005; Tan, Chang & Zhang, 2017). In brief,
Hydrolysates were diluted with phosphate buffer (75 mM, pH 7.0) to the appropriate
concentration to fall within the linear range of the standard curve. Twenty microliters of
diluted hydrolysates, trolox, and blank were mixed with 200 µL pre-headed fluorescein
solution. The 96-well plate was then incubated in plate reader for 30 min at 37 oC.
Twenty microliters of 2, 2’-Azobis(2-methylpropionamidine) dihydrochloride (AAPH)
solution was added to initiate the reaction after 30 min achieved. The excitation and
emission wavelengths were set as 485 and 520 nm, respectively. The kinetic readings
were recorded for 60 cycles with 40 seconds for each cycle. The kinetics of the
fluorescence changes were recorded immediately using software SoftMax Pro (Molecular
Devices, Sunnyvale, CA, USA). The ORAC value was calculated and expressed as

86
micromoles of Trolox equivalent per gram hydrolysates (µmol of trolox equivalent/g)
using the standard curve of Trolox.
4.3.14 Radical DPPH scavenging activity of selected hydrolysates
DPPH-free scavenging capacity of selected hydrolysates was determined
according to our previous method (Chen & Ho, 1995; Tan, Chang, & Zhang, 2017).
Twenty microliters of hydrolysates with appropriate dilutions were mixed well with 380
µL of 0.1 mM DPPH solution. The mixtures were allowed to stand at the room
temperature in the dark for 30 min. Two-hundred microliters of the mixture were added
into a 96-well plate, the absorbance was measured with a plate reader at 517 nm against
an ethanol blank. The free radical scavenging activity of the samples was expressed as
micromoles of Trolox equivalents per gram dry hydrolysates (μmol TE/g).
4.3.15 Angiotensin-converting enzyme (ACE) inhibition assay
Hydrolysates under different hydrolysis conditions were selected for ACE
inhibition assay. The ACE inhibition assay was performed according to the published
method (Wu & Ding, 2002; Zhang, Pechan, & Chang, 2018). In brief, 60 μL of ACE (10
mU/mL) dissolved in borate buffer (containing 300 mM NaCl, pH 8.3) was mixed well
with 30 μL of sample or water (for control) and stand at room temperature for 10 min.
Aliquot 60 μL of 2.5 mM hippuryl-histidyl-leucine (HHL) in the borate buffer to initiate
the reaction, and stand for 30 min at 37°C. The reaction was terminated by heating up at
85°C for 15 min. The reaction mixture was filtered through 20 um nylon syringe filter
before HPLC analysis. Hippuric acid (HA) was separated and quantified by Agilent 1260
Infinity HPLC system (Agilent Technologies, Santa Clara, CA, USA). Agilent Exlipse

87
XDB-C18 column (4.6 × 150 mm; particle size 5 µm; Agilent Technologies, Rising Sun,
MD, USA) was used and the wavelength of diode array detector (DAD) was set at
228 nm. Mobile phases solvent A (0.1% trifluoroacetic acid in water) and solvent B
(0.1% trifluoroacetic acid in acetonitrile). The elution gradient was as follow: 0–10 min,
5–60% B; 10–12 min, 60% B; 12–13 min, 60–5% B. The percentage of ACE inhibition
was calculated according to the following equation:
% inhibition = 100 – [100×(HAsample/HAcontrol)] (4.10)
where HAsample represents the content of HA when inhibitor was present;
HAcontrol represents the content of HA when inhibitor was replaced by water. The
IC50 value was defined as the concentration to inhibit 50% ACE activity and was
calculated by GraphPad Prism software based on four concentrations. Captopril was used
as positive control.
4.3.16 DPP-IV inhibition assay
This assay was carried out by using a DPP-IV inhibitor screening kit (Sigma-
Aldrich, St. Louis, MO) in accordance with the manufacture’s instruction. In brief, mix
the appropriate diluted sample solution (49 μL) with 1 μL of DPP-IV enzyme solution
and incubate at 37°C for 10 min (protect it from light). After 10 min, substrate was added
into the mixture to initiate the reaction. Measure the fluorescence (excitation wavelength
= 360, and emission wavelength = 460 nm) in a microplate reader in kinetic mode for 20
minutes at 37 °C. To correct for background in samples, include a sample blank by
omitting the DPP-IV Enzyme. Two-time points in the linear range of the plot was chose
and obtain the slope between T1 and T2. The relative inhibition rate was calculated by
the following equation:

88
Slope = (FLU2-FLU1)/(T2-T1) (4.11)
Relative inhibition rate (%) =SlopeEC−SlopeEM
SlopeEC (4.12)
where: SlopeSM = the slope of the Sample Inhibitor; SlopeEC = the slope of the Enzyme
Control. The IC50 value was defined as the concentration to inhibit 50% DPP-IV activity
and was calculated by GraphPad Prism software based on four concentrations. Sitagliptin
was used as positive control.
4.3.17 Statistical analysis
All the experiments were carried out based on a completely randomized design.
Hydrolysis processing was performed in triplicate. Data were analyzed by ANOVA using
2015 SAS (version 9.4, SAS Inc., Cary, NC, USA). Duncan’s multiple range test was
carried out to determine any significant differences (p = 0.05) between variables.
4.4 Results and discussion
4.4.1 Proximate analysis
Proximate analysis of the mixture of heads and frames was carried out. The
moisture, protein, total fat, and ash content of the mixture were 60.70%, 14.85%, 12.09%,
and 7.98%, respectively. The results indicated that the mixture of heads and frames
contains over 37% of protein (dry weight basis) which could be processed into value-
added food ingredients. Oven dried samples were used for protein, lipid and ash content
analysis, and then calculated back to wet weight basis. Because oven dried samples were
used for protein, lipid and ash content analysis, and the dried samples may have absorbed
moisture after drying. Therefore, the protein, lipid and ash content of dry weight basis did

89
not come to 100%. However, when calculated back to wet weight basis, the total number
is closer to 100%.
Table 4.1 Proximate analysis of the mixture of catfish heads and frames (w:w=3:2).
Samples Moisture (%) Protein (%) Lipid (%) Ash (%)
Mixture 60.70% ± 0.50% 14.85% ± 0.12% 12.09% ± 0.23% 7.98% ± 0.17%
Data were expressed as mean ± standard deviation (n=3). Protein, lipid and ash content
were based on wet weight basis.
4.4.2 Determination of proteolytic activity by using Azocoll and Azocasein as
substrate
Proteolytic activity of eight proteases are shown in Table 4.2. The proteolytic
activity of each protease was determined by two different methods, and the correlation
analysis of the two proteolytic activities was performed. The proteolytic activity of each
protease varied significantly, which was not surprising because that the proteases are
expected to have different proteolytic activity if the proteases are derived from different
sources. Papain, ficin and bromelain are all derived from plant sources; however, the rest
of the proteases used in this study are derived from bacteria. Thermolysin possessed the
highest proteolytic activity per g on AzocollTM and Azocasein at 70°C, followed by novo-
pro D at 60°C. The correlation between the two proteolytic activities determined by the
two different methods was 0.97, which suggesting that the two different substrate
methods did not vary significantly. However, proteases sensitivity towards these two
substrates was different, with 4 proteases having higher activities with azocasein and vice
versa. Protease activity cost of each protease is shown in Table 4.2, alcalase at 60°C
could provide 1,369,403 Azocoll unit per dollar, and followed by 1,257,669 Azocoll unit
per dollar provided by thermolysin at 70°C. The enzyme cost could provide economic

90
information for the processing industries on the basis of proteolytic activity, which is
very important as a part of the investment for the industries.
Proteases had been used based on a weight basis as reported in most of the protein
hydrolysis studies (Cai, Chang, & Lunde, 1996; Cheung & Li-Chan, 2017; Klompong,
Benjakul, Kantachote, & Shahidi, 2007; Nilsang, Lertsiri, Suphantharika, & Assavanig,
2005; Salampessy, Reddy, Phillips, & Kailasapathy, 2017). However, comparing the
protease hydrolysis on a weight basis gives little meaningful information on the
efficiency of proteases for hydrolysis. In some of the studies, which reported the protease
in enzyme unit, proteolytic activity was provided by the manufacturers (Benjakul &
Morrissey, 1997) instead of determining the proteolytic activities under the same working
conditions prior to the hydrolysis analyze experiments. In addition, literature reported
proteolytic activities were determined at different conditions and using different
substrates. Different hydrolysis conditions usually lead to different proteolytic activity,
and substrate specificity influences the protease efficiency as well. These made
comparing the results from the literature very difficult. Therefore, it is very important to
investigate and compare proteolytic activity under the same hydrolysis conditions.
Among reported publications, only two groups of researchers had reported the use of
AzocollTM to standardize proteolytic activity for salmon muscle protein hydrolysis and
comparing five proteases at the same activity level. However, our study is the first to use
both Azocoll and Azocasein as substrates to determine proteolytic activities. Even though
there are some limitations for using Azocoll and Azocasein as standard substrates, it is
convenient to get proximate activity of proteases in order to obtain references for

91
protease addition. In any rate, presenting protease activity is more accurate and repeatable
than comparing proteases on the weight basis.

92
Tab
le 4
.2
Act
ivit
y a
nd c
ost
of
eig
ht
types
of
pro
teas
es.
Enzym
es
Tem
per
ature
(°C
)
Act
ivit
y
(Azo
coll U
/g o
r
mL
)
Act
ivit
y
(Azo
case
in U
/g o
r
mL
)
Co
rrel
atio
n
coef
ficie
nt
(R2)
Enzym
e co
st
($/g
or
mL
)
Act
ivit
y c
ost
(Azo
coll U
/$)
Pap
ain
30
8048 ±
45
x
34508 ±
1618
t
0.9
6
1.3
0*
6191
40
14712 ±
120
v
60849 ±
929
r 11317
50
18060 ±
369
s 74178 ±
1315
o
13892
60
22276 ±
452
r 81092 ±
6954
n
17135
Fic
in
30
3525 ±
21
b*
94259 ±
2625
m
3.1
5*
1119
40
4109 ±
23
z 210306 ±
2496
h
1304
50
7371 ±
53
y
424508 ±
13599
f 2340
60
15062 ±
480
u
677876 ±
13082
e 4781
Bro
mela
in
30
2942 ±
34
e*
61120 ±
1204
q
3.4
5*
853
40
3274 ±
37
d*
103617 ±
7229
l 949
50
3700 ±
34
a*
221963 ±
13599
g
1072
60
3414 ±
29
c*
161467 ±
3442
i 990
Ther
mo
lysi
n
40
1.9
×10
8 ±
123
d
7.4
×10
5 ±
41313
d
652
*
291411
659509
1180982
1257669
50
4.3
×10
8 ±
225
c 1.7
×10
6 ±
58527
c
60
7.7
×10
8 ±
687
b
4.6
×10
6 ±
240996
b
70
8.2
×10
8 ±
105
a 5.6
×10
6 ±
471664
a
Neu
tras
e
30
10450 ±
17
w
1359 ±
10
b*
0.9
5/m
L
217708
40
16875 ±
178
t 2634 ±
20
a*
351562
50
27737 ±
70
p
3817 ±
117
y
577854
60
2700 ±
52
f*
1225 ±
99
c*
56250
Alc
ala
se
30
35562 ±
88
o
3369 ±
210
z
0.6
7/m
L
1045941
40
247875 ±
530
j
8711 ±
275
w
367762
50
707333 ±
367
g
33029 ±
2771
u
105572
60
917500 ±
701
f 53594 ±
8710
s 1369403
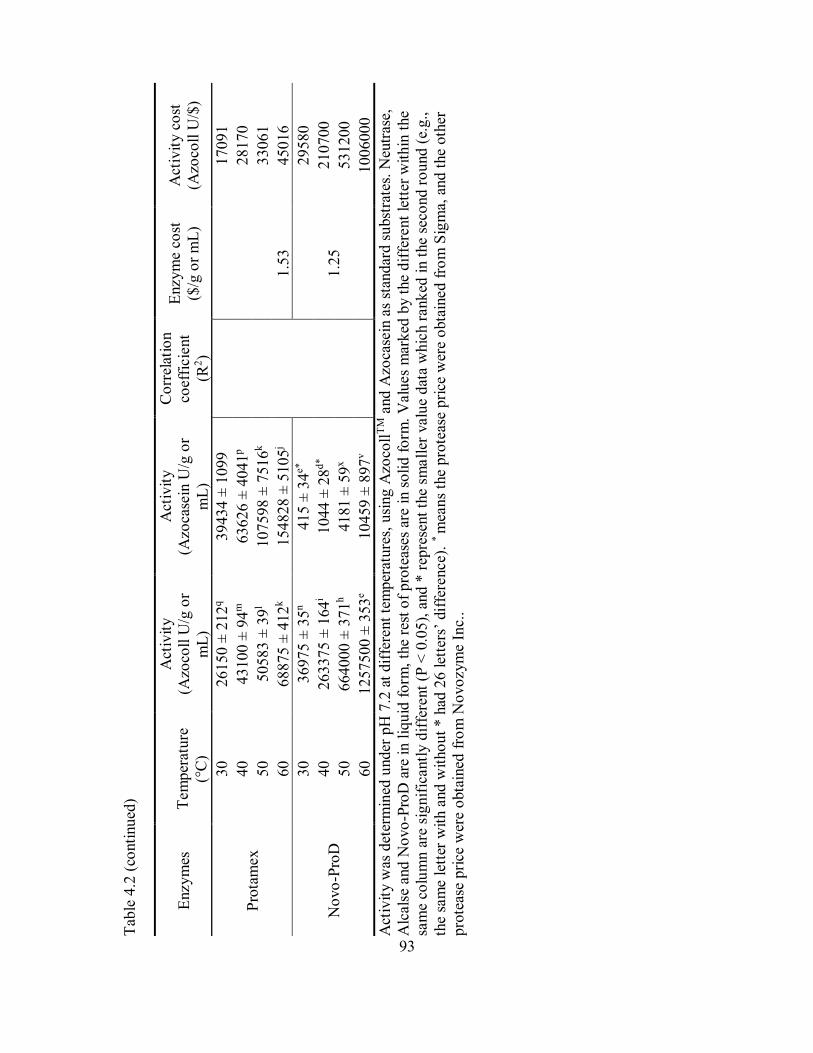
93
Tab
le 4
.2 (
conti
nued
)
Enzym
es
Tem
per
ature
(°C
)
Act
ivit
y
(Azo
coll U
/g o
r
mL
)
Act
ivit
y
(Azo
case
in U
/g o
r
mL
)
Co
rrel
atio
n
coef
ficie
nt
(R2)
Enzym
e co
st
($/g
or
mL
)
Act
ivit
y c
ost
(Azo
coll U
/$)
Pro
tam
ex
30
26150 ±
212
q
39434 ±
1099
1.5
3
17091
40
43100 ±
94
m
63626 ±
4041
p
28170
50
50583 ±
39
l 107598 ±
7516
k
33061
60
68875 ±
412
k
154828 ±
5105
j 45016
No
vo
-Pro
D
30
36975 ±
35
n
415 ±
34
e*
1.2
5
29580
40
263375 ±
164
i 1044 ±
28
d*
210700
50
664000 ±
371
h
4181 ±
59
x
531200
60
1257500 ±
353
e 10459 ±
897
v
1006000
Act
ivit
y w
as d
eter
min
ed u
nder
pH
7.2
at
dif
fere
nt
tem
per
ature
s, u
sing A
zoco
llT
M a
nd A
zoca
sein
as
stan
dar
d s
ubst
rate
s. N
eutr
ase,
Alc
als
e and N
ovo
-Pro
D a
re i
n l
iqu
id f
orm
, th
e re
st o
f pro
teas
es a
re i
n s
oli
d f
orm
. V
alu
es
mar
ked
by t
he
dif
fere
nt
lett
er w
ithin
the
sam
e co
lum
n a
re s
ignif
icantl
y d
iffe
rent
(P <
0.0
5),
and *
rep
rese
nt
the
sma
ller
valu
e dat
a w
hic
h r
ank
ed i
n t
he
seco
nd r
ound (
e.g.,
the
sam
e le
tter
wit
h a
nd w
itho
ut
* h
ad 2
6 let
ters
’ dif
fere
nce)
. * m
eans
the
pro
teas
e pri
ce w
ere
obta
ined f
rom
Sig
ma,
and t
he
oth
er
pro
teas
e pri
ce w
ere
obta
ined
fro
m N
ovo
zym
e In
c..

94
4.4.3 Degree of hydrolysis of catfish protein hydrolysates
Degree of hydrolysis is a vital index for hydrolysis processing since it influences
product yield, protein recovery rate and functional properties of the resulting
hydrolysates. In Table 4.2, the proteolytic activity based on AzocollTM was determined at
different temperatures. Protease concentrations were adjusted to 5, 10, 25, 40 and 80 AzU
per gram of protein in fish paste (protein content was determined by the Kjeldahl method)
for the hydrolysis reaction. Thermolysin had the highest activity (8.2×10⁸ Azocoll U/g
and 5.6×10⁶ Azocasein U/g) at 70 °C when using AzocollTM and Azocasein as the
substrates. Figure 4.1-4.8 showed the degree of hydrolysis curve for the eight proteases
(papain, ficin, bromelain, neutrase, alcalase, protamex, novo-proD and thermolysin)
applied at different proteolytic activities under different temperatures. Overall, proteases
derived from plant sources give higher degree of hydrolysis (range from 40-70%) than
that from the bacteria sources (range from 10-30%). Degree of hydrolysis exhibited a
sharp increase in the first 10 min and reached to a relative plateau-like pattern after 20
min. This observation was similar to most of the protein hydrolysis studies (Benjakul &
Morrissey, 1997; Klompong, Benjakul, Kantachote, & Shahidi, 2007; Kristinsson &
Rasco, 2000b; Rebeca, Pena-Vera, & Diaz-Castaneda, 1991; Shahidi, Han, &
Synowiecki, 1995), where the degree of hydrolysis increased rapidly in the first stage of
hydrolysis, and kept a slow increasing rate to reach a stable stage. The degree of
hydrolysis varied from 10% to 30% in most of the reported protein hydrolysis studies.
DH of 15.7% was observed when hydrolyzing the protein from defatted sunflower meal
with papain (Cai, Chang, & Lunde, 1996); DH of 32.9% was reported when hydrolyzing

95
the leather jacket insoluble protein with bromelain (Salampessy, Phillips, Seneweera, &
Kailasapathy, 2010).
The maximum DH of alcalase and novo-pro D were reported as 15-25% at
optimal pH and temperature, and 10%-20% for neutrase and protamex (Þorkelsson &
Kristinsson, 2009). In our study (Figure 4.1 to 4.8), the maximum DH of each protease
derived from bacteria was around 25%; however, proteases from plant sources produced
over 50% of DH in the current study. The highest degree of hydrolysis of hydrolysates
was observed in 120 min and at the highest enzyme concentration (80 AzU/g) for each
protease. Ficin (80 AzU/g) was the most efficient in hydrolyzing the catfish by-product,
reaching 71% DH (degree of hydrolysis) in 120 min at 30°C among all the enzymes
studied. However, the highest DH of alcalase hydrolysates was 16.48%, achieved in 120
min at 40°C. The above proteases behaved differently even at the same AzocollTM
activity, which suggesting that protease specific reaction sites on the catfish protein
chains were different from the analytical substrate. Kristinsson and Rasco (2000b)
observed similar results in their study of the hydrolysis of salmon muscle with 5
proteases (alcalase, flavourzyme, corolase PN-L, corolase 7098 and pyloric caeca
extract). This might be due to the substrate specificity differences.

96
Fig
ure
4.1
E
nzym
atic
hydro
lysi
s o
f ca
tfis
h b
y-p
roduct
(m
ixtu
re o
f fr
am
es a
nd h
eads)
wit
h p
apain
under
dif
fere
nt
tem
per
ature
and v
aryin
g a
ctiv
ity u
nit
s (A
zU/g
of
pro
tein
in s
ubst
rate
).
0102030405060
02
04
060
801
00
12
01
40
Degree of hydrolysis (%)
Tim
e (m
in)
Pap
ain
30
°C
5 A
zU10
AzU
25 A
zU40
AzU
80 A
zU
010
20
30
40
50
02
04
06
08
01
00
12
01
40
Degree of hydrolysis (%)
Tim
e (m
in)
Pap
ain
40°
C
5 A
zU10
AzU
25 A
zU40
AzU
80 A
zU
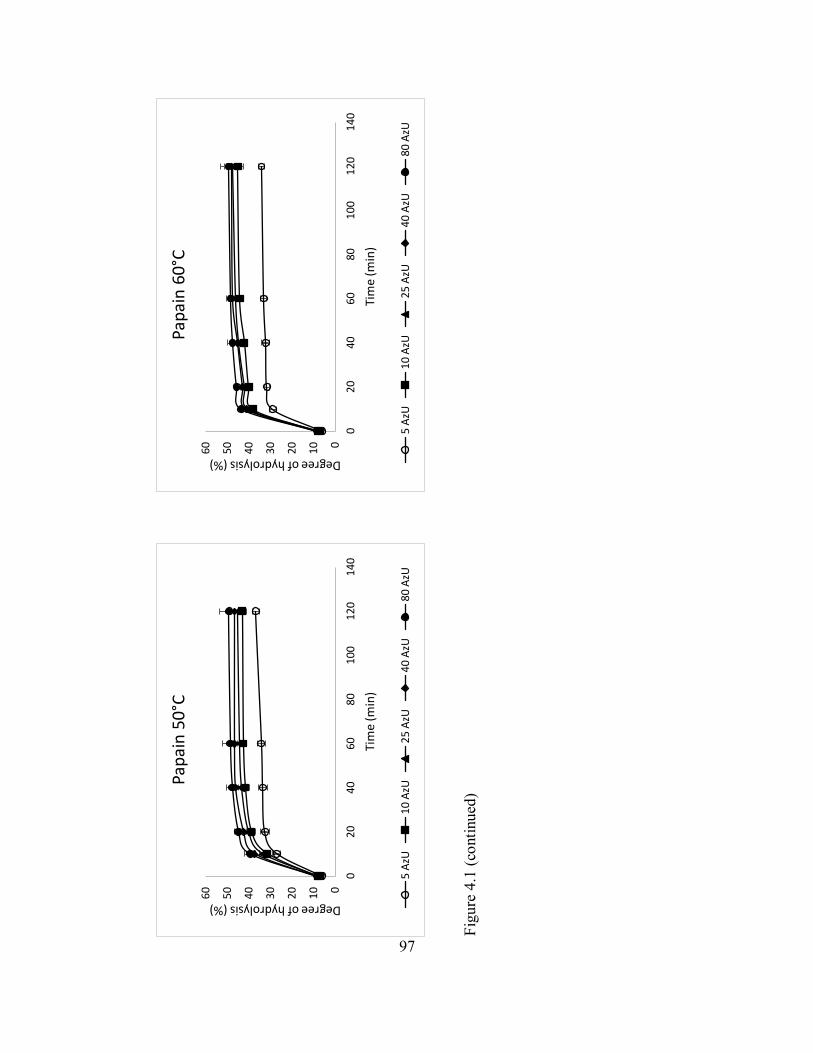
97
Fig
ure
4.1
(co
nti
nued
)
010
20
30
40
50
60
02
04
060
801
00
12
01
40
Degree of hydrolysis (%)
Tim
e (m
in)
Pap
ain
50
°C
5 A
zU10
AzU
25 A
zU40
AzU
80 A
zU
010
20
30
40
50
60
02
04
06
08
01
00
12
01
40
Degree of hydrolysis (%)
Tim
e (m
in)
Pap
ain
60
°C
5 A
zU10
AzU
25 A
zU40
AzU
80 A
zU

98
Fig
ure
4.2
E
nzym
e hydro
lysi
s o
f ca
tfis
h b
y-p
roduct
(m
ixtu
re o
f fr
am
es a
nd h
eads)
wit
h f
icin
under
dif
fere
nt
tem
per
ature
and
var
yin
g a
ctiv
ity u
nit
s (A
zU/g
of
pro
tein
in s
ubst
rate
).
020406080100
02
04
060
80
10
01
20
14
0
Degree of hydrolysis (%)
Tim
e (m
in)
Fici
n 3
0°C
5 A
zU10
AzU
25 A
zU40
AzU
80 A
zU
010
20
304050
60
70
80
02
04
06
08
01
00
12
01
40
Degree of hydrolysis (%)
Tim
e (m
in)
Fici
n 4
0°C
5 A
zU10
AzU
25 A
zU40
AzU
80 A
zU

99
Fig
ure
4.2
(co
nti
nued
)
010
20
304050
60
70
80
02
04
060
801
00
12
01
40
Degree of hydrolysis 9%)
Tim
e (m
in)
Fici
n 5
0°C
5 A
zU10
AzU
25 A
zU40
AzU
80 A
zU
010
20
304050
60
70
80
02
04
06
08
01
00
12
01
40
Degree of hydrolysis (%)
Tim
e (m
in)
Fici
n 6
0°C
5 A
zU10
AzU
25 A
zU40
AzU
80 A
zU

100
Fig
ure
4.3
E
nzym
e hydro
lysi
s o
f ca
tfis
h b
y-p
roduct
(m
ixtu
re o
f fr
am
es a
nd h
eads)
wit
h b
rom
ela
in u
nder
dif
fere
nt
tem
per
ature
and v
aryin
g a
ctiv
ity u
nit
s (A
zU/g
of
pro
tein
in s
ubst
rate
).
010
20
30
40
50
60
70
02
04
060
801
00
12
01
40
Degree of hydrolysis (%)B
rom
ela
in 3
0°C
5 A
zU10
AzU
25 A
zU40
AzU
80 A
zU
010
20
30
40
50
60
70
02
04
06
08
01
00
12
01
40
Degree of hydrolysis (%)
Tim
e (m
in)
Bro
mel
ain
40
°C
5 A
zU1
0 A
zU25
AzU
40 A
zU80
AzU
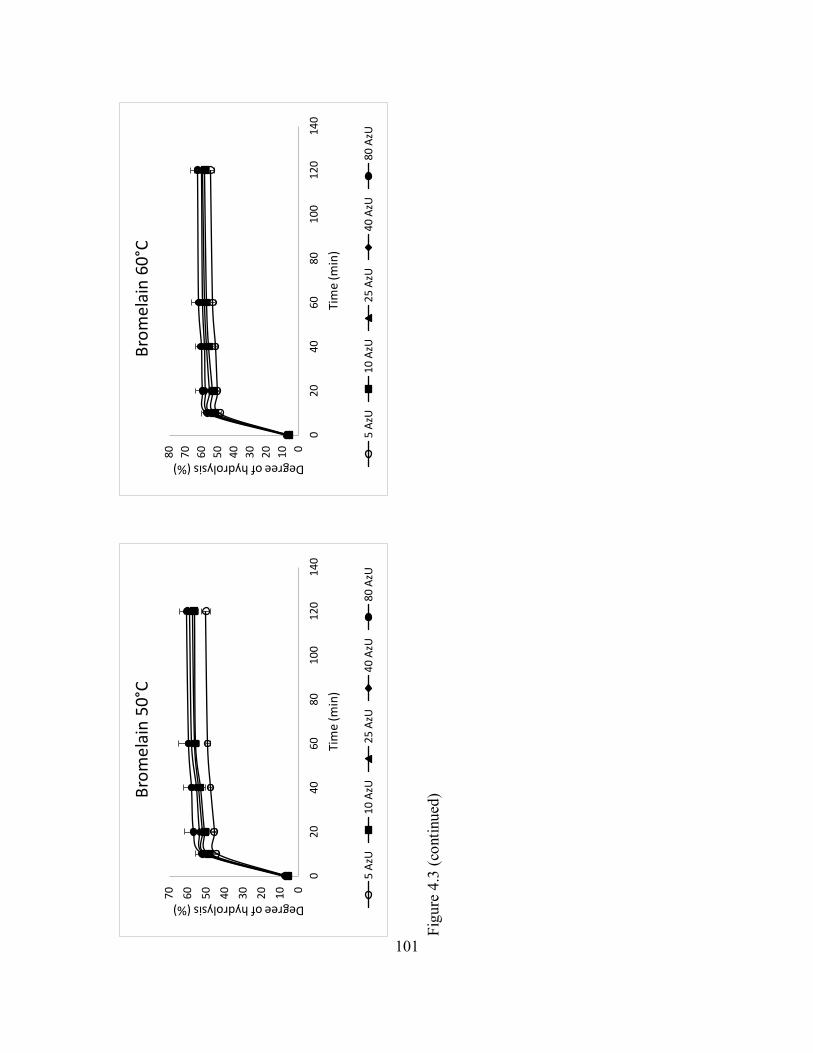
101
Fig
ure
4.3
(co
nti
nued
)
010
20
30
40
50
60
70
02
04
060
801
00
12
01
40
Degree of hydrolysis (%)
Tim
e (m
in)
Bro
me
lain
50°
C
5 A
zU10
AzU
25 A
zU40
AzU
80 A
zU
010
20
304050
60
70
80
02
04
06
08
01
00
12
01
40
Degree of hydrolysis (%)
Tim
e (m
in)
Bro
mel
ain
60
°C
5 A
zU1
0 A
zU25
AzU
40 A
zU80
AzU

102
Fig
ure
4.4
E
nzym
e hydro
lysi
s o
f ca
tfis
h b
y-p
roduct
(m
ixtu
re o
f fr
am
es a
nd h
eads)
wit
h n
eutr
ase
under
dif
fere
nt
tem
per
ature
and v
aryin
g a
ctiv
ity u
nit
s (A
zU/g
of
pro
tein
in s
ubst
rate
).
051015202530
02
04
060
801
00
12
01
40
Degree of hydrolysis 9%)
Tim
e (m
in)
Neu
tras
e 30
°C
5 A
zU10
AzU
25 A
zU40
AzU
80 A
zU
0510
15
20
25
30
35
02
04
06
08
01
00
12
01
40
Degree of hydrolysis (%)
Tim
e (m
in)
Neu
tras
e 4
0°C
5 A
zU1
0 A
zU25
AzU
40 A
zU80
AzU

103
Fig
ure
4.4
(co
nti
nued
)
0510
15
20
25
30
35
02
04
060
801
00
12
01
40
Degree of hydrolysis (%)
Tim
e (m
in)
Neu
tras
e 50
°C
5 A
zU10
AzU
25 A
zU40
AzU
80 A
zU
051015202530
02
04
06
08
01
00
12
01
40
Degree of hydrolysis (%)
Tim
e (m
in)
Neu
tras
e 6
0°C
5 A
zU1
0 A
zU25
AzU
40 A
zU80
AzU
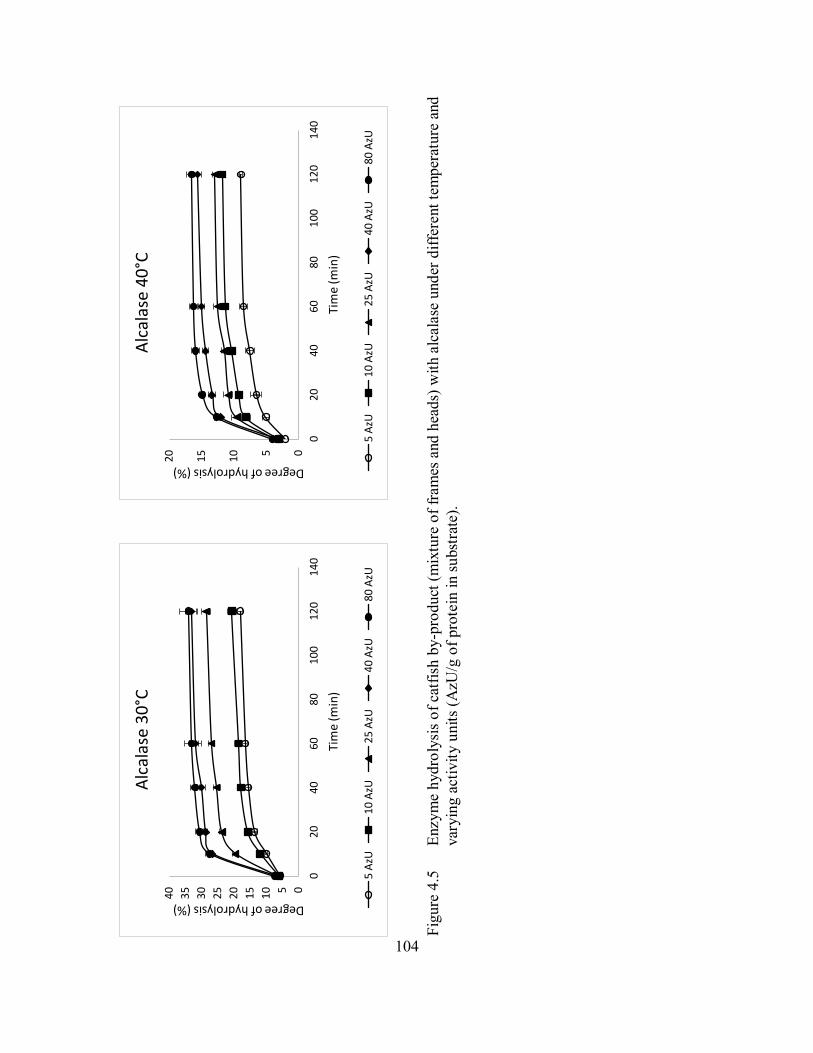
104
Fig
ure
4.5
E
nzym
e hydro
lysi
s o
f ca
tfis
h b
y-p
roduct
(m
ixtu
re o
f fr
am
es a
nd h
eads)
wit
h a
lcala
se u
nd
er d
iffe
rent
tem
per
ature
and
var
yin
g a
ctiv
ity u
nit
s (A
zU/g
of
pro
tein
in s
ubst
rate
).
0510
152025
30
35
40
02
04
060
801
00
12
01
40
Degree of hydrolysis (%)
Tim
e (m
in)
Alc
alas
e 30
°C
5 A
zU10
AzU
25 A
zU40
AzU
80 A
zU
051015
20
02
04
06
08
01
00
12
01
40
Degree of hydrolysis (%)
Tim
e (m
in)
Alc
alas
e 4
0°C
5 A
zU10
AzU
25 A
zU40
AzU
80 A
zU

105
Fig
ure
4.5
(co
nti
nued
)
051015202530
02
04
060
801
00
12
01
40
Degree of hydrolysis (%)
Tim
e (m
in)
Alc
alas
e 50
°C
5 A
zU10
AzU
25 A
zU40
AzU
80 A
zU
051015202530
02
04
06
08
01
00
12
01
40
Degree of hydrolysis (%)
Tim
e (m
in)
Alc
alas
e 6
0°C
5 A
zU10
AzU
25 A
zU40
AzU
80 A
zU

106
Fig
ure
4.6
E
nzym
e hydro
lysi
s o
f ca
tfis
h b
y-p
roduct
(m
ixtu
re o
f fr
am
es a
nd h
eads)
wit
h p
rota
mex u
nder
dif
fere
nt
tem
per
ature
and v
aryin
g a
ctiv
ity u
nit
s (A
zU/g
of
pro
tein
in s
ubst
rate
).
051015202530
02
04
060
801
00
12
01
40
Degree of hydrolysis (%)
Tim
e (m
in)
Pro
taM
ex 3
0°C
5 A
zU10
AzU
25 A
zU40
AzU
80 A
zU
051015202530
02
04
06
08
01
00
12
01
40
Degree of hydrolysis (%)
Tim
e (m
in)
Pro
taM
ex 4
0°C
5 A
zU1
0 A
zU25
AzU
40 A
zU80
AzU

107
Fig
ure
4.6
(co
nti
nued
)
0510
15
20
25
30
35
02
04
060
801
00
12
01
40
Degree of hydrolysis (%)
Tim
e (m
in)
Pro
taM
ex 5
0°C
5 A
zU10
AzU
25 A
zU40
AzU
80 A
zU
0510
15
20
25
02
04
06
08
01
00
12
01
40
Degree of hydrolysis (%)
Tim
e (m
in)
Pro
taM
ex 6
0°C
5 A
zU1
0 A
zU25
AzU
40 A
zU80
AzU

108
Fig
ure
4.7
E
nzym
e hydro
lysi
s o
f ca
tfis
h b
y-p
roduct
(m
ixtu
re o
f fr
am
es a
nd h
eads)
wit
h N
ovo
-Pro
D u
nder
dif
fere
nt
tem
per
ature
and v
aryin
g a
ctiv
ity u
nit
s (A
zU/g
of
pro
tein
in s
ubst
rate
).
0510
15
20
25
30
35
02
04
060
801
00
12
01
40
Degree of hydrolysis (%)
Tim
e (m
in)
No
vo-P
roD
30
°C
5 A
zU10
AzU
25 A
zU40
AzU
80 A
zU
0510
15
20
25
02
04
06
08
01
00
12
01
40
Degree of hydrolysis (%)
Tim
e (m
in)
No
vo-P
roD
40
°C
5 A
zU10
AzU
25 A
zU40
AzU
80 A
zU

109
Fig
ure
4.7
(co
nti
nued
)
0510
15
20
25
02
04
060
801
00
12
01
40
Degree of hydrolysis (%)
Tim
e (m
in)
No
vo-P
roD
50
°C
5 A
zU10
AzU
25 A
zU40
AzU
80 A
zU
0510
15
20
25
02
04
06
08
01
00
12
01
40
Degree of hydrolysis (%)
Tim
e (m
in)
No
vo-P
roD
60
°C
5 A
zU10
AzU
25 A
zU40
AzU
80 A
zU

110
Fig
ure
4.8
E
nzym
e hydro
lysi
s o
f ca
tfis
h b
y-p
roduct
(m
ixtu
re o
f fr
am
es a
nd h
eads)
wit
h t
her
mo
lysi
n u
nder
dif
fere
nt
tem
per
ature
and v
aryin
g a
ctiv
ity u
nit
s (A
zU/g
of
pro
tein
in s
ubst
rate
).
051015202530
02
04
060
801
00
12
01
40
Degree of hydrolysis (%)
Tim
e (m
in)
Ther
mo
lysi
n 4
0°C
5 A
zU10
AzU
25 A
zU40
AzU
80 A
zU
0510
15
20
25
30
35
02
04
06
08
01
00
12
01
40
Degree of hydrolysis (%)
Tim
e (m
in)
Ther
mo
lysi
n 5
0°C
5 A
zU10
AzU
25 A
zU40
AzU
80 A
zU

111
Fig
ure
4.8
(co
nti
nued
)
0510
15
20
25
30
35
02
04
060
801
00
12
01
40
Degree of hydrolysis (%)
Tim
e (m
in)
Ther
mo
lysi
n 6
0°C
5 A
zU10
AzU
25 A
zU40
AzU
80 A
zU
0510
152025
30
35
40
02
04
06
08
01
00
12
01
40
Degree of hydrolysis (%)
Tim
e (m
in)
Ther
mo
lysi
n 7
0°C
5 A
zU10
AzU
25 A
zU40
AzU
80 A
zU
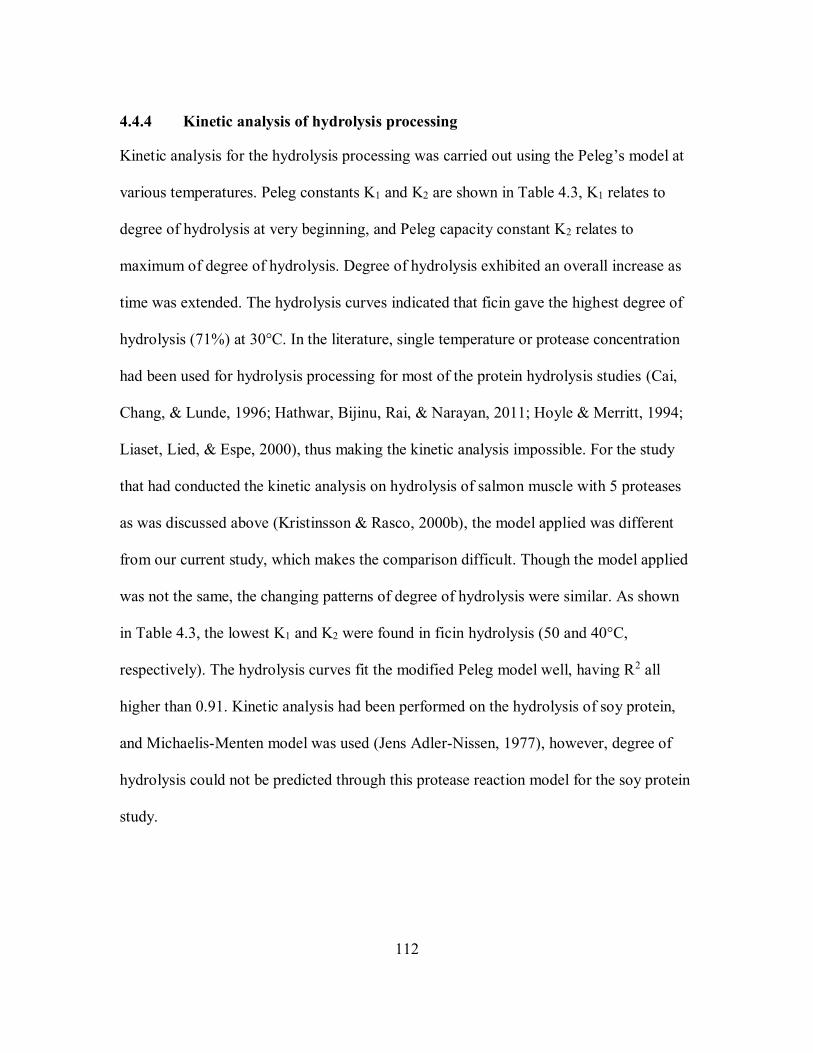
112
4.4.4 Kinetic analysis of hydrolysis processing
Kinetic analysis for the hydrolysis processing was carried out using the Peleg’s model at
various temperatures. Peleg constants K1 and K2 are shown in Table 4.3, K1 relates to
degree of hydrolysis at very beginning, and Peleg capacity constant K2 relates to
maximum of degree of hydrolysis. Degree of hydrolysis exhibited an overall increase as
time was extended. The hydrolysis curves indicated that ficin gave the highest degree of
hydrolysis (71%) at 30°C. In the literature, single temperature or protease concentration
had been used for hydrolysis processing for most of the protein hydrolysis studies (Cai,
Chang, & Lunde, 1996; Hathwar, Bijinu, Rai, & Narayan, 2011; Hoyle & Merritt, 1994;
Liaset, Lied, & Espe, 2000), thus making the kinetic analysis impossible. For the study
that had conducted the kinetic analysis on hydrolysis of salmon muscle with 5 proteases
as was discussed above (Kristinsson & Rasco, 2000b), the model applied was different
from our current study, which makes the comparison difficult. Though the model applied
was not the same, the changing patterns of degree of hydrolysis were similar. As shown
in Table 4.3, the lowest K1 and K2 were found in ficin hydrolysis (50 and 40°C,
respectively). The hydrolysis curves fit the modified Peleg model well, having R2 all
higher than 0.91. Kinetic analysis had been performed on the hydrolysis of soy protein,
and Michaelis-Menten model was used (Jens Adler-Nissen, 1977), however, degree of
hydrolysis could not be predicted through this protease reaction model for the soy protein
study.

113
Table 4.3 Hydrolysis kinetics of 8 enzymes at different temperatures and enzyme
concentrations.
Temperature (°C) Hydrolysis time (min) K1 K2 R2
Papain 30 10 0.38 0.80 0.93
20 0.58 0.73 0.95
40 0.95 1.69 0.94
60 1.41 1.98 0.99
120 2.77 3.76 0.99
40 10 0.37 0.93 0.99
20 0.66 1.58 0.97
40 1.21 3.53 0.99
60 1.72 4.51 0.98
120 3.35 8.99 0.99
50 10 0.33 0.79 0.93
20 0.55 1.01 0.96
40 0.99 2.27 0.99
60 1.46 3.24 0.98
120 2.94 4.77 0.97
60 10 0.27 0.78 0.96
20 0.52 1.25 0.97
40 0.98 2.58 0.96
60 1.40 3.77 0.94
120 2.74 7.07 0.94
Ficin 30 10 0.19 0.09 0.91
20 0.33 0.15 0.95
40 0.62 0.33 0.91
60 0.93 0.35 0.91
120 1.80 0.44 0.93
40 10 0.19 0.08 0.97
20 0.35 0.23 0.91
40 0.67 0.48 0.92
60 0.99 0.44 0.93
120 1.95 0.80 0.97
50 10 0.18 0.10 0.94
20 0.36 0.18 0.98
40 0.69 0.37 0.98
60 1.04 0.42 0.95
120 2.03 0.72 0.92

114
Table 4.3 (continued)
Temperature (°C) Hydrolysis time (min) K1 K2 R2
Ficin 60 10 0.21 0.09 0.97
20 0.36 0.09 0.98
40 0.69 0.11 0.95
60 1.01 0.12 0.94
120 1.97 0.30 0.96
Bromelain 30 10 0.23 0.11 0.97
20 0.43 0.23 0.94
40 0.83 0.34 0.97
60 1.22 0.30 0.99
120 2.38 0.79 0.91
40 10 0.22 0.34 0.99
20 0.43 0.59 0.99
40 0.83 1.18 0.99
60 1.21 1.49 0.99
120 2.38 2.82 0.99
50 10 0.22 0.18 0.98
20 0.41 0.46 0.95
40 0.79 0.79 0.95
60 1.13 1.15 0.93
120 2.23 2.19 0.94
60 10 0.20 0.15 0.98
20 0.39 0.33 0.94
40 0.76 0.57 0.98
60 1.11 0.77 0.96
120 2.18 1.42 0.97
Neutrase 30 10 0.81 12.40 0.97
20 1.63 14.03 0.92
40 2.90 28.75 0.94
60 3.70 45.12 0.96
120 7.69 65.62 0.93
40 10 0.79 2.76 0.92
20 1.25 4.92 0.99
40 2.02 8.77 0.99
60 2.67 12.58 0.99
120 5.20 21.13 0.98

115
Table 4.3 (continued)
Temperature (°C) Hydrolysis time (min) K1 K2 R2
50 10 0.62 4.93 0.96
20 1.16 2.93 0.99
40 2.08 2.81 0.94
60 2.86 4.83 0.94
120 5.55 7.75 0.95
Neutrase 60 10 0.87 15.78 0.99
20 1.37 20.88 0.94
40 2.40 42.76 0.99
60 2.97 42.76 0.99
120 5.52 78.51 0.99
Alcalase 30 10 0.37 10.09 0.95
20 0.78 9.34 0.94
40 1.54 13.50 0.93
60 2.19 18.17 0.91
120 4.20 29.55 0.93
40 10 0.97 11.45 0.97
20 1.82 13.38 0.95
40 3.43 19.82 0.91
60 4.95 21.96 0.91
120 9.55 40.45 0.91
50 10 0.72 5.58 0.92
20 1.28 10.78 0.91
40 2.36 17.69 0.91
60 1.28 10.78 0.91
120 6.42 42.37 0.93
60 10 0.64 6.59 0.98
20 1.22 9.61 0.96
40 2.21 17.87 0.98
60 3.03 25.58 0.98
120 5.63 46.05 0.98
Protamex 30 10 0.96 7.30 0.92
20 1.26 14.93 0.99
40 2.30 29.63 0.99
60 3.19 40.66 0.99
120 5.70 76.54 0.99

116
Table 4.3 (continued)
Temperature
(°C)
Hydrolysis time (min) K1 K2 R2
40 10 0.45 20.67 0.99
20 0.52 39.63 0.97
40 1.29 61.10 0.99
60 2.60 59.48 0.99
120 4.99 101.58 0.99
50 10 0.50 8.86 0.98
20 0.91 15.22 0.98
40 1.88 23.43 0.99
60 2.70 28.39 0.98
120 5.23 50.40 0.98
Protamex 60 10 1.01 4.27 0.92
20 1.79 6.95 0.91
40 3.20 13.30 0.92
60 4.25 16.06 0.94
120 8.08 28.46 0.93
Novo-pro D 30 10 0.42 11.80 0.93
20 0.99 11.99 0.97
40 1.77 20.11 0.984
60 2.37 28.53 0.98
120 4.60 49.83 0.96
40 10 1.70 8.73 0.92
20 2.08 17.39 0.95
40 3.83 26.73 0.96
60 5.23 33.18 0.91
120 9.63 56.60 0.92
50 10 0.97 10.56 0.92
20 1.82 17.02 0.93
40 3.49 30.27 0.92
60 4.89 39.03 0.92
120 8.78 68.84 0.94
60 10 1.19 8.72 0.92
20 2.13 16.30 0.91
40 3.87 27.64 0.93
60 5.74 33.91 0.93
120 8.91 66.45 0.93
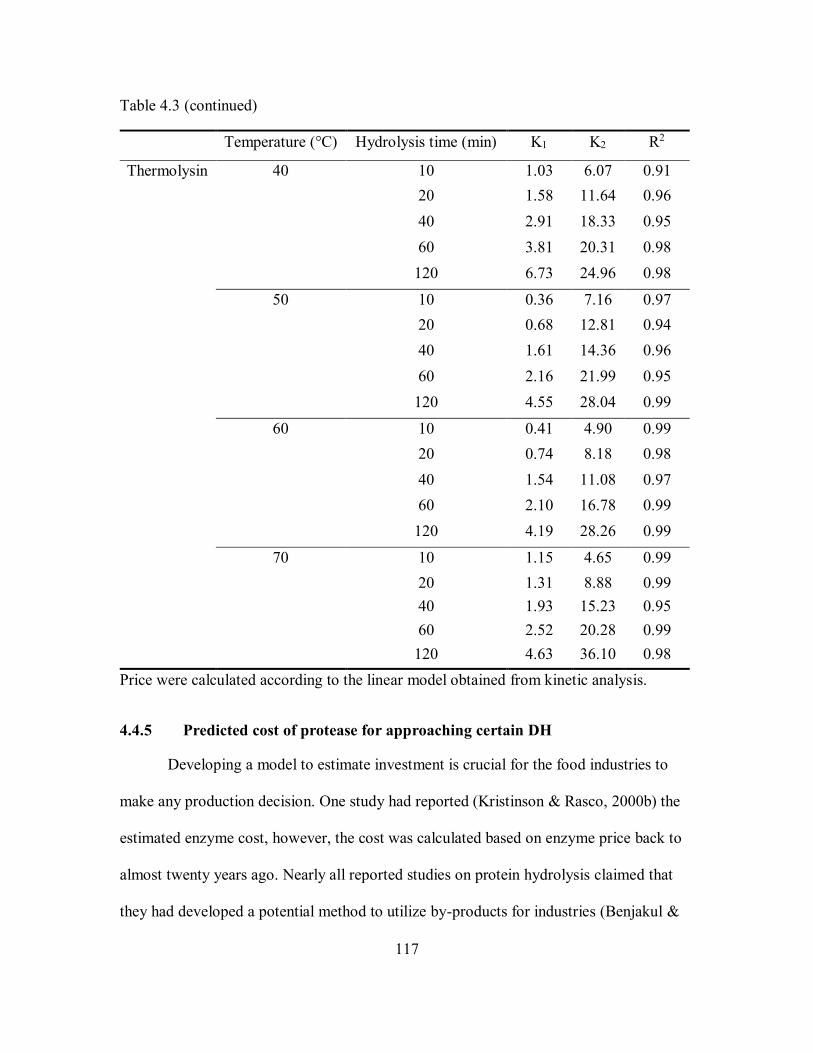
117
Table 4.3 (continued)
Temperature (°C) Hydrolysis time (min) K1 K2 R2
Thermolysin 40 10 1.03 6.07 0.91
20 1.58 11.64 0.96
40 2.91 18.33 0.95
60 3.81 20.31 0.98
120 6.73 24.96 0.98
50 10 0.36 7.16 0.97
20 0.68 12.81 0.94
40 1.61 14.36 0.96
60 2.16 21.99 0.95
120 4.55 28.04 0.99
60 10 0.41 4.90 0.99
20 0.74 8.18 0.98
40 1.54 11.08 0.97
60 2.10 16.78 0.99
120 4.19 28.26 0.99
70 10 1.15 4.65 0.99
20 1.31 8.88 0.99
40 1.93 15.23 0.95
60 2.52 20.28 0.99
120 4.63 36.10 0.98
Price were calculated according to the linear model obtained from kinetic analysis.
4.4.5 Predicted cost of protease for approaching certain DH
Developing a model to estimate investment is crucial for the food industries to
make any production decision. One study had reported (Kristinson & Rasco, 2000b) the
estimated enzyme cost, however, the cost was calculated based on enzyme price back to
almost twenty years ago. Nearly all reported studies on protein hydrolysis claimed that
they had developed a potential method to utilize by-products for industries (Benjakul &

118
Morrissey, 1997; Cheung & Chan, 2017; Diniz & Martin, 1997; Guerard, Dufosse, De La
Broise, & Binet, 2001; Ojha, Alvarez, Kumar, O'Donnell, & Tiwari, 2016; Zhou, et al.,
2016); however, no estimate cost had been provided.
In our current study, protease concentrations for approaching a certain degree of
hydrolysis level was calculated from the kinetic model, and the results are shown in
Table 4.4. The price for food grade proteases (neutrase, alcalase, protamex, novo-ProD)
was obtained from Novozyme Inc. (Franklinton, NC, USA). The price for other proteases
were obtained from Sigma (St. Louis, MO, USA). This calculation could be applied for
any desired degree of hydrolysis. However, extrapolating out of the range of the
experimental conditions might result in inaccurate cost. Nonetheless, this calculation
could be performed for any reaction time and temperature within the range of experiment
points. The protease cost is presented in Table 4.3, for reaching 15 and 20% of DH after
hydrolysis for 120 min at different temperatures were calculated based on the linear
relationship derived from the kinetic model. The lowest protease activity needed for
hydrolyzing 100 g of proteins in the substrate and approaching DH to 15% and 20% was
found in ficin hydrolysis for 120 min at 60°C (3.0 and 5.0 AzU/g, respectively).
However, the lowest protease cost to reach DH of 15% and 20% were found in
thermolysin hydrolysis for 120 min at 50°C (0.0003 and 0.0006 $/100 g of protein,
respectively).
4.4.6 Sodium-dodecyl-sulfate gel electrophoresis (SDS-PAGE)
Figure 4.9 to Figure 4.15 showed the selected SDS-PAGE patterns of
hydrolysates. All the hydrolysates hydrolyzed by papain, ficin and bromelain (plant
sources derived) showed a similar pattern (only SDS-PAGE of papain hydrolysates are

119
shown). No myosin heavy chain (around 205 KDa) and light chain (about 23 KDa) were
observed, and actin at about 43 KDa disappeared as well. All major bands exhibited in
the control (no protease treatment) group were all degraded, and this observation was
consistent with the degree of hydrolysis results. However, all hydrolysates obtained from
the reactions of alcalase, neutrase, protamex, novo-proD and thermolysin maintained the
integrity of the myofibrillar proteins at different degrees. Myosin heavy chain was
degraded into small peptides for all hydrolysates hydrolyzed by neutrase (80AzU/g) at
30, 40, 50 and 60°C (gels for 40, 50 and 60°C are not shown). Moreover, a new band was
formed at 5 KDa for the hydrolysates hydrolyzed by neutrase at 30 and 40°C.
In the alcalase hydrolysates, actin broken into small proteins first, and followed
by myosin heavy chain. And this fragmentation phenomenon was supported by both
SDS-PAGE gels and DH results, because the actin band disappeared first in the
hydrolysates, which possessed a lower DH (hydrolysates hydrolyzed at 40°C). Unlike
alcalase hydrolysis, thermolysin hydrolysis showed an opposite digestion order, and
thermolysin cleaves at the N-terminus of Leu, Phe, Val, Ile, Ala and Met. Myosin broke
into small proteins first and followed by actin. This point could be supported by the SDS-
PAGE gel of thermolysin hydrolysates at 50°C, where the myosin heavy chain degraded
first but actin still maintained its integrity. Sen and coworkers (Sen, Sripathy, Lahiry,
Sreenivasan, & Subrahmanyan, 1962) optimized the hydrolysis parameters based on
solubility and peptide chain length; and they found that the hydrolysates from an
optimized process had a low level of free tryptophan (Sripathy, Sen, Lahiry, Sreenivasan,
& Subrahmanyan, 1962). After adjusting the hydrolysis pH and extending the hydrolysis
time, new hydrolysates with higher content of tryptophan were obtained (Sripathy,
120
Kadkol, Sen, Swaminathan, & Lahiry, 1963). This suggesting that the individual amino
acids were not released equally fast during the hydrolysis process. All proteases used in
this study are endoproteases, which break the peptide bonds on nonterminal amino acids.
In other words, endoproteases can only cut the amino acids within the molecules, thus
endoproteases cannot break the proteins into monomers. Limited studies (and none for
catfish by-products) had reported the degree of hydrolysis and SDS-PAGE gel pattern at
the same time (Cai, Chang, & Lunde, 1996; Liceaga-Gesualdo & Li-Chan, 1999; Ndez-
Diaaz & Fera, 1999; Theodore & Kristinsson, 2007). However, SDS-PAGE patterns of
hydrolysates helped us understand how the protein composition changed during
hydrolysis of proteins derived from catfish by-products.

121
Tab
le 4
.4
Calc
ula
ted e
nzym
e ac
tivit
y a
nd c
ost
to
rea
ch 1
5 a
nd 2
0%
DH
when h
ydro
lyzin
g c
atfi
sh b
y-p
roduct
at
pH
7.2
.
Pro
teas
es
Tem
per
ature
(°C
)
Hydro
lysi
s ti
me
(min
)
Pro
teas
e ac
tivit
y n
eed
ed
(AzU
/ 100 g
of
pro
tein
in s
ubst
rate
)
Pro
teas
e co
st
($/1
00 g
of
pro
tein
in s
ubst
rate
)
15%
20%
15%
20%
Pap
ain
30
120
41
72
0.0
066
0.0
116
40
120
104
193
0.0
092
0.0
171
50
120
53
94
0.0
046
0.0
081
60
120
76
134
0.0
023
0.0
041
Fic
in
30
120
4.3
7.2
0.0
038
0.0
064
40
120
7.9
13
0.0
007
0.0
011
50
120
7.3
12
0.0
006
0.0
010
60
120
3.0
5.0
0.0
001
0.0
002

122
Tab
le 4
.4 (
conti
nued
)
Pro
teas
es
Tem
per
ature
(°C
)
Hydro
lysi
s ti
me
(min
)
Pro
teas
e ac
tivit
y n
eed
ed
(AzU
/ 100 g
of
pro
tein
in s
ubst
rate
)
Pro
teas
e co
st
($/1
00 g
of
pro
tein
in s
ubst
rate
)
15%
20%
15%
20%
Bro
mela
in
30
120
8.2
14
0.0
096
0.0
164
40
120
30
50
0.0
307
0.0
511
50
120
22
38
0.0
205
0.0
354
60
120
14
24
0.0
141
0.0
243
Neu
tras
e 30
120
1522
NA
0.0
520
NA
40
120
311
756
0.0
175
0.0
425
50
120
120
316
0.0
109
0.0
287
60
120
1211
3163
0.4
252
1.1
106

123
Tab
le 4
.4 (
conti
nued
)
Pro
teas
es
Tem
per
ature
(°C
)
Hydro
lysi
s ti
me
(min
)
Pro
teas
e ac
tivit
y n
eed
ed
(AzU
/ 100 g
of
pro
tein
in s
ubst
rate
)
Pro
teas
e co
st
($/1
00 g
of
pro
tein
in s
ubst
rate
)
15%
20%
15%
20%
Alc
ala
se
30
120
379
777
0.0
072
0.0
147
40
120
1654
NA
0.0
045
NA
50
120
760
2689
0.0
007
0.0
026
60
120
723
1943
0.0
005
0.0
014
Pro
tam
ex
30
120
1214
3322
0.0
710
0.1
944
40
120
1450
3376
0.0
418
0.0
973
50
120
745
1822
0.0
225
0.0
551
60
120
726
NA
0.0
161
NA

124
Tab
le 4
.4 (
conti
nued
)
Pro
teas
es
Tem
per
ature
(°C
)
Hydro
lysi
s ti
me
(min
)
Pro
teas
e ac
tivit
y n
eed
ed
(AzU
/ 100 g
of
pro
tein
in s
ubst
rate
)
Pro
teas
e co
st
($/1
00 g
of
pro
tein
in s
ubst
rate
)
15%
20%
15%
20%
No
vo
-pro
D
30
120
673
1463
0.0
228
0.0
495
40
120
2388
NA
0.0
113
NA
50
120
2138
NA
0.0
040
NA
60
120
2151
NA
0.0
021
NA
Ther
mo
lysi
n
40
120
473
1962
0.0
006
0.0
024
50
120
377
814
0.0
003
0.0
007
60
120
362
741
0.0
003
0.0
006
70
120
490
1072
0.0
016
0.0
036
Pri
ce w
ere
calc
ula
ted a
cco
rdin
g t
o t
he
linear
mo
del
obta
ined
fro
m k
inet
ic a
naly
sis.

125
Fig
ure
4.9
C
atfi
sh p
rote
in a
nd p
epti
de
pat
tern
changes
upo
n P
rota
mex h
ydro
lysi
s at
50°C
.
MH
C:
myo
sin h
eavy c
hain
; A
CT
: ac
tin.
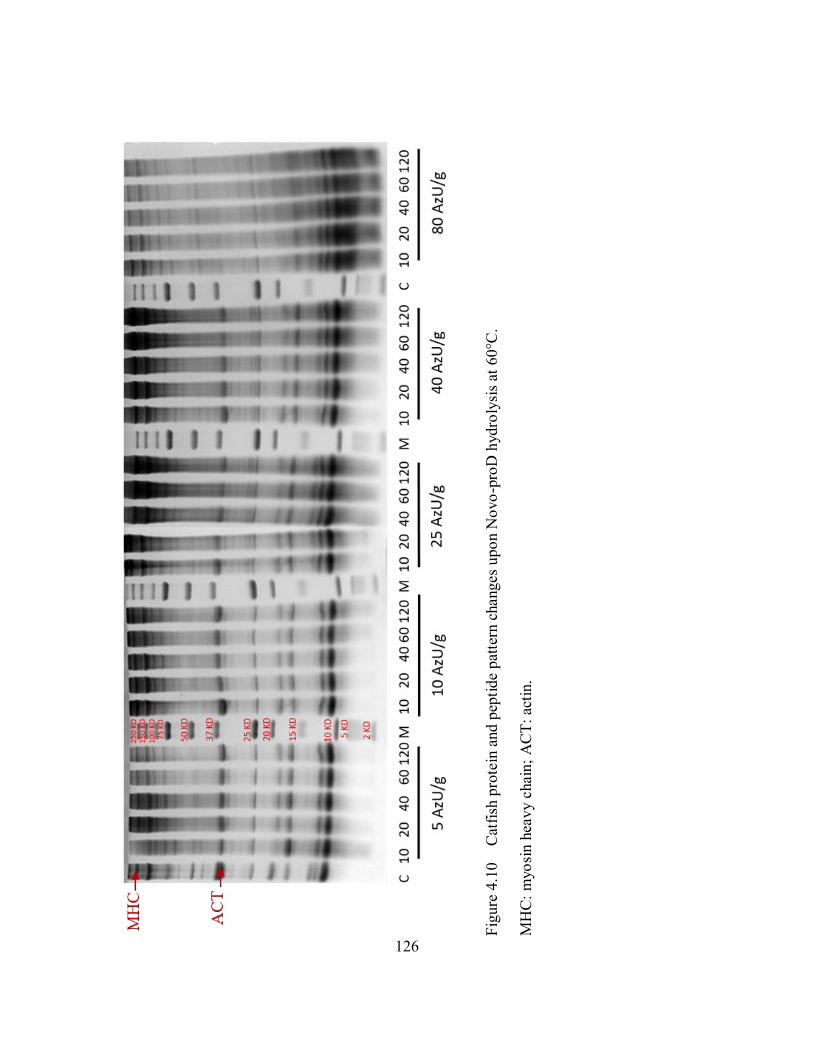
126
Fig
ure
4.1
0
Cat
fish
pro
tein
and p
epti
de
pat
tern
changes
upo
n N
ovo
-pro
D h
ydro
lysi
s at
60°C
.
MH
C:
myo
sin h
eavy c
hain
; A
CT
: ac
tin.

127
Fig
ure
4.1
1
Cat
fish
pro
tein
and p
epti
de
pat
tern
changes
upo
n P
apain
hydro
lysi
s at
40°C
.
MH
C:
myo
sin h
eavy c
hain
; A
CT
: ac
tin.

128
Fig
ure
4.1
2
Cat
fish
pro
tein
and p
epti
de
pat
tern
changes
upo
n A
cala
se h
ydro
lysi
s at
30°C
.
MH
C:
myo
sin h
eavy c
hain
; A
CT
: ac
tin.

129
Fig
ure
4.1
3
Cat
fish
pro
tein
and p
epti
de
pat
tern
changes
upo
n N
eutr
ase
hydro
lysi
s at
30
°C.
MH
C:
myo
sin h
eavy c
hain
; A
CT
: ac
tin.

130
Fig
ure
4.1
4
Cat
fish
pro
tein
and p
epti
de
pat
tern
changes
upo
n T
her
mo
lysi
n h
ydro
lysi
s at
50°C
.
MH
C:
myo
sin h
eavy c
hain
; A
CT
: ac
tin.
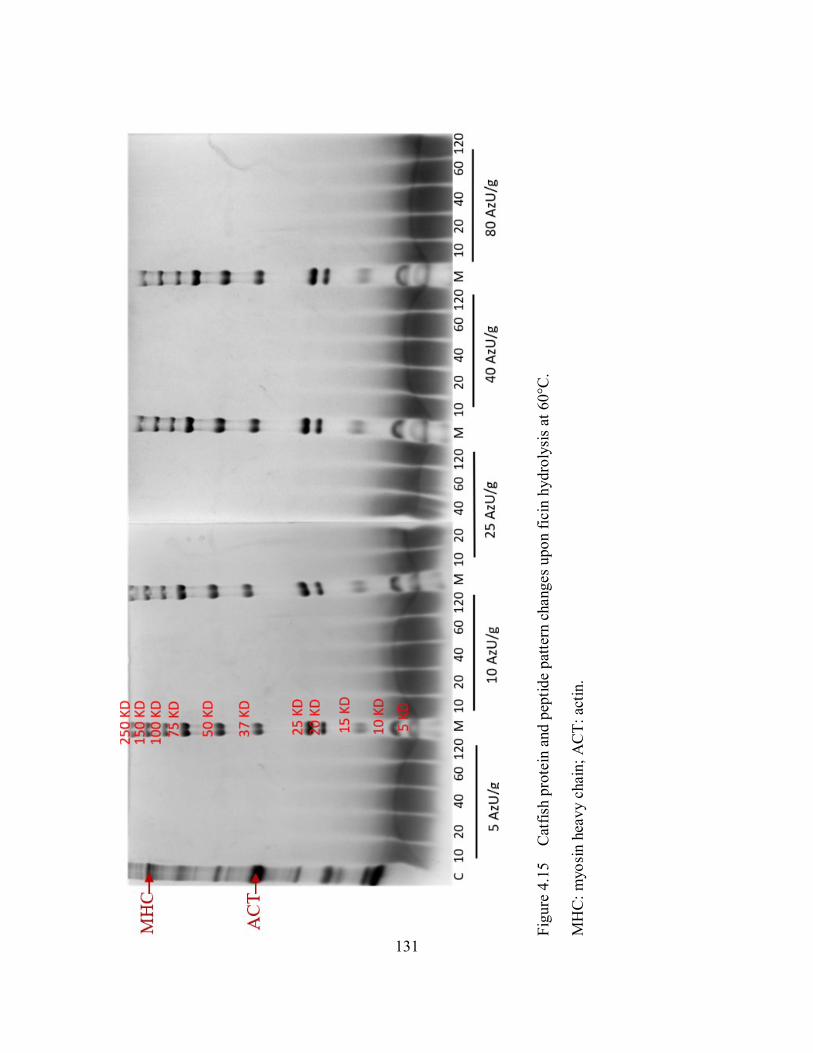
131
Fig
ure
4.1
5
Cat
fish
pro
tein
and p
epti
de
pat
tern
changes
upo
n f
icin
hydro
lysi
s at
60°C
.
MH
C:
myo
sin h
eavy c
hain
; A
CT
: ac
tin.

132
4.4.7 Emulsion capacity and stability
Emulsion activity index (EAI) and emulsion stability index (ESI) of selected
hydrolysates were determined, and soy protein isolate (SPI) was used as a positive
control. Selected results are shown in Figure 4.16 A-D. In general, hydrolysates with
lower degrees of hydrolysis (DH) exhibited higher emulsion capacities. This conclusion
was in accordance with the previous report that hydrolysates with limited degrees of
hydrolysis possessed higher emulsion capacities (Hall, Jones, O'Haire, & Liceaga, 2017).
Higher amount of hydrophobic peptides and larger molecular mass peptides would result
in a more stable emulsion system. Hydrolysates with high degrees of hydrolysis often
indicated lower emulsion capacity and stability (Ghribi, et al., 2015). Adsorption of
peptides on the surface of oil droplets during homogenization and the formation of a
membrane that blocks coalescence of the oil droplet could produce a stable emulsion
system (Mutilangi, Panyam, & Kilara, 1996). In general, it can be expected that a higher
degree of hydrolysis would lead to a lower emulsion capacity and stability (Ghribi, et al.,
2015). Adsorption of peptide chains on the surface of oil droplets during homogenization
and the formation of a membrane that blocks coalescence of the oil droplet could result a
stable emulsion system. Hydrolysates of peptides are surface active material, which could
help oil-in-water emulsion system formation since they possessed both hydrophobic and
hydrophilic groups. Peptides patterns of very small size could migrate quickly at the
interface which would make the emulsion system unstable. In addition, amphiphilicity of
peptides is the other factor which has the significant effect on the emulsifying capacity.
The amino acid sequence in an oil-in-water emulsion system had been analyzed, and it
was discovered that the amphiphilicity of peptides is more important than that of peptides

133
molecular size to emulsion capacity (Rahali, Chobert, Haertle, & Gueguen, 2000).
In this study, the lowest EAI and ESI were found at pH 4, which was in
accordance with the previous report that the lowest EAI and ESI of yellow stripe trevally
protein were observed at pH 4 (Klompong, Benjakul, Kantachote, & Shahidi, 2007).
Most of the catfish protein hydrolysates exhibited lower EAI and ESI than that of soy
protein isolate (SPI). However, only three hydrolysates exhibited comparable ESI and
EAI with SPI, and the three hydrolysates are hydrolyzed by Novo-Pro D (5 and 25
AzU/g, 10 and 20 min, respectively) and thermolysin (25 AzU/g, 20min) at 30 and 60 °C,
respectively. Emulsion property of hydrolysates from blue whiting was studied, and
exhibited much lower EAI and ESI than the current study (Egerton, Culloty, Whooley,
Stanton, & Ross, 2018). As noted in this study, protamex hydrolysates showed similar
DH and SDS-PAGE patterns with novo-ProD, but the emulsion capacity of prota-max
(data are not shown) was significantly higher than that of novo-ProD. Emulsifying
properties and stability of hydrolysates varied significantly even though the degrees of
hydrolysis were similar. This indicated that EAI and ESI are not only rely on the
molecular size of peptides but also related to the composition and amphiphilicity
structure of peptides.

134
Fig
ure
4.1
6
Em
uls
ifyin
g a
ctiv
ity i
ndex (
EA
I) a
nd e
mu
lsio
n s
tabil
ity i
ndex (
ES
I) o
f ca
tfis
h b
y-p
roduct
s hydro
lysa
tes
pre
par
ed
usi
ng N
ovo
-Pro
D (
A a
nd B
) an
d t
her
mo
lysi
n (
C a
nd D
) at
30 a
nd 6
0°C
, re
spec
tively
.
0.0
0
50.0
0
100
.00
150
.00
200
.00
250
.00
02
46
81
01
2
EAI (m2/g)
pH
SP
I5
AzU
/g 1
0m
in2
5 A
zU/g
20 m
in
40 A
zU/g
40m
in8
0 A
zU/g
120
min
05
10
15
20
25
30
35
40
45
02
46
81
01
2
ESI (%)
pH
SP
I5
AzU
/g 1
0m
in2
5 A
zU/g
20 m
in
40 A
zU/g
40m
in8
0 A
zU/g
120
min
A
B
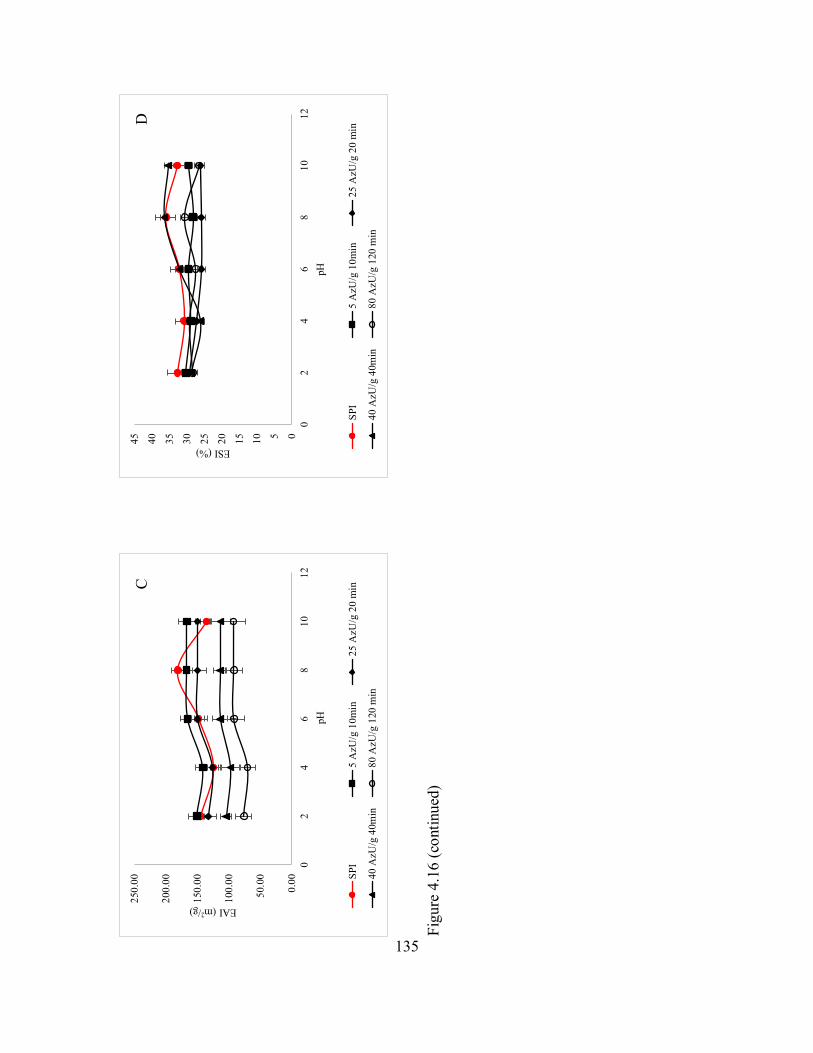
135
Fig
ure
4.1
6 (
conti
nued
)
0.0
0
50.0
0
100
.00
150
.00
200
.00
250
.00
02
46
81
01
2
EAI (m2/g)
pH
SP
I5
AzU
/g 1
0m
in2
5 A
zU/g
20 m
in
40 A
zU/g
40m
in8
0 A
zU/g
120
min
C
05
10
15
20
25
30
35
40
45
02
46
81
01
2
ESI (%)
pH
SP
I5
AzU
/g 1
0m
in2
5 A
zU/g
20 m
in
40 A
zU/g
40m
in8
0 A
zU/g
120
min
D

136
4.4.8 Foaming capacity and stability
Hydrolysates with good foaming capacity and stability were selected and shown
in Figure 4.17 (A-H). In general, the foaming capacity of the selected hydrolysates were
higher than that of SPI, however, most of the hydrolysates exhibited much lower foaming
stability than that of SPI. This might be because that small peptides do not have enough
strength to maintain a stable foam (Shahidi, Han, & Synowiecki, 1995). Foaming
property of the silver carp protamex hydrolysates exhibited higher foaming capacity and
stability than other hydrolysates (Liu et al., 2014). High molecular weight of protein
usually correlated with potent foaming capacity and stability.
To develop a good foam, proteins or peptides must have to migrate quickly to the
air-water interface. Flexible protein domains would enhance the foaming stability. In the
current study, foaming capacity and stability of hydrolysates was affected by pH
significantly (p<0.05). The lowest foaming capacity and stability were observed at pH 4.
This was in agreement with the previous report on yellow strip trevally (Klompong,
Benjakul, Kantachote, & Shahidi, 2007). Good foaming property and stability were found
in alcalase hydrolysate (5 AzU/g, 10min at 30°C), Novo-Pro D hydrolysates (5 AzU/g,
10 min at 40, 50 and 60°C), papain hydrolysates (5 AzU/g, 10min at 30°C), protamex
hydrolysates (5 AzU/g, 10min at 30, 40, 50 and 60°C), and thermolysin hydrolysates (5
AzU/g, 10min at 30, 40, 50 and 60°C). All of those hydrolysates had low degrees of
hydrolysis (< 15%) except papain hydrolysate, and the SDS-PAGE patterns of the papain
hydrolysates had more smaller peptides than that of others. Good foaming capacity and
stability not only related to the degree of hydrolysis but also related to ionic repulsion
(Klompong, Benjakul, Kantachote, & Shahidi, 2007). Good foaming capacity had been
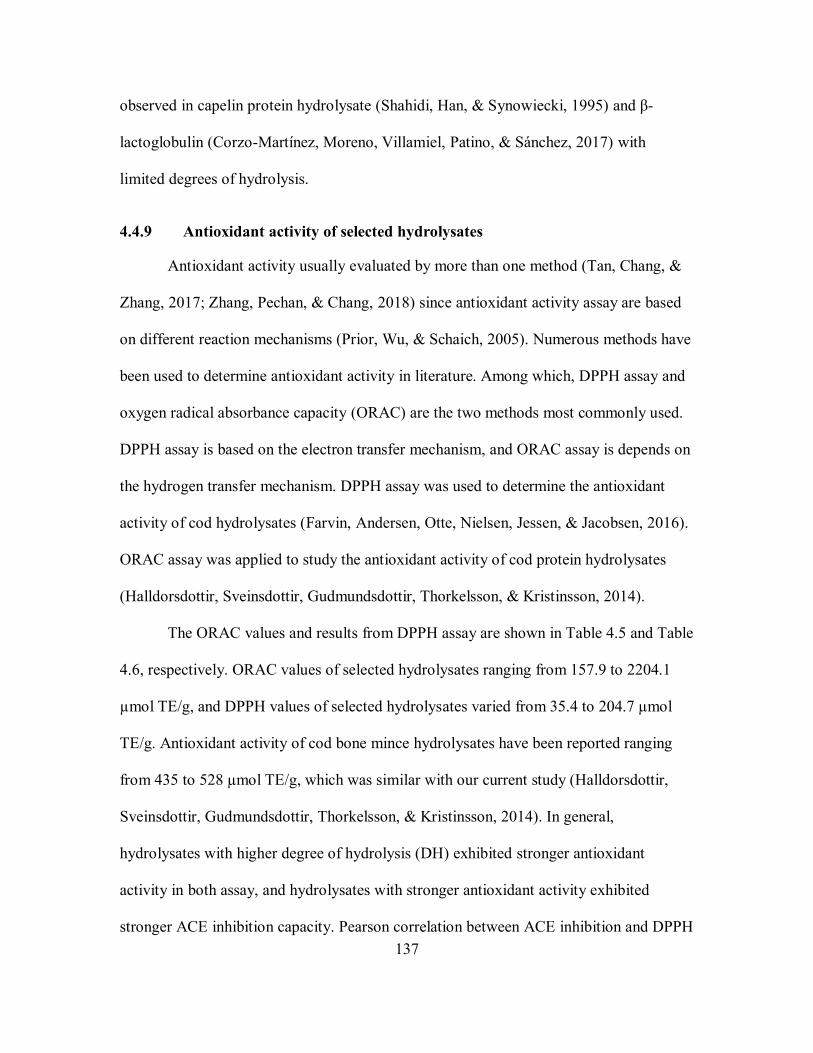
137
observed in capelin protein hydrolysate (Shahidi, Han, & Synowiecki, 1995) and β-
lactoglobulin (Corzo-Martínez, Moreno, Villamiel, Patino, & Sánchez, 2017) with
limited degrees of hydrolysis.
4.4.9 Antioxidant activity of selected hydrolysates
Antioxidant activity usually evaluated by more than one method (Tan, Chang, &
Zhang, 2017; Zhang, Pechan, & Chang, 2018) since antioxidant activity assay are based
on different reaction mechanisms (Prior, Wu, & Schaich, 2005). Numerous methods have
been used to determine antioxidant activity in literature. Among which, DPPH assay and
oxygen radical absorbance capacity (ORAC) are the two methods most commonly used.
DPPH assay is based on the electron transfer mechanism, and ORAC assay is depends on
the hydrogen transfer mechanism. DPPH assay was used to determine the antioxidant
activity of cod hydrolysates (Farvin, Andersen, Otte, Nielsen, Jessen, & Jacobsen, 2016).
ORAC assay was applied to study the antioxidant activity of cod protein hydrolysates
(Halldorsdottir, Sveinsdottir, Gudmundsdottir, Thorkelsson, & Kristinsson, 2014).
The ORAC values and results from DPPH assay are shown in Table 4.5 and Table
4.6, respectively. ORAC values of selected hydrolysates ranging from 157.9 to 2204.1
µmol TE/g, and DPPH values of selected hydrolysates varied from 35.4 to 204.7 µmol
TE/g. Antioxidant activity of cod bone mince hydrolysates have been reported ranging
from 435 to 528 µmol TE/g, which was similar with our current study (Halldorsdottir,
Sveinsdottir, Gudmundsdottir, Thorkelsson, & Kristinsson, 2014). In general,
hydrolysates with higher degree of hydrolysis (DH) exhibited stronger antioxidant
activity in both assay, and hydrolysates with stronger antioxidant activity exhibited
stronger ACE inhibition capacity. Pearson correlation between ACE inhibition and DPPH

138
values was analyzed, a negative correlation was observed with r equal to 0.48 at 0.05
significance level. And no significance correlation between ACE inhibition and ORAC
value was observed. Antioxidant activity was observed in selected hydrolysates but
showed no inhibition capacity against ACE, which indicated that antioxidant activity is
not the only factor for potent ACE inhibition capacity.

139
Fig
ure
4.1
7
Fo
am
ing p
roper
ty a
nd s
tabil
ity o
f ca
tfis
h b
y-p
roduct
s hydro
lysa
tes.
Alc
ala
se (
A a
nd B
) at
30°C
. B
ars
repre
sent
stan
dar
d d
evia
tio
ns
fro
m t
rip
licat
e det
erm
inat
ions.
So
y p
rote
in i
sola
te (
SP
I) w
as u
sed a
s
po
siti
ve
contr
ol.
0.00
%
50.0
0%
100.
00%
150.
00%
200.
00%
02
46
810
12
Foaming capacity (%)
pH
5 A
zU/g
10m
in25
AzU
/g 2
0 m
in40
AzU
/g 4
0min
80 A
zU/g
12
0 m
inSP
I
A
0.00
%
20.0
0%
40.0
0%
60.0
0%
80.0
0%
100.
00%
120.
00%
02
46
810
12
Foaming stability (%)
pH
5 A
zU/g
10m
in25
AzU
/g 2
0 m
in40
AzU
/g 4
0min
80 A
zU/g
120
min
SPI
BA
B

140
Fig
ure
4.1
7 (
conti
nued
)
No
vo
-pro
D (
C a
nd D
) at
30°C
. B
ars
repre
sent
stan
dar
d d
evia
tio
ns
fro
m t
rip
licat
e det
erm
inat
ions.
So
y p
rote
in i
sola
te (
SP
I) w
as
use
d a
s po
siti
ve
contr
ol.
0.00
%
50.0
0%
100.
00%
150.
00%
200.
00%
02
46
810
12
Foaming capacity (%)
pH
5 A
zU/g
10
min
25 A
zU/g
20
min
40 A
zU/g
40m
in
80
AzU
/g 1
20 m
inSP
I
0.00
%
20.0
0%
40.0
0%
60.0
0%
80.0
0%
100.
00%
120.
00%
02
46
81
01
2
Foaming stability (%)
pH
5 A
zU/g
10m
in25
AzU
/g 2
0 m
in40
AzU
/g 4
0min
80 A
zU/g
120
min
SPI
D
C
C
D

141
Fig
ure
4.1
7 (
conti
nued
)
Pap
ain
(E
and F
) at
30°C
. B
ars
repre
sent
stan
dar
d d
evia
tio
ns
fro
m t
rip
lica
te d
eter
min
atio
ns.
So
y p
rote
in i
sola
te (
SP
I) w
as u
sed a
s
po
siti
ve
contr
ol.
0.00
%
50.0
0%
100.
00%
150.
00%
200.
00%
02
46
81
01
2
Foaming capacity (%)
pH
5 A
zU/g
10m
in25
AzU
/g 2
0 m
in40
AzU
/g 4
0min
80 A
zU/g
120
min
SPI
0.00
%
20.0
0%
40.0
0%
60.0
0%
80.0
0%
100.
00%
120.
00%
02
46
81
01
2
Foaming stability (%)
pH
5 A
zU/g
10m
in25
AzU
/g 2
0 m
in40
AzU
/g 4
0min
80 A
zU/g
120
min
SPI
E
F
E
F

142
Fig
ure
4.1
7 (
conti
nued
)
Ther
mo
lysi
n (
G a
nd H
) at
50°C
. B
ars
repre
sent
stan
dar
d d
evia
tio
ns
fro
m t
rip
licat
e det
erm
inat
ions.
Soy p
rote
in i
sola
te (
SP
I) w
as
use
d a
s po
siti
ve
contr
ol.
0.00
%
50.0
0%
100.
00%
150.
00%
200.
00%
02
46
81
01
2
Foaming capacity (%)
pH
5 A
zU/g
10m
in25
AzU
/g 2
0 m
in40
AzU
/g 4
0min
80 A
zU/g
120
min
SPI
0.00
%
20.0
0%
40.0
0%
60.0
0%
80.0
0%
100.
00%
120.
00%
02
46
81
01
2
Foaming stability (%)
pH
5 A
zU/g
10m
in25
AzU
/g 2
0 m
in40
AzU
/g 4
0min
80 A
zU/g
120
min
SPI
G
H

143
Tab
le 4
.5
OR
AC
valu
es (
µm
ol T
E/g
) o
f se
lect
ed c
atfi
sh b
y-p
roduct
s hydro
lysa
tes
hydro
lyzed
under
dif
fere
nt
cond
itio
ns.
Valu
es
wer
e ex
pre
ssed
as
mea
n (
n=
3),
and s
tandar
d d
evia
tio
n w
as n
ot
over
10%
of
each m
ean v
alu
e;
valu
es
wit
hin
eac
h t
yp
e o
f
sam
ple
mar
ked
by t
he
dif
fere
nt
lett
er w
ithin
sam
e co
lum
n a
re s
ignif
icantl
y d
iffe
rent
(P <
0.0
5).
Pro
tease
s
5 A
zU/g
10
min
2
5 A
zU/g
20
min
4
0 A
zU/g
40
min
8
0 A
zU/g
12
0m
in
30
°C
40
°C
50
°C
60
°C
30
°C
40
°C
50
°C
60
°C
30
°C
40
°C
50
°C
60
°C
30
°C
40
°C
50
°C
60
°C
Fic
in
18
90
.5a
19
57
.8a
18
47
.2a
17
46
.2b
19
27
.3a
19
89
.4a
18
96
.2a
18
68
.4b
19
66
.1a
20
47
.7a
20
18
.4a
20
79
.4a
19
87
.3a
20
11
.5a
21
14
.5a
22
04
.1a
Pap
ain
1
28
3.2
c 1
30
1.5
c 1
35
5.1
c 1
39
7.5
c 1
31
1.2
c 1
37
8.4
c 1
39
7.4
b 1
53
2.7
c 1
47
7.2
c 1
42
7.9
c 1
50
2.7
c 1
59
5.3
c 1
50
4.3
b 1
46
6.4
c 1
55
4.6
c 1
62
2.7
c
Bro
mel
ain
1
83
1.8
b 1
79
4.1
b 1
80
5.8
b 1
87
8.4
a 1
87
2.5
b 1
85
5.3
b 1
86
1.7
a 1
90
1.2
a 1
92
2.5
b 1
89
3.3
b 1
95
5.3
b 1
97
3.2
b 1
97
3.6
a 1
90
9.5
b 2
04
1.4
b 2
01
5.8
b
Neu
trase
2
18
.3de
27
7.5
d 2
44
.8d
20
2.7
e 2
53
.6f
30
2.7
d 3
87
.4c
22
1.7
d 4
07
.1f
46
9.2
d 4
62
.3d
39
6.4
d 4
42
.4e
49
4.2
d 4
83
.1d
43
7.7
e
Alc
alase
2
27
.3d
17
6.3
f 1
85
.9e
17
9.6
f 3
55
.8d
20
1.7
g 2
23
.7de
24
1.9
d 7
58
.3d
31
5.6
e 3
87
.4e
29
6.5
e 8
73
.5c
33
2.8
f 4
39
.4e
45
1.2
d
Nov
o-p
roD
2
27
.4d
24
1.6
e 1
89
.6e
24
7.5
d 2
78
.9e
27
6.3
e 2
06
.9e
23
1.9
d 4
27
.5e
30
1.5
f 2
57
.3g
22
8.1
f 7
21
.7d
34
6.7
f 3
05
.7f
37
9.7
g
Pro
tam
ex
21
7.5
e 1
57
.9g
18
8.5
e 2
05
.9e
24
7.4
f 2
65
.9f
25
5.9
d 2
23
.8d
27
1.9
g 3
27
.5e
32
6.3
f 2
89
.4e
45
3.8
e 4
67
.3e
43
7.5
e 3
99
.6f
4
0°C
5
0°C
6
0°C
7
0°C
4
0°C
5
0°C
6
0°C
7
0°C
4
0°C
5
0°C
6
0°C
7
0°C
4
0°C
5
0°C
6
0°C
7
0°C
Ther
moly
sin
2
69
.5
25
7.4
2
66
.9
25
8.4
2
81
.6
32
7.7
3
76
.3
31
8.5
3
14
.8
33
7.7
3
96
.4
36
5.2
3
37
.5
35
7.9
4
21
.8
75
6.8

144
Tab
le 4
.6
DP
PH
valu
es (
µm
ol T
E/g
) o
f se
lect
ed c
atfi
sh b
y-p
roduct
s hydro
lysa
tes
hydro
lyzed
under
dif
fere
nt
cond
itio
ns.
Valu
es
wer
e ex
pre
ssed
as
mea
n (
n=
3),
and s
tandar
d d
evia
tio
n w
as n
ot
over
10%
of
each m
ean v
alu
e;
valu
es
wit
hin
eac
h t
yp
e o
f
sam
ple
mar
ked
by t
he
dif
fere
nt
lett
er w
ithin
sam
e co
lum
n a
re s
ignif
icantl
y d
iffe
rent
(P <
0.0
5).
Pro
teas
es
5 A
zU/g
10m
in
25
AzU
/g 2
0m
in
40
AzU
/g 4
0m
in
80 A
zU/g
120m
in
30°C
40°C
50°C
6
0°C
3
0°C
4
0°C
5
0°C
6
0°C
3
0°C
4
0°C
50°C
60°C
30°C
40°C
50°C
60°C
Fic
in
45.2
a 45.6
a 47.6
a 4
8.2
b
45
.8b
58
.3b
46
.1b
58
.3b
46
.1b
57
.6b
58.3
b
59.2
b
67.8
b
61.5
b
67.8
b
75.6
a
Pap
ain
33.3
c 38.3
b
34.3
c 3
7.3
c 3
1.7
c 3
8.6
c 3
3.0
c 4
5.5
c 3
8.6
c 4
2.9
c 47.8
c 48.4
c 42.5
c 44.8
c 46.8
c 55.6
b
Bro
mel
ain
39.2
b
46.1
a 42.9
b
54
.3a
51
.7a
55
.3a
54
.3a
69
.7a
74
.7a
66
.8a
65.8
a 69.7
a 69.4
a 71.4
a 72.7
a 74.3
a
Neu
tras
e 4.2
e 4.8
d
4.6
d
4.0
e 4
.7e
5.2
d
5.8
d
4.0
f 5
.8e
5.4
d
5.7
d
5.1
d
5.5
f 5.7
d
4.7
f 5.3
c
Alc
alas
e 4.8
d
3.7
e 3.8
e 3
.7f
5.4
d
3.8
f 4
.2f
4.5
d
8.1
d
4.3
f 5.2
e 4.8
e 9.0
d
4.7
g
5.6
e 5.4
c
No
vo-p
roD
4.6
e 4.9
c 3.8
e 4
.8d
4.8
e 5
.3d
3.7
g
4.0
f 6
.0e
4.4
f 4.5
f 4.0
f 7.1
e 5.1
f 4.2
g
4.7
d
Pro
tam
ex
4.2
e 3.8
e 3.5
f 3
.8ef
4.8
e 5
.0e
4.6
e 4
.2e
3.8
f 4
.7e
4.5
f 3.9
g
5.6
f 5.6
e 5.7
d
5.4
c
40°C
50°C
60°C
7
0°C
4
0°C
5
0°C
6
0°C
7
0°C
4
0°C
5
0°C
60°C
70°C
40°C
50°C
60°C
70°C
Th
erm
oly
sin
4.7
4.5
4.9
4
.7
5.1
5
.5
5.7
5
.0
5.3
5
.5
5.8
5.7
5.2
5.8
6.0
8.5
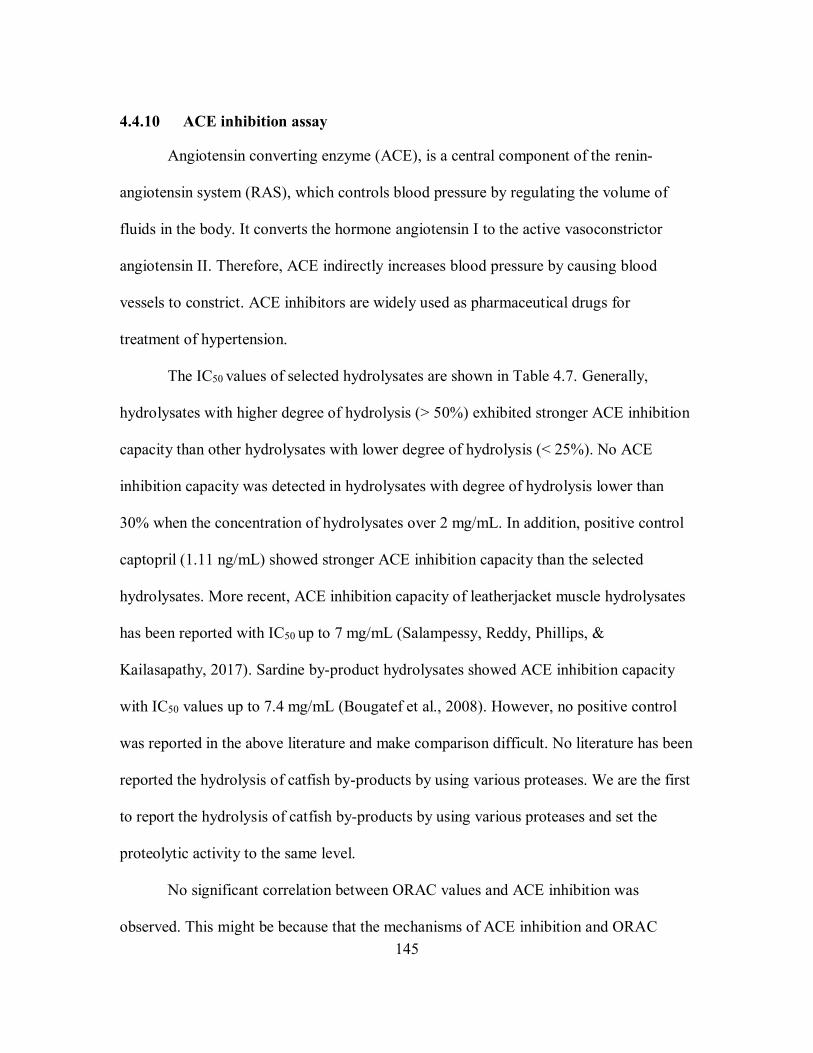
145
4.4.10 ACE inhibition assay
Angiotensin converting enzyme (ACE), is a central component of the renin-
angiotensin system (RAS), which controls blood pressure by regulating the volume of
fluids in the body. It converts the hormone angiotensin I to the active vasoconstrictor
angiotensin II. Therefore, ACE indirectly increases blood pressure by causing blood
vessels to constrict. ACE inhibitors are widely used as pharmaceutical drugs for
treatment of hypertension.
The IC50 values of selected hydrolysates are shown in Table 4.7. Generally,
hydrolysates with higher degree of hydrolysis (> 50%) exhibited stronger ACE inhibition
capacity than other hydrolysates with lower degree of hydrolysis (< 25%). No ACE
inhibition capacity was detected in hydrolysates with degree of hydrolysis lower than
30% when the concentration of hydrolysates over 2 mg/mL. In addition, positive control
captopril (1.11 ng/mL) showed stronger ACE inhibition capacity than the selected
hydrolysates. More recent, ACE inhibition capacity of leatherjacket muscle hydrolysates
has been reported with IC50 up to 7 mg/mL (Salampessy, Reddy, Phillips, &
Kailasapathy, 2017). Sardine by-product hydrolysates showed ACE inhibition capacity
with IC50 values up to 7.4 mg/mL (Bougatef et al., 2008). However, no positive control
was reported in the above literature and make comparison difficult. No literature has been
reported the hydrolysis of catfish by-products by using various proteases. We are the first
to report the hydrolysis of catfish by-products by using various proteases and set the
proteolytic activity to the same level.
No significant correlation between ORAC values and ACE inhibition was
observed. This might be because that the mechanisms of ACE inhibition and ORAC

146
assay was not the same. The ACE inhibition activity of peanut protein hydrolysates
increased with the increase of degree of hydrolysis (Jamdar et al., 2010). Therefore,
correlation between ACE inhibition and degree of hydrolysis was studied. A negative
correlation between degree of hydrolysis and ACE inhibition activity was observed with r
equal to 0.455 at 0.05 significant level. Sangsawad and coworkers have reported that
smaller molecular size of peptides possessed stronger ACE inhibitory activity
(Sangsawad et al., 2018). Regarding to the relationship between peptides structure and
ACE inhibitory activity, peptides had Pro, Phe, or Tyr at the C-terminus, and Val and Ile
at the N-terminus exhibited potent inhibitory activity against ACE (Tsai, Chen & Pan,
2008).
4.4.11 DPP-IV inhibition assay
DPP-IV plays a critical role in maintaining glucose homeostasis. It is responsible
for inactivating incretins, such as glucose-dependent insulinotropic polypeptide (GIP) and
glucagon-like peptide-1 (GLP-1). Secretion of these two intestinal hormones is triggered
by food intake. After DPP-IV was blocked by inhibitors, the increased incretin levels will
inhibit glucagon release, which in turn increases insulin secretion, decreases gastric
emptying, and decreases blood glucose levels.
IC50 values of the selected hydrolysates against DPP-IV is shown in Table 4.8.
The hydrolysates hydrolyzed by bacteria derived proteases showed no inhibition activity
against DPP-IV. However, hydrolysates hydrolyzed by plant derived proteases exhibited
inhibition activity against DPP-IV. The reason might be that the hydrolysates hydrolyzed
by papain, ficin and bromelain (plant derived proteases) had higher degree of hydrolysis
which resulted in smaller size of peptides. We are the first to report the DPP-IV inhibition

147
activity of catfish by-product hydrolysates. Therefore, comparison to the literature is
difficult.
However, two peptides Gly-Pro-Ala-Glu (372.4 Da) and Gly-Pro-Gly-Ala (300.4
Da) have been purified from Atlantic salmon skin gelatin hydrolysates and exhibited
potent DPP-IV inhibition activity (IC50 = 49.6 and 41.9 μM, respectively) (Li-Chan,
Hunag, Jao, Ho & Hsu, 2012). Barbel muscle hydrolysate has been separated by HPLC
into 5 fractions and two of them showed DPP-IV inhibition activity with IC50 = 1.09 and
0.21 mg/mL, respectively. Two peptides Trp-Ser-Gly and Phe-Ser-Asp have been
purified from the two fractions, and molecular docking analysis indicated that Trp-Ser-
Gly had stronger affinity for DPP-IV (Sila et al., 2016). Whey protein hydrolysates have
exhibited DPP-IV inhibition activity, and peptide Ile-Pro-Ala is a moderate DPP-IV
inhibitor (Tulipano, Sibilia, Caroli & Cocchi, 2011). Peptide (YINQMPQKSRE) purified
from egg yolk protein hydrolysates exhibited DPP-IV inhibition activity with IC50 value
of 222.8 μg/mL (Zambrowicz et al., 2015). Peptides length did not correlate with DPP-IV
inhibitory activity since peptides larger than 13 residues exhibited potent DPP-IV
inhibitory activity (Uchida, Ohshiba & Mogami, 2011). Amino acid composition is also
not the primary factor for DPP-IV inhibitory activity, because that the differences in
inhibitory activity between reverse and forward dipeptides Trp-Val was reported
(Nongonierma & FitzGerald, 2013). Further studies are needed to understand the
mechanism of DPP-IV inhibition activity produced by peptides.
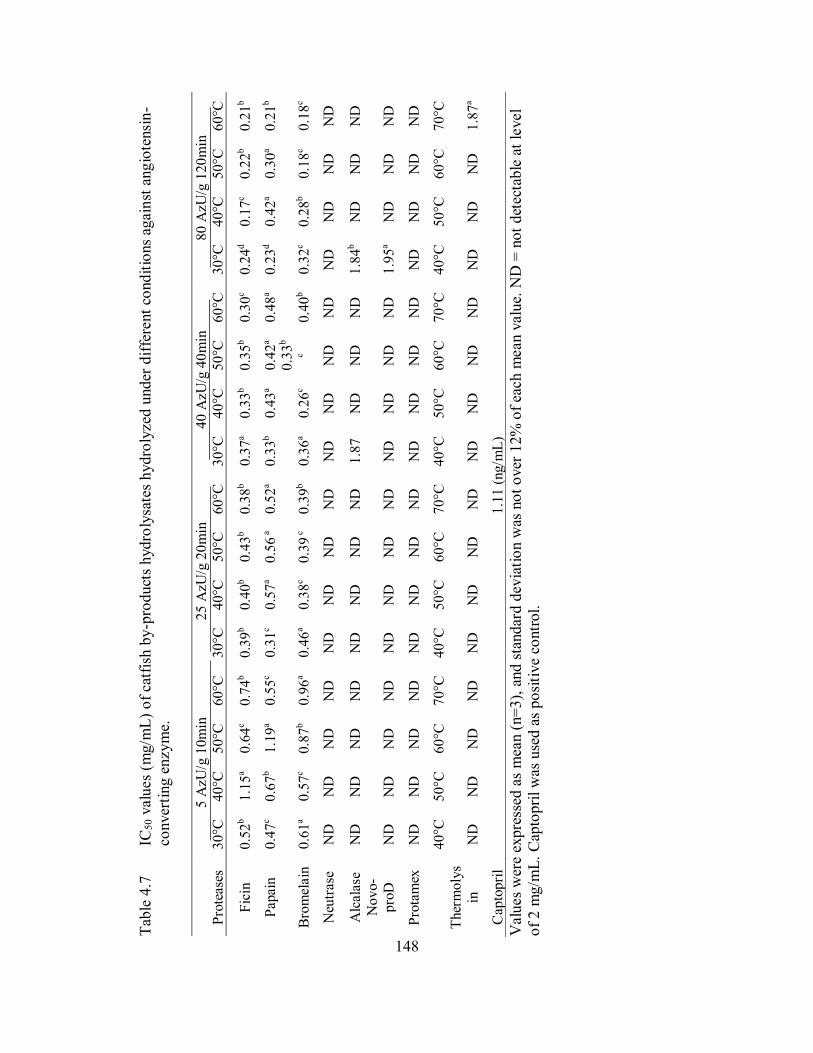
148
Tab
le 4
.7
IC5
0 v
alu
es
(mg/m
L)
of
catf
ish b
y-p
roduct
s hydro
lysa
tes
hydro
lyzed
under
dif
fere
nt
cond
itio
ns
again
st a
ng
iote
nsi
n-
conver
ting e
nzym
e.
Valu
es
wer
e ex
pre
ssed
as
mea
n (
n=
3),
and s
tandar
d d
evia
tio
n w
as n
ot
over
12%
of
each m
ean v
alu
e. N
D =
not
det
ecta
ble
at
level
of
2 m
g/m
L.
Cap
topri
l w
as
use
d a
s po
siti
ve
contr
ol.
Pro
tease
s 5
AzU
/g 1
0m
in
25 A
zU
/g 2
0m
in
40 A
zU
/g 4
0m
in
80
AzU
/g 1
20
min
3
0°C
4
0°C
5
0°C
60°C
30°C
40°C
50°C
60°C
30°C
40°C
5
0°C
6
0°C
3
0°C
4
0°C
5
0°C
6
0°C
Fic
in
0.5
2b
1.1
5a
0.6
4c
0.7
4b
0.3
9b
0.4
0b
0.4
3b
0.3
8b
0.3
7a
0.3
3b
0.3
5b
0.3
0c
0.2
4d
0.1
7c
0.2
2b
0.2
1b
Papain
0
.47
c 0
.67
b
1.1
9a
0.5
5c
0.3
1c
0.5
7a
0.5
6 a
0.5
2a
0.3
3b
0.4
3a
0.4
2a
0.4
8a
0.2
3d
0.4
2a
0.3
0a
0.2
1b
Bro
mel
ain
0
.61
a 0
.57
c 0
.87
b
0.9
6a
0.4
6a
0.3
8c
0.3
9 c
0.3
9b
0.3
6a
0.2
6c
0.3
3b
c 0
.40
b
0.3
2c
0.2
8b
0.1
8c
0.1
8c
Neu
trase
N
D
ND
N
D
ND
N
D
ND
N
D
ND
N
D
ND
N
D
ND
N
D
ND
N
D
ND
Alc
ala
se
ND
N
D
ND
N
D
ND
N
D
ND
N
D
1.8
7
ND
N
D
ND
1
.84
b
ND
N
D
ND
Novo-
pro
D
ND
N
D
ND
N
D
ND
N
D
ND
N
D
ND
N
D
ND
N
D
1.9
5a
ND
N
D
ND
Pro
tam
ex
ND
N
D
ND
N
D
ND
N
D
ND
N
D
ND
N
D
ND
N
D
ND
N
D
ND
N
D
4
0°C
5
0°C
6
0°C
70°C
40°C
50°C
60°C
70°C
40°C
50°C
6
0°C
7
0°C
4
0°C
5
0°C
6
0°C
7
0°C
Ther
moly
s
in
ND
N
D
ND
N
D
ND
N
D
ND
N
D
ND
N
D
ND
N
D
ND
N
D
ND
1
.87
a
Capto
pri
l 1.1
1 (
ng/m
L)
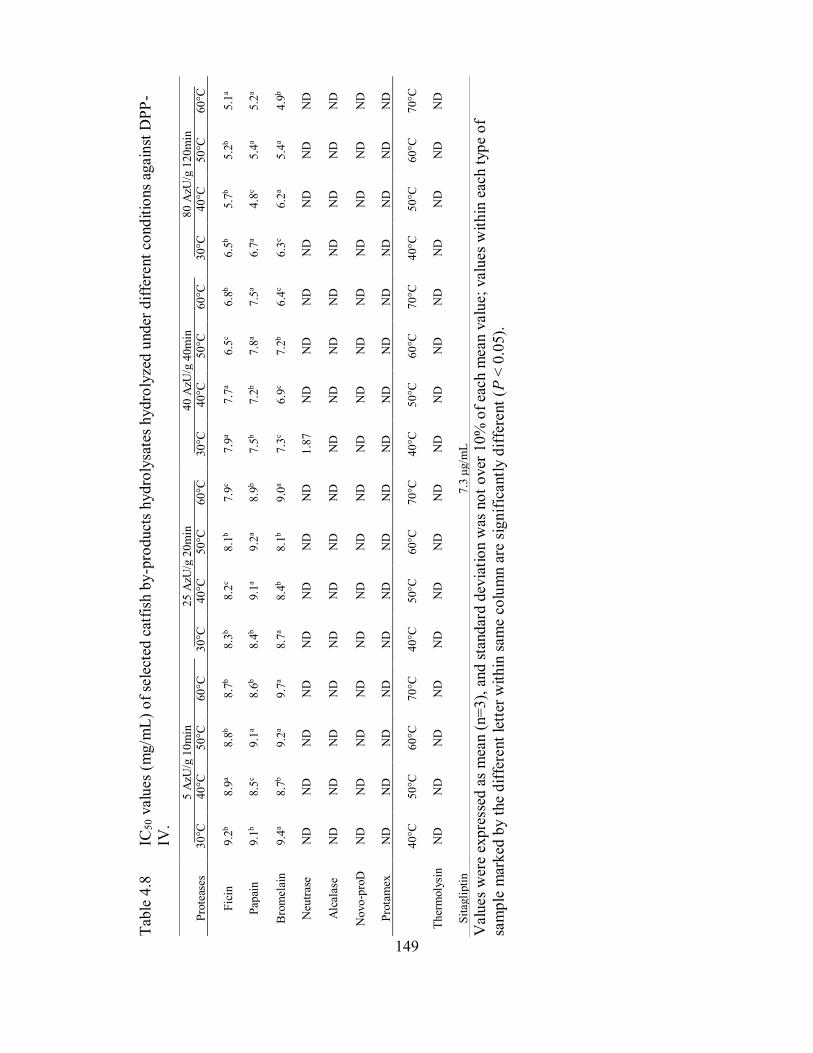
149
Tab
le 4
.8
IC5
0 v
alu
es
(mg/m
L)
of
sele
cted
cat
fish
by
-pro
duct
s hydro
lysa
tes
hydro
lyze
d u
nder
dif
fere
nt
cond
itio
ns
again
st D
PP
-
IV.
Valu
es
wer
e ex
pre
ssed
as
mea
n (
n=
3),
and s
tandar
d d
evia
tio
n w
as n
ot
over
10%
of
each m
ean v
alu
e;
valu
es
wit
hin
eac
h t
yp
e o
f
sam
ple
mar
ked
by t
he
dif
fere
nt
lett
er w
ithin
sam
e co
lum
n a
re s
ignif
icantl
y d
iffe
rent
(P <
0.0
5).
Pro
teas
es
5 A
zU/g
10m
in
25 A
zU/g
20m
in
40 A
zU/g
40m
in
80 A
zU/g
120m
in
30°C
40°C
50°C
60°C
30°C
40°C
50°C
60°C
30°C
40°C
50°C
60°C
30°C
40°C
50°C
60°C
Fic
in
9.2
b
8.9
a 8.8
b
8.7
b
8.3
b
8.2
c 8.1
b
7.9
c 7.9
a 7.7
a 6.5
c 6.8
b
6.5
b
5.7
b
5.2
b
5.1
a
Pap
ain
9.1
b
8.5
c 9.1
a 8.6
b
8.4
b
9.1
a 9.2
a 8.9
b
7.5
b
7.2
b
7.8
a 7.5
a 6.7
a 4.8
c 5.4
a 5.2
a
Bro
mel
ain
9.4
a 8.7
b
9.2
a 9.7
a 8.7
a 8.4
b
8.1
b
9.0
a 7.3
c 6.9
c 7.2
b
6.4
c 6.3
c 6.2
a 5.4
a 4.9
b
Neu
tras
e N
D
ND
N
D
ND
N
D
ND
N
D
ND
1.8
7
ND
N
D
ND
N
D
ND
N
D
ND
Alc
alas
e N
D
ND
N
D
ND
N
D
ND
N
D
ND
N
D
ND
N
D
ND
N
D
ND
N
D
ND
Novo-p
roD
N
D
ND
N
D
ND
N
D
ND
N
D
ND
N
D
ND
N
D
ND
N
D
ND
N
D
ND
Pro
tam
ex
ND
N
D
ND
N
D
ND
N
D
ND
N
D
ND
N
D
ND
N
D
ND
N
D
ND
N
D
40°C
50°C
60°C
70°C
40°C
50°C
60°C
70°C
40°C
50°C
60°C
70°C
40°C
50°C
60°C
70°C
Ther
moly
sin
N
D
ND
N
D
ND
N
D
ND
N
D
ND
N
D
ND
N
D
ND
N
D
ND
N
D
ND
Sit
agli
pti
n
7.3
μg/m
L

150
4.4.12 Protein recovery rate of hydrolysates with good functionalities
Protein recovery rate of hydrolysates with good functionalities were analyzed, and
the results are shown in Table 4.9. The protein recovery rate of hydrolysates with good
functionalities were ranging from 35.9% to 59.7%. In general, papain hydrolysates
showed higher protein recovery rate than others. Capelin protein hydrolysates were
obtained by Alcalase, neutrase and papain hydrolysis, and the protein recovery rate was
ranging from 51.6% to 70.6%, and Alcalase hydrolysates exhibited the highest protein
recovery rate (70.6%) (Shahidi, Han, & Synowiecki, 1995). However, the enzyme was
added based on the weight basis instead of enzyme proteolytic activity. Therefore, it is
impossible to compare the protein recovery rate from the present study with literature at
the same enzyme proteolytic activity. In addition, the present study is the first to report
the Novo-proD hydrolysate obtained from fish proteins, thus make comparison difficult.
Protein hydrolysates were obtained from soybean hulls with Novo-proD (Rojas, Siqueira,
iranda, Tardioli & Giordano, 2014). However, Novo-proD was added on the weight basis
which make comparison impossible.
Comparing the yield of enzymatic hydrolysis to the alkaline extraction (Chapter
5) of the proteins were extracted with different pH’s ranging from 7.5 to 11 at 0.5
interval, and the results indicated that protein recovery rate was the highest (42.8%) from
pH 8.5 extraction and without compromising the protein integrity. The proteins yield was
36.19% (wet basis) for pH 8.5 extraction, and moisture of the extracted protein is around
78%, and the protein content of the extracted protein is 83.71% (dry weight basis). In
addition, the protein content of mixture is 14.85% (wet weight basis). Therefore, the
protein recovery rate of the pH 8.5 extraction was = [0.3619 * (1-0.78) * 0.8371]

151
/(1*0.1485)=42.84%. Enzymatic hydrolysis is an alternative method to utilize the by-
product in terms of the protein recovery rate. However, the bitterness of hydrolysates
should be masked or eliminated if applied to human foods.
4.5 Conclusion
Ficin (80 AzU/g) was the most efficient in hydrolyzing the ground catfish by-
product (DH reaching 71%) in 120 min at 30°C among all the enzymes. The hydrolysis
curves fit the Peleg model well with R2 higher than 0.91. Ficin (80 AzU/g) was the most
efficient in hydrolyzing the ground catfish by-product (DH reaching 71.88%) in 120 min
at 30°C among all the enzymes. Thermolysin could be used for industries to hydrolyze
protein by-products in terms of hydrolysis efficiency and economy. Functional properties
of hydrolysates were affected by pH, and hydrolysates exhibited potent emulsion and
may be used as a replacement of SPI in food processing.

152
Tab
le 4
.9
Pro
tein
rec
over
y r
ate
(%)
of
hydro
lysa
tes
wit
h g
ood f
unct
ionali
ties
.
Valu
es
wer
e ex
pre
ssed
as
mea
n (
n=
3),
and s
tandar
d d
evia
tio
n w
as n
ot
over
10%
of
each m
ean v
alu
e;
valu
es
wit
hin
eac
h t
yp
e o
f
sam
ple
mar
ked
by t
he
dif
fere
nt
lett
er w
ithin
sam
e co
lum
n a
re s
ignif
icantl
y d
iffe
rent
(P <
0.0
5).
Pro
tease
s
5 A
zU/g
10
min
2
5 A
zU/g
20
min
4
0 A
zU/g
40
min
8
0 A
zU/g
12
0m
in
30
°C
40
°C
50
°C
60
°C
30
°C
40
°C
50
°C
60
°C
30
°C
40
°C
50
°C
60
°C
30
°C
40
°C
50
°C
60
°C
Fic
in
43
.7%
c 4
5.6
%b
45
.0%
b
44
.2%
b
44
.9%
b
46
.5%
b
46
.1%
b
43
.9%
b
43
.1%
c 4
3.1
%b
45
.8%
b
44
.4%
b
44
.7%
b
42
.3%
b
47
.1%
b
43
.5%
b
Pap
ain
5
6.7
%a
59
.7%
a 5
5.2
%a
56
.2%
a 5
5.7
%a
58
.4%
a 5
5.7
%a
54
.8%
a 5
7.9
%a
58
.4%
a 5
5.4
%a
55
.7%
a 6
0.2
%a
59
.4%
a 5
5.5
%a
54
.3%
a
Bro
mel
ain
4
1.1
%d
42
.0%
c 3
9.2
%c
44
.5%
b
39
.7%
c 4
0.5
%c
38
.3%
c 4
3.8
%b
38
.5%
d
39
.4%
b
35
.9%
c 3
7.1
%c
39
.9%
c 3
9.0
%c
34
.9%
c 3
6.2
%c
Nov
o-
pro
D
48
.9%
b
NA
4
6.8
%b
NA
4
8.4
%b
NA
4
7.3
%b
NA
4
8.8
%b
NA
4
6.8
%b
NA
N
A
NA
4
8.4
%b
NA
4
0°C
5
0°C
6
0°C
7
0°C
4
0°C
5
0°C
6
0°C
7
0°C
4
0°C
5
0°C
6
0°C
7
0°C
4
0°C
5
0°C
6
0°C
7
0°C
Ther
moly
sin
3
6.3
%
39
.3%
4
2.2
%
51
.2%
3
7.1
%
40
.2%
4
1.6
%
49
.3%
3
6.1
%
39
.9%
4
2.0
%
47
.7%
3
5.2
%
40
.1%
4
1.3
%
44
.8%

153
4.6 Research diagram in proposal
Research diagram of hydrolyzing catfish by-products in proposal are shown in
Figure 4.18. Future work and limitation of the current study will be discussed in Chapter
VI.
Figure 4.18 Research diagram of utilization of catfish by-product for making protein
hydrolysates.

154
CHAPTER V
EFFECT OF EXTRACTION PH AND TRANSGLUTAMINASE CROSS-LINKING
ON PHYSICOCHEMICAL AND TEXTURAL CHANGES IN MYOFIBRILLAR
PROTEINS EXTRACTED FROM CHANNEL CATFISH BY-PRODUCTS
5.1 Abstract
Myofibrillar proteins were firstly extracted from catfish by-products (mixture of
heads and frames) with different pH conditions, and then made into protein gels.
Transglutaminase (TGase) was incorporated to improve the gel structure. Solubility and
secondary structure of extracted myofibrillar proteins were studied. Gelling properties of
the protein gels were studied by dynamic rheological measurement. Physicochemical,
textural and thermal properties of protein gels treated with TGase were investigated.
Protein pattern changes of TGase treated protein gel was studied by SDS-PAGE. Results
indicated that alpha-helicity of myofibrillar proteins decreased with the extraction pH
over 9. Storage modulus (G’) of protein sol decreased as the increase of extraction pH (9-
11). Transglutaminase treatment had significant effect on the denaturation temperature
and enthalpy of protein gel. Rheological measurement of TGase treated protein sol
showed that excessive TGase could weaken the gel structure. Myofirbillar proteins could
extracted from catfish by-products and made into protein gels which is a value-added
product.

155
Keywords: Channel catfish by-products, circular dichroism, dynamic rheology,
differential scanning calorimetry, transglutaminase, protein gel.
5.2 Introduction
Channel catfish aquaculture is one of the most important aquaculture in United
State. Mississippi state ranks No. 1 in catfish production for continuous 5 years (Catfish
production (USDA, 2013, 2014, 2015, 2016 and 2017). Channel catfish fillet production
is one of the most important part of the local economy. However, large number of by-
products were generated during fillet processing which including skin, frames and heads.
Collagen has been successfully extracted from catfish skin with high yield and reported
earlier (Tan & Chang, 2018). Those by-products account more than 50% of the whole
fish weight which were disposed. Those by-products were regarded as waste and most of
them were processed into aquaculture feed, otherwise, it would cause serious
environment pollution. In addition, there is a shortage of protein supply worldwide, and
recovering proteins from catfish by-products is an excellent way to provide low-cost
animal proteins to fulfill global human nutritional needs.
Traditionally, surimi is made from fish meat of both salt and fresh water origins.
China is the first to produce fish ball back to year 220 BC (Park, Nozaki, Suzuki, &
Beliveau, 2013). In United State, crabsticks are made from Alaska Pollock or Pacific
Whiting after extensive washing. However, Channel catfish has never been used
commercially to make surimi or surimi like products since it has higher value in the form
of fillet. Using fish meat to make surimi products such as fish ball, fish cake and fish tofu
have been studied thoroughly (Jenkelunas & Chan, 2018; Moon, Yoon, & Park, 2017).
Protein isolate from catfish fillet have been extracted by acid and alkaline extraction

156
methods and made into protein gels (Kristinsson & Liang, 2006). However, such protein
gel made from catfish fillet has remained only in the stage of research since using fillet to
make protein gel is cost prohibitive. In addition, the nativity of the proteins is affected by
extraction/processing technology that imposes shearing force during grinding and mixing,
and degradation by endogenous hydrolytic enzymes that need to be controlled by cooling
and use of protease inhibitors. It is a challenge to maximize processing yield and the
quality of protein end-products from less desirable raw materials such as fish by-
products. Research for making food-grade products from the by-products is still in its
infancy. And this is the first study to show that the possibility of using proteins extracted
from catfish by-products (mixture of heads and frames) to make protein gel (surimi like
product), and to compare secondary structure, physicochemical and thermal properties of
proteins under different alkaline extraction conditions. The objective of this study was to
investigate (1) the secondary structure changes of myofibrillar proteins under different
extraction pHs, (2) physicochemical, textural and thermal properties of the protein gel
made from proteins extracted from catfish by-products, and (3) the effect of
transglutaminase on protein gels.
5.3 Materials and methods
5.3.1 Materials
Catfish heads and frames were collected from local catfish fillet processing
company (Country Select, Isola, MS). All the samples were buried in crushed ice during
transportation to laboratory. Heads and frames were ground using a meat grinder (LEM
Products #32, West Chester, OH) for six cycles, and the ground frames and heads were
mixed with 3% sorbitol, 3% polytriphosphate and 3% sucrose, and stored at -80°C until
157
use.
5.3.2 Chemicals
All chemicals, reagents were analytical grade and obtained from Sigma-Aldrich
Chemical Company (St. Louis, MO, USA). Sucrose and sorbitol are food grade and
obtained from local market.
5.3.3 Myofibrillar protein extraction
Ground catfish heads and frames were well mixed (w/w = 3:2). The by-products
mixture was mixed with 4 times volume of chilled water which contained 0.5% EDTA.
The pH of the slurry was adjusted to 7.5, 8, 8.5, 9, 9.5, 10, 10.5 and 11, and extract for 30
min at 4 °C with continuous stirring. The slurry was then passed through 0.5 mm sieve to
remove the pigment, and the pH of the protein solution was adjusted to 5.5 and
centrifuged at 5000 rpm for 30 min at 4 °C. Discard the supernatant and oil layer, weight
the pallet and measure the moisture content of pallet. Yield (%) = weight of pallet (g)/
weight of the mixed by-products (g). The precipitated proteins were collected for further
analysis and protein gel making.
5.3.4 Circular dichroism (CD)
Extracted myofibrillar proteins were dissolved in 0.3 M NaCl and diluted to a
concentration of 0.3 mg/mL. CD spectrum were recorded by a Jasco 810
spectropolarimeter (Jasco International Co., Easton, MD) with a Peltier jacketed
software-controlled multiple cuvette holder according to our previous study (Tan &
Chang, 2018). Myofibrillar proteins extracted with pH 7 was used as control. CD
spectrum of the myofibrillar proteins were analyzed using a 0.1 cm path length quartz

158
cell for far-UV measurement. Spectrum was recorded from 200 to 250 nm, and the scan
rate was set as 100 nm/min. Five scans were taken for each sample. Estimate α-helicity
was calculated according to the previous method (Liu, Zhao, Xiong, Xie, & Liu, 2007). A
mean residue weight of 110 g/mol has been assumed.
5.3.5 Effect of pH on solubility of extracted myofibrillar proteins
The relative solubility test was determined according to the previous method with
some modifications (Kristinsson, Theodore, Demir, & Ingadottir, 2005). Extracted
myofibrillar proteins were mixed with deionized water (1:5) and adjust pH to
corresponding extraction pH, then homogenized for 1 min (6000 rpm). Determine the
protein content in the protein homogenate with Bradford assay (Bradford, 1976), and
adjust the final protein concentration to 10 mg/mL. Then separate the protein solution to
12 fractions, adjust the pH of each fraction from 1 to 12 at 1 pH interval. Centrifuge to
precipitate the undissolved proteins, the protein concentration in supernatant was
determined by Bradford assay (Bradford, 1976). The relative protein solubility was
calculated by dividing the protein content in supernatant by the protein content before pH
adjustment.
5.3.6 Production of protein gel and transglutaminase treatment
Protein gel preparation was performed according to the method reported
previously (Huang, Abdel-Aal, & Awad, 1996). The pH of extracted myofibrillar proteins
was adjusted to neutral, and the moisture content was adjusted to 80% by adding water.
Then mixed with 3 % NaCl and 3% potato starch by grinding using a mortar and pestle
for 100 times (clockwise) at room temperature to obtain protein sol. Transglutaminase at

159
the concentration of 0.1, 0.5, 1, 2 and 4 U/g of proteins (protein content was determined
by Kjeldahl method) were added to proteins extracted with pH 8.5 before mixing by
using mortar and pestle. Protein sol treated with 1 U/g of TGase was incubated for
different times (0-120 min) at 40°C to study the protein changes during TGase treatment.
The well mixed protein sol was split into two parts, one part was stuffed into 60 mL
syringe (3 cm in diameter and 10 cm in length), and the other parts were saved for
dynamic rheological measurement. The syringes were placed in a stainless-steel rack and
covered with a glass ball on the top to prevent water evaporation during incubation. The
rack was then incubated at 40 °C water bath for 30 min and then 90°C for 20 min. Rack
was taken out after time achieved, and store at 4°C overnight to obtain protein gel.
5.3.7 Dynamic rheological measurement
The well mixed protein sol made from myofibrillar proteins extracted under
different pH were used for dynamic rheological measurement. Dynamic rheological
measurements were performed on an Anton paar dynamic rheometer (MCR 502, Anton
Paar, Houston, TX, USA). A parallel-plate geometry of 25 mm diameter and normal
force of 1 N were set for measurement. The protein sol was placed between the parallel
plates of the rheometer. The excess samples protruding beyond the upper plate was
removed. Silicone oil was gently applied to the edge of exposed sample to prevent
moisture loss during temperature increasing. Protein sol on the parallel plates were
allowed to rest for 2 min before analysis to ensure both thermal and mechanical
equilibrium at the time of measurement. For temperature sweep, samples were heated at a
speed of 1°C/min from 10 to 90 °C with 0.1% shear strain (γ) and 10 Hz frequency.

160
Storage modulus (G’) was recorded from the temperature sweep test. Three replicates of
each sample were measured.
5.3.8 Differential scanning calorimetry (DSC)
Myofibrillar proteins extracted with pH 8.5 was made into protein sol and treated
with transglutaminase at different concentrations. The protein gels were used for
differential scanning calorimetry analysis. DSC was carried out using a differential
scanning calorimetry (Perkin Elmer, Model DSC8000, Norwalk, CA, USA). Twenty
micrograms of cooked protein gels were exactly weighted and transferred to aluminum
pan and sealed, and empty pan was used as reference. The sample was scanned at
1.5°C/min over the range of 20-80°C in a nitrogen atmosphere.
5.3.9 Textural analysis and cooking loss
Textural analysis of the protein gel was carried out by using TA.XTplus Texture
Analyzer (Stable Microsystems, Godalming, Surrey, UK). Protein gels were removed
from the syringe and cut into specimens with 2.5 cm in height. Breaking force (g) and
deformation distance (mm) were measured by texture analyzer which equipped with a 5-
mm diameter plunger and the depression speed was set at 60 mm/min. The syringe and
protein gels were weighed before and after cooking. Cooking loss (%) was calculated by
dividing weight difference before and after cooking by weight before cooking.
5.3.10 Color
The color of protein gels was measured by a benchtop color meter
(Hunter Lab Colorimeter D-25, Hunter Associates Laboratory, Ruston, USA). Hunter
color (“L”, “a”, “b”) of protein gels were measured according to our previous method

161
(Kong, Chang, Liu, & Wilson, 2008). Three random spots of each sample were measured
and the averages were recorded.
5.3.11 SDS-PAGE analysis
Electrophoresis was carried out according to the method of Laemmli (1970).
Protein profiles of extracted myofibrillar protein and proteins during each extraction
stage were analyzed by SDS-PAGE gel, protein pattern changes upon TGase treatment (1
U/g of proteins, incubated at 40°C for 0-120 min) was studied as well. Electrophoresis
was performed on a 2-20% gradient gel (16×20 cm). Twenty-five micrograms of proteins
were loaded to each well, electrophoresis was conducted at room temperature with
circulating cooling water at 80V for 1.5 hrs, and 125V for 2 hrs, then 150V for 2hrs, and
followed 175V for 1 hr. Proteins were stained with 0.1% Commassie Brilliant Blue R-
250 dissolved in water, methanol and acetic acid (9:9:2, v/v/v) for 1 hr, then destained
using a solution containing water, methanol and acetic acid (17:1:2, v/v/v). For the
quantification of new polymers and other bands, gels were scanned and analyzed by a
Molecular Imager (Bio-Rad Chemidoc™ XRS+, Hercules, CA, USA) equipped with
Image Lab™Analysis Software (version 5.3).
5.3.12 Scanning electron microscopy (SEM)
Cooked protein gels (0.25×0.25×0.25 cm3) were fixed with 2.5% glutaraldehyde
in 0.2 M Sorenson’s phosphate buffer (pH 7.2) for 2 hrs at room temperature. Fixed
specimens were dehydrated in ethanol solution with serial concentrations of 30%, 50%,
70%, 85%, 95% and 100%, and then critical point dried (Autosamdri-931, Tousimis,
MD) using CO2 as transition fluid. The prepared samples were mounted on copper

162
specimen holders, sputter-coated with gold by Turbo-pumped sputter and carbon coater
(EMS 150T ES, Hatfield, PA). And examined on a JSM 6500F scanning electron
microscope (JEOL, Ltd., Akishima, Japan).
5.3.13 Statistical analysis
All the experiments were carried out on a completely randomized design and
performed in triplicate. Data were analyzed by ANOVA using 2016 SAS (version 9.4,
SAS Inc., Cary, NV, USA). Duncan’s multiple range test was carried out to determine
any significant differences between different pH extraction conditions.
5.4 Results and discussion
5.4.1 Yield of extracted myofibrillar proteins
Yield of myofibrillar proteins increased from 29.09% to 56.70% (wet weight
basis) when the extraction pH increases from 7.5 to 11. Strong correlation between
estimated α-helicity (%) of myofibrillar proteins extracted under different pH and yield
(moisture removed) was observed (R2 = 0.85). This observation showed a negative
correlation between yield and α-helicity of extracted proteins. The α-helicity of extracted
proteins decreased with the increase of extraction pH (9-11). Previous study had reported
that alkaline treatment decrease the α-helical structure of myosin extracted from catfish
fillet, however, only few pH points (pH 11, 11.5 and 12) were studied and no yield data
were reported (Raghavan & Kristinsson, 2008). We are the first to report the correlation
between protein yield and estimated α-helicity, which provide important information on
protein conformational changes upon alkaline extraction. Previous report indicated that if
a yield of 20% could be achieved, it would be economically feasible (McAlpin, Dillard,

163
Kim, & Montanez, 1994). Yield over 20% could be obtained in the current study without
compromise the α-helicity of the extracted proteins (36.19% with pH 8.5 extraction).
Therefore, to extract myofibrillar proteins from catfish by-products for value-added
product is practicable based on the economic analysis and the data obtained in the present
study.
5.4.2 Circular dichroism of extracted myofibrillar proteins
In order to gain insight into the secondary structure of extracted myofibrillar
proteins, secondary structure of extracted myofibrillar proteins was analyzed by circular
dichroism. CD spectrum of myofibrillar proteins extracted under different pH are shown
in Figure 5.1. Secondary structure of myofibrillar proteins was significantly affected by
extraction pH at the range of 9-11. The α-helical structure of proteins could be stabilized
by the hydrogen bond between carbonyl oxygen and amino hydrogen (Bastidas, Green,
Sprague, & Peters, 2016), and the electrostatic interaction between amino acids
(Adhikari, Somerset, Stull, & Fajer, 1999). CD spectrum of all the extracted proteins
exhibited two negative peaks at 222 and 208 nm, which is the predominant presence of α-
helical structure (Greenfield, 1999). CD spectrum of myofibrillar proteins extracted under
pH 7.5-8.5 were similar to control. However, the intensities of peaks were decreased with
extraction pH increasing (from 9-11), which indicated that the loss of α-helical
conformation upon alkaline extraction (pH 9-11). And relative α-helicity% of extracted
proteins was decreased from 36.6% to 28.8% with the extraction pH increased from 8.5
to 11. Conformational changes of myofibrillar proteins after alkaline treatment was
observed before (Raghavan & Kristinsson, 2008). The loss of α-helical structure of
myofibrillar proteins was also observed after the oxidation of proteins (Cao & Xiong,

164
2015). CD spectrum of myofibrillar proteins after treated with high pressure (200 to 600
MPa) exhibited significant lower peak intensity at 222 and 208 nm (Villamonte, Jury,
Jung, & Lamballerie, 2015). Most recent, the CD spectrum of fresh and thawed
myofibrillar proteins were reported, the results showed the loss of α-helical conformation
after thawing the meat in air (Jia, Nirasawa, Ji, Luo, & Liu, 2018). Though the loss of α-
helical structure of myofibrillar proteins had been reported, no study on gels which made
from those myofibrillar proteins has been reported. The present study was the first to
report the secondary structure changes of myofibrillar proteins extracted with broader
alkaline conditions (7.5-11). Therefore, this makes comparing the current results with
literature difficult.

165
Figure 5.1 Circular dichroism spectrum of myofibrillar proteins extracted under
different pH.
5.4.3 Effect of pH on solubility of extracted myofibrillar proteins
Myofibrillar proteins extracted under different pH were used for relative solubility
test. The effect of pH on solubility of extracted myofibrillar proteins are shown in Figure
5.2. The protein solubility followed a U shape curve, a typical of muscle protein
solubility curve (Choi & Park, 2002). The protein solubility sharply increased below pH
5 and above 10. The greatest solubility was observed at pH 3 in the acid range and pH 12
in the alkaline range. It was reported that the isoelectric point of myofibrillar proteins
from Channel catfish is 5.5 (Kristinsson, Theodore, Demir, & Ingadottir, 2005). When
the pH of protein solution close to the isoelectric point, the net charge of the protein
molecules was close to 0, which lead to protein precipitation. And this is the reason why
-25
-23
-21
-19
-17
-15
-13
-11
-9
-7
-5
200 205 210 215 220 225 230 235 240 245 250
CD
(m
deg
)
Wavelength (nm)
pH 7.5 pH 8 pH 8.5 pH 9 pH 9.5
pH 10 pH 10.5 pH 11 control

166
the extracted myofibrillar proteins exhibited extremely low solubility (ranging from
1.69% to 3.35%) at pH 5 and 6. In contrast, when the pH of protein solution was far away
from isoelectric point, the solubility of protein was increased by the repulsion forces (Tan
& Chang, 2018). Myofibrillar proteins extracted with weak alkaline conditions (pH 7.5-
8.5) exhibited higher solubility than that of higher pH (9-11) extracted proteins (pH 8.5
extracted proteins showed 13.73% higher solubility than the pH 11 extracted proteins at
pH 8). This observation was consistent with the CD spectra which indicated that the
myofibrillar proteins extracted at lower pH had similar CD spectra with control group
(pH 7 extraction). Loss of α-helical structure (partially denatured) would lead to
decreased solubility. Increased solubility at extreme pH conditions has been attributed to
the negative or positive charge of the protein at high or low pH, respectively.

167
Figure 5.2 Effect of pH on the solubility of myofibrillar proteins extracted under
different pH.
5.4.4 Rheological properties of protein gel made from extracted myofibrillar
proteins treated with and without transglutaminase
Traditionally, surimi was made from fish fillet with addition of salt (Park, Nozaki,
Suzuki, & Beliveau, 2013). Proteins extracted from fish muscle were used for protein gel
making recently (Xiong, et al., 2009; Zhang, Xu, Li, Wang, Xue, & Xue, 2018).
However, the current study was the first to report protein gel made from myofibrillar
proteins extracted from catfish by-products (the mixture of heads and frames). The
protein sol (before cooking) were made from myofibrillar proteins which extracted under
different pH, and the rheological profiles of those protein sol are shown in Figure 5.3.
Storage modulus (G’) representing elastic properties, it increased from 20 °C and reached
0.00%
10.00%
20.00%
30.00%
40.00%
50.00%
60.00%
70.00%
80.00%
90.00%
100.00%
0 1 2 3 4 5 6 7 8 9 10 11 12
Rel
ativ
e so
lubil
ity (
%)
pH
pH 7.5 pH 8 pH 8.5 pH 9
pH 9.5 pH 10 pH 10.5 pH 11

168
to the first peak at 43.47 °C for all the samples except protein sol made from pH 11
extracted myofibrillar proteins, suggesting the transformation from a viscous sol to an
elastic network (Liu, Zhao, Xiong, Xie, & Liu, 2007). And then the storage modulus G’
decreased reaching to the valley at around 48 °C. The decreasing in G’ might be caused
by the endogenous proteases in the protein sol, which lead to the dissociation of actin-
myosin and the denaturation of myosin tail. The first peak of protein sol made from pH
11 extracted myofibrillar protein was at 38.4 °C, which was lower than that of other
samples. As temperature further increasing, the second peak of protein sol made from pH
11 extracted proteins (56.63 °C) was much lower than others (about 73 °C). An
increasing in storage modulus (G′), which represents energy recovered per cycle of
sinusoidal shear deformation, indicated an increase in rigidity of the sample associated
with the formation of elastic gel structure (Yin, Reed, & Park, 2014). G’ of protein sol
made from pH 7.5, 8 and 8.5 extracted myofibrillar proteins were very similar. G’
decreased significantly (82.1% decreased at 90°C) with the increase of protein extraction
pH (8.5-11). This observation and the CD spectrum was mutual supportive. Correlation
analysis between storage modulus at the first peak and estimated α-helicity (%) was
conducted. The result indicated that the storage modulus (G’) of protein sol made from
different pH extracted myofibrillar proteins is positive correlated (R2 = 0.94) with α-
helicity (%) of the corresponding myofibrillar proteins. Myofibrillar proteins were
extracted from catfish muscle with alkaline conditions (pH 11, 11.5 and 12), and the
rheological properties of extracted proteins was studied (Raghavan & Kristinsson, 2008).
However, the rheological properties were determined on protein solution instead of
protein sol which make comparison difficult.

169
Transglutaminase was used to improve the gel properties of surimi (Cando,
Herranz, Borderías, & Moreno, 2016; Hu, et al., 2015). Transglutaminase could catalyze
the acyl transfer reaction, and creates larger molecules from small protein substrates
through the cross-linking reaction between glutamine residues and lysine residues in
protein molecules (Kuraishi, Sakamoto, & Soeda, 1996). The protein sol made from pH
8.5 extracted myofibrillar protein from catfish by-products was used for further TGase
treatment (1U/g of protein). Different concentrations of transglutaminase (TGase) were
mixed with extracted proteins and set for 2 hrs at 40 °C. The rheological profiles of those
TGase treated protein sols are shown in Figure 5.4. In general, storage modulus of protein
sol was increased as the addition of TGase. The storage modulus (G’) increase 42.1% at
10°C with the addition of TGase of 0 to 4 U/g of proteins. Storage modulus (G’)
representing elastic properties increased from 20 °C and reached the first peak at 43.47
°C for all the samples except protein sol treated with 2 and 4 U/g of proteins, which
indicated that higher concentrations of TGase could not help to improve the gel structure
of protein sol. In addition, storage modulus of protein sol treated with 2 and 4 U/g of
proteins were much lower than 1 U/g of proteins at 90 °C (19.9% and 41.0% lower than 1
U/g treated protein gels, respectively), which indicated that the denaturation of the
structure of protein sols. No literature has reported the rheological properties of protein
sol made from myofibrillar proteins extracted from catfish by-products, therefore,
comparison with literature was impossible.
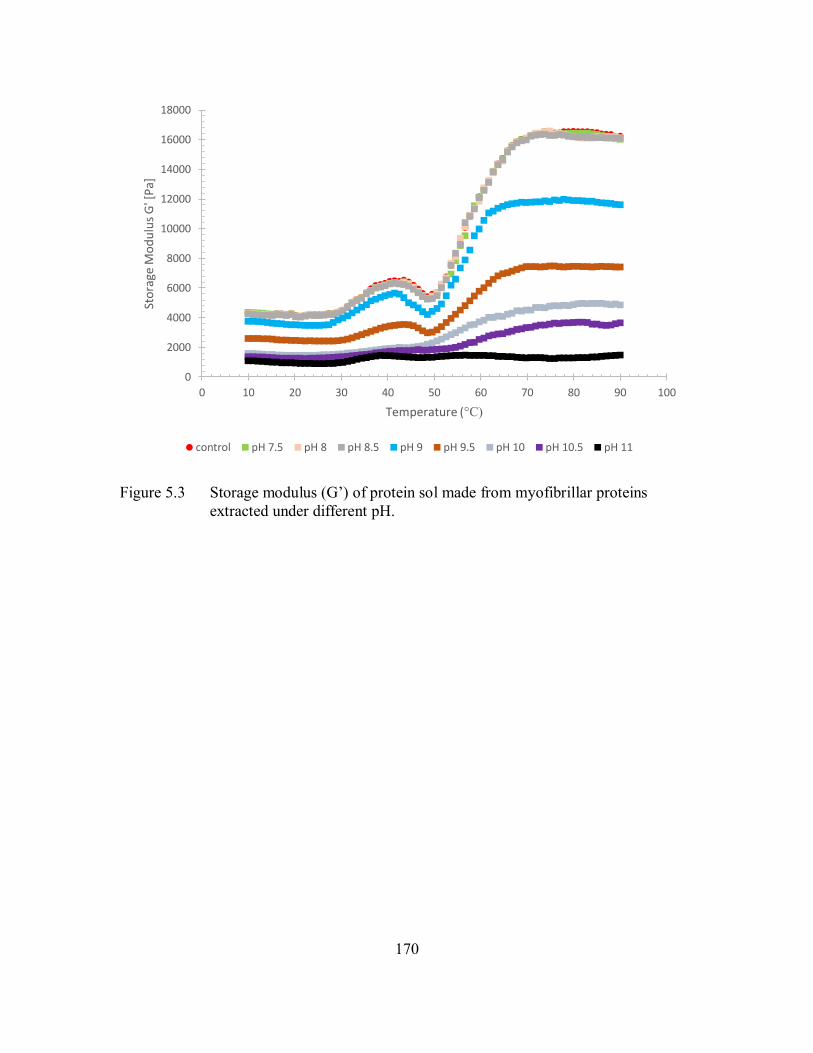
170
Figure 5.3 Storage modulus (G’) of protein sol made from myofibrillar proteins
extracted under different pH.
0
2000
4000
6000
8000
10000
12000
14000
16000
18000
0 10 20 30 40 50 60 70 80 90 100
Sto
rage
Mo
du
lus
G' [
Pa]
Temperature (°C)
control pH 7.5 pH 8 pH 8.5 pH 9 pH 9.5 pH 10 pH 10.5 pH 11

171
Figure 5.4 Storage modulus (G’) of transglutaminase treated protein sol made from
myofibrillar proteins extracted from catfish by-products (mixture of frames
and heads).
Protein sol were treated with transglutaminase at 0 to 4 U/g of proteins level.
5.4.5 Differential scanning calorimetry
Enthalpy and maximum temperature of denaturation are two main factors in
determination of thermal properties of surimi and surimi-like products. The Tmax and ∆H
of protein sol treated with different concentrations of transglutaminase and control group
(without TGase) were recorded by DSC, the results are shown in Figure 5.5.
Thermograms of all samples showed two endothermic peaks, which are corresponding to
the thermal denaturation of myosin and actin, respectively (Wright, Leach, & Wilding,
1977). Results showed that transglutaminase treatment had significant effect on
0
2000
4000
6000
8000
10000
12000
14000
16000
18000
0 10 20 30 40 50 60 70 80 90 100
Sto
rage
Mo
du
lus
G' [
Pa]
Temperature (°C)
control 0.1 U/g 0.5 U/g 1 U/g 2 U/g 4 U/g

172
denaturation temperature and enthalpy of protein gels. Maximum temperature of
denaturation for myosin significantly increased from 43.13 to 45.29 °C when the
transglutaminase concentration was increased from 0 to 1 U/g of proteins. However,
maximum transition temperature decreased from 45.29 to 38.34°C for protein gel treated
with TGase of 2 and 4 U/g of proteins. The Tmax of actin treated with 1 U/g of proteins
was significant higher than that of control. There is no significant difference between the
enthalpy of myosin in protein gels treated with 2 and 4 U/g of proteins. A significant
increase in enthalpy of myosin was observed when transglutaminase concentration
increased from 0.1 to 1 U/g of proteins, which suggested that higher transglutaminase
concentration induced more denaturation and thus better texture characteristics (Park,
Cho, Kimura, Nozawa, & Seki, 2005). Transglutaminase could catalyze the formation of
iso-peptide bond between glutamine and lysine, and this iso-peptide bonds is important
for the formation of stable protein network. And this cross-linking results in the changes
in the hydrophobicity of the protein surface, and affecting the denaturation temperature of
proteins.

173
Figure 5.5 Differential scanning calorimetry thermograms of transglutaminase-treated
protein gels made from myofibrillar proteins extracted from catfish by-
products.
5.4.6 Penetration test, cooking loss and color of transglutaminase treated
protein gels
The punch test is the most popular measurement technique used in surimi industry
for evaluating the gel properties of surimi (Park, 2013). Breaking force, deformation
distance, cooking loss and color of TGase treated protein gel are shown in Table 5.1.
Breaking force and deformation distance of TGase treated protein gel were increased
with the addition of TGase from 0-1 U/g of proteins. However, breaking force and
deformation distance was decreased when the concentrations of TGase over 1 U/g of
20 30 40 50 60 70 80 90
Heat
flow
(W
/g)
Temperature (°C)
control 0.1 U/g 0.5 U/g 1 U/g 2 U/g 4 U/g
Tmax
= 43.13 °C, ∆H = 1.23 J/g
Tmax
= 76.58 °C, ∆H = 0.87 J/g
Tmax
= 43.37 °C, ∆H = 1.54 J/g T
max = 76.48 °C, ∆H = 0.95 J/g
Tmax
= 44.28 °C, ∆H = 2.04 J/g
Tmax
= 76.67 °C, ∆H = 1.15 J/g
Tmax
= 45.29 °C, ∆H = 2.21 J/g
Tmax
= 76.62 °C, ∆H = 1.22 J/g
Tmax
= 41.27 °C, ∆H = 1.48 J/g
Tmax
= 76.55 °C, ∆H = 0.84 J/g
Tmax
= 76.47 °C, ∆H = 0.81 J/g
Tmax
= 38.34 °C, ∆H = 1.43 J/g

174
proteins. This observation was consistent with previous report that breaking force and
deformation distance of surimi gel made from tilapia fillet would decreased when
excessive TGase was added (Seighalani, Bakar, Saari, & Khoddami, 2017). Protein gel
treated with 1 U/g of proteins showed the highest breaking force and deformation
distance. The cooking loss significantly increased when the TGase concentration over 1
U/g of proteins. The use of TGase above an optimum concentration caused a detrimental
effect on the textural property of surimi gels had been reported (Ramırez, Rodrıguez-
Sosa, Morales, & Vázquez, 2000). The above report was in accordance with the other
study that the breaking force and deformation of surimi gels made from Pollock increased
when TGase increased up to a certain level and further increase in TGase decreased the
gel strength of surimi gels (Jiang, Hsieh, Ho, & Chung, 2000). TGase induces the cross-
linking between glutamine and lysine residues through non-disulfide covalent bonds
(Zhang, Xu, Li, Wang, Xue, & Xue, 2018), which lead to the formation of myosin heavy
chain cross-linking and then result a stronger gel structure (Ma, Yi, Yu, Li, & Chen,
2015). Decreasing breaking force and deformation distance of TGase treated protein gel
may attributed to excessive cross-linking. The excessive cross-linking would decrease the
gel strength by impeding intermolecular aggregation, therefore, the network formation
would be affected (Hu, et al., 2018).
Cooking loss of protein gels was significantly affected by adding TGase. Cooking
loss was significantly lower than that of control by adding TGase at the level from 0.1 to
1 U/g of proteins, and increased when the concentrations of TGase over 1 U/g of
proteins. Most of the study had been reported the textural profiles of surimi or surimi-like
product but without reporting the cooking loss (Seighalani, Bakar, Saari, & Khoddami,

175
2017; Guo et al., 2017). And it has been reported that cooking loss of surimi gel was
decreased by adding TGase (Pietrasik, 2003). Increased cooking loss of TGase treated
surimi has not been reported, however, the increased expressible water of excessive
TGase treated surimi has been observed (Seighalani, Bakar, Saari, & Khoddami, 2017),
which suggesting that excessive cross-linking might weaken the water holding capacity
of surimi gel. Water holding capacity is an ability of proteins to soak up water and retain
it within a protein matrix. This kind of trapped water consist of trapped water,
hydrodynamic water and bounded water. The higher the TGase concentration, the greater
is the number of inter and intrachain peptide cross-linking and the lower the water-
protein interaction which results in higher cooking loss. In addition, the color of the
protein gels did not significantly affect by the addition of TGase.
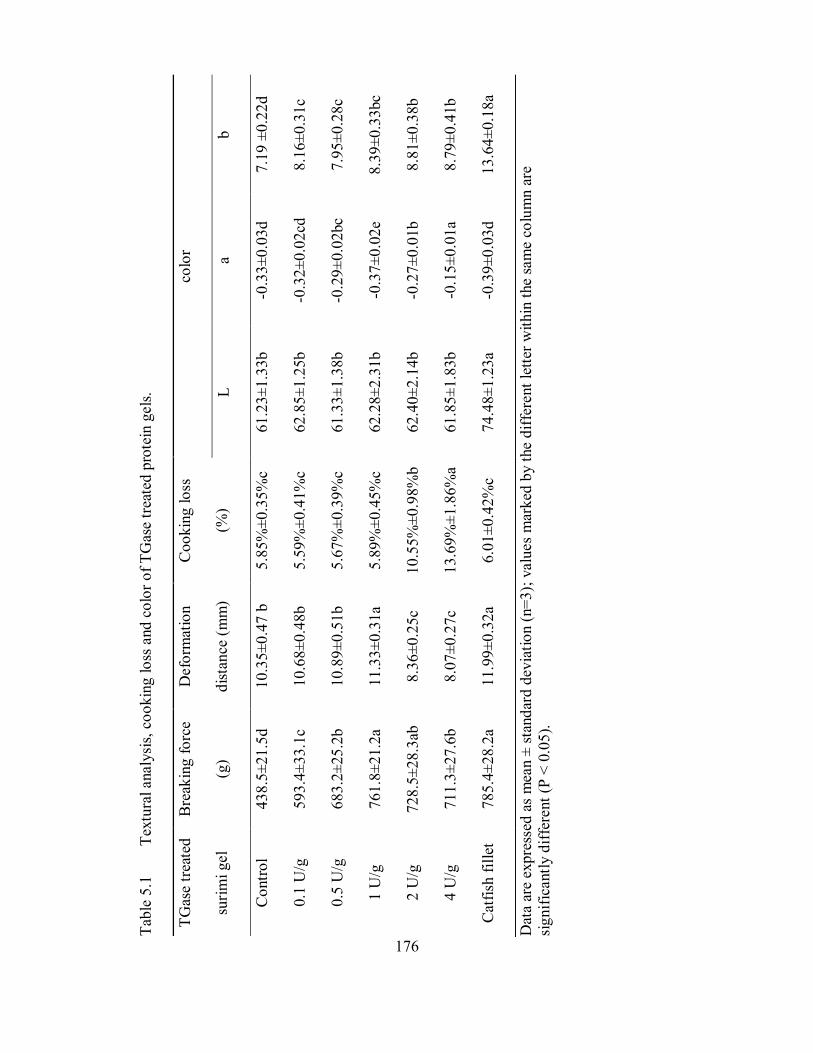
176
Tab
le 5
.1
Tex
tura
l analy
sis,
co
okin
g l
oss
and c
olo
r o
f T
Gas
e tr
eate
d p
rote
in g
els
.
Dat
a ar
e ex
pre
ssed
as
mea
n ±
sta
nd
ard d
evia
tio
n (
n=
3);
valu
es
mar
ked
by t
he
dif
fere
nt
lett
er w
ithin
the
sam
e co
lum
n a
re
sig
nif
icantl
y d
iffe
rent
(P <
0.0
5).
TG
ase
trea
ted
suri
mi
gel
Bre
akin
g f
orc
e
(g)
Defo
rmat
ion
dis
tance
(m
m)
Coo
kin
g l
oss
(%)
colo
r
L
a b
Co
ntr
ol
438.5
±21.5
d
10.3
5±
0.4
7 b
5.8
5%
±0.3
5%
c 61.2
3±
1.3
3b
-0.3
3±
0.0
3d
7.1
9 ±
0.2
2d
0.1
U/g
593.4
±33.1
c 10.6
8±
0.4
8b
5.5
9%
±0.4
1%
c 62.8
5±
1.2
5b
-0.3
2±
0.0
2cd
8.1
6±
0.3
1c
0.5
U/g
683.2
±25.2
b
10.8
9±
0.5
1b
5.6
7%
±0.3
9%
c 61.3
3±
1.3
8b
-0.2
9±
0.0
2bc
7.9
5±
0.2
8c
1 U
/g
761.8
±21.2
a 11.3
3±
0.3
1a
5.8
9%
±0.4
5%
c 62.2
8±
2.3
1b
-0.3
7±
0.0
2e
8.3
9±
0.3
3bc
2 U
/g
728.5
±28.3
ab
8.3
6±
0.2
5c
10.5
5%
±0.9
8%
b
62.4
0±
2.1
4b
-0.2
7±
0.0
1b
8.8
1±
0.3
8b
4 U
/g
711.3
±27.6
b
8.0
7±
0.2
7c
13.6
9%
±1.8
6%
a 61.8
5±
1.8
3b
-0.1
5±
0.0
1a
8.7
9±
0.4
1b
Cat
fish
fil
let
785.4
±28.2
a 11.9
9±
0.3
2a
6.0
1±
0.4
2%
c 74.4
8±
1.2
3a
-0.3
9±
0.0
3d
13.6
4±
0.1
8a

177
5.4.7 SDS-PAGE of TGase-treated protein gel
Though the textural profiles of TGase treated protein gel provide the information
for evaluating the quality of protein gel, the protein profiles changes during TGase
treatment would provide the insight information to understand the protein chemistry of
TGase treated protein gel. The SDS-PAGE gel pf proteins extracted from catfish by-
products, and TGase treated myofibrillar proteins are shown in Figure 5.6. The results
showed that sarcoplasmic proteins were successfully separated from myofibrillar proteins
by pH 5.5 precipitation. The major bands of myofibrillar proteins are myosin heavy chain
and actin. The above results indicated that protein gel treated with 1 U/g of proteins had
the highest breaking force and deformation distances, and the breaking force and
deformation distance were decreased with TGase concentration go over 1 U/g of proteins.
Therefore, TGase of 1 U/g of proteins was chose for the following study. The TGase
treated myofibrillar proteins tends to form new large polymer (252.3KD) after 20 min
treatment at 40°C, the intensity of new formed polymer reaches a platform after 100 min
treatment. Several studies have shown that the breaking force and deformation distance
were increased as the addition of low concentration of TGase and decreased with the
usage of TGase above an optimum concentration (Ramırez, Rodrıguez-Sosa, Morales, &
Vázquez, 2000; Seighalani, Bakar, Saari, & Khoddami, 2017). TGase induces the
formation of non-disulfide bond, which results in the formation of myosin heavy chain
cross-linking and result to a stronger gel. We are the first to show the protein profiles
changes of protein gel made from catfish by-products during TGase treatment at different
time. In addition, most of the TGase treatment study had used the TGase based on the
weight of protein sol (Jiang, Hsieh, Ho, & Chung, 2000; Seighalani, Bakar, Saari, &

178
Khoddami, 2017). However, the protein content of protein sol may vary. It is more
reliable by using TGase based on the protein content in protein gel.
Figure 5.6 SDS-PAGE gel of proteins extracted from catfish by-products, and TGase-
treated protein gel.
Lane 1: Molecular marker; Lane 2: pH 8.5 extracted proteins; Lane 3: supernatant after
pH 5.5 precipitation; Lane 4: pH 5.5 precipitation; Lane 5: MTGase treatment control
group (pH 5.5 precipitation); Lane 6: TGase (1 U/g) treated for 10 min; Lane 7: TGase (1
U/g) treated for 20 min; Lane 8: TGase (1 U/g) treated for 40 min; Lane 9: TGase (1 U/g)
treated for 60 min; Lane 10: TGase (1 U/g) treated for 80 min; Lane 11: TGase (1 U/g)
treated for 100 min; Lane 12: TGase (1 U/g) treated for 120 min.
5.4.8 Scanning electron microscopy
SDS-PAGE gel provides the protein profiles of TGase treated protein gel.
However, it’s still hard to understand the gel structure of TGase treated protein gel, and
Myosin heavy chain
Actin

179
the differences between control (without TGase) and TGase treated protein gels.
Therefore, scanning electron microscopy was used to visualize the microstructure of
protein gel with and without TGase treatment. For comparison, commercial fish ball
(Wei-Chuan, USA) was obtained from local Asian market and used as positive control,
protein gel made from myofibrillar proteins (pH 8.5 extraction) without TGase treatment
was used as negative control. Protein gel treated with TGase at concentrations of 0, 0.1,
0.5, 1, 2, and 4 U/g of proteins for 2 hrs were used for imaging. The images obtained
from SEM are shown in Figure 5.7. The results indicated that as the increase of TGase
concentration from 0 to 1 U/g of proteins, the gel had finer, longer and denser strands
than those without transglutaminase. These strands could form the network with more
fibrillar structure. This observation could be evidenced by a higher breaking force (Table
5.1). And this observation was in agreement with previous study that TGase treated
protein gel from threadfin bream exhibited finer and denser gel network (Kaewudom,
Benjakul, & Kijroongrojana, 2013). Discontinuous network with large holes and grooves
was observed in control protein gel (without TGase) and a denser gel matrix has been
observed after addition of TGase (Chanarat & Benjakul, 2013; Hu, et al., 2015).
However, protein gels with the addition of 2 and 4 U/g of proteins were less compact
than that of 1 U/g of proteins, which indicated that excessive TGase could destroy the gel
network. Excessive transglutaminase would decrease the breaking force of surimi was
observed before (Seighalani, Bakar, Saari, & Khoddami, 2017). However, no
microstructure was reported in the above study which make comparison difficult. Pictures
of protein gels and commercial fish ball are shown in Figure 5.8 for reference.

180
Figure 5.7 Scanning electron microscopy images of TGase-treated protein gels.
A: commercial fish ball; B: protein gel without TGase; C: TGase treated protein gel (0.1
U/g); D: TGase treated protein gel (0.5 U/g); E: TGase treated protein gel (1 U/g); F:
TGase treated protein gel (2 U/g); G: TGase treated protein gel (4 U/g).

181
Figure 5.8 Pictures of commercial fish ball and protein gels made from catfish by-
products with (1 U/g) and without transglutaminase treatment.
Commercial fish ball (Wei-Chuan, USA) was obtained from a local Asian market.
5.5 Conclusion
Higher extraction pH could result in a higher protein extraction yield with the loss
of some integrity of proteins. And extraction pH had significant effect on the secondary
structure of extracted myofibrillar proteins. Myofibrillar proteins extracted with pH 8.5
gave the highest yield without compromise the integrity of extracted proteins.
Rheological profiles of protein sols made from myofibrillar proteins showed that protein
gel made from pH 8.5 extracted proteins was the best. TGase could improve the gel
strength, but excessive TGase would result a weaker gel matrix.

182
CHAPTER VI
SUMMARY OF ACHIEVEMENTS, LIMITATIONS AND FUTURE WORK
6.1 Summary
In summary, catfish by-products including catfish skins, heads and frames have
been successfully extracted into protein products and their properties were characterized.
Collagen was extracted from catfish skin and characterized, the extraction
condition has been optimized, and the extraction kinetics were investigated as well. The
extracted collagen could have applications in food, medical and cosmetic industries.
The mixture of catfish heads and frames was hydrolyzed by 8 proteases (plant or
bacteria derived) under different conditions. Ficin (80 AzU/g) was the most efficient in
hydrolyzing the ground catfish by-product (DH reaching 71.88%) in 120 min at 30°C
among all the enzymes. Thermolysin could be used for the industries to hydrolysis
protein by-products with the highest hydrolysis economy. Functional properties of
hydrolysates were affected by pH, and hydrolysates exhibited high emulsion properties
could be used as a replacement of SPI in food system.
The myofibrillar proteins were extracted from the mixture of catfish heads and
frames with different pH conditions, and made into protein gels. Transglutaminase
(TGase) was incorporated to improve the gel structure. The results indicated that
myofibrillar proteins could be extracted (pH 8.5 without compromise the integrity of

183
proteins) from catfish by-products and made into protein gels, which is a value-added
product.
6.2 Limitations and future work
The research flow diagrams in proposal are shown in Figure 3.7 (Chapter III) and
Figure 4.17 (Chapter IV). Simulated gastrointestinal digestion of protein hydrolysates
was not completed in the present study. The reason was that the proposal is very
ambitious and a new research section (Chapter V) was added to study the extract pH
effect on the myofibrillar proteins in by-products and their protein gels. Simulated
gastrointestinal digestion of the protein hydrolysates should be included in the future’s
study. Future work should be focused on the following areas:
(1) Overall: The data obtained in the present study were from laboratory
experiments. Scaling up experiments should be included in the further study.
(2) Overall: The residue after protein extraction or hydrolysis should be studied.
The residues might could be processed into calcium supplement.
(3) Chapter III: Porcine or bovine derived collagen should be included for
reference/comparison.
(4) Chapter IV: Simulated gastrointestinal digestion of the protein hydrolysates
should be studied in the future.
(5) Chapter IV: The amino acids sequence of the hydrolysates showed good
emulsion capacity, foaming capacity, ACE and DPP-IV inhibition activities should be
studied in the future.

184
(6) Chapter IV: Bitterness of the protein hydrolysates should be studied in the
future.
(7) Chapter V: The color of the protein gels made from myofibrillar proteins
extracted from catfish heads and frames was darker than the commercial surimi products
and should be improved in the future.

185
REFERENCES
Adhikari, B. B., Somerset, J., Stull, J. T., & Fajer, P. G. (1999). Dynamic modulation of
the regulatory domain of myosin heads by pH, ionic strength, and RLC
phosphorylation in synthetic myosin filaments. Biochemistry, 38, 3127-3132.
Adler-Nissen, J. (1977). Enzymatic hydrolysis of soy protein for nutritional fortification
of low pH food. In Annales de la nutrition et de l'alimentation, 32, 205-216.
Adler-Nissen, J. (1979). Determination of the degree of hydrolysis of food protein
hydrolysates by trinitrobenzenesulfonic acid. Journal of Agricultural and Food
Chemistry, 27, 1256.
Amiza, M., Nurul Ashikin, S., & Faazaz, A. (2011). Optimization of enzymatic protein
hydrolysis from silver catfish (Pangasius sp.) frame. International Food Research
Journal, 18, 775-781.
Arnesen, J. A., & Gildberg, A. (2007). Extraction and characterisation of gelatine from
Atlantic salmon (Salmo salar) skin. Bioresource Technology, 98, 53-57.
Asghar, A., & Pearson, A. (1980). Influence of ante-and postmortem treatments upon
muscle composition and meat quality. Advances in Food Research, 26, 53-213.
Avena-Bustillos, R., Olsen, C., Olson, D., Chiou, B., Yee, E., Bechtel, P., & McHugh, T.
(2006). Water vapor permeability of mammalian and fish gelatin films. Journal of
Food Science, 71, E202-E207.
Bastidas, O. H., Green, B., Sprague, M., & Peters, M. H. (2016). Few Ramachandran
Angle Changes Provide Interaction Strength Increase in Aβ42 versus Aβ40
Amyloid Fibrils. Scientific Reports, 6, 36499.
Beddows, C., & Ardeshir, A. (1979). The production of soluble fish protein solution for
use in fish sauce manufacture I. The use of added enzymes. International Journal
of Food Science & Technology, 14, 603-612.
Benhabiles, M., Abdi, N., Drouiche, N., Lounici, H., Pauss, A., Goosen, M., & Mameri,
N. (2012). Fish protein hydrolysate production from sardine solid waste by crude
pepsin enzymatic hydrolysis in a bioreactor coupled to an ultrafiltration unit.
Materials Science and Engineering: C, 32, 922-928.

186
Benjakul, S., & Morrissey, M. T. (1997). Protein hydrolysates from Pacific whiting solid
wastes. Journal of Agricultural and Food Chemistry, 45, 3423-3430.
Bergman, I., & Loxley, R. (1963). Two improved and simplified methods for the
spectrophotometric determination of hydroxyproline. Analytical Chemistry, 35,
1961-1965.
Bougatef, A., Nedjar-Arroume, N., Ravallec-Plé, R., Leroy, Y., Guillochon, D., Barkia,
A., & Nasri, M. (2008). Angiotensin I-converting enzyme (ACE) inhibitory
activities of sardinelle (Sardinella aurita) by-products protein hydrolysates
obtained by treatment with microbial and visceral fish serine proteases. Food
Chemistry, 111, 350-356.
Bradford, M. M. (1976). A rapid and sensitive method for the quantitation of microgram
quantities of protein utilizing the principle of protein-dye binding. Analytical
Biochemistry, 72, 248-254.
BSI (British Standards Institution) (1975). Methods for sampling and testing gelatin
(physical and chemical methods). London: BSI.
Cai, T., Chang, K.-C., & Lunde, H. (1996). Physicochemical properties and yields of
sunflower protein enzymatic hydrolysates as affected by enzyme and defatted
sunflower meal. Journal of Agricultural and Food Chemistry, 44, 3500-3506.
Cando, D., Herranz, B., Borderías, A. J., & Moreno, H. M. (2016). Different additives to
enhance the gelation of surimi gel with reduced sodium content. Food Chemistry,
196, 791-799.
Cao, Y., & Xiong, Y. L. (2015). Chlorogenic acid-mediated gel formation of oxidatively
stressed myofibrillar protein. Food Chemistry, 180, 235-243.
Chanarat, S., & Benjakul, S. (2013). Effect of formaldehyde on protein cross-linking and
gel forming ability of surimi from lizardfish induced by microbial
transglutaminase. Food Hydrocolloids, 30, 704-711.
Chen, J., Li, L., Yi, R., Xu, N., Gao, R., & Hong, B. (2016). Extraction and
characterization of acid-soluble collagen from scales and skin of tilapia
(Oreochromis niloticus). LWT - Food Science and Technology, 66, 453-459.
Chen, S., Chen, H., Xie, Q., Hong, B., Chen, J., Hua, F., Bai, K., He, J., Yi, R., & Wu, H.
(2016). Rapid isolation of high purity pepsin-soluble type I collagen from scales
of red drum fish (Sciaenops ocellatus). Food Hydrocolloids, 52, 468-477.
Chen, C. W., & Ho, C. T. (1995). Antioxidant properties of polyphenols extracted from
green and black teas. Journal of food lipids, 2, 35-46.

187
Cheow, C. S., Norizah, M. S., Kyaw, Z. Y., & Howell, N. K. (2007). Preparation and
characterisation of gelatins from the skins of sin croaker (Johnius dussumieri) and
shortfin scad (Decapterus macrosoma). Food Chemistry, 101, 386-391.
Cheung, I. W., & Li-Chan, E. C. (2017). Enzymatic production of protein hydrolysates
from steelhead (Oncorhynchus mykiss) skin gelatin as inhibitors of dipeptidyl-
peptidase IV and angiotensin-I converting enzyme. Journal of Functional Foods,
28, 254-264.
Choi, J. D., Kim, D. S., & Kim, J. S. (1998). Preparation of calcium-based powder from
fish bone and its characteristics. Applied Biological Chemistry, 41, 147-152.
Choi, S. S., & Regenstein, J. M. (2000). Physicochemical and Sensory Characteristics of
Fish Gelatin. Journal of Food Science, 65, 194-199.
Choi, Y., & Park, J. W. (2002). Acid-aided protein recovery from enzyme‐rich pacific
whiting. Journal of Food Science, 67, 2962-2967.
Coêlho, D. F., Saturnino, T. P., Fernandes, F. F., Mazzola, P. G., Silveira, E., &
Tambourgi, E. B. (2016). Azocasein Substrate for Determination of Proteolytic
Activity: Reexamining a Traditional Method Using Bromelain Samples. BioMed
Research International, 2016, 1-6.
Corzo-Martínez, M., Moreno, F. J., Villamiel, M., Patino, J. M. R., & Sánchez, C. C.
(2017). Effect of glycation and limited hydrolysis on interfacial and foaming
properties of bovine β-lactoglobulin. Food Hydrocolloids, 66, 16-26.
Davenport, M., & Kristinsson, H. (2011). Channel catfish (Ictalurus punctatus) muscle
protein isolate performance processed under different acid and alkali pH values.
Journal of Food Science, 76, E240-E247.
Deacon, C. F. (2018). Peptide degradation and the role of DPP-4 inhibitors in the
treatment of type 2 diabetes. Peptides, 100, 150-157.
Diniz, F., & Martin, A. (1997). Effects of the extent of enzymatic hydrolysis on
functional properties of shark protein hydrolysate. LWT-Food Science and
Technology, 30, 266-272.
Dong, S., Zeng, M., Wang, D., Liu, Z., Zhao, Y., & Yang, H. (2008). Antioxidant and
biochemical properties of protein hydrolysates prepared from Silver carp
(Hypophthalmichthys molitrix). Food chemistry, 107, 1485-1493.
Duan, R., Zhang, J., Du, X., Yao, X., & Konno, K. (2009). Properties of collagen from
skin, scale and bone of carp (Cyprinus carpio). Food Chemistry, 112, 702-706.
Eastoe, J. (1955). The amino acid composition of mammalian collagen and gelatin.
Biochemical Journal, 61, 589.

188
Egerton, S., Culloty, S., Whooley, J., Stanton, C., & Ross, R. P. (2018). Characterization
of protein hydrolysates from blue whiting (Micromesistius poutassou) and their
application in beverage fortification. Food Chemistry, 245, 698-706.
Engel, J. (1987). Folding and unfolding of collagen triple helices. Advances in Meat
Research, 4, 145-161.
Farvin, K. S., Andersen, L. L., Otte, J., Nielsen, H. H., Jessen, F., & Jacobsen, C. (2016).
Antioxidant activity of cod (Gadus morhua) protein hydrolysates: Fractionation
and characterisation of peptide fractions. Food Chemistry, 204, 409-419.
Foegeding, E., Lanier, T., & Hultin, H. (1996). Characteristics of edible muscle tissues.
Food Chemistry, 3, 879-942.
Gbogouri, G., Linder, M., Fanni, J., & Parmentier, M. (2004). Influence of hydrolysis
degree on the functional properties of salmon byproducts hydrolysates. Journal of
Food Science, 69, C615-C622.
Gehring, C., Gigliotti, J., Moritz, J., Tou, J., & Jaczynski, J. (2011). Functional and
nutritional characteristics of proteins and lipids recovered by isoelectric
processing of fish by-products and low-value fish: a review. Food Chemistry, 124,
422-431.
Gehring, C. K., Davenport, M. P., & Jaczynski, J. (2009). Functional and nutritional
quality of protein and lipid recovered from fish processing by-products and
underutilized aquatic species using isoelectric solubilization/precipitation.
Current Nutrition & Food Science, 5, 17-39.
Ghribi, A. M., Gafsi, I. M., Sila, A., Blecker, C., Danthine, S., Attia, H., Bougatef, A., &
Besbes, S. (2015). Effects of enzymatic hydrolysis on conformational and
functional properties of chickpea protein isolate. Food Chemistry, 187, 322-330.
Gildberg, A. (1992). Recovery of proteinases and protein hydrolysates from fish viscera.,
Bioresource Technology 39, 271-276.
Gilsenan, P., & Ross-Murphy, S. (2000). Rheological characterisation of gelatins from
mammalian and marine sources. Food Hydrocolloids, 14, 191-195.
Gómez-Guillén, M. C., Giménez, B., López-Caballero, M. E., & Montero, M. P. (2011).
Functional and bioactive properties of collagen and gelatin from alternative
sources: A review. Food Hydrocolloids, 25, 1813-1827.
Goodsell, D. S., Dutta, S., Zardecki, C., Voigt, M., Berman, H. M., & Burley, S. K.
(2015). The RCSB PDB “molecule of the month”: inspiring a molecular view of
biology. PLoS Biology, 13, e1002140.
189
Greenfield, N. J. (1999). Applications of circular dichroism in protein and peptide
analysis. TrAC Trends in Analytical Chemistry, 18, 236-244.
Greenfield, N. J. (2006). Using circular dichroism collected as a function of temperature
to determine the thermodynamics of protein unfolding and binding interactions.
Nature Protocols, 1, 2527.
Guerard, F., Dufosse, L., De La Broise, D., & Binet, A. (2001). Enzymatic hydrolysis of
proteins from yellowfin tuna (Thunnus albacares) wastes using Alcalase. Journal
of Molecular Catalysis B: Enzymatic, 11, 1051-1059.
Guo, M., Liu, S., Ismail, M., Farid, M.M., Ji, H., Mao, W., Gao, J. & Li, C. (2017).
Changes in the myosin secondary structure and shrimp surimi gel strength
induced by dense phase carbon dioxide. Food Chemistry, 227, 219-226.
Hall, F. G., Jones, O. G., O'Haire, M. E., & Liceaga, A. M. (2017). Functional properties
of tropical banded cricket (Gryllodes sigillatus) protein hydrolysates. Food
Chemistry, 224, 414-422.
Halldórsdóttir, S. M., Hamaguchi, P. Y., Sveinsdóttir, H., Kristinsson, H. G., Bergsson,
A. B., & Thorkelsson, G. (2011). Properties of hydrolysed saithe protein isolates
prepared via pH shift process with and without dewatering. LWT-Food Science
and Technology, 44, 1999-2004.
Halldorsdottir, S. M., Kristinsson, H. G., Sveinsdottir, H., Thorkelsson, G., &
Hamaguchi, P. Y. (2013). The effect of natural antioxidants on haemoglobin-
mediated lipid oxidation during enzymatic hydrolysis of cod protein. Food
Chemistry, 141, 914-919.
Halldorsdottir, S. M., Sveinsdottir, H., Gudmundsdottir, A., Thorkelsson, G., &
Kristinsson, H. G. (2014). High quality fish protein hydrolysates prepared from
by-product material with Fucus vesiculosus extract. Journal of Functional
Foods, 9, 10-17.
Hathwar, S. C., Bijinu, B., Rai, A. K., & Narayan, B. (2011). Simultaneous recovery of
lipids and proteins by enzymatic hydrolysis of fish industry waste using different
commercial proteases. Applied Biochemistry and Biotechnology, 164, 115-124.
Hoyle., & Merritt, J. (1994). Quality of fish protein hydrolysates from herring (Clupea
harengus). Journal of Food Science, 59, 76-79.
Hsu, K.-C., Li-Chan, E. C., & Jao, C.-L. (2011). Antiproliferative activity of peptides
prepared from enzymatic hydrolysates of tuna dark muscle on human breast
cancer cell line MCF-7. Food Chemistry, 126, 617-622.

190
Hu, Y., Liu, W., Yuan, C., Morioka, K., Chen, S., Liu, D., & Ye, X. (2015).
Enhancement of the gelation properties of hairtail (Trichiurus haumela) muscle
protein with curdlan and transglutaminase. Food Chemistry, 176, 115-122.
Hu, Y., Shao, Y., Wu, C., Yuan, C., Ishimura, G., Liu, W., & Chen, S. (2018). γ-PGA
and MTGase improve the formation of ε-(γ-glutamyl) lysine cross-links within
hairtail (Trichiurus haumela) surimi protein. Food Chemistry, 242, 330-337.
Huang, C.-Y., Kuo, J.-M., Wu, S.-J., & Tsai, H.-T. (2016). Isolation and characterization
of fish scale collagen from tilapia (Oreochromis sp.) by a novel extrusion–hydro-
extraction process. Food Chemistry, 190, 997-1006.
Huang, Y.-w., Abdel-Aal, H. A., & Awad, A. H. (1996). Properties of surimi made from
tilapia. In Nineteenth and twentieth annual conferences of Tropical and
Subtropical Seafood Science and Technology Society of the Americans).
Ikoma, T., Kobayashi, H., Tanaka, J., Walsh, D., & Mann, S. (2003). Physical properties
of type I collagen extracted from fish scales of Pagrus major and Oreochromis
niloticas. International Journal of Biological Macromolecules, 32, 199-204.
Imm, J., & Lee, C. (1999). Production of seafood flavor from red hake (Urophycis chuss)
by enzymatic hydrolysis. Journal of Agricultural and Food Chemistry, 47, 2360-
2366.
Iwasaki, T., Noshiroya, K., Saitoh, N., Okano, K., & Yamamoto, K. (2006). Studies of
the effect of hydrostatic pressure pretreatment on thermal gelation of chicken
myofibrils and pork meat patty. Food Chemistry, 95, 474-483.
Jamdar, S. N., Rajalakshmi, V., Pednekar, M. D., Juan, F., Yardi, V., & Sharma, A.
(2010). Influence of degree of hydrolysis on functional properties, antioxidant
activity and ACE inhibitory activity of peanut protein hydrolysate. Food
Chemistry, 121, 178-184.
Jamilah, B., & Harvinder, K. G. (2002). Properties of gelatins from skins of fish—black
tilapia (Oreochromis mossambicus) and red tilapia (Oreochromis nilotica). Food
Chemistry, 77, 81-84.
Jenkelunas, P. J., & Li-Chan, E. C. (2018). Production and assessment of Pacific hake
(Merluccius productus) hydrolysates as cryoprotectants for frozen fish mince.
Food Chemistry, 239, 535-543.
Jia, G., Nirasawa, S., Ji, X., Luo, Y., & Liu, H. (2018). Physicochemical changes in
myofibrillar proteins extracted from pork tenderloin thawed by a high-voltage
electrostatic field. Food Chemistry, 240, 910-916.

191
Jiang, S. T., Hsieh, J. F., Ho, M. L., & Chung, Y. C. (2000). Microbial Transglutaminase
Affects Gel Properties of Golden Threadfin‐bream and Pollack Surimi. Journal of
Food Science, 65, 694-699.
Johnston-Bank, F. (1983). From tannery to table: an account of gelatin production.
Journal of the Society of Leather Technologists and Chemists, 68, 141-145.
Jongjareonrak, A., Benjakul, S., Visessanguan, W., Nagai, T., & Tanaka, M. (2005).
Isolation and characterisation of acid and pepsin-solubilised collagens from the
skin of Brownstripe red snapper (Lutjanus vitta). Food Chemistry, 93, 475-484.
Kaewudom, P., Benjakul, S., & Kijroongrojana, K. (2013). Properties of surimi gel as
influenced by fish gelatin and microbial transglutaminase. Food Bioscience, 1,
39-47.
Karim, A. A., & Bhat, R. (2009). Fish gelatin: properties, challenges, and prospects as an
alternative to mammalian gelatins. Food Hydrocolloids, 23, 563-576.
Kimura, S., ZHU, X. P., Matsui, R., Shijoh, M., & Takamizawa, S. (1988).
Characterization of fish muscle type I collagen. Journal of Food Science, 53,
1315-1318.
Kittiphattanabawon, P., Benjakul, S., Visessanguan, W., Kishimura, H., & Shahidi, F.
(2010). Isolation and characterisation of collagen from the skin of brownbanded
bamboo shark (Chiloscyllium punctatum). Food Chemistry, 119, 1519-1526.
Kittiphattanabawon, P., Benjakul, S., Visessanguan, W., Nagai, T., & Tanaka, M. (2005).
Characterisation of acid-soluble collagen from skin and bone of bigeye snapper
(Priacanthus tayenus). Food Chemistry, 89, 363-372.
Klompong, V., Benjakul, S., Kantachote, D., & Shahidi, F. (2007). Antioxidative activity
and functional properties of protein hydrolysate of yellow stripe trevally
(Selaroides leptolepis) as influenced by the degree of hydrolysis and enzyme type.
Food Chemistry, 102, 1317-1327.
Kong, F., Chang, S., Liu, Z., & Wilson, L. (2008). Changes of soybean quality during
storage as related to soymilk and tofu making. Journal of Food Science, 73, S134-
S144.
Kok, N., Thawornchinsombut, S., Park, J. W. (2013). Manufacture of fish ball. Surimi
and Surimi Seafood (Third Edition), Chapter 11, 291.
Kristinsson, H. G., Lanier, T. C., Halldorsdottir, S. M., Geirsdottir, M., & Park, J. W.
(2013). Fish protein isolate by pH shift. Surimi and surimi seafood, 169-192.

192
Kristinsson, H. G., & Liang, Y. (2006). Effect of pH‐Shift Processing and Surimi
Processing on Atlantic Croaker (Micropogonias undulates) Muscle Proteins.
Journal of Food Science, 71, C304-C312.
Kristinsson, H. G., & Rasco, B. A. (2000a). Fish protein hydrolysates: production,
biochemical, and functional properties. Critical Reviews in Food Science and
Nutrition, 40, 43-81.
Kristinsson, H. G., & Rasco, B. A. (2000b). Kinetics of the hydrolysis of Atlantic salmon
(Salmo salar) muscle proteins by alkaline proteases and a visceral serine protease
mixture. Process Biochemistry, 36, 131-139.
Kristinsson, H. G., Theodore, A. E., Demir, N., & Ingadottir, B. (2005). A comparative
study between acid‐and alkali‐aided processing and surimi processing for the
recovery of proteins from Channel catfish muscle. Journal of Food Science, 70,
C298-C306.
Kubota, S., Tamura, Y., Morioka, K., & Itoh, Y. (2003). Variable Pressure‐scanning
Electron Microscopic Observation of Walleye Pollack Surimi Gel. Journal of
Food Science, 68, 307-311.
Kumar, D., & BHALLA, T. C. (2003). Bacillus sp. APR-4 protease in protein recovery
from waste bones. National Academy Science Letters, 26, 332-335.
Kuraishi, C., Sakamoto, J., & Soeda, T. (1996). The usefulness of transglutaminase for
food processing. In): ACS Publications, Chapter 3, 29-38.
Ladrat, C., Verrez-Bagnis, V., Noël, J., & Fleurence, J. (2003). In vitro proteolysis of
myofibrillar and sarcoplasmic proteins of white muscle of sea bass
(Dicentrarchus labrax L.): effects of cathepsins B, D and L. Food Chemistry, 81,
517-525.
Laemmli, U. K. (1970). Cleavage of structural proteins during the assembly of the head
of bacteriophage T4. Nature, 227, 680-685.
Lansdowne, L., Beamer, S., Jaczynski, J., & Matak, K. (2009). Survival of Listeria
innocua after isoelectric solubilization and precipitation of fish protein. Journal of
Food Science, 74, M201-M205.
Le Maux, S., Nongonierma, A. B., Murray, B., Kelly, P. M., & FitzGerald, R. J. (2015).
Identification of short peptide sequences in the nanofiltration permeate of a
bioactive whey protein hydrolysate. Food Research International, 77, 534-539.
Liaset, B., Lied, E., & Espe, M. (2000). Enzymatic hydrolysis of by‐products from the
fish‐filleting industry; chemical characterisation and nutritional evaluation.
Journal of the Science of Food and Agriculture, 80, 581-589.
193
Liceaga‐Gesualdo, A., & Li‐Chan, E. (1999). Functional properties of fish protein
hydrolysate from herring (Clupea harengus). Journal of Food Science, 64, 1000-
1004.
Li-Chan, E. C., Hunag, S. L., Jao, C. L., Ho, K. P., & Hsu, K. C. (2012). Peptides derived
from Atlantic salmon skin gelatin as dipeptidyl-peptidase IV inhibitors. Journal of
Agricultural and Food Chemistry, 60, 973-978.
Liu, D., Wei, G., Li, T., Hu, J., Lu, N., Regenstein, J. M., & Zhou, P. (2015). Effects of
alkaline pretreatments and acid extraction conditions on the acid-soluble collagen
from grass carp (Ctenopharyngodon idella) skin. Food Chemistry, 172, 836-843.
Liu, H., Li, D., & Guo, S. (2007). Studies on collagen from the skin of Channel catfish
(Ictalurus punctaus). Food Chemistry, 101, 621-625.
Liu, R., Zhao, S., Xiong, S., Xie, B., & Liu, H. (2007). Studies on fish and pork paste
gelation by dynamic rheology and circular dichroism. Journal of Food Science,
72, E399-E403.
Liu, W., Li, G., Miao, Y., & Wu, X. (2009). Preparation and characterization of pepsin-
solubilized type I collagen from the scales of snakehead (Ophiocephalus Argus).
Journal of Food Biochemistry, 33, 20-37.
Liu, Y., Li, X., Chen, Z., Yu, J., Wang, F., & Wang, J. (2014). Characterization of
structural and functional properties of fish protein hydrolysates from surimi
processing by-products. Food Chemistry, 151, 459-465.
Ma, X.-S., Yi, S.-M., Yu, Y.-M., Li, J.-R., & Chen, J.-R. (2015). Changes in gel
properties and water properties of Nemipterus virgatus surimi gel induced by
high-pressure processing. LWT-Food Science and Technology, 61, 377-384.
Mackie, I. M. (1974). Proteolytic enzymes in recovery of proteins from fish waste.
Process Biochemistry (UK).
McAlpin, C. R., Dillard, J., Kim, J., & Montanez, J. (1994). An economic analysis of
producing surimi from catfish byproducts. Bulletin (Mississippi Agricultural and
Forestry Experiment Station)(USA).
Mendis, E., Rajapakse, N., & Kim, S.-K. (2005). Antioxidant properties of a radical-
scavenging peptide purified from enzymatically prepared fish skin gelatin
hydrolysate. Journal of Agricultural and Food Chemistry, 53, 581-587.
Montero, P., Alvarez, C., Marti, M., & Borderias, A. (1995). Plaice skin collagen
extraction and functional properties. Journal of Food Science, 60, 1-3.

194
Montero, P., Gómez-Guillén, M., & Borderıas, A. (1999). Functional characterisation of
muscle and skin collagenous material from hake (Merluccius merluccius L.).
Food Chemistry, 65, 55-59.
Montero, P., & Gómez-Guillén, M. C. (2000). Extracting Conditions for Megrim
(Lepidorhombus boscii) Skin Collagen Affect Functional Properties of the
Resulting Gelatin. Journal of Food Science, 65, 434-438.
Moon, J. H., Yoon, W. B., & Park, J. W. (2017). Assessing the textural properties of
Pacific whiting and Alaska pollock surimi gels prepared with carrot under various
heating rates. Food Bioscience, 20, 12-18.
Morales-Medina, R., Tamm, F., Guadix, A., Guadix, E., & Drusch, S. (2016). Functional
and antioxidant properties of hydrolysates of sardine (S. pilchardus) and horse
mackerel (T. mediterraneus) for the microencapsulation of fish oil by spray-
drying. Food Chemistry, 194, 1208-1216.
Murthy, P. S., Rai, A. K., & Bhaskar, N. (2014). Fermentative recovery of lipids and
proteins from freshwater fish head waste with reference to antimicrobial and
antioxidant properties of protein hydrolysate. Journal of Food Science and
Technology, 51, 1884-1892.
Mutilangi, W., Panyam, D., & Kilara, A. (1996). Functional properties of hydrolysates
from proteolysis of heat‐denatured whey protein isolate. Journal of Food Science,
61, 270-275.
Muyonga, J., Cole, C., & Duodu, K. (2004a). Characterisation of acid soluble collagen
from skins of young and adult Nile perch (Lates niloticus). Food Chemistry, 85,
81-89.
Muyonga, J., Cole, C., & Duodu, K. (2004b). Fourier transform infrared (FTIR)
spectroscopic study of acid soluble collagen and gelatin from skins and bones of
young and adult Nile perch (Lates niloticus). Food Chemistry, 86, 325-332.
Muyonga, J. H., Cole, C. G. B., & Duodu, K. G. (2004a). Characterisation of acid soluble
collagen from skins of young and adult Nile perch (Lates niloticus). Food
Chemistry, 85, 81-89.
Muyonga, J. H., Cole, C. G. B., & Duodu, K. G. (2004b). Extraction and physico-
chemical characterisation of Nile perch (Lates niloticus) skin and bone gelatin.
Food Hydrocolloids, 18, 581-592.
Nagai, T., Araki, Y., & Suzuki, N. (2002). Collagen of the skin of ocellate puffer fish
(Takifugu rubripes). Food Chemistry, 78, 173-177.
Nagai, T., & Suzuki, N. (2000). Isolation of collagen from fish waste material — skin,
bone and fins. Food Chemistry, 68, 277-281.
195
Nagai, T., & Suzuki, N. (2002). Preparation and partial characterization of collagen from
paper nautilus (Argonauta argo, Linnaeus) outer skin. Food Chemistry, 76, 149-
153.
Nagai, T., Yamashita, E., Taniguchi, K., Kanamori, N., & Suzuki, N. (2001). Isolation
and characterisation of collagen from the outer skin waste material of cuttlefish
(Sepia lycidas). Food Chemistry, 72, 425-429.
Nakajima, K., Yoshie-Stark, Y., & Ogushi, M. (2009). Comparison of ACE inhibitory
and DPPH radical scavenging activities of fish muscle hydrolysates. Food
Chemistry, 114, 844-851.
Nalinanon, S., Benjakul, S., Visessanguan, W., & Kishimura, H. (2007). Use of pepsin
for collagen extraction from the skin of bigeye snapper (Priacanthus tayenus).
Food Chemistry, 104, 593-601.
National Fishery Institute. (2017). Top ten most popular seafood items.
https://www.aboutseafood.com/press_release/top-10-list-highlights-seafood-
consumption-progress/.
Ndez-Diaaz, C. F., & Fea, M. (1999). Optimization of the protein fraction of
microcapsules used in feeding of marine fish larvae using in vitro digestibility
techniques. Aquaculture Nutrition, 5, 107-113.
Nilsang, S., Lertsiri, S., Suphantharika, M., & Assavanig, A. (2005). Optimization of
enzymatic hydrolysis of fish soluble concentrate by commercial proteases.
Journal of Food Engineering, 70, 571-578.
Nolsøe, H., & Undeland, I. (2009). The acid and alkaline solubilization process for the
isolation of muscle proteins: state of the art. Food and Bioprocess Technology, 2,
1-27.
Nongonierma, A. B., & FitzGerald, R. J. (2013). Dipeptidyl peptidase IV inhibitory and
antioxidative properties of milk protein-derived dipeptides and
hydrolysates. Peptides, 39, 157-163.
Nongonierma, A. B., Paolella, S., Mudgil, P., Maqsood, S., & FitzGerald, R. J. (2017).
Dipeptidyl peptidase IV (DPP-IV) inhibitory properties of camel milk protein
hydrolysates generated with trypsin. Journal of Functional Foods, 34, 49-58.
Ogawa, M., Moody, M. W., Portier, R. J., Bell, J., Schexnayder, M. A., & Losso, J. N.
(2003). Biochemical properties of black drum and sheepshead seabream skin
collagen. Journal of Agricultural and Food Chemistry, 51, 8088-8092.

196
Ogawa, M., Portier, R. J., Moody, M. W., Bell, J., Schexnayder, M. A., & Losso, J. N.
(2004). Biochemical properties of bone and scale collagens isolated from the
subtropical fish black drum (Pogonia cromis) and sheepshead seabream
(Archosargus probatocephalus). Food Chemistry, 88, 495-501.
Ojha, K. S., Alvarez, C., Kumar, P., O'Donnell, C. P., & Tiwari, B. K. (2016). Effect of
enzymatic hydrolysis on the production of free amino acids from boarfish
(Capros aper) using second order polynomial regression models. LWT-Food
Science and Technology, 68, 470-476.
Onoue, Y., & Riddle, V. (1973). Use of plastein reaction in recovering protein from fish
waste. Journal of the Fisheries Board of Canada, 30, 1745-1747.
Pal, G. K., Nidheesh, T., & Suresh, P. V. (2015). Comparative study on characteristics
and in vitro fibril formation ability of acid and pepsin soluble collagen from the
skin of catla (Catla catla) and rohu (Labeo rohita). Food Research International,
76, 804-812.
Park, J. W. (2013). Surimi and surimi seafood: CRC press.
Park, J. W., Nozaki, H., Suzuki, T., & Beliveau, J. (2013). Historical review of Surimi
technology and market developments. Surimi and Surimi Seafood, 1, 1.
Park, S. H., CHO, S. Y., Kimura, M., Nozawa, H., & Seki, N. (2005). Effects of
microbial transglutaminase and starch on the thermal gelation of salted squid
muscle paste. Fisheries Science, 71, 896-903.
Pati, F., Adhikari, B., & Dhara, S. (2010). Isolation and characterization of fish scale
collagen of higher thermal stability. Bioresource Technology, 101, 3737-3742.
Pearce, K. N., & Kinsella, J. E. (1978). Emulsifying properties of proteins: evaluation of
a turbidimetric technique. Journal of Agricultural and Food Chemistry, 26, 716-
723.
Peleg, M. (1988). An empirical model for the description of moisture sorption curves.
Journal of Food Science, 53, 1216-1217.
Pietrasik, Z. (2003). Binding and textural properties of beef gels processed with κ-
carrageenan, egg albumin and microbial transglutaminase. Meat Science, 63, 317-
324.
Piez, K. A., & Gross, J. (1960). The amino acid composition of some fish collagens: The
relation between composition and structure. Journal of Biological Chemistry, 235,
995-998.

197
Prior, R. L., Wu, X., & Schaich, K. (2005). Standardized methods for the determination
of antioxidant capacity and phenolics in foods and dietary supplements. Journal
of Agricultural and Food Chemistry, 53, 4290-4302.
Qin, L., Zhu, B.W., Zhou, D.Y., Wu, H.T., Tan, H., Yang, J.F., Li, D.M., Dong, X.P. and
Murata, Y. (2011). Preparation and antioxidant activity of enzymatic hydrolysates
from purple sea urchin (Strongylocentrotus nudus) gonad. LWT-Food Science and
Technology, 44, 1113-1118.
Quaglia, G., & Orban, E. (1990). Influence of enzymatic hydrolysis on structure and
emulsifying properties of sardine (Sardina pilchardus) protein hydrolysates.
Journal of Food Science, 55, 1571-1573.
Raghavan, S., & Kristinsson, H. G. (2008). Conformational and rheological changes in
catfish myosin during alkali-induced unfolding and refolding. Food Chemistry,
107, 385-398.
Raghavan, S., & Kristinsson, H. G. (2009). ACE-inhibitory activity of tilapia protein
hydrolysates. Food Chemistry, 117, 582-588.
Rahali, V., Chobert, J. M., Haertle, T., & Gueguen, J. (2000). Emulsification of chemical
and enzymatic hydrolysates of β‐lactoglobulin: characterization of the peptides
adsorbed at the interface. Molecular Nutrition & Food Research, 44, 89-95.
Rai, A. K., Swapna, H. C., Bhaskar, N., Halami, P. M., & Sachindra, N. M. (2010).
Effect of fermentation ensilaging on recovery of oil from fresh water fish
viscera. Enzyme and Microbial Technology, 46, 9-13.
Ramırez, J. A., Rodrıguez-Sosa, R., Morales, O. G., & Vázquez, M. (2000). Surimi gels
from striped mullet (Mugil cephalus) employing microbial transglutaminase.
Food Chemistry, 70, 443-449.
Rebeca, B. D., Pena‐Vera, M., & Diaz‐Castaneda, M. (1991). Production of fish protein
hydrolysates with bacterial proteases; yield and nutritional value. Journal of Food
Science, 56, 309-314.
Rojas, M. J., Siqueira, P. F., Miranda, L. C., Tardioli, P. W., & Giordano, R. L. (2014).
Sequential proteolysis and cellulolytic hydrolysis of soybean hulls for
oligopeptides and ethanol production. Industrial Crops and Products, 61, 202-
210.
Salampessy, J., Phillips, M., Seneweera, S., & Kailasapathy, K. (2010). Release of
antimicrobial peptides through bromelain hydrolysis of leatherjacket (Meuchenia
sp.) insoluble proteins. Food Chemistry, 120, 556-560.

198
Salampessy, J., Reddy, N., Phillips, M., & Kailasapathy, K. (2017). Isolation and
characterization of nutraceutically potential ACE-Inhibitory peptides from
leatherjacket (Meuchenia sp.) protein hydrolysates. LWT-Food Science and
Technology, 80, 430-436.
Sangsawad, P., Roytrakul, S., Choowongkomon, K., Kitts, D.D., Chen, X.M., Meng, G.,
Li-Chan, E.C. and Yongsawatdigul, J. (2018). Transepithelial transport across
Caco-2 cell monolayers of angiotensin converting enzyme (ACE) inhibitory
peptides derived from simulated in vitro gastrointestinal digestion of cooked
chicken muscles. Food Chemistry, 251, 77-85.
Sathe, S., & Salunkhe, D. (1981). Functional properties of the great northern bean
(Phaseolus vulgaris L.) proteins: emulsion, foaming, viscosity, and gelation
properties. Journal of Food Science, 46, 71-81.
Sato, K. (1993). Comparative biochemistry of molecular species of fish and mammalian
collagens. Trends Comp. Biochem. Physiol, 1, 557-567.
Sato, K., Ebihara, T., Adachi, E., Kawashima, S., Hattori, S., & Irie, S. (2000). Possible
involvement of aminotelopeptide in self-assembly and thermal stability of
collagen I as revealed by its removal with proteases. Journal of Biological
Chemistry, 275, 25870-25875.
Seighalani, F. Z. B., Bakar, J., Saari, N., & Khoddami, A. (2017). Thermal and
physicochemical properties of red tilapia (Oreochromis niloticus) surimi gel as
affected by microbial transglutaminase. Animal Production Science, 57, 993-
1000.
Sen, D., Sripathy, N., Lahiry, N., Sreenivasan, A., & Subrahmanyan, V. (1962). Fish
hydrolysates. I. Rate of hydrolysis of fish flesh with papain. Food Technology, 16,
138-141.
Shahidi, F., Han, X.-Q., & Synowiecki, J. (1995). Production and characteristics of
protein hydrolysates from capelin (Mallotus villosus). Food Chemistry, 53, 285-
293.
Sila, A., Alvarez, O. M., Haddar, A., Frikha, F., Dhulster, P., Nedjar-Arroume, N., &
Bougatef, A. (2016). Purification, identification and structural modelling of DPP-
IV inhibiting peptides from barbel protein hydrolysate. Journal of
Chromatography B, 1008, 260-269.
Singh, P., Benjakul, S., Maqsood, S., & Kishimura, H. (2011). Isolation and
characterisation of collagen extracted from the skin of striped catfish
(Pangasianodon hypophthalmus). Food Chemistry, 124, 97-105.

199
Skierka, E., & Sadowska, M. (2007). The influence of different acids and pepsin on the
extractability of collagen from the skin of Baltic cod (Gadus morhua). Food
Chemistry, 105, 1302-1306.
Sodini, I., Lucas, A., Tissier, J., & Corrieu, G. (2005). Physical properties and
microstructure of yoghurts supplemented with milk protein hydrolysates.
International Dairy Journal, 15, 29-35.
Sripathy, N., Kadkol, S., Sen, D., Swaminathan, M., & Lahiry, N. (1963). Fish
hydrolysates. III. Influence of degree of hydrolysis on nutritive value. Journal of
Food Science, 28, 365-369.
Sripathy, N., Sen, D., Lahiry, N. L., Sreenivasan, A., & Subrahmanyan, V. (1962). Fish
hydrolysates. II. Standardisation of digestion conditions for preparation of
hydrolysates rich in peptones and proteoses. Food Technology, 16, 141-142.
Tadpitchayangkoon, P., Park, J. W., & Yongsawatdigul, J. (2010). Conformational
changes and dynamic rheological properties of fish sarcoplasmic proteins treated
at various pHs. Food Chemistry, 121, 1046-1052.
Tan, Y., Chang, S. K., & Zhang, Y. (2017). Comparison of α-amylase, α-glucosidase and
lipase inhibitory activity of the phenolic substances in two black legumes of
different genera. Food Chemistry, 214, 259-268.
Tan, Y., & Chang, S. K. (2018). Isolation and characterization of collagen extracted from
Channel catfish (Ictalurus punctatus) skin. Food Chemistry, 242, 147-155.
Tang, L., Chen, S., Su, W., Weng, W., Osako, K., & Tanaka, M. (2015). Physicochemical
properties and film-forming ability of fish skin collagen extracted from different
freshwater species. Process Biochemistry, 50, 148-155.
Theodore, A. E., & Kristinsson, H. G. (2007). Angiotensin converting enzyme inhibition
of fish protein hydrolysates prepared from alkaline‐aided Channel catfish protein
isolate. Journal of the Science of Food and Agriculture, 87, 2353-2357.
Tsai, J. S., Chen, J. L., & Pan, B. S. (2008). ACE-inhibitory peptides identified from the
muscle protein hydrolysate of hard clam (Meretrix lusoria). Process
Biochemistry, 43, 743-747.
Tulipano, G., Sibilia, V., Caroli, A. M., & Cocchi, D. (2011). Whey proteins as source of
dipeptidyl dipeptidase IV (dipeptidyl peptidase-4) inhibitors. Peptides, 32, 835-
838.
Þorkelsson, G., & Kristinsson, H. G. (2009). Bioactive peptides from marine sources.
State of art. Report to the NORA fund.

200
Tilman, D., Balzer, C., Hill, J., & Befort, B. L. (2011). Global food demand and the
sustainable intensification of agriculture. Proceedings of the National Academy of
Sciences, 108, 20260-20264.
Uchida, M., Ohshiba, Y., & Mogami, O. (2011). Novel dipeptidyl peptidase-4–inhibiting
peptide derived from β-lactoglobulin. Journal of Pharmacological Sciences, 117,
63-66.
United States Department of Agriculture/National Agricultural Statistics Service
(USDA/NASS). (1997). Production and Inventory of Channel Catfish. United
States Department of Agriculture, Washington, DC,
http://usda.mannlib.cornell.edu/usda/nass/CatfProd//1990s/1997/CatfProd-02-03-
1997.pdf.
United States Department of Agriculture/National Agricultural Statistics Service
(USDA/NASS). (1998). Production and Inventory of Channel Catfish. United
States Department of Agriculture, Washington, DC,
http://usda.mannlib.cornell.edu/usda/nass/CatfProd//1990s/1998/CatfProd-04-29-
1998.pdf.
United States Department of Agriculture/National Agricultural Statistics Service
(USDA/NASS). (1999). Production and Inventory of Channel Catfish. United
States Department of Agriculture, Washington, DC,
http://usda.mannlib.cornell.edu/usda/nass/CatfProd//1990s/1999/CatfProd-02-03-
1999.pdf.
United States Department of Agriculture/National Agricultural Statistics Service
(USDA/NASS). (2000). Production and Inventory of Channel Catfish. United
States Department of Agriculture, Washington, DC,
http://usda.mannlib.cornell.edu/usda/nass/CatfProd//2000s/2000/CatfProd-02-14-
2000.pdf.
United States Department of Agriculture/National Agricultural Statistics Service
(USDA/NASS). (2001). Production and Inventory of Channel Catfish. United
States Department of Agriculture, Washington, DC,
http://usda.mannlib.cornell.edu/usda/nass/CatfProd//2000s/2001/CatfProd-02-28-
2001.pdf.
United States Department of Agriculture/National Agricultural Statistics Service
(USDA/NASS). (2002). Production and Inventory of Channel Catfish. United
States Department of Agriculture, Washington, DC,
http://usda.mannlib.cornell.edu/usda/nass/CatfProd//2000s/2002/CatfProd-02-07-
2002.pdf.

201
United States Department of Agriculture/National Agricultural Statistics Service
(USDA/NASS). (2003). Production and Inventory of Channel Catfish. United
States Department of Agriculture, Washington, DC,
http://usda.mannlib.cornell.edu/usda/nass/CatfProd//2000s/2003/CatfProd-02-06-
2003.pdf.
United States Department of Agriculture/National Agricultural Statistics Service
(USDA/NASS). (2004). Production and Inventory of Channel Catfish. United
States Department of Agriculture, Washington, DC,
http://usda.mannlib.cornell.edu/usda/nass/CatfProd//2000s/2004/CatfProd-02-05-
2004.pdf.
United States Department of Agriculture/National Agricultural Statistics Service
(USDA/NASS). (2005). Production and Inventory of Channel Catfish. United
States Department of Agriculture, Washington, DC,
http://usda.mannlib.cornell.edu/usda/nass/CatfProd//2000s/2005/CatfProd-02-03-
2005.pdf.
United States Department of Agriculture/National Agricultural Statistics Service
(USDA/NASS). (2006). Production and Inventory of Channel Catfish. United
States Department of Agriculture, Washington, DC,
http://usda.mannlib.cornell.edu/usda/nass/CatfProd//2000s/2006/CatfProd-02-01-
2006.pdf.
United States Department of Agriculture/National Agricultural Statistics Service
(USDA/NASS). (2007). Production and Inventory of Channel Catfish. United
States Department of Agriculture, Washington, DC,
http://usda.mannlib.cornell.edu/usda/nass/CatfProd//2000s/2007/CatfProd-01-31-
2007.pdf.
United States Department of Agriculture/National Agricultural Statistics Service
(USDA/NASS). (2008). Production and Inventory of Channel Catfish. United
States Department of Agriculture, Washington, DC,
http://usda.mannlib.cornell.edu/usda/nass/CatfProd//2000s/2008/CatfProd-01-30-
2008_revision.pdf.
United States Department of Agriculture/National Agricultural Statistics Service
(USDA/NASS). (2009). Production and Inventory of Channel Catfish. United
States Department of Agriculture, Washington, DC,
http://usda.mannlib.cornell.edu/usda/nass/CatfProd//2000s/2009/CatfProd-01-30-
2009_revision.pdf.

202
United States Department of Agriculture/National Agricultural Statistics Service
(USDA/NASS). (2010). Production and Inventory of Channel Catfish. United
States Department of Agriculture, Washington, DC,
http://usda.mannlib.cornell.edu/usda/nass/CatfProd//2010s/2010/CatfProd-01-29-
2010.pdf.
United States Department of Agriculture/National Agricultural Statistics Service
(USDA/NASS). (2011). Production and Inventory of Channel Catfish. United
States Department of Agriculture, Washington, DC,
http://usda.mannlib.cornell.edu/usda/nass/CatfProd//2010s/2011/CatfProd-01-28-
2011.pdf.
United States Department of Agriculture/National Agricultural Statistics Service
(USDA/NASS). (2012). Production and Inventory of Channel Catfish. United
States Department of Agriculture, Washington, DC,
http://usda.mannlib.cornell.edu/usda/nass/CatfProd//2010s/2012/CatfProd-01-27-
2012.pdf.
United States Department of Agriculture/National Agricultural Statistics Service
(USDA/NASS). (2013). Production and Inventory of Channel Catfish. United
States Department of Agriculture, Washington, DC,
http://usda.mannlib.cornell.edu/usda/nass/CatfProd//2010s/2013/CatfProd-01-28-
2013.pdf.
United States Department of Agriculture/National Agricultural Statistics Service
(USDA/NASS). (2014). Production and Inventory of Channel Catfish. United
States Department of Agriculture, Washington, DC,
http://usda.mannlib.cornell.edu/usda/nass/CatfProd//2010s/2014/CatfProd-02-20-
2014.pdf.
United States Department of Agriculture/National Agricultural Statistics Service
(USDA/NASS). (2015). Production and Inventory of Channel Catfish. United
States Department of Agriculture, Washington, DC,
http://usda.mannlib.cornell.edu/usda/nass/CatfProd//2010s/2015/CatfProd-01-30-
2015.pdf.
United States Department of Agriculture/National Agricultural Statistics Service
(USDA/NASS). (2016). Production and Inventory of Channel Catfish. United
States Department of Agriculture, Washington, DC,
http://usda.mannlib.cornell.edu/usda/nass/CatfProd//2010s/2016/CatfProd-02-05-
2016.pdf.

203
United States Department of Agriculture/National Agricultural Statistics Service
(USDA/NASS). (2017). Production and Inventory of Channel Catfish. United
States Department of Agriculture, Washington, DC,
http://usda.mannlib.cornell.edu/usda/nass/CatfProd//2010s/2017/CatfProd-02-03-
2017.pdf.
United States Department of Agriculture/National Agricultural Statistics Service
(USDA/NASS). (2018). Production and Inventory of Channel Catfish. United
States Department of Agriculture, Washington, DC,
http://usda.mannlib.cornell.edu/usda/nass/CatfProd//2010s/2018/CatfProd-02-02-
2018.pdf.
Veeruraj, A., Arumugam, M., Ajithkumar, T., & Balasubramanian, T. (2015). Isolation
and characterization of collagen from the outer skin of squid (Doryteuthis
singhalensis). Food Hydrocolloids, 43, 708-716.
Veeruraj, A., Arumugam, M., & Balasubramanian, T. (2013). Isolation and
characterization of thermostable collagen from the marine eel-fish (Evenchelys
macrura). Process Biochemistry, 48, 1592-1602.
Villamonte, G., Jury, V., Jung, S., & de Lamballerie, M. (2015). Influence of xanthan
gum on the structural characteristics of myofibrillar proteins treated by high
pressure. Journal of Food Science, 80, C522-C531.
Vojdani, F. (1996). Solubility. Methods of testing protein functionality, 11-60.
Wright, D. J., Leach, I. B., & Wilding, P. (1977). Differential scanning calorimetric
studies of muscle and its constituent proteins. Journal of the Science of Food and
Agriculture, 28, 557-564.
Wu, J., & Ding, X. (2002). Characterization of inhibition and stability of soy-protein-
derived angiotensin I-converting enzyme inhibitory peptides. Food research
international, 35, 367-375.
Wu, Q., Du, J., Jia, J., & Kuang, C. (2016). Production of ACE inhibitory peptides from
sweet sorghum grain protein using alcalase: Hydrolysis kinetic, purification and
molecular docking study. Food Chemistry, 199, 140-149.
Xiong, G., Cheng, W., Ye, L., Du, X., Zhou, M., Lin, R., Geng, S., Chen, M., Corke, H.,
& Cai, Y.-Z. (2009). Effects of konjac glucomannan on physicochemical
properties of myofibrillar protein and surimi gels from grass carp
(Ctenopharyngodon idella). Food Chemistry, 116, 413-418.
Xu, J., Mukherjee, D., & Chang, S. K. (2018). Physicochemical properties and storage
stability of soybean protein nanoemulsions prepared by ultra-high pressure
homogenization. Food Chemistry, 240, 1005-1013.

204
Yang, S.-Y., Lee, S., Pyo, M. C., Jeon, H., Kim, Y., & Lee, K.-W. (2017). Improved
physicochemical properties and hepatic protection of Maillard reaction products
derived from fish protein hydrolysates and ribose. Food Chemistry, 221, 1979-
1988.
Yasui, T., & Samejima, K. (1990). Recent advances in meat science in Japan:
Functionality of muscle proteins in gelation mechanism of structured meat
products. Japan Agricultural Research Quarterly, 24, 131-140.
Yata, M., Yoshida, C., Fujisawa, S., Mizuta, S., & Yoshinaka, R. (2001). Identification
and characterization of molecular species of collagen in fish skin. Journal of Food
Science, 66, 247-251.
Yates, L., Dutson, T., Caldwell, J., & Carpenter, Z. (1983). Effect of temperature and pH
on the post-mortem degradation of myofibrillar proteins. Meat Science, 9, 157-
179.
Yin, T., Reed, Z. H., & Park, J. W. (2014). Gelling properties of surimi as affected by the
particle size of fish bone. LWT-Food Science and Technology, 58, 412-416.
Zambrowicz, A., Pokora, M., Setner, B., Dąbrowska, A., Szołtysik, M., Babij, K.,
Szewczuk, Z., Trziszka, T., Lubec, G. and Chrzanowska, J., (2015).
Multifunctional peptides derived from an egg yolk protein hydrolysate: isolation
and characterization. Amino Acids, 47, 369-380.
Zhang, T., Xu, X., Li, Z., Wang, Y., Xue, Y., & Xue, C. (2018). Interactions and phase
behaviors in mixed solutions of κ-carrageenan and myofibrillar protein extracted
from Alaska Pollock surimi. Food Research International, 105, 821-827.
Zhang, T., Xue, Y., Li, Z., Wang, Y., & Xue, C. (2015). Effects of deacetylation of
konjac glucomannan on Alaska Pollock surimi gels subjected to high-temperature
(120° C) treatment. Food Hydrocolloids, 43, 125-131.
Zhang, Y., Liu, W., Li, G., Shi, B., Miao, Y., & Wu, X. (2007). Isolation and partial
characterization of pepsin-soluble collagen from the skin of grass carp
(Ctenopharyngodon idella). Food Chemistry, 103, 906-912.
Zhang, W. W., Lu, J. F., Jiao, D. L., Lin, L., Weng, S. B., & Jiang, S. T. (2009).
Extraction of Fish Oil from Viscera of Channel Catfish through Potassium-
method. Journal of Food Science (Chinese), 24, 007.
Zhang, Y., Pechan, T., & Chang, S. K. (2018). Antioxidant and angiotensin-I converting
enzyme inhibitory activities of phenolic extracts and fractions derived from three
phenolic-rich legume varieties. Journal of Functional Foods, 42, 289-297.

205
Zhou, C., Li, Y., Yu, X., Yang, H., Ma, H., Yagoub, A. E. A., Cheng, Y., Hu, J., & Otu,
P. N. Y. (2016). Extraction and characterization of chicken feet soluble collagen.
LWT-Food Science and Technology, 74, 145-153.