extrathermodynamic study of surface diffusion in reversed-phase liquid chromatography with silica...
TRANSCRIPT
Extrathermodynamic Study of Surface Diffusion in Reversed-Phase LiquidChromatography with Silica Gels Bonded with Alkyl Ligands of Different Chain Lengths
Kanji MiyabeFaculty of Engineering, Toyama UniVersity, 3190, Gofuku, Toyama 930-8555, Japan
Georges Guiochon*Department of Chemistry, The UniVersity of Tennessee, KnoxVille, Tennessee 37996-1600, andDiVision of Chemical Sciences, Oak Ridge National Laboratory, Oak Ridge, Tennessee 37831
ReceiVed: January 19, 2005; In Final Form: April 18, 2005
Surface diffusion on adsorbents made of silica gels bonded to C1, C4, C8, and C18 alkyl ligands was studiedin reversed-phase liquid chromatography (RPLC) from the viewpoints of two extrathermodynamic relation-ships: enthalpy-entropy compensation (EEC) and linear free-energy relationship (LFER). First, the valuesof the surface diffusion coefficient (Ds), normalized by the density of the alkyl ligands, were analyzed withthe modified Arrhenius equation, following the four approaches proposed in earlier research. This showedthat an actual EEC resulting from substantial physicochemical effects occurs for surface diffusion and suggesteda mechanistic similarity of molecular migration by surface diffusion, irrespective of the alkyl chain length.Second, a new model based on EEC was derived to explain the LFER between the logarithms ofDs measuredunder different RPLC conditions. This showed that the changes of free energy, enthalpy, and entropy ofsurface diffusion are linearly correlated with the carbon number in the alkyl ligands of the bonded phases andthat the contribution of the C18 ligand to the changes of the thermodynamic parameters corresponds to thatof the C10 ligand. The new LFER model correlates the slope and intercept of the LFER to the compensationtemperatures derived from the EEC analyses and to several parameters characterizing the molecularcontributions to the changes in enthalpy and entropy. Finally, the new model was used to estimateDs undervarious RPLC conditions. The values ofDs that were estimated from only two original experimentalDs datawere in agreement with corresponding experimentalDs values, with relative errors of∼20%, irrespective ofsome RPLC conditions.
Introduction
Reversed-phase liquid chromatography (RPLC) is one of themost effective separation techniques available for both analyticaland preparative purposes.1 The abundance of stationary phasesthat have different physical and chemical properties is one ofthe essential reasons why RPLC is used in an extremely widefield of chemistry. Although many types of separation mediacan be used as stationary phases for RPLC, alkyl-ligand-bondedsilica gels (and, particularly, C18-silica gels) are still the mostpopular packing materials for RPLC.2 It is well-known that thechromatographic behavior of these materials is dependent onthe alkyl chain length, the density of these ligands, and the natureof the end-capping treatment of the residual silanol groups. Insome cases, chemists attempted to take advantage of thedifference in chromatographic behavior of RPLC packingmaterials bonded with alkyl ligands of different chain lengthsand to control the modification conditions of the alkyl ligandsintentionally, to achieve specific separations. Many studies haveexamined the influence of the alkyl chain length on thechromatographic behavior, but mainly from the viewpoint ofthe retention equilibrium.3-8 They attempt to clarify thedependence of the retention and separation factors on the carboncontent of the material and on the length of the chains bondedto the silica gel. In contrast with these extensive studies on theinfluence of the alkyl chain length on the retention behavior inRPLC, there are few fundamental studies discussing thedependence of the mass-transfer kinetics on the surface modi-
fication conditions of the alkyl ligands bonded to the base silicagel.9,10
Under linear conditions, band broadening is dependent onthe mass-transfer kinetics of several rate processes involved inchromatography, axial dispersion, external (fluid-to-particle)mass transfer, intraparticle diffusion, and adsorption/desorptionkinetics.11,12Intraparticle diffusion is usually assumed to consistof two distinct mechanisms: pore diffusion and surface diffu-sion.13,14Surface diffusion has an important role in intraparticlediffusion.11,12The manner of surface diffusion is dependent onthe retention behavior of the sample molecules, because thesemolecules migrate on the stationary phase surface, in theadsorbed state. In principle, chromatographic separations arebased on the difference between the adsorptive interactions ofthe sample components with the stationary phase surface.Therefore, surface diffusion should be related to some essentialcharacteristics of chromatographic retention. It is expected thatimportant information about the chromatographic mechanismsin RPLC can be derived from detailed analyses of surface-diffusion phenomena from the viewpoints of the retentionequilibrium, the mass-transfer kinetics, the thermodynamics, andthe extrathermodynamics. However, few studies besides ourown11,12,15-19 have involved the thermodynamics and extra-thermodynamics of surface diffusion in RPLC.
Enthalpy-entropy compensation (EEC) is one of the impor-tant extrathermodynamic relationships. It has been applied tomany different chemical equilibria and kinetic processes, to
12038 J. Phys. Chem. B2005,109,12038-12048
10.1021/jp058028q CCC: $30.25 © 2005 American Chemical SocietyPublished on Web 05/27/2005
discuss their reaction mechanisms.20-24 The establishment ofsuch a compensation has also been supported on some theoreti-cal bases.25-29 The EEC behavior was also studied for theretention equilibrium in some liquid chromatographic systems,in RPLC,17-19,30-33 normal-phase liquid chromatography (LC),34
ion-pair RPLC,35,36and ion-exchange LC.37 In contrast with thelarge number of studies discussing EEC relationships dealingwith retention equilibrium, very few papers have been devotedto EEC relationships that involve surface diffusion, as describedpreviously.
Linear free energy relationships (LFERs) are the other typeof extrathermodynamic relationships. The free-energy change(∆G) of a chemical equilibrium is linearly correlated with thatof a related kinetic process or another reaction equilibria. EECand LFER are empirical extrathermodynamic correlations ofthermodynamic quantities that have been used to demonstratethe similarity of the mechanisms of equilibrium or of kineticprocesses and to study the characteristics of these processes fromthe viewpoints of molecular structural contributions. Regardingthe thermodynamic and extrathermodynamic properties ofRPLC, we have demonstrated actual EEC relationships for theretention equilibrium17-19,33and surface diffusion18,19in severalRPLC systems. We also reported that LFER is observed betweenthe retention equilibrium and surface diffusion in RPLC,irrespective of the experimental conditions, such as the type ofsample compounds, the type and composition of the organicmodifiers in the mobile phase, the alkyl chain length of bondedligands on the stationary phase, and the temperature.11,12,16-19
Previously,11,38,39we studied the influence of the length anddensity of alkyl ligands on some RPLC characteristics, fromthe viewpoints of the retention equilibrium, surface diffusion,and their thermodynamic properties. With increasing length ofthe alkyl chain and density of a C18 ligand, the adsorptionequilibrium constant (K), the absolute value of the isosteric heatof adsorption (Qst), and the activation energy of surface diffusion(Es) increase while the value ofDs decreases. There is a criticallevel of carbon content of the stationary phase above whichthe last four parameters do not change significantly withincreasing alkyl chain length or ligand density. However, wehave not yet been able to interpret the dependence of theDs
values on the modification conditions of a base silica gel byalkyl ligands.
This work examines the characteristics and the mechanismof surface diffusion in RPLC systems made with silica gelsbonded to different alkyl ligands (C1, C4, C8, and C18). First,we analyzed series of experimental data ofDs from differentthermodynamic points of view and studied the decrease of therate of molecular migration by surface diffusion with increasingretention strength. We derived the activation energy and the
frequency factor (Ds0) of surface diffusion from the temperaturedependence ofDs and studied the linear correlation between lnDs0 andEs. We introduced a new coefficient,δs; this parameteris the coefficientDs normalized by the alkyl ligand density (σ),which is an important factor becauseσ is dependent on the chainlength of the alkyl ligands and searched for an EEC relationshipobserved for surface diffusion, following the four methodsproposed by Krug and co-workers.25-27 The chain density orcoverage of the surface (σ) is defined as the number of molesof alkyl ligand per unit surface area of the base silica gel andis given in units of mol/m2, as described in the list of symbols.Finally, we derived a new model to account for the influenceof several experimental parameters on surface diffusion in RPLCand showed its usefulness for a comprehensive interpretationof the variations ofDs with the experimental conditions ofRPLC.
Experimental Section
Columns and Reagents.Table 1 lists the main physico-chemical properties of the four packing materials used, whichwere custom-made items, by special order, purchased fromYMC (Kyoto, Japan). The columns (6 mm ID× 150 mm) werepacked with the separation media. They are not commerciallyavailable. Some of the information in Table 1 were obtainedfrom the manufacturer. The packing materials were probablysynthesized by chemically bonding differentn-alkyldimethylsilylligands onto the surface of the same base silica gel. No end-capping treatment was performed for the silica gels bonded withC1, C4, and C8 alkyl ligands. Regarding the C18-silica gel, nosubstantial increase in the carbon content was observed uponend-capping with the trimethylsilyl ligand. The bonding densityof the ligands decreases with increasing bulkiness of the mainalkyl chain. The average distance between two ligands increaseswith increasing length of the main alkyl chain. The averageparticle diameter of the base silica gel is 45µm. As describedlater, this coarse base material was used to make it easier toanalyze band broadening phenomena quantitatively and, morespecifically, to estimate more-accurate values ofDs from theexperimental chromatographic peak profiles.
The mobile phase was a methanol/water mixture (70/30, v/v).Alkylbenzenes (ethylbenzene,n-butylbenzene, andn-hexylben-zene) were used as the sample compounds. They were allreagent grade and used without further purification. Samplesolutions were prepared by dissolving the sample compoundsinto the mobile phase. The concentration of the sample solutionswas 0.1 wt % in most cases. Uracil and sodium nitrate wereused as inert tracers to determine the internal porosity (εp) ofthe packing materials and the void fraction (external porosity,εe) of the columns.2,40,41The internal porosity is the ratio of the
TABLE 1: Physicochemical Properties of Reversed-Phase Stationary Phases in Various Main Alkyl Chains
main alkyl chain C1 C4 C8 C18
particle density,Fp (g/cm3) 0.74 0.73 0.74 0.86porosity,εp 0.62 0.61 0.56 0.46tortuosity factor,kt 3.9 4.1 4.9 4.5carbon content (wt %)
before end-capping 4.1 6.7 9.9 17.1after end-capping -a -a -a 17.1
ligand density (µmol/m2)b 4.4 3.6 3.3 3.2average distance between two ligands (nm)b 0.69 0.76 0.80 0.81reaction ratio of silanol group (%)b 55 45 42 40mass of adsorbent in the column (g) 1.8 1.8 1.8 2.1column void fraction,εe 0.44 0.42 0.42 0.42lot number of the adsorbent EC08937 BE21037 CE21037 DE16037
a No end-capping treatment was made.b Calculated from the carbon content before end-capping, the BET surface area of the base silica gel (290m2/g), and the density of silanol groups on the surface of the base silica gel (assumed to be 8µmol/m2).
Surface Diffusion in RPLC with Silica Gels J. Phys. Chem. B, Vol. 109, No. 24, 200512039
intraparticulate pore volume to the volume of the stationary-phase particles. The external porosity is the interparticle volumein the column divided by the column volume. Roughly speaking,the pulse elution time of uracil provides the sum ofεp andεe,whereas that of sodium nitrate providesεe because of theDonnan salt-exclusion effect.41 The difference in the elutiontimes of the two inert tracers givesεp.
Apparatus. A high-performance liquid chromatography(HPLC) system (Model LC-6A, Shimadzu, Kyoto, Japan) wasused. A small volume of the sample solution (ca. 0.5∼ 300µL) was introduced into the mobile phase stream, using a valveinjector (Model 7125, Rheodyne, Cotati, CA). The columntemperature was kept at constant levels by circulating temper-ature-controlled water around the column. The concentrationof the sample compound leaving from the column was moni-tored with an ultraviolet detector of the HPLC system (ModelSPD-6A).
Procedure. Pulse response experiments (i.e., elution chro-matography) were conducted under different RPLC conditions,with a column temperature between 288 K and 308 K and avolume flow rate of the mobile phase in the range of 1-2 cm3/min. A small concentration pulse or perturbation was introducedinto the mobile phase stream at the inlet of the column. In thisstudy, we measured the chromatographic data under conditionsof the linear adsorption isotherm of the sample compoundsbecause the amounts that were injected were small enough. Thefirst absolute moment (µ1) and the second central moment (µ2′)of the elution peaks were analyzed by the moment method. Theinformation regarding the retention equilibrium and the mass-transfer kinetics was derived fromµ1 andµ2′ of the elution peakprofiles, respectively.1,11-14 Some physical properties of thepacking materials (such as the internal porosity) were derivedfrom the pulse response data obtained using uracil and sodiumnitrate as the inert tracers.
Data Analysis. In this study, the values ofDs were derivedfrom µ2′ by subtracting the contributions to band broadeningof several kinetic processes acting in the column, axial disper-sion, external mass transfer, and pore diffusion. Only the basicinformation about the derivation procedure of theDs data isbriefly described in the following. Further details on the momentanalysis method can be found in other references.1,11-14
First, the value ofK was calculated from the first moment(µ1) of the elution peak. The constantK is the ratio of the soluteconcentrations in the stationary and the mobile phase atequilibrium. The concentration in the stationary phase is definedas the weight of the sample compound per unit weight of theparticulate packing materials. On the other hand, the expressionof volumetric concentration is used for the mobile phase. Thevalue ofK (in units of cm3/g) is derived fromµ1 by taking intoaccount the hold-up time of the column, the weight of stationaryphase in the column, and the void volume of the column. Theintraparticle diffusivity (De) and the axial dispersion coefficientthen were derived fromµ2′ after subtracting the contribution ofthe external mass transfer to the band spreading. The contribu-tion of intraparticle diffusion and that of the axial dispersionwere separated by taking advantage of their different flow-ratedependence. The external mass-transfer coefficient (kf) wasestimated by the equation of Wilson-Geankoplis.42 The Wilke-Chang equation was used to estimate the molecular diffusivity(Dm) of the sample compounds in the mobile-phase solvent.1,43,44
It was also assumed that intraparticle diffusion consists of twoparallel contributions: those due to pore diffusion and thosedue to surface diffusion.13,14The value ofDs was calculated bysubtracting the contribution of pore diffusion to intraparticle
diffusion. The pore diffusivity (Dp) was estimated fromDm, εp,the hindrance parameter (kh), and the tortuosity factor (kt) ofthe internal pores. The equation proposed by Satterfilder et al.45
was used to estimatekh from the ratio of the diameter of thesample molecule to the average pore diameter. The value ofkt
was determined from the similar pulse response experiments,using uracil as the inert tracer. The contribution of theadsorption/desorption kinetics at the actual adsorption sites toµ2′ was assumed to be negligibly small in RPLC.46
Several corrections were also made accurately to deriveDs
values fromµ2′. These corrections are described in the following.1. Correction for Extra-Column Tubes. The retention time
and the band dispersion experimentally measured were correctedfor the contributions of the extra-column tubes between theinjection valve and the column and between the column andthe detector. These contributions were measured from the resultsof tracer experiments made without the column and werecorrected to derive the values ofK and Ds from µ1 and µ2′,respectively.
2. Correction for Asymmetrical Peak Profiles. The influenceof the peak distortion on the determination ofµ1 andµ2′ wascorrected. The occurrence of asymmetrical (tailing or fronting)peaks has been explained based on several models.1 In this study,the radial heterogeneity of the packing structure in the columnwas regarded as the only significant origin of the peakskewness.47-49 More-accurate values ofµ1 andµ2′ were derivedfrom the elution peak profiles by applying a correctionprocedure, using some basic information of the peak, i.e., thepeak width at 10% and 50% peak height and the asymmetryfactor at 10% height. Possible heterogeneous mass-transferkinetics was not considered, because the surface of the alkylligands bonded silica gels seems to be energetically homoge-neous. For instance, when C18-silica gels are used as thestationary phase, (i) the phase equilibrium isotherm is usuallyaccounted for by the simple Langmuir model1,11,46,50and (ii)bothQst andEs were almost constant, irrespective of the amountof sample compounds adsorbed.11 These experimental observa-tions imply the apparent uniformity of the surface of C18-silicagels.
3. Correction for the Injection Volume of Sample Solution.The contributions ofµ1 andµ2′ of the sample pulses introducedat the inlet of the column were neglected, because of theextremely small size of the sample solution injected. Asdescribed previously, for instance, the injection volume of thesample solution ofn-hexylbenzene was ca. 300µL, because ofthe low solubility of the compound into the mobile-phasesolvent. It is not small in comparison with the conventionalsample injection volume in LC. However, the retention volumeof n-hexylbenzene is∼2 orders of magnitude or more largerthan the sample injection volume. The retention ofn-hexylben-zene is so strong that the volume of the sample injected providessubstantially no influence on the moment analysis of the elutionpeaks.
4. Correction for the External Mass-Transfer Kinetics. Asmentioned previously, the contribution of the external mass-transfer resistance toµ2′ was subtracted beforehand during thedetermination ofDe. An uncertainty in the estimation ofkf
provides an influence on the results of the second momentanalysis. In this study,kf was estimated by the Wilson-Geankoplis equation.42 For instance, a value,kf ) 3.4 × 10⁻²
cm/s, was obtained for benzene at 298 K when the superficialvelocity of the mobile phase solvent is 0.12 cm/s. Accordingto the equation proposed by Kataoka et al.,51 a slightly differentvalue, kf ) 2.6 × 10⁻² cm/s, was obtained under the same
12040 J. Phys. Chem. B, Vol. 109, No. 24, 2005 Miyabe and Guiochon
conditions. The corresponding values ofDs were 7.2× 10⁻⁶
cm2/s and 5.8× 10⁻⁶ cm2/s, respectively. These two valuesdiffer by ca. 25%. The influence of variation in the estimatedvalue ofkf onDs values is not so large, because the contributionof the external mass-transfer resistance toµ2′ is usually∼20%-30% in some RPLC systems.11
(5) Correction for Pore Diffusion. The contribution ofDp toDe is corrected whenDs is calculated fromDe. As mentionedpreviously, Dp was calculated fromDm, εp, kh, and kt. Theaccuracy in the estimation ofDm affects the accuracy in theestimation ofDs. In this study,Dm of the sample molecules inthe mobile-phase solvent was calculated using the Wilke-Changequation.1,43,44 It is considered that this correlation providesestimates ofDm that are in error by less than∼10%.43 Surfacediffusion is usually the major contribution to intraparticlediffusion. For example, the contribution of surface diffusion tothe overall mass transfer inside C18-silica gel particles was largeand as much as∼85%-95%.11 Because of the predominantcontribution of surface diffusion to intraparticle diffusion, theinfluence of small variation inDp (and, hence, inDm) on theestimate ofDs is small.
To derive a more-accurate value ofDs, we made thecorrections described previously for some of the parametersaffecting the original experimental data ofµ1 andµ2′ and forthe parallel contributions of diffusive molecular migrationprocesses other than surface diffusion. These corrections areresponsible for the error made in the determination ofDs, whichis estimated at∼5%-10%.11,12 In addition, in this study, thepulse response experiments were conducted under such condi-tions that the influence of some sources on the peak broadeningas described previously is minimized. Because relatively largeparticles of the alkyl ligands bonded silica gels were used asthe packing materials, the original values ofµ2′ attributed tothe band broadening in the column were relatively large.
Results and Discussion
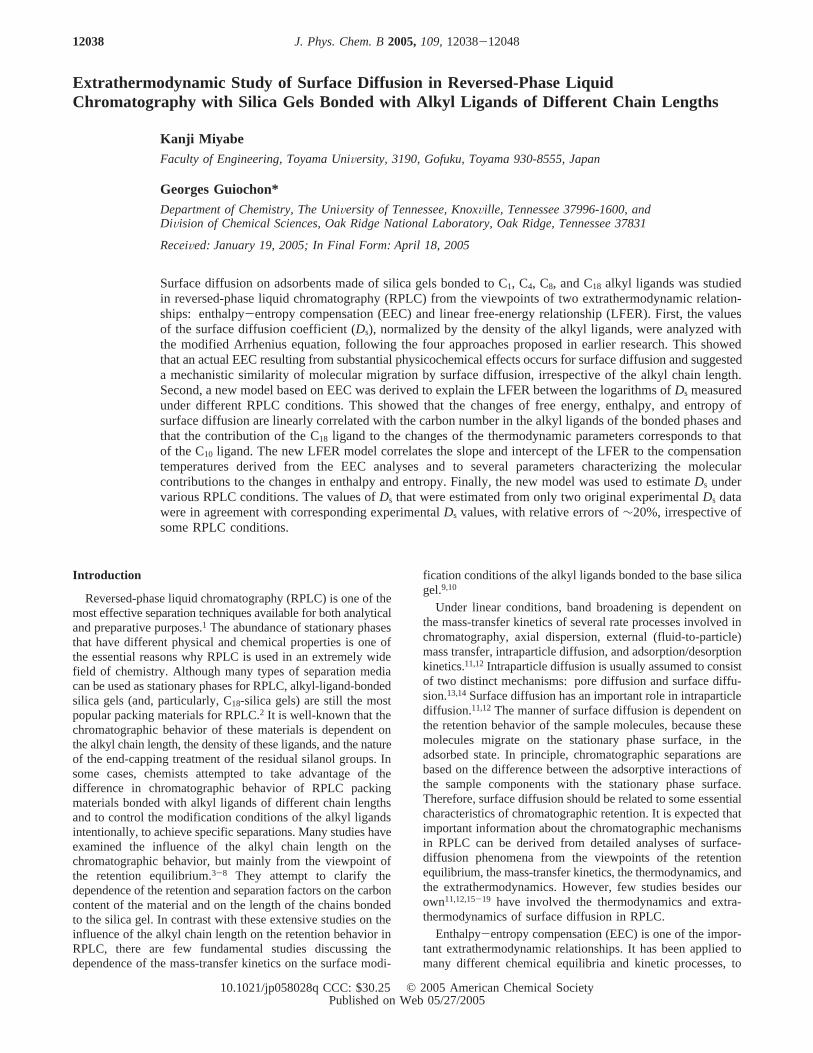
Dependence ofDs on the Retention.The solid lines in Figure1 illustrate the correlation experimentally observed betweenDs
and the carbon content of the stationary phases. The value ofDs gradually decreases as the carbon content increases. However,the value ofDs also begins to plateau when the carbon contentexceeds a critical value (∼10%), a value that seems to beapproximately the same for all the compounds studied. The
results in Figure 1 imply that molecular migration by surfacediffusion is restricted by the adsorptive interaction between thesample molecules and the stationary-phase surface.
Previously,11,12,15-17,39,52-54 we studied surface diffusionphenomena from various points of view, including the retentionequilibrium, its thermodynamics, and its extrathermodynamics.On the basis of these results, we proposed a “surface-restrictedmolecular diffusion model” as a first approximation to interpretthe intrinsic characteristics and mechanisms of surface diffusion:
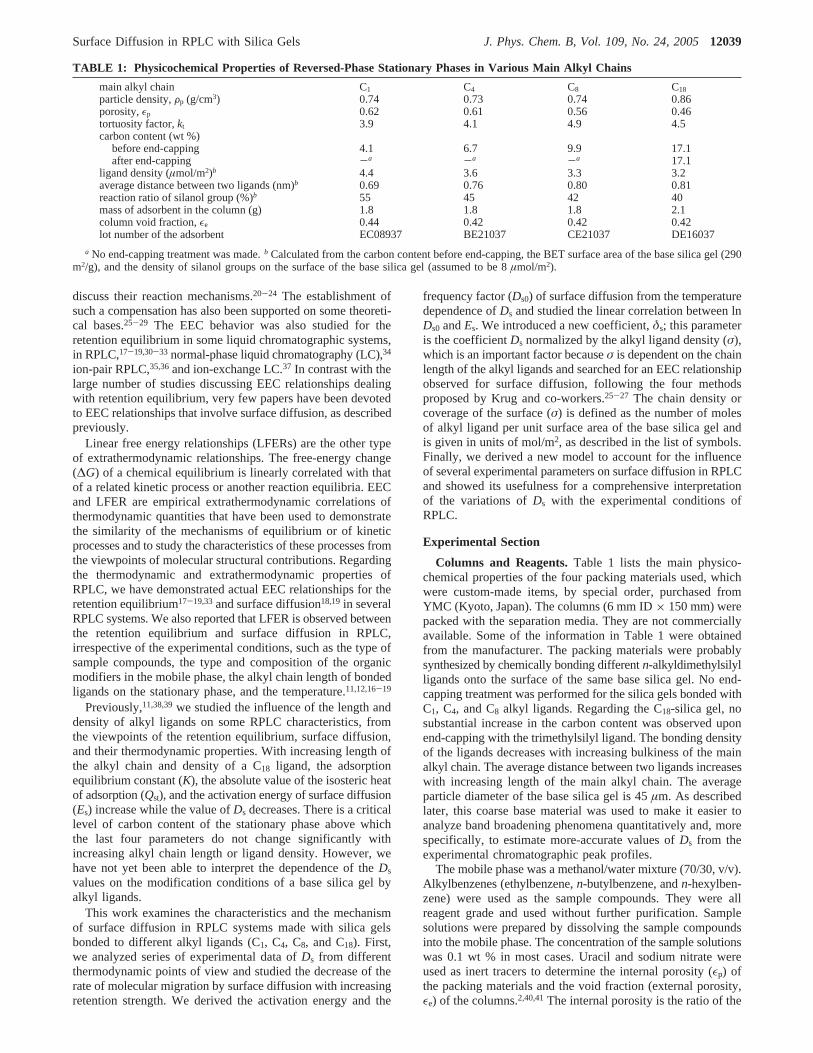
whereR is the gas constant andT is the absolute temperature.The solid lines in Figure 2 illustrate the linear correlationbetween lnDs andQst. They are almost parallel. The slope ofthe linear lines corresponds to the ratio of the proportionalcoefficient (R) to RT. The value of lnDs decreases almostlinearly as-Qst increases, suggesting that surface diffusion isrestricted by the retention strength.
Enthalpy-Entropy Compensation of Surface Diffusion.The temperature dependence ofDs was analyzed according tothe Arrhenius equation:
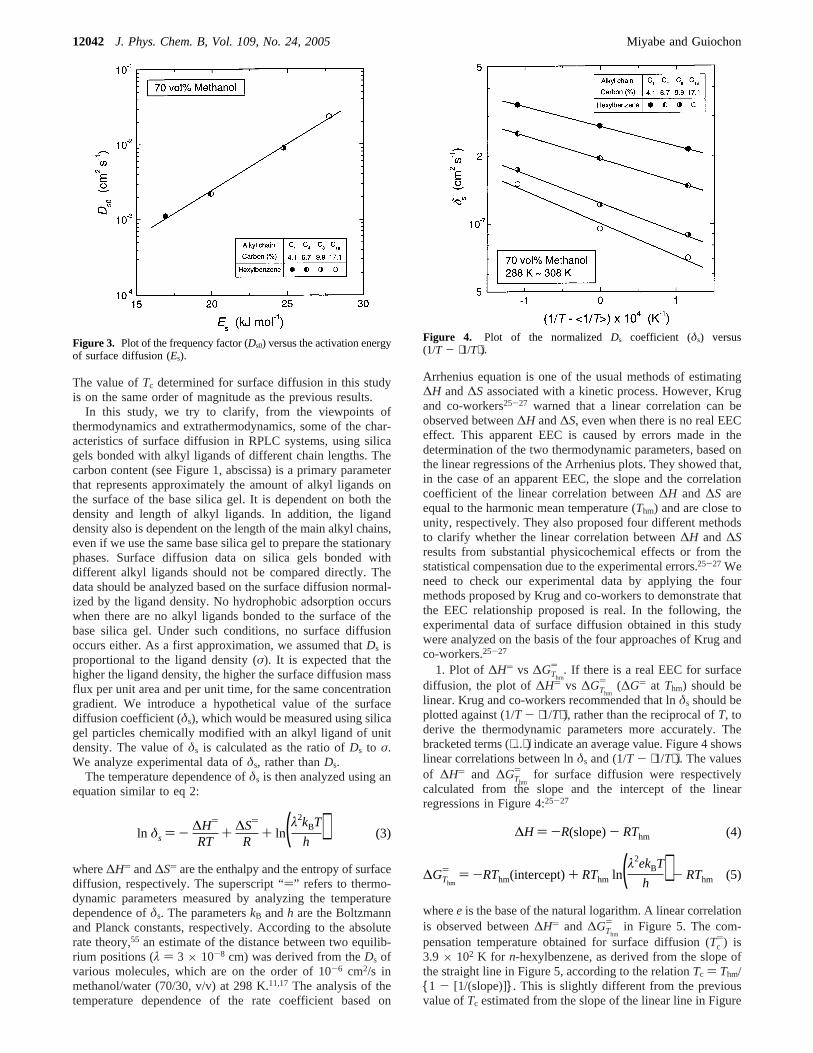
Figure 3 shows a plot between the frequency factor of surfacediffusion (Ds0) and its activation energy (Es), using the valuesmeasured forn-hexylbenzene on the different columns used.The linear correlation between lnDs0 andEs suggests that thereis an EEC for surface diffusion, regardless of the modificationconditions of the alkyl-ligand-bonded silica gels. The slope ofthe straight line in Figure 3 indicates a compensation temperature(Tc) of ∼4.2× 10² K. Unfortunately, there are no other valuesof Tc for surface diffusion with which to compare our own.18,19
We reported aTc value of ca. 6.0× 10² K for the surfacediffusion of p-alkylphenol derivatives in the RPLC systemconsisting of a C18-silica gel column and a mixture of methanoland water (70/30, v/v).19 Similarly, a value ofTc ) 3.7 × 10²
K was reported for the surface diffusion of benzene derivativesand naphthalene in the RPLC system using a C18-silica gelcolumn and an aqueous solution of tetrahydrofuran (50 vol %).18
Figure 1. Plot of the surface diffusion coefficient (Ds) versus the carboncontent of the stationary phases.
Figure 2. Plot of Ds versus the isosteric heat of adsorption (-Qst).
Ds ≈ Dm exp[-R(-Qst)
RT ] (1)
Ds ) Ds0 exp(-Es
RT) (2)
Surface Diffusion in RPLC with Silica Gels J. Phys. Chem. B, Vol. 109, No. 24, 200512041
The value ofTc determined for surface diffusion in this studyis on the same order of magnitude as the previous results.
In this study, we try to clarify, from the viewpoints ofthermodynamics and extrathermodynamics, some of the char-acteristics of surface diffusion in RPLC systems, using silicagels bonded with alkyl ligands of different chain lengths. Thecarbon content (see Figure 1, abscissa) is a primary parameterthat represents approximately the amount of alkyl ligands onthe surface of the base silica gel. It is dependent on both thedensity and length of alkyl ligands. In addition, the liganddensity also is dependent on the length of the main alkyl chains,even if we use the same base silica gel to prepare the stationaryphases. Surface diffusion data on silica gels bonded withdifferent alkyl ligands should not be compared directly. Thedata should be analyzed based on the surface diffusion normal-ized by the ligand density. No hydrophobic adsorption occurswhen there are no alkyl ligands bonded to the surface of thebase silica gel. Under such conditions, no surface diffusionoccurs either. As a first approximation, we assumed thatDs isproportional to the ligand density (σ). It is expected that thehigher the ligand density, the higher the surface diffusion massflux per unit area and per unit time, for the same concentrationgradient. We introduce a hypothetical value of the surfacediffusion coefficient (δs), which would be measured using silicagel particles chemically modified with an alkyl ligand of unitdensity. The value ofδs is calculated as the ratio ofDs to σ.We analyze experimental data ofδs, rather thanDs.
The temperature dependence ofδs is then analyzed using anequation similar to eq 2:
where∆H) and∆S) are the enthalpy and the entropy of surfacediffusion, respectively. The superscript “)” refers to thermo-dynamic parameters measured by analyzing the temperaturedependence ofδs. The parameterskB andh are the Boltzmannand Planck constants, respectively. According to the absoluterate theory,55 an estimate of the distance between two equilib-rium positions (λ ) 3 × 10⁻⁸ cm) was derived from theDs ofvarious molecules, which are on the order of 10-6 cm2/s inmethanol/water (70/30, v/v) at 298 K.11,17 The analysis of thetemperature dependence of the rate coefficient based on
Arrhenius equation is one of the usual methods of estimating∆H and∆S associated with a kinetic process. However, Krugand co-workers25-27 warned that a linear correlation can beobserved between∆H and∆S, even when there is no real EECeffect. This apparent EEC is caused by errors made in thedetermination of the two thermodynamic parameters, based onthe linear regressions of the Arrhenius plots. They showed that,in the case of an apparent EEC, the slope and the correlationcoefficient of the linear correlation between∆H and ∆S areequal to the harmonic mean temperature (Thm) and are close tounity, respectively. They also proposed four different methodsto clarify whether the linear correlation between∆H and ∆Sresults from substantial physicochemical effects or from thestatistical compensation due to the experimental errors.25-27 Weneed to check our experimental data by applying the fourmethods proposed by Krug and co-workers to demonstrate thatthe EEC relationship proposed is real. In the following, theexperimental data of surface diffusion obtained in this studywere analyzed on the basis of the four approaches of Krug andco-workers.25-27
1. Plot of∆H) vs ∆GThm
) . If there is a real EEC for surfacediffusion, the plot of∆H) vs ∆GThm
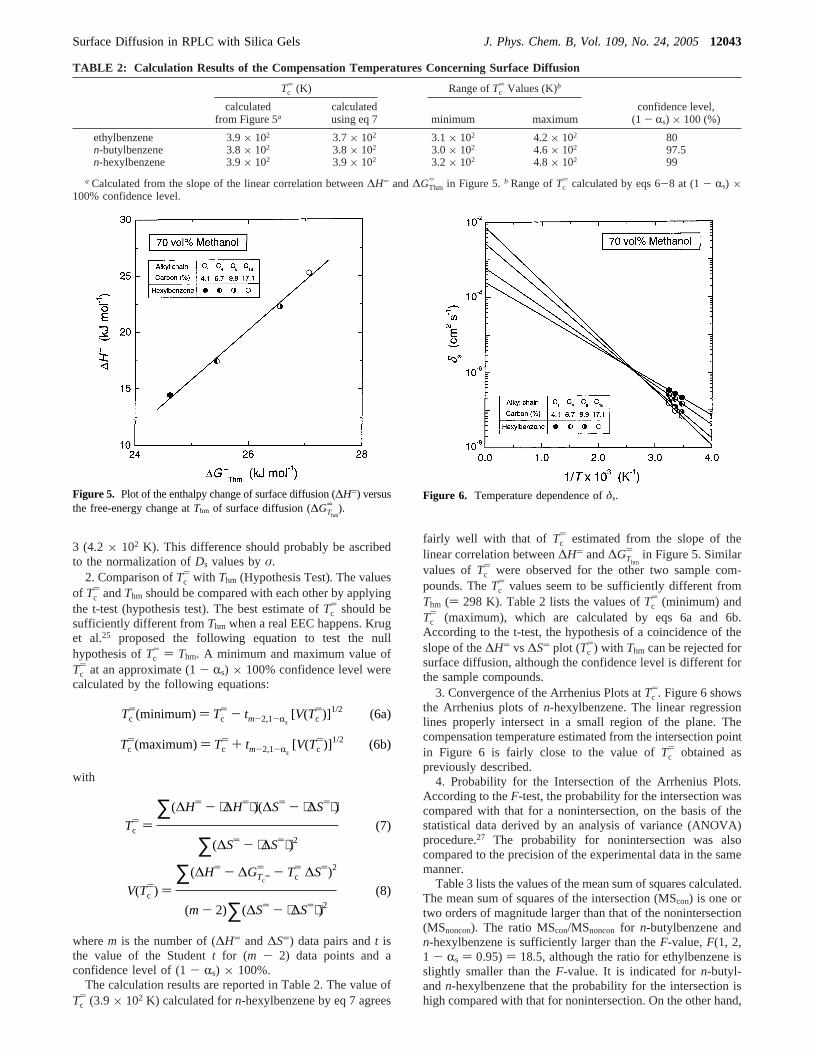
) (∆G) at Thm) should belinear. Krug and co-workers recommended that lnδs should beplotted against (1/T - ⟨1/T⟩), rather than the reciprocal ofT, toderive the thermodynamic parameters more accurately. Thebracketed terms (⟨...⟩) indicate an average value. Figure 4 showslinear correlations between lnδs and (1/T - ⟨1/T⟩). The valuesof ∆H) and ∆GThm
) for surface diffusion were respectivelycalculated from the slope and the intercept of the linearregressions in Figure 4:25-27
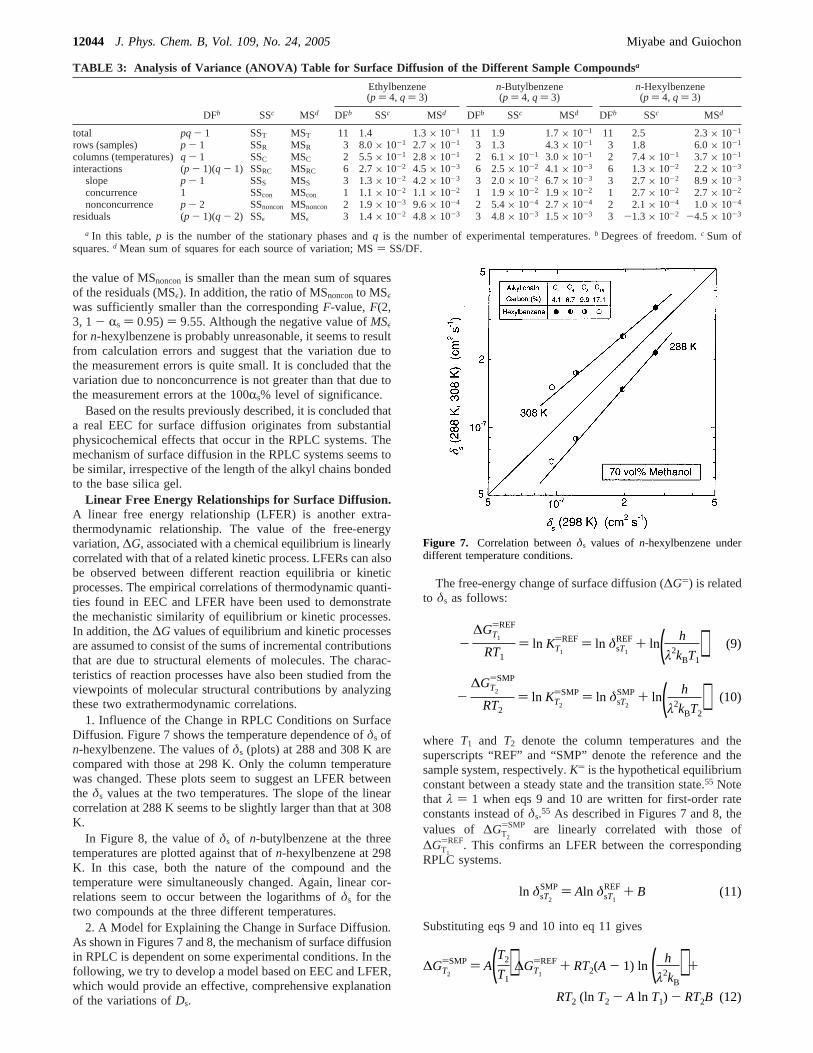
wheree is the base of the natural logarithm. A linear correlationis observed between∆H) and ∆GThm
) in Figure 5. The com-pensation temperature obtained for surface diffusion (Tc
)) is3.9 × 102 K for n-hexylbenzene, as derived from the slope ofthe straight line in Figure 5, according to the relationTc ) Thm/{1 - [1/(slope)]}. This is slightly different from the previousvalue ofTc estimated from the slope of the linear line in Figure
Figure 3. Plot of the frequency factor (Ds0) versus the activation energyof surface diffusion (Es).
ln δs ) - ∆H)
RT+ ∆S)
R+ ln(λ2kBT
h ) (3)
Figure 4. Plot of the normalizedDs coefficient (δs) versus(1/T - ⟨1/T⟩).
∆H ) -R(slope)- RThm (4)
∆GThm
) ) -RThm(intercept)+ RThm ln(λ2ekBT
h ) - RThm (5)
12042 J. Phys. Chem. B, Vol. 109, No. 24, 2005 Miyabe and Guiochon
3 (4.2× 10² K). This difference should probably be ascribedto the normalization ofDs values byσ.
2. Comparison ofTc) with Thm (Hypothesis Test). The values
of Tc) andThm should be compared with each other by applying
the t-test (hypothesis test). The best estimate ofTc) should be
sufficiently different fromThm when a real EEC happens. Kruget al.25 proposed the following equation to test the nullhypothesis ofTc
) ) Thm. A minimum and maximum value ofTc
) at an approximate (1- Rs) × 100% confidence level werecalculated by the following equations:
with
wherem is the number of (∆H) and∆S)) data pairs andt isthe value of the Studentt for (m - 2) data points and aconfidence level of (1- Rs) × 100%.
The calculation results are reported in Table 2. The value ofTc
) (3.9× 10² K) calculated forn-hexylbenzene by eq 7 agrees
fairly well with that of Tc) estimated from the slope of the
linear correlation between∆H) and∆GThm
) in Figure 5. Similarvalues ofTc
) were observed for the other two sample com-pounds. TheTc
) values seem to be sufficiently different fromThm () 298 K). Table 2 lists the values ofTc
) (minimum) andTc
) (maximum), which are calculated by eqs 6a and 6b.According to the t-test, the hypothesis of a coincidence of theslope of the∆H) vs ∆S) plot (Tc
)) with Thm can be rejected forsurface diffusion, although the confidence level is different forthe sample compounds.
3. Convergence of the Arrhenius Plots atTc). Figure 6 shows
the Arrhenius plots ofn-hexylbenzene. The linear regressionlines properly intersect in a small region of the plane. Thecompensation temperature estimated from the intersection pointin Figure 6 is fairly close to the value ofTc
) obtained aspreviously described.
4. Probability for the Intersection of the Arrhenius Plots.According to theF-test, the probability for the intersection wascompared with that for a nonintersection, on the basis of thestatistical data derived by an analysis of variance (ANOVA)procedure.27 The probability for nonintersection was alsocompared to the precision of the experimental data in the samemanner.
Table 3 lists the values of the mean sum of squares calculated.The mean sum of squares of the intersection (MScon) is one ortwo orders of magnitude larger than that of the nonintersection(MSnoncon). The ratio MScon/MSnoncon for n-butylbenzene andn-hexylbenzene is sufficiently larger than theF-value,F(1, 2,1 - Rs ) 0.95)) 18.5, although the ratio for ethylbenzene isslightly smaller than theF-value. It is indicated forn-butyl-andn-hexylbenzene that the probability for the intersection ishigh compared with that for nonintersection. On the other hand,
TABLE 2: Calculation Results of the Compensation Temperatures Concerning Surface Diffusion
Tc) (K) Range ofTc
) Values (K)b
calculatedfrom Figure 5a
calculatedusing eq 7 minimum maximum
confidence level,(1 - Rs) × 100 (%)
ethylbenzene 3.9× 10² 3.7× 10² 3.1× 10² 4.2× 10² 80n-butylbenzene 3.8× 10² 3.8× 10² 3.0× 10² 4.6× 10² 97.5n-hexylbenzene 3.9× 10² 3.9× 10² 3.2× 10² 4.8× 10² 99
a Calculated from the slope of the linear correlation between∆H) and∆GThm) in Figure 5.b Range ofTc
) calculated by eqs 6-8 at (1- Rs) ×100% confidence level.
Figure 5. Plot of the enthalpy change of surface diffusion (∆H)) versusthe free-energy change atThm of surface diffusion (∆GThm
) ).
Tc)(minimum)) Tc
) - tm-2,1-Rs[V(Tc
))]1/2 (6a)
Tc)(maximum)) Tc
) + tm-2,1-Rs[V(Tc
))]1/2 (6b)
Tc) )
∑(∆H) - ⟨∆H)⟩)(∆S) - ⟨∆S)⟩)
∑(∆S) - ⟨∆S)⟩)2
(7)
V(Tc)) )
∑(∆H) - ∆GTc)
) - Tc) ∆S))2
(m - 2)∑(∆S) - ⟨∆S)⟩)2
(8)
Figure 6. Temperature dependence ofδs.
Surface Diffusion in RPLC with Silica Gels J. Phys. Chem. B, Vol. 109, No. 24, 200512043
the value of MSnonconis smaller than the mean sum of squaresof the residuals (MSε). In addition, the ratio of MSnonconto MSε
was sufficiently smaller than the correspondingF-value,F(2,3, 1 - Rs ) 0.95)) 9.55. Although the negative value ofMSε
for n-hexylbenzene is probably unreasonable, it seems to resultfrom calculation errors and suggest that the variation due tothe measurement errors is quite small. It is concluded that thevariation due to nonconcurrence is not greater than that due tothe measurement errors at the 100Rs% level of significance.
Based on the results previously described, it is concluded thata real EEC for surface diffusion originates from substantialphysicochemical effects that occur in the RPLC systems. Themechanism of surface diffusion in the RPLC systems seems tobe similar, irrespective of the length of the alkyl chains bondedto the base silica gel.
Linear Free Energy Relationships for Surface Diffusion.A linear free energy relationship (LFER) is another extra-thermodynamic relationship. The value of the free-energyvariation,∆G, associated with a chemical equilibrium is linearlycorrelated with that of a related kinetic process. LFERs can alsobe observed between different reaction equilibria or kineticprocesses. The empirical correlations of thermodynamic quanti-ties found in EEC and LFER have been used to demonstratethe mechanistic similarity of equilibrium or kinetic processes.In addition, the∆G values of equilibrium and kinetic processesare assumed to consist of the sums of incremental contributionsthat are due to structural elements of molecules. The charac-teristics of reaction processes have also been studied from theviewpoints of molecular structural contributions by analyzingthese two extrathermodynamic correlations.
1. Influence of the Change in RPLC Conditions on SurfaceDiffusion. Figure 7 shows the temperature dependence ofδs ofn-hexylbenzene. The values ofδs (plots) at 288 and 308 K arecompared with those at 298 K. Only the column temperaturewas changed. These plots seem to suggest an LFER betweenthe δs values at the two temperatures. The slope of the linearcorrelation at 288 K seems to be slightly larger than that at 308K.
In Figure 8, the value ofδs of n-butylbenzene at the threetemperatures are plotted against that ofn-hexylbenzene at 298K. In this case, both the nature of the compound and thetemperature were simultaneously changed. Again, linear cor-relations seem to occur between the logarithms ofδs for thetwo compounds at the three different temperatures.
2. A Model for Explaining the Change in Surface Diffusion.As shown in Figures 7 and 8, the mechanism of surface diffusionin RPLC is dependent on some experimental conditions. In thefollowing, we try to develop a model based on EEC and LFER,which would provide an effective, comprehensive explanationof the variations ofDs.
The free-energy change of surface diffusion (∆G)) is relatedto δs as follows:
where T1 and T2 denote the column temperatures and thesuperscripts “REF” and “SMP” denote the reference and thesample system, respectively.K) is the hypothetical equilibriumconstant between a steady state and the transition state.55 Notethat λ ) 1 when eqs 9 and 10 are written for first-order rateconstants instead ofδs.55 As described in Figures 7 and 8, thevalues of ∆GT2
)SMP are linearly correlated with those of∆GT1
)REF. This confirms an LFER between the correspondingRPLC systems.
Substituting eqs 9 and 10 into eq 11 gives
TABLE 3: Analysis of Variance (ANOVA) Table for Surface Diffusion of the Different Sample Compoundsa
Ethylbenzene(p ) 4, q ) 3)
n-Butylbenzene(p ) 4, q ) 3)
n-Hexylbenzene(p ) 4, q ) 3)
DFb SSc MSd DFb SSc MSd DFb SSc MSd DFb SSc MSd
total pq - 1 SST MST 11 1.4 1.3× 10⁻¹ 11 1.9 1.7× 10⁻¹ 11 2.5 2.3× 10⁻¹
rows (samples) p - 1 SSR MSR 3 8.0× 10⁻¹ 2.7× 10⁻¹ 3 1.3 4.3× 10⁻¹ 3 1.8 6.0× 10⁻¹
columns (temperatures)q - 1 SSC MSC 2 5.5× 10⁻¹ 2.8× 10⁻¹ 2 6.1× 10⁻¹ 3.0× 10⁻¹ 2 7.4× 10⁻¹ 3.7× 10⁻¹
interactions (p - 1)(q - 1) SSRC MSRC 6 2.7× 10⁻² 4.5× 10⁻³ 6 2.5× 10⁻² 4.1× 10⁻³ 6 1.3× 10⁻² 2.2× 10⁻³
slope p - 1 SSS MSS 3 1.3× 10⁻² 4.2× 10⁻³ 3 2.0× 10⁻² 6.7× 10⁻³ 3 2.7× 10⁻² 8.9× 10⁻³
concurrence 1 SScon MScon 1 1.1× 10⁻² 1.1× 10⁻² 1 1.9× 10⁻² 1.9× 10⁻² 1 2.7× 10⁻² 2.7× 10⁻²
nonconcurrence p - 2 SSnoncon MSnoncon 2 1.9× 10⁻³ 9.6× 10⁻⁴ 2 5.4× 10⁻⁴ 2.7× 10⁻⁴ 2 2.1× 10⁻⁴ 1.0× 10⁻⁴
residuals (p - 1)(q - 2) SSε MSε 3 1.4× 10⁻² 4.8× 10⁻³ 3 4.8× 10⁻³ 1.5× 10⁻³ 3 -1.3× 10⁻² -4.5× 10⁻³
a In this table,p is the number of the stationary phases andq is the number of experimental temperatures.b Degrees of freedom.c Sum ofsquares.d Mean sum of squares for each source of variation; MS) SS/DF.
Figure 7. Correlation betweenδs values ofn-hexylbenzene underdifferent temperature conditions.
-∆GT1
)REF
RT1) ln KT1
)REF ) ln δsT1
REF + ln( h
λ2kBT1) (9)
-∆GT2
)SMP
RT2) ln KT2
)SMP ) ln δsT2
SMP + ln( h
λ2kBT2) (10)
ln δsT2
SMP ) Aln δsT1
REF + B (11)
∆GT2
)SMP ) A(T2
T1)∆GT1
)REF + RT2(A - 1) ln ( h
λ2kB) +
RT2 (ln T2 - A ln T1) - RT2B (12)
12044 J. Phys. Chem. B, Vol. 109, No. 24, 2005 Miyabe and Guiochon
Equation 12 formulates the LFER between the different RPLCconditions considered.
On the other hand,∆G) is the sum of an enthalpy change(∆H)) and an entropy change (∆S)), according to the Gibbs-Helmholtz relation.
The following equation has been proposed to correlate∆G) ofa molecule involved in hydrophobic interactions with a param-eter describing a molecular property (Xm):29,56
whereag andbg are the molecular thermodynamic parameters.The value ofag is ∆G) per unit value of the molecular propertyXm and that ofbg is ∆G) at Xm ) 0. Various molecularproperties can be taken forXm (for instance, the surface area ofthe nonpolar part of the molecule or recurring structuralelements, e.g., the number of methylene units in an alkyl chain).In this study, the number of C atoms in the alkyl ligands bondedto the base silica gel was changed. The number of methylenegroups (Cn) in the alkyl ligands was used asXm. The value ofCn includes the contribution of both the main alkyl chain andtwo methyl groups, because the packing materials used in thisstudy were probably synthesized using alkyldimethylsilylligands.
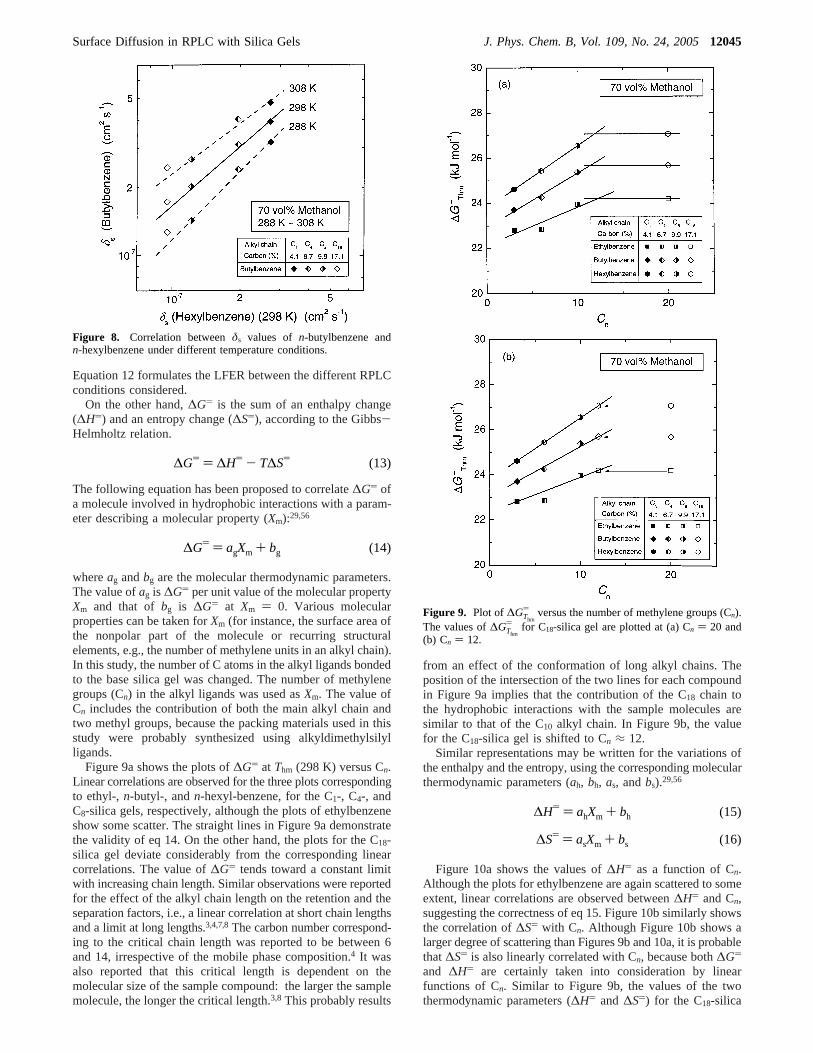
Figure 9a shows the plots of∆G) at Thm (298 K) versus Cn.Linear correlations are observed for the three plots correspondingto ethyl-, n-butyl-, andn-hexyl-benzene, for the C1-, C4-, andC8-silica gels, respectively, although the plots of ethylbenzeneshow some scatter. The straight lines in Figure 9a demonstratethe validity of eq 14. On the other hand, the plots for the C18-silica gel deviate considerably from the corresponding linearcorrelations. The value of∆G) tends toward a constant limitwith increasing chain length. Similar observations were reportedfor the effect of the alkyl chain length on the retention and theseparation factors, i.e., a linear correlation at short chain lengthsand a limit at long lengths.3,4,7,8The carbon number correspond-ing to the critical chain length was reported to be between 6and 14, irrespective of the mobile phase composition.4 It wasalso reported that this critical length is dependent on themolecular size of the sample compound: the larger the samplemolecule, the longer the critical length.3,8 This probably results
from an effect of the conformation of long alkyl chains. Theposition of the intersection of the two lines for each compoundin Figure 9a implies that the contribution of the C18 chain tothe hydrophobic interactions with the sample molecules aresimilar to that of the C10 alkyl chain. In Figure 9b, the valuefor the C18-silica gel is shifted to Cn ≈ 12.
Similar representations may be written for the variations ofthe enthalpy and the entropy, using the corresponding molecularthermodynamic parameters (ah, bh, as, andbs).29,56
Figure 10a shows the values of∆H) as a function of Cn.Although the plots for ethylbenzene are again scattered to someextent, linear correlations are observed between∆H) and Cn,suggesting the correctness of eq 15. Figure 10b similarly showsthe correlation of∆S) with Cn. Although Figure 10b shows alarger degree of scattering than Figures 9b and 10a, it is probablethat∆S) is also linearly correlated with Cn, because both∆G)
and ∆H) are certainly taken into consideration by linearfunctions of Cn. Similar to Figure 9b, the values of the twothermodynamic parameters (∆H) and ∆S)) for the C18-silica
Figure 8. Correlation betweenδs values of n-butylbenzene andn-hexylbenzene under different temperature conditions.
∆G) ) ∆H) - T∆S) (13)
∆G) ) agXm + bg (14)
Figure 9. Plot of ∆GThm
) versus the number of methylene groups (Cn).The values of∆GThm
) for C18-silica gel are plotted at (a) Cn ) 20 and(b) Cn ) 12.
∆H) ) ahXm + bh (15)
∆S) ) asXm + bs (16)
Surface Diffusion in RPLC with Silica Gels J. Phys. Chem. B, Vol. 109, No. 24, 200512045
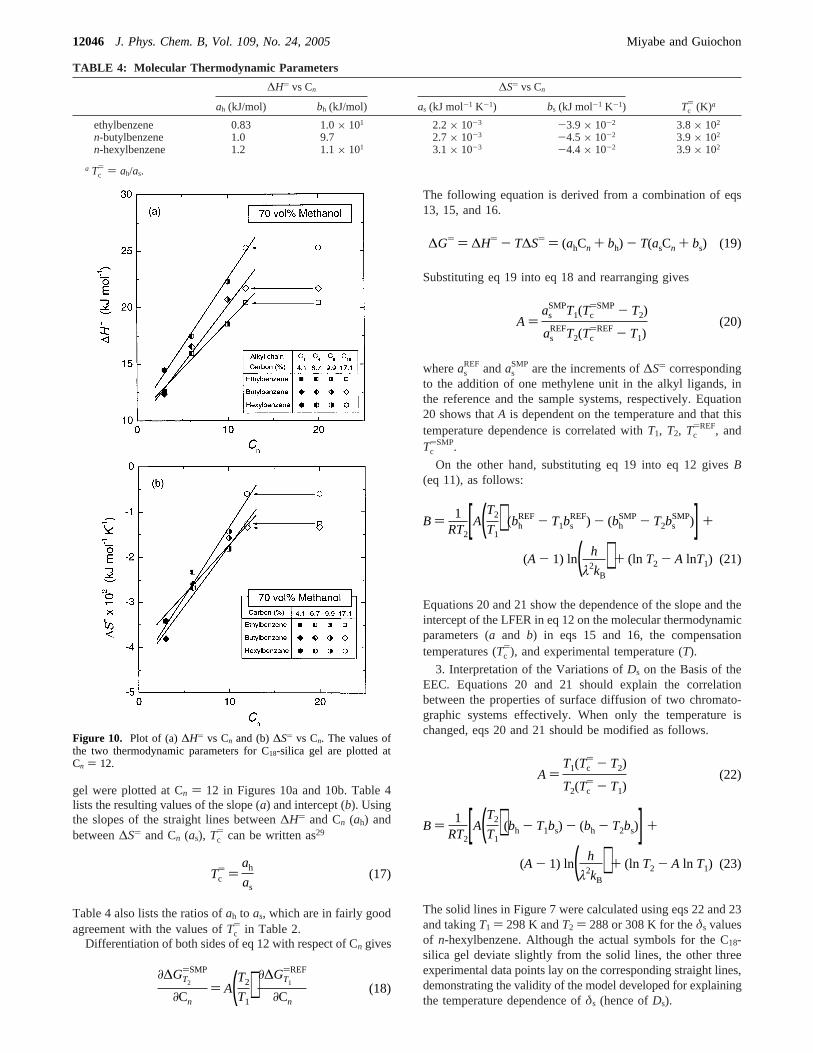
gel were plotted at Cn ) 12 in Figures 10a and 10b. Table 4lists the resulting values of the slope (a) and intercept (b). Usingthe slopes of the straight lines between∆H) and Cn (ah) andbetween∆S) and Cn (as), Tc
) can be written as29
Table 4 also lists the ratios ofah to as, which are in fairly goodagreement with the values ofTc
) in Table 2.Differentiation of both sides of eq 12 with respect of Cn gives
The following equation is derived from a combination of eqs13, 15, and 16.
Substituting eq 19 into eq 18 and rearranging gives
whereasREF andas
SMP are the increments of∆S) correspondingto the addition of one methylene unit in the alkyl ligands, inthe reference and the sample systems, respectively. Equation20 shows thatA is dependent on the temperature and that thistemperature dependence is correlated withT1, T2, Tc
)REF, andTc
)SMP.
On the other hand, substituting eq 19 into eq 12 givesB(eq 11), as follows:
Equations 20 and 21 show the dependence of the slope and theintercept of the LFER in eq 12 on the molecular thermodynamicparameters (a and b) in eqs 15 and 16, the compensationtemperatures (Tc
)), and experimental temperature (T).
3. Interpretation of the Variations ofDs on the Basis of theEEC. Equations 20 and 21 should explain the correlationbetween the properties of surface diffusion of two chromato-graphic systems effectively. When only the temperature ischanged, eqs 20 and 21 should be modified as follows.
The solid lines in Figure 7 were calculated using eqs 22 and 23and takingT1 ) 298 K andT2 ) 288 or 308 K for theδs valuesof n-hexylbenzene. Although the actual symbols for the C18-silica gel deviate slightly from the solid lines, the other threeexperimental data points lay on the corresponding straight lines,demonstrating the validity of the model developed for explainingthe temperature dependence ofδs (hence ofDs).
TABLE 4: Molecular Thermodynamic Parameters
∆H) vs Cn ∆S) vs Cn
ah (kJ/mol) bh (kJ/mol) as (kJ mol-1 K-1) bs (kJ mol-1 K-1) Tc) (K)a
ethylbenzene 0.83 1.0× 101 2.2× 10⁻³ -3.9× 10⁻² 3.8× 10²
n-butylbenzene 1.0 9.7 2.7× 10⁻³ -4.5× 10⁻² 3.9× 10²
n-hexylbenzene 1.2 1.1× 101 3.1× 10⁻³ -4.4× 10⁻² 3.9× 10²
a Tc) ) ah/as.
Figure 10. Plot of (a)∆H) vs Cn and (b)∆S) vs Cn. The values ofthe two thermodynamic parameters for C18-silica gel are plotted atCn ) 12.
Tc) )
ah
as(17)
∂∆GT2
)SMP
∂Cn) A(T2
T1) ∂∆GT1
)REF
∂Cn(18)
∆G) ) ∆H) - T∆S) ) (ahCn + bh) - T(asCn + bs) (19)
A )as
SMPT1(Tc)SMP - T2)
asREFT2(Tc
)REF - T1)(20)
B ) 1RT2
[A(T2
T1) (bh
REF - T1bsREF) - (bh
SMP - T2bsSMP)] +
(A - 1) ln( h
λ2kB) + (ln T2 - A lnT1) (21)
A )T1(Tc
) - T2)
T2(Tc) - T1)
(22)
B ) 1RT2
[A(T2
T1)(bh - T1bs) - (bh - T2bs)] +
(A - 1) ln( h
λ2kB) + (ln T2 - A ln T1) (23)
12046 J. Phys. Chem. B, Vol. 109, No. 24, 2005 Miyabe and Guiochon
When the temperature is constant, eqs 20 and 21 become
The solid line in Figure 8 was calculated using eqs 24 and 25at constant temperature (298 K). The two dashed lines in Figure8 were similarly calculated using eqs 20 and 21, because, inthat case, both the nature of the compounds and the temperaturewere simultaneously changed. Again, all the experimental dataoverlay the corresponding straight lines. This shows that eqs20 and 21 are useful to analyze the variations ofδs andDs withsome of the RPLC experimental conditions.
4. Estimation of the Value ofDs. The results describedpreviously show that it should be possible to estimate the valueof δssand, hence,Dssunder various RPLC experimentalconditions from a limited number of experimental values ofDs.In the following, three RPLC conditions (the nature of thecompounds, the length of the bonded alkyl chains, and thetemperature) were simultaneously changed. We calculatedDs
for three compounds (ethyl-,n-butyl-, andn-hexyl-benzene)between 288 and 308 K, on RPLC packing materials bondedto C1-, C4-, C8-, and C18-alkyl chains, in a methanol/water(70/30, v/v) solution, using only the two experimental valuesfor n-hexylbenzene, at 298 K, on C1- and C18-silica gels. First,the values ofDs for the three compounds were derived at agiven temperature on the C1- and C18-silica gels from those ofn-hexylbenzene, using eqs 20 and 21 and the molecularthermodynamic parameters (a andb) listed in Table 4 and thecompensation temperatures (Tc
)) listed in Tables 2 and 4. Thevalues ofDs on the C4- and C8-silica gels then were derivedusing the linear correlations between∆G) and Cn for eachcompound, as illustrated in Figure 9b. Linear functions of∆G)
with Cn were derived from the two values ofδs for the C1- andC18-silica gels estimated beforehand.
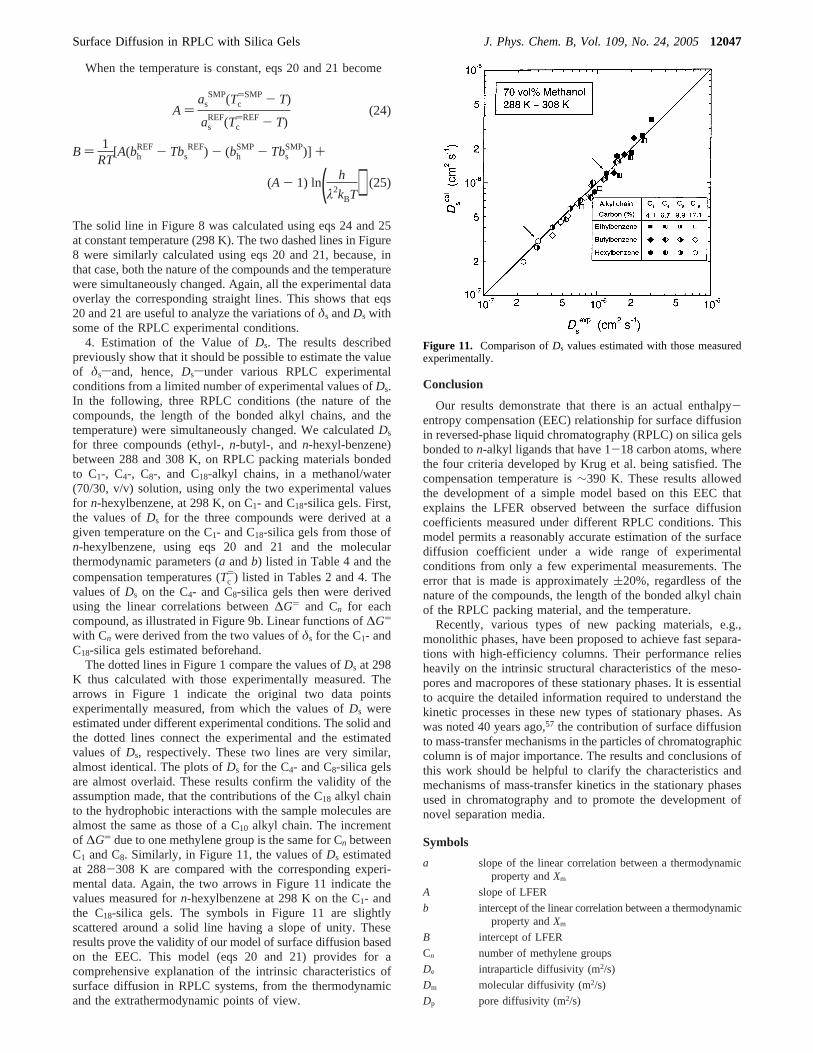
The dotted lines in Figure 1 compare the values ofDs at 298K thus calculated with those experimentally measured. Thearrows in Figure 1 indicate the original two data pointsexperimentally measured, from which the values ofDs wereestimated under different experimental conditions. The solid andthe dotted lines connect the experimental and the estimatedvalues ofDs, respectively. These two lines are very similar,almost identical. The plots ofDs for the C4- and C8-silica gelsare almost overlaid. These results confirm the validity of theassumption made, that the contributions of the C18 alkyl chainto the hydrophobic interactions with the sample molecules arealmost the same as those of a C10 alkyl chain. The incrementof ∆G) due to one methylene group is the same for Cn betweenC1 and C8. Similarly, in Figure 11, the values ofDs estimatedat 288-308 K are compared with the corresponding experi-mental data. Again, the two arrows in Figure 11 indicate thevalues measured forn-hexylbenzene at 298 K on the C1- andthe C18-silica gels. The symbols in Figure 11 are slightlyscattered around a solid line having a slope of unity. Theseresults prove the validity of our model of surface diffusion basedon the EEC. This model (eqs 20 and 21) provides for acomprehensive explanation of the intrinsic characteristics ofsurface diffusion in RPLC systems, from the thermodynamicand the extrathermodynamic points of view.
Conclusion
Our results demonstrate that there is an actual enthalpy-entropy compensation (EEC) relationship for surface diffusionin reversed-phase liquid chromatography (RPLC) on silica gelsbonded ton-alkyl ligands that have 1-18 carbon atoms, wherethe four criteria developed by Krug et al. being satisfied. Thecompensation temperature is∼390 K. These results allowedthe development of a simple model based on this EEC thatexplains the LFER observed between the surface diffusioncoefficients measured under different RPLC conditions. Thismodel permits a reasonably accurate estimation of the surfacediffusion coefficient under a wide range of experimentalconditions from only a few experimental measurements. Theerror that is made is approximately(20%, regardless of thenature of the compounds, the length of the bonded alkyl chainof the RPLC packing material, and the temperature.
Recently, various types of new packing materials, e.g.,monolithic phases, have been proposed to achieve fast separa-tions with high-efficiency columns. Their performance reliesheavily on the intrinsic structural characteristics of the meso-pores and macropores of these stationary phases. It is essentialto acquire the detailed information required to understand thekinetic processes in these new types of stationary phases. Aswas noted 40 years ago,57 the contribution of surface diffusionto mass-transfer mechanisms in the particles of chromatographiccolumn is of major importance. The results and conclusions ofthis work should be helpful to clarify the characteristics andmechanisms of mass-transfer kinetics in the stationary phasesused in chromatography and to promote the development ofnovel separation media.
Symbols
a slope of the linear correlation between a thermodynamicproperty andXm
A slope of LFER
b intercept of the linear correlation between a thermodynamicproperty andXm
B intercept of LFER
Cn number of methylene groups
De intraparticle diffusivity (m2/s)
Dm molecular diffusivity (m2/s)
Dp pore diffusivity (m2/s)
A )as
SMP(Tc)SMP - T)
asREF(Tc
)REF - T)(24)
B ) 1RT
[A(bhREF - Tbs
REF) - (bhSMP - Tbs
SMP)] +
(A - 1) ln( h
λ2kBT) (25)
Figure 11. Comparison ofDs values estimated with those measuredexperimentally.
Surface Diffusion in RPLC with Silica Gels J. Phys. Chem. B, Vol. 109, No. 24, 200512047
Ds surface diffusion coefficient (m2/s)
Ds0 frequency factor of surface diffusion (m2/s)
∆G free-energy change (J/mol)
Es activation energy of surface diffusion (J/mol)
h Planck’s constant (J s)
∆H enthalpy change (J/mol)
kB Boltzmann’s constant (J/K)
kf external mass-transfer coefficient (m/s)
kh hindrance parameter
kt tortuosity factor
K adsorption equilibrium constant (m3/g)
m number of (∆H and∆S) data pairs
MS mean sum of squares
Qst isosteric heat of adsorption (J/mol)
R gas constant (J mol-1 K-1)
∆S entropy change (J mol-1 K-1)
T absolute temperature (K)
Tc compensation temperature (K)
Thm harmonic mean of experimental temperatures (K)
Xm property of molecule
Greek Symbols
R proportional coefficient in eq 1
Rs statistical level of significance
δs Ds value normalized byσ (m2/s)
εe column void fraction (external porosity)
εp porosity of the stationary phase particle (internal porosity)
λ distance between two equilibrium positions (m)
µ1 first absolute moment (s)
µ2′ second central moment (s2)
Fp particle density (kg/m3)
σ alkyl ligand density (mol/m2)
Superscripts
cal calculated
exp experimental
REF reference
SMP sample
) thermodynamic parameters measured by analyzing tem-perature dependence ofδs
Subscripts
con concurrence
g free-energy change
h enthalpy change
noncon nonconcurrence
s entropy change
Tc compensation temperature
Thm harmonic mean of experimental temperatures
T1 temperature condition 1
T2 temperature condition 2
ε measurement errors
1 condition 1
2 condition 2
References and Notes(1) Guiochon, G.; Golshan-Shirazi, S.; Katti, A. M.Fundamentals of
PreparatiVe and Nonlinear Chromatography; Academic Press: Boston,1994.
(2) Sander, L. C.; Wise, S. A.Crit. ReV. Anal. Chem.1987, 18, 299-415.
(3) Lochmuller, C. H.; Wilder, D. R.J. Chromatogr. Sci. 1979, 17,574-579.
(4) Berendsen, G. E.; de Galan, L.J. Chromatogr. 1980, 196, 21-37.(5) Tchapla, A.; Colin, H.; Guiochon, G.Anal. Chem.1984, 56, 621-
625.(6) Tchapla, A.; Heron, S.; Colin, H.; Guiochon, G.Anal. Chem.1988,
60, 1443-1448.(7) Tchapla, A.; Heron, S.; Lesellier, E.; Colin, H.J. Chromatogr. A
1993, 656, 81-112.(8) Lork, K. D.; Unger, K. K.Chromatographia1988, 26, 115-119.(9) Karch, K.; Sebastian, I.; Halasz, I.J. Chromatogr. 1976, 122, 3-16.
(10) Knox, J. H.; Pryde, A.J. Chromatogr. 1975, 112, 171-188.(11) Miyabe, K.; Guiochon, G.AdV. Chromatogr.2000, 40, 1-113.(12) Miyabe, K.; Guiochon, G.J. Sep. Sci.2003, 26, 155-173.(13) Ruthven, D. M.Principles of Adsorption & Adsorption Processes;
Wiley: New York, 1984.(14) Suzuki, M.Adsorption Engineering; Kodansha/Elsevier: Tokyo,
1990.(15) Miyabe, K.; Guiochon, G.J. Phys. Chem. B1999, 103, 11086-
11097.(16) Miyabe, K.; Guiochon, G.Anal. Chem.2000, 72, 1475-1489.(17) Miyabe, K.; Guiochon, G.Anal. Chem.2001, 73, 3096-3106.(18) Miyabe, K.; Sotoura, S.; Guiochon, G.J. Chromatogr. A2001,
919, 231-244.(19) Miyabe, K.; Guiochon, G.Anal. Chem.2002, 74, 5754-5765.(20) Leffler, J. E.; Grunwald, E.Rates and Equilibria of Organic
Reactions; Wiley: New York, 1963.(21) Hammett, L. P.Physical Organic Chemistry; McGraw-Hill: New
York, 1970.(22) Exner, O.Nature1964, 201, 488-490.(23) Exner, O.Prog. Phys. Org. Chem.1973, 10, 411-482.(24) Exner, O.Prog. Phys. Org. Chem.1990, 18, 129-161.(25) Krug, R. R.; Hunter, W. G.; Grieger, R. A.J. Phys. Chem. 1976,
80, 2335-2341.(26) Krug, R. R.; Hunter, W. G.; Grieger, R. A.J. Phys. Chem. 1976,
80, 2341-2351.(27) Krug, R. R.Ind. Eng. Chem. Fundam.1980, 19, 50-59.(28) Boots, H. M. J.; de Bokx, P. K.J. Phys. Chem. 1989, 93, 8240-
8243.(29) Vailaya, A.; Horva´th, C. J. Phys. Chem. 1996, 100, 2447-2455.(30) Colin, H.; Diez-Masa, J. C.; Guiochon, G.; Czajkowska, T.;
Miedziak, I. J. Chromatogr.1978, 167, 41-65.(31) Melander, W. R.; Campbell, D. E.; Horva´th, C. J. Chromatogr.
1978, 158, 215-225.(32) Melander, W. R.; Chen, B. K.; Horva´th, C. J. Chromatogr.1979,
185, 99-109.(33) Miyabe, K.; Guiochon, G.Anal. Chem.2002, 74, 5982-5992.(34) Melander, W. R.; Campbell, D. E.; Horva´th, C. J. Chromatogr.
1978, 158, 215-225.(35) Riley, C. M.; Tomlinson, E.; Jefferies, T. M.J. Chromatogr. 1979,
185, 197-224.(36) Riley, C. M.; Tomlinson, E.; Hafkenscheid, T. L.J. Chromatogr.
1981, 218, 427-442.(37) de Bokx, P. K.; Boots, H. M. J.J. Phys. Chem. 1989, 93, 8243-
8248.(38) Miyabe, K.; Guiochon, G.J. Chromatogr. A2000, 903, 1-12.(39) Miyabe, K.; Guiochon, G.Anal. Sci.2001, 17 (Supplement), i209-
i212.(40) Karger, B. L.; Gant, J. R.; Hartkopf, A.; Weiner, P. H. J.
Chromatogr.1976, 128, 65-78.(41) Wells, M. J. M.; Clark, C. R.Anal. Chem.1981, 53, 1341-1345.(42) Wilson, E. J.; Geankoplis, C. J.Ind. Eng. Chem. Fundam. 1966, 5,
9-14.(43) Reid, R. C.; Prausnitz, J. M.; Sherwood, T. K.The Properties of
Gases and Liquids; McGraw-Hill: New York, 1977.(44) Bird, R. B.; Stewart, W. E.; Lightfoot, E. N.Transport Phenomena;
Wiley: New York, 2002.(45) Satterfield, C. N.; Colton, C. K.; Pitcher, Jr., W. H.AIChE J.1973,
19, 628-635.(46) Miyabe, K.; Guiochon, G.Anal. Chem.2000, 72, 5162-5171.(47) Miyabe, K.; Guiochon, G.J. Chromatogr. A1999, 830, 263-274.(48) Miyabe, K.; Guiochon, G.J. Chromatogr. A1999, 830, 29-39.(49) Miyabe, K.; Guiochon, G.J. Chromatogr. A1999, 857, 69-87.(50) Miyabe, K.; Guiochon, G.J. Chromatogr. A2000, 890, 211-223.(51) Kataoka, T.; Yoshida, H.; Ueyama, K.J. Chem. Eng. Jpn.1972,
5, 132-136.(52) Miyabe, K.; Guiochon, G.Anal. Chem.1999, 71, 889-896.(53) Miyabe, K.; Guiochon, G.J. Phys. Chem. B2001, 105, 9202-
9209.(54) Miyabe, K.; Guiochon, G.J. Chromatogr. A2002, 961, 23-33.(55) Glasstone, S.; Laidler, K. J.; Eyring, H.The Theory of Rate
Processes; McGraw-Hill: New York, 1964.(56) Lee, B.Proc. Natl. Acad. Sci. U.S.A.1991, 88, 5154-5158.(57) Giddings, J. C.Dynamics of Chromatography, Part I, Principles
and Theory; Marcel Dekker: New York, 1965.
12048 J. Phys. Chem. B, Vol. 109, No. 24, 2005 Miyabe and Guiochon