extreme events prediction from seasonal climate
TRANSCRIPT
Annual Journal of Hydraulic Engineering, JSCE, Vol.58, 2014, February
EXTREME EVENTS PREDICTION FROM SEASONAL CLIMATE FORECASTING AND CROP PRODUCTION
SIMULATIONS IN PAMPANGA RIVER BASIN, PHILIPPINES
Patricia Ann JARANILLA-SANCHEZ1, Toshio KOIKE2, Lei WANG3, Tetsu OHTA4, Yukiko IMADA5 and Masahide KIMOTO6
1Member of JSCE, Ph D., Project Research Associate, Earth Observation Data Integration & Fusion Research
(Editoria), The University of Tokyo (Tokyo, Japan) 2Fellow of JSCE, Ph.D., Professor, Department of Civil Engineering, The University of Tokyo, (Tokyo, Japan)
3 Member of JSCE, Ph.D. Professor, Chinese Academy of Science, (Beijing, China) 4 Researcher, M.Sc., Project Researcher, Earth Observation Data Integration & Fusion Research (Editoria), The
University of Tokyo (Tokyo, Japan) 5 Associate Professor, PhD, Department of Civil Engineering, Tokyo Institute of Technology (Tokyo, Japan)
6 Atmospheric and Ocean Research Institute, The University of Tokyo (Tokyo, Japan)
Seasonal climate forecasting information can be utilized by water resource managers for planning activities to reduce uncertainty with the additional predictive information. The aim of this study was to determine the predictability of extremely dry and wet conditions by looking into past extreme events and simulating at the basin-scale how well these events can be reconstructed in the Pampanga river basin, Philippines. Three-month seasonal climate forecast (SCF) model ensembles derived from the MIROC-5 Atmosphere Ocean Global Circulation Models (MIROC 5.0 AOGCM) were used to drive the Water and Energy Budget-based Distributed Hydrological Model (WEB-DHM). Extremely dry and wet years in 1982-2000 were integrated into WEB-DHM. Some outputs were incorporated into the crop model ORYZA2000 to quantify crop production on selected ENSO years 1983, 1987, 1991 and 1999-2000 (coinciding with SPAM forecasts). Crop production, drying and flooding trends were well simulated.
Keywords: WEB-DHM, Seasonal Climate Forecast, Rice Model, Pampanga River Basin
1. INTRODUCTION In the Philippines, the major contributing factor affecting drought is the El Niño Southern Oscillation (ENSO). This is evidenced by studies of decadal trends of sea surface temperature anomalies (SSTAs) in the north Pacific and the tropical Pacific influencing droughts1). The Pampanga River Basin (inclusive of Angat River Basin) supports around 97% (from Angat alone) of the domestic water requirements in Metro Manila. It is also one of the main rice producing area of the country. This basin is quite sensitive to extreme events such as floods and droughts so forecasting of these events is very important. Quantification of crop production during the drought years will allow more effective planning and adaptation by both the government and the local farmers on whether or not rice production will be sufficient for the country. The main objective of this study is to verify the
predictability of extremely dry and wet conditions by looking into past extreme events and simulating at the basin-scale how well these extreme events can be constructed in the Pampanga River Basin. The second objective of this study is to determine if simulation using a crop model can be used to quantify rice production during the dry years for the main cropping season (first cropping season: June 16 to November 16; usually begins with the rainy season). To accomplish this, the following steps were followed: 1) A 3-month seasonal climate forecast (SCF) from SPAM datasets derived from MIROC-5i Ocean Atmosphere Global Circulation Models were used to drive the Water and Energy Budget Based Distributed Hydrological model (WEB-DHM); 2) A monthly drought index was used to identify the drying trends during the 3 month forecasted; 3). A point-scale crop model was used to identify the
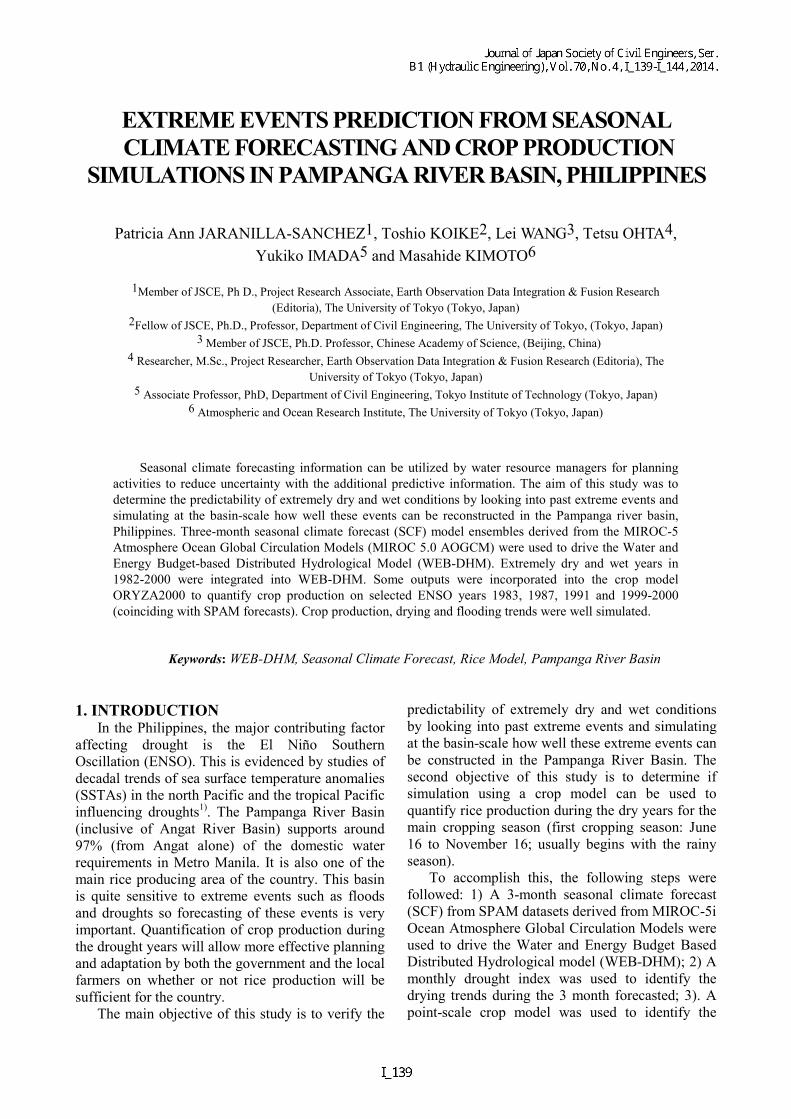
yield/ha during the cropping season for selected years by incorporating the inputs and outputs of WEB-DHM into ORYZA2000. 2. METHODS There are several methods employed in this study: (a) Hydrological model development (WEB-DHM) for the basin, calibration and validation of discharge (Q), (b) Incorporation of SPAM ensemble datasets (seasonal climate forecasts--SCFs) as input into (a); the model, (c) Drought Quantification using Monthly drought index fitting and trend Analysis and (d) incorporating the outputs (soil moisture, basin scale hydro-meteorological parameters) of part (a) in rice production simulations (drought stress and crop yield). Figure 1 shows (a), (b) and (c) while Figure 2 shows (d).
Figure 1. Study Framework for Hydrological Simulation and Seasonal Climate Forecasting.
Figure 2. Framework of combining crop model and hydrological model simulation.
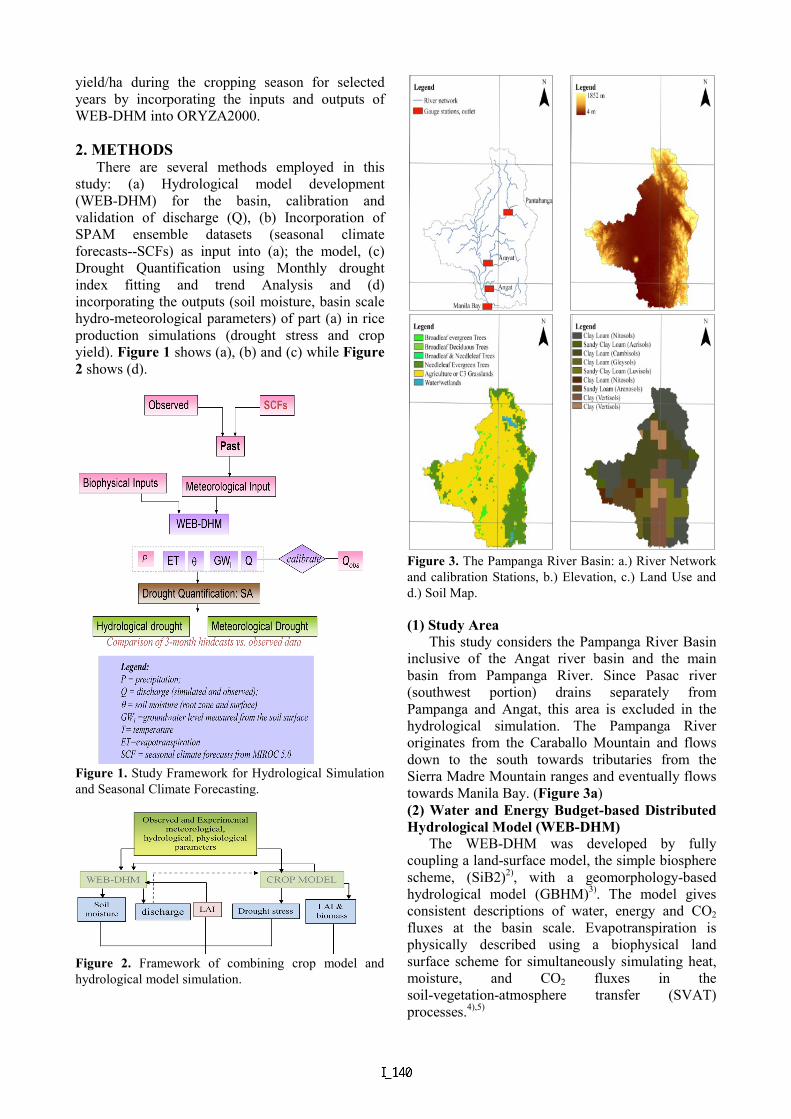
Figure 3. The Pampanga River Basin: a.) River Network and calibration Stations, b.) Elevation, c.) Land Use and d.) Soil Map. (1) Study Area This study considers the Pampanga River Basin inclusive of the Angat river basin and the main basin from Pampanga River. Since Pasac river (southwest portion) drains separately from Pampanga and Angat, this area is excluded in the hydrological simulation. The Pampanga River originates from the Caraballo Mountain and flows down to the south towards tributaries from the Sierra Madre Mountain ranges and eventually flows towards Manila Bay. (Figure 3a) (2) Water and Energy Budget-based Distributed Hydrological Model (WEB-DHM) The WEB-DHM was developed by fully coupling a land-surface model, the simple biosphere scheme, (SiB2)2), with a geomorphology-based hydrological model (GBHM)3). The model gives consistent descriptions of water, energy and CO2 fluxes at the basin scale. Evapotranspiration is physically described using a biophysical land surface scheme for simultaneously simulating heat, moisture, and CO2 fluxes in the soil-vegetation-atmosphere transfer (SVAT) processes.4),5)
Annual Journal of Hydraulic Engineering, JSCE, VOL.58, 2013, February
Table 1. WEBDHM Inputs and output details Static Inputs (biophysical) Dynamic Inputs (type and data sources) Analysis Outputs
DEM: Aster Global DEM (GDEM) 50m regridded to 1km x 1km
Meteorological (surface air temperature (K), relative humidity (%), total cloud cover (%), downward long wave and short wave radiation flux at surface (W/m2)): Japan Reanalysis data (JRA-25)7)
Land use: USGS landuse map
Rainfall: Asian precipitation-highly resolved observational data integration towards the evaluation of water resources management (APHRODITE)8) -gridded rainfall dataset (MA)
Discharge: Hydrological drought
Soil: FAO Soil map6) Leaf Area Index (LAI) and Fraction of Photosynthetically Active Radiation (FPAR) : Advance Very High Resolution Radiometer (AVHRR)., 16km x 16 km
Inputs into the model consist of static (constant) and dynamic (changing temporally) parameters (listed in Table 1). Figure 3a, 3b, 3c and 3d are the river network (and calibration stations: Pantabangan dam, San Agustin Arayat gauge and Angat dam) and static parameters (elevation, land use and soil) considered in the hydrological simulation. Note that the central plains of the basin are mostly agricultural and has a clay loam soil type ideal for rice production. (3) 2-Step Forecast Method for Developing SPAM Datasets There are 2 main parts in the development of the SPAM datasets. Firstly, atmosphere [horizontal 40 T42 (300 km lattice) and perpendicular layers] and ocean models [1.4 degrees and perpendicular 1.4 degree in longitude direction 0.5 degrees (low lattitudes) with 44 layers in lattitude direction] were coupled in AOGCM MIROC 5i using the three dimension variation method by medium resolution (T42). Secondly, the high resolution version of MIROC3 AGCM [horizontal 56 T106 (110km lattice) perpendicular layers] whose SST boundary condition is the predicted SST from the first step and initialized with JRA-25 (long-term average for temperature, zonal wind velocity and relative humidity). High-resolution MIROC3 is an official version of CMIP3, while MIROC5i is an intermediate version of MIROC5 (official version of CMIP5) One of the main benefit of the SPAM dataset is its improvements in typhoon prediction. The El Niño-Southern Oscillation (ENSO) is one of the main causes of abnormal weather generation in the world. In MIROC 3.2, the amplitude of ENSO was weak so in MIROC 4.2 and 5.09), the physical processes were improved10) and it was able to reproduce the same amplitude as that in observation
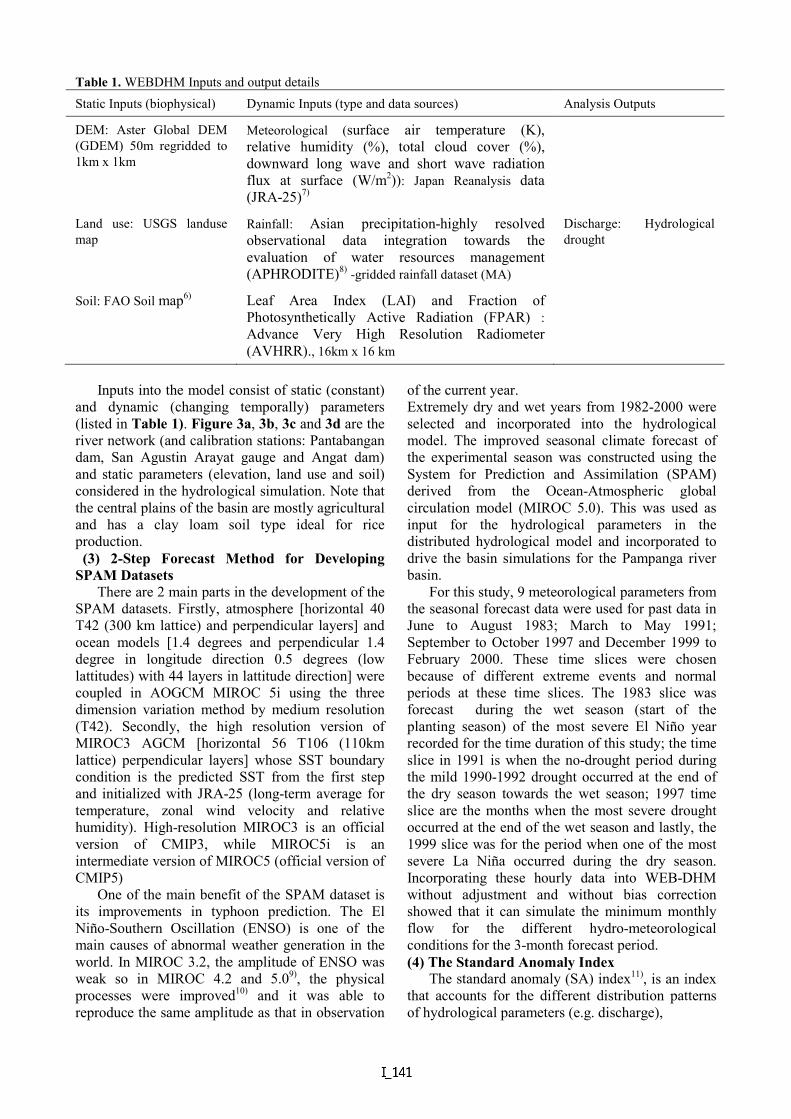
of the current year. Extremely dry and wet years from 1982-2000 were selected and incorporated into the hydrological model. The improved seasonal climate forecast of the experimental season was constructed using the System for Prediction and Assimilation (SPAM) derived from the Ocean-Atmospheric global circulation model (MIROC 5.0). This was used as input for the hydrological parameters in the distributed hydrological model and incorporated to drive the basin simulations for the Pampanga river basin. For this study, 9 meteorological parameters from the seasonal forecast data were used for past data in June to August 1983; March to May 1991; September to October 1997 and December 1999 to February 2000. These time slices were chosen because of different extreme events and normal periods at these time slices. The 1983 slice was forecast during the wet season (start of the planting season) of the most severe El Niño year recorded for the time duration of this study; the time slice in 1991 is when the no-drought period during the mild 1990-1992 drought occurred at the end of the dry season towards the wet season; 1997 time slice are the months when the most severe drought occurred at the end of the wet season and lastly, the 1999 slice was for the period when one of the most severe La Niña occurred during the dry season. Incorporating these hourly data into WEB-DHM without adjustment and without bias correction showed that it can simulate the minimum monthly flow for the different hydro-meteorological conditions for the 3-month forecast period. (4) The Standard Anomaly Index The standard anomaly (SA) index11), is an index that accounts for the different distribution patterns of hydrological parameters (e.g. discharge),
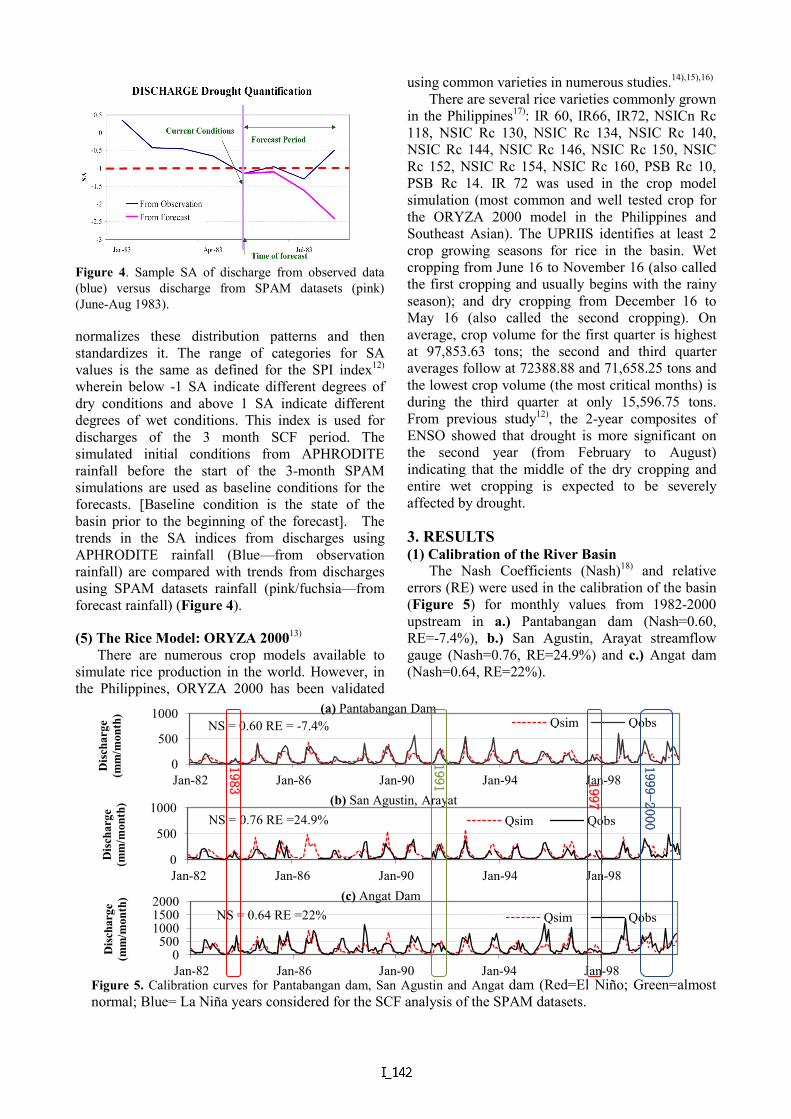
Figure 4. Sample SA of discharge from observed data (blue) versus discharge from SPAM datasets (pink) (June-Aug 1983). normalizes these distribution patterns and then standardizes it. The range of categories for SA values is the same as defined for the SPI index12) wherein below -1 SA indicate different degrees of dry conditions and above 1 SA indicate different degrees of wet conditions. This index is used for discharges of the 3 month SCF period. The simulated initial conditions from APHRODITE rainfall before the start of the 3-month SPAM simulations are used as baseline conditions for the forecasts. [Baseline condition is the state of the basin prior to the beginning of the forecast]. The trends in the SA indices from discharges using APHRODITE rainfall (Blue—from observation rainfall) are compared with trends from discharges using SPAM datasets rainfall (pink/fuchsia—from forecast rainfall) (Figure 4). (5) The Rice Model: ORYZA 200013) There are numerous crop models available to simulate rice production in the world. However, in the Philippines, ORYZA 2000 has been validated
using common varieties in numerous studies.14),15),16) There are several rice varieties commonly grown in the Philippines17): IR 60, IR66, IR72, NSICn Rc 118, NSIC Rc 130, NSIC Rc 134, NSIC Rc 140, NSIC Rc 144, NSIC Rc 146, NSIC Rc 150, NSIC Rc 152, NSIC Rc 154, NSIC Rc 160, PSB Rc 10, PSB Rc 14. IR 72 was used in the crop model simulation (most common and well tested crop for the ORYZA 2000 model in the Philippines and Southeast Asian). The UPRIIS identifies at least 2 crop growing seasons for rice in the basin. Wet cropping from June 16 to November 16 (also called the first cropping and usually begins with the rainy season); and dry cropping from December 16 to May 16 (also called the second cropping). On average, crop volume for the first quarter is highest at 97,853.63 tons; the second and third quarter averages follow at 72388.88 and 71,658.25 tons and the lowest crop volume (the most critical months) is during the third quarter at only 15,596.75 tons. From previous study12), the 2-year composites of ENSO showed that drought is more significant on the second year (from February to August) indicating that the middle of the dry cropping and entire wet cropping is expected to be severely affected by drought. 3. RESULTS (1) Calibration of the River Basin The Nash Coefficients (Nash)18) and relative errors (RE) were used in the calibration of the basin (Figure 5) for monthly values from 1982-2000 upstream in a.) Pantabangan dam (Nash=0.60, RE=-7.4%), b.) San Agustin, Arayat streamflow gauge (Nash=0.76, RE=24.9%) and c.) Angat dam (Nash=0.64, RE=22%).
Figure 5. Calibration curves for Pantabangan dam, San Agustin and Angat dam (Red=El Niño; Green=almost normal; Blue= La Niña years considered for the SCF analysis of the SPAM datasets.
0
500
1000
Jan-82 Jan-86 Jan-90 Jan-94 Jan-98
Dis
char
ge
(mm
/mon
th)
Qsim Qobs NS = 0.60 RE = -7.4% (a) Pantabangan Dam
0
500
1000
Jan-82 Jan-86 Jan-90 Jan-94 Jan-98
Dis
char
ge
(mm
/mon
th)
Qsim Qobs NS = 0.76 RE =24.9% (b) San Agustin, Arayat
0 500
1000 1500 2000
Jan-82 Jan-86 Jan-90 Jan-94 Jan-98
Dis
char
ge
(mm
/mon
th)
Qsim Qobs NS = 0.64 RE =22% (c) Angat Dam
1983
1991
1997
1999-2000
Annual Journal of Hydraulic Engineering, JSCE, VOL.58, 2013, February
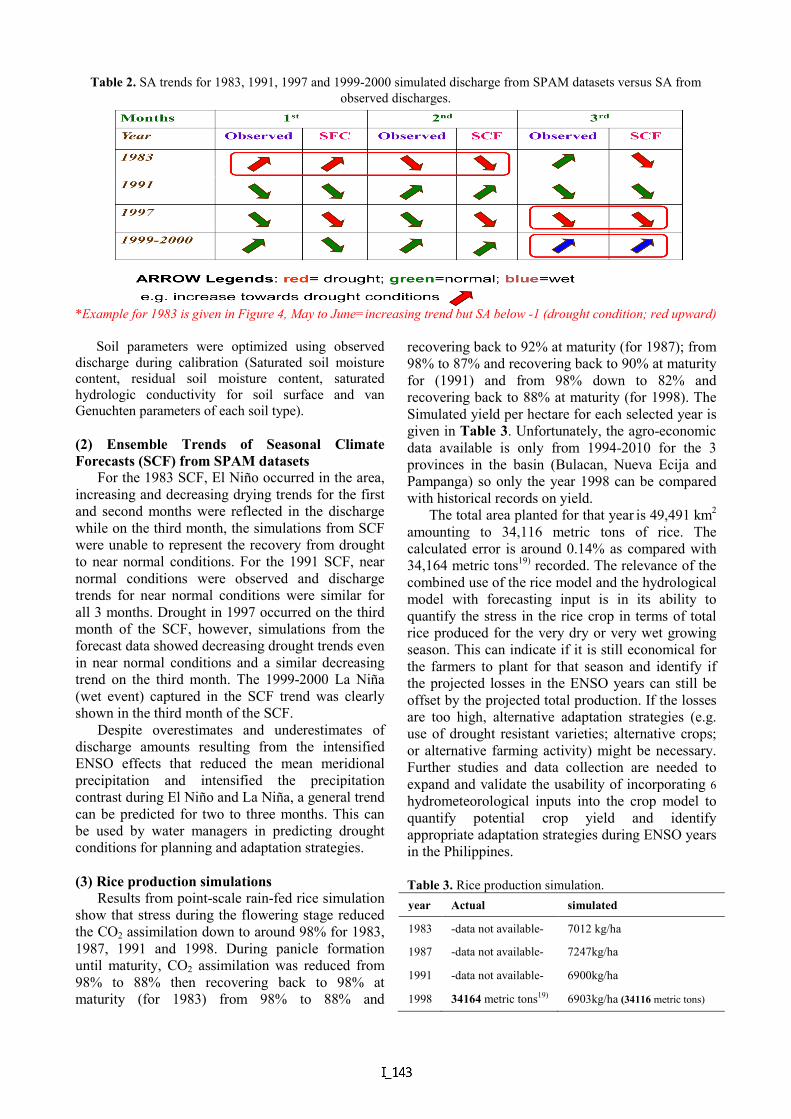
Table 2. SA trends for 1983, 1991, 1997 and 1999-2000 simulated discharge from SPAM datasets versus SA from observed discharges.
*Example for 1983 is given in Figure 4, May to June=increasing trend but SA below -1 (drought condition; red upward) Soil parameters were optimized using observed discharge during calibration (Saturated soil moisture content, residual soil moisture content, saturated hydrologic conductivity for soil surface and van Genuchten parameters of each soil type). (2) Ensemble Trends of Seasonal Climate Forecasts (SCF) from SPAM datasets For the 1983 SCF, El Niño occurred in the area, increasing and decreasing drying trends for the first and second months were reflected in the discharge while on the third month, the simulations from SCF were unable to represent the recovery from drought to near normal conditions. For the 1991 SCF, near normal conditions were observed and discharge trends for near normal conditions were similar for all 3 months. Drought in 1997 occurred on the third month of the SCF, however, simulations from the forecast data showed decreasing drought trends even in near normal conditions and a similar decreasing trend on the third month. The 1999-2000 La Niña (wet event) captured in the SCF trend was clearly shown in the third month of the SCF. Despite overestimates and underestimates of discharge amounts resulting from the intensified ENSO effects that reduced the mean meridional precipitation and intensified the precipitation contrast during El Niño and La Niña, a general trend can be predicted for two to three months. This can be used by water managers in predicting drought conditions for planning and adaptation strategies. (3) Rice production simulations Results from point-scale rain-fed rice simulation show that stress during the flowering stage reduced the CO2 assimilation down to around 98% for 1983, 1987, 1991 and 1998. During panicle formation until maturity, CO2 assimilation was reduced from 98% to 88% then recovering back to 98% at maturity (for 1983) from 98% to 88% and
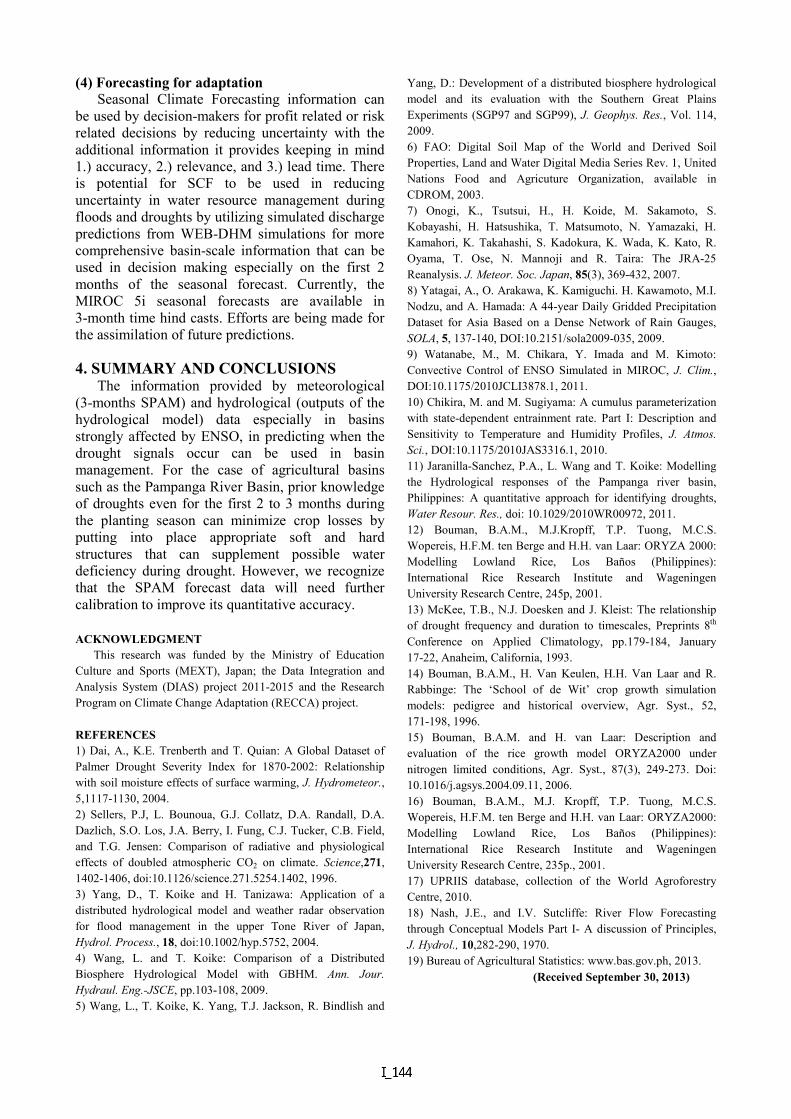
recovering back to 92% at maturity (for 1987); from 98% to 87% and recovering back to 90% at maturity for (1991) and from 98% down to 82% and recovering back to 88% at maturity (for 1998). The Simulated yield per hectare for each selected year is given in Table 3. Unfortunately, the agro-economic data available is only from 1994-2010 for the 3 provinces in the basin (Bulacan, Nueva Ecija and Pampanga) so only the year 1998 can be compared with historical records on yield. The total area planted for that year is 49,491 km2 amounting to 34,116 metric tons of rice. The calculated error is around 0.14% as compared with 34,164 metric tons19) recorded. The relevance of the combined use of the rice model and the hydrological model with forecasting input is in its ability to quantify the stress in the rice crop in terms of total rice produced for the very dry or very wet growing season. This can indicate if it is still economical for the farmers to plant for that season and identify if the projected losses in the ENSO years can still be offset by the projected total production. If the losses are too high, alternative adaptation strategies (e.g. use of drought resistant varieties; alternative crops; or alternative farming activity) might be necessary. Further studies and data collection are needed to expand and validate the usability of incorporating 6 hydrometeorological inputs into the crop model to quantify potential crop yield and identify appropriate adaptation strategies during ENSO years in the Philippines. Table 3. Rice production simulation. year Actual simulated
1983 -data not available- 7012 kg/ha
1987 -data not available- 7247kg/ha
1991 -data not available- 6900kg/ha
1998 34164 metric tons19) 6903kg/ha (34116 metric tons)
6
(4) Forecasting for adaptation Seasonal Climate Forecasting information can be used by decision-makers for profit related or risk related decisions by reducing uncertainty with the additional information it provides keeping in mind 1.) accuracy, 2.) relevance, and 3.) lead time. There is potential for SCF to be used in reducing uncertainty in water resource management during floods and droughts by utilizing simulated discharge predictions from WEB-DHM simulations for more comprehensive basin-scale information that can be used in decision making especially on the first 2 months of the seasonal forecast. Currently, the MIROC 5i seasonal forecasts are available in 3-month time hind casts. Efforts are being made for the assimilation of future predictions. 4. SUMMARY AND CONCLUSIONS The information provided by meteorological (3-months SPAM) and hydrological (outputs of the hydrological model) data especially in basins strongly affected by ENSO, in predicting when the drought signals occur can be used in basin management. For the case of agricultural basins such as the Pampanga River Basin, prior knowledge of droughts even for the first 2 to 3 months during the planting season can minimize crop losses by putting into place appropriate soft and hard structures that can supplement possible water deficiency during drought. However, we recognize that the SPAM forecast data will need further calibration to improve its quantitative accuracy. ACKNOWLEDGMENT This research was funded by the Ministry of Education Culture and Sports (MEXT), Japan; the Data Integration and Analysis System (DIAS) project 2011-2015 and the Research Program on Climate Change Adaptation (RECCA) project. REFERENCES 1) Dai, A., K.E. Trenberth and T. Quian: A Global Dataset of Palmer Drought Severity Index for 1870-2002: Relationship with soil moisture effects of surface warming, J. Hydrometeor., 5,1117-1130, 2004. 2) Sellers, P.J, L. Bounoua, G.J. Collatz, D.A. Randall, D.A. Dazlich, S.O. Los, J.A. Berry, I. Fung, C.J. Tucker, C.B. Field, and T.G. Jensen: Comparison of radiative and physiological effects of doubled atmospheric CO2 on climate. Science,271, 1402-1406, doi:10.1126/science.271.5254.1402, 1996. 3) Yang, D., T. Koike and H. Tanizawa: Application of a distributed hydrological model and weather radar observation for flood management in the upper Tone River of Japan, Hydrol. Process., 18, doi:10.1002/hyp.5752, 2004. 4) Wang, L. and T. Koike: Comparison of a Distributed Biosphere Hydrological Model with GBHM. Ann. Jour. Hydraul. Eng.-JSCE, pp.103-108, 2009. 5) Wang, L., T. Koike, K. Yang, T.J. Jackson, R. Bindlish and
Yang, D.: Development of a distributed biosphere hydrological model and its evaluation with the Southern Great Plains Experiments (SGP97 and SGP99), J. Geophys. Res., Vol. 114, 2009. 6) FAO: Digital Soil Map of the World and Derived Soil Properties, Land and Water Digital Media Series Rev. 1, United Nations Food and Agricuture Organization, available in CDROM, 2003. 7) Onogi, K., Tsutsui, H., H. Koide, M. Sakamoto, S. Kobayashi, H. Hatsushika, T. Matsumoto, N. Yamazaki, H. Kamahori, K. Takahashi, S. Kadokura, K. Wada, K. Kato, R. Oyama, T. Ose, N. Mannoji and R. Taira: The JRA-25 Reanalysis. J. Meteor. Soc. Japan, 85(3), 369-432, 2007. 8) Yatagai, A., O. Arakawa, K. Kamiguchi. H. Kawamoto, M.I. Nodzu, and A. Hamada: A 44-year Daily Gridded Precipitation Dataset for Asia Based on a Dense Network of Rain Gauges, SOLA, 5, 137-140, DOI:10.2151/sola2009-035, 2009. 9) Watanabe, M., M. Chikara, Y. Imada and M. Kimoto: Convective Control of ENSO Simulated in MIROC, J. Clim., DOI:10.1175/2010JCLI3878.1, 2011. 10) Chikira, M. and M. Sugiyama: A cumulus parameterization with state-dependent entrainment rate. Part I: Description and Sensitivity to Temperature and Humidity Profiles, J. Atmos. Sci., DOI:10.1175/2010JAS3316.1, 2010. 11) Jaranilla-Sanchez, P.A., L. Wang and T. Koike: Modelling the Hydrological responses of the Pampanga river basin, Philippines: A quantitative approach for identifying droughts, Water Resour. Res., doi: 10.1029/2010WR00972, 2011. 12) Bouman, B.A.M., M.J.Kropff, T.P. Tuong, M.C.S. Wopereis, H.F.M. ten Berge and H.H. van Laar: ORYZA 2000: Modelling Lowland Rice, Los Baños (Philippines): International Rice Research Institute and Wageningen University Research Centre, 245p, 2001. 13) McKee, T.B., N.J. Doesken and J. Kleist: The relationship of drought frequency and duration to timescales, Preprints 8th Conference on Applied Climatology, pp.179-184, January 17-22, Anaheim, California, 1993. 14) Bouman, B.A.M., H. Van Keulen, H.H. Van Laar and R. Rabbinge: The ‘School of de Wit’ crop growth simulation models: pedigree and historical overview, Agr. Syst., 52, 171-198, 1996. 15) Bouman, B.A.M. and H. van Laar: Description and evaluation of the rice growth model ORYZA2000 under nitrogen limited conditions, Agr. Syst., 87(3), 249-273. Doi: 10.1016/j.agsys.2004.09.11, 2006. 16) Bouman, B.A.M., M.J. Kropff, T.P. Tuong, M.C.S. Wopereis, H.F.M. ten Berge and H.H. van Laar: ORYZA2000: Modelling Lowland Rice, Los Baños (Philippines): International Rice Research Institute and Wageningen University Research Centre, 235p., 2001. 17) UPRIIS database, collection of the World Agroforestry Centre, 2010. 18) Nash, J.E., and I.V. Sutcliffe: River Flow Forecasting through Conceptual Models Part I- A discussion of Principles, J. Hydrol., 10,282-290, 1970. 19) Bureau of Agricultural Statistics: www.bas.gov.ph, 2013. (Received September 30, 2013)