extremely low cycle fatigue assessment of corner crack in
TRANSCRIPT

Journal of Structural Engineering Vol.61A (March 2015) JSCE
Extremely low cycle fatigue assessment of corner crack in concrete-filled steel piers
based on effective notch strain approach
Jin-Eun Park*, Takeshi Hanji** and Kazuo Tateishi***
* Dr. of Eng., Researcher, Dept. of Civil Eng., Nagoya University, Furo-cho, Chikusa-ku, Nagoya 464-8603 [email protected]
** Dr. of Eng., Associate Professor, Dept. of Civil Eng., Nagoya University, Furo-cho, Chikusa-ku, Nagoya 464-8603 *** Dr. of Eng., Professor, Dept. of Civil Eng., Nagoya University, Furo-cho, Chikusa-ku, Nagoya 464-8603
This paper presents an assessment method for extremely low cycle fatigue cracks from corner joints in concrete-filled steel piers. Low cycle fatigue tests indicated that one of the main failure modes of concrete-filled steel piers are a fatigue crack from corner joints, which is caused by out-of-plane bending deformation of flange and web plates. In the previous study, authors had proposed extremely low cycle fatigue strength curves for the corner joints based on the effective notch strain approach. In this study, the proposed method was applied to the experiment of the concrete-filled piers and it is demonstrated that extremely low cycle fatigue life of the pier can be predicted by using the method. Keywords: extremely low cycle fatigue assessment, concrete-filled steel piers, effective notch strain approach
1. INTRODUTION
During the Hyogo-ken Nanbu earthquake in 1995, two types of failure modes were observed in steel bridge piers; one is local buckling and the other is brittle fracture triggered by extremely low cycle fatigue1). Therefore, it is important to investigate seismic performance of steel bridge piers from a viewpoint of the extremely low cycle fatigue.
In order to prevent local buckling and improve seismic performance of steel piers, it has been proposed to fill the pier with concrete. Concrete-filled steel piers have high deformation capacity because in-filled concrete can constrain local deformation of flange and web plates. Therefore, the concrete-filled steel piers can resist large cyclic plastic deformation. On the other hand, when the piers endure large cyclic deformation, extremely low cycle fatigue will become a key issue. In the previous studies2), 3), low cycle fatigue cracks were actually observed at corner welds in the concrete-filled steel piers. Here, longitudinal welds between flange and web plates is called “corner weld”.
Fatigue cracks from corner welds (called “corner crack”) in steel piers are serious problem because it can cause collapse of bridges. For preventing failures of the corner welds, the current
design code4) has recommended a welding method with enough penetration in corner joints. However, assessment methods for the corner cracks in the concrete-filled piers have not been clearly indicated yet.
In this study, extremely low cycle fatigue tests with concrete-filled steel piers were performed and applicability of the proposed assessment method for corner cracks was investigated.
2. EXTREMELY LOW CYCLE FATIGUE BEHAVIOR OF CONCRETE-FILLED STEEL PIERS
This chapter indicates the low cycle fatigue behavior of
concrete filled steel piers obtained by previous study3).
2.1 Test procedures (1) Specimen configuration
Fig.1 shows the configuration and dimension of the specimens. Steel pier specimens with a box section were fabricated by welding. The corner welds were connected with partial joint penetration groove welds, as shown in the figure.
The plate thickness was 4.5mm, and flange and webs were 200mm in width. Triangular ribs were attached outside of the pier base, because the ribs were often used in some of existing steel

piers and low cycle fatigue failure actually occurred from the rib ends in the Hyogo-ken Nanbu Earthquake5). The height of the filling concrete and the stiffener configuration were determined according to the previous study2).
The geometrical parameters were represented by the width-thickness ratio parameter (Rf) of a flange plate and the slenderness ratio parameter ( ) given as follows,
EtbR y
f
2
2 )1(12 (1)
ERKh y
1 (2)
where b : flange width, t : plate thickness, σy : yield strength, E : Young’s modulus, ν : Poisson’s ratio, κ : buckling coefficient of a plate, h : column height, K : effective length factor (K=2.0 for a fixed-free pier), R : radius of gyration of steel section. In the specimen, the width-thickness ratio parameter was 0.452 and the slenderness ratio parameter was 0.241.
The mechanical properties of the steel and concrete used in this study are shown in Table 1 and Table 2, respectively, which were obtained by tensile tests of steel and compression tests of concrete. (2) Test setup and loading method
Test setup is shown in Fig. 2. The specimen was bolted at the
base and loaded at the top. Lateral quasi-static cyclic loads and a constant axial load were applied to the top of the specimen. Six displacement transducers (DH1~DH4, DV1~DV2) were installed to the specimen in order to calculate the top lateral displacement of the specimen as shown in Fig. 1.
Incremental cyclic loading shown in Fig. 3 was applied to the specimen under displacement control. The horizontal yield load (Hy) and yield displacement (δy) were calculated based on Standard beam theory considering a cross section of steel parts.
EIhH y
y 3
3
(3)
hZ
ANH yy )( (4)
where h : height of specimen, I : moment of inertia of steel, N : applied axial force, A : section area of steel and Z : section modulus of steel.
The horizontal yield load was 93.7kN and yield displacement was 3.77mm. In this study, the same displacement amplitudes were applied to all specimens to investigate the effect of the axial load on low cycle fatigue behavior under the same load conditions. (3) Test matrix
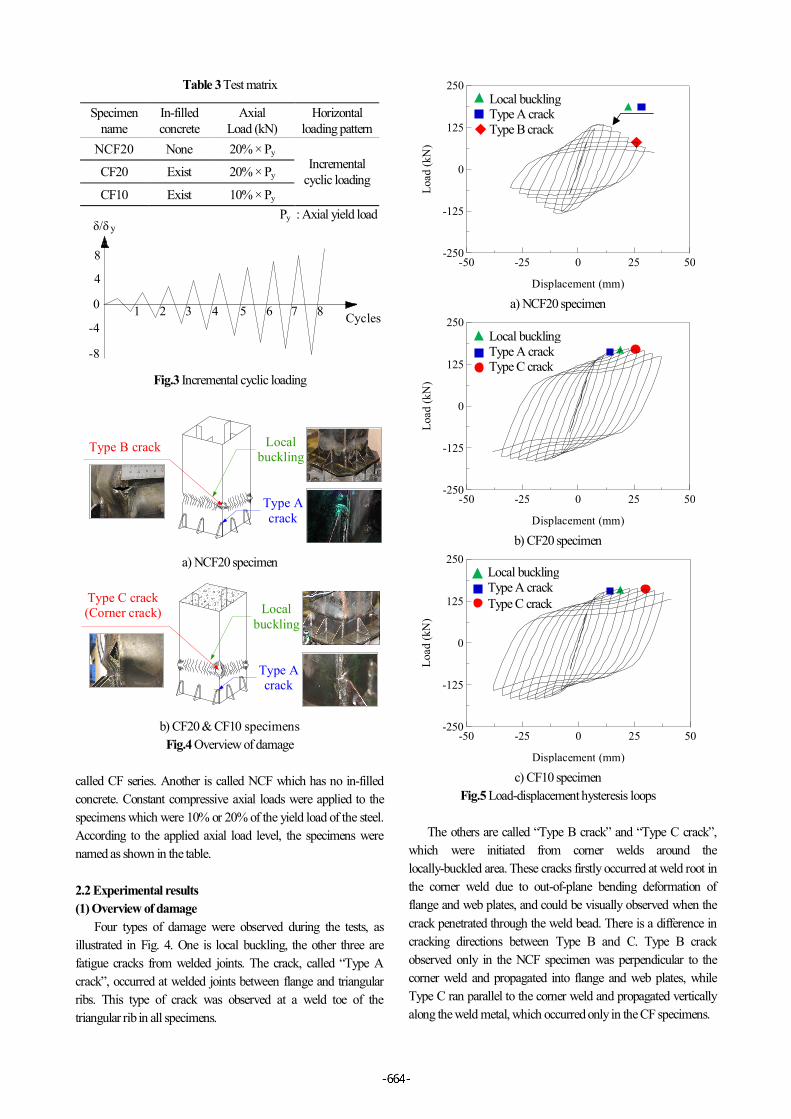
Test matrix is given in Table 3. Three specimens were used for the tests. Two of them were filled with concrete which are
3@20
095
420
914
5
560
109
60Filli
ng C
oncr
ete
460
A A
BB
B - BFlange
200
Units : mm A - A
200
Corner weld
Partial joint penetration
22
4.5
Longitudinalstiffener Displacement transducer
DH1, DH2
DH3 DH4
DV2DV1
45°
4
Fig.1 Configuration and dimension of concrete-filled steel pier specimen
Fig.2 Test setup
Table 1 Mechanical properties of steel
SM400A
Yield Strength (N/mm2)
Tensile Strength (N/mm2)
Elongation (%)
338 417 27
Table 2 Mechanical properties of filling concrete
Compressive Strength (N/mm2)
Modulus of Elasticity (N/mm2)
Remarks
27.7 2.24×10⁴ 28-days strength
Local buckling Type A crack Type C crack
Local buckling Type A crack Type C crack
Local buckling Type A crack Type B crack
called CF series. Another is called NCF which has no in-filled concrete. Constant compressive axial loads were applied to the specimens which were 10% or 20% of the yield load of the steel. According to the applied axial load level, the specimens were named as shown in the table.
2.2 Experimental results (1) Overview of damage
Four types of damage were observed during the tests, as illustrated in Fig. 4. One is local buckling, the other three are fatigue cracks from welded joints. The crack, called “Type A crack”, occurred at welded joints between flange and triangular ribs. This type of crack was observed at a weld toe of the triangular rib in all specimens.
The others are called “Type B crack” and “Type C crack”, which were initiated from corner welds around the locally-buckled area. These cracks firstly occurred at weld root in the corner weld due to out-of-plane bending deformation of flange and web plates, and could be visually observed when the crack penetrated through the weld bead. There is a difference in cracking directions between Type B and C. Type B crack observed only in the NCF specimen was perpendicular to the corner weld and propagated into flange and web plates, while Type C ran parallel to the corner weld and propagated vertically along the weld metal, which occurred only in the CF specimens.
Table 3 Test matrix
Specimen name
In-filled concrete
Axial Load (kN)
Horizontal loading pattern
NCF20 None 20% × Py Incremental
cyclic loading CF20 Exist 20% × Py
CF10 Exist 10% × Py
δ/δ
0
-8
-4
y
4
8
1 2 3 4 5 6 7 8 Cycles
Fig.3 Incremental cyclic loading
Type Acrack
Type B crack Localbuckling
a) NCF20 specimen
Type C crack(Corner crack) Local
buckling
Type Acrack
b) CF20 & CF10 specimens Fig.4 Overview of damage
-50 -25 0 25 50
Displacement (mm)
-250
-125
0
125
250
Load
(kN
)
a) NCF20 specimen
-50 -25 0 25 50
Displacement (mm)
-250
-125
0
125
250
Load
(kN
)
b) CF20 specimen
-50 -25 0 25 50
Displacement (mm)
-250
-125
0
125
250
Load
(kN
)
c) CF10 specimen
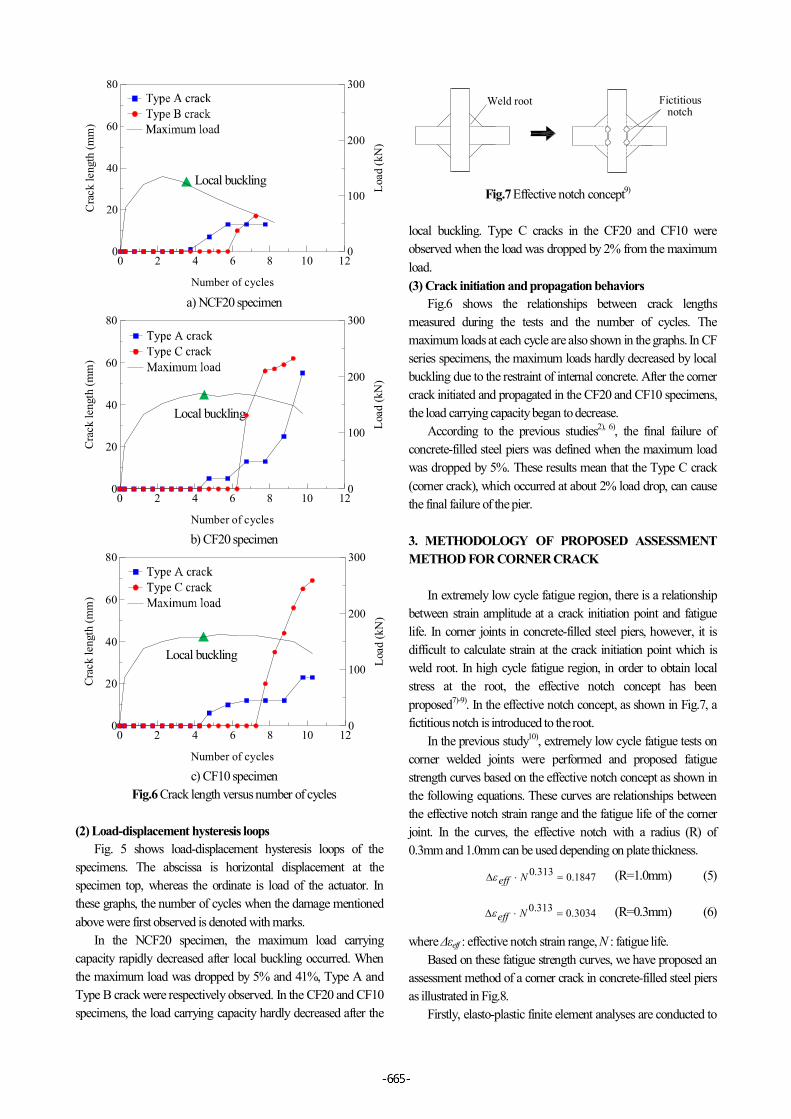
Fig.5 Load-displacement hysteresis loops
Py : Axial yield load
Local buckling
Local buckling
Local buckling
(2) Load-displacement hysteresis loops Fig. 5 shows load-displacement hysteresis loops of the
specimens. The abscissa is horizontal displacement at the specimen top, whereas the ordinate is load of the actuator. In these graphs, the number of cycles when the damage mentioned above were first observed is denoted with marks.
In the NCF20 specimen, the maximum load carrying capacity rapidly decreased after local buckling occurred. When the maximum load was dropped by 5% and 41%, Type A and Type B crack were respectively observed. In the CF20 and CF10 specimens, the load carrying capacity hardly decreased after the
local buckling. Type C cracks in the CF20 and CF10 were observed when the load was dropped by 2% from the maximum load. (3) Crack initiation and propagation behaviors
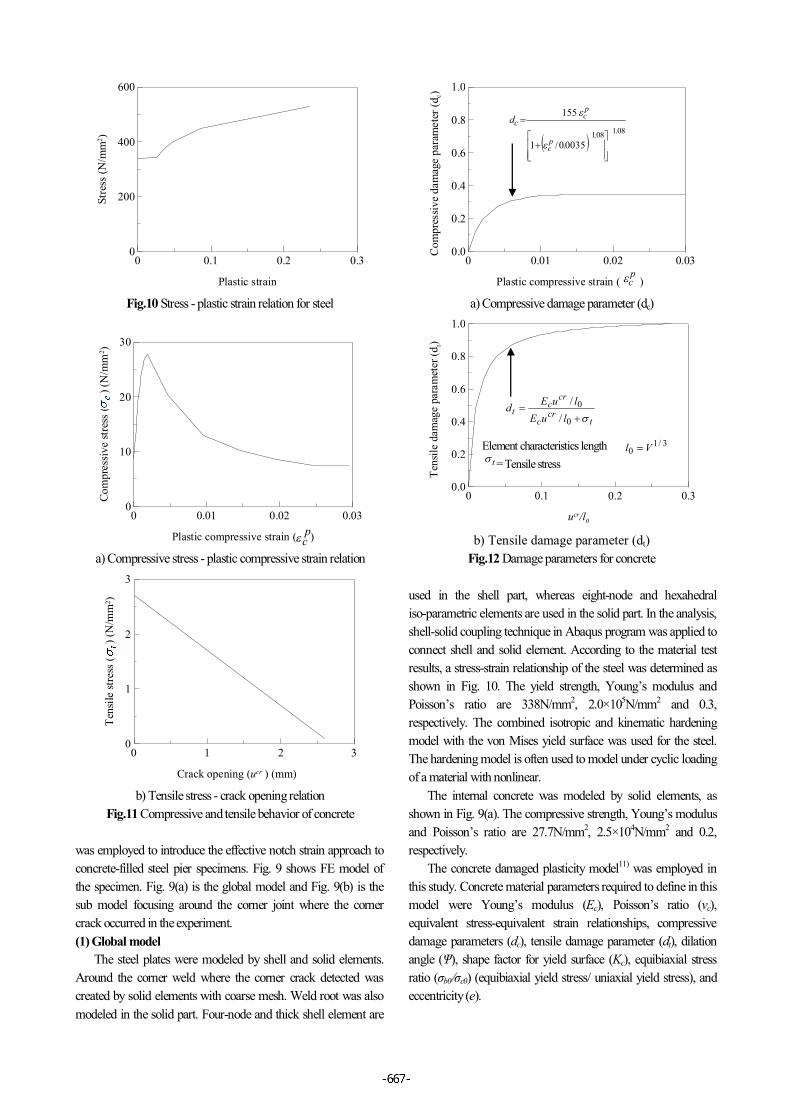
Fig.6 shows the relationships between crack lengths measured during the tests and the number of cycles. The maximum loads at each cycle are also shown in the graphs. In CF series specimens, the maximum loads hardly decreased by local buckling due to the restraint of internal concrete. After the corner crack initiated and propagated in the CF20 and CF10 specimens, the load carrying capacity began to decrease.
According to the previous studies2), 6), the final failure of concrete-filled steel piers was defined when the maximum load was dropped by 5%. These results mean that the Type C crack (corner crack), which occurred at about 2% load drop, can cause the final failure of the pier.
3. METHODOLOGY OF PROPOSED ASSESSMENT METHOD FOR CORNER CRACK
In extremely low cycle fatigue region, there is a relationship
between strain amplitude at a crack initiation point and fatigue life. In corner joints in concrete-filled steel piers, however, it is difficult to calculate strain at the crack initiation point which is weld root. In high cycle fatigue region, in order to obtain local stress at the root, the effective notch concept has been proposed7)-9). In the effective notch concept, as shown in Fig.7, a fictitious notch is introduced to the root.
In the previous study10), extremely low cycle fatigue tests on corner welded joints were performed and proposed fatigue strength curves based on the effective notch concept as shown in the following equations. These curves are relationships between the effective notch strain range and the fatigue life of the corner joint. In the curves, the effective notch with a radius (R) of 0.3mm and 1.0mm can be used depending on plate thickness.
1847.0313.0 Neff (R=1.0mm) (5)
3034.0313.0 Neff (R=0.3mm) (6)
where Δεeff : effective notch strain range, N : fatigue life. Based on these fatigue strength curves, we have proposed an
assessment method of a corner crack in concrete-filled steel piers as illustrated in Fig.8.
Firstly, elasto-plastic finite element analyses are conducted to
0 2 4 6 8 10 12
Number of cycles
0
20
40
60
80C
rack
leng
th(m
m)
0
100
200
300
Load
(kN
)
a) NCF20 specimen
0 2 4 6 8 10 12
Number of cycles
0
20
40
60
80
Crac
kle
ngth
(mm
)
0
100
200
300
Load
(kN
)
b) CF20 specimen
0 2 4 6 8 10 12
Number of cycles
0
20
40
60
80
Crac
kle
ngth
(mm
)
0
100
200
300
Load
(kN
)
c) CF10 specimen
Fig.6 Crack length versus number of cycles
Weld root Fictitiousnotch
Fig.7 Effective notch concept9)

obtain effective notch strain at a weld root in a corner weld. In the FE model, an effective notch with R=0.3 or 1.0mm is needed to be installed at the weld root (Step 1). The detail of the FE modeling is mentioned in Chapter 4. As the results of FE analysis, we obtain a histogram of the effective notch strain range (Step 2). The calculation method of effective notch strain range is referred to the previous study10).
Secondly, the damage index (Di) is calculated by using the proposed fatigue strength curve and obtained effective notch strain range as shown in equation (7) and (8) (Step 3). After then, according to the Miner’s rule, cumulative fatigue damage index D is calculated by equation (9) (Step 4).
i
ii N
nD (7)
313.0/1
,)(
ieffi
CN
(8)
iDD (9)
where Di : damage index for each strain range, Δεeff, i and ni : ith effective notch strain range and its number of cycles, Ni : fatigue life of ith, and C : constant of the fatigue strength curve depending on the radius of the effective notch (C=0.1847 for R=1.0mm,C=0.3034 for R=0.3mm)10).
If the cumulative damage index (D) reaches 1.0, it is assumed that extremely low cycle fatigue damage occurred at corner weld in concrete-filled steel piers (Step 5).
4. EXTREMELY LOW CYCLE FATIGUE ASSESSMENT OF CORNER CRACK IN CONCRETE- FILLED STEEL PIERS
4.1 Analysis methods
Elasto-plastic finite element analyses were conducted by using ABAQUS program under the same condition of the experiment in Chapter 2. In this study, sub-modeling technique
Step 1FE model with effective notch
in corner welded joints
Number of cycles
Effective notch strain range
Step 2Effective notch
strain range histogram
Step 3Damage index, Di
Number of cycles
Effective strain range
n1
ni
np
Ni
Proposed fatigue strength curve
(R=0.3 or 1.0mm)
Step 4Accumulated damage, D
Step 5D=1.0, Crack initiation
Effective notch concept(R=0.3 or 1.0mm)
Steel pier Flange
Web
Fig.8 Flow chart of extremely low cycle fatigue assessment of corner crack in concrete-filled steel piers
Axial loadCyclic loading
Shell
Solid
In-filled concreteSteel plates
Effective notch model (R=0.3mm)
Deposit metalBase metal HAZ
Actual welding shape
a) Global model b) Sub model
Fig.9 FE model
was employed to introduce the effective notch strain approach to concrete-filled steel pier specimens. Fig. 9 shows FE model of the specimen. Fig. 9(a) is the global model and Fig. 9(b) is the sub model focusing around the corner joint where the corner crack occurred in the experiment. (1) Global model
The steel plates were modeled by shell and solid elements. Around the corner weld where the corner crack detected was created by solid elements with coarse mesh. Weld root was also modeled in the solid part. Four-node and thick shell element are
used in the shell part, whereas eight-node and hexahedral iso-parametric elements are used in the solid part. In the analysis, shell-solid coupling technique in Abaqus program was applied to connect shell and solid element. According to the material test results, a stress-strain relationship of the steel was determined as shown in Fig. 10. The yield strength, Young’s modulus and Poisson’s ratio are 338N/mm2, 2.0×10⁵N/mm2 and 0.3, respectively. The combined isotropic and kinematic hardening model with the von Mises yield surface was used for the steel. The hardening model is often used to model under cyclic loading of a material with nonlinear.
The internal concrete was modeled by solid elements, as shown in Fig. 9(a). The compressive strength, Young’s modulus and Poisson’s ratio are 27.7N/mm2, 2.5×10⁴N/mm2 and 0.2, respectively.
The concrete damaged plasticity model11) was employed in this study. Concrete material parameters required to define in this model were Young’s modulus (Ec), Poisson’s ratio (νc), equivalent stress-equivalent strain relationships, compressive damage parameters (dc), tensile damage parameter (dt), dilation angle (Ψ), shape factor for yield surface (Kc), equibiaxial stress ratio (σb0 ∕σc0) (equibiaxial yield stress/ uniaxial yield stress), and eccentricity (e).
0 0.1 0.2 0.3
Plastic strain
0
200
400
600St
ress
(N/m
m2 )
Fig.10 Stress - plastic strain relation for steel
0 0.01 0.02 0.03
Plastic compressive strain ( )
0
10
20
30
Com
pres
sive
stre
ss(
)(N
/mm
2 )
a) Compressive stress - plastic compressive strain relation
0 1 2 3
Crack opening (ucr ) (mm)
0
1
2
3
Tens
ilest
ress
()(
N/m
m2 )
b) Tensile stress - crack opening relation
Fig.11 Compressive and tensile behavior of concrete
0 0.01 0.02 0.03
Plastic compressive strain ( )
0.0
0.2
0.4
0.6
0.8
1.0
Com
pres
sive
dam
age
para
met
er(d
c)
a) Compressive damage parameter (dc)
0 0.1 0.2 0.3
ucr/l0
0.0
0.2
0.4
0.6
0.8
1.0
Tens
ileda
mag
epa
ram
eter
(dt)
b) Tensile damage parameter (dt)
Fig.12 Damage parameters for concrete
pc
pc
08.108.1
0035.0/1
155
pc
pc
cd
tcr
c
crc
tluE
luEd
0
0/
/
3/10 Vl Element characteristics length
= Tensile stress t
Among these parameters, only limited values were known such as the Young’s modulus, compressive strength and Poisson’s ratio by the compression test of concrete. Therefore, this study referred to the previous study12) to determine the unknown parameters for the model.
The compressive stress-plastic compressive strain curve determined in the model is shown in Fig 11(a). The tensile strength of the concrete was assumed as 10% of its compressive strength13). As tensile stress (σt) and crack opening (ucr), a linear relation with the negative stiffness, schematically shown in Fig. 11(b), is assumed as the first-order approximation14).
The compressive damage parameter (dc) and tensile damage parameter (dt) were determined by the empirical formula14), as shown in Fig. 12. The crack opening (ucr) can be converted into plastic tensile strain by ucr / l0, where l0 = V 1/3. V denotes the averaged in-filled concrete element volume in FE model.
As the input data was not available for Ψ, Kc, σb0 ∕σc0, and e, σb0 ∕σc0 = 1.16, Kc = 0.67, and e = 0.2 were used as the default recommended values by ABAQUS15). Ψ was determined to be 20° as a value when the structural analysis results fitted in best with the experiment results.
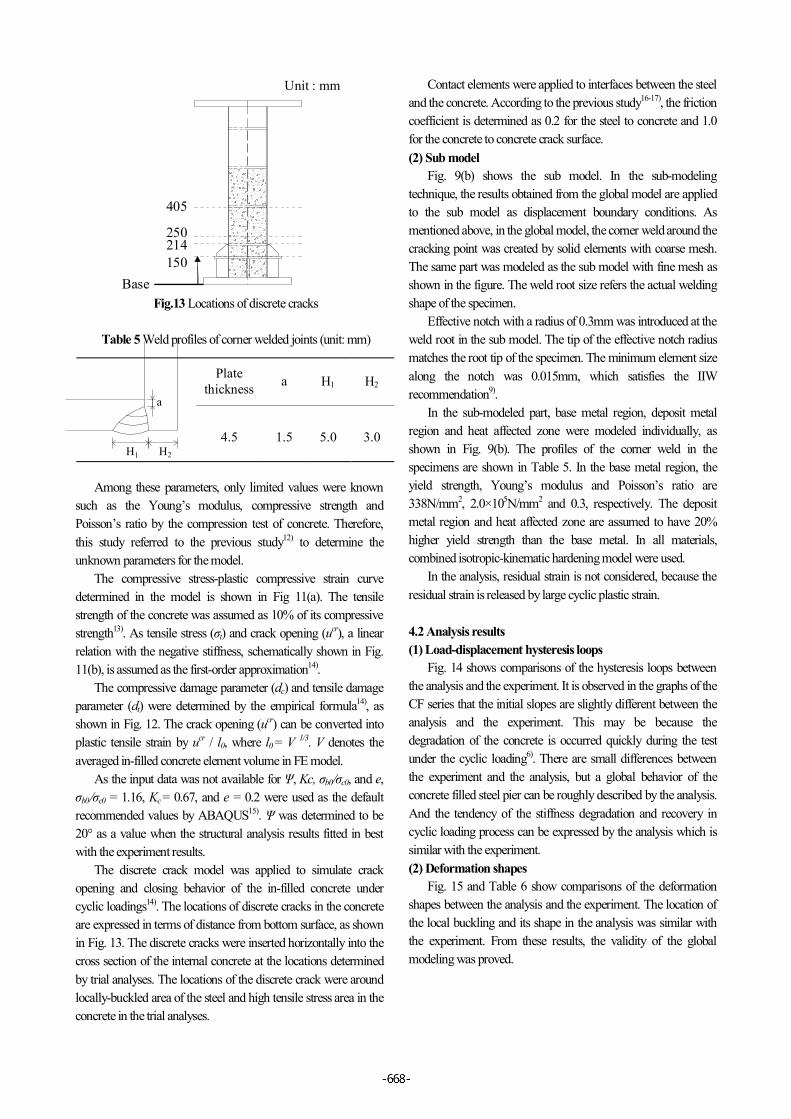
The discrete crack model was applied to simulate crack opening and closing behavior of the in-filled concrete under cyclic loadings14). The locations of discrete cracks in the concrete are expressed in terms of distance from bottom surface, as shown in Fig. 13. The discrete cracks were inserted horizontally into the cross section of the internal concrete at the locations determined by trial analyses. The locations of the discrete crack were around locally-buckled area of the steel and high tensile stress area in the concrete in the trial analyses.
Contact elements were applied to interfaces between the steel and the concrete. According to the previous study16-17), the friction coefficient is determined as 0.2 for the steel to concrete and 1.0 for the concrete to concrete crack surface. (2) Sub model
Fig. 9(b) shows the sub model. In the sub-modeling technique, the results obtained from the global model are applied to the sub model as displacement boundary conditions. As mentioned above, in the global model, the corner weld around the cracking point was created by solid elements with coarse mesh. The same part was modeled as the sub model with fine mesh as shown in the figure. The weld root size refers the actual welding shape of the specimen.
Effective notch with a radius of 0.3mm was introduced at the weld root in the sub model. The tip of the effective notch radius matches the root tip of the specimen. The minimum element size along the notch was 0.015mm, which satisfies the IIW recommendation9).
In the sub-modeled part, base metal region, deposit metal region and heat affected zone were modeled individually, as shown in Fig. 9(b). The profiles of the corner weld in the specimens are shown in Table 5. In the base metal region, the yield strength, Young’s modulus and Poisson’s ratio are 338N/mm2, 2.0×10⁵N/mm2 and 0.3, respectively. The deposit metal region and heat affected zone are assumed to have 20% higher yield strength than the base metal. In all materials, combined isotropic-kinematic hardening model were used.
In the analysis, residual strain is not considered, because the residual strain is released by large cyclic plastic strain. 4.2 Analysis results (1) Load-displacement hysteresis loops
Fig. 14 shows comparisons of the hysteresis loops between the analysis and the experiment. It is observed in the graphs of the CF series that the initial slopes are slightly different between the analysis and the experiment. This may be because the degradation of the concrete is occurred quickly during the test under the cyclic loading6). There are small differences between the experiment and the analysis, but a global behavior of the concrete filled steel pier can be roughly described by the analysis. And the tendency of the stiffness degradation and recovery in cyclic loading process can be expressed by the analysis which is similar with the experiment. (2) Deformation shapes
Fig. 15 and Table 6 show comparisons of the deformation shapes between the analysis and the experiment. The location of the local buckling and its shape in the analysis was similar with the experiment. From these results, the validity of the global modeling was proved.
150214250
405
Unit : mm
Base150214250
405
Fig.13 Locations of discrete cracks
Table 5 Weld profiles of corner welded joints (unit: mm)
a
H1 H2
Plate thickness a H1 H2
4.5 1.5 5.0 3.0

(3) Verifications of sub-modeling In order to verify the sub-modeling, the maximum principal
strain distributions in the sub model were compared with those of the global model. Fig. 16 shows the comparisons of maximum principal strain contour between in the global and sub model at 5.25 cycles in case of CF10. The tendencies of the strain distributions of the sub-model are similar with those of the global model. From these results, the validity of the sub-modeling was proved.
a) NCF20 specimen
b) CF20 specimen
Fig.15 Comparisons of deformation shapes
Table 6 Examples of deformations of locally-bucked area (CF20 specimen, 5.25cycles)
hb
Experiment (mm)
Analysis (mm)
b 20.0 22.6
h 100 116.0
(4) Strain distributions around effective notch
Equivalent plastic strain distributions around the effective notch at 6.25 cycles are shown in Fig.17. The scale of the spectrum range is constant in the figures. High strain concentration can be observed around the effective notch.
Although the magnitude of the strain around the effective notch differs depending on the axial load level (CF20 and CF10), the difference of strain values is relatively small.
4.3 Fatigue assessment for corner crack
From the effective notch strain range around the notch, the cumulative damage index (D) was calculated, and the fatigue life of the specimen was predicted. Fig. 18 shows comparisons of the prediction life and the actual life in the experiments. In the graph, the results obtained by the corner welded joint in the previous study10) are also shown.
Although there is small difference between the prediction and the experiment, relatively good agreement can be observed between them. The small difference is caused by crack propagation life, which was not included in the effective notch strain approach. However, it was confirmed that the proposed assessment method can predict the fatigue life of the corner crack in concrete-filled steel piers with relatively accuracy.
-50 -25 0 25 50
Displacement (mm)
-250
-125
0
125
250Lo
ad(k
N)
ExperimentAnalysis
a) NCF20 specimen
-50 -25 0 25 50
Displacement (mm)
-250
-125
0
125
250
Load
(kN
)
ExperimentAnalysis
b) CF20 specimen
-50 -25 0 25 50
Displacement (mm)
-250
-125
0
125
250
Load
(kN
)
ExperimentAnalysis
c) CF10 specimen
Fig.14 Comparisons of hysteretic curves

100 101 102 103
Predicted life
100
101
102
103
Act
uall
ife
Corner joints specimensConcrete-filled specimens
Fig.18 Results of fatigue assessment of corner crack in concrete-filled steel piers
5. SUMMARY AND CONCLUSIONS
This paper investigated the applicability of the proposed assessment method for corner cracks in concrete-filled steel piers in extremely low cycle fatigue region, experimentally and analytically. The following main conclusions can be stated as follows:
1) Extremely low cycle fatigue crack at corner joints is one of the main failure modes of concrete-filled steel piers.
2) The proposed method based on the effective notch strain approach for the corner crack was applied to the concrete filled steel piers and its applicability was confirmed.
3) The proposed method can predict the extremely low cycle fatigue life of the corner crack in the concrete-filled steel piers.
ACKNOWLEDGEMENT: The authors gratefully acknowledge the support from the Grant-in-Aid for Young Scientists (B) (22760339). The advices of Prof. Hanbin Ge (Meijo University) and Prof. Hikaru Nakamura (Nagoya University) are greatly appreciated. We would also like to express their sincere gratitude to Takigami Steel Construction Co., Ltd. And Nippon Sharyo., Ltd for specimen fabrication.
References 1) Usami, T., Guidelines for seismic and damage control design
of steel bridges, Japan Society of Steel Construction, 2006 (in Japanese).
2) Ge, H., Usami, T. and Toya, K., A study on strength and deformation capacity of concrete-filled steel columns under cyclic loading, Journal of Structural Engineering, JSCE, 40A, pp. 163-176, 1994 (in Japanese).
3) Park, J. E., Hanji, T., Tateishi, K. and Choi, S. M., Experimental study on low cycle fatigue behavior of concrete-filled steel piers, Proceedings of the 9th German-Japanese Bridge Symposium, CD-ROM, 2012.
4) Japan Road Association, Specification for high way bridge, 2012(in Japanese).
5) Miki, C., Damage to civil structures in great hanshin earthquake, Welding in the world, 38, pp. 243-255, 1996.
6) Usami, T., Suzuki, M. Mamaghani, H. P. and Ge, H., A proposal for check of ultimate earthquake resistance of partially concrete filled steel bridge piers, Journal of Structural Mechanics and Earthquake Engineering, JSCE, 525 (I-33), pp.69-82, 1995 (in Japanese).
7) Radaj, D., Sonsino, C. M. and Fricke, W., Fatigue Assessment of Welded Joints by Local Approach, Woodhead: Woodhead Publishing, 2006.
8) Fricke, W., Guideline for the Fatigue Assessment by Notch Stress Analysis for Welded Structures, IIW Documentation, XIII-2240-08/XV-1289-08, 2008.
9) Hobbacher, A., Recommendations for fatigue design of
Global model(5.25 cycles)
Sub model(5.25 cycles)
+5.00e-01
+3.75E-01
+2.50E-01
+1.25E-01
+0.00E+00
MaximumPrincipal strain
Fig.16 Comparisons of maximum principal strain contour
(CF10 specimen)
+6.60e-01
+4.95E-01
+3.30E-01
+1.65E-01
+0.00E+00
a) CF20 specimen
+6.60e-01
+4.95E-01
+3.30E-01
+1.65E-01
+0.00E+00
b) CF10 specimen
Fig.17 Equivalent plastic strain distributions around effective notch at 6.25 cycles
welded joints and components, IIW Documentation, XIII-1539-96/XV-845-96, 2008.
10) Hanji, T., Park, J. E., and Tateishi, K.., Low cycle fatigue assessments of corner welded joints based on local strain approach, International Journal of steel structures, Vol. 14, No. 3, pp. 579-587, 2014.
11) Lee, J. and Fenves, G., Plastic-damage model for cyclic loading of concrete structures, Journal of Engineering Mechanics, 124(8), pp. 892-900, 1998.
12) Goto, T., Ghosh, P. K. and Kawanishi, N., FEM analysis for hysteretic behavior of CFT bridge piers considering interaction between steel tube and in-filled concrete, Doboku Gakkai Ronbunshuu A, JSCE, 65(2), pp. 487-504, 2009 (in Japanese).
13) Matsumura, T. and Mizuno, E., 3-D FEM analyses on internal state inside the concrete filled steel tubular columns subjected to flexural deformation under axial loading, Journal
of Structural Engineering, JSCE, 53A, pp.75-83, 2007 (in Janpanese).
14) Goto, T., Ghosh, P. K.. and Kawanishi, N., Nonlinear finite element analysis for hysteretic behavior of thin-walled circular columns with in-filled concrete, Journal of Structural Engineering, ASCE, 136(11), pp. 1413-1422, 2010.
15) ABAQUS, Standard 6.13 user’s manual, Hibbit, Karlson & Sorensen, Inc., Paris, 2013.
16) Johansson, M. and Gylltoft, K., Structural behavior of slender circular steel-concrete composite columns under various means of load application, Steel Composite Structures, Vol. 1(4), pp. 393-410, 2001.
17) American Concrete Institute, ACI Code issues-coefficient of friction: Concrete to concrete, 2001.
(Received September 24, 2014) (Accepted February 1, 2015)