f il appraisal of lt upy iffco feitilizer project india
TRANSCRIPT

Report No. 591 -IN F ILAppraisal of Lt UPyIFFCO Feitilizer ProjectIndiaDecember 9, 1974
Industrial Projects Department
Not for Public Use
Document of the International Bank for Reconstruction and DevelopmentInternational Development Association
This report was prepared for official use only by the Bank Group. It may not be published,quoted or cited without Bank Group authorization. The Bank Group does not accept responsibilityfor the accuracy or completeness of the report.
Pub
lic D
iscl
osur
e A
utho
rized
Pub
lic D
iscl
osur
e A
utho
rized
Pub
lic D
iscl
osur
e A
utho
rized
Pub
lic D
iscl
osur
e A
utho
rized

CURRENCY EQUIVALENTS WEIGHTS AND MEASURES
Rs 1.0 = US$0.133 All weights and measures are in metric unitsRs 7.50 = US$1.00 1 Metric Ton (Ton) = 1,000 Kilograms
1 Kilogram (Kg) = 2.204 Pounds (lbs)1 Kilometer (Km) = 0.62 Miles1 Hectare (Ha) = 2.47 Acres
PRINCIPAL ABBREVIATIONS AND ACRONYMS USED
CAN Calcium Ammonium NitrateDAP Diammonium Phosphate (18-46-0)FACT Fertilisers and Chemicals, Travancore Ltd.FAI Fertilizer Association of IndiaFCI Fertilizer Corporation of IndiaGOI Government of IndiaHYV High Yielding VarietyIDBI Industrial Development Bank of IndiaIFFCO Indian Farmers Fertiliser Cooperative Ltd.KW KilowattKWh Kilowatt HourK20 (Potash) Potassium Oxide Content in FertilizersMW MegawattMWh Megawatt HourN Nitrogen Content in FertilizersNPK Complex Fertilizer Containing N, P205 and K20P205 (Phosphoric Acid) Phosphorous Pentoxide Content in FertilizersSSP Single Superphosphate (0-18-0)TPD Tons per DayTPY Tons per YearTSP Triple Superphosphate (0-46-0)UP Uttar Pradesh
FISCAL YEARS
GOI and Fertilizer Statistics - April 1-March 31IFFCO (actual operations) - July 1-June 30IFFCO (projected operations) - January 1-December 31

INDIA
APPRAISAL OF THE IFFCO FERTILIZER PROJECT
Table of Contents
Page No.
SUMMARY AND CONCLUSIONS ............ ................ i-iii
I. INTRODUCTION .... . .............. . 1
II. THE IFFCO ORGANIZATION ...................... . 1
A. Description, Organization and Management .......... ...... O.. 1B. Plants under Construction . .. 0*0.6*.* ** ... **. *** * .* 2C. Financial Evaluation of Existing Operations ....... 3D. Ylortgages ......... oso***se ........ *XX... 5
III. FERTILIZER MARKET .......... o....*. ...
A. Agriculture in India and the need for Fertilizers. 5B. The Role of the Cooperative Institutions. 6C. Supply and Demand ............ . ............. . .......... 7D. IFFCO's Market Area .. ... ............ *.*.... .... o.o 9E. IFFCO's Marketing Efforts ...... **...... .. ......... . 10F. Prices ................. .......... ...... 11
IV. THE PHULPUR PROJECT ................ .. a.* .. o..... ............. 12
A. Project Location ...... .o... .. . . o.. 12B. Project Scope *. ........ o..0..e0.0.0...*. ...... 0.0.... 13C. Feedstocks and Other Needs .. o...... 13D. Technology .. oo. . 000.0.0.o....0. .. . 14E. Ecology .. .....-. 0..0.*..... ......... 0...* 14F. Employment, Training and Social Aspects .15G. Project Execution and Operation ... 15
V. CAPITAL COST ESTIMATE AND FINANCING PLAN .......... 17
A. Capital Costs. . . .. ........... .. ... .. .. . . 17B. Financing Plan . ... . ........ o. .. .. o.. 18C. Procurement and Disbursement ...............................O. 19D. Allocation and Disbursement of IBRD Loan ....... 19
This report was prepared by Messrs. Antonio S. Tarnawiecki, Christopher J.Pratt, Denis T. Carpio and Felipe A. M. de la Balze of the IndustrialProjects Department.

Table of Contents (Continued)
Page No.
VI. FINANCIAL ANALYSIS ............................ 20
A. Analysis of the Project ................. . 20B. Financial Rate of Return and
Sensitivity Analysis ......... .......... 23C. Consolidated Forecasts for IFFCO C... O06000 23D. Financial Covenants *... *.*......... 25E. Major Risks . ............... , 25
VII. ECONOMIC ANALYSIS ............................. 26
A. W4orld Fertilizer Prices ........ .......... 26B. Economic Rate of Return ........ .......... 26C. Domestic Fertilizer Supply and Food
Production ............ .. ............... 27D. Direct Foreign Exchange Savings ...... o ... 27E. Other Benefits ............... ; 27
JIII. AGREEMENTS ..,............ #...............-.-....-. 28

ANNEXES
1-1 Glossary of Terms Used in the Report1-2 Units and Conversion Factors2-1 Geographical Distribution of IFFCO's Cooperative Shareholdings2-2 IFFCO Management Chart during Phulpur Project Construction2-3 Summary of CFI-IFFCO Agreement2-4 Projected Financial Statements for the Kalol and Kandla Factories
3-1 Agriculture in India and the need for Plant Nutrients3-2 The Agricultural Cooperative System in India3-3 Flow of Products and Funds in Agricultural Cooperatives3-4 Historical Development of the Fertilizer Market3-5 Fertilizer Market Projections3-6 IFFCO's Market Area3-7 International Price Range of Urea4-1 Meteorological Data for Allahabad Area4-2 Proposed Plant Layout for IFFCO Phulpur Project4-3 Representative Data for Heavy Fuel Oil Feedstock to be used
in the Project4-4 Representative Data for Coal and Other Utilities to be used
in the Project4-5 Description of Proposed Processes to be used in the Project4-6 Integrated Process Flow Sheet for the Project4-7 Environmental and Safety Conditions4-8 Staffing and Labor Pattern for the Phulpur Urea Project4-9 IFFCO Management Chart (during Project Construction)4-10 Construction Schedule4-11 Transportation and Handling of Large Equipment4-12 IFFCO Management Chart (Operations)5-1 Capital Cost Estimate5-2 Expenditure Commitment and Price Escalation Factors5-3 Permanent Working Capital5-4 Interest during Construction5-5 Disbursement Schedule of IBRD Loan6-1 Depreciation Schedule6-2 Urea Production Cost Estimate at mid-1978 Prices6-3 Debt Service Schedule in Current Rupees6-4 Financial Forecasts6-5 Profit and Cash Breakeven Charts6-6 Calculation of Capital Costs at constant mid-1978 Rupees6-7 Assets Revalued at mid-1978 Rupees6-8 Cash Flow for Financial Rate of Return6-9 Financial Rate of Return and Sensitivity Analysis6-10 Projected Consolidated Financial Statements7-1 Annual Economic Production Costs and Foreign Exchange Savings7-2 Estimated Prices for Economic Analysis7-3 Economic Cost and Benefit Streams in Constant 1978 Rupees7-4 Economic Rate of Return and Sensitivity Analysis
MAPSIBRD 10453R - Location of Major Fertilizer Plants and Refineries in IndiaIBRD 11227 - IFFCO's Market AreasIBRD 11228 - Site of Proposed IFFCO Phulpur Project.


INDIA
IFFCO FERTILIZER PROJECT
SUMMARY AND CONCLUSIONS
i. This report deals with the appraisal of a fertilizer project inPhulpur, Uttar Pradesh (UP) comprising a 900 tons per day (TPD) ammonia unitand a 1,500 TPD urea plant based on heavy fuel oil for feedstock and coal forsteam and power generation. The project, which is expected to start commer-cial production in September 1978, is sponsored by the Indian Farmers' Fer-tiliser Cooperative Ltd. (IFFCO), owned by the Government of India and coopera-tive institutions. Although two thirds of the shares are held by the Govern-ment, IFFCO's by-laws provide for the eventual transfer of the Governmentshares to the cooperatives. The project will add 495,000 tons per year (TPY)urea capacity (equivalent to 228,000 tons of nitrogen) to two other plantsthat IFFCO is successfully building and has almost completed. These two plants,having a final product capacity of 392,000 TPY of urea and 376,000 TPY of com-plex (NPK) fertilizers, are the first venture of the Indian cooperative systeminto the large-scale manufacture of fertilizers. The Phulpur project is esti-mated to cost about US$220 million, of which US$107 million is anticipated tobe in foreign exchange including nearly US$17 million in interest during con-struction. A Bank loan of US$109 million equivalent is proposed; it would bemade to IFFCO and guaranteed by the Government.
ii. Chemical fertilizer consumption in India grew rapidly--at an averagerate of 17% annually--in the last 20 years and reached 2.8 million tons of thethree major plant nutrients 1/ in 1973/74. With 164 million hectares, Indiais the third ranking country in the world in cropped area (and the second inirrigated land). Future increases in production of foodgrain and other cropsare expected to result not so much from enlargement of the cultivated areas asfrom improved agricultural practices, including higher rates of fertilizerapplication. Recent forecasts estimate N consumption at 4.3 and 6.9 milliontons by 1978/79 and 1983/84 respectively. 2/
iii. The growth in fertilizer production in the past 20 years (16% peryear on the average) is impressive but has failed to keep pace with demand andimports have increased almost twentyfold in spite of the fact that farmers'demand has not been fully satisfied because of balance of payment problems andrecent scarcity and high prices of imported fertilizers. Domestic productionof fertilizer has been disappointing in recent years; production of N fertilizerin 1973/74 (less than 1.1 million tons) was only 67% of commercial capacity
1/ 1.83 million tons of nitrogen (N), 0.61 million tons of phosphoric acid(P2 0 5) and 0.33 million tons of potash (K2 0).
2/ The Draft Fifth Five-Year Plan projected a 1978/79 consumption of 5.2million tons of N.

- li -
(i.e., excluding plants mechanically complete but not yet operating comuercial-ly). Because of uncertainty in the availability and pricing of fertilizers inthe world market, increased domestic production--through improvement in thecapacity utilization of existing plants and installation of new units--iscrucial for India's programs to increase agricultural production. The projectwill help to fill, at a satisfactory economic cost, the gap between productionand demand, thus diminishing the country's costly dependence on imported ferti-lizer and the consequent risk of interrupted supplies. Any shortfall in foodproduction resulting from lack of fertilizers would cost India many times thecost of producing them locally.
iv. The project envisages the utilization of modern but proven techno-logy (the ammonia plant will be similar to that of the Nangal fertilizer plantfor which IDA financing was approved in January 1973) and will be executed byIFFCO with the assistance of engineering firms which have experience in theconstruction of fuel oil-based ammonia and urea plants and offsites and whichwill actively participate in the procurement of equipment following Bankguidelines. IFFCO will set up a Project Implementation Unit, and to strengthenits capacity to manage the implementation of a project employing technologynot used today in India (the Nangal fertilizer plant will be the first majorplant based on fuel oil), IFFCO will arrange, if they or the Bank deem itnecessary, for qualified technical advisory services. The contracts with thelatter and the engineering firms will be subject to prior Bank approval.
v. The US$109 million loan will finance equipment and spares procuredaccording to Bank guidelines and the foreign exchange component of the feesfor expatriate engineering, licensing and advisory services. The balance ofthe project cost will be financed through long-term borrowings from the Gov-ernment and Indian banking institutions totalling Rs 258 (US$34.3) millionand by raising IFFCO's equity by Rs 580 (US$77.2) million through contributionsfrom the Government (Rs 360 million) and the cooperative institutions (Rs 220million). In view of the need to mobilize substantial resources from a largenumber of cooperatives, the Government has agreed to cover any shortfall inthe cooperatives' contribution. The project will be soundly capitalized witha debt:equity ratio of about 60:40 including some quasi equity in the form ofsubordinated debt to the Govern>;snt. As loans are repaid, IFFCO's financialposition will be strengthened and reserves built up for future expansion.
vi. Agricultural cooperatives in India, besides extending credit totheir members, share in the marketing of their crops, and are the major dis-tributors of fertilizer and other agricultural inputs. Institutional de-velopment, however, is uneven and the processing of credit applications andrecovery of loans must be improved. The prevailing high level of overdueloans does not affect fertilizer manufacturers (including eventually IFFCO)because sales are primarily financed by the banking system but correctivemeasures, many of which have already been taken, must nevertheless be firmlypursued, such as: disbursing credit largely in kind (fertilizer, seeds, etc.),tying of crop marketing with loan repayment, rejecting credit applicationsfrom defaulting borrowers and tightening accounting procedures at village-levelcooperatives. Operations of cooperatives located in the most important dis-tricts in IFFCO's marketing area are rapidly improving but the effectiveness

- iii -
of the steps taken must be kept continually under review. The proposed loanto IFFCO will reinforce the Company's capacity to strengthen cooperative in-stitutions at the grassroots level through the training of cooperative offi-cials for extension services on fertilizer application by individual farmers.
vii. Based on the present net ex-factory price of Rs 1,100 (US$147) perton of urea in India and the expected price escalation through 1978, theproposed plant's cash flow is projected to maintain a current ratio of atleast 1.5 to 1.0 and yield a financial rate of return of 10.3% after incometaxes or 13.9% before taxes. The present price paid by farmers for urea isRs 2,000 (US$267) per ton, but Rs 610 (US$81) per ton is set aside to sub-sidize higher-priced urea imports through a Government-controlled equaliza-tion fund. The Government has agreed to maintain fertilizer prices at levelsallowing efficient manufacturers to meet their expenses, service their debtout of their revenues and earn a reasonable rate of return on capital employed.
viii. On the basis of long-term international price levels for feedstock(US$65/ton of heavy fuel oil at plant site) and urea (US$175/ton landed atIndian port) expected at the time the plant starts commercial production, theproject's economic rate of return is 16.2%. Were production costs to increaseby 10%, the rate of return would decrease to 14.8%. A drop of US$20/ton inthe price for urea would depress the return by 3.6 percentage points. A one-year delay in the time required for construction would lower the rate of returnto 15.0% and a 10% capital cost overrun to 14.6%. The annual foreign exchangesavings are estimated at US$59 million annually.
ix. IFFCO has been active for three years in promotional programsadvocating balanced fertilizer application and other improved agriculturalpractices. As part of these programs IFFCO has been training its own andcooperative staff in all aspects of fertilizer application and marketingand has sold about 300,000 tons of fertilizers reaching a large number ofcooperative members "demonstration" plots. This extensive background infertilizer marketing and IFFCO's experience in building two large fertil-izer plants are expected to reduce risks to a minimum provided that imple-mentation of the project can be carried out as planned. However, delaysin delivery of equipment and cost overruns in excess of those provided forcannot be ruled out altogether in the tight equipment market situation existingat present. But even a one-year delay in project completion combined with a10% cost overrun - serious as these events would be in the attempt to getadditional fertilizer to Indian agriculture quickly and at a reasonable price- would reduce the economic rate of return only to 13.4%.
x. Based on the agreements reached with the Government and IFFCO asshown at the end of the report, the project is suitable for a Bank loan ofUS$109 million equivalent.


I. INTRODUCTION
1.01 The Government of India (GOI), on behalf of Indian Farmers FertiliserCooperative Ltd. (IFFCO or the Company), has requested a Bank loan of US$109million equivalent to help in the financing of a new fertilizer plant with acapacity of 297,000 tons per year (TPY) of ammonia and 495,000 TPY of urea,equivalent to 227,700 TPY of nitrogen (N) nutrient 1/ at Phulpur, UttarPradesh (UP). IFFCO is owned jointly by the Government and Indian cooperativeinstitutions and is about to complete the construction of two other fertili-zer plants in Gujarat, one at Kalol, for the production of ammonia and urea,and the other at Kandla, for the production of complex fertilizers (Map:IBRD 10453RI). The Company also plans to build a phosphoric acid plant at alater date.
1.02 IDA has extended four credits and IFC participated in two fertilizerprojects in India. A fifth fertilizer project, the Sindri Modernization Pro-ject of the Fertilizer Corporation of India (FCI), has been recently appraisedby IDA and is expected to be presented to the Executive Directors at the sametime as the IFFCO project. The Phulpur project is the first involving theconstruction of a new grass-roots plant. It was first reviewed by a Bankmission in October 1973, and after some additional preparatory work, appraisedin March/April 1974 by a mission consisting of Messrs. Tarnawiecki (Chief) andPratt, of the Industrial Projects Department.
II. THE IFFCO ORGANIZATION
A. Description, Organization and Management
2.01 IFFCO was registered on November 3, 1967, under the Bombay Coop-erative Societies Act and, subsequently, as a central society in New Delhi..It is owned two-thirds by the Government and one-third by a great number ofIndian cooperative institutions. Its authorized capital is Rs 1,000 millionand its paid-up capital Rs 285 million. The idea of the Indian cooperativesystem engaging in the large-scale manufacture of fertilizers was suggestedto the Government in 1964 by the Cooperative League of USA, which also offeredassistance in implementing it. The US Agency for International Development(AID) studied the plan in 1966/67, recommended building an ammonia/urea plantand a complex (NPK) fertilizer plant in Gujarat, and helped in their financing.These are the two plants which are now nearing completion (para. 1.01).
1/ A glossary of terms used in the report is contained in Annex 1-1 andunits and conversion factors common in the petroleum and fertilizerindustries are shown in Annex 1-2.

- 2 -
2.02 The contribution of the cooperative system to IFFCO's equity nowstands at Rs 105 million. About 24,000 cooperative institutions ranging fromthe national level federation to primary village cooperatives in 10 Statesare shareholders in IFFCO (Annex 2-1). Shareholders who contribute Rs 100,000or more have the right to a seat on IFFCO's Representative General Body, aform of general shareholders assembly, and every 200 societies with smallershareholders can jointly elect one representative. During the first 10 yearsof its existence (i.e., until November 1977), the Government appoints theBoard of Directors and the principal officers, and thereafter the Representa-tive General Body will select 5 members of the Board. The Managing, Financeand Marketing Directors, who are at the same time full-time officers, will beappointed by the Board with prior approval of the Government. Another 14members will be appointed by cooperative institutions, up to 5 by the Govern-ment and 3 by financial institutions. An Executive Committee has been estab-lished with adequate powers to run day-to-day operations of the Company. Thesenior corporate structure is shown in Annex 2-2.
2.03 The present Managing Director, Mr. Paul Pothen, is a highly ableand experienced fertilizer industry technologist and executive. The FinanceDirector, Mr. B.B. Singh, has been seconded to IFFCO from the Ministry ofFinance, and the General Manager, Mr. B. R. Singh, has an extensive backgroundin Indian fertilizer distribution and sales as well as in the cooperativesystem. Mr. Pothen's contract expires in January 1976 and Mr. B. B. Singh'sin July 1975. Mr. Pothen's contract can be extended for two additional yearswithout any difficulty and the Company has agreed to consult with the Bankon the appointment of a qualified successor to any vacancy in the position ofa fulltime Director. The eventual replacements for these men should beselected and trained as early as possible.
B. Plants under Construction
2.04 As mentioned previously, two IFFCO projects are being completed atKalol, near Ahmedabad, and about 325 km away, in Kandla, close to the IndianOcean where facilities for ocean-going vessels and railway connections areavailable. The Kalol plant comprises a 910 tons per day (TPD) ammonia unitand a 1,200 TPD urea unit plus storage, offsites and township. The ammoniaunit was designed and engineered by M.W. Kellogg Company (USA) in conjunctionwith Kellogg (India), and uses local natural gas, to be purchased from GOI atUS$0.45 per thousand standard cubic feet (MSCF), supplemented by about 180 TPDof naphtha. The urea unit was licensed by Stamicarbon N.V. (Holland) andengineered by Humphreys and Glasgow Ltd. (UK) in conjunction with H. & G.Consultants Private Ltd. (India), which also designed the offsites. It willconsume about 700 TPD of ammonia. The balance of approximately 200 TPD ofammonia will be transported via rail to the Kandla plant for the manufactureof complex fertilizers, with any surplus to be sold to industrial users.

2.05 The Kandla plant comprises two streams each having a design capacityof 600 TPD diammonium phosphate (DAP). The addition of potash enables avariety of NPK grades to be made according to need. The plant was designedby Dorr-Oliver Inc. (USA) in conjunction with Dorr-Oliver (India) Ltd. andtheir United Kingdom affiliate. Offsites were also designed by this group.A deep-water dock and township have been built nearby.
2.06 Project organization, procurement, construction and management atboth sites has been undertaken by IFFCO staff with the assistance of Cooperar-ative Fertilizers International (CFI), a group formed by US fertilizer co-operatives, and other expatriate staff working in conjunction with contractors'project teams. This arrangement (Annex 2-3) has been successful and indicatesthat IFFCO's management and project team are competent. Contracts for theseplants were let in July 1971 and commercial production of ammonia at Kalol isexpected to begin in November 1974, five months behind schedule. Due to de-layed shipment of the imported reactor, urea production at Kalol is not likelyto commence, until late 1974. Meanwhile, ammonia can be transported to Kandlaas well as to other plants subject to the availability of sufficient railtank-cars. While eventually IFFCO may produce its own phosphoric acid, ini-tially it will depend on imported phosphoric acid. One shipment of 15,000tons has already been received, but adequate supply from the world market maybe difficult during the next couple of years.
C. Financial Evaluation of Existing Operations
2.07 Total costs of the two plants, including contingencies and initialworking capital, are currently estimated at Rs 939 million (about US$125million), of which Kalol represents'about 72% and Kandla 28%. Sources offunds - US, UK, Netherlands, Government of India, Industrial Development Bankof India (IDBI) and other financial institutions - are detailed in Annex 2-1.
2.08 Financing of the two projects was highly leveraged and at the endof 1974 IFFCO's debt/equity ratio will be about 70:30. The Government hasagreed to subordinate its existing credit of Rs 112 million (Annex 2-1) onterms similar to those described for the Government's quasi-equity contributionfor the proposed Bank project (para. 5.05). Such a conversion would bringthe Company's debt/equity ratio to about 58:42 at the end of 1974.
2.09 IFFCO's projected financial statements without the project are shownin Annex 2-4 and summarized in the Table next page. The projections are basedon end-of-1974 costs and prices escalated by annual inflation rates of 12%during 1975, 8% during 1976, and 6% during 1977 and 1978; after start-up ofthe project they are expressed in constant mid-1978 prices. As mentionedbefore, the Kandla plant is facing difficulties in obtaining supplies ofphosphoric acid in the world market and the projected financial results arebased on the plant producing NPK at only 25% of capacity during the next twoyears. IFFCO's profitability, however, as shown in Annex 2-4, will still besatisfactory because the Kalol plant is expected to operate at 60% of capa-city in 1975, 80% in 1976, and 90% thereafter, and the ammonia productionintended for the manufacture of NPK fertilizer can be profitably sold toother users. The expected financial results from the two existing plants

- 4 -
Summary of Projected Financial Statements for theKalol and Kandla Factories./
(Rs million)
Year Ending December 31 1975 1976 1977 1978
Capacity Utilization (%): Kalol Unit 60 80 90 90Kandla Unit 25 25 60 80
Income Statement and Cash Flow(in current prices)Sales Revenues 15 680 1,121 1,388Cost of Sales 344 460 788 997Interest Charges j 69 65 61 59Income Taxes (55%) Y - 10 150 183Net Profit 2 145 122 149Depreciation 69 69 69 69Operating CasV low 139 279 252 277Debt Service Ž1 58 64 68 67Total Debt Service 67 74 86 85
Balance SheetCurrent Assets 213 231 248 262Cumulative-Funds:(a) Available for Investment - 121 265 435(b) Available for Distribution W - 10 19 29Net Fixed Assets and Spares 834 768 702 635Current Liabilities 7 130 93 98 124Long-Term Debt 519 503 487 449Equity (including quasi-equity) 339 535 648 788Total Assets or Liabilities 1,048 1,131 1,234 1,362
RatiosRegular Debt Service Coverage 2.3 4.2 3.7 4.1Total Debt Service Coverage 1.9 3.7 2.9 3.3Current Ratio 1.6 2.5 2.5 2.1Debt:Equity Ratio / 57:43 48:62 43:57 36:64
1/ Last digit discrepancies due to roundingv/ Interest oharges on all debt, including subordinated debt3/ Development rebate of Rs 139 million is used to offset taxable income
during 1975 and 1976V Net profit, depreciation and interest charges5/ Excluding debt service on subordinated debtb6/ Limited to 7% of net profit7 Including current portion of regular and subordinated debt
&Subordinated debt included in equity.

- 5 -
are favorable because the Kandla and Kalol plant capital and financing costswere largely incurred before the sharp equipment price inflation registeredduring 1973 and 1974. Furthermore, the present urea ex-factory price has beenset by the Government to provide a fair return on equity on the much higherpresent levels of capital and financial costs.
2.10 The Company has instituted comprehensive internal reporting pro-cedures and has agreed to supply to the Bank quarterly production, incomeand cash flow reports and audited annual reports satisfactory to the Bank.IFFCO wilL also prepare each quarter projected cash flows for the next 12-month period.
D. Mortgages
2.11 IFFCO's properties at Kalol and Kandla have been mortgaged tosecure the loans received by IFFCO from the Government, IDBI and other finan-cial institutions in India. The Government and IFFCO have agreed to vacatethe existing mortgages by June 30, 1975. These mortgages will be replaced bya new mortgage in favor of the Government. IDBI and other financial insti-tutions will be given Government guarantees for their loans to IFFCO.
2.12 The existing mortgages do not extend to any properties of theproposed Phulpur Unit. In addition to the proposed Bank loan, IDBI, otherfinancial institutions and possibly the Government will advance loan fundsto the new plant. Under the arrangements agreed with the Government andIFFCO, IFFCO may create certain liens on the properties of the Phulpur Unitin favor of the Government to secure loan amounts of the Bank and IDBI(including other financial institutions) which will be guaranteed by theGovernment, and to secure any direct lending by the Government for thePhulpur Unit. Arrangements will be made to ensure that the Bank will receivea part of any amounts recoverable under liens on the Phulpur Unit until itsloan is fully repaid. No other liens will be allowed except with the approvalof the Bank.
III. FERTILIZER MARKET
A. Agriculture in India and the Need for Fertilizers
3.01 With a cropped area of 164 million ha (Annex 3-1), India ranksthird in the world in area of cultivated land (after the USSR and US) andsecond in irrigated land (after Mainland China). In 1971, an estimated72% of the labor force worked the land but the agricultural sector's sharein GDP (at factor cost) was only about 43%. In the decade ending 1971-72,the growth rate for foodgrain output was 2.6% p.a. of which 0.5% can beascribed to cropped area increases and 2.1% to higher productivity. 1/ This
1/ However, for cereals alone (i.e., excluding pulses), the growth inoutput was 3.1% annually and in yields, 2.6% p.a..

- 6 -
was largely due to increased use of fertilizers and irrigation and to thespreading cultivation of high-yielding varieties (HYVs) of several crops,especially wheat and rice. During the last two years of the Fourth Five-Year Plan (1968/69 - 73/74) production failed to increase primarily becauseof the 1972/73 drought, scarcity of fertilizers, power shortages and trans-portation difficulties.
3.02 The Draft Fifth Five-Year Plan has set a target for foodgraingrowth of 4.2% annually from 1973/74 through 1978/79, of which 3.2% wouldresult from increased crop yields and 1.0% would be brought about throughan increase in area under crops of 10.2 million ha. However, the latestBank country economic report 1/ indicates that an increase in cropped areaof 5 million ha in foodgrains and 3 million ha in other crops is morelikely. The yields of the main crops are planned to increase by from 18%to 3S% in five years. To attain such increments increased availability offertilizers is indispensable but it must be complemented by proper use ofother inputs (water, seeds, pesticides and tractors), maintenance of advan-tageous crop price/input cost ratios for most crops, and improvement ofagricultural credit procedures.
3.03 Although under controlled small-scale farm trials, incrementalyields as high as 10 tons of foodgrain per ton of plant nutrient have beenobtained, in practical terms, a ratio of only about 6 to 1 is expectedunder average Indian conditions in the next few years. 2/ These are verycrude yardsticks of what actual marginal response to fertilizer applicationmay be, but indicate the magnitude of the foodgrain imports that would beneeded to cover shortfalls in fertilizer supplies.
B. The Role of the Cooperative Institutions
3.04 The Indian cooperative movement participates actively in agricul-tural credits, crop marketing and fertilizer distribution, and, throughIFFCO, also in the large-scale manufacture of fertilizers. The share ofthe Indian cooperative movement in agricultural credit was a meager 3% in1952, but increased rapidly during the sixties to reach about 33% of thetotal in 1969 (.Annex 3-2). In most States there is a three-tier structurefor extending short-terui eredit to individual farmers: the State-Level"Apex" cooperative bank, tile district-level central cooperative bank andthe primary (village-level) cred.aL or multi-purpose cooperative society(Annex 3-3). MIarketing of crops and distribution of fertilizers and otherinputs are also important activities of the cooperative system. The primarymarketing cooperatives handled crops valued at Rs 8.4 billion in 1971/72 andabout Rs 11 billion in 1973/74.
1/ "Economic Situation and Prospects of India" (402-IN), May 7, 1974.
2/ IBRD, Economic Situation and Prospects of India, Report No. 402-IN(May 7, 1974).

3.05 However, the primary agricultural credit cooperatives face aserious problem in the lack of sufficient well-trained full-time employeesand the large proportion of overdues: 44% of loans outstanding as of June30, 1972. This situation can be partly justified by bad crops but theGovernment and officials in the cooperative movement recognize that thelarger number of cases is due to poor management, particularly laxity inloan recovery practices (Annex 3-2, paras. 13/14). Although the problemdiminishes in relative importance as one moves up through the tiers ofthe cooperative system (Apex banks' overdues amounted to only 7% of loansoutstanding in June 1972) and it does not affect in any way the financialposition of fertilizer manufacturers (including eventually IFFCO), con-tinued improvement is of the greatest importance and the effectiveness ofsteps already taken towards this end should be kept under periodic review.These steps include disbursement of credit only to farmers who have repaidprevious loans and training of full time cooperative officials. Fortunately,some of the cooperatives most active in introducing needed reforms arelocated in the States where IFFCO will market the largest share of itsproduction.
C. Supply and Demand
3.36 In India, the cooperative institutions as well as the private andoublic sectors share in fertilizer production and distribution. One halfof the present capacity to manufacture N fertilizers--the product dealtwith in this report--is owned and operated by the public sector, mainly byFCI and Fertilisers and Chemicals, Travancore Ltd. (FACT), 1/ 31% by privatecompanies and the remaining 19% by mixed enterprises. The cooperatives willshare in production only as IFFCO's two plants come shortly on stream.Producers are allowed to market part of their straight N fertilizers 2/and the balance goes to the Central Fertilizer Pool, a public sectoragencv, wh3ich came into existence in 1942 to import N fertilizers, a func-tion it still performs.
3.71 The historical growth of fertilizer consumption and productionin In3ia is analyzed in Annex 3-4 and projections through 1983/84 aresaomn in Annex 3-5. The following paragraphs summarize the major conclu-s iOils.
3.9S Consumption of the three major plant nutrients 3/ increased atan average annual rate of 17.4% in the last 20 years, reaching 2.77 milliontons in 1973/74. Growth in consumption of N alone has been only slightly
1/ FCI was founded in 1961 to take over the management of three existingpublic sector plants (SINDRI, Nangal and Trombay) and is the largestfertilizer and the sixth largest industrial enterprise in India. FACTwas founded in 1947 as a mixed enterprise.
2/ The proportion varies in different States, but it has generally beenbetween 50% and 70% of production.
3/ Nitrogen (N), phosphorus (P205) and potash (K20).

-8-
less rapid--16.1% p.a.--and the level reached in 1973/74 was 1.83 milliontons, while consumption of P205 and K20 was 0.61 and 0.33 million tonsrespectively.
3.09 Starting from a low base, fertilizer production also increasedrapidly in the last two decades (by 16% per year) but failed to keep pacewith demand and imports have increased almost twenty-fold from 63,000 tonsof nutrients in 1953/54 to 1,220,000 tons in 1973/74. Production in 1973/74 was 1.07 million tons of N and 0.39 million tons of P205. All potassicfertilizers are imported, although some imported K20 is being incorporatedinto complex fertilizers made locally. During the last few years, the pro-nounced growth trends for consumption and production have somewhat lessenedas local plant capacity build-up was delayed, plants already completed failedto reach expected production levels, foreign exchange for imports was scarce,and imported fertilizers were increasingly more difficult to obtain or wereavailable only at rapidly increasing prices. All this has put a very heavyburden on India's balance of payments.
3.10 Present annual installed capacity to manufacture chemical fer-tilizers in India is 1.94 million tons of N and 0.57 million tons of P205(Annex 3-5). Capacity utilization of the nitrogenous fertilizer plantsaveraged only 67% in 1973/74, discounting figures for three plants whichhad either just started normal production or had not yet overcome initialproduction difficulties. - The reasons for this poor showing are many.Some--mainly power shortages and lack of foreign exchange needed for bal-ancing equipment and for operations--are not within the responsibility ofpresent plant management; others--including a good share of the responsi-bility to keep adequate stocks of spare parts and act forcefully to avoiddelays in reaching stable commercial production--are the result of poorplanninig, bureaucratic inflexibility in day-to-day operations and sometechnical shortcomings.
3.11 A great number of demand and consumption projections have beenmade in the past, but actual consumption has always fallen short of pre-dictions. The latest detailed study was a joint GOI-IBRD report preparedby li.B. Donde and Dorris Brown in 1971, which, on the basis of actual datathrough1 1968/69 forecast N demand to range between 2.4 and 2.9 millionTPY ly 1973/74 and betwieen 4.0 and 5.2 million TPY by 1978/79. The DraftFifthl Plan foresees a consumption of 5.2 million tons of N, 1.8 milliontons of P2 0 and 1.0 million tons of KI20 in 1978/79. Based on actual datatLrouglh 1971/74 and recent information supplied by Government officials,IFFCO and cooperative institutions, and taking into account possible lim-itations in areas under irrigation, multiple cropping and fertilizer sup-plies, probable Et consumption projections have been revised downwards (Annex3-5). These figures, together with past data, are summarized on the nextpage. The Governmnent is making efforts to narrow the gap between supply anddemand by increasing the output from existing plants and adding new capacity.Plants under construction or for which financing is being arranged will have
an incremental capacity of 2.9 million tons of N and 0.7 million tons of P 2 05.Expected production from these plants have been included in the projectionsshown below:

- 9 -
India - Fertilizer Consumption and Supplies(million nutrient tons)
Consumption _ Production Gap /1N P205 K20 N P205 N P205
1962/63 /2 0.35 0.08 0.04 0.19 0.09 0.19 0.011968/69 1.13 0.39 0.15 0.56 0.21 0.78 0.091969/70 1.36 0.42 0.21 0.73 0.22 0.57 0.091970/71 1.49 0.46 0.23 0.83 0.28 0.48 0.031971/72 1.75 0.56 0.30 0.95 0.29 0.46 0.241972/73 1.78 0.59 0.33 1.06 0.33 0.69 0.211973/74 1.84 0.61 0.33 1.07 0.39 0.67 0.221974/75 Estimate 2.20 0.75 0.40 1.43 0.40 0.77 0.35
Projection:
1978/79 Probable 4.31 1.57 0.78 3.72 1.14 0.59 0.431978/79 Low 3.89 1.41 0.70 3.28 0.84 0.61 0.57
1983/84 Probable 6.95 2.78 1.39 6.34 1.97 0.61 0.811083/84 Low 6.26 2.51 1.25 5.01 1.48 1.25 1.03
/1 Actual imports for 1962/63 to 1973/74. (Sums of actual production andimports do not add to consumption because of stock variations).
/2 Average for 3 years centered on 1962/63.
Under Indian agricultural conditions, an average nutrient ratio of 4:2:1for N:P205:K20 is considered desirable. At present this ratio is muchhigher in N, namely 5.5:1.8:1, but for the future a gradual improvement isforeseen. It is clear from the above that India's problem is not one ofa market unable to absorb domestic production, but of ability to supplyan ever-increasing demand.
D. IFFCO's MIarket Area
3.12 Since the two States which have the largest proportion in IFFCO'scooperative shareholdings, the Punjab and UP (each with 25%), are also thelargest potential consumers of fertilizers, IFFCO's marketing strategy willbe largely directed towards these two States. IFFCO should, in principle,supply fertilizers to its cooperative members approximately in proportionto their equity contribution. However, initially IFFCO plans to sell itsproducts in predetermined areas of seven States out of the ten with sharesin IFFCO: Punjab, UP, Haryana, Madhya Pradesh, Rajasthan, Gujarat andMaharashtra (Map: IBRD 11227). The following analysis of supply anddemand in IFFCO's marlceting area is limited to N fertilizers because

- 10 -
the gap between production and consumption of P 0 is expected to be pro-portionately wider than that for N in the near Suiure and therefore marketingof phosphate fertilizer would not present great difficulties. More detailsare given in Annex 3-6.
IFFCO Marketing AreaEstimated Supply and Demand in 1978/79
(million tons of N)
UP, Haryana M. Pradesh, RajasthanPunjab and Gujarat and Maharashtra Totals
Capacity /1 0.49 1.00 0.88 2.37
Production /1- "Probable" 0.28 0.83 0.43 1.54- "Low" 0.23 0.72 0.37 1.32
Consumption in IFFCO'smarket area:- "Probable" 0.29 1.28 0.39 1.96
- "Low" 0.27 1.22 0.33 1.82
Surplus (Deficit):- "Probable" (0.01) (0.45) 0.04 (0.42)- "Low" (0.04) (0.50) 0.04 (0.50)
/1 Capacity and production figures refer to the seven states in whichIFFCO's market area extends.
It can be seen that there will be not only an overall supply deficit inIFFCO's marketing area, but that such deficit is particularly pronouncedin the two States in which the Company's nitrogen fertilizer plants aregoing to be located (U.P. and Gujarat). Based on present plans the def-icit in the area will still persist in 1983/84. At that time probableconsumption there is expected to have increased to about 3.6 million tonsof N as against maximum production of about 3.3 million tons.
E. IFFCO's Marketing Efforts
3.13 IFFCO has pioneered in the promotion of balanced fertilizerapplication, suitable farming practices (including proper timing of fertil-izer application) and prior estimation of adequate dosages according tosoil test results, crops planted, availability of water and other culti-vation conditions. This promotion has been carried out by IFFCO through-out ten States by means of "seeding" programs, in the course of which ithas sold in the last three years more than 300,000 tons of fertilizerthrough a great number of sales points (some 4,632 at the end of 1972/73).

- 11 -
During these programs IFFCO has sought the cooperation of farmers willingto buy fertilizers in prescribed quantities 1/ and follow recommended farm-ing practices in "demonstration" plots.
3.14 To reach effectively as many farmers as possible, IFFCO hasrecognized that personnel at the sales points--whether run by the coopera-tive system, private dealers or public agencies--must be accessible toIFFCO as well as to the farmers. Therefore the Company has a trainingprogram for staff in credit cooperatives and cooperative banks. This inturn requires an active in-house training effort for the about 160 em-ployees in IFFCO's Marketing Division. Since 1970, the Company has hadmore than 30 training programs for salesmen, agronomists and marketingmanagers. In summary, therefore, IFFCO appears well prepared for themarketing of its output, and while the private and public sector plantsin its marketing area will offer healthy competition, there is no dangerof supply surpluses within the area.
F. Prices
3.15 Urea and other straight nitrogenous fertilizer prices are sta-tutorily controlled by the Government. Phosphatic and complex fertilizerprices are not subject to this control, but all phosphatic fertilizer man-ufacturers abide by the prices recommended by the Fertilizer Associationof India (FAI), which includes all the major Indian fertilizer manufac-turers. The retail price for urea, which had been kept within rathernarrow bounds since the mid-sixties has experienced two important in-creases within the last 12 months as shown below. The Government hasagreed that no actions will be taken precluding efficient fertilizer man-ufacturers from obtaining revenues enabling them to meet expenses, ser-vice debt and earn a reasonable return on invested capital. This policyhas been confirmed by the Government during negotiations.
India - Development of Selected Fertilizer Retail Prices(in Rs/MT)
Ammonium NPK DAPUrea Sulphate 15-15-15 18-46
April 1967 840 492 870 1,095March 1972 959 549 912 1,335October 1973 1,050 600 1,130 1,475May 1974 2,000 925 2,900 3,005
1/ IFFCO, unlike other manufacturers, has insisted that farmers pay for thefertilizers used in their "demonstration" plots.

- 12 -
3.16 Part of the increase approved in May 1974 will compensate the manu-facturers for higher feedstock costs and part will be used to subsidize im-ports, so as to minimize the Government's losses in importing fertilizer forwhich prices have been repidly increasing since last year (Annex 3-7). Thestructure of the present urea pricing system as applied to the Phulpur plantis as follows:
India - Structure of Urea Price(in Rs/MT)
Price to farmer 2,000Deposited with GOI for price equalization 610
Retained by manufacturer 1,390Less distribution margin 80Less freight 44Less excise tax 166
Net average Phulpur ex-factory price 1,100
Although detailed analyses are not yet available, preliminary indications arethat the benefit/cost ratios justifying generally recommended fertilizerdosages have not been affected negatively by the recent changes in the pricesof fertilizers and most crops.
IV. THE PHULPUR PROJECT
A. Project Location
4.01 Bearing in mind that markets and shareholders for the project willbe largely concentrated ia the Punjab and UP, an intensive search for asuitable location was made in these States by IFFCO. A site close to Phulpurand near Allahabad (Map: IBRD 11228) was selected and the choice appears tobe an excellent one. A broad-gauge railroad runs by the northern side ofthe site and is part of the Allahabad to Jaunpur line. A meter-gauge rail-road and also the Grand Trunk Road which both connect Allahabad with Varanasiand other important cities are 15 km to the south. The site's southernboundary is the Allahabad-Shahganj road. Thus, ability to bring in heavyequipment, feedstock (heavy fuel oil), coal and labor, as well as to trans-port the bagged (or bulk) urea is reasonably assured. Furthermore, many ofthe marketing areas in northern UP and neighboring States are accessible onlyby meter-gauge track. Therefore a substantial amount of urea will be movedby the meter-gauge network, thus reducing costs of trans-shipment and theincidence of damaged bags and-material losses. Also, the substantial addi-tional rail freight load can be shared between the two rail systems.

- 13 -
4.02 The project's external power requirements are not expected to ex-ceed 3 MVA, or about 20% of needs. Nevertheless, the site is near a 33 KV,10 MVA power line, which will be enlarged to provide secure emergency suppliesas well as construction needs. The area has good ground water sources andthe proximity of lakes plus the Ganges river provides supplementary suppliesif needed. The topography allows natural drainage and except for heavy equip-ment no piling is believed necessary. The area is not in a seismic zone andits meteorological data are given in Annex 4-1. Arrangements have been madeto purchase the required 200 ha or so for the plant site, mostly consistingof barren rural land. A condition of effectiveness of the Loan is that IFFCOtakes possession of this area. Telephone and telegraph services exist atPhulpur and telex and airline facilities at Allahabad. Ample labor is avail-able in the surrounding towns and villages.
B. Project Scope
4.03 As no major natural gas reserves have yet been found in India andlong-term additional naphtha supplies at prices low enough for fertilizerproduction are unlikely to be available, the Government is encouraging theuse of heavy fuel oil as a feedstock for ammonia production, plus coal forthe generation of steam and power. The first plant in India using thesefuels is already under construction at Nangal (FCI) and more installationsof this type are either ready for construction or planned (Sindri, Trombay V,Delhi Cloth Mills, Bathinda). The proposed Phulpur ammonia unit will closelyresemble the Nangal plant, both as to scope and design.
4.04 IFFCO plans to convert all of the ammonia to be produced at Phulpurin its 900 TPD (297,000 TPY) ammonia unit into prilled urea, as none will beneeded for other purposes and ample by-product carbon dioxide will be avail-able from the gas-producing section. The ammonia will be fed to a 1,500 TPD(495,000 TPY) urea unit, which will add an equivalent of 228,000 TPY of N toIndia's fertilizer capacity. At first all of the output will be packed inplastic lined jute bags to be purchased in the country but, if opportune,some urea may be bulk-shipped and other types of packaging may be used in thefuture. The project will include all necessary offsites such as railroadsidings, oil and coal storage and handling, ash disposal, water and effluenttreatment, cooling towers, product storage and shipping, maintenance shops,offices and personnel facilities. The envisaged plant layout is shown inAnnex 4-2.
C. Feedstocks and Other Needs
4.05 lieavy fuel oil will be brought from existing domestic refineries(primarily the one at Barauni, some 200 km away), the planned one at Mathura,in UP south of Delhi (at a distance of about 500 km), or be imported; annualconsumption will be of up to 250,000 tons. Representative chemical and physi-cal specifications and price data are given in Annex 4-3. The project's annualcoal requirements of about 400,000 tons will be moved by rail from mines inBihar and Madhya Pradesh, over a mean distance of some 400 km. Main speci-fications and typical price data for coal, power and water are shown in

- 14 -
Annex 4-4 and requirements of raw materials, utilities and other needs inAnnex 4-5. Methanol needed for gas purification and chemicals for watertreatment are available from Indian producers, as are jute bags and plasticliners.
4.06 IFFCO has agreed to enter, by December 31, 1975 into long-term con-tracts for the provision of the required supplies of heavy fuel-oil, coal andpower. The Government has assured the Bank that arrangements will be madefor the adequate supply of all materials required to operate the project atfull capacity, and promised to send letters, not later than the end of thepresent year, to the supplying agencies (Barauni refinery, the UP StateElectricity Board and coal mines). The Government has also agreed to takeall steps necessary to ensure that a sufficient number of railway cars areavailable for the transportation of raw materials and products.
D. Technology
4.07 For ammonia plants using heavy fuel oil feedstocks, experiencedlicensors for the fuel oil partial oxidation process are Shell (Holland) andTexaco (USA). Additionally, purification of the snythesis gas produced fromheavy fuel oil is most efficiently achieved by absorption type processes.For this project, sulfur and carbon dioxide removal together with carbonmonoxide conversion using the technology offered by Lurgi (F. R. Germany) isproposed.
4.08 Processes for air separation, nitrogen wash, ammonia and urea syn-theses are more widely available. Accordingly, invitations on an internationalbasis are being sent to several major engineering firms who have appropriateexperience in building large ammonia and urea plants in conjunction with theabove licensed technologies. Evaluations and selections will be made on thebasis of technical competence as well as optimum capital and discounted operat-ing costs, technical preferences, completion times and successful experience.
4.09 The ammonia plant will be a single-train installation using threepartial oxidation units and one air-separation unit. The urea plant willbe of single-train design, using one prill tower. All technology and equip-ment for these plants as well as for ancillary units and offsites will be ofproven design and construction. The proposed processes are described inmore detail in Annex 4-5 and a material flowsheet is shown in Annex 4-6.
E. Ecology
4.10 IFFCO has agreed to take all measures necessary to ensure that theammonia and urea plants plus their offsites will be designed and operatedaccording to environmental and safety standards approved by the Bank. About7,000 TPY of sulfur will be released from the heavy oil feedstock; this willbe recovered as elemental sulfur and sold. Carbon produced in the partialoxidation units will be continuously collected and used along with coal toproduce steam. Process water contaminated with methanol and other compoundsfrom the gas purification process as well as by urea plant wash-down water,

- 15 -
will be sent to an effluent-treatment unit prior to disposal. Urea dust fromthe prilling tower will be reduced to very low proportions by suitable arres-tors, to minimize product loss as well as air pollution. Coal ash, amountingto some .400 TPD will be disposed of in local ravines and some may possiblybe used locally to produce building materials. More details on environmentalprotection are given in Annex 4-7.
F. Employment, Training and Social Aspects
4.11 The project will provide employment for some 600 people, as shownin Annex 4-8. Many of these will be drawn from the town of Phulpur andnearby villages. Senior new production and maintenance staff will be giventraining in the IFFCO ammonia/urea plant at Kalol and elsewhere, prior tostart-up. They will be supplemented by experienced Kalol people during plantcommissioning and initial production stages. New technicians will be giventraining on the site during construction and start-up by IFFCO and contractors'personnel. The Company has already established an extensive training programfor its personnel at Kandla and Kalol.
4.12 The project will provide other benefits besides an annual additionof about 230,000 tons of N to India's fertilizer production. It will be aboon to the Phulpur area by creating many new direct and indirect jobs.Being a cooperative, IFFCO is very conscious of its social role. Ithas in the past, and will continue, to assist local communities and coopera-tives in many ways and mainly through training in industrial skills, marketingand improved farming methods. Constructing the project will employ for aboutfour years some 2,000 skilled and unskilled people drawn from the local areaand other parts of India. In addition, an estimated US$40 million worth ofequipment made by Indian manufacturers is likely to be purchased, provideddelivery times permit it.
G. Project Execution and Operation
4.13 IFFCO's plants at Kalol and Kandla have been constructed under theoverall management of the Company's project group. Close adherence toschedules in these projects indicates the IFFCO project team has provencompetent, with the assistance of a few experienced expatriates and in con-junction with major engineering firms, to manage the construction of a largefertilizer plant (para. 2.06).
4.14 IFFCO proposes to undertake the Phulpur project with the assistanceof engineering firms, of which two would be foreign having the necessaryexperience in urea and in ammonia based on fuel oil feedstock (para. 4.08)and the others would be Indian firms in charge of design and engineering foroffsites. The engineering firms would be coordinated and managed by a ProjectImplementation Unit within IFFCO (Annex 4-9), to be staffed essentially withthe Kalol and Kandla project groups after the start-up of these plants. How-ever, availability of this personnel could be delayed and, more importantly,they will have experience in a gas and naphtha-based ammonia plant, but not

- 16 -
in the more complex technology used in fuel oil-based plants. IFFCO hastherefore agreed to engage the services of qualified technical advisors assoon as IFFCO or the Bank deem such services necessary for the timely andefficient execution of the project.
4.15 The starting date for the construction of the Phulpur project isJanuary 1, 1975, when all necessary financial agreements are expected to havebeen reached. However, in view of the high costs of any delays in the pre-sent tight market for fertilizer plant equipment, some advanced contractingfor engineering services and process licensing, and placing orders for somelonglead items of equipment are envisaged. Under these conditions, start-upby August 1978 is anticipated. This timing will be reviewed with the engin-eering firms scheduled to be selected in November 1974, who, with IFFCO, willdevelop detailed critical path networks covering all aspects of the project.A preliminary overall schedule is shown in Annex 4-10. To ensure that sched-ules can be fulfilled, the Government has agreed to process and issue promptlyall import licenses, make available the foreign exchange and allocate locallyproduced materials as needed for the execution of the project.
4.16 The selected engineering firms will agree to furnish IFFCO withcomplete design and purchasing data within specified periods. Failure tomeet these deadlines will subject the firms to penalty payments. Plant per-formance guarantees in terms of capacity, product quality, and feedstockand utility requirements will be obtained from each process licensor andengineering firm. Inability to meet these guarantees will trigger penalties,unless effective corrections are made in the field without cost to IFFCO.It is planned to use experienced Indian contractors to undertake civilengineering design and construction, under the overall supervision and coordi-nation of the IFFCO Project Implementation Unit. Plant erection will alsobe undertaken by Indian contractors under the supervision of the firms chosento supply process and design engineering. Requirements for the movement ofsome heavy equipment are described in Annex 4-11.
4.17 Project operation during commissioning and initial production willbe undertaken by trained Indian staff under the supervision of IFFCO seniorpersonnel on loan from the Kalol plant working in conjunction with special-ists from the ammonia and urea plant licensors and engineers. Thereafter,should it not be possible to build up production as now envisaged or maintainit, IFFCO has agreed to secure the outside expertise needed to overcome suchoperational difficulties. When full-scale production has been attained, plantoperations and management will be integrated within the IFFCO corporatestructure as shown in Annex 4-12.

- 17 -
V. CAPITAL COST ESTIMATE AND FINANCING PLAN
A. Capital Costs
5.01 The total cost of the project is estimated at US$220.5 (Rs 1,655)million of wlhich US$107.3 (Rs 805) million is foreign exchange. The estimateis summarized below and shown in detail in Annex 5-1. The estimate is basedon present prices, whicli have been arrived at in consultation withi generalcontractors currently building similar factories in India and elsewhere.Physical contingencies have been estimated at about 10% of the base estimatedproject cost. Provisions for price escalation are based on the end-of-1974cost estimate including phlysical contingencies and projected price escalationrates of 11'a during 1975 and 7.5%a annually thereafter for equipment andforeign exchange costs and 10% and 8% respectively for civil works and otherlocal currency costs. Derivation of the escalation factors is shown inAnnex 5-2.
Summary of Capital Cost Estimates
in Rs million in US$ millionForeign Local Foreign LocalExchange Currency Total Exchange Currency Total %
Land Acouisition, SiteDevelopment and Township 4 23 27 o.6 3.1 3.7 2.6
Equipment, Supplies & Spares 380 210 590 50.6 28.1 78.7 56.6Freight, Insurance, Handlingand Duties 20 146 166 2.7 19.4 22.1 15.9
Licenses and Engineering 72 11 83 9.6 1.5 11.1 8.0Erection and Supervision 22 40 62 2.9 5.4 8.3 6.oCivil Works 13 52 65 1.7 7.0 8.7 6.2Project Management Services 11 19 30 1.5 2.5 4.0 2.9Pre-operating Expenses - 19 19 - 2.5 2.5 1.8Base Cost Estimate (BCE) 522 520 1,042 69.6 69.5 139.1 100.0
Physical Contingencies(10% of BCE) 53 53 106 7.0 7.0 14.0 10
Price Escalation (18.4% ofBCE plus physical contin- 106 105 211 14.1 14.0 28.1 20.2gencies)]
Installed Cost 681 678 1,359 90.7 90.5 181.2 130.2Working Capital - 98 98 - 13.0 13.0 9.3Expected Project Cost 681 776 1,457 90.7 103.5 194.2 139a5
Interest during Construction 125 73 198 16.6 9.7 26.3 -
Total Financing Required 806 849 1,655 107.3 113.2 220.5 -
1/ 18.5% on all the equipment and foreign exchange costs, and 18.0% onCivil Works and other local costs.

- 18 -
5.02 The initial working capital is estimated at about US$13.0 (Rs 98)million, all in local currency (Annex 5-3). The interest during constructionfor the project has been estimated at US$26.3 (Rs 197) million in Annex 5-4and is based on the disbursement schedule shown in Annex 5-5 and a 10-1/4,interest rate on all loans, i.e. those from the Bank and Industrial Develop-ment Bank of India (IDBI) as well as the subordinated loan (quasi-equity)from the Government.
B. Financing Plan
5.03 The proposed financing plan for the project is as follows:
Financing Plan-------- million Rs ------ …- -------- million US$…Foreign Local Foreign Local % oExchange Currency Total Exchange Currency Total Tot
EquityCooperatives - 220 220 - 29.2 29.2 13GOI 360 360 - 48.0 48.0 21
Sub-total - 580 580 - 77.2 77.2 35
Subordinated DebtGOI - 83 83 - 11.0 11.0 5
Long-Term DebtIBRD 817 - 817 109.0 - 109.0 49,IDBI _ 175 175 23.3 23.3 10.
Sub-total 817 175 992 109.0 23.3 132.3 60
TOTAL FINANCING 817 838 1.655 109.0 111.5 220.5 100.
5.04 The Bank has stressed its support of maintaining the participationof the cooperative institutions in IFFCO's equity as high as possible. TheBank has therefore agreed to permit the Government's equity contribution tobe reduced by an amount equal to the Company's internal resources that--al-though not counted upon in the above financing plan--could be made availableby IFFCO during project implementation provided that all the financial covenantsagreed upon (para. 6.09) are kept. However, since, on the other hand, thecollection of funds from a large number of cooperatives towards their equitycontribution may not proceed in step with the project's requirements, a backupguarantee has been obtained from the Government to make promptly available toIFFCO any difference between the expected and the actual equity contributionmade by cooperative institutions.
5.05 The proposed IBRD loan to IFFCO will be guaranteed by the Govern-ment and is assumed to be for 16 years (starting December 1974) including

- 19 -
5 years of grace at an assumed annual interest rate of 8% plus a 2-1/4%
guarantee fee payable to the Government. The other long-term loans (from
the Government and IDBI) are assumed to be made to IFFCO at 10-1/4% interest
rate and for a term of 15 years including a 5 year grace period, except that
the subordinated loan from the Government will only be repaid -- both as
regards interest and principal -- to the extent that after such payments theCompany can meet a minimum current ratio test, as discussed further below(paras 6.04 and 6.10). The prompt availability of these loans has been con-
firmed during negotiations. Under these assumptions and considering the
subordinated debt as quasi-equity, the project will be financed 60% by debt
and 40% by equity.
5.06 Should there be any cost overrun on the project and IFFCO be unable
to provide the necessary funds when needed and in a form satisfactory to the
Bank, it will be the responsibility of the Government to make any shortfall
available to IFFCO whether in local or foreign currency.
C. Procurement and Disbursement
5.07 International competitive bidding procedures in accordance with
Bank Guidelines will be used for equipment and materials estimated to cost
about US$66 million. Proprietary equipment essential to the process and
items in limited supply, which are critical to the timely completion of the
project and which are estimated to cost about US$8 million, may be procured
following bidding from restricted lists of qualified suppliers, with prior
approval of the Bank. Small items, costing less than US$50,000 equivalent,
with a total estimated cost of about US$2 million, may be purchased from
manufacturers and local representatives of foreign suppliers on the basis
of suitability, availability and price considerations following approval by
the Bank of the list of items involved. A preference of 15% or the customs
duty, whichever is lower, will be allowed to Indian manufacturers for the
purDose of evaluating international competitive bids. Bid evaluation will
be IFFCO's responsibility with the assistance, as required, from the engineering
firms to be contracted (para 4.08). The short-lists of prequalified suppliers
for long-lead items as well as thieir names of engineering firms (para 4.08and 4.14) and the terms of their contracts will be subject to prior Bankapproval. To expedite deliveries in a tight equipment supply position,
IFFCO will send its own procurement officers to the consultants' or to
potential suppliers' main offices.
5.08 Of the total estimated cost of about US$10n million for equipment and
materials, it is estimated that, following Bank guidelines, about US$61 million
will be imported and about US$15 million would be won through international com-'
petitive bidding by local suppliers. The balance of about US$25 million would
be procured locally and not financed from the proceeds of the Bank loan.
D. Allocation and Disbursement of IBRD Loan
5.09 The proceeds of the IBRD loan will cover the estimated cost ofinternationally bid equipment and spares, including the estimated value of

- 20 -
local equipment contracts awarded after such international bidding, pro-perietory or long-lead items procured, with prior approval of the Bank, fromselected bidders, and the foreign exchange cost of licenses, engineeringand technical services, as well as interest during construction on the Bankloan. Expected price escalation has been included in the allocated cate-gories of the loan as shown below.
Allocation of IBRD Loan(US$ million)
Equipment, Freight, Supplies and Spares 67.3Licenses and Engineering 11.4Project Management, Erection and Supervision 5.2Interest during Construction 16.6Unallocated (physical contingencies) 8.5
109.0
5.10 Quarterly disbursement forecasts for the Bank loan are containedin section C of Annex 5-5.
VI. FINANCIAL ANALYSIS
A. Analysis of the Project
6.01 The financial analysis of the project is based on a projectionextending from the expected start of commercial operations, in September1978, to the end of 1990. with the plant depreciated over the same periodof abou-t 12 years on a straight line basis (Annex 6-1) and production build-ing up from 60% capacity utilization through December 1979 to 90% in 1981.Operating costs and urea sales have been based on estimated end-of-1974prices escalated through mid-1978 assuming annual domestic inflation ratesof 12% during 1975, 8% during 1976 and 6% afterwards. 1/ As noted earlier,the Government controls ex-factory and retail prices for urea as well asthe prices for coal and heavy fuel oil. The appraisal assumes that, in linewith a recent general policy decision, confirmed during negotiations, theGovernment will allow prices for urea to rise with feedstock, coal and othercosts, leaving prices in real terms unchanged, and leading to 1978 ex-factoryprices of Rs 1,450 (US$193) per ton of urea and Rs 561 (US$75) per ton ofheavy fuel oil.
1/ These rates which yield a compound factor of 1.32 for the periodconsidered, are consistent with country economic projections.

- 21 -
6.02 The production cost structure of the project, in 1978 prices, isshown in Annex 6-2 and summarized below, for a 90% capacity utilization.
Cost per Ton of Urea (Bagged)
Project Production Costs (1978 Prices)Unit per Ton Annual
US$ Rs US$ RsMillion Million
Fuel Oil 38.40 288 17.09 128.2Coal 12.00 90 5.37 40.3Bags 15.87 119 7.07 53.0
Other Variable Costs 6.00 45 2.69 20.2
Sub-total Variable Costs 72.27 542 32.23 241.7
Fixed Costs except Depreciation 16.93 127 7.53 56.5Depreciation 36.53 274 16.28 122.1
Total Cost 125.73 943 56.04 420.3
6.03 The long-term debt service schedule for the project is shown inAnnex 6-3. The project's forecast financial statements through 1990 andthe major assumptions used are contained in Annex 6-4. A summary of theinitial five years (1978-1982) is shown on the following page.
6.04 Forecast financial statements show that, if the project performsas expected, the results will be satisfactory. Considering subordinateddebt as equity, debt service coverage 1/ would be at least 1.7, the currentratio 1.5:1.0 or higher, and the debt:equity ratio, which is projected to be61:39 at the end of 1978, would rapidly improve thereafter. In fact, theproject would generate enough cash to enable repayment of tile subordinateddebt in 10 years as shown in Annex 6-3, while at the same time maintaining atotal debt service coverage 2/ of not iess than 1.6 (except for the firstfew nonths of operation) and meeting all other financial covenants. There-fore, the financial forecasts indicate that all debt service including that
on subordinated debt can be met by the project.
6.05 The breakeven charts for the project are shown in Annex 6-5. Exceptfor the initial months of operations less than 64% and 53% capacity utiliza-tion are required for the plant to breakeven on a profit and a cash basisrespectively.
1/ Excluding the debt service on subordinated debt.
2/ Including the debt service on subordinated debt.

- 22 -
Summary Financial Forecast for the Project(Rs million) ]/
Year Ending December 31 1978 / 1979 1980 1981 1982
Capacity Utilization (%) 60 60 80 90 90
Income Statement and Cash FlowFertilizer Sales 78 431 574 646 646Cost of Sales (Net) / 69 338 391 418 418Interest Charges Y 37 110 107 99 91Income Taxes (55%) - - 16 71 75Net Profit (Loss) (28) (18) 60 58 62Depreciation 41 122 122 122 122Operating Cash Flow 50 215 289 279 275Debt Service Ž1 34 102 165 162 159Total Debt Service Y 37 110 181 178 174
Balance SheetCurrent Assets 132 145 151 158 165Cumulative Cash / - 91 193 288 382Net Fixed Assets and Spares 1,516 1,394 1,271 1,149 1,027Current Liabilities / 22 97 101 105 110Long-Term Debt 992 926 856 781 702Quasi Equity (subordinated debt) 82 74 66 58 50Equity 551 533 593 651 712Total Assets or Liabilities 1,648 1,630 1,615 1,594 1,573
RatiosDebt Service Coverage 1.5 2.1 1.7 1.7 1.7Total Debt Service Covs:,ageY 1.3 1.9 1.6 1.6 1.6Current Ratio 6. o 1.5 1.5 1.5 1.5Debt Equity Ratio / 61:39 60:40 56:44 52:48 48:52Net Profit/Sales (%) (36) (4) 10 9 10
In 1978 prices. Last digit discrepancies are due to roundingE Four months of operation onlyT Cost of sales (Annex 6-4) less sales of by-product sulfur
Including interest charges on subordinated debtNet income after taxes plus depreciation and interest charges on all debt
7/Excluding debt service on subordinated debtB Including debt service on subordinated debtv Funds not required for working capital
Including current portion of the subordinated long-term debtSubordinated debt included in equity.

- 23 -
B. Financial Rate of Return and Sensitivity Analysis
6.06 For purposes of calculating the financial rate of return of theproject, capital costs are converted to constant 1978 rupees (Annexes 6-6and 6-7) and the cost and benefit streams are shown in Annex 6-8. The returnis 10.3%, after taxes or 13.9%1' before taxes. Several factors contribute tothis relatively low return: high capital costs reflecting the sharp priceescalations recently experienced and expected during project implementationas wzell as the absence of existing infrastructure at the project site; theneed to lengthen the construction period on account of tight equipmentsupplies: and tile high income tax rate of 55%, which depresses the aftertax rate of return by about 3.6 percentage points.
6.07 Sensitivitv tests are shonm in Annex 6-9 and summarized below forthe base case ex-factory price of Rs 1,450 (US$193) per ton of urea in 1978prices, corresponding to a 1974 price of Rs 1,100 per ton (para 3.16). Therate of return is also shown for ex-factory prices 10% above and below thebase case price (As 1,595 and 1,305 per ton respectively). 'l'hese pricesare in line wit,] estinated long-term economic prices (para 7.02) and con-siderably below current world prices.
Financial Rate of Return (%)
Ex-factory Urea Price, Rs/ton 1,305 1,450 I 9,US$/ton 174 193 21K
(a) Base Case 8.5 10.3 11.9(h) Base Case before Taxes 10.7 13.9 16.8(c) Operating Cost up 10% 7.6 9.5 11.2(d) Operating Cost down 10% 9.4 11.1 12.7(e) Slower Capacity Build-up 7.6 9.3 10.8(f) One-year delay in Construction 8.0 9.6 11.0(g) 10%0 Cost Overrun 7.6 9.2 10.3(1h) 10% Cost Overrun and One-Year Delay in
Construction 7.1 8.6 10.0
C. Consolidated Forecasts for IFFCO
6.08 As mentioned before, the financial forecasts for the project aremore than adequate. The Bank loan, lhowever, will be made to IFFCO and notto the Pnulpur Project Unit. IFFCO's existing plants are expected to showvery satisfactory profitability and liquidity by the time the Phulpur plantbegins operations. Therefore, the consolidated income and cash flow pro-jections for the existing and the new facilities--shown in detail in Annex 6-10and summarized below--are also very favorable. Debt service coverage (exclud-ing subordinated debt) will be 2.2 or better and total debt service coverage(including subordinated debt), at least 1.9. Since all financial covenantscan be met, the consolidated financial forecasts include annual payments onboth the existing and the new subordinated debt to the Government beginningin 1977 and 1980 respectively and both are expected to be fully repaid by theend of 1989.

- 24 -
Summary of Projected Consolidated Financial Statementsj/(Rs million)
Year Ending December 31 1978 1979 1980 1981 1982
Capacity Utilization (%)Project (Phulpur) 60 60 80 90 90Kalol Unit 90 90 90 90 90Kandla Unit 80 90 90 90 90
Income Statement and Cash Flow (1978 Prices)Sales 1,466 1,919 2,063 2,135 2,135Cost of Sales (Net) 1,067 1,423 1,476 1,503 1,503Interest Charges ?i 95 161 146 133 121Profit before Taxes 304 336 441 499 511Income Taxes (55%) 167 184 243 274 281Net Income (Loss) after Taxes 137 151 198 224 230Depreciation 109 191 191 191 191Operating Cash Flow j 343 503 535 549 542Debt Service 4/ 101 183 246 239 232Total Debt Service -/ 121 208 278 270 261
Balance SheetCurrent Assets 397 397 397 398 404Cumulative Cash:(a) Available for Investment 450 733 977 1,2 1,(b) Available for Distribution W 28 39 53 69 85Net Fixed Assets and Spares 2,150 1,960 1,769 1,578 1,387Current Liabilities 7/& 146 231 235 240 244Long-Term Debt 1,441 1,327 1,208 1,085 958Quasi Equity 169 149 131 114 96Equity 1,271 1,423 1,620 1,845 2,075Total Assets ow Liabilitiss 3,025 3,129 3,195 3,283 3,373
RatiosDebt Service Coverage 3.4 2.7 2.2 2.3 2.3Total Debt Service Coverage 2.8 2.4 1.9 2.0 2.0Current Ratio 2.7 1.7 1.7 1.7 1.6Debt Equity Ratio / 50:50 46:64 41:59 35:65 30:70
j/ Last digit discrepancies due to rounding2 Interest charges on all debt, including subordinated debt
Net income after taxes plus depreciation and interest charges/ Excluding debt service on subordinated debtJ/ Including debt service on subordinated debtP/ Limited to 7% of net income'T Current portion of regular and subordinated debt includedvK Subordinated debt included in equity.

- 25 -
D. Financial Covenants
6.09 The estimated consolidated financial position of IFFCO by the timethe project commences commercial operation appears satisfactory. To ensurethat the project, and IFFCO in general, will operate in a financially satis-factory manner, the following covenants have been agreed upon by IFF0O:
(a) The project will be operated as a separate profit centerwith its own income, cashflow and balance sheet accountsfor control purposes;
(b) The project entity will maintain a current ratio of atleast 1.5:1.0 and IFFCO will maintain for itself a currentratio of not less than 1.1:1.0 through December 31, 1976,and of not less than 1.5:1.0 afterwards;
(c) Additional investments in fixed assets in excess of US$3million per year will be subject to prior Bank approval;
(d) IFFCO will take all necessary actions not to exceed a debt:equity ratio of 60:40 including the subordinated debt asequity;
(e) IFFCO will not incur any additional debt, if by so doingit could not maintain a debt service coverage of at least1.4 in any of the succeeding fiscal years;
(f) No dividend distribution nor debt service payments forinterest, principal or both on the subordinated debt willbe paid by IFFCO unless such payments are covered by currentearnings and subject to maintaining a current ratio of atleast 1.5 after such payments; and
(g) Completion date for the project will be understood tomean the date on which the facilities included in theproject have been tested and proven to be satisfactory inaccordance with sound engineering procedures and practicesand have maintained daily production averaging 80% of fullcapacity for a period of at least 60 consecutive days.
E. Major Risks
6.10 The project capital cost estimate includes US$28 million for priceescalation. This provision should be adequate but in the present strongsellers' market and under unprecedented inflation pressure in India, a priceescalation beyond that provided for cannot be ruled out. The project isbased on a conservative time schedule and the capital cost estimate providesfor project management assistance, which, combined with IFFCO's projectimplementation experience, should reduce risks in the project execution andoperation. However, unexpected delays in equipment deliveries from heavilybooked suppliers and inadequate fuel oil and coal supplies could also affect

- 26 -
the project. On the other hand, the financial position of IFFCO as a wholeis protected by the cash flow of its two existing plants which are nowmechanically complete and are expected to start production in a few weeks.
VII. ECONOMIC ANALYSIS
A. World Fertilizer Prices
7.01 During the late 1960's, world fertilizer prices were low becausethere was excess supply and investments in fertilizer plants were modest.Consequently, when demand grew rapidly during 1970-1973, it was not matchedwith increased supply and prices have increased sharply, partly due toscarcity and partly due to increases in hydrocarbon and phosphate rock prices,the major raw materials for fertilizer production. Freight charges, whichalso constitute a major portion of imported fertilizer costs, have also in-creased. The present worldwide fertilizer shortage and high prices, compoundedby India's continuing foreign exchange scarcity, have made it difficult forthe country to rely on imports to a major extent to meet the growing domesticdemand.
B. Economic Rate of Return
7.02 The capital costs, production costs and the ex-factory prices ofurea are all expressed in terms of constant 1978 rupees in the economicanalysis. Capital costs are converted to constant 1978 rupees in Annex 6-6.Except for fuel oil prices, the economic cost of all other production inputsare based on their financial costs, adjusted for taxes as shown in Annex 7-1.The economic prices of urea and of fuel oil are derived in Annex 7-2 based ona recent Bank report 1/ which estimates the fob (Middle East) price of ureain 1978 at US$145 per ton, bagged. Ocean freight cost and port handlingcharges of US$30 per ton and internal freight and handling costs of US$10per ton are added to the fob price to arrive at the ex-factory economicprice of US$185 per ton. The economic analysis assumes that the 1978-1990economic price of urea will remain at the 1978 level in terms of constant1978 dollars. The economic price of fuel oil during the period 1978-1990is estimated at US$65 per ton, equivalent to an fob price of US$10.9 perbarrel of crude oil, both in constant 1978 dollars, as calculated in Annex7-2. The economic cost and benefit streams are shown in Annex 7-3.
7.03 The economic rate of return for the project is 16.2%. Sensitivitytests (Annex 7-4) are summarized below for the base economic price of US$185per ton of urea and prices above (US$205) and below (US$165) this base.The economic return is higher than the financial return mainly due to theelimination of duties and income taxes (55%).
1/ Bank Report No. 467, Price Forecasts for Major Primary Commodities,June 19, 1974.

- 27 -
Economic Rate of Return, %
Economic Price of Urea, US$/Ton 165 185 205
(a) Base Case 12.6 16.2 19.4(b) Production Costs up 10% 11.0 14.8 18.2(c) Production Costs down 10% 14.2 17.6 20.6(d) Slower Capacity Build-Up /1 10.8 14.2 17.0(e) One Year Delay in Construction 11.6 15.0 17.8(f) 10% Cost Overrun 11.2 14.6 17.6(g) One Year Delay in Construction and
10% Cost Overrun 10.4 13.4 16.2
/1 Capacity utilization: Initial 16 months - 50%; Year 3 - 60%Year 4 - 70%; Year 5 - 80%; 90% thereafter.
7.04 The above table indicates that the rate of return is sensitive tothe economic price of urea. A US$20 change in the economic price of ureacauses an opposite change of about 3.4 percentage points in the rate of return.A 10% cost overrun reduces the return by 1.4-1.8 percentage points, while a10% variation in the production costs (equivalent to a 24.2% change in thefuel oil price if all the other production costs are unchanged) yields anopposite variation of 1.4 percentage points in the rate of return for thecase in which the economic price of urea is assumed to be US$185/ton. Thus,except for a drastic reduction in the economic price of urea -- which isunlikely -- the economic rate of return is satisfactory even under moderatelyadverse conditions.
C. Domestic Fertilizer Supply and Food Production
7.05 The project would increase the domestic fertilizer capacity by495,000 TPY of urea or 228,000 TPY of plant nutrient. Based on a 90%capacity utilization, the project's output could help increase foodgrainproduction in the country by about 1.1 million TPY.
D. Direct Foreign Exchange Savings
7.06 The project will make it possible for India to avoid importing ureaworth about US$76 million annually. After deducting the foreign exchangecomponent of the economic production costs, including all fuel oil (Annex7-1), the gross annual direct foreign exchange savings, based on 90% capacityutilization, is about US$59.5 million (in 1978 dollars) or about 50% of theestimated foreign exchange cost (in 1978 dollars) of the project includinginterest during construction.
E. Other Benefits
7.07 The project's market area presently gets a large proportion ofits fertilizer supply from distant factories and, hence considerable cross-country transport is required. These freight services would be reduced,

- 28 -
thus making the fertilizers more easily available to IFFCO's cooperativemembers in addition to contributing to lower transport costs.
VIII. AGREEMENTS
8.01 Assurances and agreements were obtained from the Government andIFFCO as follows:
A. From the Government that it will:
(1) Subordinate the current IFFCO debt to the Government deferringpayment of principal and/or interest unless such payments canbe made out of current earnings without lowering the currentratio below 1.5:1 (para 2.08);
(2) Cause IFFCO to have all liens existing on its assets as securityfor any debt vacated by June 30, 1975 (para. 2.11);
(3) Not take any action which would preclude efficient fertilizermanufacturers from meeting all their expenses and servicing debtout of earnings and from earning a reasonable return on investedcapital (para 3.15);
(4) Mtake arrangements satisfactory to the Bank that adequate sup-plies of inputs be made available for the efficient operationof the project (paras 4.02 and 4.06);
(5) Take all steps needed to ensure that an adequate number of railroadtank cars and wagons is available for the normal operation of theproject (para 4.06);
(6) Take all necessary steps - including issuing import licenses andallocating foreign exchange, and allocating locally producedmaterials which are subject to allocation - needed to execute theproject according to schedule (para 4.15);
(7) Provide equity and long-term financing as defined in the financialplan and cover any shortfall in the capital subscription of thecooperatives (paras 5.03 and 5.04);
(8) Make available to IFFCO any difference between the loan fundsconsidered in the financing plan and the actual amountcontracted by IFFCO from IDBI and other financial institutions(para 5.05);

- 29 -
(9) Guarantee the loan to IFFCO and subordinate the additional IFFCOdebt to the Government in the amount needed to maintain con-sistently the debt-equity ratio above 60:40 and to acceptdeferral of dividends or payment of interest and/or principalon such subordinated debt unless such distribution or paymentcan be made out of current earnings and without decreasingthe current ratio below 1.5:1.0 (para. 5.05); and
(10) Provide the financing of cost overruns in a form satisfactoryto the Bank (para 5.06) as required for the prompt completionof the project as defined in para 6.09 (g).
B. From IFFCO that it will:
(1) Consult with the Bank prior to appointing a successor to anyvacancy in the position of a full time Director or changingthe Phulpur Project Manager (paras 2.03 and 4.14);
(2) Submit quarterly and annual production, income and cash flowreports, balance sheets, cash flow projections and other reportsas agreed with the Bank (para. 2.10);
(3) Have all liens existing on its assets as security for any debtvacated by June 30, 1975, and not permit any lien to be createdexcept in favor of the Government to (i) replace the existingliens, and (ii) secure the Government's liabilities arising fromthe agreed financing arrangements in respect of the Phulpurproject (paras 2.11 and 2.12);
(4) Take possession, before the loan becomes effective, of theland required for construction of the project (para. 4.02);
(5) Enter into contracts for the supply of required inputs(para. 4.06);
(6) Build and operate the project according to environmentalstandards satisfactory to the Bank (para. 4.10);
(7) Contract for the services of engineering firms with expertisein the construction of large-scale ammonia and urea plants andfor licensing agreements under terms satisfactory to the Bank(paras 4.08 and 4.14);
(8) Set up a project implementation unit satisfactory to the Bankand, if deemed appropriate by IFFCO or by the Bank, engage theservices of an experienced technical advisor for the executionof the project (paras. 4.14);
(9) Carry out the project according to the project implementationplans and schedules approved by the Bank (para. 4.15);
(10) Engage the outside expertise needed to overcome operationaldifficulties, if they are encountered after start-up (para 4.17);

- 30 -
(11) Increase its capital and agree that shares will be subscribedas required to finance the project (para. 5.03 and 5.04);
(12) Contract loans as required by the financing plan (para. 5.03and 5.05);
(13) Procure goods and services according to Bank guidelines asspecified in paras. 5.08 and 5.09; and
(14) Maintain a current ratio of not less than 1.1:1.0 before December31, 1976 and of 1.5:1.0 afterwards, and a debt-equity ratio ofnot more than 60:40 (including in equity the subordinated debt),and observe the other financial covenants mentioned in para. 6.09.
8.02 Based on the above, the project is suitable for a Bank loan ofUS$109 million equivalent.
Industrial Projects DepartmentNovember 12, 1974

ANNEX ]L-1
INDIA - IFFCO FERTILIZER PROJECT
GLOSSARY OF TERMS USED IN THE REPORT
1. Acgua Ammonia: Solution of ammonia in water. Solubility of ammo-nia in water depends greatly on temperature. At O°C (32°F), solubility is about900 grams per liter and only 7.4 g/lt at 1000C (2120F). Acqua ammonia isalso used as fertilizer by dissolving anhydrous ammonia in irrigation water.
2. Ammonia or Anhydrous Ammonia: A compound of nitrogen and hydrogen(NH3) obtained by synthesis c nitrogen and hydrogen. It is a gas at normalatmospheric temperature and pressure. It can be liquefied at -33°C (-28°F)at atmospheric pressure but it can also be liquefied at ordinary temperaturesby application of pressureL For instance at 60°F (15.5°C) a pressure of 107.6lbs per sq. in. (7.3 kg/cm ) or about 7 atmospheres would be required. Ammoniais applied as a fertilizer because of its high nutrient content (82% N) but itrequires special expensive equipment for storage, transportation and applicationand soils having high temperatures may result in prohibitive losses.It has no application in India at the present time.
3. Ammonium Carbamate: An intermediate product--NH2-CO2-NH2--formed byreaction of ammonia and carbon dioxide during the synthesis of urea.
4. Ammonium Chloride: NH4Cl is obtained as a co-product in the manu-facture of sodium carbonate and is used as a fertilizer for some crops andtypes of soil.
5. Ammonia Feedstocks are the sources of hydrogen used for ammoniaproduction. Except for the minor use of hydrogen produced by electrolysingwater, the principal feedstocks are hydrocarbons such as natural gas, naphtha,heavy fuel oil and coal.
6. Ammonium Nitrate (AN) or chemically NH4NO3 is produced by reactingammonia with nitric acid. Nitric acid (HNO3 ), in turn, is made from ammoniaANi ontains 33.5% nitrogen, half in the ammonium form and half in the nitrate form,and is very hygroscopic. It also is a commercial explosive. In many countries,a diluent--e.g. limestone--is added to lower the analysis and negate the explo-sive properties as well as to minimize the hygroscopic properties. Mixed withsmall amounts of fuel oil it is known as ANFO explosives used in open pit mining.
7. Ammonium Sulphate (AS): Reaction product of ammonia and sulfuricacid (NH4)2 SO4. It should contain not less than 20.5% N.
8. Bagged Fertilizer: Solid fertilizers delivered to the user in bags.Net weight of the bagged fertilizer is commonly 100 lbs, 50 kg and 100 kg.
/ Fertilizer grade.

ANNEX 1-1Page 2
Smaller bags are available in some countries for use in lawns, gardens, etc.Bags are usually made of jute, polyethylene, jute lined with polyethylene,woven polypropylene and multiple-ply paper.
9. Bajra: Millets.
10. Biuret: Carbamylurea--NH2CONH2CONH2H2 0--is an impurity containedin small amounts in synthetic urea. It is generally kept to a low levelbecause of its damaging effects on maturing seeds and plant leaves. IFFCO'surea will contain less than 1% biuret.
11. Bulk Fertilizer: Solid or liquid fertilizer sold loosely in tankers,ship holds, train wagons, trucks or large containers. Anhydrous ammonia issometimes transported in refrigerated barges or railroad tanks.
12. Calcium Ammonium Nitrate (CAN) or nitro-lime is a granulated mixtureof calcium nitrate and calcium carbonate, generally containing 25% N.
13. Chemical Fertilizers: Manufactured chemical compounds suitable asfertilizers should be high enough in nutrient content; stable to avoid hazardsand handling problems; water soluble and available to plant root systems. Itis the common practice to report the nutrient content of materials in terms ofpercentages of N (nitrogen), P205 (phosphorus pentoxide)l/ and K20 (potassiumoxide)2/. Commercially available materials meeting these requirements to alarge degree are:
Primary Fertilizer Materials
% of N % of P205 % of K20Nutrient Nutrient Nutrient
Urea 46% Triple Superphosphate 46% Potassium Chloride 61%Ammonium Nitrate 34% Single Superphosphate 18% Potassium Sulfate 54%Ammonium Sulfate 21% Diammonium Phosphate 46%Diammonium Phos-phate 18%
Because of the high nutrient content of urea, diammonium phosphate and potassiumchloride (KC1), they are some of the most popular fertilizer materials in theworld today.
1/ Normally but incorrectly referred to as phosphoric acid.2/ Or potash.

ANNEX 1-1Page 3
14. Complex or NPK Fertilizers: All three primary nutrients (N, P205,K20) are frequently applied to the soil at the same time in ratios varyingwith the nutrient requirements of different crops. Complex fertilizers con-tain at least two chemically combined nutrients. To facilitate handling, theseveral required chemicals are usually agglomerated into uniform granules fordistribution. The analysis of each nutrient is given as a ratio to describethe NPK product. Thus 15-15-15 complex fertilizer contains 15% each of N,P205, and K20; and 12-24-12 complex fertilizer contains 12% N, 24% P205 and12% K20.
15. Crop Yield; Output of crop in kg or tons per ha. or lbs/acre.
16. Crore: 10 million.
17. Diammonium Phosphate (DAP) or chemically (NH4) 2HP04,is producedby reacting NH3 with phosphoric acid (H3PO4) followed by granulation and drying.
18. Dosage: Intensity of fertilizer application generally measured in kg/haor lbs/acre (nutrient content).
19. Fertilizer: The vehicle through which plant nutrients--with the ex-ception of carbon, hydrogen, and oxygen--are added to the soil. It is usual todistinguish between natural fertilizers (such as compost) and manufactured orchemical fertilizers. Very often when the term fertilizer is used alone itrefers to the latter.
20. Godown: Warehouse.
21. Granular Fertilizer: Fertilizer in a granular form, as distinctfrom powdered fertilizer which has a tendency to 'bridge' in hoppers and gene-rally to make bagging and application more difficult.
22. HYV: High Yielding Variety.
23. Jowar: Sorghum.
24. Kharif: Season extending from May to October, with sowing in May toJuly and harvest in September/October (occasionally continued through November).
25. Lakh: 100,000.
26. Linter: Cotton fibre after ginning.
27. Mixed Fertilizer: A fertilizer made by the physical mixing orblending of two or more fertilizers and generally containing more than oneplant nutrient.
28. Monsoon: Heavy rainfall in June/September (generally earlier in theSouth and later in the North).

ANNEX 1-1Page 4
29. Paddy: Rice grain before milling.
30. Partial Oxidation is a method of producing hydrogen from hydrocarbonfuels of almost any type by a non-catalytic reaction with oxygen followed byremoval of the by-product, carbon monoxide.
31. Plant Nutrients: Essential to plant growth are some 17 elements,six in large and the remainder in small or micro quantities. Carbon, hydrogen,oxygen, nitrogen, phosphorus and potassium comprise the first six; the othersof lesser significance include calcium, magnesium, sulfur, silicon, zinc, iron,aluminum, manganese, boron, sodium, and copper. Chlorine and cobalt are alsothought essential. Carbon, hydrogen and oxygen are readily available fromthe atmosphere and water. Nitrogen, phosphorus and potassium--three main nutrients--and the other elements are drawn from the soil systems. Unless supplemented byregular additions of materials containing the three main nutrients, soil becomesdepleted of fertility by repeated cropping. Use of natural organic materialssuch asaiimal and vegetable wastes can be utilized but the scale and intensityof modern agriculture have far exceeded the availability of natural 'fertilizers'.Consequently, the majority of the world's primary plant nutrient needs are nowsupplied in the form of manufactured or 'chemical' fertilizers. To an increasingdegree, secondary nutrients such as calcium, magnesium, sulfur, and micro nu-trients such as boron, zinc, copper and manganese are also added to soils alongwith the primary nutrients in ratios prescribed by agronomists according tospecific crop and soil needs.
32. Phosphate Rock: Rock containing phosphates mainly of calcium in generallycomplex forms. Some deposits contain the phosphates as nodules scattered insterile gangue. It is used to produce phosphoric acid (H3PO4) as well as super-phosphates.
33. Prilled Fertilizer: Fertilizer in spheroidal particles generally between1 and 4 mm in diameter.
34. Rabi: Season from middle of October to middle of April, with sowingtaking place in October/December and harvesting in February/April (occasionallyextended to May).
35. Single Superphosphate: A product obtained by treating phosphate rockwith sulfuric acid and consisting of a mixture of monocalcium phosphateCaH4(PO4)2, dicalcium phosphate CaHPO4, tricalcium phosphate Ca3(PO4)2, calciumsulphate and other impurities. Tricalcium phosphate is totally insoluble andis not included in the P205 content of the superphosphate (16% to 18%).
36. Triple Superphosphate: Obtained by reaction of phosphate rock andphosphoric acid. Since it contains no calcium sulphate, its P205 content(about 46%) is much higher than in single superphosphate.

ANNEX 1-1Page 5
37. Urea is known chemically as carbamide or NH2CONH2-- the normal amideof carbonic acid; this compound contains about 46% N, all in the ammoniumform. It is considerably less hygroscopic than ammonium nitrate and it isthe most widely used straight nitrogen fertilizer today.
38. Urea Synthesis: Urea is made by reacting ammonia with carbon dioxide.Since both of the materials are produced during the ammonia synthesis, ureaproduction is usually undertaken alongside an ammonia plant. Unfortunately,the corresponding acid of carbon dioxide (carbonic acid) does not form stableammonium salts as do nitric, sulfuric or phosphoric acids. Therefore, simpleneutralization as used in making ammonium nitrate and sulfate fertilizers isnot possible. Instead, ammonia and carbon dioxide are combined under heatand pressure to make ammonium carbonate which, although unstable, can bedehydrated under pressure to form urea, a stable compound. Again, unfortunately,the overall reaction is reversible and even at 300 atmospheres pressure and200°C, the conversion to urea in a single pass through the reactor is under70%. This introduces several complications: high pressure must be used tomaximize conversion; unconverted reactants must be separated and recycled;increased corrosion under the high temperatures and pressures used must beovercome, and urea decomposition into undesirable products must be minimized.In recent years, several engineering and producing companies have developedways of surmounting these problems, and large plants capable of producing athousand tons per day, or more, of urea to rigid chemical and physical speci-fications have now been operating successfully for long periods throughoutthe world.
39. Vanaspati: Vegetable shortening.
40. Zaid Kharif: Season from August to January.
41. Zaid Rabi: From beginning of February to May.
Industrial Projects DepartmentAugust 1974

ANNEX 1-2
INDIA - IFFCO FERTILIZER PROJECT
UNITS AND CONVERSION FACTORS
Weight
1 metric ton (MT) = 1.102 short tons1 short ton = 0.9072 MT1 long ton = 1.016 MT1 kilogram (Kg) = 2.205 pounds (lbs)1 pound (lb) = 0.4536 kg.
Volume
1 cubic meter (m3 ) = 35.31 cubic feet = 1,000 liters (Its) = 264.2 US gallons= 6.29 barrels
1 US gallon (gln) = 3.785 Its1 Imperial (British) gallon = 4.732 lts1 barrel (bbl)l/ = 42 glns = 158.97 m3
1 cubic foot (cu.ft.) = 7.481 glns1 SCF = 1 cu.ft. of gas under standard conditions (1 atm. and 600F)I "SC? = 1,00 SOCP1 Nm3 = 1 m3 of gas under normal conditions (1 atm. and 0°C) = 37.3 SCF
Density
Petroleum and gas axe often sold by volume but material balancesrequire calculation by weight. Specific gravities are the ratios of the weightof the substance to the weight of the same volume of water, both measuredgenerally at either 0OC or 60 0 F. Densities (weights per unit volume) are generallygiven in metric or US units. A specific gravity of 1 is equivalent to a densityof 1 MT/m3 or 62.43 lbs/cu.ft. In the case of gases,densities are usually inKg/m 3 . Since the volume of gases change considerably with temperature and pressure,they must be specified. Normal conditions are 0°C and 1 atmosphere (1.033 Kg/cm2)
pressure. Standard conditions are 60°F (15.50C) and 1 atmosphere (14.7 lbs/squareinch). The density of air is 1.293 Kg/Nm3 (0.0808 lbs/cu.ft. under normal
conditions) or 0.0764 lbs/SCF.1 MT/m3 = 62.43 lbs/cu.ft1 lb/cu.ft. = 16.018 Kg/mi = 0.1337 lbs/gin1 Nmi of air = 1.293 Kg
1 SCF = 1 cu.ft. under standard conditions.For crude petroleum densities are usually given in metric or US units,For crude petroleum and refinery products an arbitrary scale is sometimes used:the American Petroleum Institute (API) degrees.
Degrees API = 141.5 - 131.5specific gravity at 60/60°F
1/ In the petroleum industry.(Forother purposes barrels of 31.5 US gallons,36 Imperial gallons, and others are also used.)

ANNEX 1-2Page 2
Weight and Volume Equivalents for some Petroleum Products
°API Specific Bbls/MT Gross lHeating ValueGravity Kcal/Kg
CrudePennsylvania 42.6 0.813 7.74 10,830Texas 30.2 0.875 7.19 10,810California 22.8 0.917 6.86 10,500Mexico 13.6 0.975 6.45 10,420
Heavy Fuel OilsMid-Continent 27.1 0.892 7.05 10,760California 16.7 0.955 6.59 10,660Mexico 11.9 0.987 6.37 10,280India 0.93 6.76 9,960India 0.95 6.62 10,500
Other ProductsGas Oil 32.5 0.863 7.29 10,660Gasoline 60 0.739 8,51 11,530Gasoline 67 0.713 8.82 11,600
Heat
1 Kilocalorie (Kcal) = 3.97 British thermal units = 427 Kilogram-meters= 0.001163 Kwh = 4187 joules
1 British thermal unit (Btu) = 0.252 Kcal
Heating Value
1 Kcal/Kg = 1.8 Btu/lb1 Kcal/Nm3 0.106 BtuVSCF.
Industrial Projects DepartmentAugust 1974

AlNEX 2-1
1IDIA - IFFCO F$RTIUIZEF PROJECT
SOURCES OF FPUNDS
The total cost of the on-going projects at Kalol and Kandla isestimated at Rs 938.8 (US$ 125) million financed as follows:
Equity Rs Million
1. GOI 180.02. Ccoperative Institutions Distributed
Geographically as follows:(a) Punjab 25% 26n2(b) UP 25% 26.2(c) Gu4arat 10% 10.5(d) Haryana 8% 8.L(e) Rajasthan 5% 5.3(f) Maharashtra 5% 5.3(g) Madhya Pradesh 5% 5X3(h) Karnataka 5% 5.3(i) Andhra Pradesh is 5-3(j) Tarnil Nadu 5% 5-3(k) India at large 2% .9
100.0% 105.0
Total Equity 285.0
Direct Foreign Loans
US AID 157.5
Local Currency and. Indirect Foreign Loans
1. Government of India(a) On-lending of United .ingdom and
Netherlands loans 124.0(b) Local currency loans 112.3
Total Government Loan / 236.3
2. IDBI and Other FinancialInstitutions 260.0
Total Long-Term FinancingSources!/ 938.8
1/ Rs 112.3 million of this arriourt w1ll be subordinated to bring th.einitial debt equity ratio to about 58:42.
2/ Short-tern finarncing of about Rs 73 million will be required duringthe start of production.
Industrial Projects DepartmentOctober 1974

INDIAIFFCO FERTILIZER PROJECT
MANAGEMENT CHART DURING CONSTRUCTION
BOARDOF
DIRECTORS
.. . . .. . ......... . . .. .. .. . ... .... . . . . . . .... .................................................................................. ...........................
PROJECT OFFICE * MANAGING HEADOfFICELAHMEDABAD DIRECTOR NEW DELHI
(DURING CONSTRUCTION)
INDUSTRIAL RELATIONS MANAGER
ADVISER (PLANNING)
- ! *e, _ _hm...m., _ .~~~~~~~~~~~~L I V
OPERATIONS . MARKETING FINANCE GENERAL MANAGER MAN GERP(ADMINISTRATIONPRECMANAGER DIRECTOR DIRECTOR (COOPERATI MANAGER
* WORKS WORKS SA MNG M SHARE,MANAGER MANAGER M * AKTN FNNE ACUT) BOARD'
KALOL KANDLA *SRIE
STAT*EE FIELD OFFICERS OFFICER
S T A F F
World Bank-8993(R)

ANNEX 2-3
INDIA - IFFCO FERTILIZER PROJECT
SUMMARY OF IFFCO-CFI AGREEMENT
1. The Indian Farmers Fertiliser Cooperative Ltd. (IFFCO) and Coopera-tive Fertilizers International (CFI) with headquarters in the US entered intoan agreement for technical assistance in connection with the construction andoperation of the Kandla and Kalol fertilizer plants on July 10, 1968, whichwas complemented by a letter of understanding on January 27, 1969. The follow-ing are the main terms of the agreement.
2. CFI undertook to contribute US$1 million as a grant to assist incarrying out the Kandla project, disbursable in annual tranches of $100,000from September 1967 through August 1977.
3. Deposits of Rs 200,000 in an Indian bank and of US$100,000 in aUS bank were made by IFFCO to constitute imprest accounts. These accountswere to be increased or decreased quarterly by IFFCO according to estimatedquarterly disbursements presented by CFI.
4. IFFCO was to pay for CFI expenses related to the project in excessof the sums contributed by CFI, such expenses to be paid in the currencies inwhich they were incurred.
5. CFI's contribution was to be applied against the cost of maintainingits US office, its president's salary and other salaries and expenses necessarvto support the project.
6. Up to 39 positions in India were to be filled by CFI expatriates atthe plant township with annual basic salaries (applicable to calendar year1968/69)ranging from $26,000-34,000 for the operations manager and $14,000-20,000 for the plant superintendents and chief engineer to $9,000-12,000 forthe shift supervisors. Indian income tax on the salaries of expatriate personnelwas to be waived in application of the Income Tax Act of 1961 or paid by IFFCOeither directly or from the rupee imprest account. US social security, work-men's compensation and any other payroll taxes payable by the employer in theUS or the State of Illinois were to be considered a cost. The salaries wereto be adjusted in future calendar years by the escalation or de-escalationfactor applicable to the Chemical Industry in the US (the agreement and letterof understanding do not specify the source of the indexes to be used). A 25%overseas premium, a 10% payment in-lieu of insurance and retirement programsand a 10% housing and utilities allowance (or a lower sum for suitablefurnished housing and utilities if they could be found) was to be added to thebase salaries. Other benefits included merit increases every two years,education allowances for children in grades 1-12, home leave every two years,vacation in India, cost of transportation including household goods, etc.
7. Job descriptions for the positions to be filled in India by CFIwere attached to the letter of January 27, 1969.
Industrial Projects DepartmentNovember 1974

INDIA - IFFCO FERTILIZER PROJECTKALOL ANID KANDLA UNITS
(Rs million)1 2 3 4I 5 6 7 8 9 10 11 12
1975 1976 1977 197P 1072 1980 1031 1982 1983 3984 1985 1986In Current Prices I1 1978 Prices
INCOME Statement for the Year Ending December 31 a/
%CAPACITY UTIL.KANDLA UNIT 25 25 60 80 g0 90 90 90 90 90 90 90KALOL UNIT 60 80 go 90 go 90 90 90 g0 go 90 90PHULPUR UNIT 0 0 0 0 0 0 0 0 0 0 0 0GROSS OUTPUT(M.TONKANDLA UNIT(NPK) 94000 94000 225600 300Poo 338400 338400 338400 338400 338400 338400 338400 338400KALOL UNIT(UREA) 235200 313600 352800 352°00 352800 352800 352800 3520OO 352800 352800 352800 352800PHULPUR UNIT(UREA) 0 0 0 0 0 0 0 0 0 0 0 0TRANSFERS & INV.UREA TO KANDLA 2482 7482 5956 7c?41 8934 8904 8934 8934 8934 8934 8934 8934NPK INV BUILD-UP 28200 0 0 0 0 0 0 0 0 0 0 0UREA INV BUILD-UP 29400 0 0 0 0 0 0 0 0 0 0 0UNITS SOLD(TONS)NPK 65800 94000 225600 300800 338400 338400 338400 338400 338400 338400 338400 338400UREA 203318 311118 346844 344Rsg i43366 343P866 343866 343866 343866 343866 343866 343866UNIT SALES PRICE b/NPK (AVE.) RS/TON 2330 2560 2740 2905 290o 29Q05 2905 2905 2905 2905 2905 2905KALOL UREA RS/TON 1165 1280 1370 1450 1450 1450 1450 1450 1450 1450 1450 1450PHULPUR UREA RS/TO 0 0 0 0 0 0 0 0 0 0 0 0SALES(RS MILLION)NPK REVENUE 153.31 240.64 618.14 873.82 983.05 983.05 983.05 983.05 983.05 983.05 983.05 983.05UREA REVENUE 236.87 398.23 475.18 500.05 498.61 498.61 49P.61 498.61 498.61 498.61 498.61 498.61OTHER REVENUES 11 24.54 41.41 27.55 14.42 7.02 7.072 702 7.02 U2_ 7.02 7.02 7.02TOTAL REVENUE 414 680.2 87 138.20 14 3P.6 8 48.-974 148P.68 1 4 88.68 148B.68 148 86 8 1488.68 188.68VARIABLE COSTS d/FEEDSTOCK COSTS 175.10 206.42 452.62 611.90 678.90 678.90 678.90 678.90 678.90 678.90 678.90 678.90FUEL COSTS 23.01 32.85 42.79 47.16 48.14 48.14l 4P.14 48.14 48.14 48.14 48.14 48.14CATALYSTS £ CHEM 4.77 6.96 8.44 8.91 8.91 8.91 8.91 8.91 8.91 8.91 8.91 8.91EXTERNAL POWER 5.23 7.07 10.88 13.03 13.79 13.79 13.79 13.79 13.79 13.79 13.79 13.79BAGS 31.46 42.62 65.18 77.7P 82.25 82.25 82.25 82.25 82.25 82.25 82.25 82.25MKTG S PROMOTION 2.85 4.70 7.16 8.52 9.01 9.01 9.01 9.01 9.01 9.01 9.01 9.01OTHER VAR COSTS 20.58 22.53 58.26 82.02 92.28 92.28 92.28 92.28 92.28 8 92. 92.28TOTAL VARIABLE 263.00 323.15 G45.22 849.30 933.29 993.28 933.28 92933.28 933.28 7 3379s 933.28ANNUAL FIXED COSTSWAGES S OVERHEAD 17.49 19.14 20.63 21.78 21.78 21.78 21.78 21.78 21.78 21.78 21.78 21.78MAINTENANCE MATLS 31.45 34.42 37.09 39.16 39.16 39.16 39.16 39.16 39.16 39.16 39.16 39.16INSURANCE S TAXES 5.8J4 6.39 6.89 7.?7 7.27 7.?7 7.27 7.27 7.27 7.27 7.27 7.27DEPRECIATION 68.74 68.74 6P.74 6P.74 6P.74 68.74 68.74 68.7k 68.74 68.74 68.74 68.74OTHER FIXED COSTS 11.66 12.76 13.70 14.5 52 l 14.52 14.52 14.52 14.52 14.52 14.52 14.52TOTAL FIXED COSTS 135. 141.45 14 7.00 9 151. 163.48 151 8 151. 151.48 11. 51.48
TOTAL PROD. COSTS 398.18 464.60 79P.31 1000.7P 10o4.75 1084.75C 1084.75 1084.75 1084.75 1084.75 1084.75 1084.75INVENTORY ADJ.NPK INV CHANGE 54.03 4.95 4.46 3.47 0.00 0.00 0.00 0.00 0.00 0.00 0.00 0.00UREA INV CHANGE 19.69 1.46 1.32 1.02 0.00 0.00 0.00 0.00 0.00 0.00 0.00 0.00COST OF SALES 3 4.15 459.f5 78 7 . 907.31 1084.75 1084.75 1084.75 1084.75 1084.75 1084.75 1084.75 1084.75INTEREST LT DEBT 59.80 58.40 61.1n 58.80 50.o0 38.80 311.20 2. 60 25.20 20.70 16.60 13.10INTEREST ST DEBT 8.74 6.34 0.o00- 0.o0 0.00 0.o0 0.0o 0.00 0.00 0.00 0.00 0.00PROFIT BEFORE TAX 2.03 25C.99 27 _ _ 9 R 3: 7 7 _ _ ___ _ _ _2_____INCOME TAXESC559-)L/ o.oo l.41 1_ 70 1_____n4 2 ?0 RR _1_7_ JNET PROFIT 2.03 145.49 122.h 14g1.4F 10 .91 (I4.71 16.3 i% ]45 170.43 172. 45 174.30 175.87
CUM RET PROF BEG 0.00 2.03 1 !7.*? 2(0.PP 410.00 7 9.,6 742.57 308.s9 1077.410 1247.82 1420.28 1594.57CUM RET PROF END 2.03 Ili7.02 2,7.QQ L1 . Q. 72 2 74/2.27 0O8.95 1077.40 12147.82 1420.28 1594.58 1770.45
NET PROFIT 6 SALES 0 21 ll ll 11 II 11 1 1 11 12 12 12

INDIA - IFFCO FERTILIZER PROJECTKALOL AND KANDLA UNITS
(Rs million)1 2 3 4 5 6 7 8 9 10 11 12
1975 1976 1977 1978 1979 1980 1981 1982 1983 1984 1985 1986In Current Prices In 1978 Prices
FUNDS FLOW Statement for the Year Ending December 31___________
SOURCES OF FUNDSNET PROFIT 2.03 145.48 122.36 149.48 158.91 164.31 166.38 16R.45 170.43 172.45 174.30 175.87INT SUB LT DEBT 9.50 9.50 9.10 8.30 7.50 6.70 5.90 5.10 4.30 3.50 2.70 1.90INT REG LT DEBT 50.30 48.90 52.00 50.50 43.30 32.10 28.30 24.50 20.90 17.20 13.90 11.20INTEREST ST DEBT 8.74 6.34 0.00 0.00 0.00 0.00 0.00 0.00 0.00 0.00 0.00 0.00DEPRECIATION 68.74 68.74 68.74 68.74 68.74 68.74 68.74 68.74 68.74 68.74 68.74 68.74SHORT TERM DEBT 72.80 0.00 0.00 0.00 0.00 0.00 0.00 0.00 0.00 0.00 0.00 0.00TOTAL SOURCES 212.11 278.96 252.20 277.02 278.45 271.85 269.32 266.79 264.37 261.89 259.64 257.71
USES OF FUNDSCHANGE IN ACCT REC 67.10 6.70 5.20 4.70 0.00 0.00 0.0( 0.00 0.00 0.00 0.00 0.00CHANGE IN FG INV 73.72 6.41 5.77 4.49 0.00 0.00 0.00 0.00 0.00 0.00 0.00 0.00NET CHANGE OTHERS 30.10 3.00 2.30 2.10 0.00 0.00 0.00 0.00 0.00 0.00 0.00 0.00INT SUB LT DEBT 9.50 9.50 9.10 8.30 7.50 6.70 5.90 5.10 4.30 3.50 2.70 1.90INT REG LT DEBT 50.30 48.90 52.00 50.50 43.30 32.10 28.30 24.50 20.90 17.20 13.90 11.20INTEREST ST DEBT 8.74 6.34 0.00 0.00 0.00 0.00 0.00 0.00 0.00 0.00 0.00 0.00SUB LT DEBT PAY. 0.00 0.00 9.40 9.110 9.40 9.40 9.40 9.4 0 9.40 9.40 9.40 9.40REG LT DEBT PAY. 7.30 15.25 15.60 16.35 37.95 48.35 48.35 48.35 48.35 148.35 41.05 33.85ST DEBT PAYMENT 20.00 52.80 0.00 0.00 0.00 0.00 0.00 0.00 0.00 0.00 0.00 0.00TOTAL USES 266.76 148.90 99.37 95.84 98.15 955 91.95 87.35 82.95 78.45 67.05 56.35NET CASHFLOW -54.65 130.06 152.83 181.18 180.30 175.30 177.37 179.44 181.42 183.44 192.59 201.36WORKING CAP FUNDS 62.30 0.00 0.00 0.00 0.00 0.00 0.00 0.00 0.00 0.00 0.00 0.00BEGINNING CASH 0.00 7.65 137.71 290.54 471.72 652.01 827.31 1004.68 1184.12 1365.53 1548.98 1741.56
ENDING CASH 7.65 137.71 290.54 471.72 652.01 827.31 1004.68 1184.12 1365.53 1548.98 1741.56 1942.93
REG LT DEBT SERV 57.60 64.15 67.60 66.85 81.25 80.45 76.65 72.85 69.25 65.55 54.95 45.05TOTAL LT DEBT SERV 67.10 73.65 86.10 84.55 98.15 96.55 91.95 87.35 82.95 78.45 67.05 56.35CASH:DEBT RATIO 130.57 272.62 252.20 277.02 278.45 271.85 269.32 266.79 264.37 261.89 259.64 257.71REG DEBT COV RATIO 2.27 4.25 3.73 4.14 3.43 3.38 3.51 3.66 3.82 4.00 i4.72 5.72
TOTAL LT DEBT COV. 1.95 3.70 2.93 3.28 2.84 2.82 2.9? 3.05 3.19 3.34 3.87 4.57
X A
MJ

INDIA - IFFCO FERTILIZER PROJECTKALOL AND KANDLA UNITS
(Rs million)1 2 3 4 5 6 7 8 9 10 11 12
1975 1976 1977 1978 1979 1980 1981 1982 1983 1984 1985 1986
BALANCE SHEET as of December 31
CURRENT ASSETSOPERATING CASH 7.65 6.10 6.50 6.90 6.90 6.90 6.90 6.9o 6.90 6.90 6.90 6.90
ACCTS RECEIVABLE 67.10 73.80 79.00 83.70 83.70 83.70 83.70 83.70 83.70 83.70 83.70 83.70FIN GOODS INV 73.72 80.14 85.91 90.40 90.40 90.40 90.40 90.40 90.40 90.40 90.40 9O.4O
WORK IN PROCESS 3.40 3.70 4.00 4.20 4.20 4.20 4.20 4.20 4.20 4.20 4.20 4.20
RAW MATERIALS INV 61.60 67.70 _2.40 76.8o0 76.80 76.80 76. 80 76.80 76.80 76.80
TOTAL CUR ASSETS 213.47 231.44 247.81 262.00 22.00 262.00 262.00 262.00 26-2.00 262.00 262.00 262.00
ACCUMULATED FUNDSFUNDS FOR DIVIDEND 0.00 10.33 18.89 29.35 40.48 51.98 63.63 75.42 87.35 99.42 111.62 123.93FUNDS FOR INVESTME/Y 0.00 121.28 265.15 435.46 604.64 768.43 934.15 1101.80 1271.29 1442.66 1623.04 1812.10
SPARE PARTS INV. 26.70 29.40 31.40 33.30 33.30 33.30 33.30 33.30 33.30 33.30 33.30 33.30
GROSS FIXED ASSETS 876.50 876.50 876.50 876.50 876.50 876.50 876.50 876.50 876.50 876.50 876.50 876.50
ACCUM DEPRECIATION 68.74 137.48 206.22 274.96 343.70 412.44 481.18 549.92 618.66 687.40 756.14 824.88NET FIXED ASSETS 807.76 739.02 670.28 601.54 532780 46OTD 395.32 326.58 257.84 189.10 120,36 51.62
TOTAL ASSETS 1047.93 1131.47 1233.53 1361.66 1473.21 1579.77 1688.40 1799.10 1911.77 2026.48 2150.32 2282.95
CURRENT LIABILITIEACCTS PAYABLE 61.60 67.70 72.40 76.80 76.80 76.80 76.80 76.80 76.80 76.80 76.80 76.80SHORT TERM DEBT 52.80 0.00 0.00 0.00 0.00 0.00 0.00 0.00 0.00 0.00 0.00 0.00
CUR SUB LT DEBT 0.00 9.4O 9.40 9.40 9.40 9.40 9.40 9.40 9.40 9.40 9.40 0.00CUR REG LT DEBT 15.25 15.60 16.35 37.95 483.35 48.35 48.3 4.35 48.35 41.05 ,3.85 0.00TOTAL CUR LIAB. 129.65 92.70 98.15 124.15 134.55 134.55 134.55 134.55 13l.55 127.25 120.05 76.80
REG LONG TERM DEBT 518.95 503.35 487.oo 449.05 400.70 352.35 304.00 255.65 207.30 166.25 132.40 132.40EQUITY & QUASI-EQUSUB LONG TERM DEBT 112.30 102.90 93.50 84.10 74.70 65.30 55.90 46.50 37.10 27.70 18.30 18.30SHARE CAPITAL 285.00 285.00 285.00 285.00 285.00 285.00 285.00 285.00 285.00 285.00 285.00 285.00RETAINED EARNINGS 2.03 147.52 29.88 419.36 578.26 742.57 895 10 4 1247.82 1420.28 1594.58 1770.4
TOTAL EQUITY 399.33 535.42 48 78846 937.96 1092.87 1249. 5- 1408.90 1569.928 189788 2073.75
TOTAL LIABILITIES 1047.93 1131.47 1233.53 1361.66 1473.21 1579.77 1688.40 1799.10 1911.77 2026.48 2150.33 2282.95
OUICK RATIO 1.15 1.73 1.75 1.46 1.35 1.35 1.35 1.35 1.35 1.42 1.51 2.36CURRENT RATIO 1.65 2.50 2.52 2.11 1.95 1.95 1.95 1.95 1.95 2.06 2.18 3.41DEBT/DEBT+EQUITY % a/ 57 48 43 36 30 24 20 15 12 9 7 6DEBT/DEBT+SH CAP % 65 64 63 61 58 55 52 47 42 37 32 32TOTAL D/E RATIO % b/ 69 58 51 43 36 29 23 18 14 10 7 7
a!Subordiated debt included in equityb/ Subordinated debt excluded in equity.

ANNEX 2-4Page 4
INDIA - IFFCO FERTILIZER PROJECT
NOTES TO KALOL AND KANDLA FINANCIAL STATEMENTS
a/ Although Rs 112.3 million of the GOI loan is assumed to be a subordinateddebt, interest and principal payments on it are included in these state-ments according to the original terms of the debt. Prices as of the endof 1974 are escalated by the domestic inflation rates shown in Annex 5-2to mid-year prices during 1975, 1976, 1977 and 1978.
b/ Ex-factory price as of the end of 1974 are as follows:
Urea = Rs 1,100 per tonAmmonia = Rs 1,000 " "NPK (weighted average) = Rs 2,200 " "
The NPK average price is derived as follows:Fertilizer Type % 1974 Price (Rs/Ton)
141-36-12 50.6 2,25012-32-16 24.7 2,16010-26-26 24.7 2,070
100.0
Weighted average 1974 price = Rs 2,200 per ton.
Approximately 0.0264 tons of urea and 0.149 tons of ammonia are trans-ferred to Kandla from Kalol per ton of NPK produced in Kandla. Theestimated production cost of urea and ammonia, in 1974 prices andassuming 90% capacity utilization is Rs 640 and Rs 750 per ton, respect-ively. These transfer prices are not included in the variable productioncosts for NPK shown below nor are they included as part of the salesrevenues for the Kalol plant.
j Excess ammonia production not required for urea manufacture is about0.158 tons of ammonia per ton of urea produced. Most of this ammoniais transferred to Kandla for NPK production, and the rest sold toindustrial users.
,/ The estimated end of 1974 production costs are detailed as follows:
Kalol Plant
Variable Cost Items Unit Cost Units/Ton of Urea Rs/Ton of Urea
Gas Rs 124/MSCM o.647 MSCM 80.23(us$0.4h5/MsCM)
Naphtha Rs 550/ton 0.15 tons 82.50Fuel Oil (Steam Generation) Rs 703/ton 0.12 tons 84.36Power 1 4.80Catalysts & Chemicals 191.13Bags 90.00Marketing & Promotion 10.00
381 .02

ANNEX ?-!4Page §
Fixed Costs Rs Million/Year
Salaries, Wages and Overhead 9.00Maintenance Materials 21.66Insurance and Taxes 4.01Depreciation 50.15Others 6.50
91.32
Kandla Plant
Variable Cost Items Unit Cost/Ton Units/Ton of NPK Rs/Ton of NPK:-
Phosphoric Acid Rs 3,900 0.346 1,350.20Potash Rs 660 0.29 191.40Coating Agent Rs 140 0.015 2.10Coating Oil - _ 4.53Filler Rs 50 0.0266 1.33Ammonia Freight Rs 43 0.1492 6.42Urea Freight Rs 30.3 0.0264 o.80Fuel Oil (Steam) 19.82Power 15.45Bags 90.00Marketing & Promotion 10.00
1,692.05
Fixed Costs Rs Million/Year
Salaries, Wages and Overhead 7.50Maintenance Materials 8.01Insurance and Taxes 1.50Depreciation 18.59Others 4.50
40.10
i/ Development rebate of Rs 139 million is used to offset taxableincome during 1975 and 1976.
j Including investment needed for the Phulpur Project.
Industrial Projects DepartmentOctober 1°74

ANNEX 3-1
INDIA - IFFCO FERTILIZER PROJECT
AGRICULTURE IN INDIA AND THE NEED FaR PLANT NUTRIENTS
1. Sown area in 1969/70, the last year for which information isavailable, was 139 million ha of which about 30 million ha was irrigated.Irrigation was especially important in the Punjab, Tamil Nadu, U.P. andA.P. Because of multiple cropping in some regions -- and especially inthe States of Punjab, Haryana, U.P., Bihar, Orissa and Kerala -- totalcropped area was 16b million ha (Table 1), of which about 8% was under highyielding varieties (HYVs). The Punjab is the leading State using thesevarieties.
2. In area, the most important crops in India are rice, wheat,jowar, bajra, gram and other pulses (leguminous crops), groundnut and otheroilseeds, cotton and sugarcane. A breakdown of crop areas by States isshown in Table 2.
3. The yields of the main Indian crops (actual for 1961/62 and1971/72, estimated for 1973/74 and planned for 1978/79) are shown in Table3. For the five main foodgrain crops the average yield has increased by26.7% (2.h% annually), but the yield of other cereals and pulses remainedpractically stationary. The growth rate for all foodgrains was 2.1%/year.There is ample margin for improving average yields in India as compared tothose obtained ir other countries. For example, those for rice, wheat,maize, millet, augarcane and cotton are all below the world's average (Table1) and except for wheat in recent years, also below the averages for Asia.These figures do not take into account accomplishments in specific areas,such as the growth in average wheat yields in the Punjab (which reached2,h13 kg/ha in 1971/72), well above the world average of 1,628 kg/ha.
4,. The Fifth Five-Year Plan 197L-1979 forecasts an increase of 22.8%(4.2%/yr) in foodgrain output from 114 to ThO million MT1 /. Since the in-crease in area is expected to be only 6.4% (l.o%/yr), the rise in outputwould be largely based on increased productivity, the average yield beingprojected to grow from 901 to 1,053 kg/ha (3.2%/yr). This would be substantiallyhigher rate of improvement than the 2.2%/yr rate registered in 12 years from1961/62 to 1973/7h. This growth is expected to be specially marked in theyield of rice (3.h%/yr) in spite of having been only 1.4%/yr in the decadefrom 1961/62 through 1971/72.
5. The area increase projected in the Fifth Plan is largely based onincreased cropping intensity as well as on new irrigation protects and gro8sirrigated area is expected to rise by 11.2 million ha as compared to 7.0 2/million ha in the Fourth Plan. According to the latest country Bank Report,-the Draft Fifth Plan assumptions, however, seem optimistic and 7 to 8 millionha is given as a figure more likely to be attained by 1978/79. In what
1/ But actual 1973/7h output is estimated at about 104 to 108 million MT.2/ Economic Situation and Prospects of India (402-IN), April 197L.

ANNEX 3-1Page 2
follows crop production and fertilizer consumption forecaots are based onthe Economic Report's estimates of cropped area increases of 5 million hain food grains and 3 million ha in other crops, i.e., 77% and 68%respectively of the Fifth Plan'B figures. Estimated 1973/74 foodgrain crophas also been scaled down from the Fifth Plan base of 114 to about l0omillion MT.
6. During the Fourth Plan, area under HYVs grew from 9.2 to 25.0million ha and it has been estimated that by 1971/72 more than 30% (33million MT) of foodgrain was from HYVa. However, yield increases aredependent not only on the introduction of HYVs, but also on the appropriatemanagement of water supplies, use of fertilizers and plant protectionagents (insecticides, herbicides, etc.), time and form of application offertilizers and other inputs, use of tractors, availability of fuel andelectric power, avoidance of losses during harvesting and collection ofcrops, etc. UNIDO has pointed out that use of pesticides in India andAfrica in 1963 was considerably lower than in other countries and regionsand that yields were also lower.1/ Thus use of pesticides in that yearwas 0.15 kg/ha in India, 1.5 kg/ha in the US, and 10.8 kgAha in Japan.Corresponding average crop yields were 820, 2,600 and 5,h80 kg/harespectively. More recent figures on pesticide consumption in variouscountries are shown in Table 5.
7. All the nutrients, except carbon, hydrogen and oxygen, 'wichare largely removed from the air and water, are drawn from the soil._ Acalculation of the weight of nutrients contained in harvests is not,however, a good indication of the amount of fertilizer needed in a givencultivated field. Considerable amounts of nutrients may be lost througherosion, leaching and denitrification. On the other hand, nutrients arealso supplied by manure, unharvested portions of crops and dissolved inrainfall. Meaningful recomendations on dosages can be made only on thebasis of the chemical and physical structure of the soil, crop requirements,forms of cultivation, weather patterns, use of neighboring land, etc.andcrop/input price relationships. However, actual average dosages aregenerally well below the optimum.
1/ UNIDO, Industrial Production and Formulation of Pesticides in DevelopingCountries, New York 1972, page 15.
/ Excluding some nitrogen 'fixed' from the air by symbiotic micro-organismsand then absorbed by the plants' root systems.

TABLE 1
INDIA - IFFCO FERTILIZER PROJECT
CULTIVATED AREAS 1969/70(000 ha.)
Cultivated Areas Irrigated Areas IndicatorsMultiple- Total Total Distribution Gross Area by Main Crops Cropping Share Share
State HYVs cropped Sown Cropped Gross Net Rice Wheat Maize Jowar & Bairi IntensitylH Irrigated2/ EYVs 3/
Punjab 1,627 1,472 4,027 5,499 4,080 2,836 324 1,803 401 122 1.37 0.70 0.30Haryana 609 1,393 3,548 4,941 2,158 1,403 206 798 39 138 1.39 0.39 0.12Uttar Pradesh 3,507 5,395 17,483 22,874 7,929 6,819 741 3,421 231 16 1.31 0.39 0.15Gujarat 423 590 9,592 10,182 1,241 1,150 131 556 14 99 1.06 0.12 0.04Madhya Pradesh 429 2,016 18,383 20,399 1,471 1,431 675 421 3 - 1.11 0.08 0.02Rajasthan 536 1,172 13,095 14,267 2,419 2,059 41 814 158 94 1.09 0.16 0.04Maharashtra 963 973 18,462 19,435 1,623 1,431 314 263 21 340 1.05 0.08 0.05
Sub-total 7 States 8,094 13,011 84,590 97,597 20,921 17,129 2,432 8,076 867 798 1.15 0.20 0.08
Bihar 836 2,668 8,395 11,063 2,741 2,279 1,886 556 27 - 1.32 0.27 0.08West Bengal 639 1,485 5,569 7,054 1,499 1,478 1,315 27 8 _ 1.27 0.27 0.09Orissa 181 2,288 6,094 8,382 1,423 1,027 1,224 4 3 - 1.38 0.17 0.02Andhra Pradesh 758 1,635 11,510 13,145 4,153 3,189 3,283 7 52 95 1.14 0.28 0.06Kerala 239 750 2,166 2,916 589 423 477 - - - 1.35 0.20 0.08Mysore 393 597 10,197 10,794 1,305 1,144 739 24 45 91 1.06 0.11 0.04Tamil Nadu 1,234 1,093 6,069 7,162 3,272 2,507 2,321 - 11 208 1.18 0.41 0.17Other 481 1,273 4.532 5,809 1,313 1,164 975 114 __1.28 0.26 0.08
Total India 12,855 24,800 139,122 163,922 37,216 30,340 14,652 8,808 1,050 1,208 1.18 0.22 0.08
7 States as % of Totalfor India 63 52 61 59 56 56 17 92 83 66
1/ Ratio of cropped to sown areas2/ Net irrigated area to sown area ratio3/ Ratio of area under HYVs to total cropped area .td.
Source: FAI Fertilizer Statistics 1972-73, Tables IV, 1.01 and 1.03
Industrial Projects DepartmentAugust 1974

1- ~ ~ 0N10
Ibc1 0 1 °1 j 505s5 :> _ o t~n-n-_ Co_ 1L0 WH_-N-v-N-OO00Wo =. oO-lo lol _ c1.01
oNN 0o 0_11 0100
Nn NNH OW WiOt¢D_ N-- N-NW cON-N-ON-N-c0 S N-IN-
'1 I-H30 F o~<rooN>t C N cc = II>O n>9wF-wv
- N- N- N-HN-N-N-N- N-N-N- u w I oN-N- N- N- O - N N H - N-ON W H
O N-CoO N-,- O ,
g 0lN- SN- I 01nCt~>bg@C, '
N- w0 ONNI_-NN---NNN I N- I
N- N- IN_-W-I N-I I IN-N-N-N-N- IN - IO
oN-ON-HON ~ ~ ~ -H N--H -N--- O -- NO O O N-N l _ OR H~~~~ ~ wi N- NNO - NO -NNNNNNO IN-I_0 r

TABLE 3
INDIA - IFFCO FERTILIZIR PROJECT
MAIN CROP AREAS, PRODUCTION AND YIELDS
Area (Million ha.) Output (Million tons) Yields (KA/ha.)
11/ I / I/ 1/ 1l /Actual Est. - Proi. Actual Est. - Proj. - Actual tot. - Proi.
1961/62 1971/72 1973/74 1978/79 1961/62 1971/72 1973/74 1978/79 1961/62 1971/72 1973/74 1978/79
Rice 34.28 31.33 38.50 40.00 34.10 42.73 44.00 34.0 995 1,145 1,145 1,350
Wheat 13.30 19.16 20.00 22.00 11.13 26.48 30.00 38.0 837 1,382 1,500 1,727
Maize 4.42 5.64 6.00 6.50 4.27 5.03 6.50 8.0 966 892 1,083 1,231Jowar 18,14 16.80 17.50 18.00 9.81 7.75 9.50 11.0 486 461 543 611
Bajra 11.19 11.77 13.00 13.50 3.50 5.38 6.50 8.0 313 435 500 593
Sub Total 81.33 90.70 95.00 100.00 61.81 87.37 96.50 119.0 760 963 1.016 1.190
Ragi 2.53 2.40 - - 1.97 2.17 - - 779 903 -Barley 3.26 2.43 - - 2.90 2.50 - - 890 1,028 -Small millet 4.87 4.51 - - 2.02 1.58 - - 415 351 -
Sub Total 10.66 9.35 9.00 9.00 6,89 6.25 6.00 7.0 646 666 667 778
Gram 9.73 8.03 - - 5.89 5.11 - - 605 636 -Other Pulses 14.45 14.14 - - 6.22 4.38 - - 430 370 -
Sub Total 24.18 22.17 22.50 24.00 12.11 11.06 11.50 14.0 500 500 500 583
Total Foodgrain 116.17 122.22 126.50 133.00 80.81 104.68 114.00 140.0 696 856 901 1,053
Groundnut 6.61 7.24 - - 4.41 5.71 - - 667 789 -Other Oilseeds 14.85 16.04 - - 3.71 4.53 - - 250 282 -
Sub Total 21.46 23.28 15.85 17 76 / 8.12 10.24 9.4 - 12.5 - 378 440 593 707 -
Sugarcane 2.34 2.42 2.80 3.20 10.62 3/ 11.73 3/ 134.00 170.0 4,538 3/ 4,851 3/ 48 4/ 53 4/Potato 0.38 0.50 - - 2.80 4.83 - - 7,368 9,738 -Tea 0.32 0.36 - - 0.33 0.43 - - 1,031 5 1,213 5-Coffee 0.12 0.14 - - 0.08 0.10 - - 419 - 482 -Tobacco 0.41 0.45 - 0.50 0.31 0.41 - - 756 920 - -
Cotton (lint) 7.63 7.78 7.80 8.60 0.79 1.17 1.17 1.44 151 151 150 167
Jute 0.74 0.82 1.10 1.20 0.90 1.03 6/ l.21-/ 1:39 1,216 1,256 1,110 6/ 1,158 6/Rubber 0.11 0.20 - - 0.02 0.09 - - - 653 -
Other - - - 15.40Non-forecast: 8/-Banana - 0.23 - - - 3 .2 3 - - - - 14-
- Coconut - 1.08 - - -- Chili - 0.73 - - 0.40 0.44 - - - 600 -
Sub TotalNon Foodgrain
TOTALS: 163.70 169.10 180.00
1/ As given in the Draft Fifth Five-Year Plan, Actual foodgrain figures for 1973/74 are estimated to be 126 million ha., 104 oil] i0 tons and 825 Kg/ha.
2/ Includes only seven oilseeds and excludes cottonseed.
3/ As sugar. (Approximately 0.1 ton sugar per ton cane).
4/ Tons/ha.5/ Approximate figures based on estimated planted area (111,000 ha. in 1964/65).
6/ Including mesta.21 Measured over tappable area (approximately 707% of total planted area).8/ 1970-71.
Source: FAI, Fertilizer Statiotics, 1972-73Draft Fifth Five-Year Plan 1974-79.IBRD, Economic Situation of India No. 402-IN, May 1974.
Industrial Projects DepartmentAugust 1974

TABLE 4
INDIA - IFFCO FERTILIZER PROJECT
COMPARATIVE YIELDS OF SEVERAL CROPS(Kg/ha)
Rice- Wheat Maize Millet Sugarcane2/ Cottonr/
1962 1972 1962 1972 1962 1972 1962 1972 1962•t/ 1971 1962_/ 1972
India 1,396 1,616 851 1,382 992 865 431 461 441 485 120 163Bangladesh 1,700 1,500 636 636 738 938 - -Indonesia 1,786 2,436 - - 1,021 1,008 - - 753 725 200 2005/Japan 5,138 5,847 2,743 2,309 2,461 2,900 1,491 1,714 595 627 - -Pakistan 1,386 2,263 822 1,189 1,066 1,275 497 467 367 433 260 365Turkey 3,395 3,691 --- --- 1,199 1,683 1,224 1,375 --- --- 410 778
Asia Average 2,014 2,266 914 1,255 1,646 1,766 537 651 --- 492 180 240k6
Egypt 5,840 5,334 2,606 3,102 2,604 3,747 3,449 3,957 882 933 610 7805/Nigeria 1,178 1,714 2,667 2,333 880 927 568 706 437 750 120 110.Y
Africa Average 1,514 1,778 918 1,065 1,173 1,382 631 659 592 595 230 2706/
France 4,187 2,633 3,075 4,579 2,149 4,580 1,074 1,563 - - - -Germany - - 3,480 4,064 3,362 4,780 - - - - - -Romania 3,092 2,393 --- --- 1,588 2,925 - - - - - -
Europe Average 4,937 4,028 2,107 2,952 2,068 3,675 988 1,164 693 770 370 6205/
Canada - - 1,418 1,680 4,772 4,985 - - - -U.S. 4,179 5,250 1,681 2,196 4,062 6,084 - - 897 921 550 490Mexico 2,158 2,639 1,946 2,721 995 1,148 - - 594 623 640 822
N. America Average 2,956 3,845 1,589 2,050 3,242 4,689 706 768 --- 545 560 5305/
Argentina 3,436 3,538 1,522 1,612 1,894 1,862 1,351 907 496 506 2405/Brazil 1,659 1,462 949 800 1,305 1,381 - - 433 462 170 256-/Peru 4,311 4,188 994 1,006 1,390 1,788 _ _ 1,439 1,554 570 6106-'
S. America Average 1,795 1,668 1,345 1,458 1,395 1,464 1,353 921 515 514 260 2505J
World Average 2,006 2,251 1,246 1,628 2,137 2,785 567 660 492 531 330 371
India, as a % ofAsia Average 69 71 93 110 60 49 80 71 --- 99 -67 68World Average 70 72 68 85 46 31 76 70 90 93 36 44
1/ As paddy Source: FAO, Production Yearbook 19722/ As sugarcane. Figures are in 100 kg/ha. International Sugar Organization, Vol.35 No.5 May 1975 v e3/ As lint International Cotton Advisory Committee, World XI4/ Averages for 1961/65 Cotton, July 1974.5/ 1971 figures6/ Approximate figuresIndustrial Projects DepartmentAugust 1974

TABLE 5
INDIA - IFFCO FERTILIZER PROJECT
CONSUMPTION OF HERBICIDES, INSECTICIDES AND OTHER1JESTICIDES (1970)(000 tons of Active iagredients)-
Egypt El Salvador USA Colombia India Turkey Italy Japan
DDT 1.9 0.5 11.5 - 1.0 3.6 --- 1.5 0.4BHC & Lindane 0.1 - - - 33.8 --- 7.0 1.4Aldrin - - - 0.1 2.2 0.2Dieldrin --- 0.1 0.1 --- - -Chlordane & Toxaphene --- 0.5 --- 1.3 0.3 1.0 --- ---Parathion & Malathion 0.5 1.6 25.1 2.3 1.6 0.5 1.6 0.2Other Phusph. 1.6 - 19,02/ - 0.2 0.8 4.1 1.7Ca. Arsenate 0.1 0.5 1.3 0.5 - - - -Lead " -- 0.2 2.7 0.5 - - 0.4 0.3Other o52/ - --- --- - 0.1 ---Mineral Oils 3.6 --- 54.5 1.4 0.4- 2.2 11.0 10.5Endrin 2.4 - 28.3 0.2 0.8 0.1 0.2 0.1Pyrethrum- - 0.1 - 0.2 - - ---Rotenone --- . 1 --- --- --- --- ---Nicotine - - - --- 0.1 0.1Other botanical 0.1 --- --- --- --- --- --- ---Other insect. 6.0 1.8 112.7 --- 0.2 0.1 6.2 0.1Sulphur 6.7 --- 91.82 - 0.3 27.0 75.4 1.4Lime-Sulphur, etc. --- --- --- --- --- 5.1 15.5Copper Sulphate -- 13.0 --- 0.1 3.3 15.0 4.2Copper, Other 0.3 0.8 0.1 0.4 0.1 6.8 0.1Dithiocarbamate --- --- 18.1 1.6 - 0.2 15.9 3.7Captan & OtherFungicides 0.3 0.1 39.5 0.4 - - 31.7 0.3Fumigants 0.1 --- --- --- 0.1 - 3.7 10.9Xerbicides 0.1 0.2 146.5 3.0 0 22 0.9 7.5 21.3Rodenticides --- --- --- --- 0.2-/ --- 0.1 -Other Pesticides --- --- --- --- 0.1 --- 1.5
1/ Except data for Italy, which is product weight2/ 1969
--- Not available O Source: FAO, Production Yearbook 1972
Industrial Projects DepartmentAugust 1974

ANLi.X 3-2
INDIA - IFFCGC FERTILIZER PROJECT
THE AGRICULTURAL COCPERATIVE iYSTEI4 IN INDIA
A. Introduction
1. Tne coonerative movement in India began in 1,904, when the CooperativeCredit Societies Act was enacted. However, almost half a century later, theRural Credit SurveJ' of 1S52 showed that credits extended through cooperativesaccounted for only 3-;6 oe the funds borrowed by Indian farmers.
2. Under the Constitution, cooperati,e societies are broadly consideredto be subject to control by the State Government (and eligible for State pro-motion). The ational Government, however, has actively promoted the cooperativemovement through direct budgetary support (increasing from Rs 54 nillion in theFirst Five-Year Plan to Rs 2,580 million in the Fourth Five-Year Plan') notincluding indirect financing through Departmental Budgets (such as by the ReserveBank of India for their initial equity participation in cooperative creditinstitutions, etc.). To deal with cooperatives whose activities extend overmore than one State, the Union enacted the Multi-Unit Cooperative Societies Actin 1 )l`2. The National Cooperative Development Corporation was set up by theGovernmeLit of India in 1963 as a successor to the National Cooperative Develop-ment and Warehousing Board which had been established in 1956.
3. Historically, short and meditm-term credit has been the basic acti-iy-of the cooperative movement in India. But, it has extended its field of actionto other aspects of the agricultural sector: granting long-term credits for lanaimDrovement; aiding crop storage and marketing; purchasing of seed, fe^tilizersand pesticides; servicing and repairing of tractors and other agriculturalequipment; processing crops (malnly by cooperative siugar and rice mills, cottonginneries, and oil extraction plants, etc.); constructing irrigation works andpromoting rural electrification; and, cooperative farming. The total number oicooneratives in the agriculturql sector was estimated at 330_1,00 in 1969 w-ith5 million members. Their total equity was Rs 6.7 ,billion and tr.ey had is 6.2.Oiio in working caoital. The relationships between the different cooperaniveunits in the agricultural sector are snown in Annex 3_3.
0. In India about 456' of ON? has its origin in the agricultural sectorand 80' of her population is rural. With about iib million operao4ve lanl-holdings having an area of less th-.an 5 acres (2 ha) each ('able 1). Distribu-tion of inputs required for the application of modern farming methods anomarketing the crops are formidable tasks, and the failure or success cf theagricultural cooperatives has a special significance.
1/ Rs L,230 million have been allocated to the promoition and develcOpmentoft the cooperative system in the Fifth Five-Year Plan, of whichn ds 2bcmillion would be supplied by the State Governments.

ANNEX 3-2Page 2
B. Agricultural Credit
Institutional Sources of Agricultural Credit
5. The institutional sources of financing for agricultural activities(commercial banks, agricultural credit cooperatives, the Agricultural RefinanceCorporation etc.) have increased their share of total agricultural financingfrom 7.3% in 1952, when an all India Rural Credit Survey was carried out, to anestimated 39% in 19691/ but they are still overshadowed by non-institutionalsources: money lenders, family loans, traders, big landholders, etc.
Commercial Banks
6. The State Bank of India (SBI), 14 commercial banks nationalized in1969 and some non-nationalized commercial banks have rapidly increased theiroperations in the agricultural sector, total number of loans in the year endingDecember 1971 having reached 1.2 million, for Rs 3,955 million, of whichRs 2,633 million were in direct loans to agriculture, and the balance inindirect loans mainly to electrify well pumps, buy fertilizers and finance otheragricultural inputs. In 1969, the Reserve Bank of India (RBI) started a program,the "Lead Bank Scheme", according to which districts are allotted to one of thecommercial banks, the "lead" bank, which is responsible for surveying the district'sagricultural potential, implementing progressive development plans and coordinat-ing the provision of credits for the supply of farm inputs and services. ByMarch 1972, 336 districts had been allotted and the surveys of 260 had beencompleted and as a result, about 3,000 villages had been "adopted" by commercialbanks, which are supposed to meet the credit needs of farmers aswell as of persons engaged in other activities. The State Bank of India hasalso instituted an Intensive Center Scheme designed--in consultation with theState Governments--to develop some backward areas. In these areas, the SBI willestablish agricultural development branches. Up to March 1974, 150 such brancheshad been set up.
The Agricultural Re-Finance Corporation
7. The Agricultural Re-Finance Corporation (ARC) was founded in 1963primarily to refinance promotion and development loans extended by institutionswhich are shareholders of ARC: commercial banks, State cooperative banks andcentral development banks. Exceptionally it can also finance other institutions.Through 1972, the ARC has approved 788 operations (related mainly to smallirrigation projects, horticulture and land development and/or reclamati-on)involving a total financing of Rs 3,917 million (Rs 1,365 million outstanding).!The ARC has helped commercial banks to identify agricultural developrnlent plansfor centers allotted to them as "lead banks" and prepare the corresponding reports.
/ Most of this--33%--was in credits extended by cooperatives(from: "Availability and Disbursements of Cooperative Credit forFertilizers", paper presented by Mr K. S. Bawa at FAI on April 16, 1974L).
/ IDA Credits have also been channelled through ARC for on-lendingto individual borrowers.

ANNEX 3-2Page 3
Agro-Industries Corporations have been formed with equal equity participationby the Central and State Governments in 11 states (among them Punjab and UP)to finance through medium and long-term credits the rent-purchase of agri-cultural equipment (mainly tractors, pumps and power cultivators) and otherundertakings to modernize farming. The UP Agro-Industry Corporation has alsoundertaken distribution of fertilizers.
8. As a result of recommendations of the All India Rural Credit ReviewCommittee, the GOI established two schemes: the Small Farmers DevelopmentAgency (SFDA) and the Agency for the Development of Marginal Farmers and Agri-cultural Labor (MFAL) to ensure that credit under liberal conditions is avail-able to small and marginal farmers and to agricultural labor. These schemesare under implementation in a small number of districts (the SFDA in 46 and theMFAL in 41 districts as of March 1973). They are expected to extend considerab:Lytheir reach during the Draft Fifth Five-Year Plan (by 1978/79 they are plannedto cover 160 districts).
Fertilizer Credit
9. Loans to dealers and cooperatives for the procurement, storage anddistribution of fertilizers are known as "commercial credits", while those tofarmers for the purchase of fertilizers are known as "production credits".Until 1966, the GOI had supplied pool fertilizers to the State Governments on18-month terms and at low interest rates. At present only 60 days of interest-free credit is allowed. The RBI refinanced during three years commercial bankcredits to agriculture at 4-1/2% annual interest rate and did not consider loansoutstanding in their sector in the calculation of the banks' reserve require-ments. At present, these facilities have been withdrawn. The rate on thecommercial banks' loans for fertilizers is now 10-11% per annum and the margin(without collateral) is 20-25%. The Credit Guarantee Corporation qf Indiainsures repayment of credits extended by small fertilizer dealersi/ to farmers.The maximum liability is 75% of the amount lost in each transaction or Rs 75,000,whichever is lower.
10. Production credits are extended mainly by Cooperatives, commercialbanks and directly by State Governments (t'Taqavi"l loans). The present policyis to slowly phase out the latter. Farmers who are not members of cooperativesare being encouraged to become members and some State Governments have providedloans to individuals to enable them to buy their share in some types ofcooperative societies. Commercial banks have extended commercial credits tofertilizer dealers covering up to 80% of the farmers' IOUs" endorsed to the bank.However, collateral security and/or third party guarantees are also required by theBanks.Fifth Five-Year Plan
11. The Draft Fifth Five-Year Plan covering theperiod from 1974/75 to 1978/79 envisages that total institutional agriculturalcredits during this period will amount to Rs 41,000 million. Cooperatives areexpected to channel more than three quarters of this amount:
j With a turnover o-f less than Rs 0.5 million.

ANNEX 3-2Page 4
Planned Agricultural Credit 197L4-79(Rs million)
Short-Term Medium & Long-Term Total
Cooperatives 13,000 18,250 31,250Commercial 4,000 5,750 9,750
Total: 17,000 214,000 41,000
C. Agricultural Credit Cooperatives
Primary Credit Cooperatives
12. The primary Cooperative Credit Societies (or, in some cases, PrimaryMulti-Purpose Cooperative Societies) at the village level form the backbone ofthe cooperative system in India, channelling the bulk of short and medium-termfinancing extended by cooperative societies. Loans authorized by the creditcooperatives amounted to Rs 6,014 million in 1971/72 compared to Rs 2,027 millionin 1960/61 (Table 2). The All India Rural Debt and Investment Survey of 1961/62disclosed that farmers holding each more than 10 ha.of land and having assetsover Rs 20,000 had received, on the average, credits per ha. amounting to doublethose extended to farmers holding between one and two ha. (and assets betweenRs 2,500 and 5,000) and four times the credits received by farmers in the lowestrung of the land-holding ladder.
13. The Draft Fifth Five-Year Plan recognizes that "overdues constitutethe most formidable problem facing the cooperative credit institutionsl. Over-due loans have increased rapidly since the middle sixties, both in absolutevolume and in relationship to volume of operations. The present dangerouslyhigh level is undoubtedly partly due to farmerst inability to pay after beingstruck by floods and droughts, but it is gen irally admitted that slackness inrecovery of loans has also been widespread.1 Disbursement of credits largelyin kind and linkage of credit with marketing of produce are the most importantmeasures to curtail the overdues problem. The Working Group on Cooperation hassuggested among others the following guidelines for improved liquidity of thecooperative credit system:
a) Giving first priority in allocating credits to farmers whohave repaid their previous loans from crop sale proceeds.
b) Recovering credits outstanding through marketing cooperativesin those cases where purchase of inputs is made through them.
c) Using 40;0 to 50s of proceeds from crop sales made through Unionor State Government agencies to repay cooperative credits to farmers.
14. Other weaknesses observed in the operation of primary creditcooperatives are:
1/ National Cooperative Union of India, Cooperation in IndependentIndia, page 26.

ANNEX 3-2Page
a) Cumbersome procedures for processing of loans and delays indisbursing same.1/
b) Regional imbalances, four States (Gujarat, Punjab, IMaharashtraand Tamil Nadu) accounting for over 60% of all the short andmedium-term credits extended by the cooperatives.
c) Insufficient storage space in many cooperative societies.
d) Lack of professional management, full-time employees and properaccounting systems.
e) Predominance of borrowers in the management of cooperatives orlarge borrowings and high level of overdue loans in the handsof cooperative directors.
f) Interference by political figures with cooperatives creditpolicies or recovery of loans.
g) Inexistent or, at best, marginal incentives for most membersto operate through their cooperatives.
h) Low priority given to fertilizer procurement, storage andfinancing and delays in decisions concerning them.
i) Inadequate training for cooperative staff.
j) Excessive reliance on collateral and not enough on pastperformance by the borrowers../
15. A large number of primary cooperatives are not viable and many havebeen inactive for years.2 Action is being taken to strengthen the primarycooperative societies. Coercive measures against defaulting farmers is pursuedin some cases, while in others, short-term loans which remain unpaid due touncontrollable factors are being transformed into medium-term loans. The mergingof existing units, the extension of the area of operation of some, and theliquidation of inactive ones, has permitted to reduce the number of primarycooperatives by about 25% from 212,000 in 1960/61 to 159,000 in 1971/72, andit is estimated to have dropped further through June 1974 to 155,000.
j It has been estimated that only 36% of cooperative members receivedcooperative credits in 1971/72.
j For instance, the Draft Fifth Five-Year Plan states that "for small andmarginal farmers.... the share capital required to be held by them willbe reduced and will be allowed to pay the reduced amount... in convenientinstallments". However, a little later, the same document says that "he(the borrower) may be asked to provide collateral tangible security in theform of gold or silver ornaments (frequently a bride's only possession)sufficient to cover the loan with the prescribed margin".
3/ According to a study by the RBI, approximately 21,000 societies weredormant and 63,000 had operated at a loss in 1971/72.

ANNEX 3-2Page 6
The total number of members has, at the same time, grown considerably, reachingabout 35 million at present, and the average number of members per cooperativehas also increased as shown in Table 2. The size of the average loan authorizedper member has increased from Rs 119 in 1960/61 to an estimated Rs 250 permember by March 1974./ Taking into account the loss of purchasing power,however, the average loans outstanding per cooperative member has, in fact,decreased by 13% in real terms.3/
Central Cooperative Banks
16. Short and medium-term credit to the primary credit cooperatives isextended mainly through central cooperative banks or its branches. The numberof these banks was 505 in 1960/61 and had been cut down to 342 in 1971/72 witha total share capital of Rs 1,568 million (of which 31% is owned by StateGovernments and the balance by cooperative societies). The banks had depositsof Rs 5,029 million (as of June 1972) and had extended loans amounting toas 11,095 million ('Table 3). The bulk of other operating funds is raisedthrough borrowing from the State Cooperative/"lApex" Banks. Some of the CentralCooperative Banks are financially and institutionally weak and loans overduehave increased from 12% of loans outstanding in 1961 to 36% in 1972. A Govern-ment of India program is trying to rehabilitate 54 of these banks and RBI isproviding funds to strengthen their equity structure.
Apex Banks
17. On June 30, 1972, there were 25 Apex or State Cooperative Banks witha share capital of Rs 456 million (about one third provided by State Governmentsand the balance by Central Cooperative Banks and other State and regionalcooperati-ve societies). Total financing supplied by the Apex Banks amounted tonearly Rs 10,000 million in 1971/72 (Table 4). Share capital and reserves weresupplemented by deposits (mainly from the Central Cooperative Banks) and borrcw-ings from RBI. Loans overdue amount to a relatively acceptable 7% of totalloans outstanding.
Land Development Banks
18. Long-term credit to farmers is channelled mainly through the LandDevelopment Banks. In some States there is a two-tier system with one StateLand Development Bank at the too and several Primary Land Development Banksat the relending level, while in other States--among them Gujarat and UP--loans are extended to individuals through branches of the State Land Develop-ment Bank. The Land Development Banks finance their operations mainly byissuing debentuires placed with RBI, SBI, Commercial Banks, State CooperativeBanks, Life Insurance Corporations and the State Governments. Some operationsare refinanced through ARC. Total loans outstanding with individual farmerswere As 7,082 million on June 30, 1972, and 8,973 million in March 197's.
1/ GOT Draft Fifth Five-Year Plan.
2/ No detailed information on the number of borrowers is available,but it is estimated that this number has decreased by about one third,and therefore the average loan per borrower has probably increased inreal terms.

ANNEX 3-2Page 7
Overdue loans on June 30, 1971 amounted to Rs 111 million,less than 2% oftotal loans outstanding (Table 5).J/ Although more recent figures are notavailable, it is thought that the proportion has increased after that year.
Cooperative Credit in IFFCO's Market Area
19. Share capital of Apex Banks in the seven States comprising IFFCO'smarket areai amounted to 64% of the total for India (Table 6). The propor-tion for loans outstanding, which stood at 68% in 1970/71 dropped to 605% in1973/74 and is expected to drop further through the implementation of thecurrent Five-Year Plan as a consequence of efforts to strengthen the coopera-tive movement in States lagging behind, but even by 1978/79, the seven Statesin IFFCO's area are projected to account for more than 62% of total loans out-standing. Loans overdue in the seven States (2.8%) are considerably lowerthan the average for India (6.7%) but the figure for UP is higher (Table 6).
20. In the case of Central Cooperative Banks, the share of the sevenStates in the share capital and the total loans outstanding stand at 65% and53% respectively. The relatively lower figure for the latter differs con-siderably from the share of loans authorized by the Banks in those States(70% of the total for India), which may indicate difficulties in disbursementof the loans. The level of overdue loans (41.6%) is higher than the averagefor India. This situation is particularly worrisome in Punjab and Maharashtra,where overdue loans amount to more than 5O% of the outstanding loans (Table 7).
21. In 1972, the Primary Agricultural Credit Cooperatives in the sevenStates comprising IFFCO's market area had 68% of the total share capital ~aldhad extended 67% of the loans outstanding for all of India. The latter figurewas expected to drop to 62% by the end of the current Five-Year Plan (1979).The loans overdue in these seven States amounted to 44h% of the loans outstanc.in 1972, the same as the overall Indian average (Table 8). Specially high welethe overdue levels for Rajasthan, UP, Haryana and Punjab, which were all abov_50$ in the same year.
22. Ordinary long-term loans extended by Land Development Banks in theseven States mentioned above amounted to Rs 669 million in 1971/72 or 55% ofIndia's total (Table 9). The Fifth Five-Year Plan anticipates this sun willincrease to Rs 795 million by 1979 (and slightly lesser proportion--53%--ofthe total for India--Rs 1,500 million).
D. Agricultural Marketing Cooperatives
Primary Marketing Cooperatives
23. The kingpin of the marketing and input supply activities in thecooperative movement is the Primary Marketing Society. As of June 1972, ther e
j But 23% of estimated demand.
2/ Gtqjarat, Haryana, Madhya Pradesh, Maharashtra, Rajasthan andUttar Pradesh.

ANNEX 3-2Page 8
were 3,2h0 Primary Marketing Societies, of which 2,675 were general purposesocieties covering a given territory (generally at marketing points) and therest were cooperative societies for the marketing of special commodities(mainly cotton, sugarcane, tobacco, fruit and vegetables, etc.). Members ofthe Primary Marketing Societies are 133,000 Primary Agricultural CreditSocieties, 8,400 other cooperative societies and 2,570,000 individual farmers.State Governments also participate in the capital of 2,546 marketing societies.In 1971, the GOI approved a scheme to strengthen 400 selected marketing coopera-tives and State Governments with the help of the National Cooperative Develop-ment Corp. (NCDC), have helped others. In 1U72/73, 25 weak operatives in WestBengal were liquidated.
24. The value of agricultural products handled by the cooperatives in1971/72 was Rs 8,437 million, 30% higher than in the previous year (Table 10)and it is estimated to have reached Rs 10,915 million in 1973/74. The mainnroducts marketed by the cooperative societies are food grains and sugarcane.Four States--Punjab, Maharashtra, UP and Gujarat--are by far, more active inthis field than all the others, accounting for about three quarters of thetotal value marketed by the cooperative in all of India (Table 11). This shareis expected to be reduced but by 1978/79, the Draft Fifth Five-Year Plan fore-sees it will still be about two thirds of the total.
25. At the end of June 1971, 2,371 marketing cooperatives (73% of thetotal) had managerial personnel of their own and many cooperativeshad managers on loan from other organizations. The NCDC, through the StateGovernments,is subsidizing the cost of training key personnel for marketing andprocessing cooperatives, as well as the establishment of Technical and Prom ioWJi
Personnel fools at the Apex Cooperative Societies. Lack of managerial capacity,however, is still an important constraint in the ePfectiveness of the cooperativemarketing system and allied activities, including their role in the distributicof fertilizers.
District Marketing Cooperative Societies
26. As of June 1972 there were 362 district marketing societies of which148 were general purpose marketing cooperatives and the rest special purposecooperatives (such as sugarcane supply societies feeding cooperative sugar mills).Less than 20% of the district marketing societies were engaged in actual cropmarketing operations; the others confined their activities to distribution ofagricultural inputs and consumer goods. NCDC has been trying to divert districtor regional cooperatives from direct marketing functions which it deems are theprovince of primary marketing cooperatives. On June 30, 1972, total equity indistrict marketing cooperatives was is 208 million; share capital was only Rs 76million, of which about one third was contributed by the State Governments.
Apex Marketing Cooperative Federations
27. The 21 general purpose State or Apex Marketing Cooperative Federationshad on June 30, 1971 a membership of 2,100 primary marketing cooperatives, 1,360primary agricultural credit cooperatives and 2,037 other cooperative societies.

ANNEX 3-2Page 9
Total equity of the Apex Marketing Cooperative Federations was at that timeRs 300 million; share capital was Rs 158 million, of which public sectorcontributions amounted to Rs 141 million. There were also six specialcommodity State Federations: 2 for fruits, 2 for vegetables and other commo-dities, one for sugarcane (UP), and one for cotton.
Cooperative Distribution of Inputs
28. In 1971/72, the number of cooperative retail depots in operationwas more than 38,000 and 53% of them were located in the seven States comprisingIFFCO1 s market area (Table 12). The retail value of fertilizers distributed bythe cooperatives amounted to Rs 3,220 million in 1972/73, 12% higher than in theprevious year and 29% higher than in 1970/71. Total value of other agricultura:linputs (seeds, pesticides and agricultural implements) amounted to Rs 770 millionin 1971/72 (Table 13). NCDC's policy in the purchase and distribution offertilizers and other inputs is to assign to the State Cooperative Federationsj/the role of wholesalers, to the primary marketing cooperatives that of sub-wholesalers, and leaving the retail sale of fertilizers mainly to the primaryagricultural credit societies. At present, about 50,000 primary credit coopera-tives are engaged in the sale of fertilizers handling approximately one half ofthe fertilizers sold by the cooperative system to individual farmer members(Table 14).
E. Cooperative Processing of Farm Products
Cooperative Processing Units
29. Processing units in the cooperative movement fall into one of twocategories: units established as parts of regular marketing cooperatives andunits based on independent processing cooperatives. The latter group includes542 large units such as sugar mills, oil solvent extraction plants and cottonspinning mills. Small units, such as rice mills, oil presses and jute balingunits, and medium-sized units such as ginneries and cotton pressesare generally associated to marketing cooperatives. In March 1973there were about 1,250 of these units. The most important processing coopera-tives are in rice milling, manufacture of sugar, cotton spinning and vegetableoil extraction (Table 15).
Sugar Milling
30. Sugar milling is one activity in which cooperative processing hasbecome widespread, their sugarcane crushing capacity accounting for 48.5% ofthe total capacity in India. The volume of cane crushed in cooperative millsin 1972/73 was 12.5 million tons and sugar production was 1,262,000 tons(about 38% of the country's total).
1/ In two States (Tamil Nadu and Maharashtra) there are two district levelmarketing cooperative federations also acting as wholesalers.

ANNEX 3-2Page 1 0
No. of Operating Coopera- No. of Members Cooperative SugarYear tive Sugar Mills (000) Production (000 tons)
1955/56 3 - 301960/61 30 14501965/66 52 - 9301970/71 7L4 516 1,2601971/72 80 - 1,285Y/1972/73 86 653 1,262
1/ October 1971/September 1972 season figure.
31. Membership in the cooperative sugar mills in 1973 was 653,ooo, 89%of which were sugarcane growers. Total equity as of June 1972 was Rs 1,582million, as h9L million having been contributed by members and the balance bythe State Governments. The Industrial Finance Corporation (and to a lesserdegree the Life Insurance Corporation) have provided the bulk of the long-termfunding needed by the sugar cooperatives; their loans outstanding with IFC andLIC amounted to Rs 416 and 63 million respectively on March 31, 1973. Loansfor working capital have been supplied mainly by SBI and the Apex CooperativeBanks. Only five cooperatives have defaulted, and two are thought to be inserious difficulties because of inadequate cane supplies. The largest share ofcooperative sugar processing capacity is located in Maharashtra.
Cotton Marketing, Ginning and Spinning
32. Agricultural marketing cooperatives purchased as 2,432 million ofseed cotton in 1972/73. This figure is considerably above the previous year'sone of Rs 980 million because the Government of Maharashtra introduced a mo.o-poly system and appointed the Apex Iiarketing Federation as exclusive ageit.Purchases by the Federation amounted to Rs 1,335 million in 1972/73. Ths C.+cCorporation of India also entered the cotton market purchasing mostly throughmarketing cooperatives,387,030 bales of cotton valued at Rs 447 million. How-ever, the cooperative system as a whole purchased only a modest fraction of thetotal crop estimated at over 15 million bales of seed cotton in 1972/73.
33. By March 1973, there were 235 cooperative cotton ginning and pressingunits of which 208 were operational. Most belonged to Marketing Cooperativesor Federations but some were organized as separate cooperatives. During 1971/72the cooperatives ginned 3,190,000 quintals of seed cotton and pressed 860,000bales, an increase in volume of more than 10% over operations in the previousyear. Most of the cotton ginneries are in Gujarat (e2) and Maharashtra (74).
34. Spinning mills are organized as separate cooperatives. Besidesspinning mills belonging to weavers, cooperatives there were 21 cooperativespinning mills by the end of the 1972/73 fiscal year. 1L of the mills arelocated in Maharashtra. The members of these cooperatives were individual

J-ANX 3-2Page 11
cotton growers (123,000) and Primary Credit Cooperatives (12,622). Total sharecapital as of March 1972 was Rs 137 million of which Rs 88 million was contri-buted by State Governments. Licensed mills had a total number of about 400,000spindles (most had 12,000 spindle units each). INCDC, with the approval of GOI,has embarked on a program to expand existing installations to a minimum 25,000-spindle size.
Rice Milling
35. Although there were 745 organized rice mills by March 1973, of which690 were installed, there are difficulties arising mainly from managementdeficiencies and lack of working capital. During the 1972/73 season, 52 ricemills were discontinued and only 6 pilot modern mills were organized. NCDCrequested the State Governments to obtain operating figures from rice mills intheir respective States. Answers from only 278 mills were received, and theywere discouraging 14% of the mills answering the survey were not operatingbecause of lack of paddy, 23% operated at below 20% capacity and 13% at between25% and 50% capacity. The main reason given for the situation was the establish-ment of levies on the rice-millers to supply the State Governments. These leviesranged between 50% and 90% of the paddy crop in the main rice producing States.The cooperatives did not feel they could risk buying paddy at higher prices inthe open market and later being forced to sell milled rice to the State Govern-ments at prices below cost. NCDC has taken up this problem with the GoitsDepartment of Food and the Agriculture Prices Commission. Some measures weresuggested. One would allow mill cooperatives to export rice milled from freemarket paddy to deficit States on a cooperative-to-cooperative basis. In AndhraPradesh and Madhya Pradesh, the Marketing Federations were appointed by the StateGovernments as their agents to collect rice from the cooperatives and distributeit directly to retailers, so that the distribution margins could be used to off-set the mills' losses. The effect of these measures during 1972/73 is difficultto assess because of the general short out-turn of rice due to droughts. Anotherhandicap for the rice mills was lack of financing to purchase paddy. To overcomepartially this problem, NCDC authorized working capital credits of about Rs 10million to five State Governments earmarked for margin financing of croppurchases by cooperatives.
36. During the 1972/73 year, the modernization of 54 mills was scheduled.However, some doubts on whether modern parboiling and drying processescan compete with conventional methods have been voiced. NCDC appointed acommission to study this problem and recommend measures to improve the situationof modern mills. The results of the study have not yet been published.

ANNEX 3-2Page 12
F. Other Cooperative Activities
Fertilizer Production and Mixing
37. There were 18 granular fertilizer mixirg plants owned by cooperabivesby the end of 1972/73, with an investment estimated at Rs 40 million, and atotal capacity of about 750,000 tons annually. For other units being- Plannei,a minimurm investment of Rs 5 million each has been decided upon by NCDC, of'which 20-30/a would be put up by the cooperatives and the balance advanced byN4CDC. The Maharashtra Cooperative Fertilisers and Whemicals Ltd., is planningto establish a 200 ton/day ammonia plant and plants for the production ofammonium chloride and soda ash using naphtha and common salt as raw materials.This project is sponsored by the Maharashtra State Cooperative Bank, and theGOI issued a letter of intent, but there are no great probabilities of itsbein- carried out. The Indian Farmers fertiliser Cooperative Ltd. was foundedon November 3, 1967, by the cooperatives of ton States, sponsored by NCDC andthe National Federation of Marketing Cooperatives and actively supported by theDepartment of Cooperatives in the Ministry of Agriculture.
Farming
38. There is a coo-oerative farming movement comprising two types oforganizations: collective farming societies, in which l.and is owned corrmonly,and joint farming societies in which coonerative members retain ownershin oftheir plots, but share in the work expenses and crops. As of -§une 157C0, therewere 5,199 joint farming societies with 123,000 members and 3,520 collectivefarming societies with 118,000 members. The area covered by the farmingcooperatives was 287,000 ha under Joint farming and 186,000 h.a under collec-tive farming. Many of the cooperative farming societies are weak or dormant.
iural Electrification
3°. There are five rural electrification coopDeratives-one each in theStates ot' Andhra Pradesh, Karnataka, Gujarat, fKaharashtra and UP--covering 468villages and enrolling 33,721 members as of September 30, 1973. These coopera-tives sumply electric power to 2n,500 pumps and 32,930 other outlets.
40. zStorage for farm oroducts and inouts is supplied by the Food Coroora-+-on of India, the Agricultural CGOreratives. the Central and State Warenouse
Corooration and directly by some State 3over'nment.s. Storage capac_ty inco~o-erat-ive-o{red "godowns" grew from -. ! _i lion tons in 1961 to 2.6 millionin 197,0) and an estilated 3.8 million tons - 1 '4. T-is capacitv is expectedto almost double by the end of the Fifth Five-Year Plan:

ANNEX 3-2Page 13
-H,illion Tons ----------1969/70 1973/74 1978/79Actual Estimated Target
Cooperatives 2.6 6.8Food Corporation of India 2.6 5.6 8.3Central Warehouse Corporation 0. 1.3 3.I)State Warehouse Corporation 0.2 (.6 2.1State Governments 1 .4 1.8 1.8
rotal: 7.5 13.2 23.2
Approximately 70-80g of present and projected capacity in cooperative units is
used and will be required to store fertilizers. More than 57% of the estimated1974 capacity is located in the seven States comprising IFFCO's market area.
41. About 25,000 Primary Credi.t and 1,500 Marketing Cooneratives havealso entered the retail distribution of some consumer items, such as matches,kerosene, sugar, salt, vanaspati, tea, cotton cloth, etc. In 1971/72, thevalue of goods thus sold was Rs 1,800 million.
42. A fairly new field for the cooperative movement is the installationand operation of cold storage units. 18 new units were organized in 1Q72/73(of which 13 were located in UP) bringing the total number of units organizedin the country to 128 (48 of them in UP). Total capacity actually installedwas 115,6 50 tons more than one half located in UP and Punjab (Table 15).

TABLE 1
INDIA - IFFCO FERTILIZER PROJECT
DISTRIBUTION OF AGRICULTURAL LAND BY SIZE OF HOLDING
Cumulative CumulativeHolding Size Number percentage Area percentage
(Ha) (in Million) to total (in Thousand Ha)
Below 0.20 19.0 29.7 701 0.50.20 to o.40 4.6 36.8 1,348 1.60.40 to 1.01 11.5 54.7 7,715 7.61.01 to 2.02 11.0 71.9 15,945 20.02.02 to 3.04 6.o 81.3 14,886 31.53.04 to 4.05 3.3 86.5 11,540 40.54.05 to 6.07 3.7 92.2 17,969 54.56.07 to 8.09 1.8 95.0 12,427 64.18.og to 10.12 1.1 96.7 9,774 71.7
10.12 to 12.14 o.6 97.7 6,852 77.112.14 to 20.23 1.0 99.3 15,16o 88.9Above 20.23 0.4 100.0 14,317 100.0
64.o 128,634
Source: K. S. Bawa, Availability and Disbursement of Cooperative Credit for Fertilizers.
Industrial Projects DepartmentAugust 197)i
cbIC
1'N

ANNEX 3-2Page 1 5
TABLE 2
INDIA - IFFCO FERTILIZER PROJECT
PRIMARY CREDIT COOPERATIVE SOCIETIES
1950/51 1960/61 1970/71 1971/72
No. of Cooperatives (000's) 115 212 162 159No. of Members (Million) 5 17 31 32Coverage, % of Villages --- 75 95 95
, % of AgriculturalFamilies --- 30 43 ---
, % of Rural Population 7 24 36 36Equity, Rs Million 76 577 2,057 2,195Loans Outstanding from RBI, Rs Million 2,110Deposits, Rs Million 43 146 695 739Loans Authorized --- 2,027 5,779 6,014Loans Outstanding, Rs Million 341 2,215 7,850 8,580Loans Outstanding, Short-Term,
Rs. Million 290 --- --- 6,960Short-Term Loans Disbursed in Year,
Rs Million 229 1,828 --- 5.409% Overdue 22 20 41 44Averages:-Members per Cooperative 45 80 193 201-Share Capital per Member, Rs 17 34 66 69-Deposit per Member, Rs 10 9 22 23-Loans Approved, per Member, Rs 44 119 187 188
%Gov't Participation in Capital --- 10 8 9
--- Data not available
Sources: National Cooperative Union of India, Cooperation inIndependent India, August 1972.
IFFCO, Market Analysis, August 1973K.S. Bawa, Availability and Disbursement of CooperativeCredit for Fertilizers.
Industrial Projects DepartmentAugust 1974
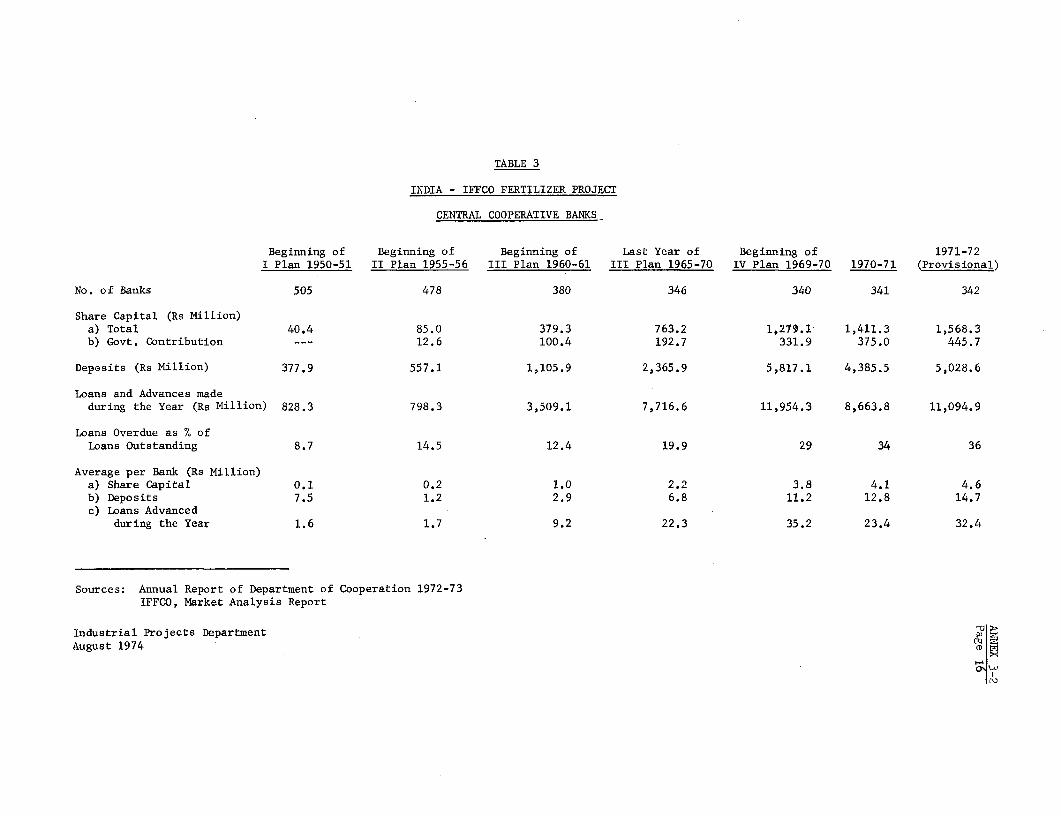
TABLE 3
INDIA - IFFCO FERTILIZER PROJECT
CENTRAL COOPERATIVE BANKS
Beginning of Beginning of Beginning of Last Year of Beginning of 1971-72I Plan 1950-51 II Plan 1955-56 III Plan 1960-61 III Plan 1965-70 IV Plan 1969-70 1970-71 (Provisional)
No. of Banks 505 478 380 346 340 341 342
Share Capital (Rs Million)a) Total 40.4 85.0 379.3 763.2 1,279.1 1,411.3 1,568.3b) Govt. Contribution --- 12.6 100.4 192.7 331.9 375.0 445.7
Deposits (Rs Million) 377.9 557.1 1,105.9 2,365.9 5,817.1 4,385.5 5,028.6
Loans and Advances madeduring the Year (Rs Million) 828.3 798.3 3,509.1 7,716.6 11,954.3 8,663.8 11,094.9
Loans Overdue as % ofLoans Outstanding 8.7 14.5 12.4 19.9 29 34 36
Average per Bank (Rs Million)a) Share Capital 0.1 0.2 1.0 2.2 3.8 4.1 4.6b) Deposits 7.5 1.2 2.9 6.8 11.2 12.8 14.7c) Loans Advanced
during the Year 1.6 1.7 9.2 22.3 35.2 23.4 32.4
Sources: Annual Report of Department of Cooperation 1972-73IFFCO, Market Analysis Report
Industrial Projects Department P f
August 1974 (D

TABLE 4
INDIA - IFFCO FERTILIZER PROJECT
APEX BANKS
Beginning of Beginning of Beginning of Last Year of Beginning of 1971-72I Plan 1950-51 II Plan 1955-56 III Plan 1960-61 III Plan 1965-66 IV Plan 1969-70 1970-71 (Provisional)
No. of Banks 15 24 21 22 25 25 25
Share Capital (Rs Million)a) Thtt;l 15.8 43.7 182.4 288.2 396.0 426.3 455.6
b) Govt. Contribution --- 18.8 64.6 99.6 117.7 133.8 ---
Deposits (Rs Million) 220.8 366.7 723.3 1,465.1 2,343.0 2,787.0 3,294.2
Loans and Advances madeduring the year (Rs Million) 421.3 678.6 582.0 4,742.2 7,151.6 7,475.9 9,985.9
Source: Annual Report of Department of Cooperation 1972-73
Industrial Projects DepartmentAugust 1974
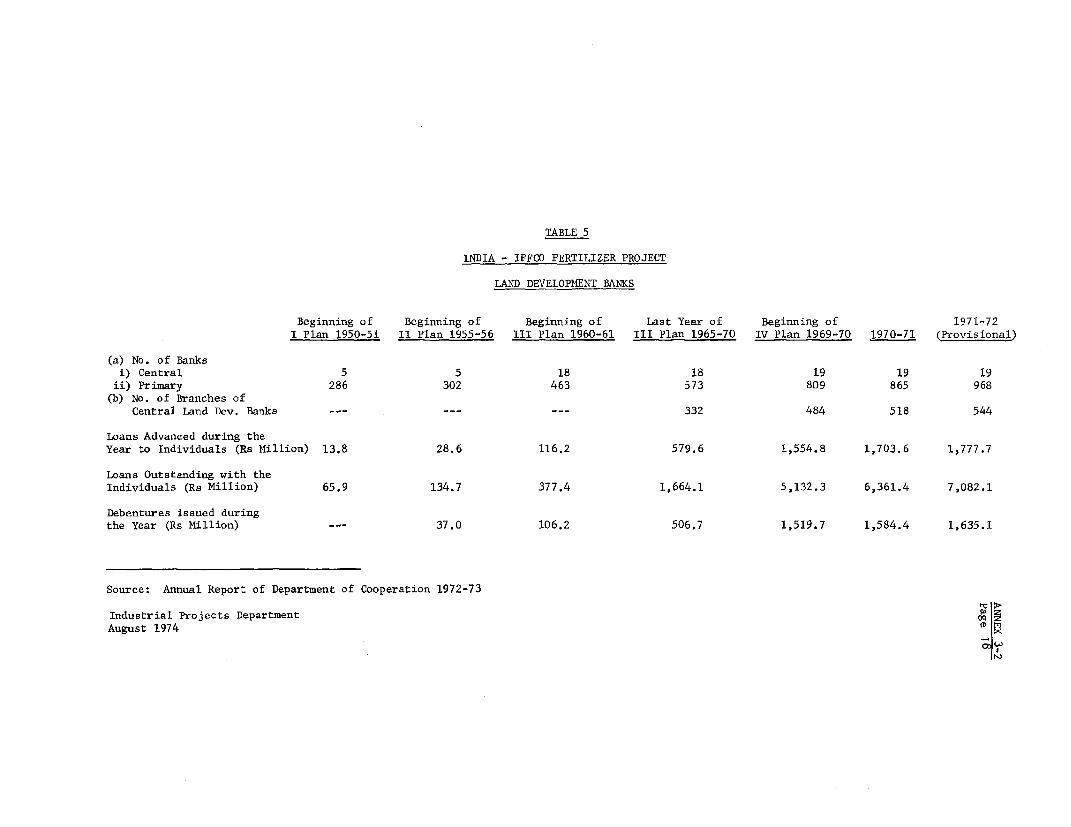
TABLE 5
INDIA - IFFCO FERTILIZER PROJECT
LAND DEVELOPMENT BANKS
Beginning of Beginning of Beginning of Last Year of Beginning of 1971-72I Plan 1950-51 II Plan 1955-56 III Plan 1960-61 III Plan 1965-70 IV Plan 1969-70 1970-71 (Provisional)
(a) No. of Banksi) Central 5 5 18 18 19 19 19ii) Primary 286 302 463 573 809 865 968(b) No. of Branches of
Central Land Dev. Banks --- --- --- 332 484 518 544
Loans Advanced during theYear to Individuals (Rs Million) 13.8 28.6 116.2 579.6 1,554.8 1,703.6 1,777.7
Loans Outstanding with theIndividuals (Rs Million) 65.9 134.7 377.4 1,664.1 5,132.3 6,361.4 7,082.1
Debentures issued duringthe Year (Rs Million) --- 37.0 106.2 506.7 1,519.7 1,584.4 1,635.1
Source: Annual Report of Department of Cooperation 1972-73
Industrial Projects DepartmentAugust 1974

TABLE 6
INDIA - IFFCO FERTILIZER PROJECT
STATISTICS OF APEX BANKS IN SEVEN STATES AND ALL INDIA 1970/71(Rs million)
Sub-Total
Gujarat Haryana M.P. Maharashtra Punjab Rajasthan U.P. 7 States All India
Share Capital (Total) 27.9 14.9 34.0 82.6 47.3 20.3 44.2 271.1 426.3
Of which Govt. Contribution 10.6 6.6 11.2 30.3 15.8 4.0 4.7 83.2 133.8
Statutory & Other Reserves 45.2 9.5 52.2 105.9 13.1 19.9 48.3 294.1 500.6
Deposits 293.0 42.5 127.8 933.2 151.6 34.0 278.1 1860.2 2787.0
Working Capital 665.5 155.5 669.8 1874.2 394.9 184.2 685.1 4629.2 6852.1
Loans Advanced 805.3 380.9 640.5 2069.3 591.0 169.0 652.4 5308.4 7475.9
Loans Outstanding 524.2 133.2 573.0 1419.0 296.8 164.4 523.7 3634.3 5342.7
Loans Overdue - 0.1 32.3 20.7 5.9 - 42.7 101.7 358.7
Overdues as % of Totaloutstanding loans - 0.1 5.6 1.5 1.9 - 8.2 2.8 6'.7
Source: IFFCO, Market Analysis Report
Industrial Projects Department M
August 1974
\o w

TABLE 7
INDIA - IFFCO FERTILIZER PROJECT
CENTRAL COOPERATIVE BANKS IN SEVEN STATES AND ALL INDIA (1970-71 FIGURES)(Rs million)
Gujarat Haryana M.P. Maharashtra Punjab Rajasthan U.P. 7 States All India
No. of Banks 18 9 43 25 17 25 56 341Share Capitali) Total 154.0 40.1 134.7 251.5 125.5 53.7 164.5 926.0 1411.3ii) Govt. Contribution 19.3 12.5 51.3 66.9 53.9 13.7 27.9 245.5 375.0Statutory and other
reserves 76.9 14.1 47.1 102.9 32.8 8.8 51.8 334.4 579.2Deposits 783.7 99.9 240.3 1132,3 82.1 383.0 3108.4 4385.5Loans Advancedi) Total 1442.3 167.9 619.4 2309.3 775.6 189.2 592.3 6096.0 8663.8ii) M.T. 65.5 9.5 56.2 20.0 47.1 11.9 41.2 251.4 643.1Loans Outstandingi) Total 1061.2 191.6 808.8 789.6 472.8 249.4 770.4 4343.8 8134.0ii) M.T. 131.8 24.2 166.8 326.8 96.0 64.9 136.4 946.9 1458.2Loans Overduei) Total 207.3 70.4 277.6 490.0 278.5 108.9 375.3 1808.0 2741.9ii) M.T. 8.0 6.9 55.2 36.4 26.1 24.7 50.3 207.6 342.4Overdues as % ofoutstanding loans 20 37 34 62 59 44 49 41.6 34
Source: IFFCO, Market Analysis Report
Industrial Projects Department OQAugust 1974
o w

TABLE 8
INDIA - IFFCO FERTILIZER PROJECT
PRIMARY AGRICULTURAL SOCIETIES IN SEVEN STATES IN RELATION TO ALL INDIA (1971-72)
Punjab Haryana U.P. Guiarat M.P. Rajasthan Maharashtra 7 States All India
1971/72 Actual
No. of Societies 10,931 6,659 25,100 8,293 9,884 7,727 19,973 88,567 188,783
Membership (In 'OOs) 1,483 716 5,925 1,380 2,241 1,288 3,199 16,232 31,985
Percentage of RuralPopulation covered 50 44 39 35 32 30 46 --- 36
Share Capital (Rs Millions)i) Total 124.0 51.0 239.0 269.0 178.0 75.0 548.0 1,484.7 2,195.0
ii) Govt. 10.0 8.0 23.0 8.0 35.0 14.9 14.2 112.4 202.6
Deposits (In Rs Millions) 203.5 8.6 57.5 52.8 43.8 14.3 45.2 425.7 738.8
Loans Advances (Rs Millions)i) Total " 613.9 192.5 512.5 852.5 565.3 97.4 1,105.0 3,939.1 6,014.3
ii) Medium Term " 34.9 4.3 130.0 37.7 65.6 6.9 226.7 599.8 738.0
Loans Outstandingi) Total " 569.1 215.1 850.6 951.6 895.1 231.1 1,683.7 5,396.3 8,031.4
ii) Medium Term " 96.8 --- 207.3 107.6 205.6 42.7 409.7 1,069.7 1,517.9
Loans overdue 284.7 114.6 451.9 249.3 384.0 145.8 738.6 2,368.9 3,535.9
Overdues as % ofLoan Outstanding 50 53 53 26 43 63 44 43.9 44
Average Per Societya) Membership (Nos.) 136 108 236 166 227 167 160 183 201
b) Share Capital (Rs) 11,335 7,659 9,530 32,509 17,989 9,719 27,442 1b,764 13,825
c) Deposits (Rs) 18,617 1,291 2,291 6,367 4,431 1,851 2,263 4,807 4,653
Average Per Membera) Share Capital (Rs) 84 71 40 195 79 58 171 91 69
b) Deposits (Rs) 137 12 10 38 20 11 14 26 23
c) Loans (Rs) 414 269 86 618 252 76 345 243 188
1973/74 EstimateLoans Outstanding (Rs Million)
- Total 850 200 820 1,280 800 340 820 5,110 9,058
- Medium Term 200 5 220 380 175 40 50 1,070 2,050
1978/79 Plan TargetLoans Outstanding (Rs Million)
- Total 1,390 490 1,400 1,760 1,650 850 1,400 10,140 16,482
- Medium Term 250 40 250 460 350 100 350 1,800 2,050
Source: Annual Report of Department of Cooperation 1972-73
Industrial Projects DepartmentAugust 1974
M D

ANNEX 3-2Page 2 2
TABLE 9
INDIA - IFC)O i'&TILIZR PitOJECT
ORDINARY LONG-TERM IOANS ADVANCED BY LAND DEVELOPMENT BANKS
DISTRIBUTION BY STATES(Rs million)
1968-69 1971-72Percentage of Percentage of
Loans All-India Loans All-IndiaState Advanced Total Advanced Total
Andhra Pradesh 131 11.1 140 11.5Assam 0.1 1 o.8Bihar 20 1.7 74 6.2Gujarat 203 17.0 151 12.4Haryana 35 3.0 43 3.6Himachal Pradesh 2 0.2 4 o.4Jammu and Kashmire 2 0.2 5 0.4Karnataka (Mysore) 51 4.3 74 6.oKerala 10 0.9 17 1.5Madhya Pradesh 33 2.8 - 4.2Maharashtra 256 22.6 - 8.1Manipur MeghalayaNagaland - _ -Orissa 20 1.7 31 2.6Punjab 62 5.3 105 8.7Rajasthan 24 2.0 25 2.1Tamil Nadu 162 13.7 196 16.2TripuraUttar Pradesh 163 13.8 .187 15.4West Bengal 11 0.9 10 0.9Other 2 0.2 4 0.4
Total: 1,187 100.0 1,217 100.0
Source: Draft Fifth Five Year Plan, Vol. II, Chap. 2, Annexure V
Industrial Projects DepartmentAugust 1974

ANNEX 3--2Page 23
..ABLZ 10
INDIA - IFFCO FERTILIZER PROJECT
MAIN FEATURES OF PRIMARY MARKETINa COOPERATIVE SOCIETIES
196769 1969/70 1970/71 1971/72
No. of Marketing Societies _ - - 3,303 3,240
No. of Individual FarmerMembers (000's) 2 - ,162 2,441 2,570
No. of InstitutionalMembers (000's) - -- 172 146 141
Of which, Primary CreditSocieties (000's) - - - - - - 133
Equity (Rs Million) 419 454 -_ -Share Capital (Rs Million) 263 274 _ _ _ __
Of which, GOI " 177 183 - -- - --
Value of Crops Marketed 5,880 6,000 6,487 8,437- Food Grains 2,210 2.020 2,606 4,285- Sugarcane 2,270 2,600 2,244 2,478- Other Crops 1,400 1,380 1,637 1,674
Source: National Cooperative Development Corporation (NCDC),Arnual aeDorts1971/72 and 1972/73.
--- Not available
Industrial Projects DepartmentAugust 1974

ANINEX 3-2Page 24
TABLE 11
INDIA - IFFCO FERTILIZER PROJECT
VALUE OF CROPS MARKETED BY THE COOPERATIVE SYSTEM(Rs million)
1968-69 1971-72 1973-74 (Est.) 1978-79 Target
Andhra Pradesh 235. 126 300 650Assam 96 142 150 400Bihar 73 143 150 400Gujarat 57 918 980 1,250Haryana 144 342 350 600Himachal Pradesh --- 11 13 50Jammu and Kashmir 6 19 30 150Karnataka (Mysore) 264 426 500 1,000Kerala 82 144 180 580.Madhya Pradesh 117 234 350 800Maharashtra 1,687 1,936 3,500 5,000Manipur --- 1 5 10Nagaland --- --- 3 10Orissa 16 27- 80 200Punjab 761 2,400 2,250 3,500Rajasthan 35 78 200 200Tamil Nadu 252 198 250 500Tripura --- 2 10 50Uttar Pradesh 1,456 1,248 1,400 2,600West Bengal 69 20 180 500Other 25 20 34 108
Total 5,885 8,436 10,915 18,558
Source: Draft Fifth Five Year Plan, Vol. II, Chap. 2, Annexure VI
Industrial Projects DepartmentAugust 1974

ANNEX 3-2Page 25
TABLE 12
INDIA - IFFCO FERTIIMZER PROJECT
COUPEXATI'E ±ttfAIL DEPOTS
State 1966-67 1967-68 1968-69 1969-70 1970-71
Andhra Pradesh 4,110 3,219 4,110 4,119 1,516Assam - - - - -
Bihar 4,753 4,703 4,220 4,220 1,560Gujarat 2,150 3,393 3,304 3,304 3,083Jammu and Kashmir 761 761 761 761 785Haryana 2,000 1,497 2,000 2,000 1,850Karnataka (Mysore) 4,373 4,373 4,308 4,533 3,290Kerala 1,202 1,363 1,363 1,363 2,149Madhya Pradesh 3,864 2,343 2,350 2,350 3,500Maharashtra 8,000 3,318 3,318 3,318 2,417Meghalaya - - - - 200Tamil Nadu 3,573 2,970 2,977 2,977 3,123Orissa 3,028 2,629 2,673 2,673 3,350Rajasthan 2,626 2,543 1,863 1,863 2,204Panjab 4,002 4,000 4,000 4,000 4,o65Uttar Pradesh 1,910 1,909 2,026 2,026 3,501West Bengal 1,679 1,679 1,000 1,000 1,605Himachal Pradesh - - - - -Other 1,139 227 227 227 413
48,170 40,927 40,473 40,707 38,620
Source: Draft Fifth Five-Year Plan, Vol. II, Chapter 2, Annexure VII.
Industrial Projects DepartmentAugust 1974

TABLE 13
INDIA - IFFCO FERTILIZER FROJECT
COOPERATIVES ROIE IN SUPPLYING FERTILIZERS AND OTHER INPUTS TO FARMERS
(Values in Rs million)
Actual Estimate Target1961/62 1968/69 1969/70 1970/71 1971/72 1972/73 1973/74 1978/79
Fertilizers 323 2,000 2,325 2,498 2,883 3,220 3,565 8,639Seeds -- - 235 --- 395 5.0 -- - 600 ---
Agricultural Equipment -- - 66 --- 104 120 -- 150 _o_Pesticides & Insecticides -- - 221 -- - 177 200 --- 250 -- -
__- - 2,522 --- 3,174 3,653 4_ 4,565 10,639
Source: Draft Fifth Five Year Plan, Vol. II, Chap. 2, Table 2 and Annexure VIIIIFFCO, Market Analysis Report, August 1573
___ Not available.
Industrial Projects DepartmentAuLust 1 'j7l,
o W

TABLE 14
INDIA - IFFCO FERTILIZER PROJECT
VALUE OF FERTILIZER DISTRIBUTED AND SHORT-TERM AGRICULTURAL CREDIT DISBURSED BY COOPERATIVES (1971-72)
Value of Fertilizers Overdues as per-Value of Fertilizers Distributed by Primary centage of loan
Distributed by Agricultural Credit outstanding atCooperatives Societies Short-Term Credit Disbursed end of year
Per Ha ofTotal Per Ha Total % of Total Cropped Area Ratio
States (Rs Million) (Rs) (Rs Million) Col. 1 (Rs Million) (Rs) Percentagef (6)(1) (2) (3) (4) (5) (6) (7) (8)
Andhra Pradesh 157 12 17 11 267 20.0 52 0.58Assam 7 3 -- -- 11 4.3 86 0.53Bihar 120 11 13 11 121 10.9 66 1.00Gujarat 393 39 253 65 879 87.4 25 0.45Haryana 193 39 67 35 189 38.0 48 1.02Himachal Pradesh 13 15 3 23 26 27.9 27 0.51Jammu & Kashmir 12 14 11 90 22 24.7 55 0.54Karnataka (Mysore) 149 --- 108 73 408 --- 51 0.36Kerala 73 25 70 96 311 106.0 30 0.23Madhya Pradesh 174 9 105 60 488 23.7 46 0.36Maharashtra 408 22 179 44 882 45.7 29 0.46Manipur --- --- 1 3 14.9 82 ---Orissa 44 6 13 30 109 12.9 57 0.40Punjab 432 76 315 73 578 101.7 56 0.75Rajasthan 52 4 13 24 91 5.4 44 0.57Tamil Nadu 308 42 124 40 568 76.8 24 0.54Tripura --- --- --- --- 8 20.9 28 ---Uttar Pradesh 303 14 20 7 397 17.1 48 C.76West Bengal 33 5 4 10 46 6.4 57 0.71Other 19 43 7 33 13 --- -- 1.50
Total (All India) 2,883 18 1,314 46 5,410 32.31 40 0.53
-- Less than 0.1--- Not Available
Source: K. S. Bawa, Availability and Disbursement of Cooperative Credit for Fertilizers. X
Industrial Projects DepartmentAugust 1974

TABLE 15
INDIA - IFFCO FERTILIZER PROJECT
NUMBER OF COOPERATIVE PROCESSING UNITS (MARCH 1973)
Cotton Cotton Oil (Pressing) Oil (Solvent)Rice Sugar Sugar Ginning Spinning Extraction Extraction Jute Cold Total TotalMills Mills By-Products & Pressing Mills Plants Plants Baling Storage Other Organized Installed
Gujarat 22 13 1 89 3 27 1 - 3 1 160 143Punjab 27 4 - 5 - 1 2 - 16 6 61 44U.P. 18 12 - - 1 12 1 2 48 47 141 103Madhya Pradesh 92 1 - 14 - 6 - - 7 32 152 119Maharashtra 127 55 7 79 14 85 2 - 3 17 389 335Haryana 13 4 1 1 - 2 - - 2 6 29 16Rajasthan 6 1 - 3 1 - 1 - 2 8 22 17
Sub-total 305 90 9 191 19 133 7 2 81 117 954 777
Other States & Terr. 440 44 6 44 5 53 2 42 47 155 838 464
Total Organized 745 134 15 235 24 186 9 44 128 272 1,792
Total Installed 690 86 11 208 20 145 5 40 80 194 1,479
OQD MSource: NCDC, Annual Report 1972-73
Industrial Projects DepartmentAugust 1974

INDIAIFFCO FERTILIZER PROJECT
FLOW OF PRODUCTS AND FUNDS IN AGRICULTURAL COOPERATIVES
LONG TERM CREDITS MEDIUM AND SHORT- MARKETING, STORAGE ANDTERM CREDITS INPUT DISTRIBUTION CROP PROCESSING CTHER
LEVELS:
ALL -INDIA CENTRAL ALL- INDIA STATE CO,OPLAND DEVELOP'T BANK BANKPEN
CO-OP UNION
EAR | LIC/UTI | g t NATIONAL MARKETING
NATIONAL CODOPERATIVE FED( EXPORTSI
OV'TSI L -. o- STATE AGENCIES
STATE CEN RAL LAN DTATE/AP| STATE/APES CO-OP FRUIT &
DVELPT BAN CO-OP BANKS | N RMARKETINX EDT FED
l~~~~~~~~~~~~~~~~~~~_:l 'E : FDRAUTIlON OF
DISTRICT D CENTRAl CO-OTT MARKETING _ CO-OP FERTILIZE ERBANKS c OCIETIES ~~~~~~~~~~~~~~~~~~~~~~~MIXING PLANTS
~~AR LS Il.RRAL ELECTRI-FICATION CO OPS
VILLAGE PRIMARY AGRICUL-1 MULTI-PURPOSE- -COPRIMARYOR F 7 1IC~IN
INTERMCEDIATE TURALCREDIU PRIMAY MARKET L CO-OP PROCESSING CO-OF SPINNINGINTERMEDIATE | -. _| | ~~~~~CO-OP SOCIETIES |CO-OPSOCIETIES | | |CO-OPS |. UNITS MILLS
INDIVIDUAL
FARMERS
LEGENDFLOW OF CREDITS
,, _, _, FLOW OF CROPS
FLOW OF FERTILIZERS
WOrld B-k- 898AIRI

ANNEX 3-
INDIA - IFFCO FERTILIZER PROJECT
HISTORICAL DEVELOPMENT OF THE FERTILIZER MARKET
A. Consumption
1. Consumption of nitrogenous fertilizers in India has grown in thelast 20 years at a rate of 16.1% annually (Table 1) which is higher than theworldwide trend, which was 10.h% annually. The speed at which Indian con-sumption of phosphatic and potasBic fertilizers has increased in the sameperiod is even higher (Table 2) and the average for the 3 major nutrients was 17.3%.
2. A decade ago, approximately one half of the total nitrogen con-sumption was as ammonium sulphate. The trend towards higher nutrient-contentand complex fertilizers which was characteristic of the situation throughoutmost of the world also swept India and at present 64% of the nitrogen contentof fertilizers distributed in India (Table 3) is as urea and 14% as variousfertilizers containing both N and P: diammonium phosphate (DAP), complexfertilizers (NPK) and nitrophosphates (NP). The same trend is applicable tophosphatic fertilizers (Table 4). Although the volume of superphosphatedistributed in India haa increased by 54% from 1962/63 through 1972/73, con-umption of phosphatic fertilizers other than superphosphate was insignificantin 1962/63, while in the last year only 2h% of the phosphoric acid content wasdistributed as superphosphate and most of the balance was as DAP and NP.
3. The distribution of N consumption by States is shown in Table 5.The largest consuIers in descending order are the States of UP, Punjab, TamilNadu, Andhra Pradesh, Maharashtra, Gujarat and "ysore. Rapid growth of con-sumption in the last 5 years has been registered in Madhya Pradesh, Orissa,Haaryana, Rajasthan and Gujarat, while there was a small drop in AndhraPradesh. As for phosphatic and potassic fertilizer consumption, the sixhighest consumers are the same States as for N, although in different order(Table 6).
4. Leaving aside Pondicherry and Delhi, which have very small areaa,intensity of fertilization (Table 7) is highest in the States of Punjab (59kg/ha), and Tamil Nadu (h5 kg/ha), followed by Kerala, UP, and Andhra Pradesh(all more than 20 kg/ha). In Assam and Rajasthan, on the other hand, averagechemical fertilizer dosages are less than 5 kg/ha. Even in the same State, thereare great variations in different districts (Annex 3-6). Average dosages and per
capita consumption of fertilizers in several countries is shown in Table 8.India's intensity of fertilization (kg/ha of arable lands) is higher than theaverage for all developing countries but lower than for Aaia and only aboutone third the world average. Because of the high population pressure oncultivated land, India's position is even more disadvantaged if measured byper capita consumption of fertilizers. Although comparisons of this typeshould not be made without consideration of types of crops grown, extent ofirrigation and agricultural practices, the Table does indicate that there isundoubtedly a case for increasing use of fertilizers in India.

ANNEX 3-4Page 2
B. Production
5. In the 10-year period from 1953/54 to 1973/74, the average rateof growth of domestic production of nitrogenous fertilizers fell behind thegrowth in consumption (Table 1). Estimated figures for 1974/75, show anincrease of more than 20% over those for the previous year. Growth ofphosphatic fertilizer production practically parallels that of nitrogenousfertilizers, both having increased about 13-fold in the 15-year period from
1957/58 to 1972/73 (Table 2). Basic potassic fertilizers are not producedin India; although complex NPK fertilizers are manufactured domestically(Table 9), they are all made from imported potassium salts.
6. Until 1958/59, the only nitrogenous fertilizer produced in Indiawas ammonium sulphate!/. In 1959/60, production of ammonium sulphate nitrate,ammonium chloride and urea was begun and a year later, calcium ammoniumnitrate (Table 10). At present (1972/73), 62% of the N content in the Indianfertilizer output is in the form of urea, and that of ammonium sulphate hasdropped to only 10.8%. A similar change has occured with phosphatic fertilizers(Table 11).
7. Production of nitrogen fertilizers by States is shown in Table 12.Only four States--Rajasthan, Assam, Orissa and Gujarat--produce more nitrogenin fertilizers than they consume. Of the others, many are small consumers,but four--UP, Punjab, Andhra Pradesh and Mysore--have annual deficits of over100,000 tons of N, and four others of more than 50,000 tons: Madhya Pradesh,Haryana, Tamil Nadu and Maharashtra. UP, Punjab, and Mysore also have sub-stantial deficits in P205 (Table 15), while Maharashtra and Delhi have hadsurpluses in 1972/73.
C. Imports and Distribution
8. The Central Fertilizer Pool ('Pool') came into existence in 1942as a public sector agency charged with the importation of fertilizers togive support to the Grow More Food campaign instituted in response to afamine in Bengal. By 1974, when the first relatively large factory (ownedby FACT) began operations, the Pool also undertook the allocation of locallymade nitrogenous fertilizers to the State governments. After 1966, domesticproducers were allowed to market part of their products or appoint agenciesof their choice. Statewise distribution of fertilizers is mainly controlledby the State governments and entrusted to cooperatives, manufacturers,agencies, private dealers and, in some cases, to Agro-Industries Corporations(which in turn may have a choice of dealers of their own or work throughprivate dealers). Some States have also developed their own distributorships,for instance the Agriculture Supply Organization in UP or have used otherorganizations such as the Food Corp of India. However, the Fifth Five-YearPlan envisages that cooperatives will progressively increase their share infertilizer marketing and FCI has agreed to sell 50% of its output through theState governments for distribution through cooperatives and other publicsector agencies.
1/ By coke gasification or obtained as by-product from coke oven gas,and a small quantity (about 10,000 tons annually) by wood gasification (t)

Page 3
TABLE 1
INDIA - IFF0 FT=ILIZE PROJECT
INDIA: CHaIL NIIOGIIOUS FRTIIZER
CfSMITJION AND PRODUCTIR?(Quantities in 000's Tons of N)
Consumption Production ImPortsYearj Volume Growth Volume % Growth Volume % of Consumption
19521! 58 63 44 75.91953/54h 92 58.6 61 (3.2) 54 58.81957/58 149 62.0 81 32.8 110 73.81958/59 172 15.4 81 - 98 57.01959/60 229 33.1 84 3.7 142 62.01960/61 212 (7.4) 112 33.3 172 81.11961/62 292 37.7 154 37.5 143 49.01962/63 360 23.3 194 26.0 229 63.61963/64 407 13.1 219 12.9 198 48.61964/65 434 6.7 243 10.9 257 59.21965/66 547 26.0 238 (2.1) 376 68.71966/67 831 51.9 309 29.8 575 68.51967/68 800 (3.7) 403 30.4 976 122.01968/69 1,131 41.4 563 39.7 780 69.01969/70 1,360 20.2 731 29.8 574 42.21970/71 1,487 9.3 833 14.o 482 32.41971/72 1,755 18.o 949 13.9 462 26.31972/73- 1,779 1.4 1,056 11.3 691 38.81973/74 1,835 3.1 1,067 o.4 670 36.5197W/75Yl 2,200 19.9 1,430 34.0 770 35.0
Average AnnualRate of Growth (%):
1953/54-1973/74 16.1 15.31963/64-1973/74 16.3 17.11961/62-1971/72 i 19.7 19.91968/69-1973/74 10.2 13.5
Note: A regression equation of the type Y=Yo(1 + r)t will show an annual rate of11.9% for consumption in the period 1959/60-1972/73.
1 April to March, except for 1952 figures which are for the calendar year.2/ Average of calendar years 1953 and 19543/ Estimates2' Years in which no excessive surplus or deficit of fertilizer supply was noticed.
Sources: FAI, Fertiliser Statistics, 1972/73, Tables 7.02/7.04.FAI, Fertiliser News, Vol.19, No. 3 (March 1974).Unpublished preliminary data from Ministry of Petroleum and Chemicals.
Industrial Projects DepartmentJuly 1974

ANNEX 3-4Page 4
TABLE 2
INDIk - IFCO FMUTILIZER PROJECT
INDIA: CHD4ICAL PHOSPHA TIC AND POTASSIC FUTILIZER
CCNSUMPTICII AND PROD1JCTION
(Quantities in 000's of Tons of Niutrient)
Phosphatic Fertilizers Potassic FertilizersConsuution Production Imports Consumption
Year , Volume Growth Volume % Growth Volume Volume / % Growth
1952 5 7 - 31953/542/ 12 140 14 100 9 2001957/58 22 83 26 86 _ 13 141958/59 29 32 31 19 - 22 691959/60 54 86 51 65 4 21 (5)1960/61 53 (2) 54 6 * 29 381961/62 54 2 65 20 1 28 (3)1962/63 81 50 88 35 8 36 291963/64 117 44 108 23 12 51 421964/65 148 27 131 21 12 70 371965/66 132 (11) 119 (9) 22 78 111966/67 249 89 146 23 129 116 491967/68 236 (5) 207 42 371 130 121968/69 389 65 213 3 91 154 191969/70 420 8 224 5 88 209 361970/71 462 10 228 2 32 228 91971/72 563 22 290 27 241 303 331972/73 587 4 330 14 211 332 101973/74 610 4 390 18 220 330 (1)1974/75i 750 23 400 2 350 400 21
Average AnnualRate of Growth (%)
1953/54-l973/74 21.9 18.5 19.71961/62-1971/72 24.3 16.1 26.81968/69-1973/74 9.4 12.9 16.5
1/ From April to March, except for 1952 which is calendar year.j Until 1958/59 figures shown are imports; from 1959/60 through 1966/67,
fertilizer distributed; after 1966/67, actual consumption3/ Average for calendar years 1953 and 1951T/ Preliminary.
Sources: FAI, Fertiliser Statistics, 1972/73, Tables 7.02/7.04.
Industrial Projects DepartmentJuly 19714

TABLE 3
INDIA - IFFGO FgTILIZR FROJFT
INDIA: NITROGEN DISTRUBITION BY TYPE OF CHEMICAL FERTILIZER
- -%…- ----------000's of tons of - -------- % of Total -------N Content 1961/62 1966/67 197L/72 1972/73 1961/62 1971/72 1972/73
Urea 46.o 67 274 1,024 1,118 21.9 62.8 64.2
Ammonium Sulphate 20.6 153 326 177 160 50.0 10.9 9.2Ammonium Sulphate Nitrate 26.0 23 23 11 15 7.5 0.7 0.9
Calcium Ammonium Nitrate 1/ 57 129 166 183 18.6 10.2 10.6Mono-Amonium Phosphate 20.0 - 39 7 2 - 0.4 0.1
Diammonium Phosphate 18.0 - 29 62 77 - 3.8 4.4Urea Ammonium Phosphate 2/ - - 72 53 - 4.4 3.0
Nitrophosphates 3/ - 10 36 39 - 2.2 2.2
NPK Comrnlex Fertilizer / - - 54 74 - 3.3 4.3Other 5/ 6 21 21 20 .2.0 1.3 1.1
306 851 1,630 1,741 100.0 100.0 100.0
l/ 26% in 1961/62 and averaging 21X3% in 1966/67, 25.4% in 1971/72 and 25.5% in 1972/73.2/ Averaging 26.3% in 1971/72 and 27.2% in 1972/73.3/ 16% in 1966/67 and averaging 16.4% in 1971/72 and 15.8% in 1972/73./ Averaging 15.2% in 1971/72 and 15.9% in 1972/73.:/ Including Chilean sodium nitrate, ammonium chloride and amnonium phosphate sulphate.
Source: FAI, Fertiliser Statistics, 1972/73, Table 5.08. Remarks: There is no breakdown of consumDtionby type of fertilizer. There are small differences between total N distribution according to
this Table and quantities shown as distributed in Table 7.01 of the same publication.
Industrial Projects DepartmentJuly 1974

TABLE 4
INDIA - IFFCO FERTILIZER PROJECT
ANNUAL DISTRIBUTIC1 BY TmPE OF CHENICAL FUETILIZER IN INDIA(000 Tons)
P205Fertilizer 1961-62 1962-63 1963-64: 1970-71 1971-72 1972-73 1972-3
Ammonium sulphate (20.6% N) 744.5 936.3 795.3 1,044.6 860.8 744.5 -Urea (46% N) 146.0 184.6 247.4 1,701.1 2,225.9 2,430.4 _Ammonium sulphate nitrate (26% N) 88.4 55.0 50.7 69.7 40.0 56.6 -Calcium ammonium nitrate: -(25% N) - - - 318.9 411.8 419.1 -
-(26% N) 219.3 294.7 494.0 241.4 241.4 298.1 -Ammonium chloride (25% N) 8.4 6.7 12.4 27.1 20.2 14.1 -Ammonium phosphate sulphate (16-20-0) 12.0 9.6 25.9 87.2 101.3 98.9 19.8Ammonium phosphate (20-20-0) - - 21.4 45.4 0.6 36.0 2.1 0.4Urea ammonium phosphate: -(28-28-0) - - - 141.6 225.7 174.9 49.O
-(20-20-0) - - - 39.5 42.1 19.8 4.0-(22-22-11) - - - 5.0 6.2 - --(14-35-14) - - - - - 25.7 9.0
Nitrophosphate: -(20-20-0/2) 5.0 13.3 17.6 74.4 42.1 - --((18-18-9) - - - 24.5 26.2 - --(15-15-15) - - - 64.4 151.5 211.0 31.6-(14-7.5-14) - - - 2.9 - - --(20-20-0)* - - - - - 36.1 7.2
NPK complex fertilizers: -(15-15-15) - - - 162.1 296.1 179.4 26.9-(14-28-14) - - - - 12.1 44.3 12.4-(17-17-17) - - - - 44.6 238.3 40.5-(18-27-3) - - - - 3.1 1.7 0.3
Diammonium phosphate (18-46-0) - - - 156.4 343.9 428.9 197.3Mono ammonium phosphate - - - - - 12.3 5.0Chilean natural nitrate of soda 8.4 12,6 - - - - -Single superphosphate: -(16% P205) 380.2 512.7 625.2 683.9 750.3 794.4 127.1
-(18.5% P205) - - - 0.4 0.3 - --(17.5% P205) - - - - --(21.0% P205) - - - - - - _
Triple superphosphate (45% P205) - - - 8.0 7.2 4.3 2.0Muriate of potash (60% K20) 41.5 57.9 80.7 277.8 350.5 472.2 -Sulphate of potash (48-52% K20) 6.1 3.5 4.3 13.4 3.0 3.8 _
Note: Minor amounts (less than 300 tons) are not showm
* Ammonium nitrophosphate (imported).Source: Fertiliser Association of India, Fertiliser Statistics 1972-73.
Industrial Projects DepartmentJuly 1974

UaNEX 3-4Page 7
TABLE 5
INDIA - IFFCO FERTILIZER PROJECT
CHDICAL NITROGEN CCNI8U1PTION B! STTES
(000's of Tons of N)
GrowthRatel/
1968/69 1969/70 1970/71 1971/72 1972/73 %/Yr
NorthHaryana 140 145 61 73 83 22.4H-Iimachtal Pradesh 14 3 3 14 5 8.7Jamrnu & Kashmir 5 3 4 4 8 114.5Punjab -135 147 175 225 235 17.7
Pun92143 30 331 1 .6Central
Uttar Pradesh 220 306 291 346 373 11.0Rajasthan 23 31 41 50 48 22.0Madhya Pradesh 21 314 51 7 92 146.0
264 -371 353 513 13East
Assam 14 3 5 7 19.7Bihar 149 70 75 88 89 114.15rissa 15 18 20 37 41 33.2West Bengal 32 34 47 56 52 17.8
o 100 114 1.96 7WIest
Gujarat 67 65 106 1114 1114 20.6Maharashtra 85 92 111 130 114 8.4
152 1 217 2 228 7TSouth
Andhra Pradesh 218 237 207 196 172 (7.3)Kerala 28 30 26 31 33 3.3Mysore (Karnataka) 69 87 93 98 10.7 9.rTamill Nadu 113 1148 165 214 190 15.7
428 502 1491 539 502 __
Other./ 3 7 6 4 16
Totals 1,131 1,360 1,487 1,755 1,779 12.3
1/ Average 1971/72 and 1972/73 compared with average 1968/69 and 1969/70.2/ Including Delhi, Goa, Pondicherry,Tripuri, etc., and geographically unallocated
amounts distributed to manufacturers for seeding programs.
Sources: FkAI, Production & Consumption of Fertilizer, Annual Review 1972-73,Table 7a.F4I, Fertilizer Stati-stics 1972-?3, Tables I. 7.02/7.04.
Industrial Projects Department
July 1974,

TABLE 6
INDIA - IFFCO FERTILIZER PROJECT
STATEWISE AND SEASONWISE CONSUMPTION OF N, P205 AND K20 1971-72 IN INDIA(tons)
N P20 K0 _ Total N +Zone/State Kharif Rabi Total Kharif Rabi Total Kharif Rabi Total P205 + Ks0
Central 138,400 291,400 474,800 40,300 85,200 125,500 13,700 53,300 67,000 667,300
Madhya Pradesh 41,400 37,400 78,800 18,900 14,600 33,500 2,200 3,800 6,000 118,300Rajasthan 18,000 32,000 50,000 6,400 9,600 16,000 1,500 3,500 5,000 71,000Uttar Pradesh 124,000 222,000 346,000 15,000 61,000 76,000 10,000 46,000 56,000 478,000Delhi n.a. n.a. n.a. n.a. n.a. n.a. n.a. n.a. n.a. n.a.
East 82,704 103,951 186,655 14,094 28,075 42,169 8,979 24,758 33,737 262,561Assam 2,000 2,900 4,900 1,000 1,050 2,050 650 550 1,200 8,150Bihar 35,696 51,951 87,647 5,712 8,401 14,113 2,543 3,964 6,507 108,267Orissa 17,233 20,204 37,437 3,070 5,311 8,381 677 3,334 4,011 49,829West Bengal 27,000 28,840 55,840 4,200 13,300 17,500 5,060 16,903 21,963 95,303Manipur 670 6 676 84 3 87 32 2 34 797Tripura 105 50 155 28 10 38 17 5 22 215Nagaland n.a. n.a. n.a. n.a. n.a. n.a. n.a. n.a. n.a. n.a.
North 97,400 208,975 306,375 9,755 51,990 61,745 4,020 11,610 15,630 383,750Haryana 22,000 51,000 73,000 960 5,700 6,660 500 1,950 2,450 82,110Himachal Pradesh 2,000 2,125 4,125 770 840 1,610 360 450 810 6,545Jammu & Kashmir 3,400 850 4,250 375 450 825 160 110 270 5,345Punjab 70,000 155,000 225,000 7,650 45,000 52,650 3,000 9,100 12,100 289,750
South 256,210 285,900 542,110 110,970 93,300 204,270 63,750 71,030 134,780 881,160Andhra Pradesh 100,700 94,900 195,600 42,100 32,100 74,200 9,500 17,700 27,200 297,000Kerala 16,000 15,300 31,300 8,500 7,200 15,700 10,800 7,200 18,000 65,000Mysore 48,600 49,400 98,000 28,000 13,500 41,500 15,600 11,700 27,300 166,800Tamil Nadu 89,000 125,000 214,000 31,000 40,000 71,000 27,000 34,000 61,000 346,000Pondicherry 1,910 1,300 3,210 1,370 500 1,870 850 430 1,280 6,360
West 113,945 131,588 245,533 63,159 66,233 129,392 29,111 22,082 51,193 426,118
Gujarat 51,525 62,645 114,170 26,839 34,303 61,142 5,143 1,935 7,078 182,390Maharashtra 61,795 68,353 130,148 35,950 31,530 67,480 23,781 20,032 43,813 241,441Goa 625 590 1,215 370 400 770 187 115 302 2,287
All India: 733,659 1,021,814 1,755,473 238,278 324,789 563,076 119,560 182,780 302,340 2,620,889(735) (1,025) (1,760) (238) (326) (564) (121) (183) (304) (2,628)
Source: Proceedings of the Zonal Conferences held by the Ministry of Agriculture, New Delhi, April-May 1972.
Industrial Projects DepartmentJuly 1974

Iable 7
INDIA - IFFCO FERTILIZER PROJECT
CONSUMPTION OF FERTILIZERS FER UNIT OF CROPPED AREA IN INDIA
Consumption in kg. per hectare (1971-72) Consumption in kg. per hectare (1972-73)
N P205 K20 Total N P2 05 K20 Total
CENTRAL 9.82 2.18 1.16 13.16 8.93 2.49 1.05 12.47
Madhya Pradesh 3.86 1.64 0.29 5.79 4
.51
i 1.92 0.40 6.86
Rajasthan 3.50 1.12 0.35 4.97 3.36 0.46 0.24 4.06
Uttar Pradesh 15.13 3.52 2.54 20.90 16.28 4.26 2.13 22.67
Delhi N.A. N.A. N.A. N.A. 18.56 4.82 1.16 24.54
EAST 6.27 1.42 1.13 8.82 6.32 1.58 1.39 9.29
Assam 1.77 0.74 0.43 2.94 2.40 0.61 0.69 3.70
Bihar 7.92 1.28 0.59 9.79 8.05 1.71 0.98 10.74
Orissa 4.46 1.00 0.48 5.94 4.83 1.19 0.70 6.72
W. Bengal 8.39 2.63 3.30 14.32 7.43 2.33 3.28 13.04
Manipur 3.60 0.46 0.18 4.24 6.14 1.31 0.38 7.83
Tripura 0.46 0.11 0.07 0.64 2.77 1.36 0.40 4.53
Nagaland N.A. N.A. N.A. N.A. 0.20 0.20 0.20 0.60
NORTH 25.06 5.05 1.28 31.39 27.12 6.62 1.86 35.6
Haryana 14.77 1.35 0.50 16.62 16.82 1.65 0.53 19.00
Himachal Pradesh 4.53 1.77 0.89 7.19 5.35 1.97 1.22 8.54
Jammu and Kashmnir 4.86 0.95 0.31 6.12 9.35 1.97 0.76 12.08
Punjab 40.92 9.57 2.20 52.69 42.79 12.59 3.34 58.72
SOUTH 15.91 6.00 3.96 25.87 15.04 6.54 4.34 25.92
Andhra Pradesh 14.88 5.64 2.07 22.59 13.63 5.46 1.85 20.94
Kerala 10.73 5.38 6.17 22.28 11.47 7.74 6.63 25.84
Mysore 9.08 3.84 2.53 15.45 9.89 5.17 3.63 18.69
Tamil Nadu 29.88 9.91 8.52 48.31 26.48 9.86 8.95 45.29
Pondicherry 62.94 36.67 25.10 124.71 68.37 39.65 22.88 130.90
WEST 8.24 4.35 1.72 14.31 7.70 3.10 1.99 12.79
Gujarat 11.21 6.00 0.69 17.90 11.18 5.30 1.04 17.52
Maharashtra 6.20 3.47 2.25 12.42 5.88 1.93 2.48 10.29
Goa 8.74 5.17 2.17 16.45 8.73 6.19 2.63 17.5
ALL INDIA 10.74 3.44 1.85 16.03 10.85 3.58 2.03 16.46
Source: F.A.I., Fertilizer Statistics 1972-73, Table I-6.05
Industrial Projects DepartmentJuly 1974

ANNEX 3-4Page 1 o
TABLE 8
INDIA - jTtO FERTILIZER PROJ1CT
CWPARIs3K OF FERTILIZER C(NIINHPTION IN VARIOUS COUNTRIS (1971-72)
Average Major Nutrient Consumption Per Capita ConsumptionKg/ha. of Arable Land Kg
N P205 K20 Total 1971-72
India 10.7 3.4 1.8 15.9 4.8Bangladesh L4.6 2.4 0.8 7.8 0.9Indonesia 10.9 1.3 0.3 12.5 1.8Japan 160.8 122.0 107.0 389.8 20.1Pakistan 11.7 1.8 0.1 13.6 4.1Turkey 10.2 6.8 0.3 17.3 13.0Asia Average 17.2 6.7 3.0 26.9 6.o
Egypt 122.7 16.7 0.7 140.i 11.5Nigeria 0.5 0.3 0.2 1.0 0.4Africa Average 4.6 3.0 1.3 8.9 5.3
France 79.8 101.1 78.7 259.6 96.8WJest Germany 139.9 115.7 152.6 408.2 55.8Italy 50.4 46.3 20.2 116.9 26.8Romania 41.0 17.1 2.1 60.2 30.9Europe Average 70.6 55.7 55.3 181.6 56.7
Canada 7.7 7.7 4W4 19.8 39.8Us 38.3 22.6 20.4 81.3 75.5Mexico 21.8 6.0 1.3 29.1 13.2N. America Average 31.6 18.4 16.0 66.o 55.0
Argentina 1.7 1.5 O.! 3.6 3.9Brazil 9.3 15.0 11.8 36.1 11.2Peru 27.3 5.0 1.2 33.5 7.1S. America Average 7.L 8.9 5.7 22.0 9.5
World Average 23.2 14.5 12.0 49.7 19.6Developed Average 40.6 31.9 25.6 98.1 53.3Developing Average 8.6 4.1 2.2 1l.9 5.5
India as a % of-Asia Average 62.2 50.7 6o.o 59.1 80.0-Developing Average 124.4 82.9 81.8 106.7 87.3-World Average 46.1 23.4 15.0 32.0 24.5
Source: FAO, Annual Fertilizer Review 1972
Industrial Projects DepartmentJuly 1974

TABLE 9
INDIA - IFFCO FERTILIZER PROJECT
PRODUCTION OF COMPLEX FERTILIZERS IN INDIA(tons)
Pr-odC Nutp-etsAmuoniuz Diamngniou Nitro Phosphate Urea Apmonumo NPK Complex Ammoaius Phosphate itamonlum Phou- Nitrophosphate Urea ARooui- NPO Couplex
Phosphate Sulphate Phosphate (Sulphala) Phosphate fertilizers Sulphate (16-2D-0) ohate (18-46-N) (20-20-0) hcsphale(28-28-O) fertilieers Total NutrientYear (16-20-20) (18-46-0) (20-20-0) (28-28-0) 17-17-17 14-28_14 N P2 05 N P205 N P2 05 N P2 05 N P205 N P205
1960-61* 6,653 - - - - - 1,064 1,334 - - - - - - - - 1,064 1,3341961-62* 13,223 - 2,116 2,645 - - _ - - - - _ 2,116 2,6451962-63 9,211 - - - - - 1,474 1,842 - - - - 1,474 1,8421963-64 28,379 - - - - - 4,541 5,676 - - _ - - - - - 4,541 5,6761964-65 49,204 - - - - - 7,873 9,841 - _ - _ - - - - 7,873 9,8411965-66 52,108 - 16,392 -/-- 8,337 10,422 - - 2,623 2,130 - - - - 11,080 12,5521966-67 77,478 - 70 612 -A/ - 12,396 15,496 - - 11,298 9,180 - _ _ - 23,694 24,6761967-68 92,401 27,714 22355 a! - - - 14,784 18,480 5,543 13,303 18,320 17,643 - - _ - 28,647 49,426
(+3 ,687)/70 ,457
1968-69 98,272 55,218 94,133 132,263 - - 16,198 20,128 11,044 26,505 18,827 8,827 37,032 37,032 - - 83,101 102,4923,360 d/
1969-70 87,137 44,664 22,246 207 357 _ - 14,539 18,D242,985 40 (24,219)s/ 8,933 21,439 17,840 76,613 64,024 64,024 - _ 105,336 120,525
(+87,670)E3 5,090 _/1970-71 88,063 55,451 4,134 159,703 - - 14,089 17,612 9,981 25,503 24,601 24,601 58,210 58,210 - - 106,881 125,926
20,186 S/ 60 207 e/59,403 hI 6 603 f/56,134 _/
1971-72 102,804 49,745 203,370 195,090 54,983 12,717 16,451 20,561 8,934 22,883 40,674 40,674 63,765 64,410 11,969 14,172 141,813 162,70035,891 4! 4.680 1!
6,966 4/3,063 kl
1972-73 94,450 69,085 240,085 174,765 242,054 44,172 15,740 19,517 12,435 31,776 36,013 36,013 56,264 62,166 47,354 53,544 167,800 203,0263,142 L/ 16 978 e/ 114 2/
18,109 k/
On Joly-June basis e/ Urea a-.oooiue phosphate (20-20-0) i/ Nitropho-phate of grade 20-20-2a/ Nitrophoaphate of grade (16-13-0) f/ Urea -o.niom phosphate of grade (22-22-15) 4/ NPo roaplc fertili.er of grade (18-27-3)b/ Diapmonium phosphate of grade (20-48-0) N/ Nitraphosphate of grade (18-18-9) R/ urea aue.ouLm phosphate oE grade (14-35-14) a 8cf Other grades of nitr-phoplhato h/ NitrophosphaLe of grade (15-15-15)d/ As-oniue phosphate of grade (20-20-0)
ooxrce: The Fertiliser Association of India, Fertiliser Statistics 1972-73.
Ind-utrial Projects tepartmentJuly 1974

Table 10
INDIA - IFFKO FERTILIZER PROJEIT
PRODUCTICl OF NITROGENOUS FERTILIZERS :I INDIA,
(Tons of N) Sub-Total
From Complex
Year A S ASN Urea CAN A/C1 Sub-Total Fertilizers!2/ Totals
1952-53 1/ 53,067 - - - - 53,067 - 53,067
1953-54 l/ 52,905 - - - - 52,905 - 52,905
1954-55 1/ 68,485 - - - - 68,485 - 68,4851955-561/ 76,859 - - - - 76,859 - 76,859
1956-571/ 78,788 - - - - 78,788 - 78,788
1957-581/ 81,144 - - - - 81,144 - 81,144
1958-591/ 80,766 - - - - 80,766 - 80,766
1959-601/ 75,605 5,538 1,689 - 862 83,694 - 83,694
1960-611/ 82,250 10,401 5,117 10,518 2,577 110,923 1,064 111,987
1961-621/ 82,874 13,830 5,955 46,762 2,762 152,210 2,116 154,326
1962-63 86,964 16,179 8,610 66,848 2,662 181,263 1,474 182,737
1963-64 90,772 12,274 8,795 102,103 3,575 126,747 4,541 131,284
1964-65 89,338 12,420 8,255 113,905 2,982 226,890 7,873 234,763
1965-66 86,383 14,366 12,668 103,140 4,105 220,662 11,000 231,662
1966-67 91,924 15,605 64,875 110,889 3,623 286,916 23,694 310,610
1967-68 85,949 15,830 95,838 117,820 3,851 319,288 28,647 347,935
1968-69 118,503 12,781 185,969 126,625 4,304 448,182 83,101 531,283
1969-70 119,848 11,128 355,457 109,948 3,233 599,614 105,336 704,950
1970-71 131,241 10,856 504,268 78,808 5,536 730,709 106,881 837,590
1971-72 123,406 7,903 568,604 102,884 4,611 807,408 141,813 949,221
1972-73 114,229 15,004 650,953 104,829 3,465 888,480 167,800 1,056,280
1/ Fi3ures for tvese yea-3 ar.c on July-June basis.
2/ From Table 9.
Source: F.A.I., Fertilizer Statistics 1972-73, Table I-3.01
Remarks: Because of the reporting procedures, totals do not match exactly totals shown in Table 1.
AS = Ammonium SulphateASN = Ammonium Sulphate NitrateCAN = Calcium Ammonium NitrateAC = Ammonium Chloride
Industrial Projects DepartsntJUly 197hk

Table 11
INDIA - IFFCO FERTILIZER PROJECT
PRODUCTION OF PHOSPHATES IN INDIA(tons)
Single Superphosphate Triple Superphosphate**
Material Grade Material of Grade Total P205167 W.S. 17.5% W.S. 18% W.S. 18.5% W.S. 19% W.S. 217% W.S. Nutrient 45% W.S. Nutrient excl. Complex
Year P205 P205 P205 P205 P205 P205 W.S. P205 P205 W.S. P205 Fertilizers
1952-53* 46,534 - - - - - 7,445; - - 7,4451953-54* 86,384 - - - - - 13,821 - - 13,8211954-55* 89,659 - - - - - 14,345 - - 14,3451955-56* 77,279 - - - - - 12,365 - - 12,3651956-57* 109,907 - - - - - 17,858 - - 17,8581957-58* 161,156 - - - - - 25,785 - - 25,7851958-59* 193,699 - - - - - 30,992 - - 30,9921959-60* 321,296 - - - - - 51,407 - - 51,4071960-61* 327,441 - - - - - 52,391 - - 52,3911961-62* 391,969 - - - - - 62,715 - - 62,7151962-63 486,705 - - - - - 77,872 - - 77,8721963-64 609,818 - 3,301 - 2,816 - 98,700 - - 98,7001964-65 723,360 - 10,627 - - 117,650 - - 117,6501965-66 652,775 - - - - - 104,444 - - 104,4441966-67 695,418 - 7,561 16,189 457 - 112,745 - - 112,7451967-68 874,096 1,674*** 11,675 94 4,054 349 145,457 554 249 145,706
13,4571968-69 658,818 2,830 4,185 6,905 - 467 108,035 4,088 1,840 109,8751969-70 615,740 - 504 11,943 - - 100,819 7,485 3,368 104,1871970-71 613,038 - - 7,905 - - 99,549 5,769 2,596 102,1451971-72 772,990 - - 2,640 - - 124,167 7,706 3,468 127,6351972-73 781,615 - - - - - 125,058 4,910 2,209 127,268
* July-June basis** Production of triple superphosphate started in March 1968*** 17% Water Soluble P205.Source: The Fertiliser Association of India, Fertiliser Statistics 1972-73.Remarks: Total production of phosphatic fertilizers should include P205 contents of complex fertilizers (Table ).
Industrial Projects DepartmenttCD
July 1974

AMNNEX 3-4Pa-ge 1 4
INDIA - IFFCO FERTILIZER PROJECT
DEFICIT (CR SURPLUS) IN-CHD(ICAL NITROGEIOUS FERTILIZERPRODJCTIC! BY STATES(too's Tons of N)
1971/72 1972/73Region/ Consumption Production Deficit Consumption Production DeficitState (Surplus) (Surplus)
NORTHERN 306 57 249 331 54 277
- Punjab 225 57 168 235 54 181- Haryana 73 - 73 83 - 83- Other 8 - 8 13 - 13
CENTRAL 475 321 154 515 364 151
- U.P. 346 209 137 373 230 143- Rajasthan 50 107 (57) 48 128 (80)- Madhya Pradesh 79 5 74 92 6 86- Other n.a. - n.a. 2 - 2
EAST 187 143 44 191 148 43
- Assam 5 30 (25) 7 34 (27)- Bihar 88 60 28 89 59 30- Orissa 37 48 (11) 41 51 (10)- W. Bengal 56 5 51 52 4 48- Other 1 - 1 2 - 2
WEST 245 254 (9) 229 264 (35)
- GuJarat 114 185 (71) 114 203 (89)- Maharashtra 130 69 61 114 61 53- Other 1 - 1 1 - 1
SOUTH 542 174 368 513 225 288
- Andra Pradesh 196 65 131 179 59 120- Kerala 31 36 (5) 33 29 4- Mysore 98 - 98 107 - 107- Tamil Nadu 214 73 141 190 137 53- Other 3 - 3 4 - 4
TOTALS 1,.755 949 806 1,779 1,.055 724
Source: F.A.I., Fertilizer Statistics 1972-73, Tables 1.7.03/7.04
Industrial Projects DepartmentJuly 1974

ANNEX 3-4Page 15
Table 13
INDIA - IFruO FERTILIZER PROJECT
DEFICIT (cR SURPLUS) IN PHOSPHATIC FERTILIZER PRODUCTICK BY STATES(000'. of 1ons)
1971/72 1972/73Consumption Production Deficit Consumption Production Deficit
(Surplus) (Surplus)
NORTHERN 62 - 62 81 81
- Punjab 53 - 53 69 _ 69- Haryana 7 - 7 8 - 8- Other 2 - 2 4 - 4
CENTRAL 126 40 86 144 38 1o6
- U.P. 76 5 71 97 5 92- Rajasthan 16 7 9 7 7 -- M. Pradesh 34 14 20 39 11 28- Other - 14 (14) 1 15 (14)
EAST 42 12 30 48 17 31
- Assam 2 - 2 2 - 2- Bihar 14 2 12 19 2 17- Orissa 8 - 8 10 - 10- W. Bengal 18 10 8 16 15 1- Other - - - 1 - 1
WEST 129 103 26 92 1o6 (14)
- Gujarat 61 37 24 54 42 12- Maharashtra 67 66 1 37 64 (27)- Other 1 - 1 1 - 1
SOUTH 204 135 69 223 170 53
- A. Pradesh 74 74 - 72 71 1- Kerala 15 15 - 56 14 9- Mysore 42 1 41 56 1 55- Tamil Nadu 71 45 26 70 84 (14)- Other 2 - 2 2 - 2
TOTALS 563 290 273 587 330 257
Source: F.A.I., Fertilizer Statistics 1972-73, Tables I.7.03/7.04
Industrial Projects DepartmentJuly 1974

ANNEX 3-5
INDIA - IFFCO FERTILIZER PROJECT
FERTILIZER MARET PROJECTIONS
A. Consumption
1. There are several systems that can be used to forecast futurefertilizer demand and consumption. The first step is to differentiate betweenrequirements and actual consumption forecasts. Unfortunately procedures forrequirement calculations are not yet generally available; estimates based onphysical depletion of nutrients from the soil may be correct for small plotsunder controlled conditions--and even in these cases they leave many factorsundefined--while calculations based on economically or financially optimumdosages for each crop are misleading generally resulting in forecasts that aretoo high when compared with actual results. These optimum dosage levels mustbe tempered by consideration of the element of risk (the farmer may well foregothe expectation of a higher return on his money in view of the potential lossof all or most of his investment due to weather conditions), the lack of finan-cing for fertilizers and other inputs, the physical lack or scarcity offertilizers when they are needed or general lack of education of individualfarmers.
2. One system frequently followed by market forecasters is to estimatefuture consumption on the basis of trend lines (generally on a semi-logarithmicscale, that is at a constant compounded growth rate) which are either automati-cally extrapolated at the same rate, or at modified rates to take into accountvarying conditions. This system has the defect of giving excessively high pro-jections when applied to historical data for new products which begin atextremely low levels of consumption. The generally observed fact of maturityobserved in the S-shaped long-term trend lines of many growth phenomena can beintroduced into the calculation by observing whether the annual growth rate isaccelerating or not during the period covered by actual data; unfortunatelydetermination of the inflection point in many cases is not precise. Anotherwidely used system is based on recommended dosages for areas under each crop.This method should be the most accurate short-term but experience shows thatfarmers do not apply fertilizer at the rates recommended and therefore anelement of subjective evaluation enters the calculation of effective ascompared to recommended dosages. A comparison of food and fertilizer require-ment projections. However, relationships between volume of crops and use offertilizer are not well defined; they vary considerably not only from countryto country but from region to region and even in small areas within one country.Furthermore, it does not take into account genetic improvements, use of herbi-cides and other pesticides, avoidance of losses after harvesting, etc.
3. Various forecasting systems have been used in India but actual figureshave never matched and have always been lower than predicted consumption. TheDonde-Brown study is the most recent in-depth analysis; it was primarily basedon district-by-district regression equations for the period 1959-1969. Thetechnique used, as described by the authors, involved making some assumptions onvarious factors:

ANNEX 3-5Page 2
"Projections were based on a close examination of thefactors that influenced changes in sales during the 10 yearsup to 1968/69. During this period, demand was influencedmost by the cultivatorls pervious experience from the use offertilizers (the learning process) and the area irrigated andplanted to selected crops known to have consumed most of thismaterial. These factors explained 70 to 90 percent of thechanges in demand. Other factors, not measurable with theavailable data and assumed to be important, included the avail-ability and use of agricultural credit, market and transportfacilities and promotional efforts.
The above factors were used to project demand for N plusP205 for each district after making appropriate assumptionsregarding changes in their growth rates. Inherent in theseassumptions were the investments needed and time required toexpand irrigation resources, develop and adopt new technologies,increase the availability of agricultural power and expand theagricultural input and commodity marketing systems. It wasassumed that cost/benefit relationships would be about the sameas observed during 1967 to 1969. In some districts assumptionsincluded improvements in agricultural credit and transportationresources.2/:t
For 1973-74, the following actual (preliminary) and forecast figures can becompared:
Million tons of NutrientsTotal N P2 05 K20
FAI (1968) Straight Line Trend 7.31 4.22 2.32 0.77FAI (1968) Population Nutrition 5.37 3.07 1.53 0.77FAI (1968) Crop Areas and Dosages 7.55 3.68 2.20 1.67FAI (1968) Needs for Agricultural Growth 6.19 3.54 1.77 0.88Fourth Plan, Original Estimate 6.58 3.73 1.74 1.11Planning Commission (1971) - 3.20 1.40 -Idem, Mid-Term Reappraisal 3.93 2.60 0.81 0.52Donde-Brown (March 1972) High Projection - 2.91 1.51 -Donde-Brown (March 1972) Low Projection - 2.40 1.10 -Draft Fifth Five-Year Plan, Base Estimate 3.00 1.97 0.62 0.41FAI Estimates (July/November 1972) High - 2.22 0.70 -FAI Estimates (July/November 1972) Low - 2.10 - -Actual Consumption 2.78 1.84 0.61 0.33
j JW.B. Donde and Dorris Brown, Effective Demand for Fertilizers inIndia, IBRD Report No. SA-31 (March 27, 1972) - A Joint Stucy withthe Government of India.

ANNA 3-5Page 3
4. Projections for 1978/79 have also ranged widely:
Million tons of NutrientsTotal N P205 K20
FAI 1972 Estimates 7.94 5.10 1.92 0.92FAI Revised Estimates 6.72 4.31 t.63 0.78Draft Fifth Five-Year Plan 8.00 5.20 1.80 1.00Donde-Brown High 7.78 5.16 2.62 -
Donde-Brown Low 6.oo 4.00 2.00
5. A new attempt has been made to forecast fertilizer consumption in1978/79 based on more recent information on crop areas, land under irrigation,areas under HYVs, and limitations in supply present at least in some areas (Table1. A probable projection of actual consumption (and not demand which wouldbe higher) of 4.31 million tons of N has been reachedl/ which wouldimply an average rate of growth of 15.8% annually from the present level(using a 3-year average centered on 1972/73 to avoid the below-the-trendfigure for 1973/74). For the next five years consumption has been projectedto increase at a more moderate rate of 10% annually to reach a level of 6.95million tons of N by 1983/84.
6. A very serious balance of payments situation could have a fartherlimiting effect on fertilizer consumption. A "low" projection is shown inTable 1, below which foodgrain production would increase at a lower rate thanpopulation, forcing imports to rise considerably above the present level.Even this nlowt projection, however, implies an average annual growth of 13.8%in N consumption, which is not far from the 14.2% rate attained in the previousfive years, when the full impact of rising petroleum and fertilizer prices hadnot yet been felt.
7. The proportion of the three main nutrients has been tilted in favorof nitrogen, both by the faster response obtained with this nutrient and alsoby the fertilizer distribution system. The ratio of N:P205:K, which used tobe about 10:1.3:1 in 195 3/54 is now 5.5:1.8:1, still higher in N than the ratioof 4:2:1 generally considered desirable under Indian agricultural conditions.For 1978/79, the Fifth Five-Year Plan calls for a ratio of about 5:2.3:1, whichmay not be realized in five years. The following projections are based on a5.5:2:1 ratio for 1978/79 and 5:2:1 for 1983/840
j/ This estimate has been corroborated in general by IFFCO's agriculturaladvisersas well as by officials of the GOI and the cooperative system.

ANNEX 3-5Page 4
Million TonsN P205 K20 Total
1962/63 Averagej Actual 0.40 0.09 0.04 0.531972/73 AverageY Actual 1.79 0.59 0.33 2.71
1978/79 Probable Projection 4.31 1.57 0.78 6.671978/79 Low Projection 3.89 1.41 0.70 6.oo
1983/84 Probable Projection 6.95 2.78 1.39 11.121983/84 Low Projection 6.26 2.51 1.25 10.02
Annual Avera e Growth Rates:1962/63-1972/73 16.2% 21.0% 23.8% 17.8%1972/73-1978/79 Probable Proj. 15.8% 17.8% 16.0% 16.2%1972/73-1978/79 Low Projection 13.8% 15.8% 13.8% 14.2%1978/79-1983/84 Probable Proj. 10.0% 12.1% 12.1% 10.8%1978/79-1983/84 Low Projection 10.0% 12.1% 12.3% 10.8%
jf Three-year averages have been used to smooth out the relatively lowvalues registered in 1973/74 as a consequence of delays in foreignexchange allocations, the rapid rise in fertilizer prices and thescarcity of foreign and domestic supplies.
B. Production
8. Actual capacity of existing nitrogenous fertilizer plants is shownin Table 2. Utilization of capacity has generally been low. For 1973/74 itwas only 55%, but if the FCI's Durgapur and Cochin I plants and Zuari AgrolsGoa plant--which are only being tested or have just begun commercial produc-tion--are excluded from the 1973/74 figures, capacity utilization rises to67%. Furthermore, fertilizer plants were hit last fiscal year by disruptionsin operation outside their control, mainly power failures and shortage of rawmaterials, which have been estimated to have resulted in a loss of productionof about 112,000 tons of N or approximately 8% of the installed capacity. Anadditional loss in output of about 45,000 tons may be ascribed to obsoleteequipment in old plants (mainly FCIls Sindri) and about 28,000 tons to laborproblems. This does not justify delays in implementation of some projects(Cochin I, Durgapur) and losses in production arising from defective design oroperation and shutdowns for modifications (Neyveli, Baroda).
9. Plants now under construction or ready for financing have a totalcapacity of 3.08 million tons of N (2.91 million tons after deducting capacitybeing retired elsewhere). 38% of this capacity is based on fuel oil as feed-stock. Considering the dates of commissioning of these plants and the diffi-culties in production that may be faced by some of them, probable incrementaloutput from these plants is expected to be about 1.88 million tons by 1978/79and 2.49 million tons by 1983/84 (Table 3). Eight other plants have also beenapproved in principle by GOI or are under consideration for financing. Theirtotal capacity is 1.91 million tons annually distributed as shown below, butno more than one or two of these plants is expected to be commissioned by 1978/79:

ANNEC 3-5Page 5
Tons/Year
Public Sector Plants: Mathura, Panipat, Paradeep 815,000Private Sector: Shiram Chemical Industries (SCI),
Shaw Wallace, Delhi Cloth Mills (DCM) 801,000Mixed Sector (GSFC) 243,000Cooperative Sector (Maharashtra Cooperative Fertilizers
and Chemicals) 51,ooo1,910,000
Still other plants are mentioned as being under consideration but no rapidimplementation of them can be seen. None are expected to be onstream by1978/79 and no more than about 0.55 million ton capacity by 1983/84:
Tons/Year
Zuari Agro at Kamptee 228,000Mangalore Chemical and Fertilizer Expansion 228,000IEL (at a new site not yet chosen) 228,000Andrew-Yule in UP 228,000Unidentified or small projects 138,000
1,050,000
10. Instalied annual capacity of phosphatic fertilizer plants is 0.57million tons (Table 4). Average capacity utilization in 1972/73 was 56%but some plants (DCM, Trombay and Corormandel) have attained much higher ratesof utilization. One plant--Zuari Agro's Goa plant--has been included in thetotal capacity but had not yet begun production. This branch of the fertilizerindustry also has a large proportion (30%) of very small superphosphate plants,for which fixed capital-related costs are not very important and which show anaverage capacity utilization rate of only 42%. Approximately o.66 milliontons of new capacity is expected to be added in 8 projects under constructionor ready for financing, while there are other projects which may be built(but probably after 1978/79) which could further increase P2 05 capacity bysome 1.02 million tons annually.
11. Production projections for 1978/79 and 1983/84 (Table 5) indicatethat the main problem in India is not that the market may not absorb theoutput of existing plants and those likely to be put in operation in the next10 years, but that supply--from both dcmestic sources and imports (limited inturn by high prices and availability in the world market)--will not be ableto meet demand.
Industrial Projects DepartmentAugust 1974

TABLE 1
INDIA - IFFCO FERTILIZER PROJECT
CHEMICAL NITROGEN CONSUMPTION PROJECTIONS, 1978/79
HYV's Other VarietiesTotals or
Rice Wheat Maize Jowar Baira Sub-Total Rice Wheat Maize Jowar Baira Pulses Oilseeds Sugarcane Cotton Other Crops Averages
Areas (million ha.)
Punjab 0.54 2.42 0.03 - 0.02 3.i 1 0.10 0.05 0.54 0.01 0.13 0.82 0.33 0.13 0.63 1.17 6.92U.P. Haryana and Gujarat 2.20 6.30 0.10 0.04 1.76 10.40 3.63 1.78 1.89 2.06 2.21 9.42 5.38 1.80 2.45 8.29 49.30Madhya Pradesh, Rajasthan & Maharashtra 1.72 2.50 0.10 1.54 1.93 7.79 4.34 3.71 1.38 7.81 4.64 10.98 2.72 0.34 2.88 9.41 56.00Sub-Total 4.46 11.22 0.23 1.58 3.71 21.20 8.07 5.54 3.81 9.88 6.98 21.22 8.43 2.27 5.96 18.87 112.22Andra Pradesh and Tamil Nadu 4.00 0.05 0.14 0.28 0.32 4.80 1.56 0.05 0.12 3.01 0.75 0.15 4.65 0.31 0.96 3.31 19.67Mysore and Kerala 0.76 - 0.06 0.16 0.02 10.00 1.29 - 0.03 2.36 0.55 0.30 1.90 0.18 1.19 1.78 10.58Other 5.53 2.68 0.47 0.13 0.45 9.25 12.84 0.46 1.14 0.10 0.22 1.95 2.22 0.31 0.23 5.81 34.53Totals 14.75 13.95 0.90 2.15 4.50 36.25 23.75 6.05 5.10 15.35 8.50 23.62 17.20 3.07 8.34 29.77 177.01
Projected Average Probable Dosages (kg/ha)
Punjab 100 100 70 40 40 20 20 20 10 10 8 15 100 60 10 56U.P. haryana and Gujarat 80 85 60 40 40 20 15 15 10 10 8 12 90 40 7 30Madhya Pradesh, Rajasthan & Maha'ashtra 60 60 50 40 40 12 10 12 7 7 4 5 60 60 5 16Partial Average 25Andra Pradesh and Tamil Nadu 95 60 70 40 40 20 20 20 10 10 5 15 100 40 10 32Mysore and Kerala 80 60 60 40 40 20 15 10 10 10 5 12 100 40 7 21Other 55 50 50 40 40 12 10 10 7 7 2 5 60 30 5 20Totals 24
Forecalst Consumnption Probable Prol. (000 tons)
Punjab 54 242 2 - 1 299 2 1 11 - 1 7 5 13 38 12 389U.P. haryana and Gujarat 192 535 6 2 70 805 73 27 28 21 22 75 65 162 98 58 1,434Madhyra Pradesh, Rajasthan & Maharashtra 103 150 5 61 77 396 52 37 17 55 32 44 14 20 172 47 886349 927 13 63 148 1,500 127 65 56 76 55 126 84 195 308 117 2,709Andra Pradesh and Tamil Nadu 381 3 10 11 13 418 31 1 2 30 8 1 70 19 38 33 651Mlysore and Kerala 61 - 4 6 1 72 26 - 1 24 6 1 23 11 47 12 223Other 305 134 Z4 5 18 486 154 5 14 1 2 4 11 19 7 29 732Totals 1,096 1,064 51 85 180 2,476 338 71 73 131 71 132 188 244 400 191 4,315
Projected Average Low Dossages (Kg/ha.)
Punjab 90 90 70 35 35 20 20 20 10 10 8 15 100 60 10 52U.P. Haryana and Gujarat 80 80 50 35 35 20 15 10 10 10 8 12 100 40 7 28Madhyra Pradlesh, Rajasthan & Maharashtra 50 60 30 25 25 10 10 10 5 5 3 5 60 60 5 13Partial Average for 7 States 22Andra Pradesh and Tamil Nadu 90 60 70 35 35 20 20 20 10 10 5 15 60 40 10 32Mysore and Kerala 60 50 50 25 25 20 15 10 10 10 5 12 60 40 7 19Other 50 40 30 15 15 10 10 6 5 5 2 5 55 30 5 18Totals 22
Forecast Constumption Low Proj. (000 tons)
Punjab 48 218 2 - - 268 2 1 11 - 1 7 5 13 38 12 358U.P. Haryana and Gujarat 176 504 5 1 44 730 73 26 19 20 22 75 65 180 98 58 1,366Madhya Pradesh, Rajasthan & Maharashtra 86 150 3 23 30 292 43 37 14 39 23 33 14 20 172 47 734Sub-Total 310 872 10 24 74 1,290 118 64 44 59 46 115 84 213 308 117 2,458Andra Pradesh and Tamil Nadu 360 3 10 10 11 394 31 1 2 30 7 1 70 19 38 33 626Mysore and Kerala 40 - 3 4 - 47 26 - - 24 5 1 23 11 47 12 196Other 276 107 14 2 7 406 128 5 7 - 1 4 11 17 7 29 615Totals 986 982 37 40 92 2.137 303 71 53 114 59 121 188 260 400 19 3895
Source: Mission estimates based on Draft Fifth Five-Year Plan figures modified by latest Country Economic Report evaluation of various agriculture sector programs. (fe
Industrial Projects DepartmentAugust 1974

TABLE 2
IN5IIA - DOPED FERTILIZER PROJECT
CHEMICAL NITROGENOUS FERTILIPER CAPeCITY AND PRODUCTION STATISTICS BY STATED
NRKEGIO/STATE SOwer- Tears ta-- Capacity 000's MT Prodoction 000's MT FRod- CoR.oity Utiliatio 'Rieni /Lseatiso shie-/ missioned 1963 1973 1974 196R/61 1962/63 1971/72 1972/73 1973/742/ siocks4/ Products
2/ 1962/63 1972/73 I973/742
NORTHERN - PUNJAB Air,-FCI, Nangal G 1961 82.5 80.0 80.0 46.8 64.6 56.5 54.0 62.0 Limestone CAN 78 67 77
CENTRAL - UTTAR PRADESH-FCI, oraskhpur G 1969 - 80.0 00.0 - - 76.0 66.8 64.0 N U - 83 80-IEL, Ka-pue P 1969 - 200.0 200.0 - - 128.5 160.3 115.0 N U - 80 58-New Central Jute Mills
Co, Vasansi p 1959 10.2 10.0 14.0 2.8 3.5 4.6 3.4 6.0 C AC 34 35 60- MADHYA PRADESH
-Hiodostan Stool, Bhilai G 1959 6/ 6.7 6/ 7/ 7/ 4.7 5,S 7/ BP AS 8/ 39 7/- NAJASTHAN
-SCI, Rota p 1969 - 110.0 110.0 - - 107.3 127.5 110.0 N U - 116 100
EASTERN - ASSAM-FCI, N-ssup G 1969 - 45.0 45.0 - - 29.8 33.7 36.0 NG AS - 75
- BIHAR-FCI, Sindri C 1951,59 120.4 90.0 90.0 81.5 84.1 57.2 55,4 59.0 C,N,etc. AS,ASN,U 68 62 66-Bokaro Stool Ltd C 1972 - 1.4 6/ - - - 0.5 7/ BP AS - 6 /-Burrakuer Cal Co., Bansjora p 1939(before) 6/ 0.3 6/ B/ 7/ - - 7/ OP AS S/ S/-Tats Ieon & Stool Co., Janshodpur p 1939 ' 6/ 4.8 6/ 7/ 7/ 3.0 3.1 7/ 8/ 69 8/
- ORIS8A-Hinduetan Steel, Rourkelo 0 1962,69 60.9 120.0 12070 - 11.4 46.4 49.1 46.0 N,BP CAN 19 41 38-Hiodentan Steel, Ro-rkelo C 1967 - 5.0 6/ 7/ 7/ 1.5 2.3 7/ BP AS - 8/
- WEST BENGAL-RFE, Durgapor C - - - 152.012/ - - - - 6.0 N U - - 4-Hinduetan Stool, Dorgap-r C 1960 6/ 4.4 6/ / 2/ 2.6 2.6 7/ BP AS 8 86 S-INSEO, Purnpur-Kulti C 1947(beforo) 6/ 4.7 / _/ 7/ 3.0 1.0 / BP AS 8/ 39 8/
WESTERN - GUJARAT-OSFC, BNroda M 1967,69 - 216.0 216.0 - - 165.4 202.6 163.0 NG,N U,AS - 94 75
- GOA-_Zai Agro Chem. Co. Ltd, San Coale P 1974 - - 171.012/ - - - - 64.0 N,PA,K U,UAP,AP,NPK - - 37
- MAhAEASHTRA-FCI, Tremboy G 1965 - 00.0 00.0 - - 68.4 70.09' 65.0-/ N,RG,F U - 75 80
SOUTHEEN - ANDRA PRADESH-Corondl Fertilisers Ltd, V1sakh P 1967,68 - 80.0 80.0 - - 64.6 58.9 54.0 N,R,S U,UAP - 74 68
- KERAL-A 10/'FACT, Alwsaye G 1947,60,72 26.3 82.8 82.0 00.5 10.4 36.4 28.6 39.0 N AS,APS,AC 45 35 48-FACT, Cochin G 1973 - - 152.012/ - - - - 14.0 N U - - 9
- TAM0L NADU-EID-Parry Ltd., Enno-o P 1963 8.2 8.2 16.0 - 1.1 6.9 6.9 11.0 N APS 13 84 69-010-Parry Ltd., Eooe P 1968 - 7.9 11/ _ - 4.2 4,6 01/ N AS - 56 11/-The Neyvoli Li8nito Corp., Noyroli G 1966 - 70.0 70.0 - - 19.8 20.9 15.0 L 0 - 30 21-Madras Fertilisees Ltd., Manal M 1971 - 164.0 164.0 - - 42.4 104.8 124.0 N,F,PA,K U,ENPK - 64 76
- MY80RE-Mysoro Che-. S FRrtilizers 1.4 - - 0.8 0.6 - - _ AS 43 -
TOTALS-C ovrnseot 300.3 671.0 964.0 139.8 170.5 402.3 391.5 416.0 57 58 43-Primate 8.2 421.2 595.0 2.8 4.6 319.1 364.7 364.0 56 87 61-Mixed - 380.0 380.0 - - 227.8 307.4 287.0 - 81 76-Unclassified 16.2 - - 11.7 6.2 - - - 38 - -
324.7 1472.2 1939.0 05433 081.3 949.2 1063.6 0067.0 56 72 5
1/ FCI - FRrtilizr Corp. of India; IISCO - Indian Iron sod Steel Co.; SCI - Sheira- Chemical Induntries; IEL - Indian Explosives Ltd; GSFC - Gujerat SeatR F-rtilioecs Co.;FACT = Th. Fortili-ers aod Chomicala Trava-coor Ltd.
2/ G = Central Goveroneot Agencies; P - Private; M = Mixed2/ Prell,inary
BP/ NP By-product (from roking); C - coks; F = fel oil; K = potssic s.alto; L = ligoito; N = naphtha; Ra - natural gas; PA = phosphoric acid; R = phosphate rok;-RG = refinery off-gas; S sulphur; Water and air are uscd is all pleats; is Naegal they (sod poser) are ths only feedstochs.
5/ As, AC, ASS and APS A=a ooisn sulphato, chloride, suiphate nitrate and phosphate sulphate r-spcctivoly; CAN = Calcium asosion itsaee; DAP = Dia-.nica phoophato;NPK = co=ples ferilizers (containing N, P20s and K20); U = -urea; UAP = urea amosaiis phosphate.
6/ By-prod-ct plants' capacity not given separately but included in totals.7/ Production not given separately bht included in totol.8/ Capacity utilieation sot given separately. Average fPr 1973/74 wos 50%.2/ Including N for indostrial (noo-fertilizer) one. I!10/ StDritly speaking, FACT is a mixed company, but shares held by the pri-tee sector ra .less thao 5. cf total.ll/ Rot availsblo12/ Technically ceder c-omlcsicnim 0 .Stresee: F.A,I,, Rortiliser Statistics 1972-73
G,O.1.,* Unpublished Consnoicatiao
Industrial Projects DtpartmentOctober 1974

TABLE 3
INDIA - IFFCO FERTILIZER PROJECT
NITROGENOUS FERTlLiZER
PROJECTS UNDER CONSTRUCTION OR READY FOR FINANCINGIncremental Incremental Projected
Annual Probable Production 1/
1/ 2/ Probable Date Capacity (000 tons of N)Feedstock- Ownership- Status Comsissionin 000
101s(N) 1978/79 1983/84
PunjabFCI, Nangal F G Construction December 1976 152 130 137New Corporation, Bathinda F G Financing June 1977 255 75 204
U.P.FCI, Gorakhpur N C Construction August 1975 51 46 46IFFCO, Phulpur F C Financing September 1978 228 136 205
Ra iasthanSCI, Kota N P Construction October 1974 42 32 38
Madhya FradeshFCI, Korba C G Construction September 1977 228 136 182
AssamFCI, Namrup NG C Construction December 1974 152 122 137
BiharFCI, Sindri F C Financing February 1978 136 66 112FCI, Barauni N G Construction March 1975 152 122 137
OrissaFCI, Talcher C C Construction December 1976 228 160 182
W. BengalFCI, haldia F G Construction June 1978 152 70 132
GuiaratIFFCO, Kalol NG C Construction December 1974 215 194 194
NaharaahtraFCI, Trombay IV A G Financing September 1977 75 4/ 37 4/ 67 4/FCI, Trombay V F G Financing December 1978 130 53 117FCI, Trombaylodernization A G Construction August 1976 18 16 16Andhra PradeshFCI, Ramagundam C G ConLtruction December 1977 228 114 160Coromandel, Visag. N P Construction June 1975 9 6 8
MeacalaFACT, Cochin II A C Construction September 1975 40 4/ 36 41 36 41
MysoreSPIC, Tuticorin N P Construction July 1975 258 206 233MC&F, Mangalore N P Construction March 1976 160 120 146
2,909 1_877 24689
1/ F = Heavy Fuel Oil; N- Naphtha; c= Coal; A= Amnionia; NG= Natural gas2/ G = Central Government Agencies; C= Cooperatives; PF= Private3/ Plant-by-plant Jigures are given only as reasonable assumptions to reach a probable nrodu,ctiou estimate for all the pLants.4/ Transferred ammronis 2ot ihcluded it total.
Industrial Projects Department o October, 1974

TABLE 4 ANNEX 3-5Page 9
INDIA - IFFCO FERTILIZER PROJECT
CHEMICAL PHOSPHATIC FERTILIZER CAPACITY AND PRODUCTION (1972/73)
Region/State Owner- Capacity Percentage Production
Firm Location ship (000 MT) Utilization (000 MT) Feedstocksl/ Products.2
NorthDelhiDCM / P 21.1 70 14.9 R,S Sp 4/
CentralUPSmall Plant, Megarwara P 9.7 54 5.2 R,S SP
RajasthanSmall Plant, Debari G 12.0 63 7.6 R,SA SP
Madhya PradeshDharmasi Morarji Chemical Co.
(Small Plant), Kumhari P 15.2 73 11.1 R,S SP
EASTBiharSmall Plant G 3.7 63 2.4 R,S SP
West BengalSmall Plants (2) P 26.2 56 14.8 R,S SP
WESTGujaratGSFC, Baroda M 51.8 61 31.8 A,R,S DAP
Small Plants (5) P 18.8 54 10.3 R,S,SA SP
MaharashtraFCI, Trombay G 36.0 100 36.0 A,R DAPDharmasi Morarji Chemical Co.,
Ambernath P 35.3 38 13.3 R,PA,S TSP,SP
Small Plants (4) P 10.4 57 5.9 R,S SP
SouthAndhra PradeshCoromandel, V. P 73.0 85 62.3 A,R,S DAPSmall Plants (1) G 6.7 16 1.1 R,S SP
Small Plants (3) P 19.9 36 7.1 R,S SPGoa - Zuari Agro P 42.0 - 42.0 A,PA,K
KeralaFACT, Alwaye G 43.7 32 14.1 A,R,S APS,SP
MysoreSmall Plant G 5.4 24 1.3 R,S SPSmall Plant P 6.5 - - R,S SP
Tamil NaduMadras Fertilizers Ltd., Manali M 85.0 63 53.5 A,PA,K NPK
E.I.D. Parry Ltd., Ernore P 10.3 84 8.6 A,R,S APS
Small Plants P 38.7 42 16.4 R,S SP
Sub-total G 107.5 58 62.5
Sub-total P 327.1 52 169.9Sub-total M 136.8 62 85.3
Total 571.4 56 317.7of which Small Plants 173.2 42 72.1
1/ A = Ammonia; R = Phosphate Rock; S = Sulphur; PA = phosphoric acid; K = potassic salts
2/ SP = Superphosphate; TSP = Triple Superphosphate; DAP = Diammonium phosphate; APS = Anmonium phosphate
sulphate; NPK = complex fertilizers3/ DCM Chemical Works4/ About.30,000 ton SP capacity deemed obsolete.
Industrial Projects DepartmentJune 1974

TABLE _
INDIA - IFFCO FERTILIZER PROJECT
CAPACITY AND PRODUCTION PROJECTIONS FOR INDIA(million tons of nutrients)
Capacity - Production1978/79 1 983/84 1978/79 1983/8-S4
Low Probable Low Probable Low Probable Low ProbableNitrogenous FertilizersExisting Plants 1.94 1.94 1.78 21 1.78 1 1.60 1.67 1.55 1.65Plants under Construction or ready
to Finance 2.30 2.91 2.30 / 2.91 1.68 1.88 2.34 2.49Other Plants under Consideration 0.23 0.55 1.40 2.46 - 0.17 1.12 2.20Total Capacity/Production 4.47 5.40 5.48 7.15 3.28 3.72 5.01 6.34Consption Forecasts 3.89 4.31 6.26 6.95GapY 0.61 0059 1.25 0.61
Phosphate FertilizersExisting Plants o.57 o.57 0.40 / 0.50 0 0.42 0.48 0.36 0.45Plants under Construction or Readyto Finance 0.40 0.53 0.53 o.66 0.32 0.50 0.54 o.60
Other Plants 0.20 0.26 0.70 1.02 0.10 0.16 0.58 0.92Total Capacity/Production 1.17 1.36 1.63 2.18 o.84 1.14 1.48 1.97Consumption Forecasts 1.41 1.57 2.51 2.78Gap j 0.57 0.43 1.03 0.81
/ Assuming some small plants would be retired2 Deducting 3 plants scheduled to be commissioned in 1978 and which may slip
No attempt has been made to combine "probable" consumption and "low" production projectionsbecause to a considerable degree consumption will depend on the availability of domesticallymade fertilizers. Therefore, "probable" consumption projections are matched with "probable"production projections and "low" consumption projections with "low" production projections.The gaps are wider for the "low-low" than for the "high-high" projections.
Industrial Projects DepartmentOctober 1974

ANNEX 3-6
INDIA - IFFCO FERTILIZER PROJECT
IFFCOIS MARKET ARE
1. IFFCO will eventually market its products throughout the ten Statesholding shares in it. For some years, however, the output from the Kandla,Kalol and Phulpur plants will be sold in 111 districts in seven States. Ureaproduced at Phulpur will be sold mainly in UP, Haryana and the Punjab withsmaller amounts also going to Madhya Pradesh and Rajasthan. Urea produced atKalol will be sold in Gujarat, Rajasthan, Madhya Pradesh and the Punjab, whileNPK from Kandla will be distributed throughout all of IFFCO's marketing area.
2. A detailed up-to-date geographical breakdown of consumption data isnot available. Figures for 1970/71, although lower than more recent consump-tion levels, are indicative of consumption patterns (Table 1). N consumptionin the districts comprising IFFCO's market area is about 75% of that for theseven States.
3. Projected N consumption and production figures for 1978/79 andexpected gap between demand and domestic supplies originating in the sevenStates comprising IFFCO's marketing area are shown in Table 2. These figuresshow that for this area, as for all of India, the problem is not one of amarket incapable to absorb production but of meeting ever-growing demand.
4. Potential for considerable increase in consumption in IFFOO'smarketing areas, as well as throughout India, is shown by the great variationin fertilizer application rates and yields in various districts. Some examples,from districts in UP and the Punjab, are shown below:
Fertilizer Dossa s Ratios to Net Sown Areas(Kg/ha of sown area) Net Irrigated MulticropTotal N
PunjabAmritsar 74 64 0.91 n.a.Ludhiana 103 71 0.75 n.a.Bathinda 29 25 0.74 n.a.
UPMuzaffarnagar 58 42 0.70 0.31Meerut 59 42 0.74 0.39Allahabad 20 14 0.20 n.a.Hamirpur 2 1 0.12 0.03

TABLE 1 ANNEX 3-6Page 2
INDIA - IFFCO FERTILIZER PROJECT
IFFCO's MARKET AREA
Consumption of Fertilizers 1971-72(By Districts where IFFCO Plans to Sell its Output)
000's of MT NutrientsState/District N K20
PUNJABRupar 5.2 1.1 0.2Patiala 22.6 4.5 1.0Sangrur 20.2 -5.2 o.8Sub-Totali/ 17 7T F.8 2.0Amritsar 27.3 4.Ferozepur 33.0 6.1 1.9Jullunder 23.8 5.2 2.0Kapurthala 8.6 2.1 o.6Ludhiana 26.7 13.4 1.6Faridkot _ ___
Sub-TotalL/ 119.4 31.4 77Total for IFTCO's
Market Area 167.4 42.2 9.5Total for State 224.4 52.9 11.9
UTTAR PRADESHDehradun 1.2 0.3 0.3Saharanpur 12.2 2.3 1.5Muzaffarnagar 16.2 4.2 2.5Meertit 24.1 4.7 2.8Bijnor 9.4 1.7 1.2Nainital 8.8 2.3 1.5Moradabad 11.7 2.4 1.8Rampur 6.o 1.7 1.1Bareilly 6.1 1.2 1.1Pilibhit 4.3 0.9 o.6Bulandshahr 10.6 3.5 1.9Aligarh 7.7 2.0 1.3Mathura 2.3 0.8 o.6Agra 6.3 1.7 0.9Etah 5.6 1 .3 0.8Badaun 6.9 1 .2 0.8Shahjahanpur 4.5 0.9 0.7Lakhimpurkheri 2 2/Sitapur 4 h.e o.5Hardoi 3.9 o.6 0.5Fatehgarh 3 1Mainpuri 6.3 1-4 o.6Etawah 4.4 0.7 o.6Kanpur 6.5 1.3 1.0Unnao 3.4 0.5 0.4Lucknow 5.6 0.9 0.8Barabanki 8.o 1.3 1.2Gonda 7.4 2.0 1.6Basti 13.1 3.1 2.5

ANNEX_3-6Page 3
Gorakhpur 13.2 1.8 1.3Deoria 13.2 2.4 2.5Ballia 4.0 0.7 0.8Azamgarh 8.1 1.3 1.1Faizabad 10.8 2.5 2.1Sultanpur 6.0 1.8 1.8Rai-Bareli 4.1 0.8 0.7Fatehpur 2.8 0.9 0.4Hamirpur 0.7 0.2 0.2Banda 1.0 0.4 0.2Jhansi 1.5 0.4 0.2Allahabad 8.9 1.7 1.3Varanasi 12.5 2.1 1.9Jaunpur 7.0 1.6 1.3Ghazipur 5.1 1.0 o.8Mirzapur 3.0 0.9 0.7
Total for IFFCO'sMarket Area J 308.8 66.2 48.4
Total for the State 3372. 53.1
IARYANAAmbala 9.6 1.3 0.5Krakshetra 3 //Karnal 33.1 3.1 1.1Jind 3.8 0.2 0.1Hissar 5.4 - 0.2Rohtak 5.4 o.6 0.1Gurgaon _4.6 0.4 0.2
Total for IFFCOtsMarket Areal/ 61.9 5.6 2.2
Total for the State 72.9 -- 2-.
MADHYA PRADESHChatarpur 1.6 0.9 0.2Panna 0.4 0.2 _Satna 1.2 0.8 0.1Rewa 1.3 0.7 -Sidhi 0.1 0.1 -Sub-Totall _ 3.3 °047Indore 3.1 1.1 0.7Dewas 1.0 0.7 0.2Ujjain 2.5 1.7 0.2Mandsaur 44.3 2.8 0.4Khandwa 4.5 0.5 0.5Khargone 3.2 1.6 '0.3Ratlam 2.7 1.8 0.3Dhar 1.7 0.7 0.1Sub-Total_/ 23.0 10.9 -57.
Total for IFFCOtsMarket Area 28.6 14.2 2.8
Total for the State 80.7 35.8 6.4

ANNEX 3-6Page 4
RAJASTHANPali 0.7 0.2MarwarJodhpur 0.6 0.1Nagore 0.2 -Ajmer 0.5 -Swaimadhopur 2.2 0.5Bharatpur 1.9 0.2 0.1Jaipur 2.1 o.6 0.2Alwar 2.9 0.1 -Jhunjhuno - -ChuruBikaner _ _Sub-Totali 11.1 1.7 0.3Jhalawar- 0.5 0.2 _Kota 4.5 3.0 0.9Bundi 2.7 o.6 0.1Chittorgarh 3.2 1.5 0.5Udaipur 1.8 0.4 0.1Bhilwara 1.9 0.4 0.1Hanumangarh 7.0 0.2 0.1Ganganagar 8.3 0.7 0.5Sub-TotalY/ 29.9 7.0 2.3
Total for IFFCO'sMarket Area 41.0 8.7 2.6
Total for the State -W-7
GUJARATAmreli 7.6 10.6 -Surat 6.3 1.5 1.4Junagarh 7.2 8.2 0.1Mehsana 7.0 1.0 -Kaira 20.9 1.2 0.3Bajkot 11.1 15.3 0.3Bhavnagar 8.4 7.6 0.6Baroda 11.5 2.7 2.3Broach 5.3 2.0 0.2Ahmedabad 7.7 0.8 o.6Jamnagar 4.7 5.9 0.2Kutch 1.0 0.1 -
Total for IFFCO'sMarket AreaY 98.7 56.9 6.o
Total for the State 1114.2 61.1 7.1

ANNEX 3-6Page .5
MAHARASHTRADhulia 6.2 2.6 2.1Jalgaon 7.1 3.5 2.3Nasik 6.4 2.9 2.1Aurangabad 5.2 3.2 1.5Ahmednagar 8.5 3.2 2.3Poona 10.4 3.2 2.4
Total for IFFCQ IsMarket Area.u 43.8 18.6 12.7
Total for the State 130.1 777
Summary
In Phulpur's Market Area 1435.5In Kalol's Market Area 314.8In Total IFFCO's
Market Area 750.2 23.8 81 .6Total for the 7 States 1,004.9 296._ 8 127.9
g/ Urea will be supplied to this area by IFFCO's Phulpur plant2/ Urea will be supplied to this area by IFFCO's Kalol plantA/ Included in figures for other districts.Source: F.A.I., Fertilizer Statistics 1972-73, Table I-6.07(b)
IFFCO, Market Report, August 1973.Remark: Totals for the States differ slightly from figures shown in
Annex 3-4, Table 5.
Industrial Projects DepartmentAugust 1974

TABLE 2
INDIA - IFFCO FERTILIZER PROJECT
CONSUMPTION AND PRODUCTION PROJECTIONS (1978/79) IN IFFCO'S MARKETING AREA(000 tons of N) Consumption
Production IFFCO'sProjected Capacity "Probable" Projection "Low" Projection Study States Marketing Area Surplus (Deficit)2/
Existing Under Other4/ Total From Under Other Total Existing Under Other Total Probable Low Probable Low Probable Low 3/Plants Construc- Existing Construc- Plants Construc-
tion Plants tion _ tion ___ __
Punjab 80 407 - 487 72 205 - 277 64 164 - 228 389 358 290 267 (13) (39)UP 290 279 - 569 261 182 - 443 232 154 - 386Haryana - - - - - - - - - - - -Gujarat 216 215 - 431 194 194 - 388 173 166 - 339
Sub-total 486 901 - 1,487 455 376 - 831 405 320 - 725 1,434 1,366 1,280 1,220 (449) (495)
Madhya Pradesh - 228 - 228 - 136 - 136 - 114 - 114Rajasthan 110 42 - 152 99 32 - 131 88 28 - 28Maharashtra 81 205 - 286 73 90 - 163 65 70 - 135
Sub-total 191 475 - 666 172 258 - 430 153 212 - 365 886 734 394 327 36 38
Total 777 1,376 - 2,153 699 839 - 1,538 622 696 - 1,318 2,709 2,458 1,964 1,814 (426) (496)
India 1,939 2,909 550 5,398 1,745 1,959 173 3,877 1,552 1,682 - 3,234 4,315 3,895 (438) (661)
1/ The seven States listed in the first column.2/ Based on full production in the seven States but linked to consumption in IFFCO's fertilizer area3/ Based on "low" production and "low" consumption figures which result in a "high" gap4/ No final decisions have yet been taken on these plants and there is no way to allocate them geographically.
One of them could possibly be DCM in Rajasthan, but it would probably not be producing commercially until after 1978/79.
Industrial Projects DepartmentAugust 1974

ANNEX 3-7Page 1
INDIAIFFCO FERTILIZER PROJECT
INTERNATIONAL PRICE RANGE OF UREA (WEST EUROPE)
200
180 -
160
uJ140--
co
w 10 ----2---zz0c-
0 100
80-
60
40 LIIi-… J F M A M J J A S O N D J F M A M J J A S 0 N D J
1972 1973 1974
SOURCE: THE BRITISH SULPHUR CORP. LTD.
World Bank-8992(R)

ANNEX 3-7
INDIA Page 2IFFCO FERTILIZER PROJECT
INTERNATIONAL PRICE RANGE OF UREA (JAPAN)
200…
180…
160
140 - … - -_
z
1972 1973 1974
SOURCE: THE BRITISH SULPHUR CORP. LTD.
World Bank-8991 (R)

ANNEX 4-1
INDIA - IFFCO FERTILIZER PLANT
SUMMARY
METEOROLOGICAL DATA FOR AILAHABBAD UPMEAN OBSERVATION FOR YEARS 1931-1960
Monthly Mean Wy Wet Temperature Humidity Rainfall MeanMaximum Minimum mm Wind
(EK7-ra)
January 12.50C 10.60C 23.70C 9.10C 79% 20.2 05
February 15.9 0C 12.40C 26.70C 11.60C 67% 20.2 05
March 22.70C 15.30C 33.30C 17.00C 44% 14.3 07
April 29.400 18.30C 38.80C 22.50C 30% 4.8 08
May 33.50C 22.40C 42.10C 27.40C 35% 8.2 09
June 32.0°C 25.10C 39.80c 28.90C 54,0 101.7 09
July 29.3°C 26.3°C 33.60C 26.60C 80% 274.8 08
August 28.60C 26.20C 32.10C 26.00C 85% 333.1 07
September 28.50C 25.60C 32.8°0 25.200 81% 195.1 07
October 25.60C 21.50C 32.60C 20.40C 69% 39.7 05
November 18.80C 14.90C 29.00C 13.10C 66% 6.9 03
December 13.5°C 11.20C 24.80 9.80C 76% 6.3
Annual Mean 24.30C 19.10C 32.40C 19.80C 64% 1,027.3 06
Industrial Projects DepartmentJuly 1974

INDIA ANNEx 4-2IFFCO FERTILIZER PROJECTPROPOSED PLANT LAYOUT
RAILWAY SIDING
| ~~~~~~~~~~~~BAGG IN GP LANT
UREA STORAGE
NH 3 LOOP AREA
: | ~~~STOR ESUREA AMMONIAPLANT STORAGE
COMPRESSOR HOUSES
PELLETIZING CO-SHIFT H2 S CANTEEN& REMIXING CONVERSION REMOVAL r
IHLOOP iiRE0 H | ~~~~~~~REFRIG H g L
RE FR 1G. ~~~~~COOLING PLANTOIL GASIFICATION CONTROL CO2 TOWERS OFFICE
STORAGE ROOM REMOVAL
STEAM & WATER WATER IN.
POWER TREAT. STORAGE
COALSTORAGE
World Bank-8990(R)

ANNEX 4-3
INDIA--IFFCO FERTILIZER PROJECT
REPRESENTATIVE DATA FOR HEAVY FUEL OIL FEEDSTOCK TO BE
USED IN THE PROJECT
1. The following typical characteristics for fuel-oil feedstock havebeen. assumed:
Type - "Heavy Fuel Oil"Distillation - Initial Boiling Point: 1500C
90% at 3300C (ASTN Cut Point)Density - 0.93 to 0.95 Kg per literSalfur - 2 to 3.5% by weightCarbon Residue - 7 to 8% by weight/weight (Conradson)Ash - 0.01 to 0.02% by weight/weightPour Point - 250C to 350CFlash Paint - About 750CGross Calorific
Value - 9,960 to 10,500 Kcal/kgNet Calorific Value - 9,500 to 9,700 Kcal/kg
Actual values for specific shipments will depend on the origin of the crudeand refining methods used.
2. Price assumptions are as follows:Rs
Price, ex-storage, per m3 F7
Less Deductions 50Cost per m3 52
Cost per Metric Ton at 0.92 specificgravity 890
Less: Excise duty concession 400
Sales tax 29Freight 42
Total
Industrial Projects DepartmentJune 1974

ANNE 4-4
INDIA - IFFCO FERTILIZER PROJECT
REPRESENTATIVE DATA FOR COAL AND OTHER UTILITIES TO
BE USED IN THE PROJECT
Coal
1. Principal characteristics of the non-coking coals the projectpropose to use and which are available from mines in Bihar, West Bengal andMadhya Pradesh are typically:
Calorific Value - 8,500 Btu/lbCarbon - 45 to 47% by weightVolatile Content - 16 to 19% by weightAsh - 30 to 35% by weight
2. For this study, the pit-head price has been assumed to be Rs 35per ton, to give the following delivered price structure:
Rs Per Metric Ton
Pit-head price 35.00Transportation 40.00Sales tax at 3% 1.00Handling charges 5.00
81.00
For calculation purposes, a delivered price of Rs 85.00 per ton has beenassumed.
Power
3. Although the plant will produce most of its power needs from coaland exothermic reaction heat, a relatively small amount (not more than 5MW) will be drawn from the State power grid at 132 KV. For calculationpurposes, a price of Rs 120 per 1,000 KWh, equivalent to Rs 0.12 ($0.016)per KWh has been assumed. This is higher than the present level, butlikely to represent the price several years hence. Electric energy generatedin plant pays a tax of Rs 10 per 1,000 KWh.
Water
4. Water will be drawn from local canals and on-site wells. Pumpingcosts are included in production cost calculations.
Industrial Projects DepartmentJune 1974

ANNEX 4-5Page 1
INDIA - IFFCO FERTILIZER PROJECT
DESCRIPTION OF PROPOSED PROCESSES TO BE USED IN THE PROJECT
A. Ammonia Manufacture
1. The ammonia plant will be designed to use heavy fuel oil aa thesource of hydrogen and will include the following principal sections:
Partial Oxidation ("P.O.11).H drogen Sulfide (H S) and Carbon Dioxide (C02) Removal.Shift Conversion (or carbon monoxide to carbon dioxide,
between H2S and CO2 removal in the Rectisol gas puri-fication unit).
Sulfur Recovery (as elemental S).Nitrogen Wash.Air-Separation.Ammonia Gas Compression Synthesis and Storage.
These unit operations are briefly described below:
Partial Oxidation
2. Fuel oil and other heavy hydrocarbons cannot be reacted or"reformed" with atean via a nickel-based catalyst to produce hydrogen andcarbon monoxide, as is done on a wide scale with natural gas and lightnaphthas. This is because deposits of carbon rapidly form on the catalystand stop the process. Instead, heavy hydrocarbons are "partially oxidized"non-catalytically with steam and oxygen at medium or hi h pressures andhigh temperatures to form hydrogen and carbon monoxide (plus some carbonand other products) according to the general reaction:
2CnHX + nO2 = 2nCO + mN2
3. Only two P.O. processes - those of Shell and Texaco - have beenadopted on a large commercial scale. It is IFFCO'sintention to use as closely as possible the technology employed in thesuccessful German P.O. plants (Veba Chemie) and which will be used in theFCI Nangal Project. These installations incorporated Shell medium-pressureP.O. gasification.
4. In the Shell process, heavy fuel oil plus some recycled carbonis indirectly heated to 2600 C with medium-pressure steam and pumped into thegasifier units along with live steam and oxygen. Operating pressure inthese vessels is about 57 atmospheres (about 840 lbs per square inch) andthe tenperature attained is approximately 1,h400°C It is planned to usethree gasifiers at Phulpur plus one on standby. The fuel oil reacts to formhydrogen (H2) and carbon monoxide (CO) plus som carbon dioxide (C02),

ANNEX 4-5Page 2
methane (CH4), hydrogen sulfide (H2S), carbonyl sulfide (COS) and freecarbon (C). About 3 percent of the carbon in the feedstock in converted tofree carbon (soot), which is recovered and burnt as fuel. Heat liberatedin the gasifiers is partly recovered in a specially-designed waste heatboiler and the exit gas is further cooled to 2000C in a feed-water heater(economiser). Carbon plus water-soluble gaseous impurities are washed outin a scrubbing unit and the cleaned gas passes the next section for removalof carbon oxides and sulfur compounds. Carbon-containing scrubber water ismixed with fuel oil in a pelletizer which produces large granules of carbon.These migrate to the fuel-oil phase and this suspension is pumped back tothe P.O. units. (Alternatively, the carbon granules can be screened out andtransported to a separate steam-raising system for use as fuel, according tocircuustances. Thia method will probably be used at Phulpur).
Hydrogen Purification
5. It is also proposed to employ the same process ("Rectisol") forremoving sulfur compounds and carbon oxides as was chosen for the Veba Chemieand Nangal plants. This is based on the preferential solubilities of thesegases in methanol at low temperatures. Raw gas after carbon removal iscooled by refrigeration to about minus 300C and sulfur compounds are reducedto 3 parts per million (ppm) by washing with a lean solution of C02 inmethanol inside a tall tower. Liquor from the base of the tower is "flashed"(i.e. quickly depressurized) to produce a gas rich in H2 8 which is sent to asulfur recovery unit. Liquor from the top of the tower is flashed to yieldhydrogen and CO which are sent to a conversion unit wherein CO is convertedor "shifted" catalytically to C02.
6. Hydrogen and C02 from the shift conversion section are cooled byliquid nitrogen (N2) and the C02 is absorbed by chilled methanol recoveredfrom the sulfur removal section to yield hydrogen containing about 10 ppm ofC02. This gas atream is sent to the nitrogen-wash section. The richsolution from the C02 absorber is flashed at 11 atmospheres, which releasesdissolved, unconverted CO and hydrogen. These are recycled to the raw gasstream entering the H2S absorption section. The C02 rich methanol isfurther depressurized to 2.2 atmoapheres. This releases high-purity C02which is compressed and used for urea synthesis and the methanol is recycledto the various Rectisol process stages.
Ancillary Operations
7. Associated with the proposed Rectisol gas purification processwill be several ancillary operations. Sulfur recovery will be undertaken bya modified Claus unit wherein one-third of the H2S released from theRectisol plant is burnt with air to yield sulfur dioxide (SO2) which iscatalytically combined with the remainder of the H2S to yield elemental Sfor sale. Conversion of CO to CO will be effected by heating gas from thesulfur removal section of the Rectisol unit up to 2200C and humidifying withhot water before passing over a suitable catalyat at about o00oC in the

ANNEX 4Page 3
Shift Conversion Section. This reduces the CO content to 3% (volume basis)after which the gas is dehumidified, cooled to 750C and recycled to the C02absorption section of the Rectisol unit. Final synthesis gas purificationand preparation will be undertaken by a nitrogen wash unit in which gas fromthe Rec isol C02 absorber at minus 55°C is washed with liquid nitrogen toremove twith the aid of an adjoining molecular sieve unit) the remainingamounts of carbon oxides, argon, methane and other impurities. Sufficientnitrogen will be added to the pure hydrogen to give the desired synthesismolar gas ratio of N2:3H2. After absorbing impurities., the remaining liquidnitrogen will be vaporized to form a gas mixture of low calorific valuewhich will be used to strip impurities from the carbon wash water, beforebeing burnt in a steam superheater, thereby simultaneously destroyingpollutants and increasing fuel economy.
Air Fractionation and Separation
8,. Also closely associated with P.O. synthesis gas (syngas) pre-paration is air fractionation whereby gaseous or liquid oxygen for partialoxidation and liquid nitrogen for hydrogen purification and syngas needs areobtained from air. (Fractionation plants are obtainable from several inter-national manufacturers and an award will be made on the basis of lowestevaluated price and discounted operating costs, plus technical suitabilityand delivery time). Typically in such plants, filtered air is turbo-compressed and cooled against cold impure N2 , produced in a downstreamsection. The air then passes to a set of reversing heat exchangers in whichstreams of pure N2 and impure N2 flow in a fixed direction and input air,oxygen and more impure N2 pass through the exchangers in directions that areperiodically reversed. Cooling induced by indirect contact with cold N2causes water vapor and G02 in the incoming air to solidify and deposit inthe heat exchangers. During the reversing period, these sublime into thestreams of impure oxygen and nitrogen and eventually leave the system.
9. Compressed air, freed from water and C02, leaves the cold end ofthe reversing exchangers and is fed into a medium-pressure fractionatingcolumn, wherein the rising air stream becomes poorer in 02 and liquifies atthe top of the column to produce a "poor liquid" with a high N2 content.Reflux liquid flowing down the column becomes richer in 02 and produces aliquid containing about 40% 02 at the base. A vaporizer supplies the mediumpressure column with the cold needed at the upper section to condensenitrogen and also the heat required in the lower section of a low-pressurecolumn to vaporize liquid oxygen. The liquid 02 is circulated by pumpsthrough a filter between the bottom and top of the vaporizer. Nitrogen con-densing in the upper section of the medium pressure column is used as areflux in both the medium and low pressure columns.
10. Liquid from the bottom of the medium pressure column afterfiltration and subcooling is expanded and introduced in the middle sectionof the low pressure column. This is located at the top of the vaporizer andprovides the final separation. It is heated at its base by condensation ofgases at the top of the medium pressure column and cooled at its top byliquid N2 coming from the medium pressure column. The cold balance of the

ANNEX 4-5Page 4
unit is supplied by expanding some of the pure N2 in an expansion turbinewhich also supplies cold necessary for starting up the unit. Oxygen of 98%purity (the balance being moisture and carbon dioxide) plus pure nitrogencontaining not more than 20 ppm oxygen and 100 ppm argon are finallyproduced. When required, argon can be separated from the N2 in an additionalunit.
Synthesis Gas Compression, Ammonia Synthesis and Storage
11. Pure syngas containing nitrogen and hydrogen in the molecularproportions of 1:3 is conpresaed in a multi-stage centrifugal coapressor at220 to 25G atmospheres and joins a recirculating gas stream in the synthesisloop. This stream passes through a converter containing beds of promotediron oxide catalyst which causes a portion of fresh syngas to react and formamonia during each cycle through the converter. Temperature in the con-verter is controlled by removing reaction heat via "quenching" with therelatively cool incoming gas stream (or by raising low-pressure steam).Reaction gases leave the converter at about 340°C and exchange heat in aboiler feed-water heater. Finally, the gas stream is water cooled andreifrigereted to minus 60C, at which temperature liquid amonia separates ina catch-pot and is depressurized. Flashed gases are recycled back to theentry of the syngas compressor at about 43 atmospheres. Loop refrigerationia undertaken by the absorption-refrigeration principle. Ilquid aimonia indepressurized in two stages and pumped to an atmospheric pressure, lowtemperature storage tank. Most flash-gas from these stages is compressedto about 3 atmospheres and absorbed in the refrigeration system. Residualflash gas is burnt to avoid pollution.
B. Urea Manufacture
12. Urea synthesis from the reaction of ammonia and carbon dioxideunder pressure takes place in two steps. The first is an exothermic re-action in which ammonium carbamate is rapidly formed.
2NH3 + C02 NH2 COONH4 + Heat
In the second step, carbamate is converted to urea and water inthe same pressure converter vessel:
NH2 COCKH4 -__ CO (NH2)2 + H2 0
The urea solution is separated from unconverted amonia, carbon dioxide,carbamate and minor by-products and evaporated to a 99.8% solution which issprayed into a tall prilling tower. The droplets solidify into hard sphereswhich are collected at the base of the tower, cooled (and coated with suit-able materials to reduce sticking, if required) and aent to storage.

ANNEX h4Page 5
13. Large scale urea process technology is limited to a few inter-national licensors and their approved engineering contractors. All arebased on the above synthesis reactions but differ in the way urea isseparated from other components. In the older "total recycle" process,all unconverted reactant8 are recycled back to the converter after step-wise separation. In the newer "stripping processes", urea is separatedfrom unconverted reactants and co-products by stripping the liquor leavingthe converter with incoming amaonia (or C02). This appreciably reducescapital and operating costs compared to older methods. C02 stripping isnow used world-wide in many large plants and ammonia stripping is alsobeing adopted for large-scale production (e.g. 1,000 tpd upward). Whileit has been decided to instanl a stripping process at Phulpur, the finalselections of licensor and engineering firm have not yet been made. Thesewill be tendered on an international basis and offers will be evaluated interms of optimum capital and discounted operating costs, technical pre-ferences, completion times and successful experience.
14. In the reaction section of the carbon dioxide stripping pro-cess, C02 plus a small quantity of air to reduce corrosion is compressedto 145 atmospheres and fed to a steam-heated high-pressure heat exchanger-"stripper" wherein it contacts liquor leaving the converter and removescarbamate by decomposing it to NH and C02. These gases pass to acondenser wherein carbaumte is relorued and is recycled to the converter.Reaction heat is used to generate low-pressure steam for use within theplant. Simultaneously, liquid annmonia from the atmospheric-pressurestorage tank is pumped to the urea plant, heated and compressed. Part issent to the converter and part joins the C02 and reformed carbamaterecycled to the converter. In this vessel, conversion of carbamate tourea is achieved by ensuring plug-flow of the reactants downwards to thebottom nossle and maintaining a residence time of about one hour.Reaction temperature and pressure are about 1800C and 140 atmospheresrespectively. Reaction liquor flows by gravity from the converter to thestripper vessel and then to the recovery section. Inert gases leaves thetop of the converter and are scrubbed in a high-pressure absorber bydilute carbamate solution before being vented to atmosphere.
15. In the recovery section, minor quantities of unconverted C02and NH3 plus nome carbamate are recovered from the urea solution leavingthe stripper. This liquor is depressurized to 3 atmospheres and fed to aheated separation/rectifier column wherein it is contacted by aNH3/C02/H2 0 gaA mixture passing up the column. Carbamate is decomposedinto NH and C02 . The urea solution is further let down to 0.45 atmos-pheres Into a flash tank separator and flows to a urea solution tank.Gases from this separator are condensed under vacuum and the condensateflows to an ammonia-water tank for eventual use or recovery. Gases fromthe rectifier are fed to a low pressure carbamate condenser and theresulting solution is cooled before being sent back to the high pressurecarbamate condenser. Urea solution from the storage tank is evaporatedin two stages working at 0.4 and 0.03 atmospheres respectively. Molten

ANNEX 4-5Page 6
urea from the second stage containing only 0.2% water is pumped to arotating perforated bucket at the top of a tall prill tower. This breaksthe melt into droplets which solidify into sAall spheres (0.1 to 0.3 mdiameter) as required. These are continuously recovered by mechanicalmeans at the base of the tower, and are sometimes cooled and coated withsuitable agents to reduce sticking, prior to storage, bagging and shipping.
16. Steam requirements for urea plant operation are frequentlyobtained from the C02 compressor turbine at 26 atmospheres or so. Thisexhaust is passed to a saturator designed to provide steam at 23 atmos-pheres for use in the C02 stripper. High-pressure condensate is flashedin another saturator to provide steam at 9 atmospheres which is used forthe second-stage urea aolution evaporator and various plant services.Additional steam at 4.5 atmospheres is produced for use in recirculationheaters, the first stage evaporator and for ammonia desorption andrecovery. In this way, maximum use of heat and energy is achieved;however, in some cases, there may still be some 4.5 atmospheres steamavailable for use outside the urea plant.
17. Urea processes based on anmonia stripping operate in a similarmanner except that the reaction liquor leaving the converter is strippedwith anmonia instead of C02.
C. Offaites (Excluding Storage and Materials Handling)
Water Supplies and Treatment
18. Raw water will be drawn from local canals, rivers and on-sitewella. Total requirements will be about 10 million gallons per day,equivalent to about 1,500 cubic meters per hour. Uhtreated raw water willbe required for ash disposal, plant wash-down and some cooling. A minorpart will be chlorinated for drinking purposes. Process water will beobtained by primary chemical treatment of raw water with lime and otherreagents for use in process units as cooling tower make-up and feed to theboiler water-conditioning unit. Boiler feed-water needs will be about 200cubic meters per hour or 1 million gallons per day. To provide for con-tingencies, the daily treatment needs will be increased by 50% and 24 hourprocess water storage will be provided. Water will be degassed afterprimary treatment and treated in ion-exchange units to remove iron, silicaand other harmful components. Feed water for the high-pressure, waste heatand primary boilers will be demineralized to give an analysis of 0.005 ppm(max) silicon as Si02; copper plus iron and nickel not more than 0.01 ppm;and a pH of 7.0 approximately. Total hardness will not exceed 0.01 ppm andmaximum conductivity will be 0.3 micromhos at 200C.
Cooling Towers
19. To save pumping, water treatment and processing costs, coolingwater will be recycled to the optimnm limit. It will be cooled by circu-lating warm water down induced-draft towers of the cross-flow type. In

AMNEX 4i-5Page 7
this design, roof fans draw in ambient air through side louvres, counter-current to the water tricklirgover internal baffles and discharge it toatmosphere at velocities high enough to prevent settling and possibleintake of the moisture-laden warm vapor. The air-cooling range will beapproximtely from 420C down to 320C.
Steam Generation
20. In addition to the removal of harxful salts in boiler feedwater (bfw), dissolved oxygen mist be eliminated by mechanical and alsochemical means such an the addition of hydrozine, phosphates and morpholine/ammonia, prior to ateam raising. Otherwise, severe corrosion would.occur inboiler,drums, tubes, puaps and pipelines. Appropriate facilities will beinstalled to minimize corrosion, scaling, pitting and related failures. Inaddition to the production of high-pressure steam in the P.O. units of theanmonia plant, coal plus small amounts of carbon pellets from theP.O. unitwill be used to raise more h.p. steam at 105 atmospheres (1,550 lbs persquare inch) and 5100C in three boilers, each having a capacity of 160.tonsper hour (one being on light load or standby). These will supply turbinesdriving the ammonia synthesis compressor, air and other gas compressors, theurea C02 compressor and power-recovery turbines and electrical generators.After optimum recovery of sensible heat and fly ash, flue gases will be dis-charged via a tall stack to the ataosphere. Fly ash and boiler grate clinkerwill be collected in a bunker by a wet system and hauled away to local dis-posal areas. Ash and clinker production will amount to some 400 tons per day.To minimize coal needs, economiiers will be installed in all steam systeme toraise boiler feedwater temperatures as high as possible.
Plant and Instrument Air
21. A motor-driven air compressor will supply compressed air forplant use via a cooler, oil cleaner and receiver. Instrument air will befurnished by an oil-free compressor and dried to minus 400C dew point toensure a trouble-free sipply. An ample reserve tank plus a separate back-upinstrumentation system with its own clean air source will be provided toaccommodate emergency shut-downs and sudden failures.
Power Supplies and Distribution
22. Provisions for obtaining up to 3 megawatts of power from theState Electricity Board will be made via a feeder line from the 132 KV grid.This voltage will be stepped down in a plant sub-station to 3.3 KV anddistributed to unit sub-stations which will provide 410, 250 and lowervoltage supplies for various plant needs. A 3.3 KV power plant within thefactory with a generating capacity of 12 KW will meet most of the load andall critical drives will be supplied from this source via a similar step-down netweok. Non-critical needs in excess of internal generating capacitywill operate on power furnished by the State-owned public utility.

ANNEX 45-Page 8
D. Storage, Handling and Other Facilities
Oil
23. Heavy fuel-oil tankers with provisions for steam heating willbe received via broad-gauge railroad and pumped to one of two 12,000 tonstorage tanks via a manifold system permitting 44 tankers to be unloadedsimltaneousl]y. In this way, unit trains carrying 1,100 tons each canshuttle between the refineries and the Phulpur plant, with only a fewhours stoppage for discharging their loads. When filled, the two tankswill provide storage for about 30 days of operation at plant designcapacity.
Coal ,
24. Daily requirements are about 1,200 tons, or one train load perday. Coal will be received via braod gauge railroad and discharged viawagon tippler and conveyors to an open stockpile. Retrieval will be byclamshell cranes and conveyors feeding the coal crushers which will die-chalrge to conveyors supplying the boiler-house bunkers. The coal yardwill hold at least one month's supply (about h0,000 tons).
Amonia
25. Liquid, chilled amonia will be delivered from the Synthesisloop in the ammonia plant to a refrigerated storage vessel holding 5,000tons, or some 5 days production. It will be maintained at minus 3300 bya boil-off and amall liquefaction system. No sales of ammonia are envis-aged and all will be pumped to the urea plant at minus 330 C and 22atmospheres. The storage tank will be insulated to minimize evaporationand rollover hazards. To prevent ground water freezing and disturbingfoundations, the tank will be mounted on foamed glass blocks and a soiltemperature of 40C maintained by steam and electric heaters. The tankand its contents will be fully instrumented for safe control and operation.
Uresa
26. A 30,000 ton bulk product storage building with a parabolicroof is planned. This will hold nearly three weeks production which isconsidered sufficient as many IFFCO cooperatives have a large combinedbagged storage capacity readily accessible by road and rail. Furthermore,recent experience in most large Indian fertilizer plants indicatesatorage capacities over 10,000 tons are unnecessary because of continualheavy offtakes. Urea prill will be conveyed from the prilling sectionto a screening unit and elevated to a tripping conveyor in the silo roof.Reclaiming will be undertaken by a mobile scraper machine which will loadthe product on to a conveyor leading to the bagging plant. Eight bagginglines will be installed, each including an automatic weigher/bagger, slatconveyor, stitching machine and discharge chutes leading to road and railloading platforms.

ANNEX 4-5Page 9
Rail Facilities
27. A broad-gauge railroad siding of nine tracks will be installedwith straight lengths of 600 meters to accomodate unit trains of 40 to 50wagons. It will be provided with diesel ahunters and other facilities tospeed turnarounds and loading.
Non-Plant Facilities
28. These will include offices, cafeterias, change rooms, workshops,garageo, fire fighting and first aid provisions, laboratory, stores, weigh-bridges, time office, security center and boundary fences. Construction ofabout 400 houses as well as a hostel and training school near the plant Isbeing considered.
Land
29. Steps have been taken to acquire a 280 ha site. It is estimatedthe plant, township and miscellaneous offaites such as water and effluenttreatment, coal yard and test faru will require 100, 40 and 60 ha.respectively, leaving 80 ha for expansion purposes such as adding a coal-based feedstock unit.
E. Raw Material, Utility and Other
30 Design Basis Plant Capacities(metric tons)
Per Day Per 330 Day Year
A3monia Plant 900 297,000Urea Plant 1,500 495,000
31 Raw Material Needes /- -- Req~~~~~~~Ruirements
merctons)
Per TonProduct Per Dayg" Per 330 Dayl/
Fuel Oil i t up o(For ammonia feedstock) 0.80 to 0.83-'750 250,000
Coal up to up to(For steam and power generation) 1,200 400,000
1/ Typical properties of fuel oil and coal to be used are given in Annexes5-4 and 5-5.
2/ This will be supplemnted by a few tons per day of carbon pellets recoveredfrom the P.O. gasifiers.
3/ Includes 0.5% transport losses._ According to fuel oil specifications.

ANNEX I 5FP 10
32 Utilities
a) PowerApproximate Requirements
(kilowatt hours)
Plant Per Ton Per Hour Per Day
Ammonia Plant 1J4 5,400 129,600
Urea Plant 38 2,375 57,000
Steam Generation 10 3,150 75,600
Water Treatment 12 2,255 5h,14o
Other Offsites and Townsite 1,870
Total 15,000
Internally Generated 12,000
Required from State Grid 3,000
b) SteamTons at 105 Atmospheres Pressure
Production Consumption DifferencePlant Per Ton Per Day Per Ton Per Day Per Ton Per Day
Ammonia Plant 2.22 1,998 5.75 5,175 -3.53 -3,177
Urea Plant - - 1.14 1,710 -1.14 -1,710
Power Plant - - - 1,320 - -1,320
Steam Plant - 6,960 0.1 696 - 6,26h
Losses - - - 57 - -57
Totals 8,958 8,958 0

ANNEX 4-5Page fl1
c) Water
Approximate Requirements in Cubic Meters
Plant Per Ton Per Hour Per Day
Ammonia Plant
-Cooling Water Make-Up 18.8 705 16,920-Demineralized Water 2.33 88 2,100
Urea Plant
-Cooling Water Make-Up 6.00 375 9,000
Coal-Fired Boilers
-Cooling Water Make-Up - 375 9,000-Demineralized Water 100 2,h00-Raw Water Ash Disposal - 100 2,400
Other Needs
-Raw Water Sanitation,Wash Down, etc. 107 2,580
Total Water 1,850 4h,hOO
Total Cooling Water Make-Up 1,h55 34,920Total Demineralized Water 188 h,500Total Untreated Water 207 4,980
Total V&ter 1,80 4I,I&oo
Catalysts and Chemicals
33 These will include: high tewperature CO-shift cetalyst; amwniasynthOeis catalyst; deoxo unit catalyst; methanol for Rectisol unit;mineral acids and alkalis, plus ion-exchange resons for water treatmentunits; surfactants or coating agents for urea product, as required; andsanitation and slime control agents.
Bags
34 It is planned to pack and ship product urea in 50-kilo polyethy-lene-lined jute bag. Requirements will be 20 bags per ton, i.e. 30,000per day. These will be purchased in conjunction with the bagging needs ofthe other IFFCO plants. The possibility of producing bag liners atPhulpur or elsewhere from polyethylene chips is under consideration.

AMEX 4 -5Page 12
F. Product and Co-Product Specifications
35 Urea
Output, design basis - 1,500
Composition:
Nitrogen - 46.3% weight basisH2 0 - 0.2% " HBiuret - 0.8% n nIron - 5 ppm maximm
Prill size range - between 1 and 2.14 millimeters diameter.
36 Amnonia
Output, design basis - 900
Composition:
NH3 - 99.9% weight basisH20 - 0.1% nOil - 5 ppm maximum
Pressure - 1 kg/cm 2 absoluteTemperature - Minus 33.50C
37 Carbon Dioxide:
Output - About 1,130 TPD
Composition:
CO2 - 98% Volume basisInert Gases - 2% " iH20 - Saturated, or slightly less
Pressure - 1.115 kg/cm 2 or lessTemperature - 200C
38 Sulfur
Output - About 20 TPDState - Molten
Cciosition:
S - 99.6% weight basis (dry)Temperature - 1600C approximatelyRecovery - 93%
Industrial Projects DepartintJuly 1974

INDIA ANNEX 4-6IFFCO FERTILIZER PROJECT
INTEGRATED PROCESS FLOW SHEET FORTHE PROJECT
CLAUS MOLTENSULFUR S TO SOLIDIFICATION,
RECOVERY 20 TPD STORAGE & SHIPPINGUNIT
METHANOL MAKE-UP° 6 TP D
HEAVY PRILRECTISOL CO TOCO 2RCIOUEL _OIL PATILLFRCTRO0 77OTFD OXIDATION SULFUR----- _SHIFT CO RECOVERYo 770 TPD ~ UNIT STRIPPING CONVERSION UNI
UNIT UNIT UI
CARBON DIOXIDETO UREA SYNTHESIS
SOAGEO A0 SYNTHESIS COMPRESSION le IWRAS5HE
5,000 TONS SECTION UNIT
1 130 900TPD TPDCO2 NH3
STEAM TAL UNIT NITROENTT
TO D TRANSPORTATION
7000
400TPDD (METRICOXYGEN TO
~ COAL BOILER AIR-WPARTIAL OXIDAT ON1200 TPD 1H05UASTEA STEAM SEPARATION UI 0 P
STEAM TO ALL UNIT NITROGEN TOUNITS SYNGAS PREPARATION
750 TPD
ASH TO DISPOSAL400 TPD (METRIC TONS PER DAY)
World Bank-8989(R)

ANNEX h-7Page 1
INDIA - IFFCO FERTILIZER PROJECT
ENVIRONMENTAL AND SAFETY CONDITIONS
A. Environmental
1. Principal wastes from the ammonia plant will be:
Surplus Carbon Dioxide:
2. This gas, mixed with nitrogen, is harmless and will be ventedto atmosphere.
Fractionation Air:
3. This contains water vapor and carbon dioxide. It is harmlessand will be released to atmosphere.
'rrocianiC Acid (HCN) Gas Stripper:
4.:, HCN gas will be burnt to harmless water vapor, carbon dioxideand nitrogen which will be released via a stack to the atmosphere.
Carbon-Oil Slurry:
5. This slurry from the partial oxidation units contains 97% ofthe heating value of fuel oil and will be burnt to help raise steam inthe coal fired boilers.
Methanol-Water:
6. A small quantity (about 3 cubic meters per hour) of weak methanolwill be discharged from the Rectisol unit. This will be piped to the maineffluent treatment unit and dispersed by dilution.
Carbon-Scrubbing Water:
7. This will be discharged from the HCN stripper. It will containsome vanadium and other impurities present in the fuel oil and will bepiped to the effluent-treatment unit.
Syngas Gas Purification:
8. Apart from the methanol operating in the closed-circuit Rectisolsystem, the only other purification agent used will be harmless liquidand gaseous nitrogen.
Sulfur Compounds:
9. These will be removed from the P.O. gas stream by the Rectisolunit and converted to elemental S. Only traces will remain unconvertedand these will be burnt before discharge to atmosphere.

ANNEx 4-7Page 2
10. Effluents from the Urea plant will be mostly wash-down waterswhich may contain several hundred parts per million of urea and ammonia.These will be sewered to the effluent-treatment unit. The escape of ureadust from prilling, handling and bagging operations will be minimized bydust filters and good plant design, for economic as well as ecologicalconsiderations.
11. Effluents from plant offsites include:
Boiler Stack Cases:
12. Like any coal-fired installation, these will include carbondioxide, and small amounts of soot and fly ash will be held to a minimumby good plant design, dust catchers and skilled stoking. Fly ash andgrate clinker will be handled in a wet system to eliminate dust and willbe disposed of in local low-lying barren areas. Dust from the coalstorage and handling sections will be minimized by use of water sprays.
Water Treatment Wastes
13. Lime sludge and waste streams from process water and boiler feedwater treatment units containing ammonium salts, chlorides and sulfateswill be piped to the effluent treatment plant.
18. Collected wastes in the effluent treatment plant will be givenappropriate chemical and biological treatment to conform to Indian IS-2490regulations before being discharged to the plant storm water sewer. Nodifficulty is anticipated in meeting these limits which are:
Total suspended solids 100 ppmpH 5.5 to 6.9Biological oxygen demand 30Phenols 1 ppm
15. Sanitary wastes from the plant and housing colony will behandled and treated in a separate system by conventional means.
B. Safety
16. The plant will include all possible precautions against explosion,fire and other operating hazards. As examples, process units and equip-ment will be designed on "fail-safe" principles and will be provided withback-up emergency instrumentation. Operators will be thoroughly trainedin other plants and on simulators in emergency shut-down and restartprocedures. All hazardous flanges and other danger spots will be shrouded.Large tanks containing fuels or dangerous chemicals will be surrounded bysafety dykes. Machine guards, walkways, ladders, etc. will follow, when

ANNEX 4-7Page 3
appropriate, US or European standards. Emergency showers and first aidequipment will be provided. IEFCO will promote good housekeeping andsafety by frequent drills and prizes. Accordingly, it is anticipated
that the Phulpur plant's accident frequency will be of a very loworder.
Industrial Projects DepartmentJuly 1974

ANNEx 4-8
INDIA - IFFCO FERTILIZER PROJECT
STAFFING AND LABOR PATTERN FOR THE PROJECT
1. The pattern of organization would be similar to that developedfor IFFCO projects at Kalol and Kandla. The total strength inclusiveof seven top managers would be 589.
2. Preliminary indication regarding the staffing pattern is givenbelow:
Staff __
Executives Manage- Super- Skilled Admn Un- Totalment visory skilled
WVorks Manager - - - 2 1 3
Production Manager 5 12 117 6 120 260Maintenance Manager 5 - 69 - 37 111Technical Manager 4 - 75 - 16 95Finance Manager 2 6 - 12 4 24Materials Manager 1 3 13 10 15 42Personnel Manager 1 3 1 5 44 54
Total 18 24 275 35 237 589
3. It is estimated that houses would have to be constructed forabout 400 of these personnel. The estimated cost of the township includingroads, drains, electricals, public buildings, etc. is estimated atRs 180 lakhs.
Industrial Projects DepartmentJuly 1974

INDIA ANNEX 4-9IFFCO FERTILIZER PROJECT
PROPOSED PROJECT CONSTRUCTION STAFF ORGANIZATION
PROJECT MANAGERSjIBRPOE (LIAISON) SU OJECT MANAGER (LIAISON) T UREA
OFFSITES
PLANNC IENUNIT
_ ~~~~CHIEF PRCRMNPROJECT OFFiCER CONSTRUCION COOCREMENATO
ENGINEER ~ ~ ~ Cz*N;NE
ST FF| M ECH . ElNFFNEER OV ERS E ERS ERECTION ENGRS.INST. ENGINEERS
PERSONNEL
F I NANC E M AN AG ER AND MANTAGIELR
I NCHARG E
f STAFF 1 0 GUARDS | | PURCHAS|| STORES ||LBU SETO 0 SECTION
World Bank-8988(R)

INDIAIFFCO FERTILIZER PROJECTCONSTRUCTION SCHEDULE
MONTHS
ITEMS 1 2 3 4 1 5 6 7 8 10 1112 13 1 1516 17 18 19 20 21 22 23 24 25 26 27 28 29 30 31 32 33 34 35 36 37 38 39 40 41
AMMONIA PLANT IFOUNDATIONS u m li U UU*I U
MAIN EQUIPMENT W I I= I _ 1 r6f . 1v m h 1i MM r .__
OTHER EOUIPMENT I u *lmml f . *.m..m___
PIPING, INSTRUMENT & ELEC. _ _ I _ 16 polElsllNN Sol III Im *mmmmmmummmu
UREA PLANT
FOUNDATIONS I II I1 111111 II II t _ I IIMAIN EQUIPMENT I * I t .E1 ii i ,i i m.m mElE *mrnmmmmmm_____
OTHER EQUIPMENT 0V119 III 1IIhIIIlIII no IIiEII I * m u u m m
PIPING, INSTRUMENT & ELEC. I `*7 I. v. IIA II" 1111 _
OFFSITES _ * ." L h .']EriImmIuIEIEmmIImJuImImmUUmU_ _ _ _
STEAM & POWER no I * I i m i in d .m _____
WATER TREATMENT IIE i-iE i iMii i imsi i .. . m.COOLING TOWERS lol I Emfilio lolloo|ls lol|l II all III Wlol1o 1|lo low W| loll __
WATER & POWER-SUPPLY & DIST. I wIT. III oiiml I lol II oil __I_I_II_I_I_
MATERIAL HANDLING EQUIP. U j tiEsE liimneI IIIFIiIE II 1T..m....llll l I
RAILWAY SIDING o t iT r .. . .t . .. ..E __. i l ll g ll gl
OTHER OFFSITES I .1 lii 111 IIEU U IUm m
CIVIL WORKS P61 9 .6 Im.m1.mmillSITE PREPARATION I
FOUNDATIONS *tm U mEmmEmE I
BUILDINGS&STORAGES a a tN I I II lIiIr l oil ii E. -. I IOI r~~~~~~~~~~~~~~~T ~~~~~~~MECHANICAl-&SUPPLY I I Ii
LEGEND
_ m m_ DESIGN/ENGINEERING gmggggmgmmmmm CONTRACTING/PROCUREMENT CONSTRUCTION/EXECUTION
World Bank-8986(H)

ANNX 4-1i1
INDIA - IFFCO FERTILIZER PROJECT
TRANSPORTATION AND HANDLING OF LARGE EQUIPMENT
IFFCO has constructed a special road vehicle to carry loads of up to250 tons, which has been used to move the Kalol converters and other heavyvessels from the port to the site. Large mobile cranes have also been hiredfor Kalol and these will be retained or purchased for the Phulpur project,if possible. (A heavy lift mobile crane will also be required after theproject is built, to help undertake maintenance work and this will have to bepurchased). A preliminary study has shown the movement of overdimensionalconsignments such as ammonia and urea converters, tall scrubbing columns, etc..,from Bombay or Calcutta via the broad gauge railroad may be possible withoutmajor problems and costs. The overdimensional consignments include the following:
Length Diameter Weight----- meters tons
Ammonia PlantShift Converter 1 20.0 3.0 80Shift Converter 2 9.0 3.5 100Direct Contact Cooler 3.5 10.0 70Ammonia Converter 13.3 2.0 200Catch Pot 8.0 2.3 60
Urea PlantConverter 31.0 3.0 250High Pressure Heat Exchanger 11.0 3.0 110High Pressure Carbamate Condenser 16.0 2.5 100High Pressure Scrubber 10.0 2.0 25Steam Drum 12.0 3.0 15o
Industrial Projects DepartmentAugust 1974

INDIAIFFCO FERTILIZER PROJECT
MANAGEMENT CHART (OPERATIONS
BOARDOF
DIRECTORS
MANAGING HEAD OFFICEDIRECTOR NEW DELHI
.~~~~~~~~~~~~~~~
OPERATIONS MARKETIN
WOK WOK . . STF MAIE MAAE I SAE
* SATIONS | S . | MARKE;;;;; T v | GENERAL MANAGER | | ~~~~(ADMINISTRATION|MANA GER .DIRECTOR DIRECTOR (COOPERATION) §|&PRONL
MMANAGER ANAGER * MARKETING (FINANCE) ACCOUNTS) BOARDKALOL KANDLA SERVICES
............. ................................................................. .......................... .......... .. ,, .,:
' ~~~.......... ................................................................. .... .......
WORKS MANAGER STATE FIELD OFFICESPHULPUR . MANAGERS
. * .SA F:................................... .................................................................................... l ,
S T A F F
World Bank-89E16(R) r

INDIA - IFFCO FERTILIZER PROJECT
CAPITAL COST ESTIMATE(US$ million)
Foreign Exchange _Local CurrencyLDcal Local
Foreign Exch. Currency CurrencyDirect Total CIF Component of Foreign Exch. 'total Duties Part of Part ofImports Freight & Direct ICB won by Component of Foreign 40% of CIF Local ICB won by Local Total Total
FOB Insurance Imports Local Suppliers. Local Procure. Exchange Dir,Imports Handling Local Supp. Procure. Local ProjectEquipment- Ammonia Plant 22.51 1.55 24.06 3.24 1.97 29.27 9.63 1.40 4.86 5.05 20.94 50.21- Urea Plant 6.49 0.54 7.03 0.93 0.57 8.53 2.82 0.40 1.40 2.60 7.22 15.75- Steam Plant 5.80 0.31 6.11 0.83 0.51 7.45 2.45 0.30 1.24 4.50 8.49 15.94- Power Plant 1.23 0.07 1.30 0.17 1.00 2.47 0.53 0.07 0.27 4.00 4.87 7.34- Other Offsitea 0.62 0.03 0.65 0.08 0.50 1.23 0.27 0.03 0.13 2.00 2.43 3.66- Construction Equipment 0.90 0.10 1.00 0.15 0.15 1.30 0.40 - 0.15 0.45 1.00 2.30- Spare Parts 2.35 0.15 2.50 0.30 0.25 3.05 1.00 0.10 0.50 1.00 2.60 5.65
Sub-total, Equipment 39.90) ?.75 42.65 5.70 4.95 53.30 17.10 2.30 8.55 19.60 47.55 100.85
Land Acquisition - - - - - - - - 0.50 0.50 0.50Site Development and Township - - - - 0.65 0.65 - - - 2.55 2.55 3.20Licenses and Engineering 9.55 - 9.55 - - 9.55 - - - 1.60 1.60 11.15Civil Works - - - - 1.75 1.75 - - - 6.95 6.95 8.70Erection and Supervision 2.90 - 2.90 - - 2.90 - - - 5.40 5.40 8.30Project Management Services 1.50 - 1.50 - - 1.50 - - - 2.50 2.50 4.00Pre-operating Expenses - - - - - - - - - 2.50 2.50 2.50
Sub-total Basic Cost Estinnte 53.85 2.75 56.60 5.70 7.35 69.65 17.10 2.30 8.55 41.60 69.55 139.20
Physical Contingency (10%) - - 5.65 0.60 0.75 7.00 1.70 0.25 0.85 4.15 6.95 13.95Sub-total 62.25 6.30 8.10 76.65 18.80 2.55 9.40 45.75 76.50 153.15
Price Escalation _/ 11.50 1.15 1.45 14.10 3.50 0.45 1.75 8.25 13.95 28.05Sub-total 73.75 7.45 9.55 90.75 22.30 3.00 11.15 54.00 90.45 181.20
Working Capital - - - - - - - - - 13.00 13.00 13.00Interest during Construction - - 16.60 - - 16.60 - - - 9.70 9.70 26.30
Total Financing Required 90.35 7.45 9.55 107.35 22.30 3.00 11.15 76.70 113.15 220.50
a/ 18.5% on direct imports, duties and local equipment, brought through ICB.18% on civil works and all other local costs.
Industrial Projects DepartmentOctober 1974

ANNEX 5-2Page 1
INDIA - IFFCO FERTILIZER PROJECT
EXPENDITURE CCffMITNENT AND PRICE ESCALATIDN FACTORS
A. Expenditure Commitment Schedule
Year % of Project Base (unescalated) Cost
1 (1975) 15
2 40
3 35
4 (8 months) 10
100
B. Annual Escalation Rate:E6scalation Rate, %
F Works andYear and Local Equipment Other Local Costs
1 (1975) 11% 10%
2 (1976) 7.5% 8%
3-h (1977-1978) 7.5% 8%
C. Price Escalation Factors per $100 of Base Cost
Foreign Exchange Civil Works andand Local uipment Other Local Costs
Compounded Factor per $100 Compounded Factor per $100Year Escalation Rate Base Cost Escalation Rate Base Cost
1 (1975) 5.5% 15.a/ 5.0% 15.8
2 15.2% 46.1 1.h% 45.8
3 23.8% 43.3 23.6% 43.3
h (1/3 year) 31.5% 12 13.8%.18 .1
Price Escalation Compounded Over Construction Period:
(a) For Foreign Exchange and Local Equipment 18.h%, say 18.5%
(b) For Civil Works and Other local Costs = 18.1%, say 18.0%
1/ Calculated as follows: 15 + (0.055 x 15) = 1.55 x 15 = 15.8, where 15 is thedisbursement in Year 1 from A above.

ANNEX 5-2Page 2INDIA - IFFCO FERTILIZER PROJECT
EXPENDITURE COMMIfr AND PRICE ESCAIATION FACTORS
D. AssUmed Annual Price Inflation Rates
International Prices
AveraRe Annal Inflation Rates %Fquipmnt and General
Year Enaineering Services PriCa/
1975 11
1976 7.5 7.5
1977-1978 7.5 7.5
Compond Factor from Start of1975 to rid-1978 1.33 1.33
Domestic (India) Prices
Equipment, Civil GeneralTear Works and Engineering Prices
1975 10 12
1976 8 8
1977-1978 8 6
Coapound Factor from Start of1975 to mid-1978 1.33 1.32
a! 1975 tO 1985 inflation rates are takcen from the Bank's Price ForecastsFor Major Prary Camiodities, Report No. I467, June 19, V7T|.
Industrial Projects DepartmentOctober 1974

ANNEX 5_3
INDI1 - IFFCO FERTILIZER PROJECT
PE4RHAENT WCRINlG GAPITAL IN MID-1978 PRICES
AmountItem (Rs Xi3lion)
Raw Material Inventor'Ya&1. FUel Oil: 23,100 tons 0 Rs 56l/ton 12.962. Coal t 36,400 tonA S Rs 112/ton 4.083. Bags for 45,000 tone wea 0 Rs 119/ton of urea 5.364. Chemicals and consumables for 90,000 tons of urea"/
* 22.0/ton of urea 1.98Subtotal 24.38
SDare Parts Inventory (at acquisition cost) 55.27
Intermediate Product InventoryAmnonia: 5,000 tons S Rs 1,072/ton2! 5.36
Finished Product InventoryUrea (bagged): 145,000 tons @ Rs 925/ton:- 41'63
Accomnto ReceivableSales of 40,00o bone urea e Re 1,450 (US$193)/ton 58.0
Minimm Operating Cash Balance1/12 of annual fixed operating cost excludingdepreciation charges 4.71
Gross Working Capital 189.35Less:
Accounts Payable1. Fuel Oil: 23,100 tons 0 Rs 56 1/ton 12.962. Coal : 36,400 tons 0 Re 112/ton 4.083. Bags for 45,000 tone urea 0 Rs I19/ton of urea 5.36
Subtotal 22.40
Sub-total 166.95
Deductt
Depreciation Charges Included in Ammonia and Urea Inventory! lL15
Spare Parts Included in Capital Cost Estimate 55.27
Permanent Working Capital to be included in Project Costsay Rs 97.5 million or $13.0 million 97,53
a/ Except for chei9cals and amonia inventory, all otbir inventory of materialsare based on 30 operating days of supply or I5,000 tons of urea.
/ Chemicals and consmaables represent 60 operating days supply or 90,000 tonsof Urea.
s/ Amoinia is taken to represent 80% of the urea production cost (excludingcost of bags of Rs 119/ton). Since 0.6 tons of ammenia are used per tonof urea, the production coot relationship is as follonsw(Ammonia production cost/ton) x (0.6) - (0.80) x (urea production co t/toc)A-lka production cost/ton = (1.33) x (urea production coat/toe)
- (1.33) x (925 - 119)A onirA production cost RJs 1,072/ton of anionia.
4/ Price excludes marketing and premotien charges of Rs 13 per ton*/ Depreciation included in urea production cost - Rs 274/ton of urea.
Depreciation included in the ammonia production coat Rs 364 /ton of ammonia.
Industrial Projects DepartmentOctober 1974

1NNEX 5-4Page 1
INDIA - IFFCO FERTILIZER PROJECT
INTERET DURING CONSTRUCTION
A. Interest and commitment charges on IBRD Loan of US $109 (Rs. 817.5) million:
Disbursement Average ($ Million)Period Percentage $Million Undisbursed
At end of Year 1 (1975) 10 10.9 103.6At end of Year 2 35 38.1 79.1At end of Year 3 40 43.6 38.2At end of Year 4 (8 months) 15 16.4 8.2
100 - 109.0
-Us___--------- US$ Million --------------Year Ending December 31 1975 1976 1977 1978 (8 months)
Already Drawn 0 10.90 49.00 92.60Previous Year's Interest 0 1.34 3.80 7.93Opening Debt 0 12.2L 52.80 100.53Interest on Opening Debt(a) IBRD (8%) 0 0.98 4.22 5.36(b) GOI Guarantee Fee (2V) 0 0.28 1.19 1.51
Disbursed During Year 10.90 38.10 43.60 16.40Interest on Current Disbursenent(a) IBRD (4%) o.h4 1.52 1.74 O.b4(b) GOI Guarantee Fee (1 1/8%) 0.12 0.43 o.49 0.12
Average Undisbursed Amount 103.60 79.10 38.20 8.20IBRD Commitment Fee (3/A%) 0.78 0.59 0.29 o.0,
Total Interest Charges for Year 1.34 3.80 7.93 7.47
Interest assumed for capital cost estimate:
(a) IERD (foreign exchange) 1.3 3.1 6.3 5.9(b) GOI (local currency) 0.1 0.7 1.7 1.6
B. Interest on local currency loansa/ of US $3b.3 (Rs. 257.3) million:
Disbursement Average ($ Million)Period Percentage $ Million Undisbursed
At end of Year 1 (1975) 5 1.7 33.5At end of Year 2 25 8.6 28.3At end of Year 3 50 17.2 15.hAt end of Year 4 (8 months) 20 6.8 3.4
100 i i.

ANNEX 5-4Page 2
------- JS$ Million -- ---Year Ending December 31 1975 1976 1977 1978 (8 months)
Already Drawn 0 1.70 10.30 27.50Previous Year's Interest 0 0.34 0.86 2.14Opening Debt 0 2.0k 11.16 29.64Interest on Opening Debt (iOc) 0 0.21 1.14 2.03Disbursed During Year 1.70 8.60 17.20 6.80Interest on Current Disbursement (5 1/8%) 0.09 0.44 0.88 0.23Average Undisbursed Amount 33.50 28.30 15.40 3.4oCommitment Fee (3/4%) 0.25 0.21 0.12 0.02
Total Interest for Year 0.34 0.86 2.14 2.28
Interest assumed for capital cost estimate:
(a) Financial Institutions 0.2 0.6 1.4 1.6(b) GOIŽ/ 0.1 0j 0.7 .7
0.3 0.9 2.1 2.3
a/ Including subordinated debts to the GOI of US$ 11.0 (Rs. 82.5) million,representing 32% of the local currency loans.
b/ 32% of local interest charges are for the GOI loans.
Industrial Projects DepartmentOctober 1974

ANNEX 5-5Page 1
INDIA - IFFCO FERTILIZER PROJECT
DISBURSEMENT SCHEDULE(U$million)
-----------Year------------1 2 3 4
A. Project Cost 1975 1976 1977 1978 Total(8mth-s)
I. Foreign Exchange Cost
(a) Equipment & Services 9.1 31.8 36.3 13.6 90.8(b) Interest during Construction 1.3 3.1 6.3 5.9 16.6
Subtotal 10.4 34h.9 1h,2.6 19.5 107.1
II. Local Currency Cost
(a) Equipment & Services 6.8 23.8 27.2 10.3 68.1(b) Working Capital - - - 13.0 13.0(c) Duties 2e2 7.8 8.9 3.4 22.3(d) Interest during Construction 0.4 1.6 3.8 3.9 9.7
Subtotal 9.4 33.2 39.9 30.6 113.1
TOTAL 19.8 68.1 82.5 50.1 220.5
B. Financing Sources
I. IBRD Loan 10.9 38,1 43.6 16.4 109.0
II. Local Currency
1. Equity(a) Cooperatives 2.7 8.1 8.2 10.2 29.2(b) GOI 4.5 13.3 13.5 16.7 h8.0
2. Subordinated Debt (GOI) 0.6 2.8 5.5 2.1 11.03. Long-Term Loans 1.1 5.8 11.7 h.7 23.3
Subtotal 8.9 30.0 38.9 33.7 111.5
TOTAL 19.8 68.1 82.5 50.1 220.5

ANNEX 5-5Page 2
C. Quarterly Disbursements of IBRD Loan
Quarterly Cumulative(US$ million) (US$ million) Percentage
Year 1 (1975) I 2.1 2.1II 2.2 4.3III 3.3 7.6IV 3.3 10.9 10
Year 2 I 7.6 18.5II 8.7 27.2III 10.9 38.1IV 10.9 49.0 45
Year 3 I 12.0 61.0II 10.9 71.9III 10.9 82.8IV 9.8 92.6 85
Year 4 I 7.6 100.2II ~~~~5.14 105.6
III 3.4 109.0 100
Industrial Projects DepartmentOctober 1974

ANNE. 6-1
INDI& - IFFCO FERILIZR PROJECT
DIPRNCIATIONI SCHEDUIE(At Acquiaition Cost)
La llion
A. Depreciated Over 12 Years
(a) Construction Equipment 17.2(b) Plant and Off.ite Equipment, Licenses & Engineering 78O.l4(c) 'rection and Supervision 62.3(d) Civil Works 65.3(e) Project Managemnt Services 30.0(f) Pro-Operating cpensas 18.8
Subtotal 9714.0
Physical Continecy 97.14Subtotal 1,071.14
Price Escalation 196.4Subtotal 1,Z67 .T
(g) Interest During Construction 197.3
Total Depreciable Assets 1,465.1
B. Non-Deorciable Assets
(a) Land Acquisition, Township and Site Development 27.7(b) Spare Parts 142.14
Subtotal 70.1
Pbysical Contingency 7.0
Subtotal 77.1
Price Escalation 14.1Subtotal 91.2
(c) Permanent Working Capital 97.5Total Non-Depreciable Assets 188.7
Total Project Cost 1,653.8
C. Annual Depreciation Chargew (straight line method):
Annual Depreciation 1,465.1 - s 122.1 million
Industrisl Prni X.ts DepartrntOctober 19714

AiNEI 6-2
INDIA - IFFCO FERTILIZER PROJECT
URE PRODUCTION CCST ESTIMATE AT MID-1978 PRICES(at M0 capacity utilization)
Unit/Ton Re/Ton Res Million/Ulnit Rs/Unit of Urea of Urea Year
A. Variable Costs
1. Fuel Oil tons 561 0.513 287.79 128.22. Coal ton 112 0.808 90.50 4&0.33. Bags _- - 119.0 53.04. Chemicals & Consmables - - - 22.00 9.85. Erternal Powr kwh 0.16 48 7.68 3.46. Duty on Self-Generated
Paver kwh 0.013 192 2.50 1.17. Marketing & Promotion - - - 13.20 5.9
Total Variable Costa 542.67 241.7
B. Fixed Costs
1. Salarios, Wages & Overh ad - - - 28.06 12.52. Maintenance Materia4r - _ 80.13 35.7
3. Insurance and T- - - 18.63 8.3.Depeciation Charge at
Aqisition CostE - _ - 274.07 122.1
Total Fixed Costs 400.89 178.6
C. Total Production Cost - - _ 943.56 420.3
D. Leas Sulphur Sales - - - 5.68 2.5
B. Net Production Coat beforeIntweret Charges e - 937.88 417.8
a/ 3.5% of equipmnt cost for plant and offaites at 1978 equipment prices.
Total(Ru Million)
(i) Plant and Offuite Equipment Costa (at end ofi 1974 prices) 696.8
(ii) Physical Contingency (10%) 69.7
Subtotal 766.5(iii) Price Escalation from end of 1974 to .id-1978 (33%) 252.9
Total 1,019.4Anual Maintenace Naterial Coats - (0.035) x (1,020) say 1,020
- Rs 35.7 millionk/ 0.5% of total proJect coat including interet during constction.
Amnual I s1uoo sA Tax 'pes . (0.005) x (1,653.8)- Rs 8.3 rdllion
c/ If the assets are realued In 1978 r%pes, the depreciation charges wil beRs 135.2 million per year, as shown in Annex 6-7.
Industrial Projects DepartmentOctober 1974

ANNEX 6-3
INDIA - IFFCO FERTILIZER PROJECT
DEBT SERVICE SCHEDULE IN CURRENT RUPEES(Millions)
End-of-Year Debt Interest PrincipalOutstanding Payments Paymentsb!/
IBRD GOT IDBI IBRDE/ GO_ IDBI_ IBRD GOI IDBI
1 19781/ 817.50 82.50 174.75 27.90 2.82 5.97
2 817.50 82.50 174.75 83.79 8.46 17.91
3 768.79 7h.25 157.27 82.57 7.82 16.57 48.71 8.25 17.48
h 716.14 66.00 139.79 77.48 6.98 14.78 52.65 8.25 17)48
5 659.18 57.75 122.31 71.98 6.13 12.98 56.96 8025 17048
6 597.57 49.50 104.83 66.02 5.28 11.19 61.61 8.25 17.48
7 530.93 41.25 87.35 59.58 4.44 9.40 66.64 8.25 17.48
8 458.85 33.00 69.88 52.61 3.59 7.61 72.08 8.25 17.47
9 380.89 24.75 52.41 45.07 2.75 5.82 77.96 8.25 17.47
10 296.59 16.50 34,94 36.92 1.90 4.03 84.30 8.25 17.47
11 205.39 8.25 17.47 28.11 1.06 2.214 91.20 8.25 17.147
12 106.77 18.57 0.21 0.45 98.62 8.25 17.147
13 8.26 106077
a/ At 8% per annum plus the 2% guarantee fee to the Government (which is 21.95% of theamount shawn in this column).
b/ Payments are made semi-annually at the start and middle of each year, and the interestcharge for the year is calculated based on the amount outstanding at the start and themiddle of the year.
c/ At 10V per annum.d/ 4 months of operation only.
Industrial Projects DepartmentOctober 1974

ANNEX 64Page 1
INDI - IFMVO FERTILIZER IROJECT
FINANCIAL FORECASTS FOR PROJECT ALONE
OPENING B&LANCE SHHET? FOR PROJECT ALCKIE(As of Aug. 30, l978)
(Rs Million)At AcqUiistion
Current Assets Cost
1. Cashl/ 90o3142. Accomts Receivable O.OO3. Finished Goods Inventory 0.0014. Work-in-Process 5.365. Raw Material Inventory 24.38
Total Current Assets 119.88
9pare Parts 55.27Gross Fixed Assets 1,501.05Accumulated Depreciation 0.00
Net Fixed Assets 1,501.05
TOTAL ASSETS i,676.20
Current Liabilities
Accounts Payable 22.h0Short-Teom Debt 0.00current Part of Long-Term Debt 0.00
Total Current Liabilities 22.140
Long-Ter Debt 992.25Subordinated Debt 82.50
-Total Debt 1,074.75
EquityShare Capital 579.05Retained Earnings 0.00
579.05
TOTAL LIABILITIRS 1,676.20
a/ Part of this cash is used to finance accounts receivable and finishedgoods inventory during the initial months of operation. Other cxrrntassets and liabilities are taken from Annex 5-3.
Industrial Projects DepartmentOctober 1974

INDIA - IFFCO FERTILIZER PROJECTPHULPUR PROJECT ALONE
(Rs million)1 2 3 4 5 6 7 8 9 10 11 12 13
1978 1979 1980 1981 1982 1983 1984 1985 1986 1987 1988 1989 1990
_________________
INCOME Statemnt for the Year Ending December 31, in 1978 Prices_________________
%CAPACITY UTIL.KANDLA UNIT 0 0 0 0 0 0 0 0 0 0 0 0 0KALOL UNIT 0 0 0 0 0 0 0 0 0 0 0 0 0PHULPUR UNIT 60 60 80 90 90 90 90 90 90 90 90 90 90GROSS OUtPUT(M.TONKANDLA UNITCNPK) 0 0 0 0 0 0 0 0 0 0 0 0 0KALOL UNIT(UREA) 0 0 0 0 0 0 0 0 0 0 0 0 0PHULPUR UNIT(UREA) 98901 297000 396000 445500 445500 445500 445500 445500 445500 445500 445500 445500 445500TRANSFERS C INV.UREA TO KANDLA 0 0 0 0 0 0 0 0 0 0 0 0 0NPK INV BUILD-UP 0 0 0 0 0 0 0 0 0 0 0 0 0UREA INV BUILD-UP 45000 0 0 0 0 0 0 0 0 0 0 0 0UNITS SOLD(TONS)NPK 0 0 0 0 0 0 0 0 0 0 0 0 0UREA 53901 297000 396000 445500 445500 445500 445500 445500 445500 445500 445500 445500 445500UNIT SALES PRICENPK (AVE.) RS/TON 0 0 0 0 0 0 0 0 0 0 0 0 0KALOL UREA RS/TON 0 0 0 0 0 0 0 0 0 0 0 0 0PHULPUR UREA RS/TO 1450 1450 1450 1450 1450 1450 1450 1450 1450 1450 1450 1450 1450SALES(RS MILLION)NPK REVENUE 0.00 0.00 0.00 0.00 0.00 0.00 0.00 0.00 0.00 0.00 0.00 0.00 0.00UREA REVENUE 78.16 430.65 574.20 645.98 645.98 645.98 645.98 645.98 645.98 645.98 645.98 645.98 645.98OTHER REVENUES 0.s6 1.6 2.29 2.5 2.5 2.53 2. 2.53 -2.53 2,53 2.5TOTAL REVENUE 7 432.34 576.45 6142.50 6142B:6 sj b45 648.50 6 5 0 fW 648.50VARIABLE COSTSFEEDSTOCK COSTS 28.46 85.47 113.96 128.21 128.21 128.21 128.21 128.21 128.21 128.21 128.21 128.21 128.21FUEL COSTS 8.95 26.88 35.84 40.32 40.32 40.32 40.32 40.32 40.32 40.32 40.32 40.32 40.32CATALYSTS t CHEM 2.18 6.54 8.71 9.80 9.80 9.80 9.80 9.80 9.80 9.80 9.80 9.80 9.80EXTERNAL POWER 0.76 2.28 3.04 3.42 3.42 3.42 3.42 3.42 3.142 3.42 3.42 3.42 3.42BAGS 11.77 35.34 47.12 53.01 53.01 53.01 53.01 53.01 53.01 53.01 53.01 53.01 53.01MKTG t PROMOTION 0.71 3.92 5.23 5.88 5.88 5.88 5.88 5.88 5.88 5.88 5.88 5.88 5.88OTHER VAR COSTS _______ 11 11 112 112.TOTAL VARIABLE 53 081611 8 21 90 24 I 7 1 24176 241.76 241 76 241 76 241 7 6ANNUAL FIXED COSTSWAGES t CVERHEAD 4.16 12.50 12.50 12.50 12.50 12.50 12.50 12.50 12.50 12.50 12.50 12.50 12.50MAINTENAN:CE MATIS 11.88 35.69 35.69 35.69 35.69 35.69 35.69 35.69 35.69 35.69 35.69 35.69 35.69!NSURANCE t TAXES 2.76 8.30 8.30 8.30 8.30 8.30 8.30 8.30 8.30 8.30 8.30 8.30 8.30DEPRECIAlION 40.66 122.10 122.10 122.10 122.10 122.10 122.10 122.10 122.10 122.10 122.10 122.10 81.44OTHER FIXED COSTS 0 00 0.00 0.00 0 00 0.00 0.00 0.00 0 00 0.00 0.00 0 00 0.00 0.00TOTAL FIXED COSTS 59 146 7.0 17.0 1786 178.60 178. 60 1. -1 75 TT186 17B.60 178.60O 17.60 17 137.94
TOTAL rROD. COSTS 112.53 339.77 393.50 420.36 420.36 420.36 420.36 420.36 420.36 420.36 420.36 420.36 379.70INVENTORY ADJ.NPK INV CHANGE 0.00 0.00 0.00 0.00 0.00 0.00 0.00 0.00 0.00 0.00 0.00 0.00 0.00UREA INV CHANGE
42L20 0.00 0.00 0.00 0.00 0.00 0.00 0 00 0.00 0.00 0.00 0.00 0.00
CGST OF SALES 70.33 339.77 393.50 420.36 420.36 420.36 420.36 420.36 420.36 420.36 420.36 420.36 379.70INTEREST LT DEBT 36.69 110.16 106.96 99.24 91.09 82.49 73.42 63.81 53.64 42.85 31.41 19.23 8.26,NTEREST ST DEBT 0.00 0.00 0 00 0.00 0.00 0.00 0 00 0.00 0.00 0.00 0.00 0.00 (3.0
-P~0FIT BEFORE TAX -28.30 -17.60 75.99 128.90 137.05 14 .6 1'47214. 71.0152 19.30 26.5INCO'ME TAXESC55t)X 2 .O9?.8 81.0 11 85 l 1o 9038 959119 082Ž, NET PROFIT BEFORE 2TAX .30 -7 .5i 20 69. 3 73.95 7 833 88.53 .01 117.25
CUM REr Pt;OF BEG $0.00 -28.30 -45.90 13.54 71.55 133.22 198.77 268.39 3142.34 1420.87 504.25 592.79 686.80CUM RET PROF END -28.30 -45.90 13.54 7 1.55 133.22 198.77 268.39 342.35 420.87 504.25 592.79 686.80 804.04
NET PRCFIT % SALES -36 -14 10 9 10 10 11 11 12 13 14 14 18

INDIA - IFFCO FERTILIZER PROJECTPHULPUR PRO.IECT ALONE
(Rs million)1 2 3 4 5 6 7 8 9 10 11 12 13
1978 1979 1980 1981 1982 1983 1984 1985 1986 1987 1988 1989 1990
FUNDS FLOW Statement for the Year Ending December 31 in 1978 Prices___________
SOURCES OF FUNDSNET PROFIT -28.30 -17.60 59.44 58.01 61.67 65.54 69.63 73.95 78.53 83.38 88.53 94.01 117.25
INT SUB LT DEBT 2.82 8.46 7.82 6.98 6.13 5.28 4.44 3.59 2.75 1.90 1.06 0.21 0.00
INT REG LT DEBT 33.87 101.70 99.14 92.26 84.96 77.21 68.98 60.22 50.89 40.95 30.35 19.02 8.26
INTEREST ST DEBT 0.00 0.00 0.00 0.00 0.00 0.00 0.00 0.00 0.00 0.00 0.00 0.00 0.00
DEPRECIATION 40.66 122.10 122.10 122.10 122.10 122.10 122.10 122.10 122.10 122.10 122.10 122.10 81.44
SHORT TERM DEBT 0.00 0.00 0.00 0.00 0.00 0.00 0.00 0.00 0 00 0.00 0.00 0.00 0 00
TOTAL SOURCES 49.05 214.66 288.50 279.35 27T4.8 270.13 265.15 25 9.8 254.27 248733 242.04 235.34 206.95
USES OF FUNDSCHANGE IN ACCT REC 58.00 0.00 0.00 0.00 0.00 0.00 0.00 0.00 0.00 0.00 0.00 0.00 0.00
CHANGE IN FG INV 42.20 0.00 0.00 0.00 0.00 0.00 0.00 0.00 0.00 0.00 0.00 0.00 0.00
NET CHANGE OTHERS 62.61 0.00 0.00 0.00 0.00 0.00 0.00 0.00 0.00 0.00 0.00 0.00 0.00
INT SUB LT DEBT 2.82 8.46 7.82 6.98 6.13 5.28 4.44 3.59 2.75 1.90 1.06 0.21 0.00
INT REG LT DEBT 33.87 101.70 99.14 92.26 84.96 77.21 68.98 60.22 50.89 40.95 30.35 19.02 8.26
INTEREST ST DEBT 0.00 0.00 0.00 0.00 0.00 0.00 0.00 0.00 0.00 0.00 0.00 0.00 0.00
SUB LT DEBT PAY. 0.00 0.00 8.25 8.25 8.25 8.25 8.25 8.25 8.25 8.25 8.25 8.25 0.00
REG LT DEBT PAY. 0.00 0.00 66.19 70.13 74.44 79.09 84.12 89.55 95.43 101.77 108.67 116.09 106.77
ST DEBT PAYMENT 0.00 0.00 0.00 0.00 0.00 0.00 0.00 0.00 0.00 0.00 0.00 0.00 0.00
TOTAL USES 199.50 110.16 181.40 177.62 173.78 169.83 165.79 161.61 157.32 152.87 148 33 143.57 115.03
NET CASHFLOW -150.46 104.50 107.10 101.73 101.08 100.30 99.36 98.25 96.95 95.46 93.71 91.77 91.92
WORKING CAP FUNDS 152.75 0.00 0.00 0.00 0.00 0.00 0.00 0.00 0.00 0.00 0.00 0.00 0.00
BEGINNING CASH 0.00 2.29 106.80 213.90 315.62 416.71 517.01 616.37 714.62 811.57 907.03 1000.74 1092.51
ENDING CASH 2.29 106.80 213.90 315.62 416.71 517.01 616.37 714.62 811.57 907.03 1000.74 1092.51 1184.43
REG LT DEBT SERV 33.87 101.70 165.33 162.39 159.40 156.30 153.10 149.77 146.32 142.72 139.02 135.11 115.03
TOTAL LT DEBT SERV 36.69 110.16 181.40 177.62 173.78 169.83 165.79 161.61 157.32 152.87 148.33 143.57 115.03
CASH:DEBT RATIO 49.05 214.66 288.50 279.35 274.86 270.13 265.15 259.86 254.27 248.33 242.04 235.34 206.95
REG DEBT COV RATIO 1.45 2.11 1.74 1.72 1.72 1.73 1.73 1.74 1.74 1.74 1.74 1.74 1.80
TOTAL LT DEBT COV. 1.34 1.95 1.59 1.57 1.58 1.59 1.60 1.61 1.62 1.62 1.63 1.64 1.80
(T '
0'

INDIA - IFFCO FERTILIZER PROJECTPHULPUR PROJECT ALONE
(Rs million)1 2 3 4 5 6 7 8 9 10 11 12 13
1978 1979 1980 1981 1982 1983 1984 1985 1986 1987 1988 1989 1990
____________
BALANCE SHEET as of December 31____________
CURRENT ASSETSOPERATING CASH 2.29 16.00 21.23 27.69 34.67 42.21 50.36 59.18 68.69 79.04 90.17 63.81 4.71ACCTS RECEIVABLE 58.00 58.00 58.00 58.00 58.00 58.00 58.00 58.00 58.00 58.00 58.00 58.00 58.00FIN GOODS INV 42.20 42.20 42.20 42.20 42.20 42.20 42.20 42.20 42.20 42.20 42.20 42.20 42.20
WORK IN PROCESS 5.36 5.36 5.36 5.36 5.36 5.36 5.36 5.36 5.36 5.36 5.36 5.36 5.36RAW MATERIALS INV 24.3 24.8 24.28 24238 _24.38 24.38 24. 38 2 8 24.3 24.38 24.38 24.38TOTAL CUR ASSETS 132.244 45.95 151.17 157.63 164.61 172.15 180.30 189.12 19 3 208.98 220.11 193.75 134.65
ACCUMULATED FUNDSFUNDS FOR DIVIDEND 0.00 0.00 0.95 5.01 9.33 13.91 18.79 23.96 29.46 35.30 41.49 48.08 56.28FUNDS FOR INVESTME 0.00 90.79 191.72 282.93 372.72 460.89 547.23 631.48 713.42 792.70 869.08 980.63 1123.43
SPARE PARTS INV. 55.27 55.27 55.27 55.27 55.27 55.27 55.27 55.27 55.27 55.27 55.27 55.27 55.27
GROSS FIXED ASSETS 1501.05 1501.05 1501.05 1501.05 1501.05 1501.05 1501.05 1501.05 1501.05 1501.05 1501.05 1501.05 1501.05ACCUM DEPRECIATION 40.66 162.76 284.86 406.96 529.06 651.16 773.26 895.36 1017.46 1139.56 1261.66 1383.76 1465.20
NET FIXED ASSETS 1T60. 1338.29 1216.19 1094.09 971.99 -4 727.79 6056 483.59 361.49 239.39 117.29 35.-85
TOTAL ASSETS 1647.90 1630.30 1615.30 1594.93 1573.91 1552.12 1529.37 1505.52 1480.37 1453.73 1425.35 1395.02 1405.49
CURRENT LIABILITIEACCTS PAYABLE 22.40 22.40 22.40 22.40 22.40 22.40 22.40 22.40 22.40 22.40 22.40 22.40 22.40
SHORT TERM DEBT 0.00 0.00 0.00 0.00 0.00 0.00 0.00 0.00 0.00 0.00 0.00 0.00 0.00
CUR SUB LT DEBT 0.00 8.25 8.25 8.25 8.25 8.25 8.25 8.25 8.25 8.25 8.25 0.00 0.00
CUR REG LT DEBT 0 00 66.1,9 70.13 74.44 79.09 84.12 89.55 95. 43101 108.67 116.09 106.77 0 00TOTAL CUR LIAB. 22.40 96.84 100.78 105.09 109.74 7 114.77 120.20 126.08 132.42 139.32 146.74 129.17 22.40
REG LONG TERM DEBT 992.25 926.06 855.93 781.49 702.40 618.28 528.73 433.30 331.53 222.86 106.77 0.00 0.00EQUITY C QUASI-EQUSUB LONG TERM DEBT 82.50 74.25 66.00 57.75 49.50 41.25 33.00 24.75 16.50 8.25 0.00 0.00 0.00SHARE CAPITAL 579.05 579.05 579.05 579.05 579.05 579.05 579.05 579.05 579.05 579.05 579-05 579-05 579-05RETAINED EARNINGS -28.30 -45.90 13J54 71.55 133.22 198.77 268.39 342.35 420.87 504.25 592.79 686.80 804.04
TOTAL EQUITY -6-3.25 607.40 658.59 708.35 761.77 819.07 880.44 946.15 1016.42 1091.55 1171.84 1265.85 1383.09
TOTAL LIABILITIES 1647.90 1630.30 1615.30 1594.93 1573.91 1552.12 1529.38 1505.53 1480.37 1453.74 1425.35 1395.02 1405.49
QUICK RATIO 4.58 1.20 1.20 1.22 1.23 1.24 1.25 1.26 1.28 1.29 1.30 1.27 4.68
CURRENT RATIO 5.90 1.51 1.50 1.50 1.50 1.50 1.50 1.50 1.50. 1.50 1.50 1.50 6.01DEBT/DEBT+EQUITY % / 61 60 57 52 48 43 38 31 25 17 8 0 0DEBT/DEBT+SH CAP % 63 62 60 57 55 52 48 43 36 28 16 0 0TOTAL D/E RATIO % b/ 66 65 61 56 51 46 40 33 26 18 8 0 0
a/ Subordinated debt included in equityb/ Subordinated debt excluded in equity
(D'

ANNEX 6-4Page 5
INDIA - IFFCO FERTILIZER PROJECT
PROJECTED FINANCIAL STATEMENTS FCR THE PROJECT AL(NE
Assumptions
1. The subordinated debt or quasi-equity also carries 10i% annualinterest rate. It is paid in 20 equal semi-annual principal payments startingJanuary, 1980. Interest payments are also made semi-annually at the same timeprincipal payments are due.
2. The operating cash level is determined by a quick ratio of 1.2 or acurrent ratio of 1.5, whichever test indicates a higher amount. Should bothtests indicate an amount less than Rs 4.71 million (Annex 5-3), Rs 4.71 millionis used as the operating cash level. 4ny cash in excess of the operating require-ment for each year is accumulated either in Cash Available for Dividends or in theaccount Cash Available for Investment. The annual dividend payments are limitedto a maximum of 7% of annual net income by the laws regulating cooperatives.Any cumulative surplus cash not needed for operating purposes or not available,for dividend payments is recorded in the account Cash Available for Investment.Since the financial covenants specify that the debt service on the subordinateddebt will be paid only out of current earnings, funds from the account CashAvailable for Investment can not be used for interest or principal payments onthe subordinated debt.
3. The current assets (except cash) and the accounts payable are takenfrom Annex 5-3.
4. Operating costs are taken from Annex 6-2.
5. Debt serTice payments are taken from Annex 6-3.
Industrial Projects DepartmentOctober 1974

ANNEX 6-5
INDIA - IFFCO FERTILIZER PROJECTPROFIT AND CASH BREAKEVEN CHARTS
% CapacityUtilization
100
90
80
1.4 Debt CoverageRatio Breakeven
70
> $ _ ~~~~~~Profit Breakeven
50 ft
40 a\ICash Breakeven
40 N
30
20
10
0 l l l l l l1 2 3 4 5 6 7 8 9 10 11 12 13
1978 1990(4 months) Operating Year
World Bank-9063(R)
Industrial Project Department
October 1974

ANNEX 6.6
INDIA - IFFCO FERTILIZER PROJECT
CAPITAL COSTS AT CONSTANT NID-1978 RUPEES FOR CALCULATION OF RATES OF RETURN(Rs million)
------------ Tearn------3975 196 1977 L978 Total'
A. General Annual Inflation Rate (8 mnths)
1. International Prices, % 11.0 7.5 7.5 7.52. D=estic, % 12.0 8.0 6.0 6.0
B. Coapedactor to Mid-1978Pr-icesl
1. Iutwrmatimnal 1.26 1.16 1.08 1.012. Domsotic 1.25 1.13 1.06 1.01
C. Disbrmseut in Current Rupee/
1. F.rein kExhange 68.25 238.50 272.25 102.00 681.002. Looal Currey:
(a) Duties 16.50 58.50 66.75 25.50 167.25(b) Others 51.00 178.50 20h.00 174.75 608.25
Subtotal 67.50 237.00 270.75 200.25 775.50
D. Diabursunt in Constant Mid-1978 Rupees
1. Foreign Exchange 86.00 276.66 294.03 103.02 759.712. Lcal Currency:
(a) Duties 20.62 66.10 70.76 25.76 183.24(b) Others 63.75 201.70 216.24 176.50 658.19
Subtotal 84.37 267.80 287.00 202.26 841.43
E. Capital Costs at Constant Mid-1978 Ruape.
1. For Financial Rate of Return 170.37 544.46 581.03 305.28 1,60o.1h2. For Econaoic Rate of Return2/2149.75 478.36 510.27 279.52 1,417.90
a/ Compound factor from middle of year to the middle of 1978 assuming dis-bursemnts o¢cur in the middle of the year or alternatively, uniformlyover the year.
b/ Excludes interest during construction. Values are from Annex 5-5.c/ Excludes duties.
Industrial Projects DepartmentOctober 1974

ANNEX 6-7
INDIA - IFFCO FERTILIZER FROJECT
ASSETS REVALUED IN MID-1978 RUPEES(Rs million)
A. Total Project Cost
Years
Project Costs in Current Rupees2/ 1 2 3 L Totala) Foreign Exchange Costs 78.00 261.75 319.50 146.25 805.50b) Local Currency Costs 70.50 249.00 299.25 229.50 848.25
Sub-total 14.0- 510-.75 617.75 375.75 1,653.75
Project Costs in 1978 Rupeesa) Foreign Exchange Cost 98.28 303.63 345.06 1-47.71 894.68b) Local Currency Cost 88.12 281.37 317.20 231.80 918.49
Sub-total 186.40 585.00 662.26 379.51 1,813.17
B. Non-Depreciable Assets
At Acquisition Conversion Factor Cost at Mid-Cost to mid-1978 Rs 1978 Rs
Land and Site DevelopmentŽ/ 27.70 1.21 33.52Spare Parts ia) Duties 9.78 1.08 16.56b) Materials 45J46 1.07 48.64
Sub-total 55.24 59.20
Permanent Working Capital 97.50 1.01 98.48Total 180.44 191.20
s==.,=~ ~ ~ ~~~~~= =====s
C. Depreciable Assets 1,621.97
D. Annual Depreciation ChargesBased on Revalued Assets
135.2(1,621.97/12)
From Annex 6-6 with interest during construction added.
/ Assumes disbursements are 70% in 1975 and 30% in 1976.i/ Assumes spare parts are acquired in 1977. The conversion factor
for duties are based on international price inflation, the conversionfactor for materials is a weighted average, based on 65% foreign exchangeand 35% local currency on a net of duties basis.
Industrial Projects DepartmentOctober 1974

ANNEX 6-8
INDIA - IFFCO FERTILIZER PROJECT
CASH FLOW FOR FINANCIAL RATE OF RETURN
BASE CASE
(In Millions of 1978 Rupees)
(B + C) (B + C - D)(A) (B) (C) (D) Before After
Capital Operating Depreciation Income Tax TaxYear Costs./ Profit Charges Tax Cash Flow Cash Flow
1 (1975) 170.372 54k4.b6 -
3 581.03 --- -4 305.28 (32.27) 40.66 - 8.39 8.395 - (29.54) 122.10 - 92.56 92.566 - 60.85 122.10 16.55 182.95 166.bO7 - 106.04 122.10 70.90 228.14 157.218 - 106.0o 122.10 75.38 228.114 152.769 - 106.04 122.10 80.11 228.14 148.0310 106.0Ak 122.10 85.10 228.114 13.0411 - 106.04 122.10 90.38 228.14 137.7612 _ 106.04 122.10 95.98 228.14 132.1613 - 106.04 122.10 101.91 228.14 126.231k 106.04 122.10 108.20 228.14 119.9415 - 106.04 122.10 1.90 228.14 113.2416 (191.20Y) 146.70 81.44 113.30 228.14 84k.84
a/ In constant 1978 rupees as calculated in Annex 6-6.b/ The non-depreciable assets recovered at end of forecast period, converted to
1978 rupees in Annex 6-7.
Industrial Projects DepartmentOctober 1974

ANNE:Y 6-9
INDIA - IFF0 FRTILIM PROJECT
FINANCIAL RATE OF RETUN AND SISITiVITr ANALYSIS
Intenal Rate of Return,__
Ex-Factory Price of Urea, Rs/Ton 1,305 1.450 1,595
(a) Base Case 8.5 10.3 11.9
(b) Base Case before Taxes 10.7 13.9 16.8
(c) Operating Costs up 10% 7.6 9.5 11.2
(d) Operating Costs down 10% 9.4 11.1 12.7
(e) Slower Capacity Build_Upa/ 7.6 9.3 10.8
(f) 10% Cost Orerrm 7.6 9.2 10.8
(g) One Year Delay in Construction 8.0 9.6 11.0
(h) 10% CoBt Overrun and One YearDelay in Construction 7.1 8.6 10.0
a/ Capacity Utilisationss Year 1 (3 months) - 50%; Year 2 - 50%; Year 3 - 60%;Y Year 4 - 70%; Year 5 - 80%; 90% thereafter
Industrial Projects DepartmentOctober 1974

INDIA - IFFCO FERTILIZER PROJeCTCONSOLIDATEO FINANCIAL STATEMENTS
(Rs million)
1 2 3 4 5 6 7 8 9 10 11 12
1975 1976 1977 1978 1979 1980 1981 1982 1983 1984 1985 1986
In Current Prices In 1978 Prices
INCOME Statement for the Year Ending December 31
%CAPACITY UTIL.KANDLA UNIT 25 25 60 80 90 90 90 90 90
KALOL UNIT 60 80 90 90 90 90 90 90 90 go 90 go
PHULPUR UNIT 0 0 0 60 60 80 90 90 90 90 90 90
GROSS OUTPUT(M.TONKANDLA UNIT(NPK) 94000 94000 225600 300800 338400 338400 338400 338400 338400 338400 338400 338400
KALOL UNIT(UREA) 235200 313600 352800 352800 352800 352800 352800 352800 352800 352800 352800 352800
PHULPUR UNIT(UREA) 0 0 0 98901 297000 396000 445500 445500 445500 445500 445500 445500
TRANSFERS & INV.UREA TO KANDLA 2482 2482 5956 7941 8934 8934 8934 8934 8934 8934 8934 8934
NPK INV BUILD.-UP 28200 0 0 0 0 0 0 0 0 0 0 0
UREA INV BUILD-UP 29400 0 0 45000 0 0 0 0 0 0 0 0UNITS SOLD(TONS)NPK 65800 94000 225600 300800 338400 338400 338400 338400 338400 338400 338400 338400UREA 203318 311118 346844 398760 640866 739866 789366 789366 789366 789366 789366 789366UNIT SALES PRICENPK (AVE.) RS/TON 2330 2560 2740 2905 2905 2905 2905 2905 2905 2905 2905 2905
KALOL UREA RS/TON 1165 1280 1370 1450 1450 1450 1450 1450 1450 1450 1450 1450PHULPUR UREA RS/TO 0 0 0 1450 1450 1450 1450 1450 1450 1450 1450 1450
SALESCRS MILLION)NPK REVENUE 153.31 240.64 618.14 873.82 983.05 983.05 983.05 983.05 983.05 983.05 983.05 983.05UREA REVENUE 236.87 398.23 475.18 578.20 929.26 1072.81 144.58 1144.58 1144.58 1144.58 1144.58 1144.58
OTHER REVENUES 24.514 41.41 27.55 14.98 8.71 9.27 9.55 9.55 9.5 9. 9.55TOTAL REVENUE 1414.72 11 20Y.87 114 T7 31921.02 2065.13 2137.19 2179 2137.19 2137.19 2137.19VARIABLE COSTSFEEDSTOCK COSTS 175.10 206.42 452.52 640.35 764.37 792.86 807.11 807.11 807.11 807.11 807.11 807.11FUEL COSTS 23.01 32.85 42.79 56.11 75.02 83.98 88.146 88. 46 88.46 88.46 88.46 88.46CATALYSTS S CHEM 4.77 6.96 8.44 l.oq 15.1414 17.62 18.71 18.71 18.71 18.71 18.71 18.71
EXTERNAL POWER 5.23 7.07 10.88 13.79 16.oP 16.84 17.22 17.22 17.22 17.22 17.22 17.22
BAGS 31.46 42.62 65.18 89.55 117.59 129.37 135.26 135.26 135.26 135.26 135.26 135.26MKTG g PROMOTION 2.85 4.70 7.16 9.23 12.93 14.23 14.89 14.89 14.89 14.89 14.89 14.89
OTHER VAR COSTS 20 8 22.53 58.26 82.27 93.02 93.27 97.9 93. .R9 939 93.9 93.3
TOTAL VARIABLE - UT6N5.323. 90250 1094.45 8 T1175.04 1175.04 11795.0
ANNUAL FIXED COSTSWAGES S OVERHEAD 17.49 191.4 20.63 25.94 34.28 34.28 34.28 34.28 34.28 34.28 34.28 34.28
MAINTENANCE MATLS 31.45 34.42 37.09 51.04 74.86 714.86 74.P6 74.86 74.86 74.86 74.86 74.86INSURANCE C TAXES 5.84 6.39 6.89 10.03 15.58 15.58 15.58 15.58 15.58 15.58 15.58
DEPRECIATION 68.74 68.74 68.74 109.40 190.814 190.84 190.84 190.84 190.84 190.84 190.84 190.84
OTHER FIXED COSTS 11.66 126 13.75 14.52 14.52 14.52 114.92 114.52 14.52 14.52 14.52 14.52
TOTAL FIEDC70921 0 .93 33 0.0 7 330.07 330.07 330.07 330.07 330.07 330.07
TOTAL PROD. COSTS 398.18 464.60 792.31 1113.31 11424.52 1478.25 150N.11 1505.11 1505.11 1505.11 1505.11 1505.11INVENTORY ADJ.NPK INV CHANGE 54.03 4.95 4.46 3.47 0.00 0.00 0.00 0.00 0.00 0.00 0.00 0.00UREA INV CHANGE 6 1.46 1.32 43.23 0.00 0.00 0.00 0.00 0.00 0.00 0.00 0.00COST OF SALES 344.15 459.65 787.85 1067.64 1424.52 1505.11 1505.11 1505.11 1505.11 1505.11 1505.11INTEREST LT DEBT 59.80 58.40 61.10 95.40 160.96 145.76 133.44 120.69 107.69 914.12 80.41 66.74INTEREST ST DEBT 8.74 6.34 0.00 0.00 0.00 0.00 0 00 0.00 0.00 0.00 0.00 0.00PROFIT BEFORE TAX 2.03 155.89 271.92 T37T 1441.12 149 51138 T7 '4.38 537.95 551 66 565.33INCOME TAXES(55%) 0 10 41 67 4 6 82 8 1 2 3 41 3109NET PROFIT 2 03 1453 4 123012 214?.3 232 142 2 3 5.9762
CUM RET PROF BEC 0.O0 2.03 147.52 269.8B 406.62 557.61 756.11 980.50 1210.62 1446.59 1688.67 1936.92
CUM RET PROF END 2.03 147.52 269.88 006.62 557.61 756.11 980.50 1210.62 1446.59 1688.67 1936.92 2191.32
NET PROFIT % SALES 0 21 11 0 8 10 10 11 11 11 12 12
m1

INDIA - IFFCO FERTILIZER PROJECTCONSOLIDATED FINANCIAL STATEMENTS
(Rs million)1 2 3 4 5 6 7 8 9 10 11 12
1975 1976 1977 1978 1979 1980 1981 1982 1983 1984 1985 1986In Current Prices In 1978 Prices
FUNDS FLOW for the Year Ending December 31
SOURCES OF FUNDSNET PROFIT 2.03 145.48 122.36 136.74 150.99 198.50 224.38 230.12 235.97 242.08 248.25 254.40INT SUB LT DEBT 9.50 9.50 9.10 11.12 15.96 14.52 12.88 11.23 9.58 7.94 6.29 4.65INT REG LT DEBT 50.30 48.90 52.00 84.37 145.00 131.24 120.56 109.46 98.11 86.18 74.12 62.09INTEREST ST DEBT 8.74 6.34 0.00 0.00 0.00 0.00 0.00 0.00 0.00 0.00 0.00 0.00DEPRECIATION 68.74 68.74 68.74 109.40 190.84 190.84 190.84 190.84 190.84 190.84 190.84 190.84SHORT TERM DEBT 72.80 0.00 0.00 0.00 0.00 0.00 0.00 0.00 0.00 0.00 0 00 0.00TOTAL SOURCES 212.11 278.96 252.20 341.63 502.79 535.10 546 541.65 534.50 527.04 519.50 511.98
USES OF FUNDSCHANGE IN ACCT REC 67.10 6.70 5.20 62.70 0.00 0.00 0.00 0.00 0.00 0.00 0.00 0.00CHANGE IN FG INV 73.72 6.41 5.77 46.69 0.00 0.00 0.00 0.00 0.00 0.00 0.00 0.00NET CHANGE OTHERS 30.10 3.00 2.30 64.71 0.00 0.00 0.00 0.00 0.00 0.00 0.00 0.00INT SUB LT DEBT 9.50 9.50 9.10 11.12 15.96 14.52 12.88 11.23 9.58 7.94 6.29 4.65INT REG LT DEBT 50.30 48.90 52.00 84.37 145.00 131.24 120.56 109.46 98.11 86.18 74.12 62.09INTEREST ST DEBT 8.74 6.34 0.00 0.00 0.00 0.00 0.00 0.00 0.00 0.00 0.00 0.00SUB LT DEBT PAY. 0.00 0.00 9.40 9.40 9.40 17.65 17.65 17.65 17.65 17.65 17.65 17.65REG LT DEBT PAY. 7.30 15.25 15.60 16.35 37.95 114.54 118.48 122.79 127.44 132.47 130.60 129.28ST DEBT PAYMENT 20 00 52.80 0.00 0.00 0.00 0.00 0.00 0.00 0°00 0.00 0°00 0 00TOTAL USES 266.76 148.90 99.37 295.34 208.31 277.95 269.57 261 .13 252.78 2 22 21367
NET CASHFLOW -54.65 130.06 152.83 46.29 294.48 257.15 279.09 280.52 281.72 282.80 290.84 298.31WORKING CAP FUNDS 62.30 0.00 0.00 152.75 0.00 0.00 0.00 0.00 0.00 0.00 0.00 0.00
BEGINNING CASH 0.00 7.65 137.71 290.54 489.58 784.06 1041.21 1320.30 1600.83 1882.55 2165.35 2456.19
ENDING CASH 7.65 137.71 290.54 489.58 784.06 1041.21 1320.30 1600.83 1882.55 2165.35 2456.19 2754.49
REG LT DEBT SERV 57.60 64.15 67.60 100.72 182.95 245.78 239.04 232.25 225.55 218.65 204.72 191.37TOTAL LT DEBT SERV 67.10 73.65 86.10 121.24 208.31 277.95 269.57 261.13 252.78 244.24 228.66 213.67CASH:DEBT RATIO 130.57 272.62 252.20 341.63 502.79 535.10 548.66 541.65 534.50 527.04 519.50 511.98
REG DEBT COV RATIO 2.27 4.25 3.73 3.39 2.75 2.18 2.30 2.33 2.37 2.41 2.54 2.68
TOTAL LT DEBT COV. 1.95 3.70 2.93 2.82 2.41 1.93 2.04 2.07 2.11 2.16 2.27 2.40

INDIA - IFFCO FERTILIZER PROJECTCONSOLIDATED FINANCIAL STATEMENTS
(Rs million)1 2 3 4 5 6 7 8 9 10 11 12
1975 1976 1977 1978 1979 1980 1981 1982 1983 1984 1985 1986
____________
BALANCE SHEET as of December 31
CURRENT ASSETSOPERATING CASH 7.65 6.10 6.50 11.61 11.61 11.61 13.26 18.84 24.88 22.64 21.05 11.61ACCTS RECEIVABLE 67.10 73.80 79.00 141.70 141.70 141.70 141.70 141.70 141.70 141.70 141.70 141.70FIN GOODS INV 73.72 80.14 85.91 132.60 132.60 132.60 132.60 132.60 132.60 132.60 132.60 132.60WORK IN PROCESS 3.40 3.70 4.00 9-56 9.56 9.56 9.56 9.56 9.56 9.56 9.56 9.56RAW MATERIALS INV 61.60 67.70 72.4o 101.18 101.18 1011 01.101.8 101.18 101 18 101.18 101 18 101 18TOTAL CUR ASSETS 213.47 231.44 247.81 396.65 396.65 965 398.31 403.89 409!92 907M 406.'10 396.65
ACCUMULATED FUNDSFUNDS FOR DIVIDEND 0.00 10.33 18.89 28.46 39.03 52.93 68.63 84.74 101.26 118.21 135.58 153.39FUNDS FOR INVESTME 0.00 121.28 265.15 449.50 733.41 976.67 1238.41 1497.24 1756.41 2024.50 2299.55 2589.49
SPARE PARTS INV. 26.70 29.40 31.40 88.57 88.57 88.57 88.57 88.57 88.57 88.57 88.57 88.57
GROSS FIXED ASSETS 876.50 876.50 876.50 2377.55 2377.55 2377.55 2377.55 2377.55 2377.55 2377.55 2377.55 2377-55ACCUM DEPRECIATION 68.74 137.48 206.22 315.62 506.46 697.30 888 14 1078.98 1269 82 1460 66 1651.50 1842.34NET FIXED ASSETS 807.76 739.02670.2 2061.93 1871.09 1680.25 148941 1298.57 1107.73 726.05 535.21
TOTAL ASSETS 1047.93 1131.47 1233.53 3025.12 3128.76 3195.07 3283.33 3373.01 3463.89 3555.85 3655.85 3763.32
CURRENT LIABILITIEACCTS PAYABLE 61.60 67.70 72.40 99.20 99.20 99.20 99.20 99.20 99.20 99.20 99.20 99.20SHORT TERM DEBT 52.80 0.00 0.00 0.00 0.00 0.00 0.00 0.00 0.00 0.00 0.00 0.00CUR SUB LT DEBT 0.00 9.40 9.40 9.40 17.65 17.65 17.65 17.65 17.65 17.65 17.65 0.00CUR REG LT DEBT 15.25 15.60 16.35 37.95 114.54 118.48 122.T9 127.44 1'2.47 13o.6o 129.28 0.00TOTAL CUR LIAB. 129.65 92.70 98.15 146.55 231.39 235.33 239. 64 244.29 249.32 247.45 246.13 99.20
REG LONG TERM DEBT 518.95 503.35 487.00 1441.30 1326.76 1208.28 1085.49 958.05 825.58 694.98 565.70 565.70EQUITY & QUASI-EQUSUB LONG TERM DEBT 112.30 102.90 93.50 166.60 148.95 131.30 113.65 96.00 78-35 60.70 43.05 43.05SHARE CAPITAL 285.00 285.00 285.00 864.05 864.05 864.05 864.05 864.05 864.05 864.05 864.05 864.05RETAINED EARNINGS 2,03 147.52 269.88 406.62 557.61 756.11 980.50 1210.62 1446.59 1688.67 1956.92 2191.32TOTAL EQUITY 399.33 535.42 648.38 1437.27 1570.61 1751.461958.20 2170.67 23W.99 2613.42 2844.02 30982
TOTAL LIABILITIES 1047.93 1131.47 1233.53 3025.12 3128.76 3195.07 3283.33 3373.01 3463.89 3555.85 3655.85 3763.32
QUICK RATIO 1.15 1.73 1.75 1.95 1.24 1.21 1.20 1.20 1.20 1.20 1.20 2.88CURRENT RATIO 1.65 2.50 2.52 2.71 1.71 1.60 1.66 1.65 1.64 1.65 1.65 4.00DEBT/DEBT+EQUITY % A/ 57 48 43 50 46 41 36 31 26 21 17 15DEBT/DEBT+SH CAP % 65 64 63 63 61 58 56 53 49 45 40 40TOTAL D/E RATIO q. b/ 69 58 51 56 51 45 39 34 28 23 18 17
a/ Subordinated debt included in equitybi Subordinated debt excluded in equity m m
o-

ANNEX 7-1
INDIA - IFFCO FERTILIZER PROJECT
ANNUAL ECCCNMIC PRODTCTICN COSTSAND FOREIGN EXCHANGE SAVINGS!/
Economic Costs in 1978 Rupees-b
Rs/tons of Urea Rs Million/yearI. Economic Production Costs
A. Foreign Inputs
(a) Fuel Oil at US$55 (Rs 412)/ton CIFa/ 211.61 94.3(b) Maintenance Materials (55% foreign)!/ 44.07 19.6(c) Chemicals (60% foreign) 13.20 5.9(d) External Power (50% foreign) 3.84 1.7
Subtotal 272.72 121.5
B. Local Inputs
(a) Local Handling of Fuel Oil at US$10(Rs 75)/ton 38.48 17.1
(b) Coal 90.50 40.3(c) Power and Chemicals (excluding 5% taxes) 12.01 5.3(d) Local Components of Maintenance Materials!/ 18.43 8.2(e) Wages and Overhead 28.06 12.5(f) Bagging Costs 119.00 53.0(g) Insurance & Taxes (excluding 5% for taxes) 17.70 7.9(h) Marketing and Promotion 13.20 5.9(i) Less: Sales of Sulphur By-Product (5.68) (2.5)
Subtotal 331.70 147.7
II. CIF Value of Annual Production
A. Value of Production at Average CIF US$170(Rs 1,275)/ton of Urea 568.0
III. Gross Average Annual Foreign Exchange Savingsin 1976 Prices Equivalent to US$59.5 Millionor US$134 per ton of Urea 446.5
a/ Based on 90% capacity utilization.b/ Taken from Annex 6-2 and Annex 7-2 for fuel oil and urea prices.c/ The economic cost of US$65/ton of fuel oil is divided into a CIF component
of US$55/ton and local handling of US$10/ton.d/ This is the same proportion of foreign exchange in the spare parts of the
capital cost estimate.e/ Excludes duties on maintenance materials equivalent to 40% of the foreign
component or about Rs 17.63/ton of urea.
Industrial Projects DepartmentOctober 1974

ANNEX 7-2
INDIA - IFFCO FERTILIZER PROJECT
ESTIMATED PRICES FOR ECONOMIC ANALYSIS
A. Urea Prices
Urea produced by the project will substitute for fertilizer thatwould otherwise be imported. The economic benefits to the country are there-fore primarily measured in terms of the estimated world market price for ureawhen the project commences commercial operation in 1978. The most recent Bankforecast!! for the price of urea in that year is US$145 per ton, bagged, fobMiddle East in 1978 dollars. Since supply and demand are thought to be fairlywell balanced in that year, this 1978 price is assumed to be the long-termbasis for economic pricing. The economic price of urea, at factory site, isderived as follows:
1978 Cost|P':r Ton of Urea in Current Dollars
FOB Price, Bagged 145Ocean Freight 25
CIF Price 170Local Port Handling 5Inland Freight to Factory 10
Economic Price, ex-factory 185
B. Heavy Fuel Oil
The economic price for heavy fuel oil is derived from crude oilprices. The Bank forecasts that the fob (OPEC countries) price for crude oilwill range between US$9.90 and US$11.90 per barrel, or an average of US$10.90in 1978. The economic price of fuel oil is estimated to be 65% of the CIFcrude oil price on a weight basis (i.e. 7.3 barrels of crude oil per ton and6.7 barrels of fuel oil per ton). The economic price, at factory site, isderived as follows:
1978 Cost in Current US$
Crude Oil, FOB 10.90 per barrelOcean Freight, Crude Oil 0.75 per barrelLanded Cost, Crude Oil (11.65 x 7.3) or 85 per tonLanded Cost Equivalent of Heavy Fuel Oil (85 x 0.65) 55 per tonLocal Transport Cost to Project 10 per ton of fuel oilEconomic Price of Heavy Fuel Oil 65 per ton
C. Other Production Inputs
The economic prices of all other production inputs are assumed toremain constant during the period 1978-1990 in terms of constant 1978 prices.The 1978 economic prices of these inputs are assumed to be identical to thefinancial prices as of mid-1978 as shown in Annex 6-2.
1/ Price Forecasts for Major Primary Commodities, Bank report no. 467, June 19, 1974.
Industrial Projects DepartmentOctober 1974

AJNEX 7-3Page 1
INDIA - IFFCO FIRTILIZUCR PROJECT
WQKUWC COST AND BNEFIT STREAKS I CONSTAIT1978 RUPE ARD US D0LAR8a
Base Case(Rs Million)
Economic Costs Bpuefita
Project Capacity Capita; Fuel Oi Productiqn Value of RecoveresYear Utilization Costa_ Co,t:V costsY Production_/_ As9t;
1 (1975) - 119.75
2 _ 478.36 - - _ _
3 - 510.27 - _ - _
4 60 279.52 24.73 40.39 137.22 _(4 months)
5 60 - 74.27 121.28 12.09 _
6 80 - 99.03 145.64 549.45 -
7 90 - 111.41 157.82 618.13 -
8 90 - 3Ji1.k1 157.82 618.13 -
9 90 - 111.41 157.82 618.13 -
10 90 - 111.41 157.82 618.13 -
11 90 - 111.41 157.82 618.13 -
12 90 - 111.41 157.82 618.13 -
13 90 - 111.41 157.82 618.13 -
134 90 - 111.41 157.82 618.13 -
15 90 - 111.41 157.82 618.13 -
16 90 111.41 157.82 618.13 180.614
Total 1,1417.90

ANNIEX 7-3Page 2
a/ At the exchange rate Ru 7.50 - US$1.00.b/ From Amex 6-6.:a At u$65 (Rs 488)/ton composed of CIF US$55 and local handlng of
11$10 per ton.FroK Annex 7-1 with variable cost itme (as identified in Amnex 6-2)adjusted to reflect different capacity utilizations. The economiccosts are sumearied as:
Variable costs, excluding feel oil at Re 250.09 per tonof vrea and net of aulphur sales a Rs 2h6.07/ton of urea
Fimed costs per year - Rs 48.2 milion
B/ Based on an economic price of US$185 per ton of urea composed of anFOB price ef US$145/ton, plus US$25/ton for ocean freight, US$5/ton forport charges and US$10/ton for local handling and inland freight.
f/ Th6se are the non-depreciable assets in the depreciation schedule(Armex 6-1) adjusted to 1978 economic prices on the assumtion thatcoats for land and site develoiunt are disbursed 70% in 1975 and 30%in 1976; and spar parts, net of duties, are 65% foreign and 35% local,al acquired in 1977. The derivation iB as follows:
Rs MillionAt Acquisition Conversion Factor Cost at 1978
cost to 1978 Ruees RApees
1. Land and Site Developant 27.70 1.21 33.522. Spare Parts 55.24 - -
Less: Duties (9.78) - -
Econodic Cost 45.46 1.07 48.643. Permanent Workiag Capital 97.50 1.01 98.48
TO!AJL 170.66 18o.64
Indu.trial Projects DepartmentOctober 1974

ANN 7-I4
INDIA - IFFCO FERTIIZER PROJET
ECQICCIC RATE OF RETURN AND S1USITIVITY ANALYSIS
3CCKCOIC RATE O REURN %
Econmic Price of Urea, U$/ton 165 185 205
Economic Costs
(a) Base Case 12.6 16.2 19.b
(b) Production Cost up 10%-'/ 11.0 1-4.8 18.2
(c) Prodaction Cost down 10%/ 214.2 17.6 20.6
(d) Slower Capacity Build-upl 10.8 14.2 17.0
(a) One Year Delay in Corstruction 11.6 15.0 17.8
(f) 10% Coat Overr0 11.2 14.6 17.6
(g) One Year Delay in Constructionand 10% Cost Overrun 10. ~ 13.b 16.2
a/ Equivalent to 24.2% change in fuel oil cost if other costs remain thesame.
b/ Capacity Utilization: Year 1 (1978, 4 months) - 50%; Year 2 - 50%;Year 3 - 60%; Year 4 - 70%; Year 5 - 80%; 90% onwards.
Industrial Projects DepartmentOctober 1974

I)-,-^ I
*2~~~~-' - ~~~~~INDIA<., I MAJOR FERTILIZER PLANTS AND REFINERIES
AFGHANISTAN S9-_ -AFGHANISTAN '1 ePRESENT AND PROPOSED
'f " ,,o'rtre $3
JAMMUaondlAS5HM/R FEJ FRT ILIZER PLANTS REFINERIESI F~~~~~~~~~~~~~~~~~~~~~~~~~~~~~~
p U ~~~~~~~~~~~~~~: A CoPlel...dz >> _, i Q , U~~~~~~~~~~~~~~~~~~~~~~~~~~~~~~~~~Inder Consiroc, ion
PRADFESH C I Ni.. T.-
PAKISTAN AI>CA Slo.t, -nd Uoton T.nr.Iory Boundon.,
Chotmndago- nlnohonol Bounder,.,
! ~~FOi' $P;( / ' '¾'/ HAA'YA/VA r: 1 ' ~ C H I N A ON.
/ Delhi EW DELHI V (Tibet)/}TTAR O EA ABUANLgI
4- N
16) KHE7 RI 'AMATHLRA NEPAL// C RHENI ERA NESH BHUTAN A"' /9
an, R d EJA STF H A N 0O Lucknow . ' . A * NANI
Udole /EH A R> f \tB ANGLADE SH *
F( E S, -5T ' I.Vo -~ fGUJAT CI JRGA R8ENE SP tiAZ
ROURKE BURMA-3~~~~~~~~2r
:AHAA5OR iAAANHR
E BOD r7ABIJRL.4AHI SHELI a rr
RAMAGUNCAM/0/
CALHEA@RoMANDE0L
C //Et YOR/5p /Arabian PEE DES5H-
ZUARI ~ AR/ATAC
IimysORE)
MANGALOREt l ore 0 * tModro'~DMAORAS
* NEY(ELI
FAC¢nT*fi C lL IlPS S O IDo 200 300 400 b^ MILES
rIE/ALApg ' ° 100 200 300 400 50, 0 790 P K[LOM4ETERS
Thoardrum" sPic
,SRI LANKA
Orw- r,, - -d
_ ' . 4MrsShar - E : , -- P« xa~~~~~~~~~~~~~~~~~~~~~~~~~~~~~~~~~~~~~~~~~9i

I

IN DIA
r' >. IFFCO FERTILIZER PLANT PROJECT
-- 1aei~o'eoe ore -) .,IFFCO MARKET AREAS
S jAnproxinnotece lils me ! t-t > Ar-e supplied frot Phuipur
JAMMU & KASHMIR j} Area supplied from Kalol
. Proposed pilnt
--- ---Bod gouge railwys
Other gauga railosy
Je HIMACHAL As it NationaI capitl
Snb > PRADESH' o Cities
P A K I S T A N - D m =s tril b-d Unhzn Ter-ritory beundger
.- St...--i,terndtiorl eaoendies
N1 EP ANDCIA , /NH EPL "KKJ'V BHUTAN~
T %RAJ T
It B A NGLAD ESH~
AiXY. r A ¼~~~~~~~~~~~,J O~ B URMA
Arablan Sea I S A Ž
BBng.y Bay of Bengal
1 a
Y' 0 100 200 300 400 3oo
GuM ~ ~ ~ ~ ~ ~ ~ ~ ~ ~ ~ ~ ~ ~ ~~~~~~~MP
SRI LANKA A 100 200 300 000 .50 600 700 00O KI~~~~~~~~~~~~~~~~~~~~~~OLOMETERS -
F :~~~~~~~~~~~~~~~~~~~ 00" S oset aeO,raai t aousn-aoiia a t oe


To Shahoani40mnfs m ile
/f!HANCSTA!, , C H I N A) ~~~~' , (Tibet)
tPAKISTAN "
IRAN"J ii.
Phulpur /
BROAD GAUGE TO JaUJnPUr I N D I AURMA38 MI'les ~ ~ ~ ~ ~ ~ ~ OLD~~
Parezbadl Mahka SIE FLPOPSE PLHRZ POJC
TO A l h a habod BAD PAd
< Saidupur / tFecondpciassroad
16 mlwaes 23~~~~~~~~~~~~~~~~~~~~~~~~~~~~~~~~~~~~~~~~~~~~~~~~~~~~~~~~~~~~~~~~~~~~~~~~~~~~~~~~~~~~~~~~~jTh oundaris hown on this map do notakmu a imply ~~~~~~~~~~~~~~~~~~~~~~endor ement or a ceptan e by the
WrdBank and its affiliate&
Miranpatti
.1s Khudaipur q\aniuChaturbhujpur
i3 ~~~~~~~~~~~alalpur Chandanpurat INDIA
IFFCO FERTILIZER PLANT PROJECTPar ezabod MhkrSITE OF PROPOSED PULPH-UR PROJECT
Selected site
.. / 1 KLOPaved roadsSaidupur Second class roadsRailwaYs
Inayatpa2tti (
0 2 4 6 3:~~~~~~~~~~~~~~~~-- -
o 2 4 6~~~~~~~~~~~~~~c MILES -o 2 4 8 10p
KILOMETERS OD.