f. s. razavi, y. rohanizadegan, m. hajialamdari, m ... … · 2 (purity 99.9999%)by employing the...
TRANSCRIPT

arX
iv:1
407.
5695
v1 [
cond
-mat
.sup
r-co
n] 2
1 Ju
l 201
4
Quasiparticle-Self-Energy and its Effect on the Superconducting
Order Parameter of the Pyrochlore Superconductor Cd2Re2O7
F. S. Razavi, Y. Rohanizadegan, M. Hajialamdari, M. Reedyk, and B. Mitrovic
Department of Physics, Brock University,
St. Catharines, Ontario, L2S 3A1, Canada
R. K. Kremer
Max-Planck-Institut fur Festkorperforschung,
Heisenbergstraβe 1, 70569 Stuttgart, Germany
(Dated: July 23, 2018)
Abstract
The magnitude and the temperature dependence of the superconducting order parameter ∆(T )
of single-crystals of Cd2Re2O7 (Tc = 1.02 K) was measured using point contact spectroscopy. In
order to fit the conductance spectra and to extract the order parameter at different temperatures we
generalized the Blonder-Tinkham-Klapwijk theory by including the self-energy of the quasiparticles
into the Bogoliubov equations. This modification enabled excellent fits of the conductance spectra.
∆(T ) increases steeply below the superconducting transition temperature of 1.02 K and levels off
below ∼0.8 K depending on measurement directions where its value varried from 0.22(1) meV
to 0.26(1) meV. Our results indicate the presence of a strong electron-phonon interaction and
an enhanced quasiparticle damping and may be related to a possible phase transition within the
superconducting region at ∼0.8 K.
PACS numbers: 74.70.-b, 74.70.Tx, 74.25.-q, 74.20.Pq
1

A large number of transition metal (TM) oxides crystallize with the α-pyrochlore struc-
ture with the general composition A2B2O7, where A is a larger and B is a smaller TM cation.
Amongst the α-pyrochlores, Cd2Re2O7 is the only one which shows superconductivity at ∼1
K1,2. At room temperature, Cd2Re2O7 exhibits a cubic structure (space group Fd3m). At
TS1 ∼ 200 K, Cd2Re2O7 undergoes a metal-to-metal second order structural phase transition
(PT) to a non-centrosymmetric tetragonal structure (space group I 4m2) followed by a first
order PT at TS2 ∼ 120 K to another tetragonal structure (space group I4122)3–5. These
two PTs have a profound effect on the electronic and the magnetic properties of Cd2Re2O7.
The electrical resistivity and the magnetic susceptibility drop sharply below TS13,4. Heat
capacity measurements below TS2 showed an exceptionally large electronic Sommerfeld co-
efficient of γ =15 mJ/K2 mol Re1,6. Band structure calculations for the room-temperature
cubic structure revealed that the electronic density of states (DOS) at the Fermi level arises
mainly from bands with Re-5d character with electron or hole pockets at various points
of the Brillouin zone7. However, the band structure of Cd2Re2O7 in the low-temperature
structure (T < TS2) indicated localized Cd 4d and itinerant Re-5d electrons and a quasi two
dimensional Fermi surface8. The results of the Re nuclear quadrupole resonance (NQR) and
the Cd nuclear magnetic resonance (NMR) at low temperature, and in the superconducting
state, revealed no magnetic or charge ordering9. Just below Tc, the187Re spin lattice relax-
ation rate exhibits a pronounced coherence peak with an increase of the relaxation rate by a
factor of two and subsequently, below ∼0.8 K, an exponential decrease consistent with weak-
coupling BCS theory and an isotropic gap9. Vyaselev et al. calculated the Wilson ratio and
obtained a value of 0.34 indicating strong electron-phonon coupling incompatible with weak-
coupling theory9. The far-infrared spectroscopy measurements on Cd2Re2O7 crystals in the
superconducting state at ∼0.5 K revealed two strong absorption peaks near 9.6 and 19.3
cm−1 which completely vanish above Tc possibly indicating strong electron-phonon coupling
in the superconducting state10.
In this article, we report point contact spectroscopy measurements on single crystals of
Cd2Re2O7 carried out in order to better understand the superconducting state of Cd2Re2O7.
Our measurements provide the temperature dependence of the superconducting order pa-
rameter which differs markedly from the BCS temperature dependence of the energy gap.
For T → 0 K the order parameter approaches a value between 0.22(1)to 0.26(1) meV, i.e
2∆(0)/kBTc > 5.0(1) indicating that Cd2Re2O7 is a strong-coupling superconductor.
2
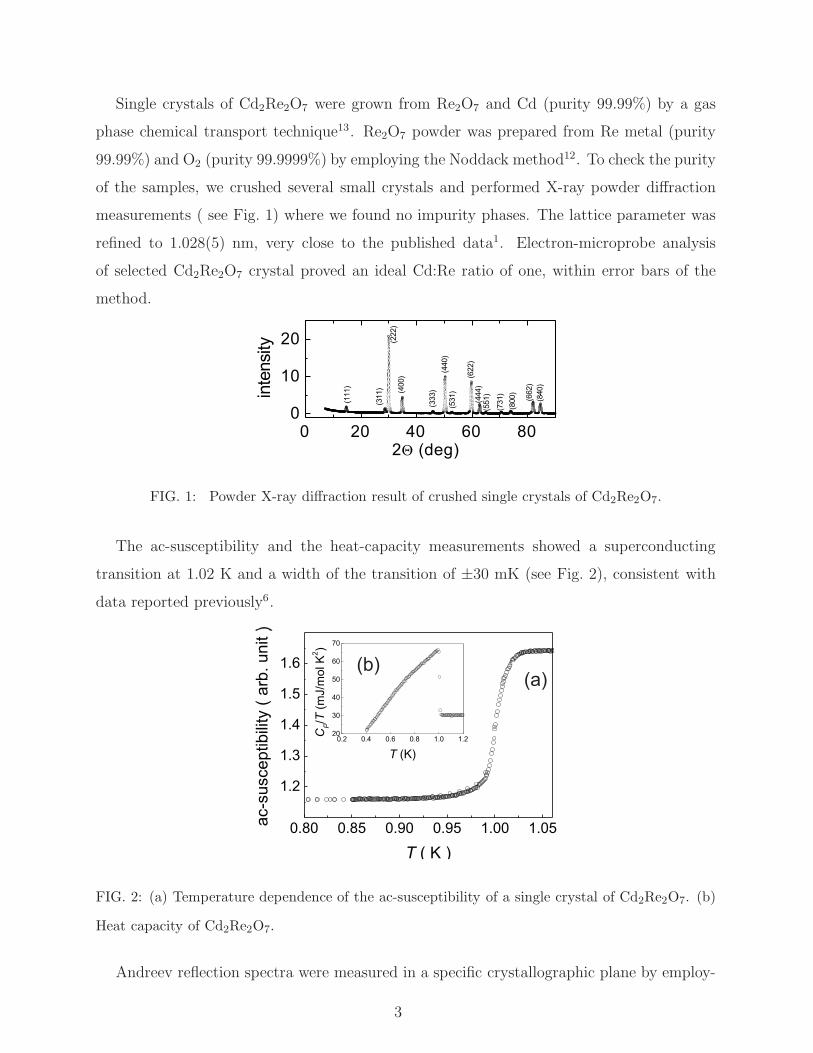
Single crystals of Cd2Re2O7 were grown from Re2O7 and Cd (purity 99.99%) by a gas
phase chemical transport technique13. Re2O7 powder was prepared from Re metal (purity
99.99%) and O2 (purity 99.9999%) by employing the Noddack method12. To check the purity
of the samples, we crushed several small crystals and performed X-ray powder diffraction
measurements ( see Fig. 1) where we found no impurity phases. The lattice parameter was
refined to 1.028(5) nm, very close to the published data1. Electron-microprobe analysis
of selected Cd2Re2O7 crystal proved an ideal Cd:Re ratio of one, within error bars of the
method.
FIG. 1: Powder X-ray diffraction result of crushed single crystals of Cd2Re2O7.
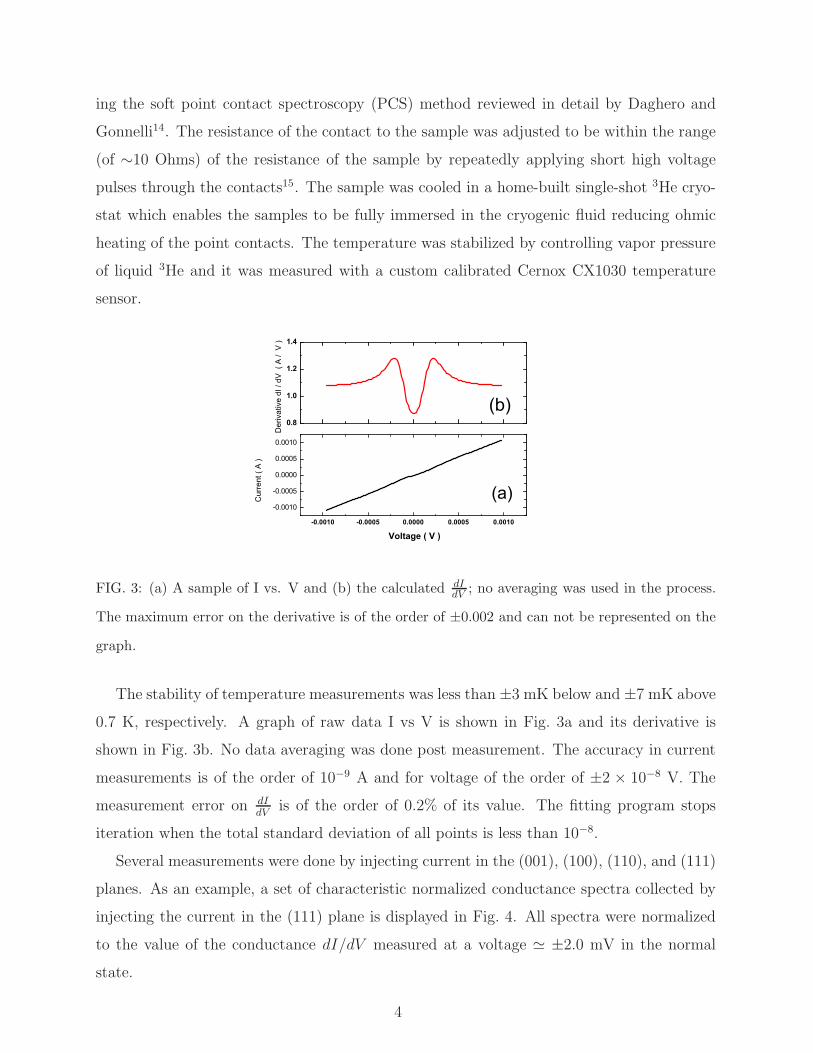
The ac-susceptibility and the heat-capacity measurements showed a superconducting
transition at 1.02 K and a width of the transition of ±30 mK (see Fig. 2), consistent with
data reported previously6.
FIG. 2: (a) Temperature dependence of the ac-susceptibility of a single crystal of Cd2Re2O7. (b)
Heat capacity of Cd2Re2O7.
Andreev reflection spectra were measured in a specific crystallographic plane by employ-
3
ing the soft point contact spectroscopy (PCS) method reviewed in detail by Daghero and
Gonnelli14. The resistance of the contact to the sample was adjusted to be within the range
(of ∼10 Ohms) of the resistance of the sample by repeatedly applying short high voltage
pulses through the contacts15. The sample was cooled in a home-built single-shot 3He cryo-
stat which enables the samples to be fully immersed in the cryogenic fluid reducing ohmic
heating of the point contacts. The temperature was stabilized by controlling vapor pressure
of liquid 3He and it was measured with a custom calibrated Cernox CX1030 temperature
sensor.
-0.0010 -0.0005 0.0000 0.0005 0.0010
-0.0010
-0.0005
0.0000
0.0005
0.0010
0.8
1.0
1.2
1.4
(b)
Der
ivat
ive
dI /
dV (
A /
V )
(a)
Voltage ( V )
Cur
rent
( A
)
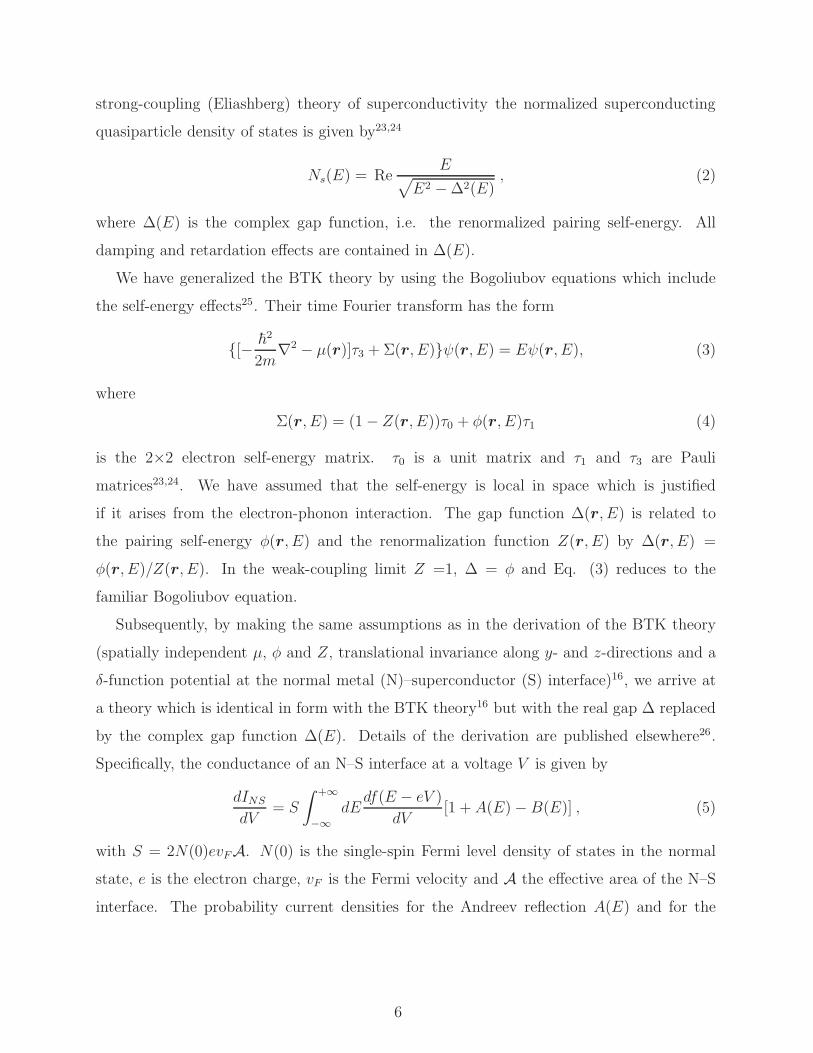
FIG. 3: (a) A sample of I vs. V and (b) the calculated dI
dV; no averaging was used in the process.
The maximum error on the derivative is of the order of ±0.002 and can not be represented on the
graph.
The stability of temperature measurements was less than ±3 mK below and ±7 mK above
0.7 K, respectively. A graph of raw data I vs V is shown in Fig. 3a and its derivative is
shown in Fig. 3b. No data averaging was done post measurement. The accuracy in current
measurements is of the order of 10−9 A and for voltage of the order of ±2 × 10⁻⁸ V. The
measurement error on dI
dVis of the order of 0.2% of its value. The fitting program stops
iteration when the total standard deviation of all points is less than 10−8.
Several measurements were done by injecting current in the (001), (100), (110), and (111)
planes. As an example, a set of characteristic normalized conductance spectra collected by
injecting the current in the (111) plane is displayed in Fig. 4. All spectra were normalized
to the value of the conductance dI/dV measured at a voltage ≃ ±2.0 mV in the normal
state.
4

-0.001 0.000 0.001
0.8
1.0
1.2
1.4
1.6
1.8
2.0
No
rmal
ized
Co
nd
uct
ance
Voltage (mV)
0.580(1) K 0.646(2) K 0.744(1) K 0.831(4) K 0.874(4) K
0.945(6) K 0.976(1) K 1.015(2) K Temperature
0.360(2) K 0.420(5) K 0.571(2) K
FIG. 4: Voltage dependence of the normalized conductance () for Cd2Re2O7. For clarity the
normalized conductance is shifted by 0.1 relative to the previous temperature indicated on the
right. The solid black lines represent the fits obtained using our generalized BTK theory with a
complex gap.
An attempt to fit the normalized conductance spectra of Cd2Re2O7 using the Blonder–
Tinkham–Klapwijk (BTK) theory16 did not provide satisfactory results, especially for the
spectra at temperatures close to Tc where finite lifetime effects can play an important role17.
The BTK theory is based on the Bogoliubov equations for the two-component wave function
ψ(r, t) =
u(r, t)
v(r, t)
(1)
for particles and holes, respectively, but does not take into consideration any self-energy
effects, i.e. finite quasiparticle lifetimes. Previous attempts to extend the BTK theory to in-
clude lifetime effects were purely phenomenological and assumed that the time-dependence
of the particle and hole amplitudes u and v in the Bogoliubov equations are of the form
exp[−i(E − iΓ)t/~], where E is the quasiparticle energy, and Γ is its scattering rate18–20.
The resulting theory has a form identical to the BTK theory but with the normalized
superconducting quasiparticle density of states given by the so-called Dynes equation21
Ns(E) = Re (E − iΓ)/√
(E − iΓ)2 −∆2, where ∆ is the superconducting energy gap.
However, it was pointed out that the above equation cannot be justified microscopically,
at least not for conventional strong-coupling superconductors such as Pb or Nb22. In the
5
strong-coupling (Eliashberg) theory of superconductivity the normalized superconducting
quasiparticle density of states is given by23,24
Ns(E) = ReE
√
E2 −∆2(E), (2)
where ∆(E) is the complex gap function, i.e. the renormalized pairing self-energy. All
damping and retardation effects are contained in ∆(E).
We have generalized the BTK theory by using the Bogoliubov equations which include
the self-energy effects25. Their time Fourier transform has the form
[− ~2
2m∇2 − µ(r)]τ3 + Σ(r, E)ψ(r, E) = Eψ(r, E), (3)
where
Σ(r, E) = (1− Z(r, E))τ0 + φ(r, E)τ1 (4)
is the 2×2 electron self-energy matrix. τ0 is a unit matrix and τ1 and τ3 are Pauli
matrices23,24. We have assumed that the self-energy is local in space which is justified
if it arises from the electron-phonon interaction. The gap function ∆(r, E) is related to
the pairing self-energy φ(r, E) and the renormalization function Z(r, E) by ∆(r, E) =
φ(r, E)/Z(r, E). In the weak-coupling limit Z =1, ∆ = φ and Eq. (3) reduces to the
familiar Bogoliubov equation.
Subsequently, by making the same assumptions as in the derivation of the BTK theory
(spatially independent µ, φ and Z, translational invariance along y- and z-directions and a
δ-function potential at the normal metal (N)–superconductor (S) interface)16, we arrive at
a theory which is identical in form with the BTK theory16 but with the real gap ∆ replaced
by the complex gap function ∆(E). Details of the derivation are published elsewhere26.
Specifically, the conductance of an N–S interface at a voltage V is given by
dINS
dV= S
∫ +∞
−∞
dEdf(E − eV )
dV[1 + A(E)− B(E)] , (5)
with S = 2N(0)evFA. N(0) is the single-spin Fermi level density of states in the normal
state, e is the electron charge, vF is the Fermi velocity and A the effective area of the N–S
interface. The probability current densities for the Andreev reflection A(E) and for the
6
normal reflection B(E) are given by (in units of the Fermi velocity vF )
A(E) =|u|2|v|2|γ|2 (6)
B(E) =[|u|4 + |v|4 − 2Re (u2v2)]z2(z2 + 1)
|γ|2 (7)
γ = u2 + (u2 − v2)z2 (8)
u, v =1√2
√
1±√
E2 −∆2(E)/E . (9)
The parameter z in Eqs.(7-8) is a dimensionless barrier strength parameter related to the
strength of the δ-function potential V (x) = Hδ(x) at the interface by z = H/(~vF ).
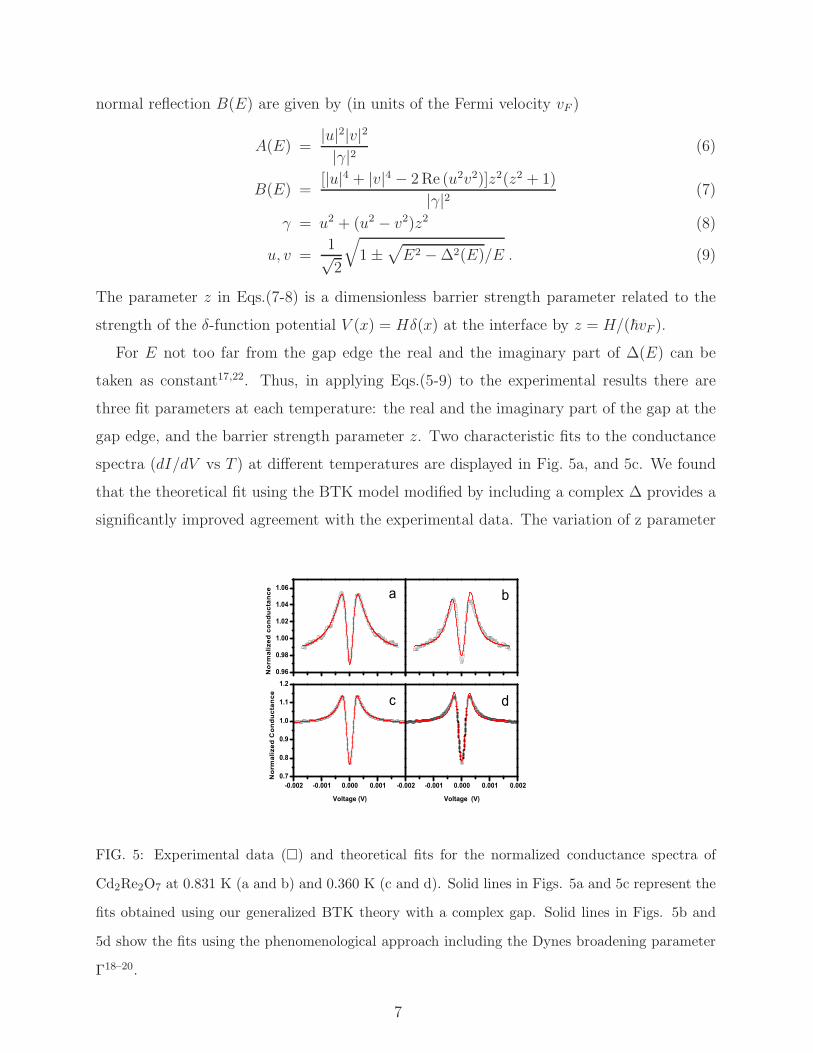
For E not too far from the gap edge the real and the imaginary part of ∆(E) can be
taken as constant17,22. Thus, in applying Eqs.(5-9) to the experimental results there are
three fit parameters at each temperature: the real and the imaginary part of the gap at the
gap edge, and the barrier strength parameter z. Two characteristic fits to the conductance
spectra (dI/dV vs T ) at different temperatures are displayed in Fig. 5a, and 5c. We found
that the theoretical fit using the BTK model modified by including a complex ∆ provides a
significantly improved agreement with the experimental data. The variation of z parameter
0.96
0.98
1.00
1.02
1.04
1.06
a
Nor
mal
ized
con
duct
ance
b
d
-0.002 -0.001 0.000 0.0010.7
0.8
0.9
1.0
1.1
1.2
c
Nor
mal
ized
Con
duct
ance
Voltage (V)
-0.002 -0.001 0.000 0.001 0.002
Voltage (V)
FIG. 5: Experimental data () and theoretical fits for the normalized conductance spectra of
Cd2Re2O7 at 0.831 K (a and b) and 0.360 K (c and d). Solid lines in Figs. 5a and 5c represent the
fits obtained using our generalized BTK theory with a complex gap. Solid lines in Figs. 5b and
5d show the fits using the phenomenological approach including the Dynes broadening parameter
Γ18–20.
7
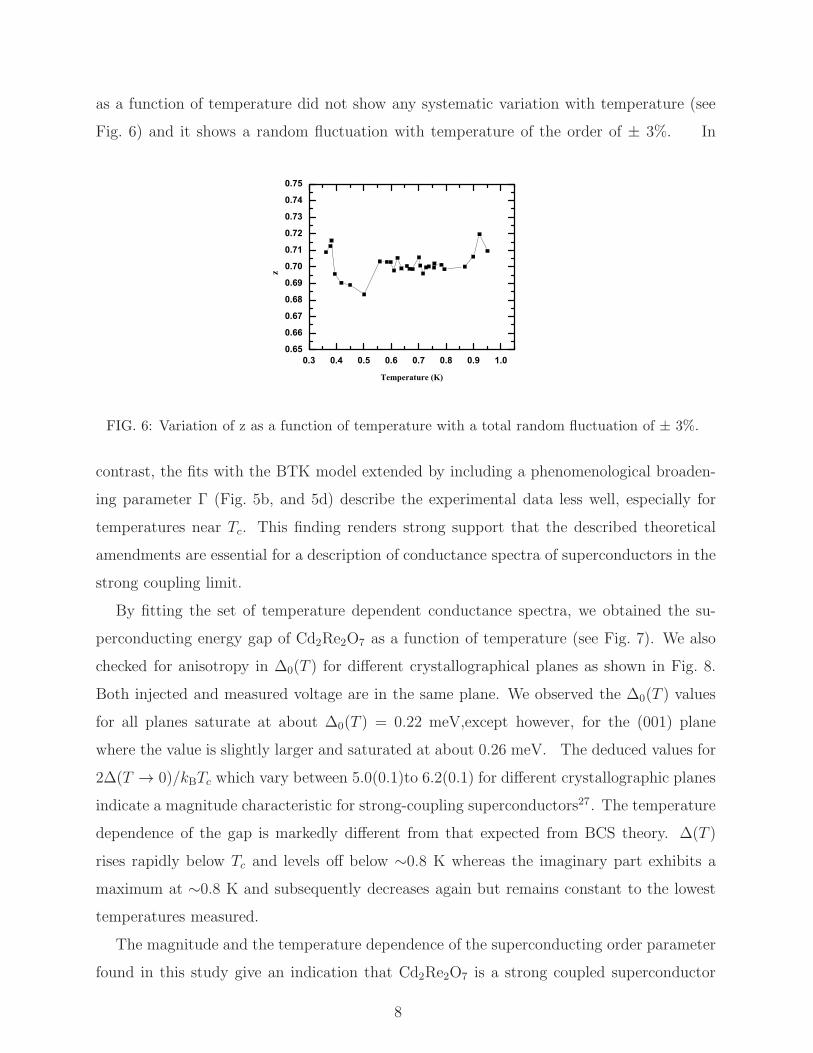
as a function of temperature did not show any systematic variation with temperature (see
Fig. 6) and it shows a random fluctuation with temperature of the order of ± 3%. In
0.3 0.4 0.5 0.6 0.7 0.8 0.9 1.00.65
0.66
0.67
0.68
0.69
0.70
0.71
0.72
0.73
0.74
0.75
z
Temperature (K)
FIG. 6: Variation of z as a function of temperature with a total random fluctuation of ± 3%.
contrast, the fits with the BTK model extended by including a phenomenological broaden-
ing parameter Γ (Fig. 5b, and 5d) describe the experimental data less well, especially for
temperatures near Tc. This finding renders strong support that the described theoretical
amendments are essential for a description of conductance spectra of superconductors in the
strong coupling limit.
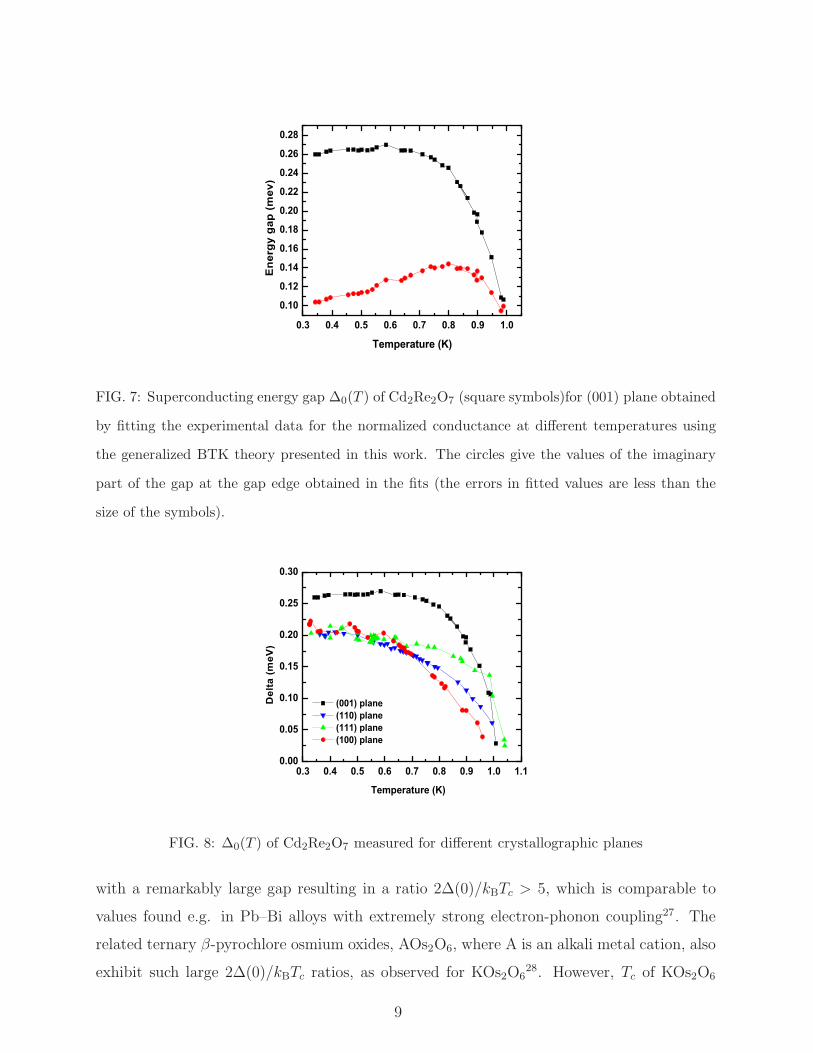
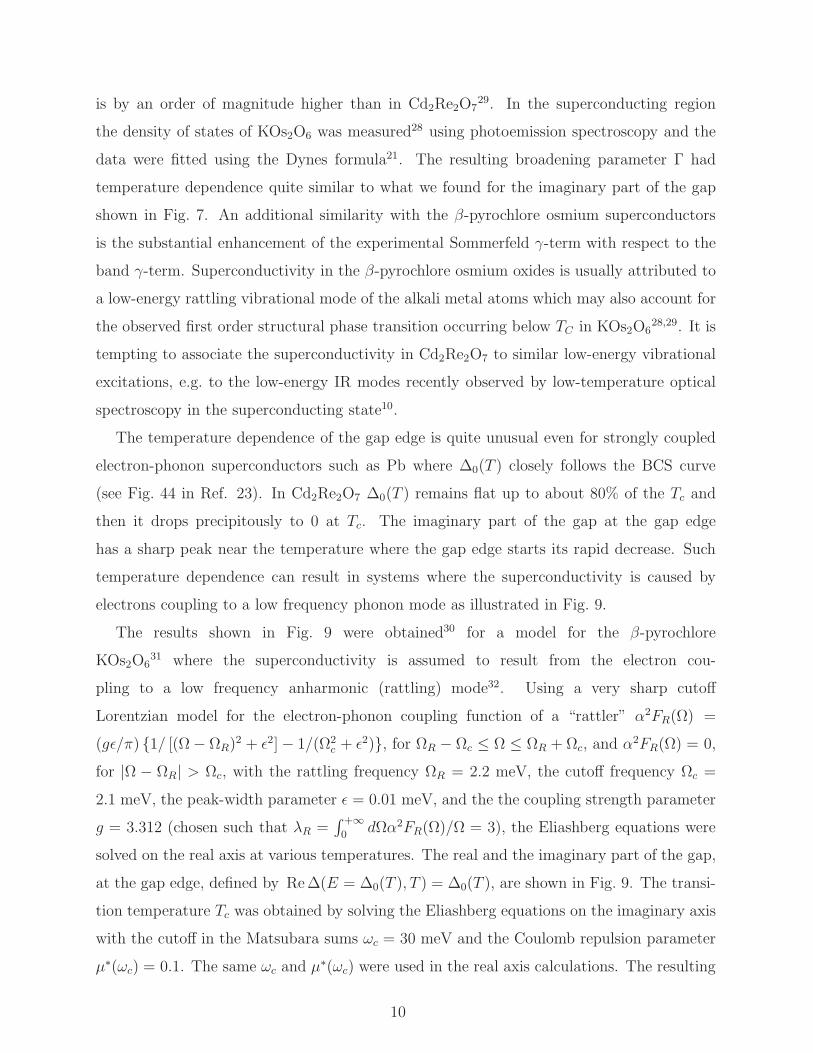
By fitting the set of temperature dependent conductance spectra, we obtained the su-
perconducting energy gap of Cd2Re2O7 as a function of temperature (see Fig. 7). We also
checked for anisotropy in ∆0(T ) for different crystallographical planes as shown in Fig. 8.
Both injected and measured voltage are in the same plane. We observed the ∆0(T ) values
for all planes saturate at about ∆0(T ) = 0.22 meV,except however, for the (001) plane
where the value is slightly larger and saturated at about 0.26 meV. The deduced values for
2∆(T → 0)/kBTc which vary between 5.0(0.1)to 6.2(0.1) for different crystallographic planes
indicate a magnitude characteristic for strong-coupling superconductors27. The temperature
dependence of the gap is markedly different from that expected from BCS theory. ∆(T )
rises rapidly below Tc and levels off below ∼0.8 K whereas the imaginary part exhibits a
maximum at ∼0.8 K and subsequently decreases again but remains constant to the lowest
temperatures measured.
The magnitude and the temperature dependence of the superconducting order parameter
found in this study give an indication that Cd2Re2O7 is a strong coupled superconductor
8
0.3 0.4 0.5 0.6 0.7 0.8 0.9 1.0
0.10
0.12
0.14
0.16
0.18
0.20
0.22
0.24
0.26
0.28
Ene
rgy
gap
(mev
)
Temperature (K)
FIG. 7: Superconducting energy gap ∆0(T ) of Cd2Re2O7 (square symbols)for (001) plane obtained
by fitting the experimental data for the normalized conductance at different temperatures using
the generalized BTK theory presented in this work. The circles give the values of the imaginary
part of the gap at the gap edge obtained in the fits (the errors in fitted values are less than the
size of the symbols).
0.3 0.4 0.5 0.6 0.7 0.8 0.9 1.0 1.10.00
0.05
0.10
0.15
0.20
0.25
0.30
(001) plane (110) plane (111) plane (100) plane
Del
ta (m
eV)
Temperature (K)
FIG. 8: ∆0(T ) of Cd2Re2O7 measured for different crystallographic planes
with a remarkably large gap resulting in a ratio 2∆(0)/kBTc > 5, which is comparable to
values found e.g. in Pb–Bi alloys with extremely strong electron-phonon coupling27. The
related ternary β-pyrochlore osmium oxides, AOs2O6, where A is an alkali metal cation, also
exhibit such large 2∆(0)/kBTc ratios, as observed for KOs2O628. However, Tc of KOs2O6
9
is by an order of magnitude higher than in Cd2Re2O729. In the superconducting region
the density of states of KOs2O6 was measured28 using photoemission spectroscopy and the
data were fitted using the Dynes formula21. The resulting broadening parameter Γ had
temperature dependence quite similar to what we found for the imaginary part of the gap
shown in Fig. 7. An additional similarity with the β-pyrochlore osmium superconductors
is the substantial enhancement of the experimental Sommerfeld γ-term with respect to the
band γ-term. Superconductivity in the β-pyrochlore osmium oxides is usually attributed to
a low-energy rattling vibrational mode of the alkali metal atoms which may also account for
the observed first order structural phase transition occurring below TC in KOs2O628,29. It is
tempting to associate the superconductivity in Cd2Re2O7 to similar low-energy vibrational
excitations, e.g. to the low-energy IR modes recently observed by low-temperature optical
spectroscopy in the superconducting state10.
The temperature dependence of the gap edge is quite unusual even for strongly coupled
electron-phonon superconductors such as Pb where ∆0(T ) closely follows the BCS curve
(see Fig. 44 in Ref. 23). In Cd2Re2O7 ∆0(T ) remains flat up to about 80% of the Tc and
then it drops precipitously to 0 at Tc. The imaginary part of the gap at the gap edge
has a sharp peak near the temperature where the gap edge starts its rapid decrease. Such
temperature dependence can result in systems where the superconductivity is caused by
electrons coupling to a low frequency phonon mode as illustrated in Fig. 9.
The results shown in Fig. 9 were obtained30 for a model for the β-pyrochlore
KOs2O631 where the superconductivity is assumed to result from the electron cou-
pling to a low frequency anharmonic (rattling) mode32. Using a very sharp cutoff
Lorentzian model for the electron-phonon coupling function of a “rattler” α2FR(Ω) =
(gǫ/π) 1/ [(Ω− ΩR)2 + ǫ2]− 1/(Ω2
c+ ǫ2), for ΩR − Ωc ≤ Ω ≤ ΩR + Ωc, and α
2FR(Ω) = 0,
for |Ω − ΩR| > Ωc, with the rattling frequency ΩR = 2.2 meV, the cutoff frequency Ωc =
2.1 meV, the peak-width parameter ǫ = 0.01 meV, and the the coupling strength parameter
g = 3.312 (chosen such that λR =∫ +∞
0dΩα2FR(Ω)/Ω = 3), the Eliashberg equations were
solved on the real axis at various temperatures. The real and the imaginary part of the gap,
at the gap edge, defined by Re∆(E = ∆0(T ), T ) = ∆0(T ), are shown in Fig. 9. The transi-
tion temperature Tc was obtained by solving the Eliashberg equations on the imaginary axis
with the cutoff in the Matsubara sums ωc = 30 meV and the Coulomb repulsion parameter
µ∗(ωc) = 0.1. The same ωc and µ∗(ωc) were used in the real axis calculations. The resulting
10
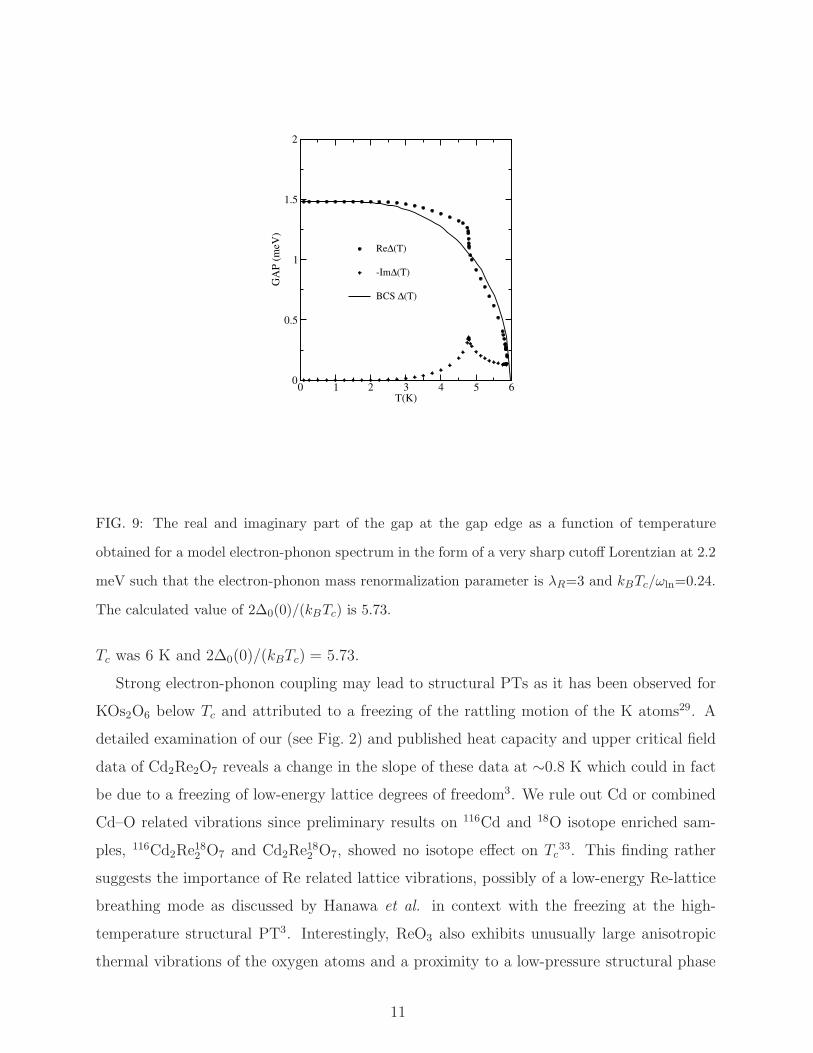
FIG. 9: The real and imaginary part of the gap at the gap edge as a function of temperature
obtained for a model electron-phonon spectrum in the form of a very sharp cutoff Lorentzian at 2.2
meV such that the electron-phonon mass renormalization parameter is λR=3 and kBTc/ωln=0.24.
The calculated value of 2∆0(0)/(kBTc) is 5.73.
Tc was 6 K and 2∆0(0)/(kBTc) = 5.73.
Strong electron-phonon coupling may lead to structural PTs as it has been observed for
KOs2O6 below Tc and attributed to a freezing of the rattling motion of the K atoms29. A
detailed examination of our (see Fig. 2) and published heat capacity and upper critical field
data of Cd2Re2O7 reveals a change in the slope of these data at ∼0.8 K which could in fact
be due to a freezing of low-energy lattice degrees of freedom3. We rule out Cd or combined
Cd–O related vibrations since preliminary results on 116Cd and 18O isotope enriched sam-
ples, 116Cd2Re182 O7 and Cd2Re
182 O7, showed no isotope effect on Tc
33. This finding rather
suggests the importance of Re related lattice vibrations, possibly of a low-energy Re-lattice
breathing mode as discussed by Hanawa et al. in context with the freezing at the high-
temperature structural PT3. Interestingly, ReO3 also exhibits unusually large anisotropic
thermal vibrations of the oxygen atoms and a proximity to a low-pressure structural phase
11

transition34. The observation of anisotropy in the superconducting order parameter ∆0(T )
in Cd2Re2O7 might be as a result of the anisotropy of the Fermi surface as reported by band
structure calculations7.
In summary, we have measured N–S conductance spectra below the superconducting
transition temperature of the α-pyrochlore superconductor Cd2Re2O7 by soft point contact
spectroscopy. We developed and employed an extension of the BTK theory by including
the quasiparticle self-energy into the Bogoliubov equations, and thus we were able to fit the
conductance spectra as well as derive the temperature dependence and the magnitude of
the superconducting order parameter. The magnitude of the gap at T = 0 indicates that
Cd2Re2O7 is a strong-coupling superconductor. The temperature dependence of the order
parameter is markedly different from that of the weak-coupling BCS gap.
Acknowledgments
Financial support for this work was partially provided by the Natural Sciences and Engi-
neering Research Council of Canada (NSERC) and the Canadian Foundation for Innovation
(CFI). F.S.R. acknowledges the research support by the MPG during his sabbatical stay at
the MPI for Solid State Research, Stuttgart, Germany.
1 M. Hanawa, Y. Muraoka, T. Tayama, T. Sakakibara, J. Yamaura and Z. Hiroi, Phys. Rev. Lett.
87, 187001 (2001).
2 M. Sakai, K. Yoshimura, H. Ohno, H. Kato, S. Kambe, R. E. Walstedt, T. D. Matsuda, Y.
Haga, Y. Onuki, J. Phys.: Condens. Matter 13, L785 (2001).
3 M. Hanawa, J. Yamaura, Y. Muraoka, F. Sakai, and Z. Hiroi, J. Phys. and Chem. of Solids 63,
1027 (2002).
4 R. Jin, J. He, J. R. Thompson, M. F. Chisholm, B. C. Sales, and D Mandrus, J. Phys.: Condens.
Matter 14, L117 (2002).
5 K. Arai, K. Kobayashi, K. Kodama, O. Vyaselev, M. Takigawa, M. Hanawaa, and H. Hiroi, J.
Phys.: Condens. Matter 14, L461 (2002).
6 Z. Hiroi and M. Hanawa, J. Phys. and Chem. of Solids 63, 1021 (2002).
12
7 D. J. Singh, P. Blaha K. Schwarz, and J. O. Sofo, Phys. Rev. B 65, 155109 (2002).
8 S.-W. Huang, H.-T. Jeng, J.-Y. Lin, W. J. Chang, J. M. Chen, G. H. Lee, H. Berger, H. D.
Yang and K. S. Liang, J. Phys.: Condens. Matter, 21, 195602 (2009).
9 O. Vyaselev, K. Arai, K. Kobayashi, J. Yamazaki, K. Kodama, M. Takigawa, M. Hanawa, and
H. Hiroi, Phys. Rev. Lett. 89, 017001 (2002).
10 M. Hajialamdari, F. S. Razavi, D. A. Crandles, R. K. Kremer, and M. Reedyk, J. Phys.:
Condens. Matter 24, 505701 (2012).
11 N. Barisic, L. Forro, D. Mandrus, R. Jin, J. He, and P. Fazekas, Phys. Rev. B, 67, 245112
(2003).
12 W. Z. Noddack, Z. Elektrochem. 34, 628 (1928).
13 N. Barisic, L. Forro, D. Mandrus, R. Jin, J. He, and P. Fazekas, Phys. Rev. B, 67, 245112
(2003).
14 R. S. Gonnelli, D. Daghero, G. Ummarino, V. A. Stepanov, J. Sun, S. M. Kazakov, and J.
Karpinski, Phys. Rev. Lett. 89, 247004 (2002).
15 D. Daghero, R. S. Gonnelli, Supercond. Sci. Technol. 23 043001 (2010).
16 G. E. Blonder, M. Tinkham and T. M. Klapwijk, Phys. Rev.B 25, 4515 (1982).
17 S. B. Kaplan, C. C. Chi, D. N. Langenberg, J. J. Chang, S. Jafarey, and D. J. Scalapino, Phys.
Rev. B 14, 4854 (1976).
18 A. Plecenik, M. Grajcar, S. Benacka, P. Seidel, and A. Pfuch, Phys. Rev. B 49, 10016 (1994);
M. Grajcar, A. Plecenik, P. Seidel, and A. Pfuch, Phys. Rev. B 51, 16185 (1995).
19 Y. de Wilde, T. M. Klapwijk, A. G. M. Jansen, J. Heil, and P. Wyder, Physica B 218, 165
(1996).
20 L. Janson, M. Klein, H. Lewis, A. Lucas, A. Marantan, and K. Luna, Am. J. Phys. 80 (2), 133
(2012).
21 R. C. Dynes, V. Narayanamurti, and J. P. Garno, Phys. Rev. Lett. 41, 1509 (1978).
22 B. Mitrovic and L. A. Rozema, J. Phys.: Condens. Matter 20, 015215 (2008).
23 J. R. Schrieffer, Theory of Superconductivity, (W. A. Benjamin, New York, 1964).
24 D. J. Scalapino, in Superconductivity, edited by R. D. Parks (Marcel Dekker, New York, 1969),
Vol. 1, P 466.
25 W. L. McMillan, Phys. Rev. 175, 559 (1968).
26 Y. Rohanizadegan, MSc. Thesis, Brock University(2013).
13
27 B. Mitovic, H. G. Zarate, and J. P. Carbotte, Phys. Rev. B 84, 184 (1984).
28 T. Shimojima, Y. Shibata, K. Ishizaka, T. Kiss, A. Chainani, T. Yokoya, T. Togashi, X.-Y.
Wang, C. T. Chen, S. Watanabe, J. Yamaura, S. Yonezawa, Y. Muraoka, Z. Hiroi, T. Saitoh,
and S. Shin, Phys. Rev. Lett. 99, 117003 (2007).
29 Z. Hiroi, J. Yamuaura, and K. Hattori, J. Phys. Soc. Japan 81, 011012 (2012).
30 B. Mitrovic and E. J. Nicol, unpublished.
31 T. Shimojima, Y. Shibata, K. Ishizaka, T. Kiss, A. Chainani, T. Yokoya, T. Togashi, X.-Y.
Wang, C. T. Chen, S. Watanabe, J. Yamaura, S. Yonezawa, Y. Muraoka, Z. Hiroi, T. Saitoh,
and S. Shin, Phys. Rev. Lett. 99, 117003 (2007).
32 G. D. Mahan and J. O. Sofo, Phys. Rev. B 47, 8050 (1993).
33 F. S. Razavi and R. K. Kremer, unpublished results.
34 U. D. Wdowik, K. Parlinski, Tapan Chatterji, S. Rols, and H. Schober, Phys. Rev. B 82, 104301
(2010).
14