f/6 21/2 combust ion behavior of solid fuel ramjets ... · directed at the combustion behavior of...
TRANSCRIPT
AD A106 061 NAVAL POSTGRADUATE SCHOOL MONTEREY CA F/6 21/2COMBUST ION BEHAVIOR OF SOLID FUEL RAMJETS. VOLUME 1. CORRELATIO--ETC(UIJUL al B A BINN, W E SCOTT, 0 W NETZER
UNCLASSIFIED NPS67-81-OlO-VOL-1 NL
mhhhIIIIIIIIIuEEIIEEEEEEIIEEEEEEEEEEEEIIEIIIhEEEEEEEIIE

it/ I
~NPS67-81-Ip-IV L ~i
NAVAL POSTIGRADUATE SCHOOLMonterey, California
to DT I,--OCT 2 3 1981
4- COMBUSTION BEHAVIOR OF 4OLID FUEL RAMJETS q IV=06 .ORRELATION OF Oj ACTING ANDI
S NON-REACTING FLOW CHARACTERISTICS
LU~
LA_ Brian A./Binn/ Winston E./Scottd David W./Netzer
C..*.. "
Approved for public release; distribution unlimited.
Prepared for:
Naval Weapons CenterChina Lake, CA 93555
81 10 23 ,t

NAVAL POSTGRADUATE SChuOLMonterey, Califormia
Rear Adrrral J. J. Ekelund D. A. SchradySuperintendent Acting Provost
The work reported herein was supported by the Naval Weapons Center,China Lake, CA.
Reproduction of all or part of this report is authorized.
This report was prepared by:
A "- 1, /7) -- <
BRIAN A. BINNCaptain, U.S. Air Force
WINSTON £. SCOTTLieutenant, U.S. Navy
DAVID W. NETZERProfessor of Aeronautics
Reviewed by: Released by:
M. F. PLATZER W. M. TOLLESQiairman of Aeronautics Dean of Research
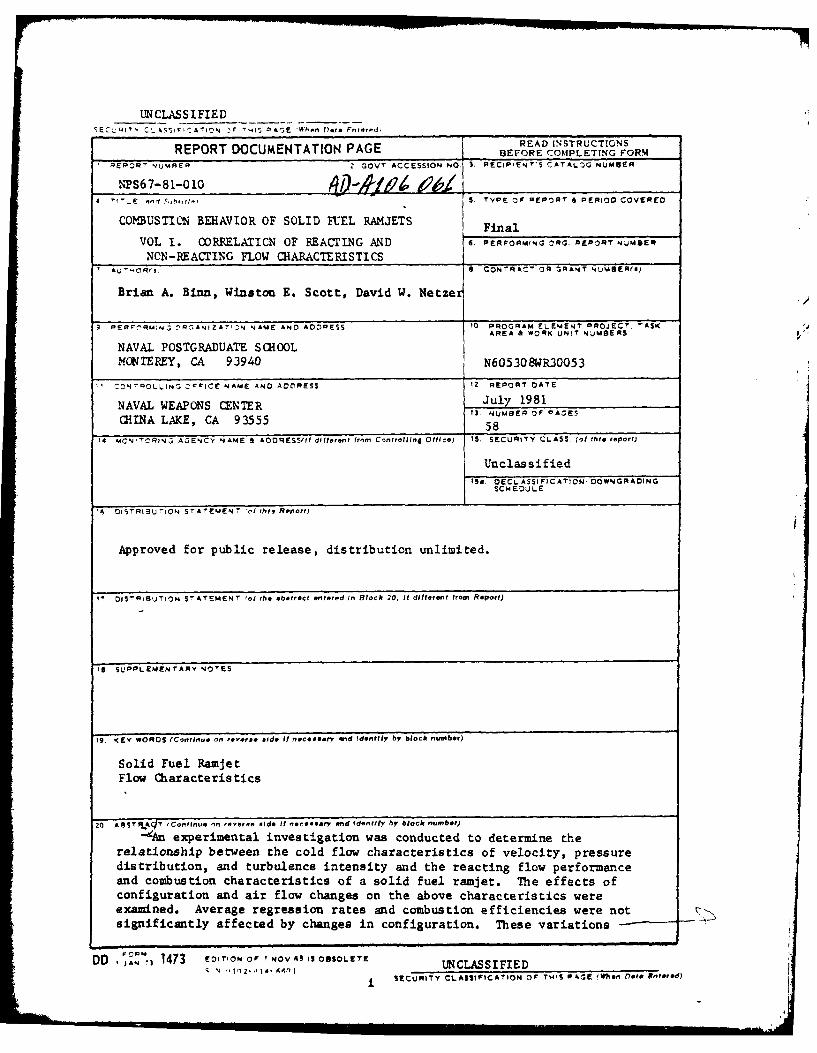
UNCLASSIFIEDEC ITI -_k 1 1F ':A T ION 'II 041E '1tP..n te. F I I'd;
____________________________________ BEFRE INOTRUETINSRREPORT DOCUMENTATION PAGE EFREAD NSTRUCTIONS M
REPORT NU4RER 2 GOVT ACCESSION No. 3. RECIPIENT'S CATALOG NUMBER
NS67-81-01o ,1jJ-674 &1 _
4 TITLE 5,,'1 s.ahi. .TYPE OF REP'ORT & PERIOD COVERED
COMBUSTION BEHAVIOR OF SOLID FUEL RAMJETS Final
VOL I. CORKELATICN OF REACTING AND 6. PEROMING RG. REPORT N JMSER
NON-REACTING FLOW CHARACTERISTICSI AQ--oRI, 8 CONTRACT OR :;RANT NuMSER(,j
Brian A. Binn, Winston E. Scott, David W. NetzeI
9 dN. C"P&'NIZAT'.W NAME AND 1DcPES'
10 PROGRAM ELEMENT PROJECT. TASKAREA & WORK UNIT NUMBERS
NAVAl POSTGRADUATE SCHOOLMON TEREY, CA 93940 N605308WR30053
1 CZN'ROLLINO OFFICE NAME AND ADORESS 12 REPORT DATE
N I July 1981NAVAL WEAPONS CENTER 3l NUBER OF AE
CHINA LAKE, CA 93555 58
14 4ONTCRM)lN, AGENCY NAME & ADOFDESSIt different from Cntroilind Office) IS. SECURITY CLASS. of hie report)
UnclassifiedISa. OECL ASSI FICATION, DOWNGRADING
SCHEDULE
1, ISTRIgUrION STArEMENT "f this Reroft)
Approved for public release, distribution unlimited.
I' DIST"ISIJTION STATEMENT 'of the ebetrac entered In Block 20, If different from Report)
IS SULPPLEMENTARY NOTES
IS. K(EY WORDS (Continue on reverse add* it neceeary end Identify by block number)
Solid Fuel RamjetFlow Characteristics
20 A STA ,/T Co.ntn....e n rwr... side It nec..ry end dntify y' block number)
--An experimental investigation was conducted to determine therelationship between the cold flow characteristics of velocity, pressuredistribution, and turbulence intensity and the reacting flow performanceand combustion characteristics of a solid fuel ramjet. The effects ofconfiguration and air flow changes on the above characteristics wereexamined. Average regression rates and combustion efficiencies were notsignificantly affected by changes in configuration. These variations
DO 1473 EDITON o I NOV AS 13 OBSOLETE UNCLASSIFIEDSECURITY CLASSIFICATION Or THIS v&GE fW?.en Dote Itrtered)

UNCLASSIFIED%m . ASIVC A,' *ad of V. -6431 .G -* *e ..* .. 0
in test conditions significantly affected the centerline turbulenceintensity but not the near-wall turbulence intensity in cold flow. Near-wall turbulence profiles in cold flow were found to correlate with thefuel regression profiles in reacting flows. The use of bypass resultedin decreases in regression rate and efficiencies for all cases.
Access tcr Fs,"
NTIS "&DT:c TAB [
By.
,'Av; i i , nd/ot
DIst Spe, al
" F orm. Ma."in ,,- UNCLASSIFIED- " £ U'.2-n14-6601'e , -' .. -.. .. • . u..... .
-- .* S_ * * . .,.

L
TABLE OF CONTENTS
Page No.
I. INTRODUCTION .......................... ................. 1
II. METHOD OF INVESTIGATION ................................. 3
III. DESCRIPTION OF APPARATUS .......... .................... 5
A. RAMJET MOTOR . ............ ..... * ...... * ........ 5
B. AIR SUPPLY AND FLOW CONTROL SYSTEM ................. 6
C. INSTRUMENTATION ...................... . .......... 7
1. Total Pressure Rake ............... ....... 7
2. Static Pressure Taps .......... ........... 7
3. Hot-Wire Anemometers .... * ................... 8
4. Thrust Measurement ...... ............... ........ 8
IV. EXPERIMENTAL PROCEDURES .................... ... . 9
A. CALIBRATIONS ........................... ........... 9
B. NON-REACTING FLOW STUDIES ......................... 9
1. Pressure and Velocity Distribution ............. 9
2. Hot-Wire Anemometer Studies ................... 10
C. REACTING FLOW STUDIES ... ...... . ...... ... .... ... 10
1. Pressure Measurement .. 11
2. Temperature Measurement ............ 11
3. Regression Rate/Pattern ...................... 12
4. Thrust Measurement ..... . ....... 6 .............. 12
5. Calculation of Combustion Efficiencies ......... 13
iii

Page No.
V. RESULTS AND DISCUSSION ................ ....... .............. 15
A. NON-REACTING FLOW EXPERIMENTS ............. ........... 15
1. Large Inlet Diameter (Configurations I and 2,Table I) .... *.. ... o ............................. 15
2. Large Inlet Diameter, w/Screen (Configurations 5and 6, Table I) ................................ 17
3. Large Inlet Diameter, w/Aft Orifice Plate (Config-urations 8 and 9, Table I) ...................... 18
4. Small Inlet Diameter (Configurations 3 and 4,Table I) . . . ........... *........................ 20
5. Small Inlet Diameter, w/Screen (Configuration 7,Table I) ............ *..s*.......................... 22
6. Circumferentially Grooved Fuel Grain (Configur-ation 13, Table I) ...... o...6............0.......... 22
B. REACTING FLOW EXPERIMENTS .............. .............. 23
1. Small Inlet Diameter, (Configurations 3 and 4,Table I) ............. .. ............ 25
2. Small Inlet Diameter, w/Screen (Configuration 7,Table I) ............ 0........9.........#............. 26
3. Small Inlet Diameter, w/Aft Orifice Plate (Config-urations 10 and 11, Table I) ........ s............ 27
4. Circumferentially Slotted Fuel Grain (Configur-ation 13, Table I) .................. ......... 27
5. Centrally Located Orifice Plate in Fuel Grain (Con-figuration 14, Table I) ....... ................. 28
6. Enlarged Forward End of Fuel Grain (Configurations15 and 16, Table I) .......................... 28
7. Combustion Pressure Oscillations .................. 28
VI. CONCLUSIONS ............................................... 30
VII. REFERENCES ................................................ 57
iv

LIST OF FIGURES
Fig. No. Page No.
1. Schematic of Solid Fuel Ramjet ....... .................. 31
2. Schematic of Air Inlet System for Engine on Thrust Stand 31
3. Total Pressure Probe in Fuel Grain ........... .......... 32
4. Pressure Tap Locations in PNM Fuel Grain .................... 32
5. Centerline Hot-Wire Probe ... ................................. 33
6. Near-Wall Hot-Wire Probe ............. ................. 33
7. Solid Fuel Ramjet on Thrust Stand ............................ 34
8. Velocity Profiles, No Bypass (Config. 1, Table I),PC - 3.80 atm, &p = 0.090 kg/sec (I Div. - 25 fps) ........... 35
9. Velocity Profiles, Bypass (Config. 2, Table I), Pc = 3.84 atm,&= 0.047 kg/sec, Is - 0.046 ks/sec (I Div. - 25 fps ........ 35
10. Reattachment Locations for Axisymmetric Flows (Fig. 7 ofRef. 7) ...................................................... 36
11. Axial Pressure Distributions, h/D - 0. 2 50 ................... 37
12. Centerline Turbulence Intensity, h/D 0.250 ................ 38
13. Side Wall Turbulence Intensity, h/D - 0.250 .................. 39
14. Bottom Wall Turbulence Intensity, h/D - 0.250 ................ 40
15. Velocity Profiles (Config. 5, Table I), w/screen,Pc - 3.96 atm, & - 0.093 kg/sec (1 Div. - 25 fps) ........... 41
16. Axial Pressure Distribution, Screen and Aft Orifice Plate .... 42
17. Centerline Turbulence Intensity, Inlet Screen ................ 43
18. Side Wall Turbulence Intensity, Inlet Screen ................. 44
19. Bottom Wall Turbulence Intensity, Inlet Screen ............... 45
20. Velocity Profiles (Config. 8, Table I) w/Aft Orifice Plate,PC = 4.04 atm, l - 0.093 kg/sec (I Div. - 25 fps) ........... 46
21. Centerline Turbulence Intensity, Aft Orifice Plate ........... 47
22. Side Wall Turbulence Intensity, Aft Orifice Plate ............ 48
v

Fig. No. Page No.
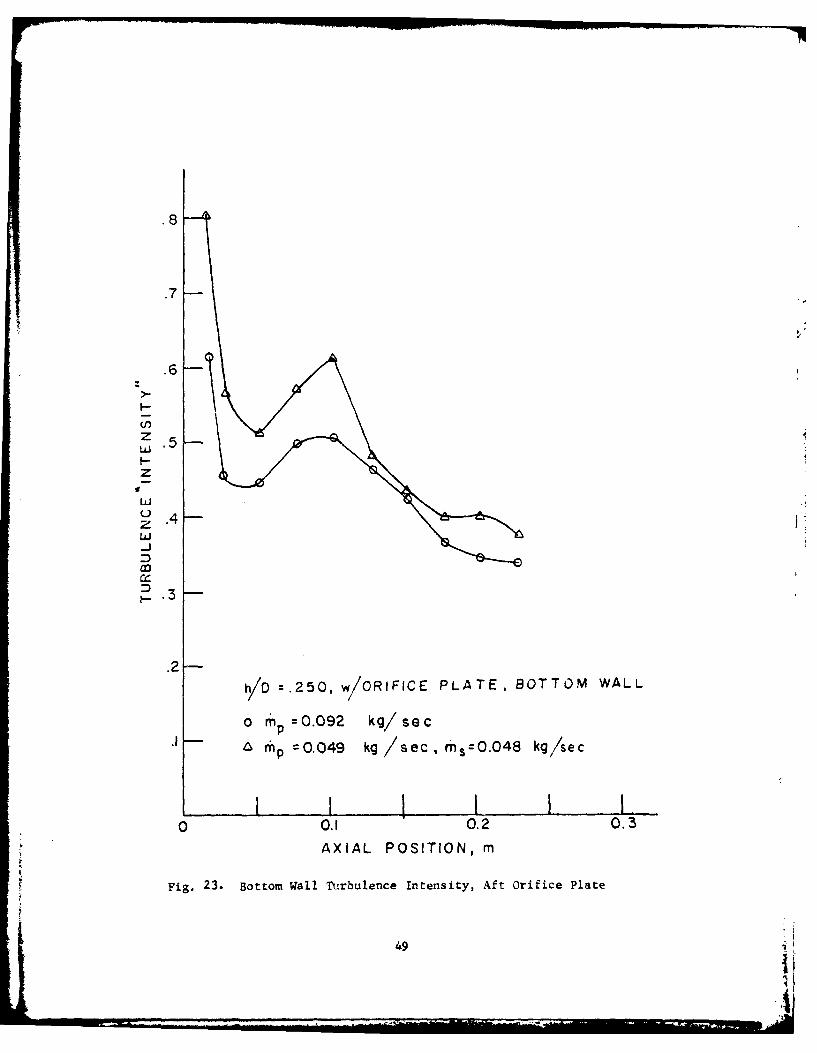
23. Bottom Wall Turbulence Intensity, Aft Orifice Plate .......... 49
24. Velocity Profiles, No Bypass (Config. 3, Table I),PCw 4.06 atm, - 0.094 kg/sec (1 Div. 25 fps, at 1.0 in1 Div. - 50 fps) ............................................. 50
25. Velocity Profiles, Bypass (Config. 4, Table I), Pc = 4.10 atm,- 0.049 kg/sec, & - 0.048 kg/sec (I Div. a 25 fps) ....... 50
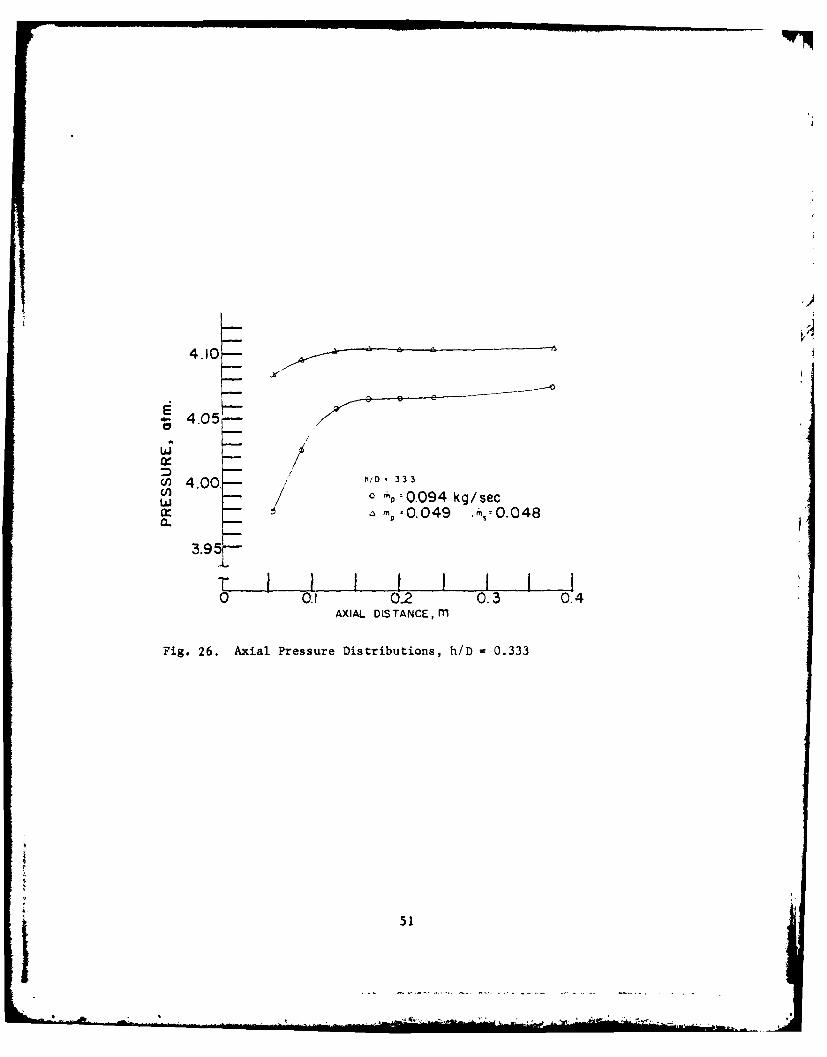
26. Axial Pressure Distributions, h/D - 0.333 .................... 51
27. Centerline Turbulence "Intensity", h/D - 0.333 ............... 52
28. Side Wall Turbulence "Intensity", h/D - 0.333 ... ..... 53
29. Bottom Wall Turbulence "Intensity", h/D - 0.333 .............. 54
30. Centerline Turbulence "Intensity" Profiles ................... 55
31. Near-Wall Turbulence "Intensity" Profiles ...... ........... 55
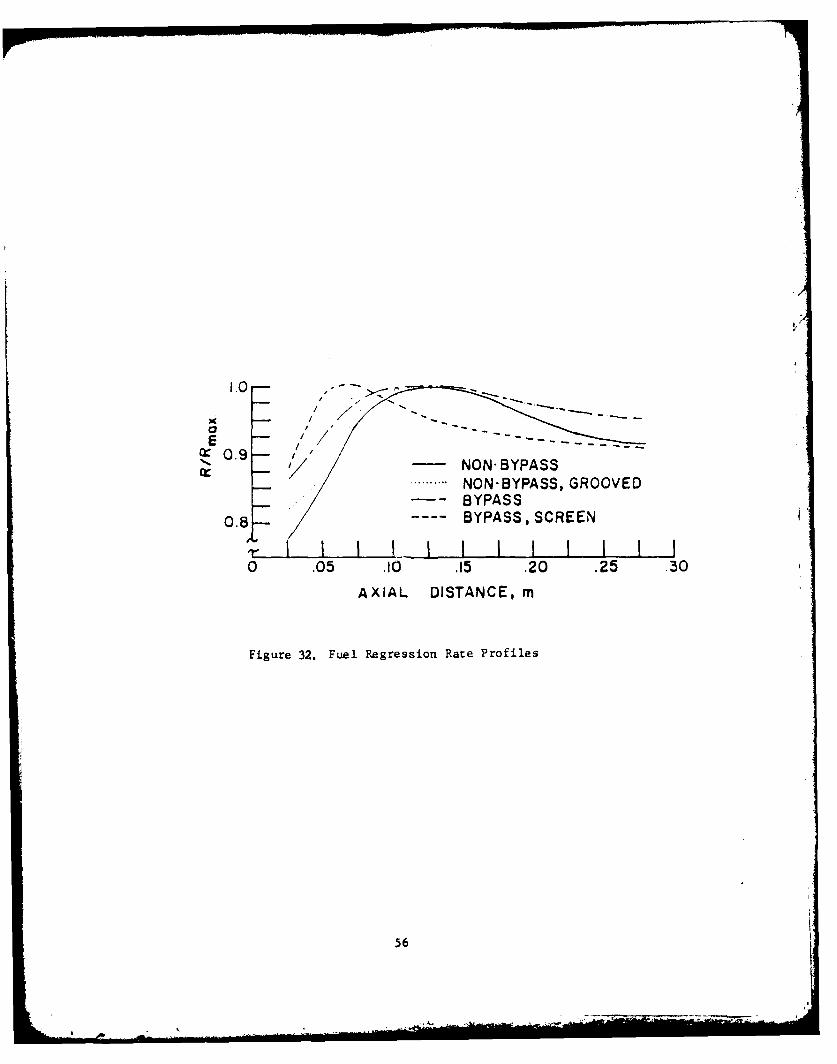
32. Fuel Regression Rate Profiles ...... .... ............... 56
vi
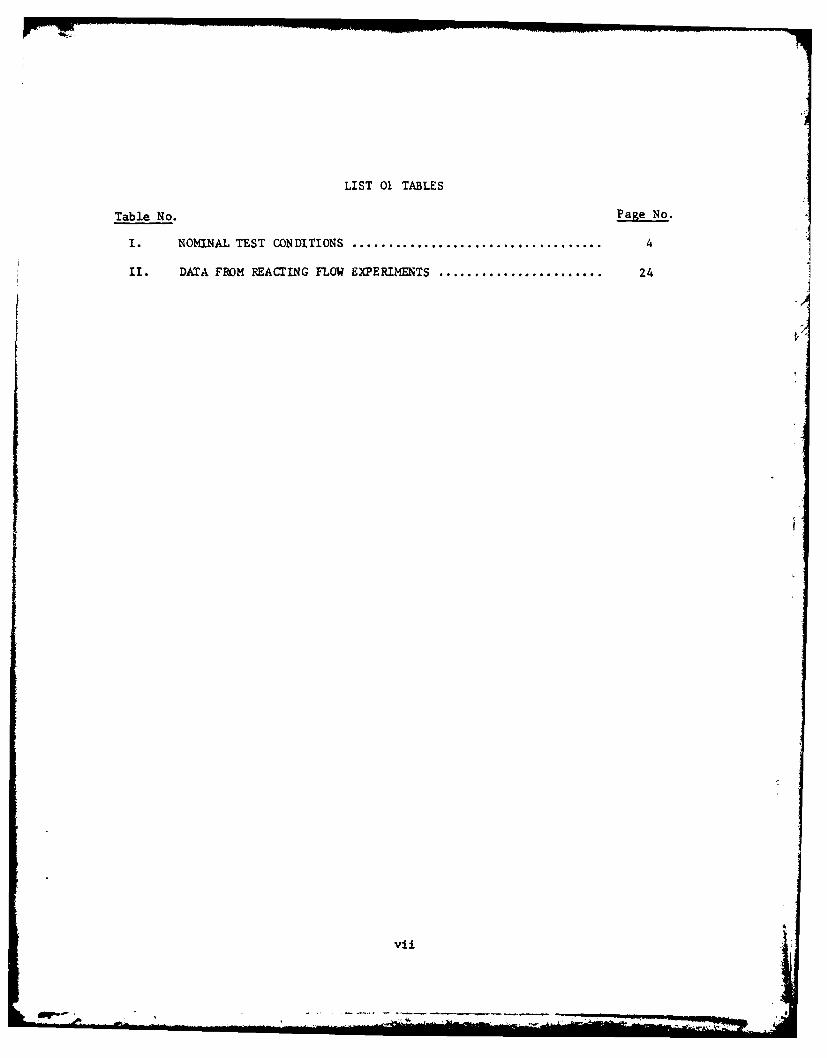
LIST 01 TABLES
Table No. Page No.
I. NOMINAL TEST CONDITIONS ........................................ 4
II. DATA FROM REACTING FLOW EXPERIMENTS ......................... 24
vii
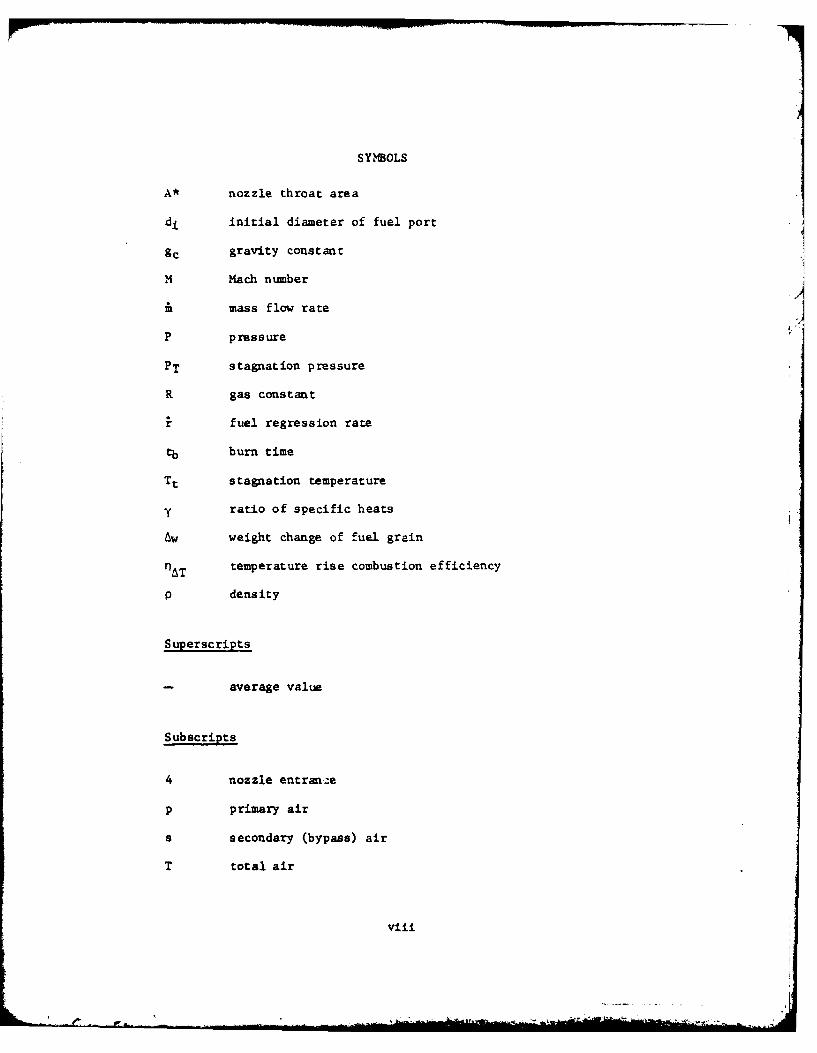
SYMBOLS
A* nozzle throat area
di initial diameter of fuel port
gc gravity constant
M Mach number
&mass flow rate
P pressure
PT stagnation pressure
R gas constant
ifuel regression rate
tb burn time
Tt stagnation temperature
y ratio of specific heats
Aw weight change of fuel grain
nAT temperature rise combustion efficiency
p density
Superscripts
average value
Subscripts
4 nozzle entran,:e
p primary air
s secondary (bypass) air
T total air
viii
- I,. - -

I. INTRODUCTION
The Naval Postgraduate School has had a continuing research effort
directed at the combustion behavior of solid fuel ramjets under the
sponsorship of the Naval Weapons Center, China Lake. Both mathematical
modeling [Refs. 1, 2 & 3] and experimental efforts [Refs. 4-9] have been
conducted to determine the effects of design variables on the obtainable
performance. One major area requiring additional attention is the attain-
ment of improved combustion efficiency together with higher energy fuels.
New fuels are required which will yield high density impulse and good
flammability limits for various inlet, grain and aft mixing chamber con-
figurations. Recently a wide variety of HTPB based fuels have been consid-
ered [Ref. 10 & 11]. To date the alternate fuels have not yielded signifi-
cant performance improvements and indications are that mixing processes
within the fuel grain port may be as important as fuel composition. The
attainment of higher efficiencies with existing or new fuels may require
innovative methods for controlled mixing of the diffusion limited combustion
processes within the fuel port. However, there is some evidence from past
work at NPS that variations in the curing process of Plexiglas has resulted
in significant changes in combustion efficiency without additional mixing
being attempted. Additional work is required to better understand the
effects of fuel properties and mixing processes on the combustion efficiency.
It is important to determine fuel behavior under various operating
conditions before final selection is made. In the past, fuels have been
evaluated under limited test conditions. This has sometimes resulted in
inexplainably low performance and unusual fuel regression patterns and/or
flammability limits in final hardware configurations.
Cold flow tests at UTC/CSD and NPS have been used for model validation
efforts and to better understand the flowfield within the fuel grain and
aft mixing chamber. However, these data have not been consistently related
to fuel performance (regression pattern, efficiency, flammability limits,
etc.) in a reacting environment.
It would be most beneficial if cold flow measurements and fuel charac-
teristics could be used a priori to predict the expected fuel behavior in
a reacting environment and in a specific geometric configuration.
In this investigation the performance of several fuels was measured
under various operating conditions and test geometries and an attempt was
made to correlate the results with cold flow measurements, fumdamental fuel
characteristics, and/or the amount of mixing induced near the fuel surface.
Volume I of this report presents the results obtained when an attempt
was made to correlate cold flow measurements with reacting flow character-
istics.
2
40• _I
II. XETHOD OF INVESTIGATION
In order to determine if relationships exist between cold flow
data and combustion performance, non-reacting flow data consisting of
static and total pressure measurements, and centerline and near-wall
hot-wire anemometer measurements have been made. Nominal test condi-
tions are listed in Table I. Static pressure was obtained with the
use of wall mounted taps along the length of the ram-et motor. These
values, along with stagnation pressure measurements from a total pressure
rake, were used to determine pressure distribution and velocity profiles
in the ramjet motor. The hot wire anemcmeter data yielded quantitative
and qualitative information on the turbulence intensity within the ramjet
model.*
To gather the desired information from the reacting flow studies,
the solid fuel ramjet motor was mounted on a thrust stand. Along with
the thrust data, static pressure distributions along the grain were
obtained. The experimental firings were conducted using polymethylmeth-
acrylate (P14) fuel grains. Nominal test conditions are presented in
Table I. Several grain modifications were also made to promote fuel-
air mixing within the fuel port.
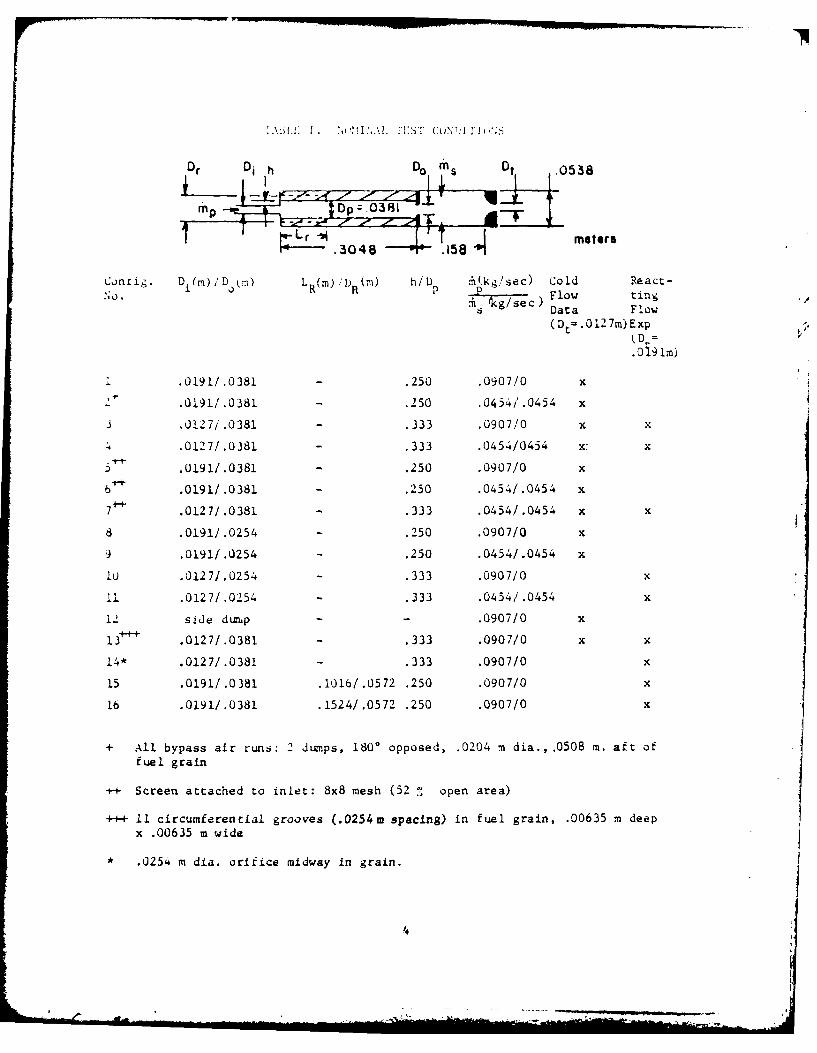
Dr Di h DO M5 ot .0538
mip Dp .0:381 "
t~r metersf F - .3048 ".158 m ~l
Conrig. Di(m) /D km) LR(m) /1R () h/D i(kg/sec) Cold React-NO. i ) Flow ting
S Data Flow
(Dt=.0127m)Exp(D,=.Ollm)
.0191/.0381 - .250 .0907/0 x
- .0191/.0381 - .250 .0454/.0454 x
3 .0127/.0381 - .333 .0907/0 x x
4 .0127/.0381 - .333 .0454/0454 x, x
.0191/.0381 - .250 .0907/0 x'+ .0191/.0381 - .250 .0454/.0454 x
7+_+ .0127/.0381 - .333 .0454/.0454 x x
8 .0191/.0254 - .250 .0907/0 x
9 .0191/.0254 - .250 .0454/.0454 x
10 .0127/.0254 - .333 .0907/0 x
Il .0127/.0254 - .333 .0454/.0454 x
1 side duup - - .0907/0 x
13*' .0127/.0381 - .333 .0907/0 x x
14* .0127/.0381 - .333 .0907/0 x
15 .0191/.0381 .1016/.0572 .250 .0907/0 x
16 .0191/.0381 .1524/.0572 .250 .0907/0 x
+ All bypass air runs: 2 Jnps, 1800 opposed, .0204 m dia., .0508 m. aft of
fuel grain
+-+ Screen attached to inlet: 8x8 mesh (52 % open area)
+-++ 11 circumferential grooves (.0254m spacing) in fuel grain, .00635 M. deepx .00635 m wide
* .0254 m dia. orifice midway in grain.
4
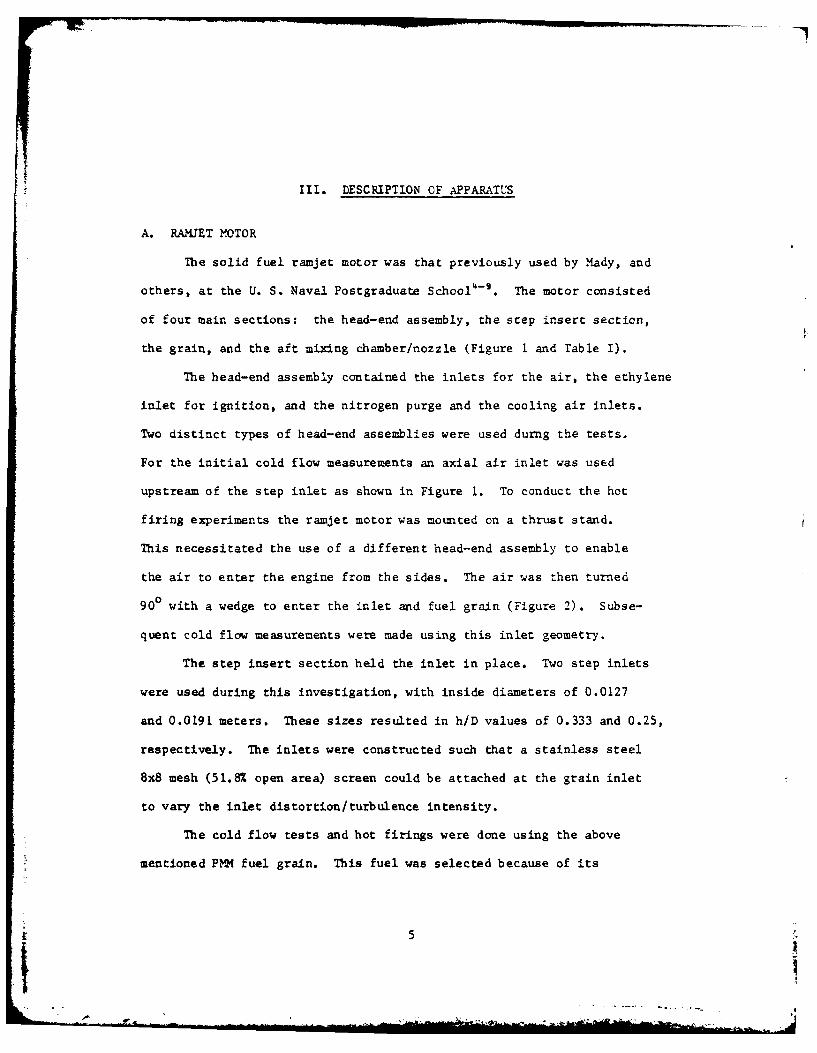
III. DESCRIPTION OF APPARATUS
A. RAMJET MOTOR
The solid fuel ramjet motor was that previously used by Mady, and
others, at the U. S. Naval Postgraduate School - . The motor consisted
of four main sections: the head-end assembly, the step insert section,
the grain, and the aft mixing chamber/nozzle (Figure I and Table I).
The head-end assembly contained the inlets for the air, the ethylene
inlet for ignition, and the nitrogen purge and the cooling air inlets.
Two distinct types of head-end assemblies were used durng the tests.
For the initial cold flow measurements an axial air inlet was used
upstream of the step inlet as shown in Figure 1. To conduct the hot
firing experiments the ramjet motor was mounted on a thrust stand.
This necessitated the use of a different head-end assembly to enable
the air to enter the engine from the sides. The air was then turned
900 with a wedge to enter the inlet and fuel grain (Figure 2). Subse-
quent cold flow measurements were made using this inlet geometry.
The step insert section held the inlet in place. Two step inlets
were used during this investigation, with inside diameters of 0.0127
and 0.0191 meters. These sizes resulted in h/D values of 0.333 and 0.25,
respectively. The inlets were constructed such that a stainless steel
8x8 mesh (51.8% open area) screen could be attached at the grain inlet
to vary the inlet distortion/turbulence intensity.
The cold flow tests and hot firings were done using the above
mentioned PMt fuel grain. This fuel was selected because of its
5
| p............•

availability and wide use for basic research in hybrid rocket combustion
and in studies of polymer degradation. The grains were nominally
0.3048 meters in length with an initial inside port diameter of 0.0381m.
The aft mixing chamber had four bypass dumps located symmetrically
around the chamber. For this study two 1800 opposed dumps were used,
and the remaining two were blocked off. These bypass dumps were
0.0204 m in diameter and were located 0.0508m from the exit plane of
the fuel grain. A 0.0048m thick orifice plate with a 0.0381m internal
diameter was located at the aft end of the fuel grain to maintain
a fixed step height entering the aft chamber. A few tests were made
using an aft orifice with an internal diameter of 0.0254 m.
The aft chamber had a length to diameter ratio (L/D) of 2.93 and
an inlet step h/D of .146. A pressure tap was located near the rear
end of the aft chamber. A 0.0127 m diameter converging nozzle was used
in the cold flow experiments to provide choked flow. A nozzle of
0.0191 m diameter was used during hot firing runs to provide a chamber
pressure of approximately 4 atm.
B. AIR SUPPLY AND FLOW CONTROL SYSTEM
The main air supply was powered by a Pennsylvania air compressor
that could provide air at pressures up to 10 atm. The air was fed
into a reservoir and then directed to the ramjet motor. A Polytherm
air heater was also available if the air needed to be heated.
Standard ASME orifice flowmeters were used to measure the flow
rates of the air into the motor for both primary and secondary (bypass)
air. Manually operated gate valves between the orifices and the motor
6
II
were used to provide the desired flow rates to the motor. Two pneu-
matically operated Jamesbury ball valves (operating together) either
vented the primary air to the atmosphere, or allowed it to pass through
the motor. The line pressures and differential pressures across the
ASME orifices were recorded on a Honeywell Model 2106 Visicorder and/or
a strip chart recorder.
C. INSTRLUENTATION
Flow measurements during the cold flow tests consisted of a
total pressure rake, axial pressure distributions (using wall pressure
taps), and centerline and side wall hot wire turbulence intensity mea-
surements. During hot firings the axial pressure distribution was also
measured as was the thrust.
1. Total Pressure Rake
A 7-probe total pressure rake was designed to axially traverse
the ramjet motor from the inlet plane through the aft mixing chamber.
Figure 3 is a drawing of the rake installed in the PiM fuel grain.
A mounting device was attached to the nczzle to steady the probe and
allow for traversing of the motor. The probe support tube was scribed
for easy determination of probe location when inside the motor. Plastic
tubing connected the seven total pressure taps to a Scanivalve system,
which was in turn attached to a digital D.C. voltmeter for reading of
the data.
2. Static Pressure Taps
A total of 8 wall pressure taps were employed. One was located
in the head-end assembly and one, as previously mentioned, in the aft
7

mixing chamber. The remaining six were spaced in the fuel grains as
shown in Figure 4. These were also connected to the Scanivalve system
mentioned above. These measurements, along with the rake total pressure
readings, allowed for determination of velocity profiles throughout
the ramjet apparatus during non-reacting experiments. During non-
reacting experiments the Scanivalve output was manually recorded.
During hot firings the output was recorded on a strip chart with the
Scanivalve cycled automatically.
3. Hot-Wire Anemometers
Turbulence intensity measurements were made during the cold
flow experiments along the centerline of the ramjet motor and also
along the side walls of the fuel grain at two circumferential positions
(900 and 1800). The apparatus used miniature Thermo-systems Incorporated
(TSI) hot wires. Figures 5 and 6 show the hot wire apparatus in the
fuel grain. The hot wire was connected directly to the TSI electronic
equipment. A D.C. voltmeter and a true RMS meter were used to read the
hot wire output. Additionally, an oscilloscope was connected for visual
observations of the hot wire output and for setting the stability
prior to the measurements.
4. Thrust Measurement
Thrust measurement was accomplished by mounting the ramjet
motor apparatus to a small thrust stand as shown in Figure 7. The
head-end of the motor was mounted such that the thrust pick-up was
in-line with the centerline of the engine. The transducer output was
recorded on a strip chart recorder. Load cell calibration was accom-
plished using a pulley/weight system.
8
IV. EXPERIMENTAL PROCEDURES
A. CALIBRATIONS
The transducers required for the flow and thrust measuring devices
were calibrated prior to the running of each test. The line pressure
and differential pressure transducers and the Scanivalve were calibrated
using a Heise gauge and bottled nitrogen.
B. NON-REACTING 17LOW STUDIES
I. Pressure and Velocity Distributions
The total pressure rake was axially traversed from the air inlet
plane to the aft mixing chamber. All 15 wall static and stagnation
pressure readings, plus one atmospheric reading, were made when the rake
was secured at each desired position. Data were taken at 0.0254, 0.0889,
0.1270, 0.2032, 0.3048, 0.3810 and 0.4445m from the air inlet.
The wall static pressure distributions were obtained when the rake
was positioned at 0.381m (0.0762m into the aft mixing chamber). This
position was selected to limit effects due to the blockage which occurs
when the probe is within the fuel grain.
The velocity profiles could easily be determined using the static
and total pressure values together with the isentropic, compressible
flow relationships between the pressures, velocity, temperature, and
the properties of air. The values of y and R , which were used,
were those of air on a standard day at sea level.
9
2. Hot-Wire Anemometer Studies
A guide was mounted as close to the hot wire as possible to
steady the probe. This helped reduce the vibration of the probe
considerably. Although the readings taken near the rear end of the
grain and in the aft mixing chamber did not receive the benefits from
the guide, the velocities in these regions were much lower and vibrations
of the probe were minimal.
The centerline turbulence intensity measurements were taken at the
air inlet plane, at 0.0254m intervals through the first half of the
grain, and then at larger intervals (depending cn the test being run).
The near-wall turbulence readings were taken at a nominal radial
distance of 0.0024m from the wall. Two passes were made down the
grain in order to obtain the data at 900 and 1800 under the same flow
conditions. The data were recorded at 0.0127m from the air inlet and
then at 0.0254m intervals to 0.2286m with the experimental set-up
used in these tests. If the probe guide had been allowed to exit the
aft end of the grain, the wire would have broken when it came into
contact with the wall.
Using the readings from the digital D.C. voltmeter and the Ballantine
true RMS meter, the turbulence intensities were determined. Although
the hot wire was used in the linearized mode, many of the measurements
could only be considered in a qualitative manner since intensities
often exceeded 15%.
C. REACTING FLOW STUDIES
The procedure for setting of the required flow rates for the tests
was the same as that used in the non-reacting experiments.
10

The motor was ignited by first setting the desired air flow rate(s),
igniting a small ethylene-oxygen torch that vented in the face of the
step inlet, and then bleeding in a small amount of ethylene upstream
of the inlet dump. After ignition, the torch and ethylene bleed were
terminated.
Combustion normally lasted for forty-five seconds. The motor
was extinguished at the end of each run by simultaneously venting the
air to the atmosphere and actuating the nitrogen purge system. Low
pressure air was then blown through the motor for cooling.
1. Pressure Measurement
Several fuel grains were instrumented with pressure taps
identical to those in the non-reacting flow studies (Figure 4). As with
the cold flow tests, a fuel port pressure distribution was obtained.
The aft mixing chamber pressure (combustion pressure) was also recorded
on a Visicorder, in addition to the strip chart. This was necessary
to obtain a continuous pressure-time trace for the duration of the firing.
A highly accurate time signal was also recorded to allow determination
of burn time for regression rate calculations.
2. Temperature Measurement
The air inlet temperature was recorded on a strip chart. The
inlet total temperature was derived from the measured inlet static
temperature and the air flow rate. This was used, along with the derived
total temperature at the nozzle inlet, for computation of the combustion
efficiency.
11 4.

3. Regression Rate/Pattern
To determine the average regression rate C r ) it was necessary
to make preliminary measurements of the fuel grain prior to insertion
into the ramjet motor. The grains were weighed prior to and after e'ach
run. Based on the weight loss and the burn time of the run the average
regression rate was calculated using
7 ,4Aw + d2) (1)r -2tb (Pfgc i
Average initial diameter values (di) for the PMM fuel grains with
piecewise varying internal geometries were computed. This computation
was based on equating the total calculated internal volume Vt to that
of an equivalent centrally perforated, constant diameter fuel grain.
The regression patterns, axial and circumferential, were also of
interest during this study. The regression patterns were examined by
making selective cuts through the fuel grain both perpendicular and
parallel to the central axis. These profiles were inspected for loca-
tion of maximum regression rate and symetry of burn pattern.
4. Thrust Measurement
The ramjet motor was mounted on a small thrust stand to measure
thrust directly. The thrust transducer was connected to a strip chart
recorder. A small tare was used to assure solid contact of the thrust
stand against the transducer at all times. The thrust measurement was
also used with other measured variables to determine combustion
efficiency.
12

5. Calculation of Combustion Efficiencies
The efficiency of the ramjet combustion process is usually
defined as a ratio of the theoretical temperature rise to that which
is actually attained. Because of the difficulty in measuring an
average gas temperature due to the high temperature levels, the accepted
practice is to calculate the temperature of the gas based on either
burner pressure or thrust.
The measurement of thrust can be suspect depending on the experimen-
tal set-up and measuring technique. One of the main problems is the
bringing of the air flow into the ramjet motor while mounted on the
thrust stand. It is possible to introduce an unknown tare force which
can degrade the acceptability of the measured thrust. The experimental
set-up minimized this problem by bringing the air into the head-end
and aft mixing chamber through long flexible hoses from above, thereby
imparting no force along the thrust line of the motor.
To determine the temperature rise efficiency the following
relationship was used:
Tt meas T t air (2)AT Tt theor T t air
Tt air was determined from measurement of the temperature at the head-end
of the motor. In this low velocity region, stagnation and static temp-
era~ures are virtually identical. The value of Tt meas can be found
using the measured pressure and mass flow rate, as previously mentioned,
13

and the one-dimensional mass continuity relationship for flow through
a choked nozzle. From
A* (~ \ l)(+)/-)P T4 A*gY (3)
R TT4
the following relationship can be obtained:
Tt mea - R + [1+(2 4 &()
Values of P4 , A , AND iaT are measured quantities (station 4
is just prior to the nozzle). The NWC Pepcode computer program was
used to determine the theoretical combustion temperature and required
gas properties (R and y) at the experimentally determined air-fuel
ratio and inlet conditions. M4 was determined from y and the known
nozzle contraction ratio.
14

V. RESULTS AND DISCUSSION
A. NON-REACTING FLOW EXPERIMNTS
The non-reacting flow experiments were accomplished in an attempt
to characterize the flowfield within the solid fuel ramjet motor for
widely varying geometries and flow rates. The studies included the
determination of velocity profiles, wall static pressure variation,
centerline turbulence intensity, and near-wall turbulence intensity.
The magnitude of the Pd voltage/DC voltage measured with the hot-wire
anemometer (in the linear mode) was normally greater than 15% and,
therefore, cannot actually be called "turbulence intensity". The ratio
only provided relative magnitudes from test to test. For discussion
purposes, however, the term "turbulence intensity" will be employed
1. Large Inlet Diameter (Configurations 1 and 2, Table I)
The reattachment point/region can be considered to be that point
where no reverse flow occurs. This occurred at approximately 0.102m
for the case with no bypass as compared to over 0.203 m when bypass was
introduced (Fig. 8 and 9). The reattachment point location for no
bypass flow compared favorably with previous work (Fig. 10). The
length of the recirculation region for the run with bypass was sur-
prisingly long. If the flow were laminar there would be a tendency for
the reattachment zone to move downstream. However, a check of the
Reynolds number indicated that, as expected, the flow was fully turbulent.
Apparently, when small recirculation regions are employed the flow
characteristics within the aft mixing chamber affect the recirculation
15
region within the fuel port. The velocity profiles in the center portion
of the aft mixing chamber were flat and essentially identical for
both cases.
Figure 11 presents the axial pressure distributions in the fuel
grain and one point in the aft mixing chamber. The pressure leveled
off at about 0.127m without bypass, slightly downstream of reattachment.
The bypass pressure distribution was quite flat over the entire grain
length but did decrease slightly at the head-end.
Peak turbulence "intensities" along the motor axis were located
at approximately 0.140 m and 0.191m for the no-bypass and bypass
configurations respectively, just downstream of the locations where wall
static pressures leveled off and reattachments occurred (Fig. 12). Bypass
caused higher values of turbulence "intensity" in the aft region of the
fuel grain.
Analysis of the side and bottom wall turbulence "intensities"
(Fig. 13 and 14) indicated that, in contrast to the centerline tur-
bulence "intensities", there was no significant effect of the bypass
on the position of maximum near-wall turbulence "intensity" in the fuel
port. Bypass levels were again greater than no-bypass levels. Secondary
peaks of turbulence "intensity" occurred at approximately 0.102 m, near
where the flow reattachment occurred with no bypass. The near-wall
turbulence "intensities" were significantly greater than the center-
line values. Comparison of side and bottom wall profiles indicated that
the flow was nearly symmetric along the grain.
The upstream effects of the bypass on the flow seems to be signifi-
cant. It moved the reattachment point downstream (as determined by the
16
-- .. . . . . .:. . . . . .. . . . ... . . . . .. . .. m , * _ . _*_ . . . - , , ,~ -. -
mean velocity profiles), increased the required distance for the velocity
profiles to become flat, moved the peak centerline turbulence "intensity"
downstream, and also caused an increase in the turbulence "intensities"
for both near-wall and centerline positiotLs.
If centerline turbulence "intensity" affects the regression rate
pattern, the results indicate that a more rapid variation in regression
rate would occur along the grain for 502 bypass. it could also be
expected that the point of maximum fuel regression would take place
farther downstream for the bypass case. However, if near-wall turbu-
lence is dominant in its effects on the regression pattern no signifi-
cant variation would be expected between no bypass and 50% bypass.
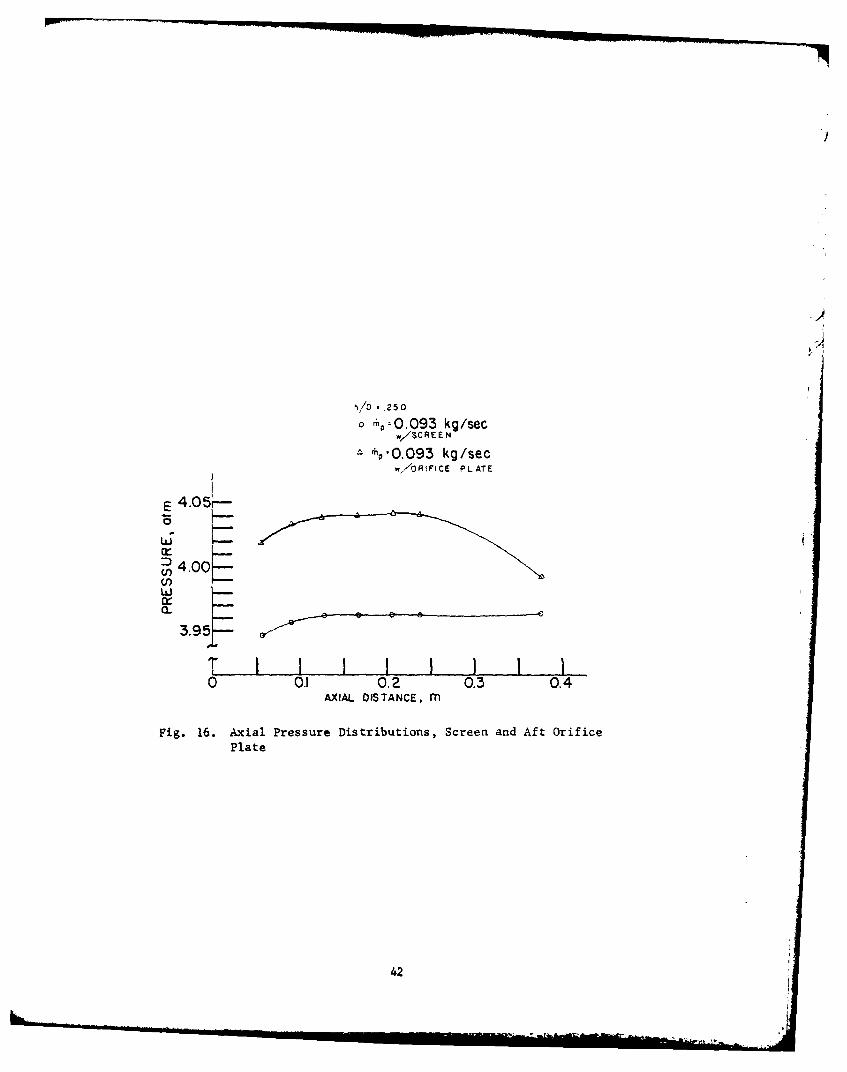
2. Large Inlet Diameter, w/Screen, (Configurations 5 and 6, Table I)
This test was conducted with a wire mesh screen attached to
the step inlet in order to examine the effects of inlet distortion/
turbulence intensity variations. Velocity profiles (Fig. 15) and
a pressure distribution (Fig. 16) are presented for the no-bypass
conditions.
The velocity profiles were almost identical to those with no screen;
showing only a slight decrease in maximum velocity at the inlet. The
screen did not seem to have any effect on the reattachment point location
or the mean velocity profiles.
The pressure distribution (Fig. 16) also exhibited the same
characteristics as the inlet without the screen.
The effect of the screen was readily noticeable in the turbulence
"intensity" measurements (Figs. 17-19). The location of the peak
centerline "intensity" was the same, but the value was much greater.
17
4k& A -tMM*
Since the average velocity (U) was nearly the same with or without
the screen, the fluctuating velocity values (u') were much greater
As for the inlet without the screen, the peak near-wall "intensities"
occurred farther upstream than the peak centerline "intensities."
The screen had little effect on the magnitude of the bottom wall
"intensities" but decreased the side wall values.
The screen apparently introduced increased centerline turbulence
without significantly affecting the mean flow characteristics or the
near-wall turbulence.
3. Large Inlet Diameter, w/aft Orifice Plate (Configurations 8and 9, Table I)
In this series of experiments a small diameter orifice plate
was placed at the rear of the grain. This geometry should provide
increased mixing of the fuel vapor and air within the aft end of the
fuel port.
The wall static pressure data used to construct the velocity
profiles showed large fluctuations, and a drop in mean pressure at the
aft end of the grain where the flow accelerated through the small orifice.
The mean velocity profiles within the fuel grain were the same as with-
out the plate (Fig. 16 and 20). The aft-end flow restriction apparently
caused large scale oscillations in the flow within the entire fuel grain.
The mean location of the reattachment point appeared to be unchanged.
A difference was noted in the aft mixing chamber, as expected, since the
inlet flow area was reduced by the presence of the plate. Near the grain
exit and into the aft mixing chamber, the velocity increased and a large
aft recirculation zone was generated.
18

The centerline turbulence (Fig. 21) was also affected by the
installation of the plate. The turbulence "intensity" without bypass
did not peak and then drop off as it did without the plate. The values
increased to a slightly higher value and remained nearly constant.
The bypass condition showed a great increase in turbulence "intensity"
within the fuel grain, indicating again that the fluctuating velocity u')
was much greater.
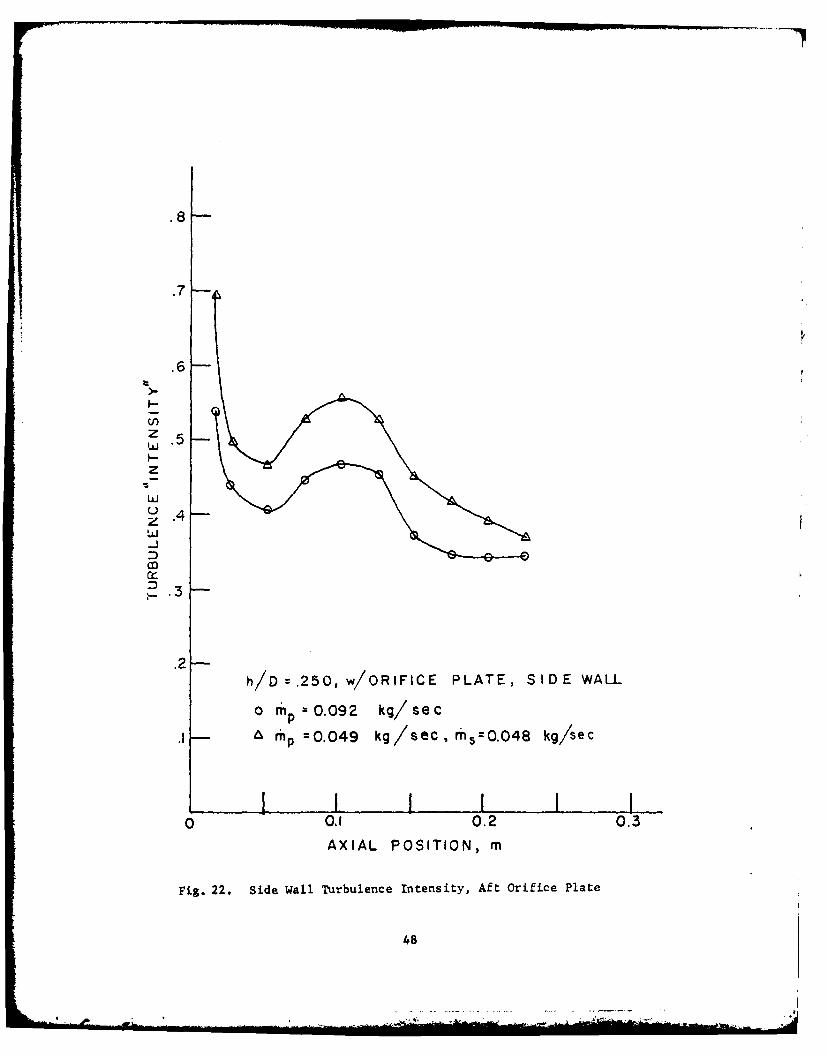
The near-wall turbulence "intensity" profiles (Figs. 22 and 23) were
nearly the same with and without the orifice plate, with peak "intensity"
occurring at about 0.102m. It is interesting to note that the wall
measurements showed the turbulence "intensity" to drop off after the
peak value whereas the ceaterline values did not. The near-wall
"intensity" values were very similar in magnitude and profile with
and without the aft orifice plate. These data indicate that the effect
of the plate on the higher frequency turbulence might be confined to
the core of the flow and to the aft mixing chamber. As noted above,
very low frequency mean velocity oscillations were introduced in the
flow by the aft orifice plate. Thus, increased bulk mixing occurred
throughout the fuel port and increased centerline turbulence occurred
in the flow at the aft end of the fuel grain where the boumdary layer
is thick. This behavior could indicate that the orifice plate may
increase fuel regression rate near the aft end and also may increase
combustion efficiency. However, if near-wall turbulence dominates the
regression rate behavior, very little regression rate changes would be
observed.
19
uiUlrf•t,

4. Small Inlet Diameter (Configurations 3 and 4, Table I)
Figures 24 and 25 depict the velocity profiles obtained with
and without bypass, respectively. Both conditions of air flow exhibited
similar profiles with flow reattachment occurring between 0.089 and
0.127m. Reattachment location has been shown previously to be a
function of step height 5 . It was not possible from this data to locate
a more precise position. Later measurements in the motor, with the
thrust stand mounted air inlet configuration, indicated a reattachment
point at 0.122m without bypass and 0.109m with bypass. Bypass did
not cause the large scale recirculation effects on the velocity profiles
within the fuel grain as it did with the large diameter inlet. The
"profiles" in the aft mixing chamber apparently represent large scale
recirculation in this region, with or without bypass. This is a marked
deviation from the results of the experiments using the larger inlet.
The axial pressure distributions (Fig. 26) show the same general
characteristics as obtained with the large inlet. These results indi-
cate that bypass has more upstream effects on the large diameter/lower
velocity inlet, but that the aft mixing region is more unsteady with
the small diameter inlet.
Centerline and near-wall turbulence "intensities" are shown in
Figures 27 through 29. The general characteristics of the centerline
"intensity" profiles were in agreement with that from the large inlet.
The magnitudes of the centerline "intensities" were considerably
greater, as might be expected from the higher shear forces in the for-
ward region. Without bypass, the peak centerline "intensity" occurred
further upstream, very near flow reattachment. The introduction of the
20

bypass air flow increased the values of the "intensity", especially
in the aft portion of the grain, and the values were much higher than
with the large inlet. The highest value of centerline turbulence "inten-
sity" with bypass occurred downstream of the flow reattachment and the
location where the pressure leveled off.
Near-wall turbulence "intensities" were smaller with the smaller
inlet and the peak values occurred further downstream. Bypass did not
affect the location of the peak near-wall turbulence.
Higher centerline values and lower wall values, as compared to the
larger inlet diameter, can be explained by the movement and location
of the eddies created by the interface between the core flow and the
recirculation region. The eddies formed are closer to the centerline
with the small inlet and are of greater intensity initially. This
could explain the occurrence of the peak centerline "intensity" closer
to the head-end, and the greater value without bypass air. Apparently,
the larger initial eddies are dissipated rapidly as they approach
the wall, since near-wall turbulence "intensity" was lower with the
smaller inlet.
The effects of these data on the expected fuel regression rates
and regression pattern depends upon whether centerline or near-wall
turbulence "intensity" (or both) is more significant. If regression
rate is a stronger function of centerline turbulence "intensity" the
position of highest regression could be expected to occur at the aft
end of the grain when bypass air is introduced. If near-watl "inten-
sity" is predominant, the maximum regression rate would occur at about
midgrain. The downstream shift of peak near-wall turbulence "intensity"
21

with increasing h/D is in agreement with reattachment and regression
rate behavior.
The turbulence data shown in Figures 27, 28 and 29 were obtained
with an axially directed and straightened flow entering the fuel inlet
dump (Fig. 1). Also shown on Figures 27 and 28 are turbulence profiles
obtained with rapidly turned, 900 opposed dumps upstream of the fuel inlet
dump (Fig. 2). The latter geometry is seen to significantly increase
both centerline and near-wall turbulence levels. The peak in the center-
line turbulence profile was shifted downstream. However, the near-wall
turbulence profile was not affected.
5. Small Inlet Diameter, v/Screen (Configuration 7, Table I)
The results obtained with the screen on the small diameter
inlet with bypass were somewhat different from those obtained when the
screen was attached to the large diameter inlet. Centerline turbulence
increased to very large values and peaked near the aft end of the fuel
grain (Fig. 30) as it did without the screen (Fig. 27). The location
of the maximum near-wall turbulence "intensity" moved upstream to
aproximately 0.10m. The location of the flow reattachment (approxi-
mately O.109m) was not significantly affected by the screen.
6. Circumferentially Grooved Fuel Grain (Configuration 13, Table I)
Since earlier data have indicated that alternate fuels may
not provide improved performance in conventional centrally perforated
fuel grains, a fuel grain modification to enhance near-wall mixing was
investigated. Circumferential grooves were cut into the PMM fuel grain
in order to disturb the boundary layer and to somewhat increase the
fuel-air mixing in the reaction region (Table I).
22

The mean velocity profiles and reattachment points were not signifi-
cantly different from those obtained without the grooves. Figures 30 and
31 present the non-reacting flow turbulence profiles for identical grain
inlet flow conditions with and without the enhanced near-wall mixing.
The grooves increased near-wall turbulence over much of the forward part
of the fuel grain and increased the centerline turbulence in the aft
portion of the fuel grain.
B. REACTING FLOW EXPERIMENTS
A total of 28 firings were conducted, all with PMM fuel grains having
a nominol length of 0.305m (12 in.). Nominal ignition and run times
were 3 seconds and 45 seconds respectively.
Calculated values of regression rate and temperature rise efficiency
based on pressure are presented in Table II. Since all tests were conducted
using a fixed fuel grain length and total air flow rate, the equivalence
ratios for the bypass tests were considerably less than for nonbypass tests.
23
- -

a * S - -~ .J 0
1K!. N 3 .4 -~ N
a . * 4U - * a - - .4 0
* a - s 4 .4
.4 . S~ . - .4 * C
- 4 Si V3a
* 0 - 3 0 -~ U
1*5 4 -. 3 3- a N 0* a - id . U
- ~ 0 4
0 - 0.4 0 . * 3.;
.4 3- N ~ 0 .4* . - .4- C C 4 . -
* C - 4 .4
* - - 0 0, 4 0 - p.
lU .i -~ * .4 C 4bE * a .4 -* . - 4 .4
0 4a ~ ~ S- - 3- .4 ,- 4.
p .4 *3
* 9 .~ -~ .4
- 2 ~4 S4.- 0 4 3- 4
- U - 4 . 4a - i 5
4' 4' '~ 4
0 .4. N
9 a 2 ~ 24 0 - 3- ~ 4 ~
- 0 0 * .0a
- 2 -~ ~
V. 4' - C - 0 -- s~ 0, .4 0 .~ *o a.4 4
. .. ~ a -4 V ~ ; a.- C 0 . .4
~ .4 0U
3.1 4 .4.4 *4
4.4 ..J 4. - a . 4 . 3.; ~
- - 0
7 4 .4 - 3-* . - - 4 .4
8 0 * . . 4
- 3- -, -.4 *0
- a a. . .~ ~
a - ~ N 3- 4 44' .3, - 0* 4U - a a ~ * 43 . .4 N
a.4' C .4 1 .4
a a * -- 0 N w - 0 4
4 4 -3 .3. - -~ ~ -a a * N * . N- - 0 .4 N
N N C ~
N C N
9 a - I 3.; 23 0 .4
o . - . .4
* 0 - I - 3 0
.4 3 5 S -S
9a- m
a.0. 3- 4 NS 0 4
0* . a - U .4 ~
3 4 N ~ 4 0
.4 4 4 . 4
a - ~ .4 33 0 0
a - I *
2 -~ 344
9 0 -
I -*=~ .~
-. - 3 1 *s .5
~ -. .4.i *~ .1 ~ b
24

1. Small Inlet Diameter (Configurations 3 and 4, Table 1)
As expected with this type of axial inlet, the regression
pattern was circumferentially symmetric at all points along the grain.
This was true for all firings accomplished. The non-bypass point of
maximum regression (Fig. 32) was located at approximately 0.13m from
the head-end. From the cold flow data for the same geometry (Figs. 27,
28-solid symbols), this peak occurred near the peak in near-wall turbu-
lence "intensity".
The firings with 50% bypass produced efficiencies approximately
8 points lower than the non-bypass results (fixed grain length and tctal
air flow rate). However, the point of maximum regression rate was um-
changed (Fig. 32); also in agreement with the near-wall turbulence behav-
ior. The regression rate did not decrease as rapidly from the maximum
point to the aft end compared to that for the non-bypass conditions.
The cold flow centerline turbulence (Fig. 27) continued to rapidly
climb in the aft portion of the grain. If centerline turbulence affects
the wall regression rate, the latter would be expected to continue to
increase with axial distance. Bypass did cause the near-wall turbulence
25

to level-off toward the aft end of the fuel grain (Fig. 28). Near-wall
turbulence intensities were also slightly higher for the case with
bypass. These results indicate that near-wall turbulence "intensity"
better correlated with regression behavior than did centerline turbu-
lence "intensity". This could be expected since the fuel layer is
quite thin and the flame is normally located very near the wall. Turbu-
lence/mixing within the hot gas core apparently has little effect on
the fuel regression rate.
2. Small Inlet Diameter, w/Screen. (Configuration 7, Table I)
The test with no bypass air flow would not sustain combustion.
Combustion was attained for the case of 50% bypass. For cold flow,
the screen was observed to significantly increase the centerline
turbulence intensity. This amount of turbulence apparently greatly
affected the mass transport of air into the recirculation region. This
could possibly cause the normally fuel rich recirculation zone to be
saturated with air, thereby quenching the combustion reaction. The
reduction of the air inlet velocity (mean and fluctuating component)
with the use of bypass was apparently enough to allow the flameholder
to sustain combustion in the grain.
Use of the inlet screen resulted in a slight increase in efficiency
for those tests with nominal flowrates. Two tests (14 & 15) with low
or high air flow rates did produce significantly higher efficiencies.
The inlet screen had no noticeable effect on the average regression
rate of the fuel grain (Table II). However, there was a large differ-
ence in the location of the point of maximum regression. This was
located at approximately 0.07m (vs. approximately 0.13m with no screen)
26

from the head-end and w'as more sharply defined than the case without the
screen (Fig. 32).
The upstream movement of the position of maximum regression rate and
the decreased regression rate near the aft end of the grain was again in
good agreement with the behavior of the near-wall turbulence distribution
(Fig. 31).
3. Small Inlet Diameter, w/Aft Orifice Plate, (Configurations 10and 11, Table 1)
The inclusion of the smaller diameter aft orifice plate did not
appreciably change the performance of the ramjet motor in either the
non-bypass or bypass flow conditions as compared to the motor with the
larger diameter orifice plate. One test (No. 18) had very low efficiency.
4. Circumferentially Slotted Fuel Grain (Configuration 13. Table I)
Only two tests were conducted with this configuration. The
increased fuel-air mixing near the fuel surface significantly increased
the fuel regression rate (Table II) but did not affect the combusticn
efficieny. Too much mixing can quench chemical reactions and decrease
combustion efficiency and too little mixing can reduce combustion efficiency
by allowing excessive unburned fuel vapor/carbon to enter the aft mixing
chamber.
Regression rate profiles with and without the grooves are presented
in Figure 32. The grooves did not affect the position of the maximum
regression rate but did slightly increase the profile in the forward and
aft portions of the grain. This behavior corresponded more nearly to the
near-wall turbulence profile (Fig. 31) than to the centerline turbulence
profile (Fig. 30). Apparently, the grooves provided increased fuel sur-
face area but did not significantly affect the diffusion flame zone.
27
... .. . .... . . . .... .... .. . . . - -...
5. Centrally Located Orifice Plate in Fuel Grain (Configuration
14, Table I)
In order to compare the effects of large scale mixing to those
obtained with near-wall mixing, a fuel grain was modified to include
an orifice plate midway in the grain. Although the resulting fuel
regression pattern was very non-uniform (high regression near orifice
plate), no significant change in average regression rate or combustion
efficiency was obtained (although test No. 26 did have lower efficiency).
6. Enlarged Forward End of Fuel Grain (Configurations 15 and 16,Table I)
Another means of increasing mixing and at the same time
decreasing grain inlet flow velocity is to enlarge the inlet dump
and initial fuel grain diameters (to maintain an adequate area ratio
for flame stabilization). Test 27 (Table II) utilized an enlarged
inlet diameter with a length approximately equal to the recirculation
zone length. Test 28 (Table II) used a significantly longer enlarged
inlet region. Both tests resulted in significantly reduced fuel
regression rates. Combustion efficiency was not significantly affected
in Test 28. The high value obtained in Test 27 may be misleading since
large amplitude combustion pressure oscillations were present.
7. Combustion Pressure Oscillations
The peak-to-peak amplitude of the pressure oscillations are
typically less than 3% for the non-bypass conditions. This was also
true for the grooved fuel grain. All tests with bypass had signifi-
cantly greater pressure oscillations. The frequency and/or amplitude
could not be determined precisely because of the recording speed and
28
the line length connecting the motor to the pressure transducers.
In similar tests, Mady 6 reported the frequency to be about 150 Hz. and
the amplitude to be approximately 20% of chamber pressure in the bypass
configuration. The magnitude of the oscillations observed in the
present tests were approximately 10% of the chamber pressure. This
behavior appears to be linked to the interaction of the bypass air
with one of the shear layers (exiting the fuel grain or at the air
inlet). The smaller aft orifice plate also caused an additional
characteristic. Combustion oscillations occurred periodically (approx-
imately every 6 seconds) for short periods of time. This showed up
as small peaks in the pressure and thrust-time traces.
When the forward end of the grain was enlarged for a length
approximately that cf the recirculation zone, small amplitude (3% of PC)
oscillations transitioned to larger (10% of P) amplitudes after 20 sec-
onds of burn time. When the enlarged diameter was lengthened to be
greater than the recirculation zone length, the pressure oscillations
began at a low amplitude (5% P c) and increased gradually (to 10% PC )cpuntil shutdown (at 45 seconds burn time).
These data indicate that combustion pressure oscillaticns can
occur In solid fuel ramjets as a result of induced disturbances to
the fluctuating shear layers at the fuel grain and aft mixing chamber
inlets. Further studies of this phenomena are currently being conducted.
29
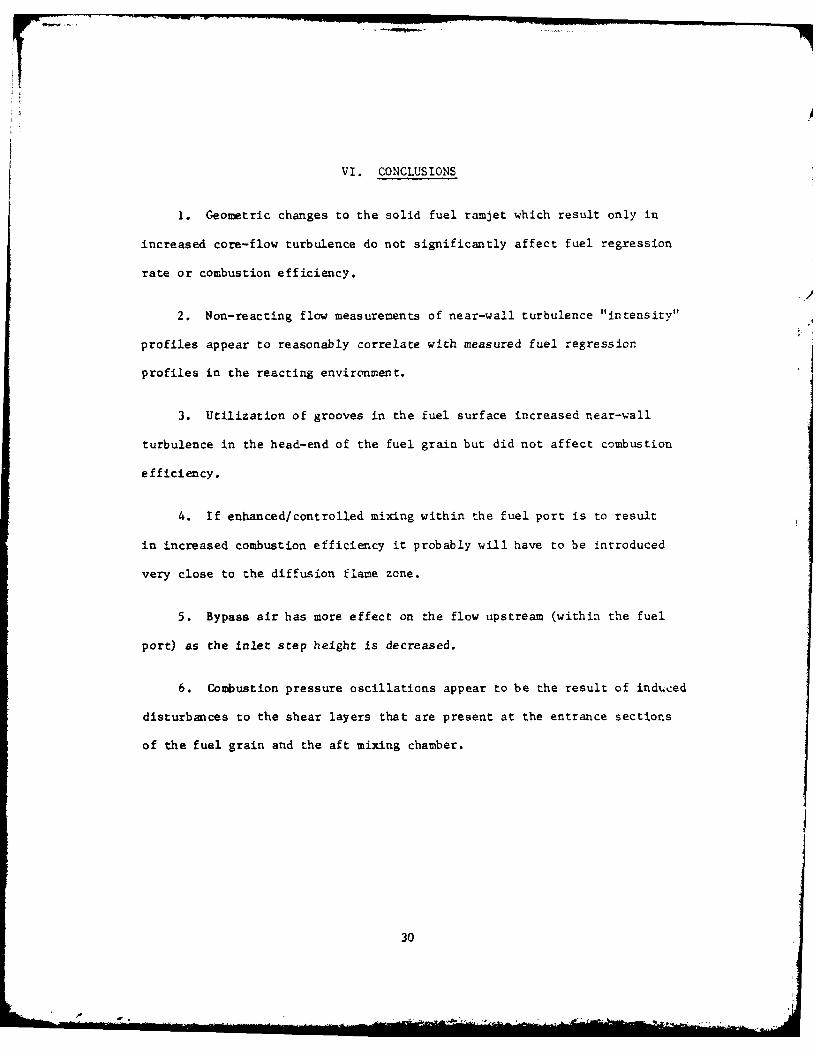
VI. CONCLUSIONS
1. Geometric changes to the solid fuel ramjet which result only in
increased core-flow turbulence do not significantly affect fuel regression
rate or combustion efficiency.
2. Non-reacting flow measurements of near-wall turbulence "intensity"
profiles appear to reasonably correlate with measured fuel regression
profiles in the reacting environment.
3. Utilization of grooves in the fuel surface increased near-wall
turbulence in the head-end of the fuel grain but did not affect combustion
efficiency.
4. If enhanced/controlled mixing within the fuel port is to result
in increased combustion efficiency it probably will have to be introduced
very close to the diffusion flame zone.
5. Bypass air has more effect on the flow upstream (within the fuel
port) as the inlet step height is decreased.
6. Combustion pressure oscillations appear to be the result of induced
disturbances to the shear layers that are present at the entrance sections
of the fuel grain and the aft mixing chamber.
30
* - a * ,.

41EAO ENO STE PAEMr !N SEIRT BYPASS AFT
ASE8YFUEL A IR MIXER
AIR
Fig. I Schematic of Solid Fuel Ramjet
AIR
AIR
Fig. 2 Schematic of Air Inlet System for Engine on Thrust Stand
31
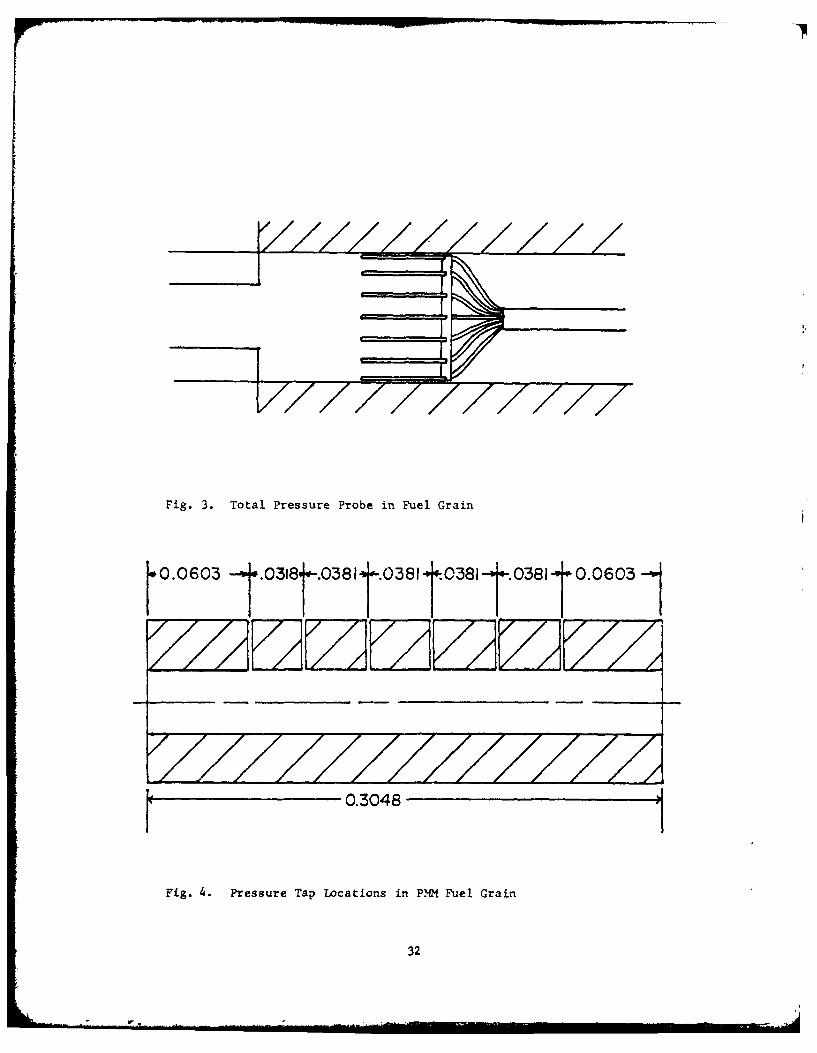
Fig. 3. Total Pressure Probe in Fuel Grain
S0.0603 O.3 8t~. 381I.0[. 38 {O38 1i..j. 38 jIb0.06031
0.30481
Fig. 4. Pressure Tap Locations in PNM Fuel Grain
32

Fig. 5. Centerline Hot Wire Probe
Fig. 6. Near-Wall Hot Wire Probe
33

34

Jn
!I - co CO,-
1 ._ _ _ _
--- ^ "
LOO
I ';4
00
:___ "__ ________-___"_____ p------------ .. ... 7." " "T . --. k' ,I -0 - --- - "--
---- h-------------- 0.o
CVu
-- 0 -
LO5
____ ____ 1
10 ~ .
- - -
z ON_____ 0 0
_____ ____* -4)
____2 __ ____ _ In
IT IT%nJ
35~

3-
X/D -
01 02 0.3 04h/ 0
- KRALL- SPARROW Maxim'um h~eat transferRAM.JET MODELPHANEUF-NETZER 10% Blowing
- - - - PHANEUF-NETZER No Blowing...... BOAZ-NETZERs Water injection
Fig. 10.- Reattachment Locations for Axisymmetric Flows(Fig. 7 from Ref. 7)
36

.- Mow
3.85-
30-
0 3.00- .25o
u7 - n0.090 kg/sec- p.047 , .046
3.75'w
n I I I I I I I0 0.1 0.2 0.3 0.4
AXIAL DISTANCE, M
Fig. 11. Axial Pressure Distributions, h/D 0.250
37
TW

4 f,
.E
E
LO 0 -
a.
CL CL
E E4
N~l-0
kiIS~i~l, 303-in~in.00
38-

.8
.6-
z
w.4zLaJ
-j
-. 3
.2- h/D:.250, SIDE WALL
o m p 0.091 kg/sec
a mp 0.048 ms rn 04
0 0.1 0.2AXIAL POSITION, M
Fig. 13. Side Wall Turbulence intensity, hID = 0.250
39

.8
.7
.6
I-
.5LUJ
zw
04
3
h/D :.250, BOTTOM WALL
0Omp 0.091 kg/sec
6 MY 0.048 ,~ =3 0.047
0 0.1 0.2AXIAL POSITION, m
Fig. 14. Bottom Wal. Turbulence Intensity, hID 0.250
40

I -
If-" , - -' - eJ -
h
II
I '4
0 -1
h • -
I .. _ , : . ... ,, ,_ .... . .. . .. .. ,. ... . ,~k. ..... ,, ,,, , . .,. :., . ,
h/0 250
*mp-O.09 3 kg/sec
w/SCREEN
* n-0.093 kg/secw/ORiFiCE PLATE
w(=) 4.00o
0
3.95-
T 1 -1 ! I I i0 0.1 0.2 0.3 0.4
AXIAL DISTANCE, m
Fig. 16. Axial Pressure Distributions, Screen and Aft Orifice
Plate
42

.44
.3 .-
z
h/D=.250 w/SCREEN
0 o =0.093 kg/se c
6 ni =0.047 kg/sec, mns=0.O46 kg/sec
0 0.1 0.2 0.3 0.4
AXIAL P0SITION~m
Fig. 17. Centerline Turbulence Intensity, Inlet Screen
43

.81
.7
.6
LU
h/D .250, w/SCREEN, SIDE WALL
.1 ~ m Zn :.093 kg/sec
A' 2 0.048 kg /se c, ms 0.048 kg/sec
0 0.1 0.2 0.3AXIAL POSITION, m
Fig. 18. Side Wall Turbulence Intensity, Inlet Screen
44

.8|
.7
.z 5
. .
.-
0
.--
.2
h/D :.250, w/SCREEN BOTTOM WALL
. 0 mp = 0.093 kg/sec
A mp =0.048 kg/sec, rns =0.048 kg/sec
! Ii i0 0.1 0.2 0,3
AXIAL POSITION, m
Fig. 19. Bottom Wall Turbulence Intensity, Inlet Screen
45

U-3t
0
o6 -jII
-44
'0-iw N
-0
0 --
U-J
f~Izc4Z ~z~46

.8
.7
.6
z
Li
-!.
CUQ:.3
.2
h/D.250 w/ORIFICE PLATE
0 m p-0.093 kg/sec
a mY 0.047 kg/sec, ris=0.046 kg/sec
I I !, I I I I !0 0.1 0.2 0.3 0.4
AXIAL POSITION, m
Fig. 21. Centerline Turbulence Intensity, Aft Orifice Plate
47 1*
.8
.7
ZI
.6
.4-
C--
L&J
C13
.3
h/D .250, w/ORIFICE PLATE, S I DE WALL
0 rnp =0.092 kg/Se c
.1 flip =0.049 kg/sec M' S=0.048 kg/sec
0 0.1 0.2 0.3AXIAL POSITION, m
Fig. 22. Side Wall Turbulence Intensity, Aft Orifice Plate
48
.7
.6
z .5
z
c-).4z
-j
.23
h/D =.250, w/ORIFICE PLATE, BOTTOM WALL
0 mv =0.092 k/ se c
1 MA pn =0.049 kg /sec, M. S0.048 kg/sec
0 0.1 0.2 0.3AXIAL POSITION, m
Fig. 23. Bottom Wall Turbulence Intensity, Aft orifice Plate

I =IT
-, I--- , -- -----------------0% -0
0 2-
__ __ __ _ I
C4u
10 u004
lC--u-- -t - -- ---l- _ 4-,, C" I -"
000
'-4 CCM
4 ell
LA M
so~
4.10
- 4.05
(nl 4.00. /1 -10 3 33 k/e0, p .094kgse
w~a.~ ~ ~ m . 0 49 , - 0. 048
1r I - I0 UI 0-2 0.3 0.4
AXIAL DISTANCE, M
Fig. 26. Axial Pressure Distributions, hID =0.333

.8
.7
.6
z
z
Z .4
-j
-. 3
o mnp 0.091 kg/seca m~ 2O.046 , mn8 = 0.045 kg/sec
SOLID SYMBOLS - INCREASED INLETTURBULENCE
0 .05 .0 .15 .20 .25 .30 .35 .40 .45
AXIAL POSITIOIN, M
Fig. 27. Centerline Turbulence "Intensity", hID -0.333
52
Awl-.

.8
.7
.6-
z .
z
wi
zLi-JD
.2-
0o rn=0.092 kg /sec
mp=0.048, fn 0.047 kg/sec
I - I -I I - - I -0 0.1 0.2 0.3
AXIAL POSITION, m
Fig. 28. Side Wall Turbulence "Intensity". hID 0.333
53

.7
.6
F-
z .LUI
Z
.--
co
Lii
.2-
0 mp 0.092 kg/sec
.1 A mp-O.048, rm =0,047kg/sec
SOLID SYMBOLS- INCREASED INLET TURBULENCEI I I I
0 0. 0.2 0.3AXIAL POSITION, m
Figure 29. Side wall Turbulence "Intensity',' h/D - O.333
54
4.. ... .

0.6
w 04-
0.3 1
w 1~0.2 0 NO BYPASS
-1 3"0 NO BYPASS, GROOVED
0-1A BYPASS, INLET SCREEN
~0
0 .04 .08 .12 .16 .20AXIAL DISTANCE, m
Fig. 30. Centerline Turbulence "Intensity" Profiles
0.8
0.7-
W0.6
z- 0.5
zCNO BYPASS
Co o~p 0 NO BYPASS, GROOVEDABYPASS, INLET SCREEN
~0.1
011 1 1 110 .0.4 .08 .12 .16 .20
AXIAL DISTANCE, mFig. 31. Near-Wall Turbulence "Intensity" Profiles
55
0.9 - -N1.0-
~O.9 /NON-BYPASS
... NON-BYPASS, GROOVED.-- BYPASS
0.8 BYPASSSCREEN
'. I....I i.... ! I I I I I I 1 I0 .05 .10 .15 .20 .25 .30
AXIAL DISTANCE, m
Figure 32. Fuel Regression Rate Profiles
56
VII. REFERENCES
1. Netzer, D. W., "Modeling Solid-Fuel Ramjet Combustion," JSR, Vol. 14,No. 12, Dec. 1977, pp. 762-766.
2. Netzer, D. W., "Model Applications to Solid-Fuel Ramjet Combustion,"JSR, Vol. 15, Sept-Oct. 1978, pp. 263-264.
3. Stevenson, C. A. and Netzer, D. W., "Primitive-Variable Model Appli-cations to Solid Fuel Ramjet Combustion," JSR, Vol. 18, No. 1,Jan-Feb., 1981, pp. 89-94.
4. Boaz, L. D. and Netzer, D. W., "An Investigation of the InternalBallistics of Solid Fuel Ramjets," NPS Report NPS-57Nt73031A,March 1973.
5. Phaneuf, Jr., J. T. and Netzer, D. W., "Flow Characteristics inSolid Fuel Ramjets," NPS Report NPS-57Nt74081, May 1974.
6. Mady, C. I., Hickey, P. J., and Netzer, D. W., "An Investigationof the Combustion Behavior of Solid Fuel Ramjets," NPS FeportNPS-67Nt77092, Sep. 1977.
7. Mady, C. J., Hickey, P. J., and Netzer, D. W., "Combustion Behaviorof Solid Fuel Ramjets," JSR, Vol. 15, No. 3, May-June 1978, pp. 131-132.
8. Hewett, M. E. and Netzer, D. W., "Application of Light ExtinctionMeasurements to the Study of Combustion in Solid Fuel Ramjets,"NPS Report NPS-67-78-008, Nov. 1978.
9. Hewett, M. E. and Netzer, D. W., "Light Transmission Measurementsin Solid Fuel Ramjet Combustors," JSR, Vol. 18, No. 2, March-April1981, pp. 127-132.
10. Burdette, W. and Reed, R., Jr., "Navy High Energy Solid Ramjet FuelProgram," 1979 JA1NNAF Propulsion Meeting, Anaheim, Ca, 5-9 March 1979.
11. Schadow, K. C., "Solid Fuel Ramjet Evaluation," 16th JANNAF CombustionMeeting, Monterey, CA, 10-14 Sep. 1979.
57
--La

INITIAL DISTRIBUTION LIST
No. of Copies
1. Library, Code 0212 2Dean of Research, Code 012 2Naval Postgraduate SchoolMonterey, CA 93940
2. Department of AeronauticsCode 67Naval Postgraduate SchoolMonterey, CA 93940
Prof. M. F. Platzer, Chairman 1
Prof. D. W. Netzer 15
LT W. E. Scott 2CAPT B. A. Binn 2
3. Defense Technical Information Center 2Attn: DDC-TCACameron Station, Bldg. 5Alexandria, VA 22314
4. Naval Air Systems Command 2Washington, D.C. 20361
AIR-330
5. Naval Weapons CenterChina Lake, CA 93555
Tech. Library, Code 753 3F. Zarlingo, Code 3246 3K. Schadow, Code 388 1W. Burdette, Code 3244 1
6. Chemical Systems DivisionUnited TechnologiesP.O. Box 358Sunnyvale, CA 94088
Tech. Library IR. Dunlap I
A. Holzman IG. Jensen IP. Willoughby 1P. LaForce I
7. Chemical Propulsion Information Agency 2
APL-JHUJohns Hopkins RoadLaurel, MD 20810
8. AFAPLWright-Patterson AFB, OH 45433
R. D. Stull 258