factors affecting ev adoption: a literature review...
TRANSCRIPT

Factors Affecting EV Adoption: A Literature Review and EV Forecast for
Hawaii
Dr. Makena Coffman Dr. Paul Bernstein
Sherilyn Wee University of Hawaii, Economic Research Organization
for
Hawaii Natural Energy Institute, University of Hawaii at Manoa
1680 East West Road, POST 109 Honolulu, HI 96822
E-mail: [email protected]
Submitted to: Dr. David Block
Florida Solar Energy Center University of Central Florida
1679 Clearlake Road Cocoa, FL 32922
Report Number: HNEI-04-15 April 2015
The contents of this report reflect the views of the authors, who are responsible for the facts and the accuracy of the information presented herein. This document is disseminated under the sponsorship of the U.S. Department of Transportation’s University Transportation Centers Program in the interest of information exchange. The U.S. Government assumes no liability for the contents or use thereof.

Factors Affecting EV Adoption: A Literature Review and EV Forecast for Hawaii
Executive Summary Electric Vehicles (EVs) reduce or entirely negate gasoline or diesel use in the vehicle itself through integration with the electric grid. Plug-in Hybrid Electric Vehicles (PHEVs) can draw from a battery as well as liquid fuel. Battery Electric Vehicles (BEVs) are solely powered through electricity. Both provide the opportunity for power-sharing with the electric grid and can potentially ease the integration of sources of intermittent renewable energy. EVs are also a potentially important technology to help reduce greenhouse gas (GHG) emissions, local air pollution, and vehicular noise. In recognition of these benefits, the U.S. in 2009 set a goal of putting one million electric vehicles (EVs) on the road by 2015. As of the end of 2014, approximately 290,000 EVs have been purchased in the U.S. About 3,000 of those are in Hawaii which makes it one of the highest, along with California, in shares of new BEV sales in the country. This paper provides a review of studies on the factors that affect EV adoption. These factors are organized as internal and external factors, meaning characteristics of the EV vehicle itself and those that are out of the direct control of EV car manufacturers. Internal factors include battery costs, purchase price, driving range, and charging time. External factors include fuel prices, policy incentives, consumer characteristics, availability of charging stations, travel distance, public visibility, and vehicle diversity. Policy mechanisms available to support EV adoption are also reviewed, including subsidies and other incentives, supporting infrastructure build-up and raising awareness. This report also discusses literature findings regarding the role these factors play in EV adoption – with an emphasis on impacts in Hawaii. Studies that develop forecasts of EV adoption over time are also reviewed and harmonized in this report. Focusing on the literature for diffusion models, a set of forecasts that represent low, reference, and high EV adoption were selected. Diffusion models estimate rates of technology acceptance based on technology cost decline, marketing and other social factors. Applying these literature-based forecasts to Hawaii-specific EV and car sales data, a preliminary forecast of potential EV adoption in Hawaii is provided. Estimates are that there will be 140,000 EVs on the road in Hawaii by the year 2040 in the reference scenario. In the low scenario, the estimate is 110,000 and, in the high scenario, 280,000. Future research will be conducted to better understand the uniqueness of Hawaii’s economy and geography and how it affects EV ownership cost and likely EV adoption over time.
2

Table of Contents
Executive Summary .................................................................................................................... 2
I. Introduction .............................................................................................................................. 4
II. Factors Affecting EV Adoption .......................................................................................... 5 Internal Factors ..................................................................................................................................... 5
Figure 1. Sample EVs Purchase Price in Comparison to ICE and HEV............................................ 6 Figure 2. Sample EVs Purchase Price over Time $2011 ......................................................................... 7 Figure 3. EV Driving Range and Purchase Price ...................................................................................... 8 Figure 4. EV Charging Time and Purchase Price .................................................................................. 10
External Factors ................................................................................................................................. 10 Table 1. EVs Available in the U.S. and Hawaii ...................................................................................... 14
Policy Mechanisms ............................................................................................................................ 15 Figure 5. Financial Incentives and EV Market Share by Country ...................................................... 16 Figure 6. BEV Consumer Benefit and EV Market Share by State .................................................... 17 Figure 7. PHEV Consumer Benefit and EV Market Share by State ................................................. 17
III. EV Adoption Rates Over Time ...................................................................................... 18 Agent-Based Models ......................................................................................................................... 19
Figure 8. Agent-Based Models for PHEV Penetration Rates ............................................................. 19 Consumer Choice Models ................................................................................................................ 20
Figure 9. Consumer Choice Models for PHEV Penetration Rates ................................................... 21 Diffusion Models ................................................................................................................................ 22
Figure 10. Diffusion Model Literature Annual PHEV and BEV Sales Forecasts ......................... 23
IV. Synthesizing EV Adoption Rates for Hawaii .............................................................. 24 Figure 11. Selected Diffusion Model PHEV and BEV Penetration Rates ...................................... 25
Developing Hawaii’s EV Forecast ................................................................................................. 25 Figure 12. Annual Vehicle Sales and New Hybrid & EV Retail Registrations ............................... 26 Figure 13. EV Penetration Rate Scenarios ............................................................................................... 27
Projecting New EV Sales in Hawaii .............................................................................................. 28 Figure 14. Hawaii EV Forecast ................................................................................................................... 29
V. Conclusion ............................................................................................................................ 29
VI. Acknowledgements ........................................................................................................... 31
VII. References ......................................................................................................................... 32
3

I. Introduction As part of the response to concerns over rising oil costs, energy security, and climate change, there is effort to promote energy efficient and alternative fuel vehicles. In the U.S., there have been increases in Corporate Average Fuel Economy (CAFE) standards as well as federal and state incentives toward hybrid electric vehicles (HEVs) and, more recently, plug-in hybrid electric vehicles (PHEVs) and battery electric vehicles (BEVs). PHEVs and BEVs, the focus of this study, are collectively referred to as electric vehicles (EVs). EVs reduce or entirely negate gasoline or diesel use in the vehicle itself through integration with the electric grid. PHEVs can draw from a battery as well as liquid fuel. BEVs are solely powered through electricity. Both provide the opportunity for power-sharing with the electric grid and can potentially ease the integration of sources of intermittent renewable energy (Richardson, 2013; Galus et al., 2010; Lund and Kempton, 2008). This is a potentially important technology to help reduce greenhouse gas (GHG) emissions, local air pollution, and vehicular noise (Brady and O’Mahony, 2011; Hawkins et al., 2013). In recognition of these benefits, the U.S. in 2009 set a goal of putting one million electric vehicles (EVs) on the road by 2015. This goal is far from being reached. As of the end of 2014, approximately 290,000 EVs have been purchased in the U.S (EIA, 2014a; EDTA, 2015). About 3,000 of those are in Hawaii (DBEDT, 2015). Hawaii has one of the highest, along with California, shares of new BEV sales in the country (Jin et al., 2014). Prior work suggests that EV adoption will be limited without closing the gap between EV and internal combustion engine (ICE) vehicle costs. Mechanisms include declining battery costs as well as policy measures such as increasing gasoline and diesel prices (perhaps from a tax) and direct subsidies (Eppstein et al., 2011; Shafiei et al., 2012; Sierzchula et al., 2014). The U.S. has provided substantial policy support to the development and deployment of EVs. For example, $2 billion was allocated in the 2009 American Recovery and Reinvestment Act for battery manufacturing projects, vehicle component production, construction of production facilities and demonstration projects (Carley et al. 2013). Between 2006 and 2013, there were $1,000 tax credits for installation of home chargers and up to $30,000 for businesses chargers (U.S. DOE, 2014a). There is also up to a $7,500 per vehicle consumer subsidy for qualifying EVs. Battery only EVs and extended range PHEV qualify for the full $7,500 tax credit while PHEVs more broadly qualify for $2,500 (IRS, 2014).1 The barriers to EV adoption are not solely financial. Through survey work across large U.S. cities, Carley et al. (2013) found that stated intent to purchase EVs is rather low largely due to range considerations. As such, additional factors such as the presence of a charging network will be critical to EV adoption (Sierzchula et al., 2014). In addition to federal goals and incentives, individual U.S. states offer a range of incentives. Hawaii, for example, offered a subsidy of up to $4,500 for EV purchase as well as support
1 The tax credit is based on the battery capacity such that for each additional kilowatt hour (kWh) beyond 5 kWh, an extra $417 is awarded on top of the minimum $2,500.
4

for residential charging stations for early adopters between 2010 and 2012 (US DOE, 2014b). Hawaii has also begun to create a public charging network by requiring that public parking lots with more than 100 spaces equip at least one stall with EV charging infrastructure. EVs can park free of charge at metered stalls and access carpool lanes. Despite widespread government support, most EV adoption rates have fallen short of initial goals. For planning and policy purposes, it is important to understand possible and likely EV adoption trends as well as mechanisms that more effectively affect rates of uptake. In this paper, studies are reviewed on the factors that affect EV adoption rates. Much of the recent EV literature draws upon the experience of HEVs and technology diffusion more broadly. EV adoption forecasts have been collected and harmonized, and this report provides literature-based forecasts for EV adoption in Hawaii. EV adoption forecasts were also reviewed in a similar manner to Al-Alawi et al. (2013) by grouping them by forecasting methodologies, including agent-based models, consumer choice models and diffusion rate models. Agent-based models focus on the interactions of individual decision-makers. Consumer choice models emphasize probabilistic outcomes of consumer behavior. Diffusion models estimate rates of technology acceptance based on technology cost decline, marketing, and other social factors. Using the diffusion model literature, this study presents three scenarios for EV adoption. This forecast serves as a first-cut to understanding possible EV adoption in Hawaii, where literature-based adoption rates are applied to a Hawaii-specific forecast on car sales over time. This report is organized as follows. Section II presents factors that affect EV adoption. Section III reviews studies that assess EV adoption rates over time. Section IV narrows these studies to the case of Hawaii and presents three possible EV adoption pathways. Section V provides concluding remarks including study limitations and plans for future work.
II. Factors Affecting EV Adoption The factors affecting EV adoption are organized as those that are internal to EVs, like battery performance and price and those that are external, such as fuel prices and charging stations, and the policy mechanisms that may influence adoption.
Internal Factors Internal factors, meaning those that are characteristics of the EV vehicle itself, which affect EV adoption, include battery costs, purchase price, driving range, and charging time (Sierzchula et al., 2014). EVs relatively high purchase price, limited driving range, and long charging time requirements are major impediments to EV adoption (Hidrue et al., 2011; Graham-Rowe et al., 2012; Carley et al., 2013). Purchase Price and Battery Costs EVs tend to be more expensive than their comparable ICE or HEV counterpart. Figure 1 below shows a sample of EV purchase prices in comparison to their comparable ICE and/or HEV. The base models of the Ford C-Max, Focus, Fusion and Toyota Prius are
5

showcased because the EV version is basically identical to the ICE/HEV in terms of body design. The shown average price paid is based on purchases in Honolulu for 2014.
Figure 1. Sample EVs Purchase Price in Comparison to ICE and HEV
Generally speaking, the ICE tends to have the lowest purchase price and the EV the highest. In the case of the Ford C-Max, Fusion, Focus and Toyota Prius, the EV version of the vehicle is substantially higher. The Ford C-Max is available in both an HEV and PHEV, where the PHEV is an additional $4,000. These are approximately equal when considering the federal subsidy.2 The Ford Fusion is available in an ICE, HEV, and PHEV, where the PHEV is an additional $13,000 more than the ICE and $6,000 more than the HEV. With a similar $4,000 federal tax credit, the difference between the PHEV and HEV is relatively small. The Ford Focus is available in an ICE and BEV, where the BEV is $10,000 more. The federal subsidy of $7,5003 closes this gap to within $3,000. The Toyota Prius PHEV costs about $6,000 more than the HEV – where the federal subsidy of $2,500 similarly closes the gap to within $3,000. Hidrue et al. (2011) found through a stated choice experiment that the median person would be willing to pay near zero for a BEV over a comparable conventional gasoline vehicle. In a 2011 survey done of consumers within 21 large U.S. cities, Carley et al. (2013) found that EV purchase price is the most dominant “major disadvantage” (with more than 50% of survey
2 The existing federal subsidy for PHEVs is equal to $2,500 plus $417 for a vehicle that draws propulsion energy from a battery with at least 5 kWh of capacity. Every additional kWh is given an additional $417 (IRS, 2014). 3 The existing federal subsidy for BEVs is $7,500. For both PHEVs and BEVs the credit will cease when a manufacturer has sold 200,000 qualifying vehicles in the U.S. (IRS, 2014).
6

respondents). Both of these surveys were administered prior to EVs entering the U.S. market in a notable way, meaning that there may have been less knowledge of EV characteristics. Nonetheless, industry surveys reviewed by Tran et al. (2013) similarly show that more than 63% of buyers cite purchase price as a large deterrent (in comparison to only 39% of HEV buyers). However, Hidrue et al. also found that there is still a market for EVs because consumers with the highest value for BEVs are willing to pay between $6,000 and $16,000 more than a comparable gasoline vehicle (in part due to love of technology and environmentalism; see consumer characteristics below). Because purchase price is heavily dependent on battery costs (Sierzchula et al., 2014), Hidrue et al. suggest that battery costs need to decline considerably (from 2011) if EVs are to be competitive within the U.S. without the federal subsidy. This trend is occurring. EV prices have generally declined since they were introduced to the market in 2011. For illustrative purposes, Figure 2 below shows the base manufacturer’s suggested retail price (MSRP) for the Chevrolet Volt, the Toyota Plug-in Prius, the Ford Focus BEV, the Nissan Leaf BEV, and the Mitsubishi i-MiEV. These are models that were introduced in the U.S. in 2011 and 2012. These prices exclude subsidies and are normalized to $2011.
Figure 2. Sample EVs Purchase Price over Time $2011
Since its introduction in 2011, the Ford Focus BEV MSRP has declined by nearly $10,000 in real terms. Similarly, the Chevrolet Volt PHEV has declined in MSRP by approximately $7,000 and the Nissan Leaf BEV approximately $5,000. Ultimately, the influence of purchase price on consumer vehicle purchase decisions must also be weighed with a full assessment of ownership costs, including fuel, maintenance, and depreciation costs as well as resale value. Driving Range
7

Carley et al. (2013) found that closely after price as an impediment to EV adoption is driving range. In their survey, over 70% of respondents say range is either a major disadvantage or somewhat of a disadvantage. The survey was done only within urban areas, so this lends itself to a group who would likely be less concerned with driving range than those in rural areas (see travel distance below) – thus underestimating the true concern of driving range among U.S. consumers. Similarly they also found that respondents show much more interest in buying a PHEV rather than a BEV to overcome this barrier (making the vehicle closer in performance to an HEV). Carley et al. found that of those identified as very interested in buying a BEV, only 22% are exclusively interested in BEVs. Of those identified as very interested in buying a PHEV, 60% are exclusively interested in PHEVs. Likewise, in a “vehicle design game” survey conducted in San Diego, California in 2011, Axsen and Kurani (2013) found that respondents most often design a vehicle related to a PHEV. BEVs are least popular, even under a scenario where they can drive up to 150 miles in range at no additional cost. They note that improvements in charging infrastructure may alleviate consumer concerns. In addition, Tamor et al. (2013) conclude through an EV cost-payback model for Minneapolis, with a particular consideration for trip chaining and range, that PHEVs will be more accepted than BEVs. Figure 3 below shows EVs available on the market, characterized by their driving range and price. For PHEVs, driving range is shown as both “all-electric” and “total range,” meaning the sum of the electric and gasoline drive. Cars are organized by average price paid (on the right axis), where the least expensive vehicles are on the left and most expensive are on the right.
Figure 3. EV Driving Range and Purchase Price
8

Without further statistical analysis, it is difficult to compare the value of driving range relative to other vehicle attributes. However, a graphical comparison is illustrative of the variety of ranges currently available on the market. The vehicle with the notably highest all electric range is the Tesla Model S BEV, which is also priced at the higher end of the cost spectrum. Other luxury vehicles, including the Porsche Panamera S E-Hybrid PHEV and the BMW i8 PHEV have a very low electric driving range. The Mitsubishi-MiEV BEV is the lowest cost EV on the market and has an all-electric driving range of 62 miles. The Ford Focus Electric BEV and the Nissan Leaf S BEV travel 76 and 84 miles, respectively. In Hawaii, due to its’ island geography, driving range may not however be as looming a concern. This is perhaps evidenced by the number of BEVs sold in Hawaii relative to PHEVs. In 2014, Hawaii’s new vehicle share of BEVs was about 1.2% in comparison to 0.3% for PHEVs (Jin et al., 2014). Tran et al. (2013) suggest through a simulation of consumer adoption that BEVs are likely to be more preferred than PHEVs, given adequate charging infrastructure. PHEVs may serve as a transition technology. Charging Time Charging time is potentially less severe of a disadvantage in comparison to driving range. In Carley et al.’s survey, a majority of respondents (almost 40%) said it was a “somewhat or a disadvantage.” Nonetheless, there may be strong willingness to pay for fast charging time. Hidrue et al. (2011) found that the average respondent is willing to pay nearly $6,000 to go from 10 to 1 hours charging time, and $8,500 to go from 10 hours to 10 minutes. Figure 4 shows EV charging time (normalized by hours per kWh) and average price paid, where cars are similarly organized by price as in Figure 3.
9

Figure 4. EV Charging Time and Purchase Price
The Mitsubishi-MiEV, the Nissan Leaf S BEV, the BMWi3 BEV and REX PHEV, and the Tesla Model S BEV are available in level 3, 440 volt “quick-charging” (shown in green). This dramatically decreases charge time (per kWh) and, at least visually, seems to have little bearing on price. Other models are standardly available with level 2, 240 volt, and level 1, 120 volt, charging.
External Factors External factors, meaning those that are out of the direct control of EV car manufacturers, that will affect EV adoption include: fuel prices, policy incentives, consumer characteristics, availability of charging stations, travel distance, public visibility, and vehicle diversity. Fuel Prices Fuel prices, both gasoline and diesel, are found to be the strongest predictors of HEV adoption (Diamond, 2009; Beresteanu and Li, 2011; Gallagher and Muehlegger, 2011) and would similarly affect EV adoption depending on the relative price of electricity (Hidrue et al., 2011). In an econometric study using both panel and cross-sectional data of HEV adoption between U.S. States, Diamond (2009) found that gas price had the strongest effect on market share, where a 10% increase in the average price of gas would result in a 70-90% increase in state hybrid market share (depending on the vehicle). In Hawaii, this effect might be dampened. In the continental U.S., the price of electricity is generally dislocated from the price of gasoline and diesel. Due to Hawaii’s dependence on oil for electricity, the price of electricity in Hawaii tends to move with the price of crude oil and, subsequently, gasoline
10

and diesel. As Hawaii switches toward non-oil sources of electricity, this relationship will diminish. Consumer Characteristics Consumer characteristics potentially affecting the purchase of EVs include education, gender, income, number/type of cars owned, level of environmentalism, and love of technology. Hidrue et al. (2011) found that being young or middle age, having a BA or higher degree, expecting higher gasoline prices in the next 5 years, being environmentally-sensitive, being likely to buy an HEV, having a place to install an EV outlet, being likely to buy a small or medium passenger car, taking at least one long drive per month, and having a tendency to buy new products on the market make a consumer more statistically likely to be “EV-oriented.” Diamond (2009) found that income is positively related to HEV market share in the U.S., however with mixed significance depending on the vehicle and model specification. Hidrue et al. (2011), on the other hand, found no evidence that higher income makes someone more likely to be “EV-oriented” and, in fact, found that income and being a multicar household both reduce the likelihood of being “EV-oriented.” This is contrary to prior work that assumed that being a multi-car household may help consumers overcome the barrier of limited driving range, because there would be a “backup” car. Early EV work often only surveyed multicar households (Hidrue et al. 2011). Whether a consumer is “environmental sensitive” is captured by a wide range of differing indicators within the literature. Hidrue et al. (2011) found that while pollution reduction is a valued attribute of EVs, it is valued considerably less than performance indicators. The authors found that people valued a 50% reduction in pollution (relative to a gasoline vehicle) by about $1,900 and a 95% reduction by $4,300. Sierzchula et al. (2014) found neither education, gender, nor environmentalism to be significant in determining EV market share within a country. In a survey of EV drivers in the UK, Burgess et al. (2013) found some evidence of a ‘green image’ effect on attitudes toward EVs. Moreover, studies suggest that a certain class of consumers will be early adopters regardless of cost or policy. The first consumers are willing to adopt new technologies are often willing to pay a premium (Rogers, 1995) because they want to have the latest technology and may be less risk averse. Carley et al. (2013) found in their survey that early adopters are likely to be highly educated and environmentally-sensitive, in addition to saying that they believe it is important for the U.S. to reduce dependence on foreign sources of oil. Owning an HEV is an additional indicator of adoption for an EV. Tran et al. (2013) found in surveys for the EU and U.S. that early adopters of BEVs tend to be male, between 18 and 34 years of age, well educated with high income, are environmentally-sensitive, already own a car, are interested in new technologies, sensitive to government incentives, and knowledgeable about fuel economy. In addition, in reviewing survey data, Tran et al. found that the profile of potential first movers is not substantially different from those categorized as “might be willing to consider” purchasing a BEV. Sierzchula et al. (2014) says that it is critical for there to be a large enough set of early adopters in order for other market forces to take hold, such as economies of scale. Part of the challenge facing the penetration of new technologies is that the further a new technology
11

is from the more conventional established one, the less a typical consumer is willing to pay (Sierzchula et al., 2014). This may be one justification for policy support early-on. On the other hand, early adopters are often categorized as having a love of new technology and thus may be likely to adopt the technology regardless. Santini and Vyas (2005) suggest separating early adopters from other consumers of alternative vehicles in regards to estimation of willingness to pay and likelihood of adoption in order to better understand long-term trends and impacts of policy. Travel Distance Due to EV’s potentially limited driving range, travel distance is critically important. This is often related to issues of urban form and thus urban density is used as a proxy for travel distance (as in Sierzchula et al. 2014). This is one reason why Carley et al. (2013) focus their survey work only within U.S. cities. As discussed within internal factors, the issue of travel distance is a characteristic in which PHEV and BEVs markedly differ. Though BEVs generally go further on the electric drive than PHEVs, BEVs clearly suffer from limited driving range and thus possible range anxiety. PHEVs, with the additional fuel-based engine, negate this problem. As such, PHEVs may be more similar to HEVs in this respect. Diamond (2009) found that the higher a state’s average vehicle miles traveled (VMT); its market share of HEVs is also significantly higher. He et al. (2012) found that people who primarily drive on highways tend to care more about a vehicles’ fuel economy. For a BEV, Hidrue et al. (2011) similarly found that consumers who take “at least one drive per month longer than 100 miles” are more likely to be BEV-oriented. This finding is intuitive because the farther a person drives, the more likely or willing they may be to purchase a more fuel efficient vehicle because the savings will accrue more quickly. For a BEV, this relationship likely hits some threshold relating to range whereafter it will no longer hold. Similarly, Hidrue et al. (2011) also found in their survey-based study that increasing range from 75 to 150 miles is worth over $5,600 to the average respondent, and from 75 to 300 miles over $12,700 (increasing at a decreasing rate). Charging Station Networks Due to limited travel distance, the presence of charging station networks is found to be critically important to EV adoption. Using a cross-country data for 2012, Sierzchula et al. (2014) found that charging infrastructure (relative to population) is significantly positively related to EV market share. Tran et al. (2013) similarly found in their simulation model that the presence of an extensive charging network is critical to support mass adoption. What determines adequate infrastructure is, however, a local question. In addition, it is not just the reach of the network that is important but also the elapsed time of recharge. There is still much to be known about where infrastructure should be built as well as its optimal service quality. Through survey work done in Japan, for example, Ito et al. (2013) found that an EV user will have a lower willingness to pay for “quick charging” at a retail location (for example, outside a supermarket) if the user has “quick charge” capability at home. Public Visibility and Vehicle Diversity
12

Public visibility is related to peer and networks effect, technology acceptance and comfort levels (Eppstein et al., 2011). Lane and Potter (2007) discuss cars as a “status symbol” that serves to reinforce anti-environmental behavior. They suggest that one way to promote low carbon vehicles is by increasing their image through enhanced amenity value. On the other hand, Axsen and Kurani (2013) found in a survey of new vehicle buyers in San Diego, California that positive interest in HEVs and EVs was based on association of these vehicles with “intelligence, responsibility, and support of the environment and nation.” Burgess et al. (2013) found in survey work of EV drivers in the UK that EV drivers perceive themselves to be particularly susceptible to stereotyping. The stereotype is, however, evolving from a more negative to positive view – where greater contact with EV drivers helps to reinforce this. Seeing more cars on the road should also increase EV awareness. Axsen et al. (2009) model the “neighborhood effect” as decreasing intangible costs with increased HEV market share. As such, the number of years that EVs have been available for purchase is one potential measure of public visibility (Sierzchula et al., 2014). Table 1 below depicts EVs available for sale in the U.S. and Hawaii by year of introduction. The year that the vehicle came to market in the U.S. is shown in blue, and outlined in black for “HI.” Duration of availability as well as total number available is a reflection of consumer choice.
13

Table 1. EVs Available in the U.S. and Hawaii Year Available in U.S. EV Models 2010 2011 2012 2013 2014 Nissan Leaf, BEV HI Chevrolet Volt, PHEV (EREV) HI Mitsubishi i-MiEV, BEV HI Tesla Model S, BEV* HI Toyota Plug-in Prius, PHEV HI Ford Focus Electric, PHEV HI Chevrolet Spark EV, BEV Toyota RAV-4 EV, BEV** Ford C-Max Energi, PHEV HI Ford Fusion Energi, PHEV HI Porsche Panamera S E-Hybrid, PHEV HI Fiat 500e, BEV** Honda Accord Plug-In, PHEV** Cadillac ELR, PHEV (EREV) HI BMW i3, BEV HI BMW i3 REX, PHEV (EREV) HI BMW i8, PHEV*** HI Kia Soul Electric, BEV** Volkswagon E-Golf, BEV** Mercedes-Benz B Class Electric Drive**, BEV Number of Models in U.S. Market (Hawaii) 2 (0) 3 (3) 9 (5) 12 (6) 20 (13)
*Available in Hawaii upon special order in 2012. Tesla Sales Center opened on Oahu in 2013. **Initially limited to select markets. ***Available in Hawaii upon special order. The Nissan Leaf BEV and Chevrolet Volt PHEV (extended range) were the first electric vehicles available for purchase in the U.S. in 2010 and Hawaii in 2011. A total of 20 EVs are available in the U.S. and 13 in Hawaii. In a statistical model using survey data on Canadian’s preferences for vehicle technology, Mau et al. (2008) found that the degree of market penetration of clean vehicle technologies has an impact on consumer preferences. They found that as the market share for HEVs increases, the higher the consumer value for HEVs. They call this the “neighbor effect.” Comfort levels can also be achieved through consumers who have experience with HEVs. Carley et al. (2013) found that owning a hybrid is a strong predictor of intent to purchase an EV. This may also be due to consumers being early technology adopters.
14

Policy Mechanisms Policy mechanisms available to support EV adoption include subsidies and other incentives, supporting infrastructure build-up and raising awareness. Subsidies and Other Incentives To support EV adoption and use among citizens and businesses, government can provide direct subsidies to consumers and/or businesses, assist in marketing, and support projects like car-sharing that include EVs within the fleet (Bakker and Trip, 2013). There is a wide and somewhat inconclusive literature on the impact of financial incentives on new vehicle technology adoption. Understanding whether financial incentive creates additional EV penetration is important in regards to assessing the effective use of public funds and resources. Within HEV’s, the impact of financial incentives are found to be mixed (Sierzchula et al., 2014). Diamond (2009) found evidence of a weak positive relationship between financial incentives and HEV adoption, and its statistical significance is mixed depending on the state and year. Moreover, individual state incentives did not seem to substantially alter a state’s HEV adoption trend without impacting other important factors like gas prices. Diamond concludes that subsidies are rewarding consumers within higher income brackets who are likely to make the vehicle purchase regardless. Whereas Diamond found that a doubling of monetary financial incentives leads to an 18% increase in HEV market share, this can similarly be achieved through a 3% increase in the average gas price. Gallagher and Muehlegger (2011) use national HEV sales data per capita to assess the impacts of incentives such as access to HOV lanes, tax credits, sales tax rebates, and gas prices. They found that gas prices and tax incentives significantly impact sales, where the rebate has a larger effect than the credit. They found that access to HOV lanes is significant in some states. Building on this work and incorporating an S-shaped diffusion curve (see below) to account for technology adoption trends, Jenn et al. (2013) found that the incentives put forth in the 2005 Energy Policy Act had a significant effect on the sales of HEVs in the U.S. The 2005 Energy Policy Act created consumer tax credits that were partially scaled to the fuel economy rating of the vehicle. It included a phasing out mechanism: if a manufacturer sold 60,000 HEVs within one quarter, the incentives applied to their vehicles would be cut in half twice over the course of the year and then phased out entirely. They found that HEV sales increase by 0.0046% for every dollar spent as a subsidy, on average. However, they also found that it is only really meaningful for HEVs receiving subsidies over $1,000 – implying that small amounts do not seem to matter at the margin. There is a growing literature focusing on the effect of financial incentives on EV sales. Zhang et al. (2011) found no evidence of government incentives as an impact to EV purchase in statistical analysis done regarding survey data in Nanjing, China. On the other hand, Sierzchula et al. (2014) found financial incentives to be slightly positive and statistically significant. They conducted a cross-national statistical analysis of factors affecting EV adoption rates for 30 countries in 2012. Similar to Jenn et al. (2013), however, they found
15

that incentives lower than $2,000 has little effect. Figure 5 below summarizes the main findings of Sierzchula et al. (2014), showing the value of country financial incentives for EV’s and their corresponding EV market share.
Figure 5. Financial Incentives and EV Market Share by Country
Source: Recreated from Sierzchula et al. (2014). Gass et al. (2014) assess the total cost of ownership of EVs and ICEs in Austria based on a dynamic calculation from 2011 and projecting to the year 2020. In this study, total cost of ownership includes all of the major costs of buying, owning, and disposing of a vehicle but does not account for environmental externalities (because they want to focus mainly on the consumer perspective). They assess the impact of an up-front price support, a carbon tax, and increasing the fuel consumption tax. The authors found that the upfront price support will help EV adoption, particularly because the tax mechanisms are less politically viable. Jin et al. (2014) monetize state EV incentives, ranging from direct incentives like subsidies to indirect ones like access to HOV lanes. Figures 6 and 7 summarizes the main findings of Jin et al. (2014) and shows the value of state-level incentives offered for BEV and PHEVs in the U.S. (shown in a bar graph relating to the left axis) in comparison to vehicle sales (shown with diamonds relating to the right axis).
16

Figure 6. BEV Consumer Benefit and EV Market Share by State
Source: Recreated from Jin et al. (2014).
Figure 7. PHEV Consumer Benefit and EV Market Share by State
Source: Recreated from Jin et al. (2014).
17

Jin et al. (2014) found that the most valuable state incentives are direct subsidies, though access to HOV lanes is also notable. Hawaii is found to rank sixth in regards to EV incentives, where they are valued at about $1,200 for HOV lane access and about $1,000 for free parking at metered stalls (for BEVs). Colorado ranks the highest in consumer benefits, primarily due to its up to $6,000 income tax credit for EVs in 2014 (Colorado Department of Revenue, 2014), yet there is little difference in Colorado’s share of new EV vehicles in comparison to the U.S. average. Without statistical analysis, however, it is difficult to know whether their findings suggest that incentives are significant. Supporting Charging Infrastructure Build-up It may be an appropriate role of government to support EV infrastructure build-up as a public good (Gass et al., 2014). Moreover, it may be an effective focus for policy support. Sierzchula et al. (2014) found that supporting charging infrastructure has the most dominant policy effect on a country’s rate of new EV sales; specifically, that providing one charging station (per 100,000 residents) could have twice the impact on a country’s rate of new EV sales than $1,000 in financial incentives. Brown et al. (2010) discuss the importance of creating and adopting early standards for charging infrastructure to ease this transition. Brown et al. emphasize the importance of creating standards for two-way electricity transfer, including in commercial areas. Raising Awareness Survey work within the literature shows that consumers are often either misinformed or not fully informed regarding vehicle purchases. Lane and Potter (2007) found in a study of UK consumers that people are often misinformed regarding vehicle characteristics, particularly related to fuel usage. They found that consumers say they have economic concerns, yet their knowledge of actual car costs is rather low. While consumers may know more about fuel costs, taxes and insurance, issues of depreciation and government incentives for cleaner cars are not well understood. Krause et al. (2013) found in a survey of consumers in 21 large U.S. cities that nearly two-thirds of respondents incorrectly answer questions about EVs. About three-quarters underestimated their value or advantages. Nearly 95% were not aware of state and local incentives. Zhang et al. (2011) similarly found in a survey of consumers in Nanjing, China that consumers have limited understanding of EVs. Bakker and Trip (2013) suggest that it can be the role of the city/municipality to include EV-relevant information on their website and through outreach at events.
III. EV Adoption Rates Over Time Understanding the expected penetration rates of new technologies is important for policy and planning purposes. The translation of factors that affect EV adoption to estimating adoption rates over time requires application of specific modeling techniques. Al-Alawi and Bradley (2013) provide a comprehensive summary of HEV and EV market penetration rate studies. They categorize these studies into three distinct methodologies: agent-based, consumer choice, and diffusion rate/time series models. This section presents and builds on the work of Al-
18

Alawi and Bradley by summarizing known studies to date. For a more comprehensive description of modeling techniques, see Al-Alawi and Bradley (2013).
Agent-Based Models Agent-based modeling is a computer simulation technique that describes the interactions of individual decision-makers (i.e. agents). It is widely applied in the field of vehicle technology adoption. The advantages of agent-based modeling is that it uses micro-data regarding agent characteristics and preferences. On the other hand, they tend to be complex and extremely difficult to validate (Al-Alawi and Bradley, 2013). Al-Alawi and Bradley (2013) identify Sullivan et al. (2009) as the most comprehensive agent-based modeling study available at the time of writing. Al-Alawi and Bradley additionally discuss Eppstein et al. (2011), but exclude their results because they do not specify a starting date. Eppstein et al. are here included, with the assumption that PHEVs are introduced in 2010. Figure 8 below summarizes the main findings of Sullivan et al. (2009) and Eppstein et al. (2011).
Figure 8. Agent-Based Models for PHEV Penetration Rates
Source: Selected scenarios recreated from Al-Alawi and Bradley (2013), Sullivan et al. (2009) and Eppstein et al. (2011). Sullivan et al. (2009) uses a dynamic model comprised of four decision makers—consumers, government, fuel producers, and vehicle manufacturers—to simulate PHEV penetration in the U.S. market. In Sullivan’s four scenarios, the existing federal tax credit is assumed to remain constant throughout the time horizon while fuel prices, original equipment manufacturers (OEM) subsidies and sales tax exemptions vary over time. Within their model, the major drivers of difference between PHEV penetration rates are OEM subsidies and sales tax exemptions. This has a dominant effect over gasoline prices. There is near zero PHEV penetration in the base case where only gas prices differ but when combined with subsidy and sales tax exemptions, adoption rates increase substantially. In their highest
19
adoption scenario, which has the most aggressive subsidies as well as low gasoline prices, PHEVs are estimated to capture about a quarter of the market for new vehicles by 2040. Eppstein et al. (2011) additionally consider spatial, social, and media influences. The authors vary factors such as PHEV purchase price and rebates, gasoline prices, and all-electric battery range. They also change agent attributes such the levels for PHEVs perceived to be in an agent’s geographic neighborhood and social network, perception of cost savings, and their “level of greenness.” Across all scenarios, the authors assume PHEVs cost $40k with gasoline prices rising from $3 to $12/gallon. In their highest PHEV penetration rate scenario (high level of greenness) with a $7,500 rebate, PHEV sales reach 60% by 2035. In the lowest PHEV penetration rate scenario, market share only comprises 2.2% both with and without the subsidy. Even in the low threshold scenario, government incentives have relatively little effect on penetration rates; expected lifetime fuel costs provided on vehicle stickers are found to be far more important.
Consumer Choice Models Consumer choice models are a broad term used by Al-Alawi and Bradley (2013) to encompass models that estimate the probability of consumer behavior. Logit models are used to estimate the probabilistic preferences of consumers and discrete choice models calculate the probability of a specific product being chosen. These models are most advantageous when they are calibrated from detailed historic data on consumer demographics and past vehicle sales (Al-Alawi and Bradley, 2013). However, in the case of new technologies like EVs, limited historical data may be available. This drives the need for survey information as well as potentially biases studies from the “action-attitude gap” (Lane and Potter, 2007). This refers to the difference in what consumers may say they are going to do in contrast to actual actions. Revealed preference data, observations that “reveal” them through the marketplace, is considered most representative of true consumer preferences. Stated preference data, from surveys, can be fraught with overstatements and misperceptions (Axsen et al., 2009; Brownstone et al., 2000; Shepherd et al., 2012). Stated preference data is often used, however, given the limited observations of EVs in the market. In a logit study that combines both stated and revealed preference data, Brownstone et al. (2000) say that, “[stated preference] data are critical for obtaining information about attributes not available in the marketplace, but pure [stated preference] models with these data give implausible forecasts.” The authors found in comparing the application of a stated-preference model and one that mixed stated and revealed preference data that the purely stated preference based forecasts overstated findings on the order of magnitude of 300%. Their forecast dropped from 20% (for a non-gasoline vehicle share) to 6% in a multinomial logit specification and from 42% to 18% in a mixed logit specification. Similarly, Axsen et al. (2009) estimate HEV adoption rates in both Canadian and Californian markets using a combination of revealed and stated preference data. They found that revealed preference data outperforms stated preference data in terms of accuracy of estimation, but are statistically problematic because explanatory variables are often high correlated. They conclude that stated preference data is best used for estimating beta coefficients and revealed preference data should be used for forecast model calibration. Al-Alawi and Bradley (2013) identify reliance on hypothetical data as the major disadvantage of this methodology.
20

Al-Alawi and Bradley identify Bandivadekar (2008) and Sikes et al. (2010) as the two primary studies using consumer choice methods for PHEVs (others focus solely on HEVs and none focus on BEVs). No additional consumer choice studies with a temporal dynamic were found. Figure 9 recreates the main penetration rate findings of these two studies.
Figure 9. Consumer Choice Models for PHEV Penetration Rates
Source: Selected scenarios recreated from Al-Alawi and Bradley (2013), Sikes et al. (2010) and Bandivadekar (2008). Bandivadekar (2008) employs a discrete choice model to forecast U.S. PHEV annual sales share. Two of the scenarios “Market Mix” and “Hybrid Strong” are shown in Figure 9. In response to the additional pressure to reduce petroleum use in an environment where HEVs are the dominant vehicle of choice, combined with lower battery costs, PHEV sales are found to gain momentum after 2020. Bandivadekar forecasts that about 20% of new sales will come from PHEVs by the year 2045, assuming that HEVs also have a strong market. Under the “market mix” scenario, the penetration rate for both PHEVs and HEVs are about half—where turbocharged gasoline and conventional vehicles remain a strong force in the market. The main driver of this difference is the assumed relative cost of hybrid and diesel vehicles. Sikes et al. (2010) develop a Market Adoption of Advanced Automotive Technology model using a nested multinomial logit specification. They build upon Sullivan et al. (2009)’s agent-based modeling framework and forecast PHEV market penetration in the U.S. under varying policy options. The scenarios displayed in Figure 9 above show three cases where the market for PHEVs fails to launch, achieving only several percentages of the market by 2020. These scenarios include 1) a base case where vehicle costs drop precipitously from continued success in research and development, 2) lower initial vehicle price through subsidizing battery costs, and 3) increasing charging infrastructure in the city (25%) and suburbs (15%).
21

On the other hand, assuming the federal tax credit extends to 2020 (as opposed to the current phasing out in 2015 when 200,000 qualified PHEVs are sold by each manufacturer), they also show a case where penetration rates reach about 17% by the year 2020.
Diffusion Models Diffusion models attempt to capture the process by which new technology is adopted by society. Diffusion models capture factors that are both internal and external to the market (as described above). Additional metrics include innovation, communication, time, and the surrounding social system. Theories of diffusion include concepts of early adopters and the role of social influence. This results in an S-shaped curve associated with the rate of an innovation’s adoption, which is often modeled as a normal distribution over time. The most widely used diffusion models are the Bass, Gompertz and Logistics models, and they have been applied widely to the field of automobile markets (Al-Alawi and Bradley, 2013). The advantages of diffusion models are that they can be fit to the historical trend of the technology itself and/or to similar technologies. The disadvantage is that the time of peak sales as well as the ultimate market potential are exogenous to the model (Al-Alawi and Bradley, 2013). As such, many diffusion models incorporate elements of both consumer choice and agent-based models. Figure 10 shows the range of literature that uses a diffusion model to estimate annual PHEV and BEV sales over time. This is the only set of models that forecast both PHEV and BEVs. Al-Alawai and Bradley (2013) present results for Jeon (2010), McManus and Senter (2009), and Becker (2009) in level values, whereas they have been translated into the share of EVs in new car sales for the purposes of this study. The work of Al-Alawi and Bradley is extended to include studies by Shepherd et al. (2012) and Higgins et al. (2012).
22

Figure 10. Diffusion Model Literature Annual PHEV and BEV Sales Forecasts
Source: Selected scenarios recreated from Al-Alawi and Bradley (2013), Jeon (2010), McManus and Senter (2009), Becker (2009), Shepherd et al. (2012), and Higgins et al. (2012). McManus and Senter (2009) develop a “consideration-purchase” model to predict PHEV sales at varying price premiums, an idea which was suggested by Struben and Sterman (2008). This scenario is their “preferred market model,” which focuses on the market behavior of consumers. This is in contrast to Centronne et al.’s (2007) work that does not make any behavioral assumptions, in the spirit of the original Bass model. New sales are determined by replacements for disposed vehicles and new vehicle acquisitions. Their main finding is that PHEV sales are responsive to price premiums. Compared to comprising nearly 3% of new sales at a price premium of $10,000 in 2050, PHEVs capture approximately 45% of the market at a price premium of $2,500. Becker (2009) uses the U.S. Energy Information Administration’s (EIA) Annual Energy Outlook reference and high oil price scenario along with the Bass (1969) model, as well as vehicle purchase price and operating costs, to forecast the U.S. market share of BEVs. Under the EIA reference scenario, BEVs comprise 64% of new car sales while BEVs reach nearly 90% of the light duty vehicle market share in response to high oil prices. Becker’s results are much higher than the other literature and for this reason are put aside. Jeon (2010) projects the U.S. market share of PHEVs and BEVs by using the Norton- Bass model—an extension of the seminal Bass diffusion model (1969) to include adoption and substitution across successive generations of a new technology (Norton and Bass, 1987). This approach, in contrast to the original Bass model, which has a fixed saturation level, accounts for an evolving consumer base as newer models are released. In addition, Jeon further incorporate price and advertising effects (Generalized Bass Model) into the Norton-Bass model. Driven largely by the lower price for EVs than that of PHEVs due to declining
23
battery costs in 2020, PHEVs are projected to capture 6% of the market by 2030 while BEVs make up some 13%. Higgins et al. (2012) combines choice modeling, multi-criteria analysis, and diffusion models to spatially forecast the Australia market. Financial criteria (annual cost, upfront cost, household income) and non-financial criteria (performance, distance, demographic suitability, familiarity) were calibrated based on focus groups derived from demographic data and a large-scale survey which was used to quantify the scores and weight for each criterion. In the base case, as a result of lower prices and performance improvements, BEVs gain traction from year 2020 onward—increasing from nearly zero in 2020 to roughly 13% in 2030. Shepherd et al. (2012) apply a dynamic systems approach—consisting of a fleet turnover model, a discrete choice model, and a technology/social diffusion model—to forecast PHEV and EV adoption in the UK. Their model builds upon Struben and Sterman (2008) by applying the parameters from Struben and Sterman’s (2008) discrete choice model. Shepherd et al.’s (2012) themed scenarios combine varying subsidy levels and attributes from their conditional marketing case to forecast the uptake of EVs from 2020 through 2050—the first entails a subsidy of £5000 for any EV for 3 years along with realistic improvements to BEVs, while the second assumes £5000 for BEVs for 6 years with the government budget capped at £500m, and there are significant improvements to BEV range, operating costs, fuel availability and maximum speed. The utility of BEVs exceeding that of PHEVs and conventional vehicles by 2050 is embedded in these attribute improvements. In general, Shepherd et al.’s estimations are considerably lower than other diffusion model literature because they internalize Brownstone et al. ’s (2000) finding in regards to the tendency of survey respondents to overstate their intentions and willingness to pay for EVs. They scale their dataset based on the findings of Brownstone et al. to overcome this challenge.
IV. Synthesizing EV Adoption Rates for Hawaii To narrow the pathways to three representations of possible EV penetration over time, a process of elimination is used. Scenarios that essentially predict failure of technology adoption, such as Sullivan et al. (2009)’s base case, are excluded. This is because Hawaii’s EV penetration rate is already around 4.5% of new car sales (see below). Scenarios are additionally selected if the subsidy and price assumptions better match the U.S. context. And finally, diffusion-based models are the main focus (though comparison of results to the agent-based and consumer choice literature is done) for two reasons: 1) the comprehensiveness of the modeling approach, and 2) simply that it’s a more full literature that includes forecasts for both PHEVs and BEVs. Because the primary exercise is to choose a reasonable range of expected EV penetration rates over time and, when comparing the diffusion literature to either the agent-based or consumer choice models, the range is fairly well covered (after excluding technology adoption failure scenarios). As such, this study primarily draw upon the work of Shephered et al. (2012), Higgins et al. (2012), and Jeon (2010). Five specific scenarios are chosen that either best capture subsidy conditions relative to the U.S. federal government as well as a range of expectations regarding infrastructure development and declining technology costs. For Jeon (2010), their
24
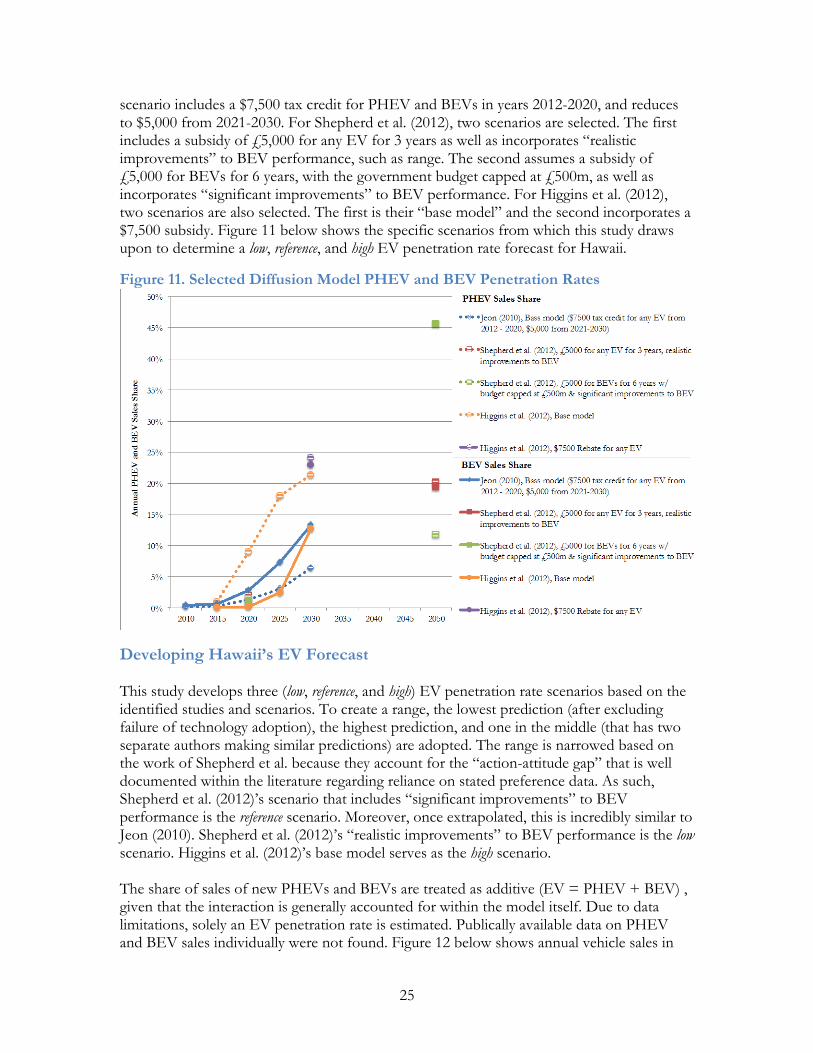
scenario includes a $7,500 tax credit for PHEV and BEVs in years 2012-2020, and reduces to $5,000 from 2021-2030. For Shepherd et al. (2012), two scenarios are selected. The first includes a subsidy of £5,000 for any EV for 3 years as well as incorporates “realistic improvements” to BEV performance, such as range. The second assumes a subsidy of £5,000 for BEVs for 6 years, with the government budget capped at £500m, as well as incorporates “significant improvements” to BEV performance. For Higgins et al. (2012), two scenarios are also selected. The first is their “base model” and the second incorporates a $7,500 subsidy. Figure 11 below shows the specific scenarios from which this study draws upon to determine a low, reference, and high EV penetration rate forecast for Hawaii.
Figure 11. Selected Diffusion Model PHEV and BEV Penetration Rates
Developing Hawaii’s EV Forecast This study develops three (low, reference, and high) EV penetration rate scenarios based on the identified studies and scenarios. To create a range, the lowest prediction (after excluding failure of technology adoption), the highest prediction, and one in the middle (that has two separate authors making similar predictions) are adopted. The range is narrowed based on the work of Shepherd et al. because they account for the “action-attitude gap” that is well documented within the literature regarding reliance on stated preference data. As such, Shepherd et al. (2012)’s scenario that includes “significant improvements” to BEV performance is the reference scenario. Moreover, once extrapolated, this is incredibly similar to Jeon (2010). Shepherd et al. (2012)’s “realistic improvements” to BEV performance is the low scenario. Higgins et al. (2012)’s base model serves as the high scenario. The share of sales of new PHEVs and BEVs are treated as additive (EV = PHEV + BEV) , given that the interaction is generally accounted for within the model itself. Due to data limitations, solely an EV penetration rate is estimated. Publically available data on PHEV and BEV sales individually were not found. Figure 12 below shows annual vehicle sales in
25

Hawaii from 1989 to 2013, divided between cars and light trucks from 2003 onward. It also includes HEV and EV sales, starting from 2005 and 2008, respectively (HADA, 2003-2013).4
Figure 12. Annual Vehicle Sales and New Hybrid & EV Retail Registrations
Source: HADA, 1989-2013. By 2013, HEV sales reached 10% of new car sales and 5% of total retail sales. EVs in 2013 reached 3% of new car sales and 2% of total retail sales. For 2014, a total EV figure of 1,050 based on data provided in an EV stakeholder workshop is adopted (Deutsch, 2015). To extrapolate between points within each scenario, a logistic function (an S-shaped curve) is imposed to smooth forecasts over time, between 20155 and 2040. Within the diffusion literature, the imposition of a logistic function is a well accepted mechanism to describe technology acceptance over time (Rogers, 1995). Jenn et al. (2013) discuss, for example, the importance of incorporating an S-shaped diffusion curve into econometric work assessing the factors that affect EV adoption. The reasoning behind the “S” is that, for any innovation, new technology must be widely adopted such that it reaches critical mass – or else it will fail to be adopted. First early adopters will enter the market, then an early majority, late majority, and laggards. This study imposes the following functional form for the S-shaped curve:
4 The HADA data does not include fleet or sales transacted on the mainland and are subsequently shipped to Hawai‘i. The Department of Business Economic Development and Tourism (DBEDT) publishes data on cumulative hybrid and electric vehicles registration (vehicle stock) on a monthly basis from the Department of Transportation, but this includes fleet registration and it is unclear whether the registered vehicles hold an active licenses status (as opposed to those scrapped or shipped out-of-state). This study is most interested in the individual consumer’s purchase decision and therefore hones in on new EV adoption. 5 Because Hawaii’s EV share has already surpassed literature estimates for 2015, the 2014 car sales estimate is taken and Hawaii’s estimated EV penetration in 2014, to derive the EV share in 2015, estimated at 4.5%.
26

𝑃𝑃(𝑡𝑡) = 𝑃𝑃0𝑒𝑒𝑟𝑟𝑟𝑟 ((1 + 𝑃𝑃0)(𝑒𝑒𝑟𝑟𝑟𝑟 − 1))⁄ Where :
𝑃𝑃(𝑡𝑡) is the penetration in year t (or market share of new EVs sales in year t) 𝑃𝑃0 is the initial market share of EV sales (2013 EV sales share in Hawaii) 𝑟𝑟 is the proportional increase of the penetration P in one unit of time
Data is available for the market share of new EV sales in 2013, namely 4.6% of car sales. Using the end point (i.e., P(t)) from each selected forecast, r is solved. Knowing the value of r, all intermediate values of P(t) are then solved. This “fills in” the selected forecasts, as well as extend them over time. Figure 13 below shows the three literature-based penetration rate forecasts after the application of the S-shaped curve from 2015 to 2040. Uptake remains positive in growth rate throughout the time horizon because it is assumed that the peak of the “S” is not reached in this time horizon.
Figure 13. EV Penetration Rate Scenarios
The extrapolated literature estimates results in a reference scenario of EV adoption such that EVs achieve a 34% market share of new car sales by 2040. In the high scenario, the market share is 72% and in the low, 24%. Embedded in each of these estimates is a set of modeling assumptions in regards to consumer acceptance, declining technology cost, improving EV performance and infrastructure investment. Shepherd et al. (2012) include financial support, even in what is the low case. Further work into Hawaii-specific EV policies will help to both refine these forecasts as well as inform which pathway Hawaii is more likely pursuing. For comparison to other vehicle market innovations (as is common practice within diffusion literature), Kromer et al. (2010) document that the transition to automatic transmission achieved an annual growth rate of approximately 15% while the transition to diesel achieved
27
an annual growth rate of approximately 8%. In the high case, there is an average annual growth rate of 12%. In the reference case, this is 10%, and in the low case, 8%. Thus the low forecast mimics a system similar to that of the uptake of the diesel engine. The high case is not quite to the level of the switch to automatic transmission – as electrification is a relatively more disruptive technology.
Projecting New EV Sales in Hawaii Translating the EV penetration rate scenarios to estimating future EV sales requires projecting new vehicle sales over time. This is done by applying a forecast for real growth of Hawaii’s Gross State Product (GSP) over time. Sivak (2013) found in an analysis of forty-eight countries from 2005-2011 that the logarithm of gross domestic product is a strong predictor of the logarithm of vehicle sales. Hawaii’s GSP forecast is a simple estimation based on historic averages (about 2.2% annual growth).6 The percentage change in GSP over time is used to estimate year-to-year growth in new vehicle sales in Hawaii. Since Hawaii Automobile Dealership Association (HADA) data is not yet available for calendar year 2014, it is assumed that total vehicle sales are the same as 2013 (48,766) and project forward using that year’s GSP growth. From vehicle sales, the historical average of car sales (46% between 2003-2013) is taken and applied to estimate car sales over time.7 In this is embedded the rather rigid assumption that new EV drivers come from the pool of car drivers and not light trucks and that the share of car sales to total vehicle sales remains constant over time. In addition, a vehicle scrappage rate of 6% is adopted to estimate the total stock of vehicles, including EVs.8 This rate is applied to EVs beginning in 2020, with the assumption that this will be the first cohort of EVs to face “scrappage.” Figure 14 below shows the Hawaii EV Forecast for low, reference and high scenarios of EV adoption. Annual EV sales are shown on the left axis (line graphs) and cumulative EV’s are shown on the right axis (bar graphs).
6 To ensure harmonization with future work, a forecast of GSP was also estimated based on the Hawaii Computable General Equilibrium (H-CGE) Model (Coffman and Bernstein, 2014). H-CGE is calibrated based on the EIA’s Annual Energy Outlook 2014 reference oil price forecast (based on Brent crude) (EIA, 2014b). Fuel prices determine changes in economic activity away from what could otherwise be characterized as the “steady state.” These differences are extremely small under the reference fuel price projection (which remains fairly constant in real dollars) and thus the historic trend of GSP is the primary driver of vehicle sales growth over time (about 2.2% annually). 7 Through personal communication, it was learned that Higgins et al. (2012) forecast is applied only to car sales. The forecast of Shepherd et al. (2012), though it is applied to all vehicles within the paper, is based in the UK where there are more cars and fewer light duty trucks than in the U.S. Hawaii’s share of cars to light duty trucks is similar to the U.S. average and approximately half of all vehicles. In addition, of the 20 available EV models in the U.S., 19 are cars. The one light duty truck EV is only available for purchase in California. As such, the forecast for this study is made based on car sales in Hawaii. 8 Similarly, McManus and Senter (2009) apply a rate of 5.3%.
28

Figure 14. Hawaii EV Forecast
In the reference scenario, the estimate is that there will be approximately 140,000 EVs on the road in Hawaii by the year 2040. This amounts to approximately 8% of cars on the road being an EV by the year 2040. In the low scenario, the estimate is about 110,000 and, in the high scenario about 280,000. This translates to 6% and 15% of cars on the road in the year 2040, respectively.
V. Conclusion This study provides a review of the literature regarding factors that affect EV adoption as well as condenses forecast studies for EV penetration rates. A set of scenarios that best match today’s market conditions is adopted to develop three (low, reference, and high) EV adoption forecasts within the sale of cars in Hawaii. As can readily be seen through the review of literature, there is much work to be done in understanding whether consumers will adopt EVs in critical mass. The forecast provided here is meant as a first-cut at understanding possible EV adoption scenarios in Hawaii, though it is fraught with uncertainty in regards to assumptions of technology acceptance, EV cost and performance, and infrastructure build-up. Nonetheless, providing a range of possible future adoption rates helps to frame the conversation to understand a reasonable set of uptake scenarios for policy and planning purposes. This study specifically avoided failure of technology adoption scenarios as a lower bound. This means that the low scenario is not representative of a true lower bound, but rather of a low(er) level of technology acceptance. Even this case assumes some level of federal subsidy and improvements in EV characteristics.
29

Moreover, many of the studies from which this study draws are from outside the U.S. where gasoline prices may be more expensive. While it is difficult to translate entirely to the case of Hawaii, where both gasoline and electricity are tied to the price of oil, it is evident from the literature that fuel price is a primary driver of expected EV adoption. World oil prices are currently in a period of decline (EIA, 2014c). For this reason, it seems reasonable to caution against reliance on the high EV adoption scenario. On the other hand, there may be strong reason to believe that range anxiety related to travel distance may be lessened in Hawaii’s island geography. Moreover, Hawaii’s early emphasis on public EV charging stations may help to quell this concern. This may have implications on both the total level of EVs sold in Hawaii as well as the ratio of PHEVs to BEVs. Further research is needed to better understand the uniqueness of Hawaii’s economy and geography and how it affects EV ownership cost and likely EV adoption.
30

VI. Acknowledgements This report was funded under a sub award to the Hawaii Natural Energy Institute, University of Hawaii at Manoa, from the Florida Solar Energy Center, University of Central Florida, through a grant from the US Department of Transportation’s University Transportation Centers Program, Research and Innovative Technology Administration.
31

VII. References Al-Alawi, B., Bradley, T., 2013. Review of Hybrid, Plug-In Hybrid, and Electric Vehicle Market Modeling Studies. Renewable and Sustainable Energy Reviews, 21, 190-203. Axsen, J., Mountain, D., and Jaccard, M., 2009. Combining Stated and Revealed Choice Research to Simulate the Neighborhood Effect: The Case of Hybrid-Electric Vehicles. Resource and Energy Economics, 31, 221-238. Axsen, J., Kurani, K., 2013. Hybrid, Plug-In Hybrid or Electric- What do Car Buyers Want? Energy Policy, 61, 532-543. Bakker, S., Trip, J. 2013. Policy Options to Support the Adoption of Electric Vehicles in the Urban Environment. Transportation Research Part D 25,18-23. Bandivadekar, A., 2008. Evaluating the impact of advanced vehicle and fuel technologies in US light-duty vehicle fleet. Massachusetts Institute of Technology.
Bass, F., 1969. A New Product Growth Model for Consumer Durables, Management Science, 15, 215-227. Becker, T., 2009. Electric vehicles in the United States: a new model with forecasts to 2030. Center for Entrepreneurship and Technology Technical Brief. Beresteanu., A., Li, S., 2011. Gasoline Prices, Government Support and the Demand for Hybrid Vehicles in the United States. Int. Econ. Rev. 52(1), 161-182. Brady, J., O’Mahony, M., 2011. Travel to Work in Dublin: The Potential Impacts of Electric Vehicles on Climate Change and Urban Air Quality. Transportation Research Part D 16, 188-193. Brown, S., Pyke, D., Steenhof, P. 2010. Electric Vehicles: The Role and Importance of Standards in an Emerging Market. Energy Policy 38, 3797-3806. Brownstone, D., Bunch, D., and Train, K. 2000. Joint Mixed Logit Models of Stated and Revealed Preferences for Alternative Fuel Vehicles. Transportation Research Part B 34, 315-338. Burgess, M., King, N., Harris, M., Lewis, E., 2013. Electric Vehicle Drivers’ Reported Interactions with the Public: Driving Stereotype Change? Transportation Research Part F, 17, 33-44. Carley, S., Krause, R., Lane, B., Graham, J. 2013. Intent to Purchase a Plug-In Electric Vehicle: A Survey of Early Impressions in Large US Cities. Transportation Research Part D 18, 39-45. Centronne, F., Goia, A., Salinelli, E., 2007. Demographic processes in a model of innovation diffusion with dynamic market. Technological Forecasting and Social Change, 74, 247-266.
32

Coffman, M., Bernstein, P., 2014. Linking Hawaii’s Islands with Wind Energy. Annals of Regional Science, DOI 10.1007/x00168-014-0644-y. Colorado Department of Revenue, 2014. Income 67: Innovative Motor Vehicle and Alternative Fuel Vehicle Credits. Taxpayer Service Division. Available at: https://www.colorado.gov/pacific/sites/default/files/Income67.pdf Department of Business, Economic Development and Tourism (DBEDT), 2015. DBEDT Data Warehouse. Registered Vehicles, Taxable. Research & Economic Analysis Division (READ). State of Hawai‘i. Accessed 15 January 2015. Available at: http://hawaiieconomicdata.com/ Deutsch, M., 2015. Presentation at Hydrogen Fuel Cell and Battery Electric Vehicle Stakeholder Charette. Nissan North America. Hosted by Department of Business, Economic Development and Tourism (DBEDT) and the International Council on Clean Transportation (ICCT) on January 13, 2015. Diamond, D., 2009. The Impact of Government Incentives for Hybrid-Electric Vehicles: Evidence from US States. Energy Policy 37, 972-983. Electric Drive Transportation Association (EDTA), 2015. Electric Drive Sales Dashboard. Accessed 15 January 2015. Available at: http://electricdrive.org/index.php?ht=d/sp/i/20952/pid/20952 Eppstein, M., Grover, D., Marshall, J., Rizzo, D., 2011. An Agent-Based Model to Study Market Penetration of Plug-In Hybrid Electric Vehicles. Energy Policy 39, 3789-3802. Gallagher, K., Muehlegger, E., 2011. Giving Green to Get Green? Incentives and Consumer Adoption of Hybrid Vehicle Technology. Journal of Environmental Economics and Management 61(1), 1-15. Galus, M., Zima, M., Andersson, G., 2010. On integration of plug-in hybrid electric vehicles into existing power system structures. Energy Policy 38, 6736-3745. Gass, V., Schidt., J., Schmid, E., 2014. Analysis of Alternative Policy Instrumetns to Promote Electric Vehicles in Austria. Renewable Energy, 61,96-101. Hawaii Automobile Dealer’s Association (HADA), 1989-2013. Hawaii Auto Outlook. Available at: http://hawaiiautodealer.com/magazine/index.html Hawkins, T.R., Singh, B., Majeau-Bettez, G., Stromman, A.H., 2013. Comparative Environmental Lifecycle Assessment of Conventional and Electric Vehicles. Journal of Industrial Ecology 17, 53-64. He, L., Chen, W., Conzelmann, G., 2012. Impact of Vehicle Usage on Consumer Choice of Hybrid Electric Vehicles. Transportation Research Part D, 17, 208-214.
33
Hidrue, M., Parsons, G., Kempton, W., Gardner, M., 2011. Willingness to Pay for Electric Vehicles and their Attributes. Resource and Energy Economics 33, 686-705. Internal Revenue Service (IRS), 2014. Plug-in Drive Vehicle Credit (IRC-30D). Accessed 15 January 2015. Available at: http://www.irs.gov/Businesses/Plug-In-Electric-Vehicle-Credit-(IRC-30-and-IRC-30D) Ito, N., Takeuchi, K., and Managi, S., 2013. Willingness to Pay for Infrastructure Investments for Alternative Fuel Vehicles. Transportation Research Part D, 18, 1-8. Jenn, A., Azevedo, I., Ferreira, P., 2013. The Impact of Federal Incentives on the Adoption of Hybrid Electric Vehicles in the United States. Energy Policy 40, 936-942. Jeon, S.Y., 2010. Hybrid and Electric vehicle technology and its market feasibility. Massachusetts Institute of Technology, Cambridge, MA. Jin, L., Searle, S., Lutsey, N., 2014. Evaluation of State-Level U.S. Electric Vehicle Incentives. The International Council on Clean Transportation, White Paper. Krause, R., Carley, S., Lane, B., and Graham, J., 2013. Perception and Reality: Public Knowledge of Plug-In Electric Vehicles in 21 U.S. Cities. Energy Policy, 63: 433-440. Kromer, M., Bandivadekar, A., Evans, C., 2010. Long-Term Greenhouse Gas Emission and Petroleum Reduction Goals: Evolutionary Pathways for the Light Duty Vehicle Sector. Energy, 35, 387-397. Lane, B., Potter, S., 2007. The Adoption of Cleaner Vehicles in the UK: Exploring the Consumer Attitude-Action Gap. Journal of Cleaner Production, 15, 1085-1092. Lund, H., Kempton, W., 2008. Integration of renewable energy into the transport and electricity sectors through V2G. Energy Policy, 36, 3578-3587. McManus, W., Senter R., 2010. Market models for predicting PHEV adoption and diffusion. University of Michigan Transportation Research Institute, Ann Arbor, MI. Mau, P., Eyzaguirre, J., Jaccard, M., Collins-Dodd, C., and Tiedemann, K., 2008. The ‘Neighbor Effect’: Simulating Dynamics in Consumer Preferences for New Vehicle Technologies. Ecological Economics, 68, 504-516. Norton, J., Bass, F., 1987. A Diffusion Theory Model of Adoption and Substitution for Successive Generations of High-Technology Products. Management Science, 33, 1069-1086. Richardson, D., 2013. Electric vehicles and the electric grid: A review of modeling approaches, Impacts, and renewable energy integration. Renewable and Sustainable Energy Reviews, 19, 247-254. Rogers, E., 1995. Diffusion of Innovations, 4th Edition. The Free Press, New York, NY.
34

Santini, D.J., Vyas, A.D., 2005. Suggestions for New Vehicle Choice Model Simulating Advanced Vehicle Introduction Decisions (AVID): Structure and Coefficients. Center for Transportation Research, Energy Systems Division, Argonne National Laboratory ANL/ESD/05-1. Shafiei, E., Thorkelsson, H., Asgeirsson, D., Davidsdottier, B., Raberto, M., Stefansson, H., 2012. An Agent-Based Modeling Approach to Predict the Evolution of Market Share of Electric Vehicles: A Case Study from Iceland. Technological Forecasting & Social Change 79(9), 1638-1653. Sierzchula, W., Bakker, S., Maat, K., Wee, B., 2014. The Influence of Financial Incentives and other Socio-Economic Factors on Electric Vehicle Adoption. Energy Policy 68, 183-194. Sikes K., Gross, T., Lin, Z., Sullivan, J., Cleary, T., Ward, J., 2010. Plug-in hybrid electric vehicle market introduction study: final report. Oak Ridge National Laboratory (ORNL). Struben, J., Sterman, J., 2008. Transition challenges for alternative fuel vehicle and transportation systems. Environment and Planning B: Planning and Design, 35, 1070-1097 Sullivan, J., Salmeen, I., Simon, C., 2009. PHEV market place penetration: an agent based simulation. University of Michigan Transportation Research Institute. Sivak, M., 2013. Predicting Vehicle Sales from GDP in 48 Countries: 2005-2011. Working Paper of the University of Michigan Transportation Research Institute. Accessed February 2, 2015 and available at: http://deepblue.lib.umich.edu/bitstream/handle/2027.42/96442/102925.pdf?sequence=1&isAllowed=y. Sullivan, J., Salmeen, I., Simon, C., 2009. PHEV Marketplace Penetration: An Agent Based Simulation. Working Paper of the University of Michigan Research Institute. Accessed February 4, 2015 and available at: http://deepblue.lib.umich.edu/bitstream/handle/2027.42/63507/102307.pdf?sequence=1&isAllowed=y Tamor, M., Gearhart, Ch., Soto, C., 2013. A Statistical Approach to Estimating Acceptance of Electric Vehicles and Electrification of Personal Transportation. Transportation Research Part C, 26, 125-134. Tran, M., Banister, D., Bishop, J., McCullogh, M., 2013a. Simulating Early Adoption of Alternative Fuel Vehicles for Sustainability. Technological Forecasting & Social Change 80, 865-875. U.S. Department of Energy (DOE), 2014a. Federal Laws and Incentives for Electricity. Alternative Fuels Data Center. Accessed 15 January 2015. Available at: http://www.afdc.energy.gov/fuels/laws/ELEC/US
35

U.S. Department of Energy (DOE), 2014b. Expired, Repealed, and Archived Hawaii Incentives and Laws. Alternative Fuels Data Center. Accessed 15 January 2015. Available at: http://www.afdc.energy.gov/laws/laws_expired?jurisdiction=HI U.S. Energy Information Administration (EIA), 2014a. California leads the nation in the adoption of electric vehicles. Accessed February 5, 2015 and available at: http://www.eia.gov/todayinenergy/detail.cfm?id=19131&src=email U.S. Energy Information Administration (EIA), 2014b. Annual Energy Outlook 2014. Accessed February 5, 2015 and available at: http://www.eia.gov/forecasts/aeo/index.cfm. U.S. Energy Information Administration (EIA), 2014c. Falling Gasoline Prices: The Influence of Crude Oil Prices and Other Factors. Accessed February 5, 2015 and available at: http://www.eia.gov/petroleum/weekly/archive/2015/150122/includes/analysis_print.cfm Zhang, Y., Yu, Y., Zou, B., 2011. Analyzing Public Awareness and Acceptance of Alternative Fuel Vehicles in China: The Case of EV. Energy Policy, 39, 7015-7024.
36