factors affecting oil and product prices - trala 2015 annual meeting... · factors affecting oil...
TRANSCRIPT
Factors Affecting Oil and Product Prices
Rayola Dougher
API Senior Economic Advisor

0
20
40
60
80
100
120
140
160
Iran/Iraq war
Gulf War OPEC
cuts 4.2
million
9/11
Low spare
capacity
Recession
Libyan
Uprising
Supply
surplus
The price of oil has fluctuated sharply before
Inflation-adjusted 2014 $/barrel
Sources: Inflation-adjusted average refiners acquisition price for crude oil
PDVSA strike
Iraq War
Asian Growth

$0.00
$1.00
$2.00
$3.00
$4.00
$5.00
Mar-08 Mar-09 Mar-10 Mar-11 Mar-12 Mar-13 Mar-14 Mar-15
Crude Oil $1.18 Gasoline $2.46 Diesel $2.93
Changes in gasoline and diesel prices closely
track changes in crude oil prices
Average prices as of March 6, 2015
Sources: NYMEX (WTI crude oil) and AAA (gasoline and diesel)

Many factors affect the price of oil, but in the end
it comes down to supply and demand
Source: EIA

Growth in Global Oil Supply
Disruptions (mmb/d)
0.0
0.5
1.0
1.5
2.0
2.5
3.0
3.5
4.0
Ja
n 2
01
2
Ju
l 20
12
Ja
n 2
01
3
Ju
l 20
13
Ja
n 2
01
4
Ju
l 20
14
Ja
n 2
01
5
OPEC
Non-
OPEC
Growth in U.S. Crude Oil
Production* (mmb/d)
0.0
0.5
1.0
1.5
2.0
2.5
3.0
3.5
4.0
Ja
n-2
012
Ju
l-2
01
2
Ja
n-2
013
Ju
l-2
01
3
Ja
n-2
014
Ju
l-2
01
4
Ja
n-2
015
Growth in U.S. oil production has largely offset
the growth in global oil supply disruptions
Source: EIA * Includes hydrocarbon gas liquids, biofuels, and refinery processing gains.

0
0.5
1
1.5
2
2.5
2014 2015 2016
Production
Consumption
World growth in crude oil production surged
ahead of growth in consumption in 2014
Source: EIA, Short-term Energy Outlook, February 2015
(mill
ion
ba
rre
ls p
er
da
y)

U.S. oil production is increasing as a result of
technological innovations
4
5
6
7
8
9
10
1970
1975
1980
1985
1990
1995
2000
2005
2010
2015
U.S. Crude Oil Production (millions of barrels per day)
Source: EIA
>73% growth
2008 to 2014

SHALE ENERGY PROVIDES A NATIONAL OPPORTUNITY
Current and prospective resources and basins in the continental US
Source: EIA based on data from various published studies – updated May 9, 2011
Current Shale Resources
Prospective Shale Resources
Basins
Shallowest/ Youngest
Mid-Depth/ Mid-Age
Deepest/Oldest
Shale Resources, Lower 48 States
Stacked Resources

-0.5
0
0.5
1
1.5
2
2014 2015 2016OPEC North America
Russia and Caspaian Sea Latin America
North Sea Other Non-OPEC
World crude oil and liquid fuels production growth
Mill
ion
ba
rre
ls p
er
da
y
Source: EIA, Short-term Energy Outlook, February 2015

-1
0
1
2
3
4
United
Sta
tes
Cana
da
Bra
zil
Chin
a
Om
an
Austr
alia
Ma
laysia
Ind
ia
Norw
ay
Sud
an
/S.
Sud
an
Oth
er
Nort
h S
ea
Kaza
khsta
n
Vie
tnam
Gab
on
Co
lom
bia
Russia
Syria
Egyp
t
Azerb
aija
n
Mexic
o
Un
ited
Kin
gd
om
2016
2015
2014
Non-OPEC crude oil and liquid fuels production
growth
(mill
ion
ba
rre
ls p
er
da
y)
Source: EIA, Short-term Energy Outlook, February 2015

0%
10%
20%
30%
40%
50%
60%
70%
Crude oil and petroleum product imports have
declined as a share of consumption
Source: EIA

Why does diesel fuel cost what it does?
57% 18% 13%
Crude Oil Excise
Taxes Transportation
and Retailing Refining
12%
Source: EIA, based on average 2014 price of $3.83 per gallon

Combined local, state and federal (cents per gallon) as of January 1,2015
One reason the price of diesel fuel varies by state
is that taxes vary

2013
2014
2015
Projected
2016
Projected
WTI Crudea
($/barrel) 97.91 93.26 55.02 71.00
Brent Crude
($/barrel) 108.64 99.02 57.56 75.00
Gasolineb
($/gallon) 3.51 3.36 2.33 2.73
Dieselc
($/gallon) 3.92 3.83 2.83 3.24
Heating Oil
($/gallon) 3.78 3.73 2.74 3.03
Natural Gasd
($/mcf) 10.30 10.91 10.28 10.56
Electricity
(cents/kwh) 12.12 12.49 12.63 12.85
EIA price forecast
a West Texas Intermediate b Average regular pump price c On-highway retail d Residential average
Source: EIA, Short-term Energy Outlook, February 2015.

Power and Politics

Expanding alternative fuels for transportation:
current laws

The Congressional
Budget Office
predicts the price
of diesel could rise
by up to 51 cents
per gallon and
gasoline by up to
26 cents per
gallon by 2017.

Save consumers up
to $5.8 billion a year
in lower fuel costs
Add 300,000 jobs to
U.S. economy in
2020
Reduce America’s
trade deficit by $22
billion in 2020
Why export crude oil?
Crude oil exports yield economic benefit across all 50 states
Source: ICF International and EnSys Energy,

87% of federal offshore acreage is off-limits to
development

Development of Canadian oil sands would benefit
the U.S. economy

Filling America’s tank Within 10 years Canada and U.S. can provide all our liquid fuel needs
U.S. Oil
Production
Oil from Canada
Biofuels
Oil from
Rest of World
Sources of liquid
fuel supply
in 10 years
53%
13%
10%
24%
72%
18%
10%
EIA Forecast Potential Sources: EIA; Wood Mackenzie
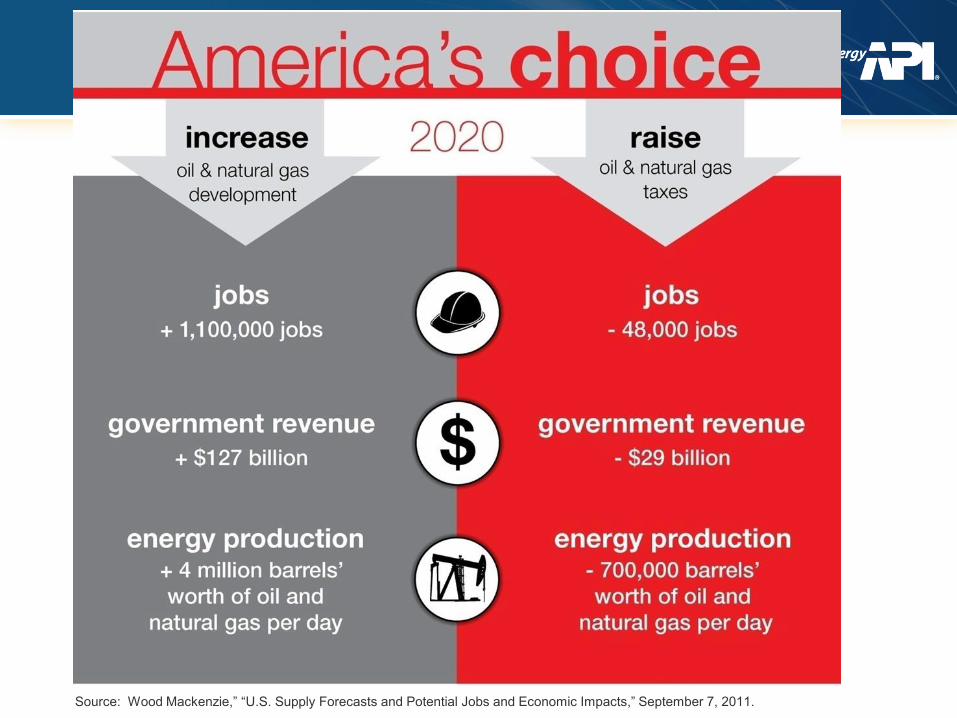
Source: Wood Mackenzie,” “U.S. Supply Forecasts and Potential Jobs and Economic Impacts,” September 7, 2011.

90% 86% 86% 85%
83%
72% 70%
65%
Lead to morejobs
Helpstrengthen
energysecurity
Helpstimulateeconomy
Help lowerenergy costs
SupportO&NG
development
SupportKeystone XL
pipeline
Supportoffshore
development
Increasingenergy taxes
may hurtconsumers
Harris Poll Results on Increased U.S. Oil and Natural Gas Development
Voters voice strong support for increased
domestic oil and natural gas development
Source: Harris Interactive telephone poll, November 5, 2014

For more information visit: www.api.org
www.energytomorrow.org
www.energycitizens.org