factors affecting workers rating of sewing operatorsfactors affecting workers rating of sewing...
TRANSCRIPT

International Journal of Current Engineering and Technology E-ISSN 2277 – 4106, P-ISSN 2347 – 5161 ©2018 INPRESSCO®, All Rights Reserved Available at http://inpressco.com/category/ijcet
Research Article
663| International Journal of Current Engineering and Technology, Vol.8, No.3 (May/June 2018)
Factors Affecting Workers Rating of Sewing Operators
Sharmin Akter#* and Tahsin Sharmila Raisa^ #Department of Textile Engineering, ^Department of Business Administration Daffodil International University, Bangladesh
Received 25 March 2018, Accepted 30 May 2018, Available online 01 June 2018, Vol.8, No.3 (May/June 2018)
Abstract The aim of this study is to research how different factors affect workers rating of sewing operators. In the study, the effects of age, gender, working experience, working environment, financial incentives, salary, leadership practice, training facilities, machine condition, working methods, education and working hour on workers rating are researched. It is posited that different factors have different effects on performance. Random sampling method was used to select 43 garments factory and research work continued to assemble primary data through a structured questionnaire among selected factories. Correlation is used to test null and alternative hypotheses and we used the data for presenting graphical pictures, tables and explanatory form. From the analysis we found that machine maintenance has highest weak negative relation with workers rating and the independent variable, education has lowest weak positive relation with workers rating.
Keywords: Workers rating, Garments, Performance, Industry 1. Introduction
1.1 Background of the research
1 The Ready-Made Garments (RMG) industry occupies a distinctive position in the Bangladesh economy. In the field of Industrialization Ready-Made Garments (RMG) industry is a hopeful step. It has given the opportunity of employment, especially innumerable uneducated women of the country. It is the leading exporting industry in Bangladesh, which experienced phenomenal growth during the last 25 years. By taking advantage of an insulated market under the provision of Multi Fiber Agreement (MFA) of GATT, it attained a high profile in terms of foreign exchange earnings, exports, industrialization and contribution to GDP within a short span of time. The industry plays a vital role in employment generation and in the provision of income to the poor. Nearly four million workers are directly and more than twelve million people are indirectly associated with the industry. The sector has also played a significant role in the socio-economic development of the country. As Bangladesh’s RMG sector is labor intensive; the production rate, product quality, on time delivery mostly depends on their performance. Most of the cases production does not achieve the planned efficiency, and this may impact on the production output. Not only that, the company appointed additional sewing machine operators to *Corresoponding author’s ORCID ID: 0000-0001-8103-6125 DOI: https://doi.org/10.14741/ijcet/v.8.3.21
complete shortages of the order quantity when the shipment date is closer to this kind of situations, the company bears an additional time and cost for the production. Many are of the opinion that production lines that consist of machine operators are not performing well, leading to production drop per day and per month. There are various reasons that lead to the drop of production efficiency i.e. the output by the production department. Therefore, it is necessary to analyze the factors affecting the underperformance of employees of the production department (N. Amarashinghe, 2015). 1.2 Objectives and limitations of the research This research has three main goals:
• To find out the factors influencing the performance level of employees • To examine the association between such factors and the presentation level of employees • To deliver endorsements to the administration in order to lessen probable effect of employee underperformance on target production. We included employees with fluctuating lengths of service periods in the sample. If the selected respondent does not hold practical experience within the organization, the comment might have been less than precise. On the other hand, we used the primary data collection method in the research and it was an open-ended feedback form. Many questions may

Sharmin Akter et al Factors Affecting Workers Rating of Sewing Operators
664| International Journal of Current Engineering and Technology, Vol.8, No.3 (May/June 2018)
confuse for the employees which may create contradiction of the accurate result. There are many terms like workers’ education, family background, and socio-cultural context, which limit our capacity to create an objective image out of their responses. Additionally, this research was carried out within a short span of time (4 months). This compelled to overlook certain areas pertaining to the study, which might have affected the final result. 2. Literature Review 2.1 Age According to Rajapaksha, U. G. (2015) age has positive relation with organizational commitment (OC) and job satisfaction. As mature person has more self-assurance and patience on the work place than a younger one (Rajapaksha, U.G.,2015). According to Wright and Hamilton (1978), with increase in age a person has greater level of self- esteem and confidence. Just like the same age has direct relation with organizational commitment (OC), if a worker is getting older then he supposes to be more committed with the organization (Wright and Hamilton,1978). 2.2 Gender
According to Dr. Saleem, Khan & Imran (2014) there is positive significant impact of gender on their working performance (Dr. M. A. Saleem, et al,2014). Besseleer & Sandstrom (2015) also found that gender differences have impact on research performance also. Conducting the same study after 10 years they found that productivity of male researchers has grown faster than of female researcher, but the field normalized (relative) citation impact indicators of male and female researchers remain about equal. (Besseleer & Sandstrom, 2015). 2.3 Working Experience Majumder & Begum (2000) found that garment workers, mostly female garment workers have had no previous work experience and it affects to the performance level of the factory. They also found that most of the female workers are young, unmarried, with less education of rural origin and from poor families (P. Paul Majumder, A. Begum, 2000).
2.4 Working environment
A well designed physical working environment is very important for productive work. Each organization should be designed their physical working environment to suit the requirements of workers. A well organized place of work minimizes material handling, improves efficiency, reduces worker exhaustion, and improves the workers' attendance, job
satisfaction, motivation, morale and health. Proper layout of the organization reduces accidents and promotes health and safety for the workers. And also better lighting system of the organization increases productivity and reduces difficulties and eye strain for workers. It is very important for any organization to improve the efficiency of works (Hiba, 1988). Parimalam (2006) investigated on the environmental factors of Garment Industry and its effects. They concluded that congested work area, improper ventilation, dust, excessive noise, high temperature and humidity inside the apparel plant are the major problems. They also found that all these problems affect for the concentration and skill of the operator to work (Parimalam as cited by Mandal, 2008). Furthermore, due to occupational hazards and workplace stress most of the female workers do not like to continue their work in the Garment Industry for a long time period and it will affect for the efficiency in the work place (Majumder & Begum, 2000). According to Nanzushi(2014), the work environment which encompasses several factors impacts on the way the employees perform their work. A comfortable and all inclusive workplace environment will boost the employees’ performance hence boosting the organizational performance. 2.5 Financial Incentives Among different incentives monetary incentives are the most researched. Several studies have researched how monetary incentives affect performance and motivation. Many of the researchers have found positive correlation between monetary incentives and performance. Stajkovic and Luthans (2001, p. 585─587) conducted an empirical study in two facilities which conducted the same tasks and located several miles apart from each other. According to study monetary incentives improved performance over 30 per cent compared with those who did not get incentives. Also other researchers have conducted similar empirical studies and found that performance increase in groups with monetary bonus systems whereas in control groups performance usually stays at the same level (Petty, Singleton & Connell 1992, p. 430; Hanlon & Taylor 1994, p. 97; Condly, Clark & Stalovicth 2003, p. 51). Monetary incentives frequently are suggested as a method for motivating and improving the performance of persons who use and are affected by accounting information (e.g. Atkinson, Banker, Kaplan, Young, 2001; Horngren, Foster, & Datar, 2000; Zimmerman, 2000), and their use in organizations is increasing(Wall Street Journal, 1999).
2.6 Salary
One of the purposes of someone being the employee or a labor of a company is to earn an income in the form of wages or compensation. Wages are earned can fulfill

Sharmin Akter et al Factors Affecting Workers Rating of Sewing Operators
665| International Journal of Current Engineering and Technology, Vol.8, No.3 (May/June 2018)
basic necessities such as food, clothing and housing. Every company in setting the amount of the wage paid to an employee must be viable, so that the lowest wage given to meet the needs of their life (Kanzunnudin,2007). The calculation of wage increases not only the necessities of worth living but also inflation, economic growth, and productivity (Iqbal,2013). Employee productivity measurement using the net value added shows wages and employee performance has a positive correlation, but the rate of growth of net value added per worker is faster than the rate of growth of wages per worker. Means that there are factors other than wages in improving employee performance that is non-monetary factors (Nayak and Patra, 2013). 2.7 Leadership Practice Leadership practices relate to employee performance is very important for our research. Leadership is the very big toll or the weapon of the association to achieve its objectives and without it, it is unviable for the organization to reach its main goal. On the other hand, without the leadership the application of tasks and their accomplishments are impossible. (Quinn Mills, 2005). Apparel industry is the most demanding and the busiest workplace where people never get enough time to accomplish job because of over load & hurry hour. So enthusiasm is very important to preserve people energetic in every working day. Only a merchandiser can lead effectively to improve efficiency (M. N. Alam,2016). The figure 1 shows why a merchandiser need to be a good leader.
Figure 1
Three characters every successful leader has To be successful at encouraging and leading others, leadership skills are the tools, performances & capabilities that person needs. There are three traits mentioned in figure 2 that every leader must have. If there is fail to reach these three tools, at least one of
below four things will eventually happen (P. Paul Majumder, A. Begum, 2000). 1) The person will be so depressed that he will be
burned out. 2) Team will fail finishing their tasks.
1. Team members will leave. 2. Team will lose admiration for the leader.
Figure 2: Success Pyramid & three traits that every successful leader possess
2.8 Training Facilities The Centre of Excellence for Bangladesh Apparel Industry (CEBAI) has acknowledged authorization as a registered training association from the Bangladesh Technical Education Board, the body that guarantees quality and offers certification for technical and vocational education. For the improvement of the quality of work and efficiency in garment factories and qualifying workers to have their skills formally recognized, CEBAI will play a big role. It will also deliver training and certification for instructors, evaluators and managers. The majority of the recipients will be women and 5 percent people with disabilities. CEBAI Training Centre has established in Ashuliya (Dhaka) and a variety of courses for basic sewing machine operators, guiding with administration skills are being taught in that area. Training approaches and prospectuses that meet the demands of industry have been introduced. New proficiency standards and curricula developed as part of the National Technical and Vocational Qualification Framework (NTVQF) offer basic operator skills in knitwear, denim, lingerie and woven products. Industry necessities are being encountered though directing of Enterprise Based Training (EBT) facilities in ten leading RMG groups which have seen over 4,100 workers skilled. For the higher wage and productivity, EBT center helps companies to eradicate helpers and improve the ability of existing workers/employees .Collaboration with Muslim Aid, UCEP and the Bangladesh-Korea Technical Training Centre has seen 480 disadvantaged people in Dhaka and Chittagong gain access to training and RMG jobs.
2.9 Machine Condition
Rapid computerization of production, closure of some uncooperative factories and the arrival of some other
Sharmin Akter et al Factors Affecting Workers Rating of Sewing Operators
666| International Journal of Current Engineering and Technology, Vol.8, No.3 (May/June 2018)
high-potential sectors has shriveled the total number of workers employed by the garment sector by 0.80 million over the last five years. In 2013, the total number of garment workers in Bangladesh stood at 4.4 million, which fell to 3.6 million now, said Syed Sultan Uddin Ahmed, executive director of the Bangladesh Institute of Labour Studies. One machine can make at least 10 workers in a factory jobless, according to Ahmed. Apart from mechanization, the closure of nearly 400 small and medium factories is also responsible for the decrease of garment workers. Increasing attention to value-added garment items such as blazers, suits, lingerie and sportswear is another reason for the decrease of the number of workers, according to industry insiders. On the other hand, for high-end garment items, a certain level of fulfillment is needed that cannot be accomplished by way of manual labor. 2.10 Working Condition For the collapse of Tazreen Fashions fire and Rana Plaza, ILO has given considerable importance on enhancing safety and working conditions in the ready-made garment sector. Major initiative steps are being taken to examine RMG factories for structural and fire safety. The measurement of the Labour Inspectorate, the Fire Service and Civil Defense Department is being significantly improved. Employers and workers are taking an active role in training mid-level managers, supervisors and trade union leaders on occupational health issues. Through training of female labor assessors and the establishment of a comprehensive inspection checklist that protects the rights of both women and men in the workplace, ILO has maintained the creation of a gender inclusive labor inspectorate in Bangladesh The work is approved by ILO's Enlightening Working Conditions in the Ready-Made garment Sector programmed supported by Canada, the Netherlands and the United Kingdom. 2.11 Education
The garments workers are less educated in garments factory in Bangladesh. Most of the workers can only write their names & address as most of them left the school after primary education. Few of them have gone to class eight (M.Z.A Bhuiyan, 2012). The following reason can be outlined the causes of less education amongst the garments worker:
a) Poverty: Most of the guardians of the garments
workers are poor and that is why they prefer to think job is better than education.
b) Ignorance: Most of the guardians are also illiterate. They think female education is not helpful to generate income of their family so they send their female member to work in the garments factory without making them more educated.
c) Easy accessibility of job: Anybody may have a job overnight if he/she tries which makes the young people to get involved in the garment factory.
d) Dowry system: It is the system of the society that, most of the guardians demanded huge amount of money in the marriage of their female children as dowry who are working in the garments factories. They are making money for themselves as they are keeping the money in the bank for their future.
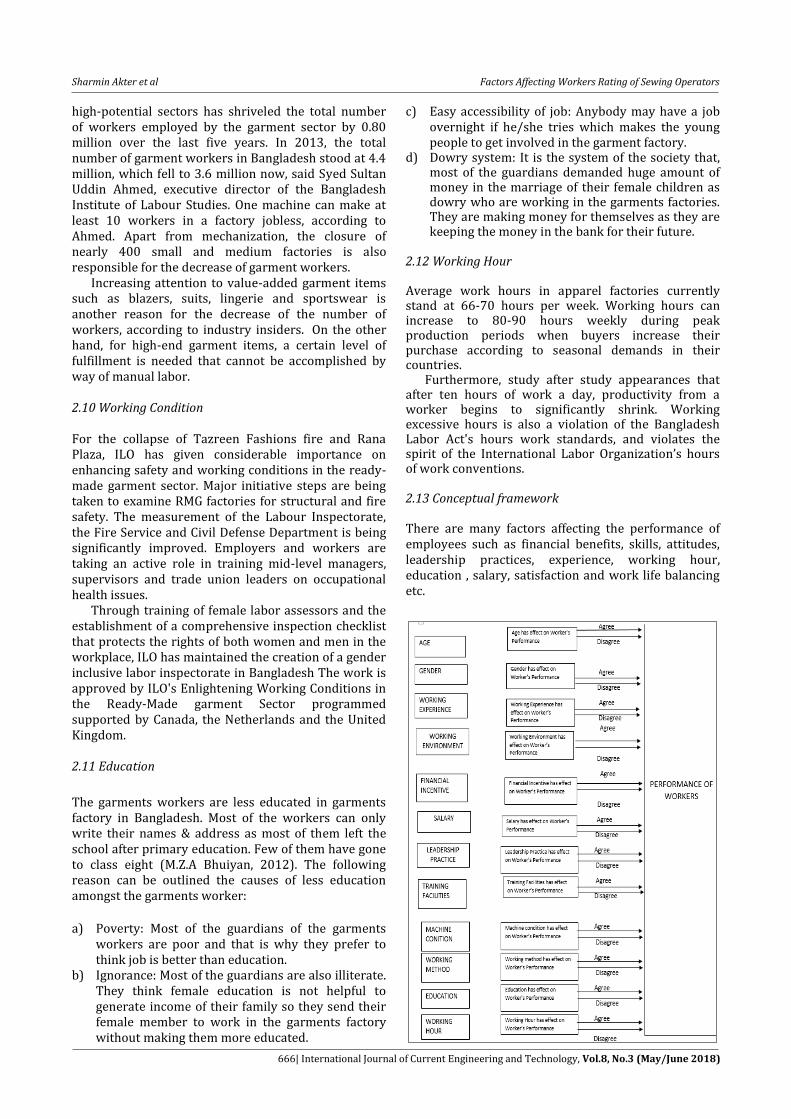
2.12 Working Hour Average work hours in apparel factories currently stand at 66-70 hours per week. Working hours can increase to 80-90 hours weekly during peak production periods when buyers increase their purchase according to seasonal demands in their countries. Furthermore, study after study appearances that after ten hours of work a day, productivity from a worker begins to significantly shrink. Working excessive hours is also a violation of the Bangladesh Labor Act's hours work standards, and violates the spirit of the International Labor Organization’s hours of work conventions. 2.13 Conceptual framework There are many factors affecting the performance of employees such as financial benefits, skills, attitudes, leadership practices, experience, working hour, education , salary, satisfaction and work life balancing etc.

Sharmin Akter et al Factors Affecting Workers Rating of Sewing Operators
667| International Journal of Current Engineering and Technology, Vol.8, No.3 (May/June 2018)
Table 2.1 Dependent and independent variables
Independent Variables Dependent Variable X1-Age
Y- Performance
X2-Gender X3-Working Experience
X4-Working Environment X5-Financial Incentive
X6-Salary X7-Leadership Practice X8-Training Facilities X9-Machine Condition X10-Working Method
X11-Education X12-Working hour
This can be further explained in a formula as follow. Y = f( X1,X2,X3,X4,X5,X6,X7,X8,X9,X10,X11,X12) 2.14 Hypothesis tested Following null hypothesis H0 and alternative hypothesis H1 were formulated to be tested. H0
a. Age does not relate to the performance of workers. b. Gender does not relate to the performance of workers c. Working Experience does not relate to the performance of workers. d. Working Environment does not relate to the performance of workers. e. Financial Incentive does not relate to the performance of workers. f. Salary does not relate to the performance of workers. g Leadership does not relate to the performance of workers. h. Training Facilities do not relate to the performance of workers. i. Machine Condition does not relate to the performance of workers. j. Working method does not relate to the performance of workers k. Education does not relate to the performance of workers l. Working Hour does not relate to the performance of workers
H1
a. Age relates to the performance of workers. b. Gender relates to the performance of workers c. Working Experience relates to the performance of workers. d. Working Environment relates to the performance of workers. e. Financial Incentive relates to the performance of workers. f. Salary relates to the performance of workers. g Leadership relates to the performance of workers. h. Training Facilities relate to the performance of workers. i. Machine Condition relates to the performance of workers.
j. Working method relates to the performance of workers k. Education relates to the performance of workers l. Working Hour relates to the performance of workers 3 Methods of data collection Two sources were referred for figures in this research specifically primary data and secondary data. Primary data Primary data is more significant to the research and this was collected through a questionnaire to test the hypothesis which was developed based upon the variable. We used the Likert scale with five different choices namely strongly disagree, disagree, neither agree nor disagree, agree and strongly agree. Secondary data Secondary data was collected through sources available in the production department and other departments such as Industrial Engineering Department, HR department. Related articles, internet, books etc. were also consulted in the search for secondary data. 4. Data analysis and presentation We used SPSS and MS Excel to analyze the data. On the other hand Bar charts, pie charts and scatter diagrams were used in order to support the interpretations of each variable .Pearson correlation was used to show the relationship between the independent variables and the dependent variable and narrations were provided to explain them in detail.
4.1 Introduction to Data Analysis For the research, a sample on classified source was selected and this sample characterized the total group of the target workforce which was vital to have an understanding of the sample selected. For understanding the backgrounds of the respondents, the following analyses were done. 4.2 Analysis of the Respondents
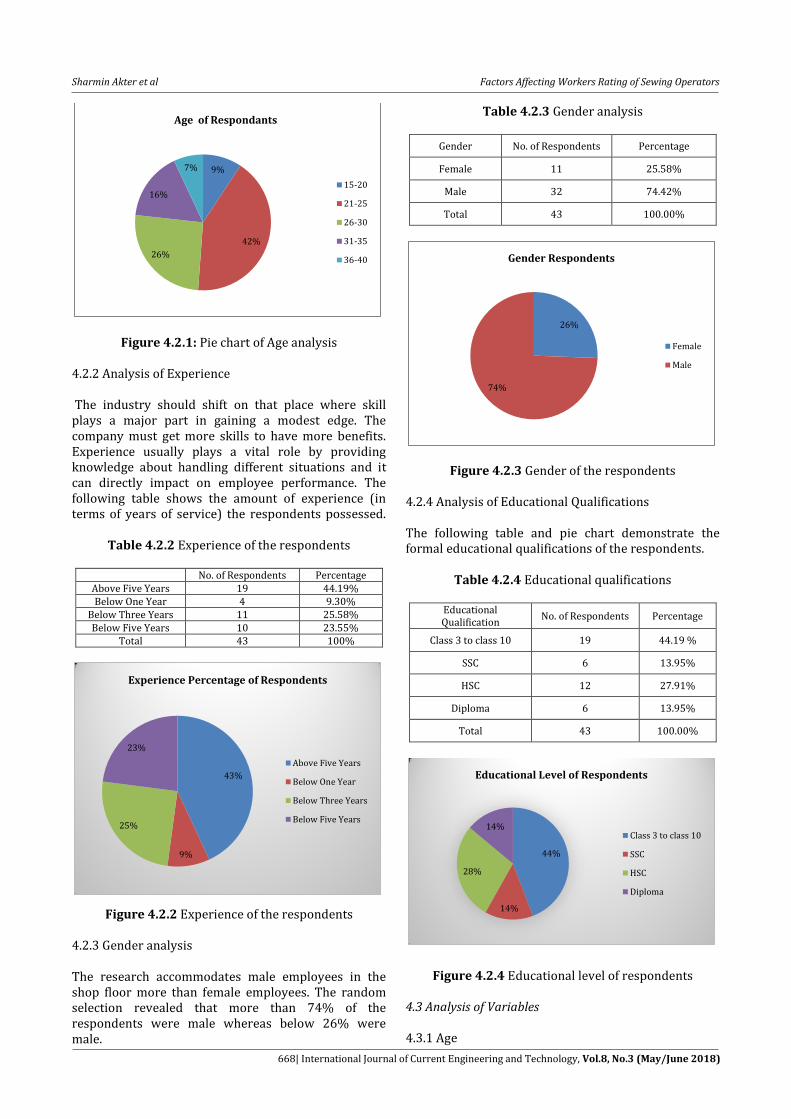
4.2.1 Analysis of Age In the research, 43 sewing associates were taken based on stratified random sampling. The sample consists of five age categories: 15-20, 21-25, 26-30, 31-35 and 36-40.
Table 4.2.1 Age Analysis of Respondents
Age Group No. of Workers Percentage of Age 15-20 4 9.30% 21-25 18 41.86% 26-30 11 25.58% 31-35 7 16.28% 36-40 3 6.98%
Grand Total 43 100%
Sharmin Akter et al Factors Affecting Workers Rating of Sewing Operators
668| International Journal of Current Engineering and Technology, Vol.8, No.3 (May/June 2018)
Figure 4.2.1: Pie chart of Age analysis 4.2.2 Analysis of Experience The industry should shift on that place where skill plays a major part in gaining a modest edge. The company must get more skills to have more benefits. Experience usually plays a vital role by providing knowledge about handling different situations and it can directly impact on employee performance. The following table shows the amount of experience (in terms of years of service) the respondents possessed.
Table 4.2.2 Experience of the respondents
No. of Respondents Percentage Above Five Years 19 44.19% Below One Year 4 9.30%
Below Three Years 11 25.58% Below Five Years 10 23.55%
Total 43 100%
Figure 4.2.2 Experience of the respondents
4.2.3 Gender analysis The research accommodates male employees in the shop floor more than female employees. The random selection revealed that more than 74% of the respondents were male whereas below 26% were male.
Table 4.2.3 Gender analysis
Gender No. of Respondents Percentage
Female 11 25.58%
Male 32 74.42%
Total 43 100.00%
Figure 4.2.3 Gender of the respondents 4.2.4 Analysis of Educational Qualifications The following table and pie chart demonstrate the formal educational qualifications of the respondents.
Table 4.2.4 Educational qualifications
Educational Qualification
No. of Respondents Percentage
Class 3 to class 10 19 44.19 %
SSC 6 13.95%
HSC 12 27.91%
Diploma 6 13.95%
Total 43 100.00%
Figure 4.2.4 Educational level of respondents
4.3 Analysis of Variables 4.3.1 Age
9%
42%
26%
16%
7%
Age of Respondants
15-20
21-25
26-30
31-35
36-40
43%
9%
25%
23%
Experience Percentage of Respondents
Above Five Years
Below One Year
Below Three Years
Below Five Years
26%
74%
Gender Respondents
Female
Male
44%
14%
28%
14%
Educational Level of Respondents
Class 3 to class 10
SSC
HSC
Diploma

Sharmin Akter et al Factors Affecting Workers Rating of Sewing Operators
669| International Journal of Current Engineering and Technology, Vol.8, No.3 (May/June 2018)
Correlations
Workers_Rating AGe
Workers_Rating
Pearson Correlation 1 -.072
Sig. (2-tailed) .647
N 43 43
AGe
Pearson Correlation -.072 1
Sig. (2-tailed) .647
N 43 43
There is low negative relationship between worker rating and age. 4.3.2 Gender
Correlations
Workers_Rating Gender
Workers_Rating
Pearson Correlation
1 .072
Sig. (2-tailed) .647
N 43 43
Gender
Pearson Correlation
.072 1
Sig. (2-tailed) .647
N 43 43
There is weak positive relationship between worker rating and gender.
4.3.3 Working Experience
Correlations
Workers_
Rating Working_
Experience
Workers_ Rating
Pearson Correlation 1 .047
Sig. (2-tailed) .767
N 43 43
Working_ Experience
Pearson Correlation .047 1
Sig. (2-tailed) .767
N 43 43
There is weak positive relationship between worker rating and working experience. 4.3.4 Working environment
Correlations
Workers_Rating Working_
environment
Workers Rating
Pearson Correlation
1 .042
Sig. (2-tailed) .789
N 43 43
Working environment
Pearson Correlation
.042 1
Sig. (2-tailed) .789
N 43 43

Sharmin Akter et al Factors Affecting Workers Rating of Sewing Operators
670| International Journal of Current Engineering and Technology, Vol.8, No.3 (May/June 2018)
There is weak positive relationship between worker rating and working environment. 4.3.5 Financial Incentives
Correlations
Workers_
Rating Financial_ incentive
Workers Rating
Pearson Correlation
1 .033
Sig. (2-tailed) .834
N 43 43
Financial incentive
Pearson Correlation
.033 1
Sig. (2-tailed) .834
N 43 43
There is weak positive relationship between worker rating and financial incentive. 4.3.6 Salary
Correlations
Workers_
Rating Salary
Workers_ Rating
Pearson Correlation 1 .094
Sig. (2-tailed) .550
N 43 43
Salary
Pearson Correlation .094 1
Sig. (2-tailed) .550
N 43 43
There is weak positive relationship between worker rating and salary. 4.3.7 Leadership practice
Correlations
Workers_
Rating Leadership
_practice
Workers_ Rating
Pearson Correlation
1 .071
Sig. (2-tailed) .649
N 43 43
Leadership_ practice
Pearson Correlation
.071 1
Sig. (2-tailed) .649
N 43 43
There is weak positive relationship between worker rating and working leadership practice. 4.3.8 Training facilities
Correlations
Workers_
Rating Training_ facilities
Workers_ Rating
Pearson Correlation
1 .096
Sig. (2-tailed) .542
N 43 43
Training_ facilities
Pearson Correlation
.096 1
Sig. (2-tailed) .542
N 43 43

Sharmin Akter et al Factors Affecting Workers Rating of Sewing Operators
671| International Journal of Current Engineering and Technology, Vol.8, No.3 (May/June 2018)
There is weak positive relationship between worker rating and training facilities. 4.3.9 Methods & Machine
a) In the questionnaire, there were four questions related to methods concerning the availability of Standard Work Sheet (STW), understanding of STW, completeness of STW and training on STW. The feedback has been summarized as follows.
Methods
Table 4.1 Summary of machine capability and availability
Methods Strongly disagree Disagree Neutral Agree Strongly Agree
Questions N % N % N % N % N % Q1 1 2.33% 0 0% 5 11.63% 22 51.16% 15 34.88% Q2 0 0% 1 2.33% 0 0% 33 76.74% 9 20.93% Q3 1 2.33% 4 9.30% 2 4.65% 27 62.79% 9 20.93% Q4 1 2.33% 1 2.33% 1 2.33% 32 74.42% 8 18.6%
1.74% 3.5% 4.66% 66.27% 23.83%
Figure 4.1 Summary of machine capability and availability
i. SWS Availability
Correlations
Workers_ Rating
SWS_ Availability
Workers_ Rating
Pearson Correlation
1 .310*
Sig. (2-tailed) .043
N 43 43
SWS_ Availability
Pearson Correlation
.310* 1
Sig. (2-tailed) .043
N 43 43
*. Correlation is significant at the 0.05 level (2-tailed).
As per table 4.8, the correlation test states there is a positive correlation between the worker’s rating and the SWS availability. However as it falls within the category of “0” to “0.5”, it can be viewed as a positive weak relationship. ii. Understanding of methods
Correlations
Workers_
Rating
Understanding_
of_methods
Workers_Rating
Pearson Correlation
1 -.044
Sig. (2-tailed) .777
N 43 43
Understanding_of_methods
Pearson Correlation
-.044 1
Sig. (2-tailed) .777
N 43 43
A negative relationship is observable in the scatter diagram (figure 4.17). Even the correlation test resulted 0.44 i.e. a weak negative relationship between two variables.
0.00%
10.00%
20.00%
30.00%
40.00%
50.00%
60.00%
70.00%
StronglyDisagree
Disagree Neutral Agree StronglyAgree

Sharmin Akter et al Factors Affecting Workers Rating of Sewing Operators
672| International Journal of Current Engineering and Technology, Vol.8, No.3 (May/June 2018)
iii. Methods completion
Correlations
Workers_
Rating Method_
completion
Workers_ Rating
Pearson Correlation
1 .311*
Sig. (2-tailed) .043
N 43 43
Method_ completion
Pearson Correlation
.311* 1
Sig. (2-tailed) .043
N 43 43
*. Correlation is significant at the 0.05 level (2-tailed).
There is positive weak relationship between workers rating and method completion. Iv Training on Applied methods
Correlations
Workers_
Rating Training_on_
applied_methods
Workers_Rating
Pearson Correlation
1 -.119
Sig. (2-tailed)
.447
N 43 43
Training_on_applied_methods
Pearson Correlation
-.119 1
Sig. (2-tailed)
.447
N 43 43
The value of Pearson Correlation is -.119. So we can say that there is very low relationship between workers rating and training on applied methods. b) In the questionnaire, there were three questions related to machine capability and availability, concerning machine maintenance, capability, easy operation of machines. The feedback has been summarized as follows. Machines
Machine Questions Q1 Q2 Q3
Strongly disagree
N 1 0 1 1.55%
% 2.33% 0% 2.33%
Disagree N 0 3 0 2.33%
% 0% 6.98% 0%
Neutral N 0 5 0 3.88%
% 0% 11.63% 0%
Agree N 33 28 28 68.99%
% 76.74% 65.12% 65.12%
Strongly Agree
N 9 7 14 23.26%
% 20.93% 16.28% 32.56%
i. Operating machine
0.00%
10.00%
20.00%
30.00%
40.00%
50.00%
60.00%
70.00%
80.00%
StronglyDisagree
Disagree Neutral Agree StronglyAgree

Sharmin Akter et al Factors Affecting Workers Rating of Sewing Operators
673| International Journal of Current Engineering and Technology, Vol.8, No.3 (May/June 2018)
Correlations
Workers_
Rating Operating_
machine
Workers_ Rating
Pearson Correlation
1 .075
Sig. (2-tailed) .633
N 43 43
Operating_ machine
Pearson Correlation
.075 1
Sig. (2-tailed) .633
N 43 43
There is very low positive relationship between worker rating and operating machine. ii. Machine maintenance
Correlations
Workers_
Rating Machine_
maintenance
Workers_ Rating
Pearson Correlation
1 -.154
Sig. (2-tailed) .324
N 43 43
Machine_ maintenance
Pearson Correlation
-.154 1
Sig. (2-tailed) .324
N 43 43
There is weak negative realtionship between workers rating and machine maintenance iii. Problem with machine
Correlations
Workers_
Rating Problem_
with_machine
Workers_ Rating
Pearson Correlation
1 -.030
Sig. (2-tailed) .847
N 43 43
Problem_ With machine
Pearson Correlation
-.030 1
Sig. (2-tailed) .847
N 43 43
There is low negative relationship between worker rating and problem with machine. 4.3.10 Education
Correlations
Workers_
Rating Education
Workers_ Rating
Pearson Correlation 1 .337*
Sig. (2-tailed) .027
N 43 43
Education
Pearson Correlation .337* 1
Sig. (2-tailed) .027
N 43 43
*. Correlation is significant at the 0.05 level (2-tailed).
There is weak positive relationship between worker rating and education. 4.3.11 Working hour

Sharmin Akter et al Factors Affecting Workers Rating of Sewing Operators
674| International Journal of Current Engineering and Technology, Vol.8, No.3 (May/June 2018)
Correlations
Workers_
Rating Working_
hour
Workers_ Rating
Pearson Correlation
1 -.086
Sig. (2-tailed) .581
N 43 43
Working_ hour
Pearson Correlation
-.086 1
Sig. (2-tailed) .581
N 43 43
There is weak negative relationship between worker rating and working hour.
4. Hypotheses result
Independent variable Correlation test
result against workers rating
Interpretation
Impact of results towards workers rating
-0.8
to
-1
-0.5
to
-0
.2
-0.2
to
0
0
0 t
o 0
.5
0.5
to
0.8
0.8
to
1
Age -.072 Weak negative Gender .072 Weak positive
Working Experience .047 Weak positive Working Environment .042 Weak positive
Financial Incentive .033 Weak positive Salary .094 Weak positive
Leadership Practice .071 Weak positive Training Facilities .096 Weak positive
Machine Condition
Operating machine 0.075 Weak positive Machine maintenance -0.154 Weak negative Problem with machine -0.030 Weak negative
Working Method
SWS Availability 0.310 Weak positive Understanding of
methods -0.044 Weak negative
Method completion 0.311 Weak positive Training on applied
methods -0.119 Weak negative
Education 0.337 Weak positive Working hour -0.086 Weak negative
Conclusions Meeting on time delivery is the most challenging task in RMG sector. As our garments sector is labor intensive, preparing labor to meet on time delivery is the wisest decision. Hence studying the factors affecting workers performance is important from managerial perspective. Towards this end, six factors (age, machine maintenance, problem with machine, understanding of methods, training on applying methods and working hours) shows weak negative relationship where eleven factors (Gender, working experience, working environment, financial incentive, salary, leadership practice, training facilities, operating machine, SWS availability, method completion, education) shows weak positive relationship with workers rating. However, there were a few limitations such as management influence, level of understating of the questionnaire to the workers, workers work pressure negate to provide information which may have had an impact over the research findings.
References
Amarasinghe, N (2015), Factors Affecting the
Underperformance of Employees*, Social Affairs: A Journal for the Social Sciences, Social Affair, Vol.1 No.2, 59-94.
Majumder, P.P., & Begum, A. (2000), The gender imbalance in the export oriented garment industry in Bangladesh, The world bank development research group,1-42.
Rajapaksha, U.G.(2015), Analysis of Factors affecting to Employee Turnover in Medium Scaled Apparel Industry in Sri Lanka, 6th International Conference on Business & Information ICBI – 2015, Faculty of Commerce and Management Studies, University of Kelaniya, Sri Lanka. pp 177-197.
Wright and Hamilton (1978). https://www.coursehero.com/file/p6gi1obi/Wright-and-Hamilton-1978-said-age-is-a-factor-on-how-committed-an-accountant/.
M. A. Saleem, D. I. Khan & M. Imran (2014), Gender preference and Job Performance a case study of Universities of Peshawar District (KPK) Pakistan, European Journal of Business and Management ISSN 2222-1905 (Paper) ISSN 2222-2839 (Online) Vol.6, No.31.

Sharmin Akter et al Factors Affecting Workers Rating of Sewing Operators
675| International Journal of Current Engineering and Technology, Vol.8, No.3 (May/June 2018)
P.v.d Basseleer & U. Sandstrom,(2016), Gender differences in research performance and its impact on careers: a longitudinal case study,Scientometrics.10.1007/s11192-015-1775-3
Hiba,J. C.(1988). improving Working Conditions and Productivity in the GarmentIndustry.1-166
Mandal,S(2008,August).Studies on Seam quality with Sewing Thread size, stitch density and Fabric properties, The Hong Kong Polytechnic University, 1-287.
Majumder, P.P., & Begum, A. (2000, June). The gender imbalance in the export oriented garment industry in Bangladesh, The world bank development research group ,1-42.
C. Nanzushi., ‘The effect of workplace environment on employee performance in the mobile telecommunication firms in nairobi city county’ School of Business University of Nairobi 1-50
Kanzunnudin, M. (2007), Effect of wages and supervision of employee productivity: A case Study on PT Tonga Tiur Son Zenith District Kragan, Fokus Ekonomi, 2(1), 11-20.
Iqbal, S. (2013), Labour Fate: Diluting Inequality. Jakarta: Kompas.
Nayak, S.R., Patra, S. (2013), Wage-labour productivity relationship in manufacturing sector of Odisha: An observed analysis. International Journal of Engineering Science Invention, 2(3), 8-11.
Stajkovic A. & Luthans F. 2001. Differential Effects of Incentive Motivators on Work Performance. The Academy of Management Journal, Vol. 44, No. 3. pp. 580─590
Petty M., Singleton B. & Connell D. 1992 An Experimental Evaluation of an Organizational Incentive Plan in the Electric Utility Industry. Journal of Applied Psychology, Vol. 77, No. 4, pp. 427─436
Hanlon S., Meyer D. & Taylor R. 1994. Consequences of Gainsharin, Group & Organization Management, Vol. 19, No. 1, pp. 87─111
Condly S., Clark R. & Stolovitch H. 2003. The Effects of Incentives on Workplace Performance: A Meta-Analytic Review of Research Studies. Performance Improvement Quarterly, pp. 46─63
Atkinson, A. A., Banker, R., Kaplan, R. S., & Young, S. M. (2001). Management accounting (3rd ed.). Upper Saddle River, NJ: Prentice-Hall
Horngren, C. T., Foster, G., & Datar, S. M. (2000). Cost accounting: a managerial emphasis (10th ed.). Upper Saddle River, NJ: Prentice-Hall.
Wall Street Journal. (1999). Linkingpay to performance is becominga norm in the workplace. 115(April 6), 1.
A. Q. Chaudhry, A. Javed. ‘Impact of Transactional and Laissez Faire Leadership Style on Motivation’International Journal of Business and Social Science Vol. 3 No. 7; April 2012.
M. N. Alam(2016), Role of leadership in merchandising. Textile Today. September 20, 2016
M. Z. A. Bhuiyan (Sept-Oct 2012), ‘Present status of Garment Worker in Bangladesh: An Analysis. IOSR Journal of Business and Management (IOSRJBM) ISSN: 2278-487X Volume 3, Issue 5, PP 38-44www.iosrjournals.org