factors associated with cotton ginning problems in tennessee
TRANSCRIPT

University of Tennessee, Knoxville University of Tennessee, Knoxville
TRACE: Tennessee Research and Creative TRACE: Tennessee Research and Creative
Exchange Exchange
Bulletins AgResearch
9-1963
Factors associated with Cotton Ginning Problems in Tennessee Factors associated with Cotton Ginning Problems in Tennessee
B. D. Raskopf
University of Tennessee Agricultural Experiment Station
Follow this and additional works at: https://trace.tennessee.edu/utk_agbulletin
Part of the Agriculture Commons
Recommended Citation Recommended Citation Raskopf, B. D. and University of Tennessee Agricultural Experiment Station, "Factors associated with Cotton Ginning Problems in Tennessee" (1963). Bulletins. https://trace.tennessee.edu/utk_agbulletin/304
The publications in this collection represent the historical publishing record of the UT Agricultural Experiment Station and do not necessarily reflect current scientific knowledge or recommendations. Current information about UT Ag Research can be found at the UT Ag Research website. This Bulletin is brought to you for free and open access by the AgResearch at TRACE: Tennessee Research and Creative Exchange. It has been accepted for inclusion in Bulletins by an authorized administrator of TRACE: Tennessee Research and Creative Exchange. For more information, please contact [email protected].

-~-
September 1963Bulletin 366
FactorsAsso •
't. ,. l-'
with· ~~"-
CottonGinnili9Problems in Tennessee
by B. D. Raskopf
The Universityof Tennessee
AgriculturalExperi'ment Station
John A. Ewing,Director
Knoxville

Summary
This study was designed to identify and evaluate the importanteconomic problems in the ginning industry in the state, to
develop some approaches to solving these problems, and to sum-marize and analyze the position of the ginning industry in termsof its importance, trends, capacity, changes in ginning machineryand equipment, and ginning costs.
-Some important factors associated with ginning problemsare: i) shifts in cotton production to West Tennessee; 2) acreagecontrols; 3) low annual volume per gin; 4) variables related togin capacity such as seasonality of gin operations, gin down-time,methods of harvesting, and variations in annual ginnings; and 5)increased fixed and operating costs of ginning.
-For the 10-year periods, 1942-51 to 1952-61, cotton produc-tion has been increasing in the 13 West Tennessee counties ofGibson, Crockett, Tipton, Fayette, Haywood, Lauderdale, Lake,Madison, Hardeman, Carroll, Weakley, Obion and Chester. In theother 8 cotton-producing counties of West Tennessee, 36 countiesof Middle Tennessee, and 18 counties of East Tennessee, cottonproduction has declined.
For the 9 years of acreage controls, 1950 and 1954 to 1961,the farmers in 53 of 62 cotton-producing counties under-plantedtheir cotton acreage allotments every year. During these yearsthe allotted acres not planted annually averaged 40,400 for 21West Tennessee counties, 16,745 for 29 Middle Tennessee counties,and 3,661 for 12 counties of East Tennessee.
-The shifts in the cotton production and acreage control pro-gram in many areas of the state has resulted in volume per gin toosmall to cover cost of ginning. Of the 182 gins in 1950 with volumeunder 1,000 bales per gin, 92 became inactive by 1962. Of the 92gins going out of business, 66 were in West Tennessee, 21 in MiddleTennessee, and 5 in East Tennessee.
- Low volume per gin has been an important factor affectingginning costs, particularly during years of acreage controls. Forexample, in 1950 the average volume per gin dropped 543 bales
2
from the preceding year and ginning cost rose $5.20 per bale. From1953 to 1957 the average volume per gin declined 734 bales andginning cost rose $11.43 per bale.
-As an average during the peak season of ginning in 1962 lessthan half of the ginning capacity generally was used. Unusedca-pacity was explained largely by the seasonality of gin operations,gin out-of-operation time (down-time) from many causes, and lowgin operating efficiency because of the higher proportion of hand-snapped and machine-picked cotton.
The total daily ginning capacity (two 12-hour shifts) of allgins in the state averaged 28,790 bales since 1947 with little annualvariation. On the other hand individual gin capacity as an averagefrom 1948 to 1962 increased 37% per gin, 36% per stand, and26% per saw. Total hourly or daily capacity of all gins has notincreased during the past 15 years because the increase in capacityper gin has been offset by the inactivation of 109 gins duringthis period.
Since 1941 the increase in fixed and operating costs of gin-ning has been at a faster rate than the increase in bales per gin.While volume per gin increased 1.4 times from 1941 to 1962, theginning cost per bale increased 6 times for depreciation and in-terest, 5.3 times for taxes, 3.8 times for management, 3 times forlabor, and around 2 times for wrapping, fuel and power, repairs,insurance, and miscellaneous costs.
Faced with the problems of low volume, faster harvesting,and increasing fixed and operating costs, many ginners have onlythe following alternatives: 1) increasing gin capacity and seedcotton storage facilities in an attempt to cope with the problemsassociated with changes in methods of harvesting; 2) engaging inother sidelines or business activities related to ginning; 3) re-ducing gin down-time; 4) increasing ginning charges; or 5) ceas-ing operations.
The alternative ginning systems presented in this report(Appendix G) indicate that gins with 5 to 8 bales capacity per hourhave low costs of ginning in volumes ranging from 3,000 to 6,000bales per gin each year. In 1962 there were only 51 gins withvolume above 3,000 bales. However, trends indicate that the num-ber of gins is likely to decline to around 200 within the next 10years with average volume per gin around 3,000 bales.
3

Contents
PAGESUMMAR Y 2
INTRO DUCTI0 N 5Importance of Cotton Industry in Tennessee 5Purpose of the Study 5Sources of Information 6
PRODUCTION FACTORS ASSOCIATED WITHGINNIN G PRO BLEMS 6
Changes in Production and Number of Gins 6Cotton Control Programs and Adjustments 10Low Volume per Gin 11Alterna ti ve Ginning Systems 12Transportation of Seed Cotton 14
GIN CAPACITY FACTORS ASSOCIATED WITHGINNIN G PRO BLEMS 15
Variables Related to Gin Capacity 15Seasonality of gin operations 16Gin-out-of -operation time 16Changes in methods of harvesting 19Variations in annual ginnings 19
Gin Capacity Difficulties and Approaches to Problems 20Increased gin capacity 20Unused gin capaci ty 20Modernizing gins 21Investment necessary to increase gin capacity 22
INCREASED COST FACTORS ASSOCIATED WITHGINNIN G PRO BLEMS 23
Ginning Costs Per Bale 23Increased Cost Difficulties and Approaches to Problems 24
Shift to higher ginning capacity per hour 24Gin business diversification and integration ---------------------24Increase in ginning charges 25Gin s becom ing inactive 26
APPEND IX 27
4

Factors Associated with Cotton Ginning Problemsin Tennessee
by B. D. Raskop£
I ntrod uctionIMPORTANCE OF COTTON GINNING INDUSTRY
IN TENNESSEE
Cotton is Tennessee's leading cash crop and during the past 10years the farm marketings of cotton averaged $106 million
dollars annually. In the marketing of the cotton crop the ginnersmake a substantial contribution to the economy of the state inginning and ginning services.
In 1962 the replacement value of 273 active gins in the statewas estimated at $32,000,000. Ginners' costs for plant deprecia-tion and interest amounted to $3,312,000. To gin the 1962 cropof 548,408 running bales, ginners paid $1,634,000 for labor,$1,475,000 for management, $1,294,000 for bagging and ties,$916,000 for repairs, $713,000 for fuel and power, $686,000 forinsurance, $466,000 for taxes, and $576,000 for supplies and serv-ices. The total cost to producers for ginning and ginning serviceswas estimated at $11,072,000 for the 1962 crop. For this year theginning costs as a proportion of the farm value of the crop averagednearly 11% or $20.19 per bale (Appendix 0).
Around 60,000 farmers in Tennessee depend upon ginners, notonly to gin their cotton, but to provide many other services. In1962 the ginners bought 63% of the lint cotton and 91% of thecottonseed produced by farmers. Many ginners provide supple-mentary services in connection with cotton production and market-ing, including 1) production credit; 2) new or improved plantingseed; 3) delinting; treating and testing seed; 4) use of trucks,trailers, and dusting machines; 5) sampling baled cotton; 6)furnishing cotton market news; 7) storing cotton at the gin yard;8) hauling cotton to the warehouse; and 9) aiding growers inplacing cotton under government loan.
PURPOSE OF THE STUDYIn recent years there has been a distinct shift in both acreage
and production location for cotton in the state, particularly during
5

the years of acreage controls. The impact of this shift in produc-tion on the cost and efficiency of ginning constitutes the majorproblem. The specific objectives of this study were to 1) identifyand evaluate the ginning problems, and 2) develop some alternativeapproaches to ginning problems.
SOURCESOF INFORMATIONAnnually, from 1928 to 1962, data were obtained from cotton
marketing and ginning studies conducted by the Tennessee Agri-cultural Experiment Station in cooperation with the Cotton Di-vision, Agricultural Marketing Service, USDA. Considerable usewas made of the annual cotton production reports of the Bureauof the Census, the Tennessee Crop Reporting Service, and the Ten-nessee Annual Statistical Reports, Agricultural Stabilization andConservation Committee.
The historical information on gin capacity was obtained fromthe Bureau of the Census; the Cotton Division, AgriculturalMarketing Service, USDA; and unpublished studies made by theTennessee Agricultural Experiment Station on ginning equipmentand practices from 1928 to 1962. The data on cost of ginning wereobtained annually from 28 gins during the period 1928 to 1940, and56 gins during the years 1941 to 1962. The basic data used in de-veloping alternative models or systems of ginning and seed cottonassembly functions were obtained from a survey of ginners, cottonproducers, and truckers during the 1962 crop year.
Production Factors Associated with GinningProblems
CHANGES IN PRODUCTION AND NUMBEROF GINS
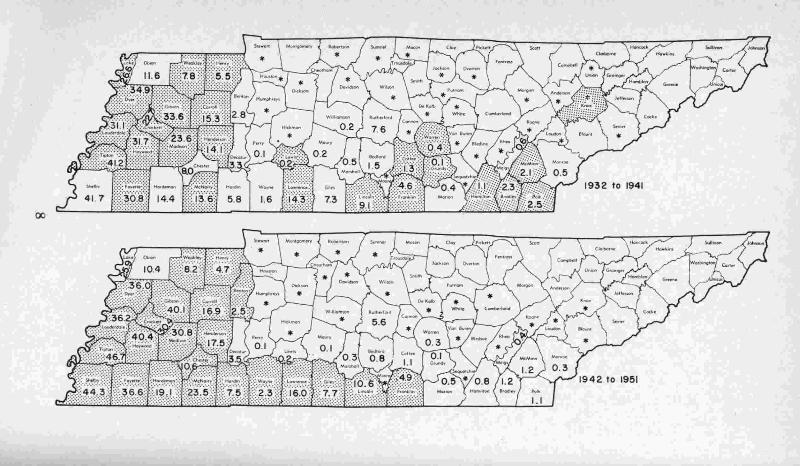
Cotton production in Tennessee by counties and geographicareas has been undergoing significant changes during the past 30years. On the basis of 10-year averages, 1942-51 to 1952-61,' therehas been considerable increase in 13 of the 21 counties of WestTennessee and a substantial decrease in each of the counties ofMiddle and East Tennessee (Fig. 1).lTen-year averages were used to level out the effects of annual variations due to climaticconditions, control programs, and production practices.
6

Average annual production in West Tennessee increased from492,000 bales during the 1942-51 period to 526,000 bales in theperiod 1952-61. Important increases in annual production occurredin the counties of Gibson, Crockett, Tipton, Fayette, Haywood,Lauderdale, Lake, Madison, Hardeman, Carroll, Weakley, Obion,and Chester. Production in Dyer County remained about the samebut declined in other West Tennessee counties including McNairy,Shelby, Henry, Decatur, Hardin, Benton, and Henderson.
Annual production in Middle Tennessee decreased from 50,626bales in the 1942-51 period to 41,783 bales in the 1952-61 period.A decrease was reported in each of the 31 counties producing cot-ton. Production in 13 counties of East Tennessee decreased from5,541 bales in the 1942-51 period to 1,961 bales during the 1952-61years.
Data shown in Appendix A indicate that both Middle and EastTennessee are steadily going out of cotton production. For theperiod 1932-41, Middle and East Tennessee combined averaged12.2% of the state crop but this proportion dropped to 7.7% duringthe 1952-61 years, and 5.9% in 1962.
The number of active cotton gins in Tennessee decreased froma peak of 833 in 1900 to 273 in 1962. Several factors have beenassociated with the rapid decline in number of gin plants. Com-mercial ginning in the state began about 1900 when improvementsin gin machinery aided in consolidating the industry into largecentral gins. Small planters found that the cost of operating theirgins was greater than the fees for the larger gins. By 1931 only9 plantation gins were operating in Tennessee.2 Shifts in cottonproduction have also affected the number of gins in many counties.
Although annual cotton production increased in the state from1932 to 1962 the number of gins, as an average, declined in eachcounty. During the past 30 years the greatest percentage decreasein number of gins occurred in the areas showing decreases incotton production, including the counties of Middle and East Ten-nessee, and Decatur, Benton, Hardin, and Henry counties of WestTennessee (Appendix A).
Changes occurring in the number of active gins by 5-yearperiods in counties in Tennessee since 1915 are shown in Appendix'B. D. Raskopf. The Cotton Ginning Industry in Tennessee, Tennessee Agricultural Experi-ment Station Bulletin No. 303, September, 1959.
7
00

5.3 1.4 11.4
* Less than 100 bales o Counties showing increase in production aver the previous 10- year average
Source: Based on Appendix A.
Figure 1: Annual cotton production in thousand 500-lb. bales by counties, Tennessee, 1932-41 to 1962.

B. From 1915 to 1962, gin numbers were reduced by 247 in WestTennessee, 23 in Middle Tennessee, and 19 in East Tennessee. By1962 all gins in 10 cotton-producing counties in Middle Tennesseeand those in 4 counties of East Tennessee became inactive.
COTTON CONTROL PROGRAMS ANDADJUSTMENTS
During the 38 years, 1925 to 1962, cotton acreage controlswere in effect for 19 years. In 3 of these years, 1933-35, cottonacreage was controlled through rental or retirement of acres; in16 years, 1938-43, 1950, and 1954-62, the control was accomplishedthrough cotton allotments. Changes in cotton production, cottonplanted acres, and number of gins were associated with the cottoncontrol programs beginning in 1933 (Fig. 2 and Appendix C).
500 LB. BALES(000)1200
1100
1000
900
800
700
600GINS
500 500
400 400
300 300
200 200
100 100
0
ACRESlOOO)1200rr"'T""1r-rT"T"'T""I'""T'''1''"'1'''T"T"'T''''1r-rT"T"'T""I'""T'''1''"'1'''T"T"'T''''1r-rT"T"'T""I'""T'''1''"'1''''''''
400
COT TON PRODUCTION "(500 LB. BALESl " " ,
I, .\ I'" ," I'l :\ I \ I " ~ , ,
,\ ",' "" , ' " \1" :', : \ ' I,,' \ I-' ~,I ,,' , ' , '
-;'-'r;--' --.:',:...,...--J'L.- .••.':....,'_ ' ~I'\ ' " '" I'\,' ~ \,• I ,I,
\
800
700
600
500
300
200
100
Source: Based on Appendix C.
Figure 2. Cotton acres allotted and planted, cotton production,and number of gins, Tennessee, 1925 to 1962.
10

The average for the 8 years of no cotton controls (1925-32),compared with the average for the recent 8 years of controls(1955-62), showed that cotton planted acres declined over 50%and number of gins 34%. On the other hand, during the sameyears, cotton production increased by 17% because of the increasein yield per acre. Co~ton yield per planted acre increased from anannual average of 207 pounds for the years 1925-32, to 494 poundsfor the years 1955-62.
During the 1950 and 1954-62 years, when acreage allotmentswere in effect, Tennessee cotton producers and ginners experiencedconsiderable difficulty in adjusting to the control program. From1950 to 1962 the number of cotton allotments in the state droppedfrom 74,370 to 58,540, allotted acres from 742,000 to 601,000,planted acres from 644,000 to 553,000, and number of gins from365 to 273 (Appendix C).
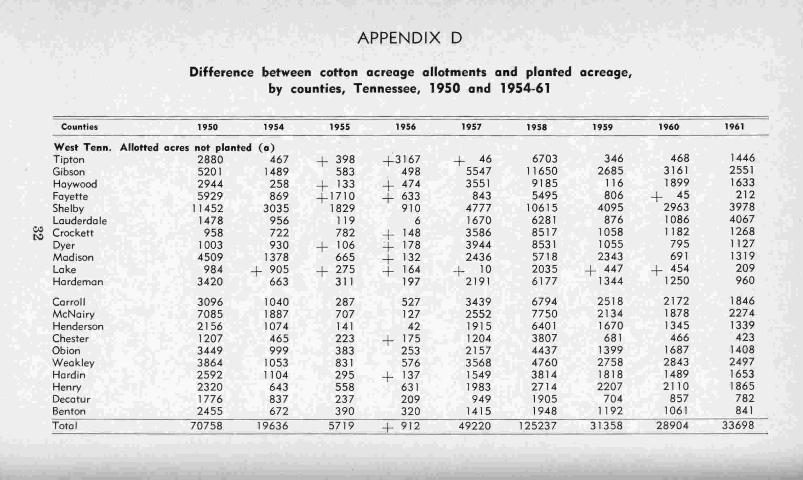
The difference between cotton acreage allotments and plantedacres by counties is shown in Appendix D for the years 1950 and1954 to 1961. These data indicate that as an average the farmersin 53 of the 62 cotton-producing counties under-planted their allot-ments every year.
Allotted cotton acres not planted in Tennessee ranged from6,000 in 1956 to 167,000 in 1958 and averaged 59,800 acres an-nually .. Ginnings per plant in 500-pound bales averaged 1,121 in1950, 1,293 in 1957, and 1,420 in 1958. Mainly because of lowvolume per gin during these years the ginning costs per bale werehigh (Appendixes C and F).
The approach to the problem of adjusting to the cotton controlprogram has been for the ASCS County Committees to encourageproducers to protect allotments for their farms by planting all oftheir allotment, or where the farmer knows that he will not plantpart or all of his allotment, to release this for reapportionment.In cases where farmers do not plant all of their allotments, andthese are released to the county committees, this preserves theallotment planting history of the individual farmer, the county,and the state.
LOW VOLUME PER GINProduction and ginnings per gin within a particular county
generally followed the same pattern during the past 30 years. On
11

the other hand, wide differences existed among counties in pro-duction and ginnings per plant (Appendix E). Among counties,average ginnings per plant ranged from 437 to 2,010 bales duringthe years 1932-41, from 727 to 2,363 bales during the years1942-51, from 814 to 3,157 bales during the 1952-61 period, andfrom 432 to 3,161 bales in 1962.
Although the trend in volume per gin for the state as a wholehas been upward since 1928, the increase in ginnings per plant hasnot kept pace with the increased cost of ginning (Fig. 3). Duringthe 13-year period, 1928-40, volume per gin averaged 1,048 runningbales and the estimated ginning cost $4.74 per bale. With the be-ginning of World War II, ginning costs per bale rose rapidly andreached $24.59 in the 1957 crop year with the low volume of 1,259bales per gin (Appendix F).
One approach to the problem of increased cost of ginning isthe more rapid retirement of sub-modern gins, permitting the re-maining plants to increase their volume substantially. The effectsof increased volume in lowering the ginning cost per bale are indi-cated in Figure 3 for the 8 crop years of 1944, 1948, 1951 to 1953,1955, 1958, and 1959. In each of these years, as volume per ginincreased over the preceding year, the cost per bale for ginningdeclined. As an average during these 8 years, each increase involume of 100 bales was associated with a decrease of 54 cents perbale in the cost of ginning where average volume per gin rangedfrom about 1,200 to 2,200 bales.
ALTERNATIVE GINNING SYSTEMSOne approach to the problem of determining the effects of
plant capacity and volume on ginning costs is through designinggin models as indicated in Appendix G. This analysis attempts todetermine the size of gins in capacity per hour, utilizing modernequipment, which would minimize the cost of ginning with givenvolumes under conditions of no seed cotton storage, and with seedcotton storage.
These data show that: 1) the cost of ginning on a bale basisdeclines rapidly for each model gin as the time of operation in-creases up to 1,200 hours; 2) at the lower volumes, generally under4,000 bales, the costs are higher for the larger than for the smallerplants; 3) as the gin increases in capacity per hour the cost perbale for labor and power and fuel declines; 4) gins with capacity
12

BALES DOLLARS2550,,-r-r-T'"'"'"1-r-r-T'"'"'"1-r-r-T'"'"'"1r-T"-r-,.....,r-T-r--r-r-T-r--r-r-T-r-r-r-T-r-r-T'"'"'"1-' 25.50
1950 19.50
IB.OO
16.5"
15.00
13.50
12.00
10·50
9.00
1.50
6.00
4.50
3·00
1.!l0
01960
IBOO
16'50
1500
1350
1200
GINNING COSTVPER BALE ($l
1950 19551935 1940 1945
Source: Based on Appendix F.
Figure 3. Running bales of cotton ginned per active gin and esti-mated ginning cost per bale, Tennessee, 1928-62.
of 5 to 8 bales per hour have the lower costs of ginning in volumesranging from 4,000 to 6,000 bales, under conditions of no seedcotton storage and no seed cotton assembling costs; and 5) somegins might be able to increase their volumes and reduce per-balecosts through adding seed cotton storage facilities.
For example, in Gin model B (Appendix G) the cost of ginningwith a volume of 3,000 bales is estimated at $15.35 per bale. If
13

this volume could be increased to 5,000 bales with 2,000-bale storagefacilities, the total ginning cost per bale might be reduced to $13.97.
Data in Appendix G indicate that the small capacity gin (2.5bales per hour) has the lowest ginning cost per bale up to the3,000 bales. However, nearly all gins of this capacity level havebecome inactive in the state (Appendix N). The plants with highercapacity in bales per hour have been able to secure a greatervolume per gin.
In the 1962 crop year, 8 gins with 3.3 bales capacity per houraveraged 1,250 bales per plant; 90 gins with 4.2 bales capacityaveraged 1,600 bales; 13 gins with 4.5 bales capacity averaged1,850 bales; 43 gins with 5 bales capacity averaged 1,900 bales;78 gins with 5.6 bales capacity averaged 2,150 bales; 27 gins with6.6 bales capacity averaged 2,500 bales; 7 gins with 7 bales capacityaveraged 2,750 bales; and 7 gins with over 8 bales capacityaveraged 4,885 bales.
TRANSPORTATION OF SEED COTTON·The cost of assembling seed cotton at the gin is not included
in the ginning costs in Appendix G since this cost generally hasbeen borne by the producer. With the trend in the ginning industrytoward larger volume per gin and seed cotton storage at the gin,the cost of transporting cotton to the gin may become a cost ofginning. For this reason data were secured in 1962 on the cost oftransporting seed cotton to the gin.
A survey of truckers and producers in 1962 indicates that thecost per bale of transporting seed cotton to the gin varies con-siderably per bale, per hour, or per mile, according to the num-ber of miles traveled. Within a gin radius of 25 miles the costranges from about 13 cents per bale for the shortest hauls (round-trips), to $1.22 per bale for trips up to 25 miles (Table 1). Thesedata are based on the use of a %-ton truck and six 5-bale trailers-two trailers used in transit, two left in the field with the cottonpicker, and two left at the gin.
Based on season travel of 12,500 miles, the truck fixed costaverages 5 cents per mile and operating cost 5 cents per mile.Trailer cost averages 6 cents per mile. Truck driver labor averages$1.25 per hour. The cost per bale for transporting seed cottonfrom 2 to 50 miles increases about 2.225 cents per bale for eachadditional mile over a 2-mile haul.
14

Table 1. Estimated cost of transporting seed cotton by truck andtwo S-bale trailers, Tennessee, 1962
Truck and I Labor (b) All costs per round trip
Round-trip tra iler cost Time Cost Total Per bale Per hour Per milemiles $ (a) min. $ $ $ $ $
1 .16 53 1.10 1.26 .126 1.43 1.26002 .32 56 1.17 1.49 .149 1.60 .74508 1.28 74 1.54 2.82 .282 2.29 .3525
14 2.24 92 1.92 4.16 .416 2.71 .297120 3.20 110 2.29 5.49 .549 2.99 .274526 4.16 128 2.67 6.83 .683 3.20 .262732 5.12 146 3.04 8.16 .816 3.35 .255038 6.08 164 3.42 9.50 .950 3.48 .250044 7.04 182 3.79 10.83 1.083 3.57 .246150 8.00 200 4.17 12.17 1.217 3.65 .2434
(a) 16 cents per mile. (b) Includes time on road. in loading. and at the gin @ $1.25 per hour.
Gin Capacity Factors Associated withGinning Problems
VARIABLES RELATED TO GIN CAPACITY
The· potential daily ginning capacity in Tennessee, based onone 12-hour shift (10 hours of operation), increased from 8,424bales in 1906 to 15,048 bales in 1954, declined to 13,630 bales in1959 and since increased to 14,064 bales in 1962 (Appendix J).Although the number of active gins decreased from 702 in 1906to 273 in 1962, the average capacity per gin per hour steadily in-creased from 1.2 bales in 1906, to 5.2 bales in 1962 (Appendix J).
However, as an average for each ginning season, only a smallproportion of the potential ginning capacity in Tennessee has beenused. As shown in Appendix I, only 25 to 51 (12-hour shifts pergin) were actually needed to gin the crop during anyone of theyears 1930 to 1962. But during these seasons most gins were openonly from 68 to 169 days, the average being around 100 days. Thevariations in used ginning capacity, on an annual basis, is ex-plained mainly by seasonality of gin operations, gin out-of-operation time, changes in methods of harvesting, and variationsin production.
15
Seasonality of Gin Operati6ns
Seed cotton is not delivered in an even flow to gins becauseof variations in growing and harvesting due to weather conditionsand because of differences in methods of harvesting. As shownin Table 2, the cotton harvesting season in Tennessee is about 200days, extending from around September 1 to March 20 of the fol-lowing year.3 The periods, September 1 to 15, and November 14to March 20, are characterized by intermittent ginning. Used gincapacity as a percent of total potential capacity is low during theseperiods.
From September 1 to 15 during the 41 years from 1922 to1962, no cotton was ginned in 1923 and the most ginned was101,503 bales in 1956, requiring less than 7 of the 12 work days forginning with 12-hour shifts daily. From November 14 to March20, during the 41 years, the most ginned in one period, January16 to March 20, was 102,186 bales in 1945, requiring less than 8of the 53 work days for ginning with 12-hour shifts daily. In the1962 crop year, during the period September 1 to 15, and November14 to March 20, only 7 of the 116 work days were required forginning, and this is based on 10 hours of ginning in a 12-hour shift.
During the middle or peak periods, between September 16and November 14, enough seed cotton was received at the ginsduring some years to require more than one 12-hour shift per gindaily. In 1941, for example, 207,015 bales were ginned during theperiod, September 16 to 30, requiring 16 (12-hour shifts per gin).In 1922 the ginnings totaled 203,749 bales from October 1 to 17,requiring 20 (12-hour shifts per gin).4
Gin Out-of-Operation Time
The low percentage of used ginning capacity, on an annualbasis, is partly explained by the different kinds of gin down-time(Table 3). For example, during the 1962 crop year, of the 201days from September 1, 1962, to March 20, 1963, about 92% ofthe time (4,434 hours) might be classed as down-time. This gin
3Ginning periods are based on reports issued by the Bureau of the Census for cotton ginnedduring the periods September 1-15 and 16-30, October 1-17 and 18-31, November 1-13 and14-30, December 1-12, December 13 to January 15, and January 16 to March 20.
4A 12-hour shift includes 12 hours of ginning and about 2 hours of gin down-time or stopsreQuired for care of machinery ~ failures in gin machinery and equipment, gin fires, rest stops,and brief waiting periods for seed cotton.
16

Table 2. Least and most running bales of cotton ginned annuallyin specified periods, and time needed for ginning, 1922-62
Least ginned Most ginnedduring period • during period 1962 crop
12-hour 12-hour 12-hourCensus Days 1922 shifts 1922 shifts shiftsginning Work- to needed for to needed for needed forperiods Total days 1962 ginning 1962 ginning Total ginning
No. No. Boles No. Boles No. Boles No.
Sept. 1-15 15 12 0 (a) 0 101503 ( i) 6.8 48589 3.516-30 15 12 0 (a) 0 207015 (j) 16.0 123786 8.8
~ Oct. 1-17 17 15 69987 (b) 5.4 203749 (k) 20.1 186456 13.3-:J 18-31 14 12 39736 (c) 3.8 146596 (I) 10.1 96782 6.9
Nov. 1-13 13 10 20736 (d) 1.5 116487 (m) 10.1 46883 3.414-30 17 14 18417 (e) 1.2 77237 (n) 5.6 29940 2.1
Dec. 1-12 12 10 3939 (f) 0.3 53397 (a) 4.1 8703 0.6Dec. 13-Jan. 15 34 27 2693 (g) 0.2 66224 (p) 5.1 5156 0.4Jan. 16-Mar. 20 64 53 447 (h) 0.1 102186 (q) 7.9 2113 0.2
(a) 1923. (b) 1945. (c) 1923. (d) 1947. (e) 1956. (f) 1942.(g) 1954. (h) 1954. (i) 1956. (j) 1941. (k) 1922. (I) 1948.(m) 1931. (n) 1960. (0) 1940. (p) 1937. (q) 1945.
Source: Computed from Annual Reports of the Bureau of the Census and Appendix J.

Table 3.-Estimated gin aut-of-operation time and ginning capacityby specified periods, 273 gins, Tennessee, 1962 crop year
Gin down-time Actual gin capacity(d)
Sundays G~nnings ExcludingCensus and Short Long Ginning in Sundays,ginning Total legal stops stops time running holidays, and Percentperiod time holidays (a) (b) (c) bales short stops used
Hours Bales Bales
Sept. 1-15 360 72 8 245 35 48589 337536 14.416-30 360 72 18 182 88 123786 337536 36.7
Oct. 1-17 408 48 28 199 133 186456 421920 44.218-31 336 48 14 205 69 96782 337536 28.7
~ Nov. 1-13 312 72 8 199 33 46883 281280 16.700 14-30 408 72 4 311 21 29940 393792 7.6
Dec. 1-12 288 48 2 232 6 8703 281280 3.1Dec. 13-Jon. 15 816 168 1 644 3 5156 759456 0.7Jon. 16-Mor. 20 1536 264 1 1269 2 2113 1490784 0.2All periods 4824 864 84 3486 390 548408 4641120 11.8
(a) Includes 2 hours of each 12-hour shift for cleaning, lubricating, adjusting and repairing gin machinery, brief waiting periods for seed cotton, mechanicalfailut"es in gin machinery and equipment, overheating in the driers, choke-ups in gin equipment, rest stops, and fires occurring from various causes'.
(b) Long waiting periods for seed cotton, stops caused by rainy weather or gin breakdowns, or complete shutdown for the season.
(c) Number of bales ginned divided by average ginning capacity of 1,406.4 bales per hour for 273 gins-see Appendix J.
(d) Rated gin capacity in Tennessee in 1962 averaged 6.4 bales per gin per hour or 1,758 bales per hour for 273 gins. Actual capacity averaged 5.2 balesper gin per hour or 1,406.4 bales per hour for 273 gins. Actual capacity averages 20%' less than rated capacity and is accounted for in differences in con-dition and weights of seed cotton per bale, time resulting from individual gin stands running idle or empty to avoid mixing of cotton of different producers,or because the conventional feeding system does not keep all of the stands supplied with seed cotton all of the time.
Source: Computed from reports of the Bureau of the Census and a survey of gins made in Tennessee during the 1961 and 1962 crop years.

down-time included 864 hours of Sundays and legal holidays whenmost of the gins did not operate; 84 hours for short gin stopsduring workshifts ; and 3,486 hours for long stops-mainly waitingperiods for seed cotton, stops caused by rainy weather, stops forrepair of gin machinery, or complete shutdown.
In actual operations during the 1962 crop year many ginsclosed after about 3 months operation, September to November, oroperated only 1 to 3 days a month from December to March. Theginning season for the 273 gins averaged 100 days (2,400 hours)with only 390 hours of actual ginning time.
Changes in Methods of HarvestingOne study in Tennessee showed that actual gin capacity per
hour averages about 20% lower than rated capacity.s Much ofthis difference annually can be attributed to the high proportionof hand-snapped, and to a lesser extent, machine-picked cottonwhich generally contains a larger amount of foreign matter thanfound in hand-picked cotton. For example, in 1962 about 24% ofthe 555,000 bales of cotton produced was hand-snapped and re-quired an average of 580 pounds more seed cotton to gin a balethan was needed for hand-picked cotton. In the same year, 41%of the crop was machine-picked and required an average of 58pounds more seed cotton to gin a bale than was needed for hand-picked cotton (Appendix K).
Hand-snapped cotton, and to a lesser extent, machine-harvested cotton, place a heavier load on the conveying, drying,cleaning, and extracting machinery ahead of the gin stands. Todeliver the same weight of cleaned and conditioned seed cotton tothe gin saws, the conventional feeding systems must handle con-siderably more hand-snapped or machine-picked cotton than isrequired with hand-picked cotton.S The increased amount neces-sary with hand-snapped cotton averaged 46% during the 1945-62period, and varied by years from 36% to 60%. The increasedamount with machine-picked cotton averaged 8% during the1954-62 period and varied annually from 0 to 12% (Appendix K).
Variations in Annual GinningsChanges in the volumes of the cotton crops from year to year
exert considerable influence on gin capacity needed during various~B. D. Raskopf~ The Cotton Ginning Industry in Tennessee, Tennessee Agricultural ExperimentStation Bulletin No. 303, September, 1959.
19

periods in the season. When cotton ginnings in Tennessee aregrouped by 10-year periods, volumes of cotton ginned from Sep-tember to November during the past 40 years have changed con-siderably. For the 10-year periods, 1922-31 to 1952-61, the increasein ginnings averaged 37,344 bales during September 1-15 period,62,148 bales for the September 16-30 period, 29,401 bales for theOctober 1-17 period, 23,551 bales for the October 18-31 period, and13,253 bales for the November 1-13 period (Appendix L).
These changes in ginnings were partly due to the increase inproduction in the state. Cotton ginnings rose from an average of416,546 bales during the years 1922-31, to 556,017 bales for theyears 1952-61, an increase of 3,500 bales annually.
Gin Capacity Difficulties and Approaches to Problems
The factors of seasonality of gin operations, gin out-of-operation, changes in methods of harvesting, and variations incotton production have resulted in four important problems in theTennessee ginning industry: 1) how to cope with the need for in-creased ginning capacity per hour during the season; 2) how toreduce the rate of unused capacity during slack ginning periods;3) how to modernize gins to meet the changing conditions inmethods of harvesting and ginning capacity; and 4) what summust be invested to boost gin capacity for periods of peak harvest.
Increased Gin CapacityDuring the past 40 years the Tennessee ginners have increased
gin capacity sufficiently to meet the need for peak season ginningsduring anyone year (Table 2). As indicated in Appendix I, al-though the number of gins declined and annual ginnings increasedfrom 1906 to 1962, the total ginning capacity of all gins per 12-hour shift has about kept pace with the increase in ginnings.While the number of gins declined from 702 in 1906 to 273 in 1962,the number of gin stands per gin increased 89% and the numberof saws per gin increased 145%. During this period, as an averageper hour, gin capacity ~ncreased 76% per saw, 114% per gin stand,and 333 % per gin (Appendix J).
Unused Gin CapacityThere are two possible approaches to the problem of unused
gin capacity. One is by shortening the period of time when the
20

gin is open for business during the 200-day season when cotton isharvested. As indicated previously, many gins in Tennessee duringthe 1962 crop year closed after about 90 days of operation or op-erated only a few days a month after the peak of the ginningseason.
During periods of actual gin operation many ginners are mak-ing special efforts to decrease gin down-time by: 1) providingadditional sucker pipes for unloading long trailers so cotton is al-ways available for ginning; 2) installing bulk or master feed con-trol systems to keep gin stands supplied with cotton all of thetime; and 3) devising split stream arrangements in cotton drying,over-head cleaning, and in lint cleaning. During 1962 crop year, ofthe 273 gins, 191 were equipped with two or more drying stages,170 had cotton overflow bypass systems, and 42 had bulk or masterfeed control systems.
A second possible approach to the problem of unused gin ca-pacity is to store seed cotton in trailers, baskets, or cotton houses,and gin it during slack periods.6 This method offers some possi-bility of stabilizing ginning costs per bale by operating gins at ornear their efficient rates of ginning for a longer period of time(Appendix G). About one-third of the gins in 1962 reported seedcotton storage facilities, ranging from 5 to 300 bales per gin.
Modernizing Gins
Since 1935 vast changes have occurred in the use of additionalauxiliary equipment in gins for conditioning, cleaning, extracting,and other ginning functions. Ginning machinery and equipmentadditions became necessary as ginning capacity increased (Ap-pendix J), and as methods of harvesting changed (Appendix K).
From 1935 to 1961 the number of active gins declined from438 to 277, but gin capacity per hour per gin increased from 3 to5 bales. The proportion of gins equipped with seed cotton driersincreased from 1% to 99%, overhead seed cotton cleaners from55% to 94%, overhead seed cotton extractors from 16% to 81%,lint cleaners from 0 to 99%, and fire prevention and fire fightingdevices (green boll traps, magnets, and carbon dioxide systems)from 10% to 63% (Appendix M).
6Storing Seedcotton in Trailers, Trailer Baskets, and Cotton Houses in Arkansas and l\Ussouriin 1961 and Its Effect on Quality and Value of Lint, Agricultural Experiment Stations ofArkansas and Missouri, Mimeograph Series 119, November. 1.962.
21
The added investments and other fixed and operating costsrepresented by such equipment have .contributed to the upwardtrend in ginning costs. From 1941 to 1961, ginning costs increased3 times per bale. The average replacement value per gin rose from$13,840 in 1941 to $111,660 in 1961. Annual depreciation and in-terest on investment per gin increased from $1,384 in 1941 to$11,166 in 1961. All fixed and operating costs per bale showedconsiderable increases from 1941 to 1961 (Appendix 0). As ginsmodernized and gin investment increased, there were annual in-creases in costs of labor and management, repairs and maintenance,fuel and power, insurance, taxes, and sundries.
While ginning costs from 1941 to 1961 increased over 4 timesper gin and 3 times per bale, it is difficult to determine the pro-portion of this increase which is due to gin modernization. Thisis true, because during the 21-year period, wide variations amonggins existed: in bales ginned per gin; types of ginning machineryand equipment; length of ginning season; size of gin; number inthe gin crew; hourly rate of pay; gin shut-down time; servicesoffered by ginners; kind and amount of fuel and power used;methods of assessing gin charges; methods of depreciation; typeand amount of insurance carried; rates and bases of assessmentfor taxes; and changes in price levels of equipment and supplies.
In the approach to the problem of gin modernization, highvolume per gin has been a key factor in holding down ginningcosts. During the years 1958 to 1961, gin modernization consistedof adding several new and larger gin plants; remodeling gin ma-chinery, equipment, and buildings; and installing much auxiliarygin equipment. However, during these 4 years volume per gin rosefrom 1,382 to 1,987 bales and ginning costs per bale declined from$23.32 to $19.62 (Appendix M).
Investment Necessary to Increase Gin CapacityTo aid in answering the question as to the investment neces-
sary to increase gin capacity for periods of peak harvest, the ginsin Tennessee were grouped for the crop years 1955 and 1962 (Ap-pendix N) into the following: by number and size of gin stand,by gin capacity per hour, and by gin plant investment.
The replacement value of 335 gins in 1955 is estimated at$19,611,000 or $58,540 per gin. By 1962 the number of gins de-clined to 281 (273 active) but replacement value increased to
22

$32,016,000 or $117,275 per gin. Modernization of gins during the8 years, together with advance in price of machinery and buildings,contributed mostly to the higher gin investment. From 1955 to1962, hourly capacity per gin increased from 4.4 to 5.2 bales andmany gins installed auxiliary gin equipment as indicated in Ap-pendix M.
Data in Appendix N indicate that, in gin remodeling, an in-crease in capacity of 1 bale per hour was associated with anincrease in gin plant investment of about $8,550 in 1955, but thishad increased to $15,000 in 1962. For example, in 1962 in Tennes-see there were 90 gins with hourly average capacity per gin of4.2 bales and gin replacement value estimated at $103,000 per gin.As an average, a gin in this group could be converted to a capacityof 8 bales per hour at a cost of $57,000, and to 12 bales per hourat a cost of $117,000.
In making the conversion to higher capacity in bales per hour,the ginner has the choice of many different combinations of makesand types of gin machinery. Today in Tennessee there are about10 different new systems with saws ranging from 12 to 18 inchesin diameter and from 75 to 177 in number per stand. Whenmatched with the proper auxiliary equipment, the new model ginstands have from 2 to 3 times the hourly capacity of the samenumber of gin stands bought new a few years ago.
Increased Cost Factors Associated withGinning Problems
GINNING COSTS PER BALEDuring the past 35 years or from 1928 to 1962, total ginning
cost-as based on an 11-year moving average-increased about 56cents per bale annually. Most of this increase occurred afterWorld War II (Fig. 3). Based on the data obtained annually from56 ginners, the cost per bale for ginning rose from an average of$6.54 in 1941 to $20.19 in 1962. The 11-year moving average in-crease was 67.5 cents per bale annually. During the 'same yearsthe average volume per gin rose from 1,375 to 1,980 bales, or over36 bales annually when based on the 11-year moving average (Ap-pendix 0).
23

During the past 22 years, major fixed and operating costs perbale showed annual average increases of 26.2 cents for deprecia-tion and interest, 9.9 cents for management, 8.2 cents for labor,5.5 cents for repairs and maintenance, 4.8 cents for power andfuel, 4.2 cents for bagging and ties, 2.8 cents for taxes, 2.0 centsfor insurance, and 3.9 cents for miscellaneous costs. Since 1941the increase of each major fixed and operating cost has been ata faster rate than the increase in hales per gin. While volume pergin increased 1.4 times from 1941 to 1962, the ginning cost perbale increased 6 times for depreciation and interest; 5.3 times fortaxes; 3.8 times for management; 3 times for labor; and about 2times for wrapping, fuel and power, repairs and maintenance, in-surance, and miscellaneous costs.
INCREASED COST DIFFICULTIES ANDAPPROACHES TO PROBLEMS
With the upward trend in all fixed and operating costs ofginning in recent years many ginners are faced with one or moreof the following alternatives: 1) try to minimize the cost of op-erations by shifting to higher ginning capacity per hour; 2) adoptbusiness diversification and integration; 3) increase the charge forginning; or 4) become inactive.
Shift to Higher Ginning Capacity Per HourThe trend in the ginning industry in Tennessee is toward
higher ginning capacity in bales per hour in an attempt to minimizethe costs of ginning and at the same time cope with the problemsassociated with rapid changes in methods of harvesting. A sur-vey of ginners in 1962 indicated that within the next 10 years gincapacity per gin for all active gins is likely to average around 8bales per hour.
Gin Business Diversification and Integration
Many of the ginners in the state, faced with increased op-erating costs, have found survival possible by engaging in otherbusiness activities related to ginning. All ginners bought cotton-seed from farmers; 95% bought cotton from producers; and 60%were engaged in one or more activities of supplying farmers withcredit for cotton production, selling producers n8W or improved
24

seed, selling fertilizer, feed and supplies, and hauling baled cottonfrom the gin to the warehouse. In 1962 about 63% of all the lintcotton and 91% of the cottonseed produced in the state was boughtby the ginners (Appendix P).
Increase in Ginning Charges
Ginning charge per running bale in Tennessee averaged $4.74for the period 1928 to 1940. From 1941 to 1962 the charges in-creased from $5.41 to $15.95 or an annual average increase of50 cents per bale (Table 4).
Table 4. Ginning charge per bale in Tennessee, 1928-40and 1941-62
Crop Ginning charge Crop Ginning charge
yeor SOO-Ib. bale Running bale year SOO-Ib. bale Running bale
$ $ $ $
1928-40 4.63 4.74 1952 10.42 10.661941 5.21 5.41 1953 10.91 11.161942 5.52 5.70 1954 11.12 11.401943 5.77 5.92 1955 11.86 12.001944 6.07 6.36 1956 12.04 12.491945 6.17 6.42 1957 13.26 13.541946 7.75 7.91 1958 13.44 13.551947 7.77 7.97 1959 13.96 13.991948 8.40 8.77 1960 14.30 14.471949 8.48 8.62 1961 15.42 15.451950 10.02 10.12 1962 15.71 15.951951 10.40 10.51
Source: Annual Reports on Charges for Ginning Cotton. 1928-62. Cotton Division, AgriculturalMarketing Service, USDA.
Data on ginning charges (Table 4) and costs of ginning (Ap-pendix F) indicate that as an average, custom ginning as a busi-ness itself has not been profitable in Tennessee since 1940. Foreach of the years 1941 to 1962, as an average, the cost per balefor ginning exceeded the ginning charge. During this period aboutone-third of the gins annually operated at a loss. Most of the ginsoperating at a loss have gone out of business. The number ofactive gins in Tennessee declined from 423 in 1940 to 273 in 1962.Some ginners used profits made from other operations to offsetlosses incurred in ginning.7
'B. D. Raskopf, The Cotton Ginning Industry in Tennessee, Tennessee Agricultural ExperimentStation Bulletin No. 303, September, 1959.
25

Gins Becoming Inactive
The number of gins in Tennessee during the past 20 yearsdeclined at the rate of nearly 7 per year. This trend is likely tocontinue during the next 10 years for the following three reasons:
1) Data in Appendix A indicate that cotton production is de-clining in 80% of the 75 cotton-producing counties. In the 61counties where production declined during the 10-year periods,1942-51 to 1952-61, the annual ginnings per plant averaged under900 bales. In these 61 counties the number of active gins declinedfrom 153 in 1942 to 84 in 1961, a decrease of 45%. In 14 countiesin West Tennessee, although cotton production has been increasing,the number of active gins declined from 255 in 1942 to 193 in1961, a decrease of 24%.
2) With increased costs of ginning, volume per gin has be-come a more important factor and the small volume plants havefound it difficult or impossible to survive. From 1941 to 1962 thenumber of firms in Tennessee ginning under 1,000 bales decreasedfrom 163 to 32, and the number ginning from 1,000 to 2,000 balesdecreased from 172 to 96 (Appendix H).
3) The trend is upward in gin capacity per hour or to plantscapable of ginning from 125 to 200 bales of cotton daily. With therapid shift to machine harvesting (Appendix K), most producersprefer to gin at the larger plants where there is less waitingin lines.
26

Appendix
;,
;
27
,
:~j i~

APPENDIX A
Average annual cotton production and number of gins by specifiedperiods in Tennessee, 1932-41 to 1952-61 and 1962
1932- 1942- 1952- 1932- 1942- 1952-Counties 1941 1951 1961 1962 1941 1951 1961 1962
Av. ,prod. in SaO-lb. bales Average number of gins
Tipton 41183 46651 52310 58400 22.6 21.5 19.6 19Gibson 33580 40122 48810 49100 25.5 22.4 21.2 20Haywood 31679 40353 45710 48200 21.1 21.3 20.3 19Fayette 30821 36596 41970 43100 29.0 23.9 19.3 16Shelby 41696 44334 40860 40500 32.6 31.2 23,4 19Lauderdale 31143 36222 40820 43100 24.2 22.2 20,5 19Crockett 22672 30363 37170 38000 14.3 13.0 12.0 12Dyer 34911 35999 36010 34500 23.3 21.1 17.2 17Madison 23573 30806 32875 33100 24.8 22.7 20.1 19Lake 26641 25891 29280 28000 14.9 12.6 10.2 10Hardeman 14410 19074 21140 19700 17.6 16.7 14.0 11Carroll 15312 16932 18645 19300 18.4 18.0 14.9 13McNairy 13626 23498 18080 14100 20.9 17.7 17.0 14Henderson 14061 17506 16770 13800 19.4 17.7 16.0 11Chester 8047 10598 11010 9400 10.1 10.2 7.7 6Obion 11609 10387 10964 9800 8.8 9.3 7.7 7Weakley 7759 8157 8980 8860 7.0 6.1 5.3 4Hardin 5752 7528 6573 5250 9.7 7.4 5.0 5Henry 5462 4721 3598 2850 4.6 3.8 3.3 3Decatur 3333 3521 2454 1820 5.3 3.4 1.8 1Benton 2759 2455 1641 1440 3.0 3.4 1.9 1West Tenn. 420029 491714 525670 522320 357.1 325.6 278,4 246Lawrence 14333 16025 13654 11400 19.1 15.9 12.7 10Lincoln 9144 10615 10076 8830 11.0 9.0 6.8 5Giles 7347 7655 5351 4110 9.6 7.0 4.7 4Franklin 4550 4903 4721 3130 4,0 3.2 2.8 2Rutherford 7643 5587 3131 1650 6.4 4.5 3.6 3Wayne 1750 2288 1734 1400 3.9 2,7 0,8 0Other (30) 4738 3553 3116 1552 5.7 5.4 1.8 1Mid. Tenn. 49505 50626 41783 32072 59,7 47.7 33.2 25Bradley 2163 1199 444 109 2.0 2.0 1.4 1Polk 2532 1133 363 102 3.9 2.4 1.4 0McMinn 2076 1169 249 65 3.9 2.3 1.0 1Other (15) 2295 2040 905 332 3.0 2.0 1.0 0East Tenn. 9066 5541 1961 608 12,8 8.7 4.8 2State 478600 547881 569414 555000 429.6 382,0 316.4 273Source: Computed from Annual Reports of the Tennessee Crop Reporting Service and theBureau of the Census, 1932-62.
28

APPENDIX BNumber of active cotton gins in Tennessee, by specified 'years,
1915-62County 1915 20 25 30 35 40 45 50 55 60 62
Number of active ginsTipton 35 30 21 23 22 22 22 20 20 19 19Gibson 26 21 22 24 27 24 23 22 22 20 20Hoywood 36 26 22 19 23 21 21 22 21 19 19Foyette 42 32 30 30 30 28 24 21 19 17 16Shelby 47 47 40 32 31 36 31 30 27 19 19Louderdole 29 27 24 26 24 22 21 22 22 19 19Crockett 15 11 16 15 15 14 13 12 12 12 12Dyer 21 18 26 24 25 22 21 19 17 17 17Modison 36 33 27 27 23 26 23 22 21 19 19Loke 14 14 19 18 14 15 14 11 10 10 10Hordeman 32 22 21 18 18 17 17 16 15 11 11Carroll 25 19 19 19 18 18 18 18 16 13 13McNairy 33 23 22 24 22 20 17 18 18 15 14Henderson 33 25 24 22 20 18 17 17 18 12 11Chester 14 9 9 8 10 11 10 10 9 6 6Obion 5 7 11 9 10 9 9 9 8 7 7Weakley 6 6 7 7 7 7 6 6 6 5 4Hardin 22 16 13 13 11 9 6 7 ·5 5 5Henry 5 5 5 4 5 5 4 4 3 3 3Decatur 11 9 7 5 6 5 4 3 2 1 1Benton 6 4 5 4 3 3 3 3 2 2 1West Tenn. 493 404 390 371 364 352 324 312 293 251 246Lawrence 5 10 13 21 20 18 17 16 14 11 10Lincoln 11 12 11 11 11 11 9 9 8 5 5Giles 19 13 13 13 10 8 7 6 5 4 4Franklin 1 3 3 4 4 4 3 3 3 2 2Rutherford 7 7 9 7 7 6 4 4 4 3 3Wayne 2 3 3 3 4 4 3 2 2 0 0Coffee 0 0 1 1 1 2 2 2 1 1 1Bedford 1 2 2 2 1 2 2 2 0 0 0Maury 1 2 2 1 1 1 0 0 0 0 0Lewis 0 1 1 1 1 1 0 0 0 0 0Hickmon 0 1 1 1 0 0 0 0 0 0 0Williamson 0 1 1 1 0 0 0 0 0 0 0Marshall 0 1 1 1 1 1 1 1 0 0 0Warren 1 1 1 1 1 1 1 1 0 0 0Perry 0 1 1 0 0 0 0 0 0 0 0Wilson 0 0 1 0 0 0 0 0 0 0 0Mid. Tenn. 48 58 68(0)68 62 59 49 46 37 26 25Bradley 4 5 3 3 2 2 2 2 2 1 1Polk 6 4 5 4 4 4 2 2 2 1 0McMinn 9 5 6 4 4 4 3 1 1 1 1Hamilton 0 2 2 1 1 1 1 1 0 0 0Monroe 1 1 1 1 1 1 1 1 0 0 0Meigs 1 1 1 1 0 0 0 0 0 0 0East Tenn. 21 18 18 14 12 12 9 7 5 3 2State 562 480 476 453 438 423 382 365 35 280 273(a) Includes 4 gins located in other counties in Middle Tennessee.Source: Computed from annual reports ~o{ the' Bu;'e~u.of the Census.
29

APPENDIX C
Cotton farms, acreage, yields, production, and gins, Tennessee, 1925 to 1962
Prod.Acres of cotton (000) 500 lb. Boles
Crop Cotton Allotted Yield per acre boles peryeor forms or goal Planted Harvested Planted Harvested (000) Gins gin
No. No. No. No. Lbs. Lbs. No. No. No.
1925 87650 (0) 1163 1146 212 215 515 476 10821926 87824 (0) 1106 1089 195 198 451 474 9511927 87998 (0) 921 912 186 188 359 454 791
~ 1928 87172 (0) 1071 1042 191 197 429 451 9510 1929 88346 (0) 1055 1044 233 236 515 455 1132
1930 88898 (0) 1152 1129 157 160 378 453 8341931 89450 (0) 1054 1050 270 271 595 444 13401932 90002 (0) 1080 1063 212 216 480 431 11141933 90554 883(b) 1151 883 184 240 444 433 10251934 91105 812(b) 763 759 254 255 405 432 9381935 88365 812(b) 757 750 200 202 317 438 7241936 85625 (0) 805 797 257 260 433 431 10051937 32885 (0) 943 937 335 337 661 434 15231938 80145 822(b) 742 733 316 320 490 433 11321939 77405 832(b) 733 707 293 304 449 423 10611940 75231 814(b) 729 715 334 340 509 423 12031941 73056 803(b) 690 680 414 420 598 418 14311942 70881 801(b) 725 715 412 418 625 408 15321943 68706 807(b) 723 720 325 326 491 400 12281944 66531 (0) 665 660 404 407 562 391 1437

1945 66632 (a) 605 590 368 378 466 382 12201946 66734 (a) 635 630 391 394 519 379 13691947 66835 (a) 734 730 338 340 519 377 13771948 66937 (a) 823 820 389 390 669 382 17511949 67038 (a) 911 895 332 338 633 377 16791950 74370 742(b) 644 630 304 310 409 365 11211951 72118 (a) 826 785 309 325 534 359 14871952 69864 (a) 866 860 352 355 638 350 18231953 67610 (a) 958 950 350 353 702 344 20411954 65356 690(b) 657 648 399 404 548 342 16021955 65478 594(b) 581 570 513 522 623 335 18601956 65164 564(b) 558 543 473 486 552 330 16731957 62002 569(b) 495 465 401 427 415 321 12931958 62234 583(b) 416 400 481 501 419 295 14201959 61706 582(b) 525 510 601 619 660 290 2276
C.:I 1960 61496 573(b) 525 512 531 544 583 280 2082~ 1961 61067 611(b) 557 538 475 492 554 277 20001962 58540 601(b) 553 538 480 493 555 273 2033Na control (a) 914 902 277 280 529 413 1281Cantral 710(b) 659 633 368 384 508 364 1396
(a) = Years of no acreage controls. (b) = Years of acreage con troIs.
Source: Computed from annual reports of the Tennessee Crop Reporting Service and Tennessee Annual Statistical Reports. ASCS Programs, 1950 and 1954to 1962.
APPENDIX D
Difference between cotton acreage allotments and planted acreage,by counties, Tennessee, 1950 and 1954-61
Counties 1950 1954 1955 1956 1957 1958 1959 1960 1961West Tenn. Allotted acres not planted (a)Tipton 2880 467 + 398 +3167 + 46 6703 346 468 1446Gibson 5201 1489 583 498 5547 11650 2685 3161 2551Haywood 2944 258 + 133 + 474 3551 9185 116 1899 1633Fayette 5929 869 +1710 + 633 843 5495 806 + 45 212Shelby 11452 3035 1829 910 4777 10615 4095 2963 3978Lauderdale 1478 956 119 6 1670 6281 876 1086 4067
C\:) Crockett 958 722 782 + 148 3586 8517 1058 1182 1268~Dyer 1003 930 + 106 + 178 3944 8531 1055 795 1127Madison 4509 1378 665 + 132 2436 5718 2343 691 1319Lake 984 + 905 + 275 + 164 + 10 2035 + 447 + 454 209Hardeman 3420 663 311 197 2191 6177 1344 1250 960Carroll 3096 1040 287 527 3439 6794 2518 2172 1846McNairy 7085 1887 707 127 2552 7750 2134 1878 2274Henderson 2156 1074 141 42 1915 6401 1670 1345 1339Chester 1207 465 223 + 175 1204 3807 681 466 423Obion 3449 999 383 253 2157 4437 1399 1687 1408Weakley 3864 1053 831 576 3568 4760 2758 2843 2497Hardin 2592 1104 295 + 137 1549 3814 1818 1489 1653Henry 2320 643 558 631 1983 2714 2207 2110 1865Decatur 1776 837 237 209 949 1905 704 857 782Benton 2455 672 390 320 1415 1948 1192 1061 841Total 70758 19636 5719 + 912 49220 125237 31358 28904 33698
-

Middle Tenn. Allotted ocres not plontedLawrence 1803 3132 869 1159 8002 13981 5450 4460 4900Lincoln 1620 876 525 335 2296 4798 2986 1729 2083Giles 2922 1582 972 783 2969 4808 3360 2776 2788Franklin 1889 911 453 469 2004 3131 1910 1899 1386Rutherford 3933 792 489 436 2136 3575 3142 1596 1461Wayne 1790 867 352 195 1100 1854 1071 735 980Bedford 1164 387 350 239 609 1162 1179 969 882Coffee 1062 282 227 208 762 1133 901 615 572Warren 759 237 167 161 364 559 497 430 41920 other(b) 1899 712 562 522 1137 1676 1395 669 1327Total 18841 9778 4966 4507 21379 36677 21891 15878 16798East Tenn. Allotted acres not plantedBradley 1528 797 601 483 805 995 841 538 698
COPolk 1105 666 361 293 620 782 608 513 559
CO McMinn 2842 795 520 359 651 765 641 556 664Hamilton 591 344 280 262 606 579 458 532 554Meigs 449 313 231 194 371 485 352 393 481Monroe 993 250 200 178 256 282 254 235 2416 other(c) 548 271 112 74 169 267 205 179 177Total 8056 3436 2305 1843 3478 4155 3359 2946 3374State total 97655 32850 12990 5438 74077 166069 56608 47728 53870(a) + indicates acres over-planted.
(b) Cannon, Cumberland, Davidson, DeKalb, Dickson, Grundy, Hickman, Humphreys, Lewis, Marshall, Maury, Montgomery, Moore, Perry, Robertson,Stewart, Van Buren, White, Williamson, and Wilson.
(c) Knox, Loudon, Marion, Rhea, Roane, and Sequatchie.
Source: Computed from Tennessee Annual Statistical Reports, ASCS, Nashville, Tennessee.

APPENDIX E
Bales of cotton produced per gin and ginnings per gin, annualaverage, by counties, Tennessee, 1932-41 to 1952-61
1932- 1942- 1952-II
1932- 1942- 1952·Counties 1941 1951 1961 1962 1941 1951 1961 1962
West Tenn. Prod./gin, SOO lb. bales Ginnings/gin, SOO lb. bales
Tipton 1822 2170 2669 3074 1835 2200 2605 3105Gibson 1317 1791 2302 2455 1351 1866 2401 2547Hoywood 1501 1895 2252 2537 1409 1797 2237 2515Foyette 1063 1531 2175 2694 933 1329 1821 2097Shelby 1279 1421 1746 2132 1317 1431 1734 2137Lauderdale 1287 1632 1991 2268 1426 1822 2189 2582Crockett 1585 2336 3098 3167 1645 2363 3024 3147Dyer 1498 1706 2094 2029 1560 1712 2062 2026Madison 951 1357 1636 1742 947 1297 1588 1635Lake 1788 2055 2871 2800 2010 2205 3157 3161Hardeman 819 1142 1510 1791 878 1287 1656 1997Carroll 832 941 1251 1485 856 1008 1292 1556McNairy 652 1328 1064 1007 716 1055 1127 1060Henderson 725 989 1048 1255 703 1011 1076 1215Chester 797 1039 1430 1567 768 996 1367 1618Obion 1319 1117 1424 1400 1206 1116 1626 1444Weakley 1108 1337 1694 2215 877 964 1398 1725Hardin 593 1017 1315 1050 437 750 992 900Henry 1187 1242 1090 950 992 992 921 938
Middle Tenn.
La"wrence 750 1008 1075 1400 850 1123 1199 1234Lincoln 831 1179 1482 1766 832 1357 1774 2304Giles 765 1094 1139 1028 673 980 980 857Rutherford 1194 1242 870 550 1228 1386 862 432Other counties
52 (a) 755 831 1124 1421 613 727 814 732State 1114 1434 1800 2033 1112 1421 1790 2029
(a) Includes 2 counties in West Tennessee, 32 in Middle Tennessee, and 18 in East Tennessee,producing cotton one or more years, 1982-61.
Source: Computed from annual reports of the Bureau of the Census, and the Tennessee CropReporting Service. 1932-61.
34

APPENDIX F
Relation of cotton volume to ginning costs per gin, Tennessee,1928 to 1962
Running bales I Estimated cost of
Orop Active Ginned ginning per bale (0)
year gins Totol Per gin II-yr. av._ (b) Annual II-yr. avo (b)
No. Bales Bales Bales $ $
1928 451 423471 939 939 5.431929 455 504282 1108 975 5.381930 453 371433 820 971 4.881931 444 577994 1302 962 4.071932 431 467491 1085 1010 4.061933 433 428881 990 1038 4.47 4.75(b)1934 432 396655 918 1045 5.24 4.671935 438 315602 721 1053 4.42 4.621936 431 422197 980 1103 4.79 4.771937 434 633335 1459 1119 4.80 5.021938 433 473761 1094 1129 4.70 5.451939 423 432383 1022 1164 4.51 5.781940 423 502871 1189 1188 4.83 6.251941 418 574121 1373 1245 6.54 6.821942 408 602538 1477 1278 6.88 7.501943 400 479791 1199 1298 8.74 8.071944 391 538251 1377 1348 8.08 8.761945 382 449656 1177 1356 10.43 9.931946 379 509943 1345 1381 10.69 10.861947 377 507032 1345 1418 12.25 11.551948 382 641070 1678 1465 11.16 12.121949 377 622498 1651 1498 12.20 12.801950 365 404411 1108 1539 17.40 13.461951 359 525383 1463 1577 15.11 14.191952 350 621119 1775 1569 14.15 15.451953 344 685751 1993 1574 13.16 16.461954 342 534001 1561 1622 16.22 17.021955 335 613059 1830 1658 15.27 17.611956 330 527484 1598 1738 18.49 17.821957 321 404292 1259 1787 24.59 18.28(b)1958 295 411038 1393 1818 23.321959 290 642245 2215 1849 17.311960 280 570876 2039 1880 18.731961 277 550310 1987 1911 19.621962 273 548408 2009 1942 20.19
(a) Based on 18 gins, 1928-40, and 56 gins, 1941-62.
(b) Based on II-year moving average.
Source: Computed from annual reports of the Bureau of the Census, and unpublished studiesmade by the Tennessee Agricultural Experiment Station.
35

APPENDIX G
D
Estimated ginning cost per bale by different gin capacities andvolume per gin, with and without specified amounts of seed
cotton storage facilities, Tennessee, 1962
Gin models
6000bales
Seed cottonstorage
A
B INone
4000bolesNone
1000bales
2000bales
c \None
Bales per hourInvest. ($) (0)
2.577500
12352000
DepreciationInterest (c)ManagementMaintenanceTaxes (f)
(b)
(d)(e)
None
2.599500
5115000
5159000
8160000
8248000
155207440400024801426
12220000
152906600480022001265
2189010560480035202024
Total 4279411832 13938 16654
Annual fixed cost5386 6486 79932325 2985 34502900 2900 3400775 995 1150446 572 661
($)11120480040001600920
30866 30155
WrappingLabar (g)Power, fuelInsuranceMiscellaneousRepairs
per gin10193477034001590914
20867 22440
2.381.671.641.251.201.00
2.381.391.401.251.201.00
2.381.39lAO1.251.201.00
2.382.672.321.251.201.00
Operating2.382.672.321.251.201.00
bale ($)2.38 2.382.00 1.671.97 1.641.25 1.251.20 1.201.00 1.00
Total 10.82 8.62 8.62
Bales per gin100020003000400050006000700080009600
1000011000120001360014400
20400
22.6516.7414.76
cast per2.382.001.971.251.201.00
10.82 9.80 9.80 9.14
Estimated cost of ginning per bale ($)24.76 26.45 30.67 31.58 40.0117.79 18.13 20.24 20.36 24.5815.47 15.35 16.76 16.62 19.4314.31 13.96 15.02 14.75 16.86
13.13 13.97 13.63 15.3112.58 13.28 12.88 14.28
12.78 12.35 13.5512.41 11.95 13.00
11.48 12.3612.2311.9511.7111.41
9.14
(h)38.7823.7018.6716.1614.6513.6512.9312.3911.7611.6411.3611.1310.8410.71
5104130.0222.8819.3217.1815.7514.7313.9713.0812.9012.5112.1911.7711.59
10.72
(a) See Appendix N for gin plant investment without seed cotton storage. Additional investment forplants with seed cotton storage is estimated at $22 per bale and includes steel baskets, basket lifters withtractors and corrugated tin roofs to protect stored cotton from weather.
(b) 8% annually on gin machinery and equipment and 5% on buildings.
(c) 6% interest charge on 'h of investment. (d) Management cost for 6 months. (e) 1% of gin plantinvestment. (f) $5.75 tax rate on gin plant investment. (g) Labor at $1.25 per hour. (h) Costs ofginning without seed cotton storage were computed on a per bale basis for each gin operating two12-hour shifts daily with 10 hours of ginning per shift up to 60 days or 1,200 hours.
36

APPENDIX H
Number of active gins by specified volume of ginning,Tennessee, 1941-62
RunningBales per gin bales Bales
Crop Under 1000- 2000- 3000 I Ac~iYe ginned peryear 1000 1999 2999 and over gins (000) gin
No. % No. % No. % No. % No. Boles Bales
1941 163 39 172 41 60 14 23 6 418 574.1 13731942 138 34 179 44 69 17 22 5 408 602.5 14771943 186 46 159 40 44 11 11 3 400 479.8 11991944 153 39 164 42 58 15 16 4 391 538.3 13771945 184 48 159 42 33 9 6 1 382 449.7 11771946 150 40 156 41 59 15 14 4 379 509.9 13451947 135 36 175 46 57 15 10 3 377 507.0 13451948 95 25 176 46 73 19 38 10 382 641.1 16781949 103 27 164 44 68 18 42 11 377 622.5 16511950 182 50 135 37 41 11 7 2 365 404.4 11081951 129 36 136 38 66 18 28 8 359 525.4 14631952 103 30 134 38 66 19 47 13 350 621.1 17751953 76 22 124 36 87 25 57 17 344 685.8 19931054 51 15 146 43 94 27 51 15 342 534.0 15611955 42 12 148 44 96 29 49 15 335 613.1 18301956 36 11 149 45 98 30 47 14 330 527.5 15981957 85 26 137 43 79 25 20 6 321 404.3 12591958 73 25 142 48 62 21 18 6 295 411.0 13931959 6.4 22 120 42, 62 21 44 15 290 642.2 22151960 42 15 117 42 71 25 50 18 280 570.9 20391961 40 15 95 34 92 33 50 18 277 550.3 19871962 32 12 96 35 94 34 51 19 273 548.4 2009Average 103 30 144 41 70 20 32 9 349 543.8 1558
Source: Computed from annual reports of the Bureau of the Census.
37

APPENDIX I
Ginning capacity of Tennessee gins, 1906-1962
Ginning 12-hour Ginning 12-hourcapacity shifts capacity shifts
Total 12-hour needed Total 12-hour neededCrop Active g'nned shifts to gin Crop Active ginned shifts to ginyear gins (000) (000) crop y~or gins (000)" (000) crop
No. Bales Bales No. No. Bales Bales No.
1906 702 304 8.4 37 1945 382 450 13.0 351915 562 296 9.6 31 1946 379 510 13.3 391920 480 315 9.6 33 1947 377 507 13.9 371925 476 513 10.9 48 1948 382 641 14.5 451930 453 371 11.3 33 1949 377 622 14.7 431931 444 578 11.5 51 1950 365 404 14.6 281932 431 467 11.6 41 1951 359 525 14.7 361933 433 429 12.1 36 1952 350 621 14.7 431934 432 397 12.5 32 1953 344 686 14.8 471935 438 316 13.1 25 1954 342 534 15.0 361936 431 422 12.9 33 1955 335 613 14.7 421937 434 633 13.0 49 1956 330 527 14.9 361938 433 474 13.0 37 1957 321 404 14.4 281939 423 432 13.1 33 1958 295 411 13.6 311940 423 503 13.1 39 1959 290 642 13.6 481941 418 574 13.0 45 1960 280 571 13.7 421942 408 603 13.1 47 1961 277 550 13.9 401943 400 480 13.2 37 1962 273 548 14.1 391944 391 538 13.3 41 Av. 444 444 11.9 38
-Running bales.
Source: Computed from annual reports of the Bureau of the Census and unpublished studies made bythe Tennessee Agricultural Experiment Station, 1928 to 1962.
38

APPENDIX J
Active gins, classified by number of stands and saws, and by ginningcapacity, Tennessee, 1906-62
Gin stands Gin saws Gin capacity pe, hour
Crop Active Per Per Per Per P., Per Allyear gins Total gin Total gin stand gin stand saw gins
No. No. No. No. No. No. Bales Bales Lb•. Bales
1906 702 1244 1.8 84085 120 68 1.2 0.7 5.0 842.41915 562 1293 2.3 87924 156 68 1.7 0.7 5.4 955.41920 480 1248 2.6 84864 177 68 2.0 0.8 5.7 960.01925 476 1380 2.9 93840 197 68 2.3 0.8 5.8 1094.81930 453 1404 3.1 95472 211 68 2.5 0.8 5.9 1132.51931 444 1421 3.2 96210 217 68 2.6 0.8 6.0 1154.41932 431 1422 3.3 96975 225 68 2.7 0.8 6.0 1163.71933 433 1428 3.3 101033 233 71 2.8 0.8 6.0 1212.41934 432 1426 3.3 102689 238 72 2.9 0.9 6.1 1252.81935 438 1422 3.3 106741 244 75 3.0 0.9 6.1 1314.01936 431 1422 3.3 108072 251 76 3.0 0.9 6.0 1293.01937 434 1432 3.3 108259 249 76 3.0 0.9 6.0 1302.01938 433 1429 3.3 106475 246 75 3.0 0.9 6.1 1299.01939 423 1396 3.3 106096 251 76 3.1 0.9 6.2 1311.31940 423 1396 3.3 106120 251 76 3.1 0.9 6.2 1311.31941 418 1379 3.3 104804 251 76 3.1 0.9 6.2 1295.81942 408 1347 3.3 103719 254 77 3.2 1.0 6.3 1305.61943 400 1320 3.3 101640 254 77 3.3 1.0 6.5 1320.01944 391 1290 3.3 100362 257 78 3.4 1.0 6.6 1329.41945 382 1269 3.3 99702 261 79 3.4 1.0 6.5 1298.81946 379 1251 3.3 98829 261 79 3.5 1.1 6.7 1326.51947 377 1282 3.4 101278 269 79 3.7 1.1 6.9 1394.91948 382 1299 3.4 103920 272 80 3.8 1.1 7.0 1451.61949 377 1282 3.4 102560 272 80 3.9 1.1 7.2 1470.31950 365 1241 3.4 99280 272 80 4.0 1.2 7.4 1460.01951 359 1221 3.4 97680 272 80· 4.1 1.2 7.5 1471.91952 350 1190 3.4 95200 272 80 4.2 1.2 7.7 1470.01953 344 '1204 3.5 96052 279 80 4.3 1.2 7.7 1479.21954 342 1197 3.5 96957 284 81 4.4 1.3 7.8 1504.81955 335 1170 3.5 94424 282 81 4.4 1.3 7.8 1474.01956 330 1155 3.5 93555 284 81 4.5 1.3 7.9 1485.01957 321 1130 3.5 91530 285 81 4.5 1.3 7.9 1444.51958 295 1040 3.5 84051 285 81 4.6 1.3 8.1 1357.01959 290 997 3.4 80908 279 81 4.7 1.4 8.4 1363.01960 280 954 3.4 77766 278 82 4.9 1.4 8.8 1372.01961 277 955 3.4 78276 283 82 5.0 1.5 8.8 1385.01962 273 940 3.4 80146 294 85 5.2 1.5 8.8 1406.4
Source: Computed from annual reports of the Bureau of the Census and unpublished studies made bythe Tennessee Agricultural Experiment Station, 1928 to 1962.
39

APPENDIX K
Number of bales of cotton produced, by methods of harvesting,and weight of seed cotton per bale, Tennessee, 1928-62
Method of harvesting andweight of seed cotton per bole
Production Hand-picked Hand-snapped Machine-picked
500 lb. Wt. of Wt. of Wt. ofCrap bales Bales seed Bales seed Bales seedyear (000) (000) cotton (000) cotton (000) cotton
No. No. % Lbs. No. % Lbs. No. % Lbs.
1928-44 493 444 90 1391 49 10 1840 0 0 (b)
1945 466 405 87 1279 60 13 1885 1 (0) (b)1946 519 472 91 1332 46 9 2023 1 (0) (b)1947 519 462 89 1277 56 11 1903 1 (0) (b)1948 669 602 90 1285 65 10 1876 2 (0) (b)1949 633 576 91 1360 55 9 1970 2 (0) (b)1950 409 356 87 1344 51 13 1931 2 (0) (b)1951 534 443 83 1354 88 16 1932 3 (0) (b)1952 638 555 87 1324 75 12 1926 -8 1 (b)1953 702 639 91 1326 52 7 1974 11 2 (b)
1954 548 488 89 1346 49 9 1899 11 2 14591955 623 486 78 1457 105 17 2083 32 5 16011956 552 497 90 1290 33 6 2063 22 4 14431957 415 336 81 1429 66 16 1995 13 3 15101958 419 356 85 1454 46 11 2261 17 4 14101959 660 502 76 1390 105 16 1892 53 8 14461960 583 379 65 1391 93 16 2013 111 19 14421961 554 299 54 1410 111 20 2034 144 26 14731962 555 194 35 1426 133 24 2006 228 41 14841945-62 555 462 83 1360 68 12 1981 25 5 1474
(a) Less than 1%.
(b) No data.
Source: Computed from annual reports of the Bureau of the Census and the Cotton Division, AgriculturalMarketing Service, USDA, and unpublished studies made by the Tennessee Agricultural ExperimentStation, 1928 to 1962.
40

APPENDIX L
Number of running bales of cotton ginned in specified periodsin Tennessee, average 1922-31 to 1952-61 and 1962
Period Unit 19621922-31 1932-41 1942-51 1952-61
Sept.1-15
Bales%
65201.6298476.4 23580
4.543864
7.948589
8.9
Sept.16-30
Bales%
12378622.6
5206612.5.
9644820.7
9381317.8
11421420.5
Oct.1-17
Bales%
11339327.2
11973925.8
13845026.2
14279425.7
18645634.0
Oct.18-31
Bales%
9678217.6
7859318.9
8059117.3
9900018.7
10214418.4
Nov.1-13
Bales%
468838.5
5455213.1
5060110.9
5572210.6
6780512.2
Nov.14-30
Bales%
299405.5
4472710.7
399348.6
514739.8
432237.8
Dec.1-12
Bales%
87031.6221995.3
207554.5
222474.2
204823.7
Dec. 13-Jon. 15
Bales%
21130.4Jon. 16-Mar. 20
Bales%
278676.7
166294.0
191114.1
77041.7
203783.8
233954.4
161972.9
52940.9
51560.9
AnnualBales%
548408100.0
416546100.0
464730100.0
528058100.0
556017100.0
Gin cap. (a) Bales 10959 12755 13829
(a) Daily gin capacity of all active gins operating 10 hours per 12-hour shift.
14335 14064
Source: Data on ginning were compute<! from annual reports of the Bureau of the Census. Data onginning capacity compute<! from Appendix J.
41

APPENDIX M
1958-1959
Type of auxiliary equipment used by gins and average ginningcosts per gin, by specified periods, Tennessee, 1935-62
Item Unit1961·1962
1935-1936
1941-1942
1945-1946
1950-1951
1955-1956
Active gins No. 438 418 382 365 335 295 277
Seed cottondriers
No.%
27399
21
348
12934
19854
26880
27593
Overhead seedcotton cleaners
No.%
27794
26194
24055
24158
22058
25670
28284
Overhead seedcotton extractors
No.%
7016
8420
8623
11331
13641
20770
22381
Lintcleaners
No.%
16650
27995
27699
oo
oo
oo
41
Fire preventiondevices
No.%
4410
5914
6517
8824
10230
12241
17563
Boles per gin (0) No. 1987721 1375 1177 1108 1829 1382
Gin cop. per hour Boles 3.0 3.1 3.4 4.0 4.4 4.6 5.0
Ginning cost per bale $ 4.42 6.54 10.43 17.40 15.27 23.32 19.62
(al Based on 28 gins, 1935-36, and 56 gins, 1941-62.
Source: B. D. Raskopf. The Cotton Ginning Industry in Tennessee, Tennessee Agricultural ExperimentStation, Bulletin No. 303, September, 1959. Data for the 1961 crop year are based on unpublished studi•••made by the Tennessee Agricultural Experiment Station in cooperation with the Cotton Division, Agri-cultural Marketing Service, USDA.
42

APPENDIX NAverage gin capacity and estimated gin plant investment, by
number and size of gin stand, Tennessee, 1955 and 1962
Number Gin Investment per plant
of gin capacity Gin plants (estimated)
stonds per gin in Replacement
IFor new
and sows per hour Tennessee value plant(a) 1955 1962 1955 1962 1955 1962 1955 1962
Type Bales Number Thousand dollars
2·70'5 1.95 2.2 1 1 37 73 57 1131-75 HC 2.5 0 0 (b) 78 (b) 1182-80'5 2.5 2.8 10 3 41 82 61 1222-90'5 2.9 3.3 4 5 45 90 65 1303-70'5 2.925 3.3 17 7 45 90 65 1303-80'5 3.75 4.2 123 90 52 103 72 1434-70'5 3.9 4.4 18 11 53 106 73 1462-80'5, 1-90'5 3.95 4.45 0 1 (b) 107 73 147
1-80'5, 2-90'5 4.15 4.7 0 1 (b) 111 75 1513-90'5 4.35 4.95 36 39 57 114 77 1542-70'5, 2-80'5 4.45 5.0 1 1 58 115 78 1552-75'5 HC 5.0 0 3 (b) 115 (b) 1554-80'5 5.0 5.6 87 77 62 124 82 1642-120'5 HC (b) 6.0 0 1 (b) 130 (b) 1704-90'5 5.8 6.6 18 27 70 139 90 1795-80'5 6.25 7.0 7 7 73 145 93 185
2-88'5 HC 8.0 0 1 (b) 160 (b) 2002-8018'5 HC 8.0 0 1 (b) 160 (b) 2002-79'5 HC 8.0 0 1 (b) 160 (b) 2006-80'5 7.5 5 0 83 (b) 103 (b)3-80'5, 3-90'5 8.1 1 0 89 (b) 109 (b)7-80'5 8.75 1 0 94 (b) 114 (b)6-90'5 8.7 1 0 94 (b) 114 (b)4-70'5, 4-80'5 8.9 1 0 95 (b) 115 (b)3-120'5 HC 9.0 0 1 (b) 175 (b) 2152-119'5 HC 10.0 0 1 (b) 190 (b) 2303-90'5, 4-80'5 9.35 1 0 96 (b) 116 (b)4-70'5, 4-90'5 9.7 1 0 103 (b) 123 (b)8-80'5 10.0 1 0 104 (b) 124 (b)7-90'5 10.15 1 0 107 (b) 127 (b)2-177'5 HC 12.0 0 1 (b) 220 (b) 2604-120'5 HC 12.0 0 1 (b) 220 (b) 260,A.II gins 4.4 5.2 335 281 (c) ______
(a) Letters HC indicate new model stands and saws with high capacity in bales per hour.
(b) No data available.
(c) 273 active in 1962.
Source: Computed from unpublished studies made by the Tennessee Agricultural Experiment Station,1955 to 1962, and from data on cotton gin equipment obtained annually by the Cotton Division, Agri-cultural Marketing Service, USDA.
43

APPENDIX 0Average ginning costs per running bale and bales per gin, S6 gins, Tennessee, 1941-62
Vol. Dep. FuelCrop per and Wrop- andyear gin into Lobar Mg't ping power Repairs Ins. Toxes Misc. Totol
Boles Dollors per bole
1941 1375 1.00 .95 .70 1.06 .60 .78 .66 .16 .63 6.541942 1477 1.02 1.33 .72 1.22 .59 .62 .63 .16 .59 6.881943 1198 1.18 1.70 .97 1.64 .75 .82 .80 .20 .68 8.741944 1362 1.08 1.68 .94 1.43 .73 .62 .71 .18 .71 8.081945 1177 1.32 2.24 1.17 1.65 1.06 .97 .84 .21 .97 10.431946 1347 1.42 2.20 1.29 1.99 .95 1.06 .75 .19 .84 10.69
1947 1344 1.58 2.28 1.43 2.08 1.03 1.21 .78 .20 1.66 12.251948 1677 1.50 2.20 1.35 2.12 .98 .91 .70 .18 1.22 11.16
~ 1949 1652 1.68 2.33 1.50 2.33 1.24 1.02 .78 .20 1.12 12.20~ 1950 1108 2.52 3.51 2.35 2.43 1.98 1.30 1.20 .31 1.80 17.40
1951 1464 1.96 2.84 1.83 2.58 1.72 1.42 .92 .25 1.59 15.111941-51 1380 1.48 2.11 1.30 1.87 1.06 .97 .80 .20 1.07 10.861952 1774 1.74 2.60 1.60 2.63 1.45 1.63 .77 .28 1.45 14.151953 1993 1.72 2.34 1.63 2.30 1.32 1.45 .70 .28 1.42 13.161954 1560 2.98 2.99 2.12 2.25 1.69 1.34 .92 .35 1.58 16.221955 1829 3.20 2.64 1.94 2.10 1.49 1.41 .82 .38 1.29 15.271956 1599 4.42 2.99 2.51 2.35 1.69 1.38 .93 .45 1.77 18.491957 1252 6.64 3.93 3.35 2.41 2.23 1.84 1.24 .65 2.30 24.59
1958 1382 6.24 3.73 3.25 2.40 2.17 1.70 1.23 .67 1.93 23.321959 2215 4.28 2.85 2.27 2.20 1.31 1.63 .91 .48 1.38 17.311960 2031 5.06 3.05 2.23 2.27 1.44 1.73 1.27 .58 1.10 18.731961 1987 5.62 2.96 2.66 2.38 1.39 1.62 1.16 .63 1.20 19.621962 1980 6.04 2.98 2.69 2.36 1.30 1.67 1.25 .85 1.05 20.191952-62 1781 4.36 3.00 2.39 2.33 1.59 1.58 1.02 .51 1.50 18.28

APPENDIX PProportion of cotton lint and seed purchased by ginners and other
agencies, and cottonseed used on the farm, Tennessee, 1933-62
Lint cotton Cottonseed
Prod. Bought Placedin Bought by under Bought Used
Crop running by other gov't Prod. by on
yeor bales ginners merchants loan 000 tons ginners farm
No. % % % No. % %
1933 428881 53 32 15 198 70 301934 396655 10 1 89 185 78 221935 315602 52 47 1 137 77 231936 422197 63 37 no loon 192 81 191937 633335 35 19 46 252 82 181938 473761 30 2 68 191 86 141939 432383 51 48 1 171 88 121940 502871 73 24 3 220 86 141941 574121 53 41 6 231 91 91942 602538 63 25 12 240 88 121943 479791 30 40 30 190 84 161944 538251 56 33 11 211 88 121945 449656 63 36 1 177 88 121946 509943 57 42 1 205 90 101947 507032 72 27 1 197 89 111948 641070 53 15 32 255 90 101949 622498 79 14 7 261 90 101950 404411 79 20 1 165 85 15.1951 ·525383 92 6 2 218 87 131952 621119 78 17 5 254 89 111953 685751 63 11 26 279 93 71954 534001 81 16 3 223 92 81955 613059 61 20 28 250 94 61956 527484 69 8 23 211 92 81957 404292 78 9 13 176 94 61958 411038 37 5 58 178 93 71959 642245 3 23 74 269 93 71960 570876 14 5 81 238 90 101961 550310 66 7 27 231 90 101962 548408 63 6 31 228 91 9Av. 518965 56 20 24 214 88 12
Source: Compiled from the annual reports of the Bureau of the Census; Cotton Division, AgriculturalMarketing Service, USDA, and Policy Program Appraisal Division, Agricultural Stabilization and Con-""rvation Service, USDA.
3M-3-64
45

THE UNIVERSITY OF TENNESSEEAGRICULTURAL EXPERIMENT STATION
KNOXVILLE, TENNESSEE
AGRICULTURAL COMMITTEEBOARD OF TRUSTEES
Andrew D. Holt, PresidentClyde M. York, Chairman
Ben Douglass, Harry W. Laughlin, Wassell RandolphW. F. Moss, Commissioner of Agriculture
STATION OFFICERSADMINISTRATION
Andrew D. Holt, PresidentWebster Pendergrass, Dean of Agriculture
J. A. Ewing, DirectorEric Winters, Associate DirectorJ. L. Anderson, Budget Officer
DEPARTMENT HEADS
T. J. Whatley, AgriculturalEconomics and Rural Sociology
J. J. McDow, AgriculturalEngineering
L. F. Seatz, AgronomyC. S. Hobbs, Animal Husbandry-
Veterinary ScienceRuth L. Highberger, Child
DevelopmentJ. T. Miles, Dairy
M. R. Johnston, Food TechnologyBernadine Meyer, Foods
and Institutional ManagementMyra L. Bishop, Home Management,
Equipment, and Family EconomicsB. S. Pickett, HorticultureR. L. HaJIlilton, InformationK. L. Hertel, PhysicsJ. O. Andes, Plant PathologyO. E. Goff, PoultryAnna J. Treece, Textiles and Clothing
UNIVERSITY OF TENNESSEE AGRICULTURALRESEARCH UNITS
Main Station, J. N. Odom, General Superintendent of Farms, KnoxvilleUniversity of Tennessee-Atomic Energy Commission Agricultural Research
Laboratory, Oak Ridge, N. S. Hall, Laboratory Director
BRANCH STATIONS
Dairy Experiment Station, Lewisburg, J. R. Owen, SuperintendentHighland Rim Experiment Station, Springfield, L. M. Safley, SuperintendentMiddle Tennessee Experiment Station, Spring Hill, E. J. Chapman, Superin-
tendentPlateau Experiment Station, Crossville, J. A. Odom, SuperintendentTobacco Experiment Station, Greeneville, J. H. Felts, SuperintendentWest Tennessee Experiment Station, Jackson, B. P. Hazlewood, Superintendent
FIELD STATIONS
Ames Plantation, Grand JunctionCumberland Plateau Forestry Field Station, WartburgFriendship Forestry Field Station, ChattanoogaHighland Rim Forestry Field Station, TullahomaMilan Field Station, Milan