factors influencing consumer attitude and perception
TRANSCRIPT

FACTORS INFLUENCING CONSUMER ATTITUDE AND PERCEPTION
TOWARDS ONLINE TO OFFLINE (O2O) FOOD DELIVERY BUSINESS IN
A TIER 3 CITY OF INDIA
Aarti Rishi1, Chidanand Patil
2 and Venu Prasad H D
3
ABSTRACT
The growth in technology coupled with low-cost mobile data plans attracts many people to
access the Internet, which has resulted in a spike in Online to Offline (O2O) business in India
including Online Food Delivery (OFD) platforms. In the present global COVID-19
pandemic, the OFD service providers played a vital role in delivering the food to consumers
and enabling the restaurants to keep operating by minimising their losses. With the increase
in demand for fast and online foods, many businesses are entering into tier 3 cities in India.
This study was conducted in a tier 3 city in the month of February-March 2020 to assess the
consumer attitude and perception towards an OFD application, Zomato. The results indicate
that the frequency of using an app, monthly expenditure of the respondent and the first five
order benefits that the Zomato offers to the customers shows highly significant to the orders
they place. However, most of the respondents reported digital trustworthiness, higher service
charges, followed by higher prices as the challenges while ordering food. Home-cooked food
with 24x7 availability were the expectations of the consumers. As the demand for online food
orders increases, there is a huge scope to improve the business, if the company switches to
adopt user-friendly services and provide excellent quality products at a reasonable price.
Government need to ensure safety in online transactions in order to attract more people to use
electronic medium for transaction. The outcome of the study would help the policy makers
and OFD players to better understand the insights of consumers towards OFD system
especially in a tier III cities and may take new initiative for the improvement of OFD
business sector.
Key words: Online to Offline (O2O), Online food delivery, Consumer attitude, Consumer
preference
1Student (Email: [email protected]) &
2Assistant Professor, Department of Applied
Agriculture, Central University of Punjab, Bathinda, Punjab, India. PIN: 151001. 3Scientist (Email: [email protected]), Centre for Water Resources Development and
Management, Kozhikode, Kerala, India. PIN: 673571.
Journal of University of Shanghai for Science and Technology ISSN: 1007-6735
Volume 23, Issue 8, August - 2021 Page-5
2Corresponding author email: [email protected]
Journal of University of Shanghai for Science and Technology ISSN: 1007-6735
Volume 23, Issue 8, August - 2021 Page-6
Introduction
The rapid growth of e-commerce has given rise to many new forms of businesses like
B2B (Business to Business), B2C (Business to Consumer), C2C (Consumer to Consumer)
and O2O (Online to Offline) (Li et al, 2020). The business of O2O is a marketing method
based on Information and Communications Technology (ICT) whereby consumers place
orders for goods or services online and receive the goods or services at an offline outlet (Li et
al, 2020). In the past few years, the O2O Food Delivery (FD) market has flourished globally
(Xu & Huang, 2019) and O2O commerce is growing rapidly through Online Food Delivery
(OFD) platforms (Li et al, 2020).
OFD can be defined as a process of distribution of food or take out from a restaurant
or a local food joint through a web page or mobile app (Vinaik, 2019). Currently, 11 percent
of the global population has access to FD platforms (Singh, 2019). The global market for FD
stood at €83 billion or one percent of the total food market (Hirschberg et al., 2016; Dave &
Trivedi, 2019). China is the leading country in the market share of OFD followed by United
States with the developing markets of India and Brazil which are showing a rapid growth of
more than 9 percent (Compound Annual Growth Rate- CAGR) (Li et al, 2020). Between
2015-18, the online delivery market has embraced a growth of 25 percent and is expected to
grow at a rate of 14.9 percent till 2020 (Dave & Trivedi, 2019).
The OFD business is found to be satisfying the needs of the urban and metropolitan
consumers, who are busy with their work, with no time to travel and expect the food to
deliver at their doorsteps from different restaurants across the city (Ganapathy & Abu-
Shanab, 2020; Singh & Verma, 2020). Different mobile food ordering applications have been
widely used in the restaurant business as a creative platform for targeting consumers and
supplying best quality food services (Alalwan, 2020). Indians are highly active at using
mobile applications for ordering food online from various apps (Jeyakumari, 2020) and the
use of apps depends on individual choice and convenience. With more than 1.2 billion
population, India is at the cusp of a massive e-commerce revolution (Raman, 2018). In March
2019, food app downloads increased by 2.9 times year-on-year in India to around 46.4
million downloads (Times of India Newspaper, 2019). The revenue from the OFD system
accounts for US$ 9,207 million in the year 2020, with 184.3 million users and expected to
increase to US$164 billion by 2024 (www.statista.com). Currently, OFD in India is estimated
Journal of University of Shanghai for Science and Technology ISSN: 1007-6735
Volume 23, Issue 8, August - 2021 Page-7
to be worth ` 10.27 Billion (www.statista.com), which indicates a tremendous growth and
opportunity in the coming years.
Ordering the food online has become easier, customers have more choice to access
food from a wide range of restaurants to their locations with a single tap of their mobile
phone (Hirschberg et al., 2016; Alalwan, 2020). Along with delivering food, the OFD
business has created employment opportunities to chefs, administrative staffs in restaurants,
delivery people, programmers and support industries like food packaging etc.
The number of delivery app users and their social impact has increased along with the
number of smartphone users (Song et al., 2017). There were 5.2 billion smartphone
connections in 2019 and it was estimated that half of the world‟s population will have access
to mobile internet services by the end of 2020 (Li et al, 2020). The low-cost mobile data
packs have made India the most affordable country in accessing the internet (Mehta et al.,
2019). The food apps were the second most downloaded applications for Apple iOS users and
a latest Boston Consulting Group report revealed that around 60 percent of food catering
customers had already embraced no less than one mobile food ordering application (Alalwan,
2020).
The factors which are responsible for the increased usage of OFD services in India are
growing, these include middle class population, growing working women population, rising
per capita income, increased relatively economical internet penetration, increased digital
literacy, advanced mobile technology, lack of time to prepare food, availability of variety of
foods, rewards and cashbacks, availability of different payment options like credit card, debit
card, in-app wallet and cash on delivery, congested metropolitan cities, expansion in the pace
of urbanization and the changing demographics where we have more youngsters who have
more urge for eating outside food rather than home cooked food (Bajaj & Mehendale, 2016;
Bagla & Khan, 2017; Vidwans, 2018; Sharma et al., 2018; Chakraborty, 2019; Dave &
Trivedi, 2019; Begum, 2020; Verma, 2020). Apart from this, Social media also plays an
important role in the rise of OFD business and the most preferred social media platform
includes Facebook followed by Instagram, wherein the companies deliver various offers and
contests and try to build a connection with customers and put efforts to turn them into loyal
ones (Mehta et al., 2019).
Journal of University of Shanghai for Science and Technology ISSN: 1007-6735
Volume 23, Issue 8, August - 2021 Page-8
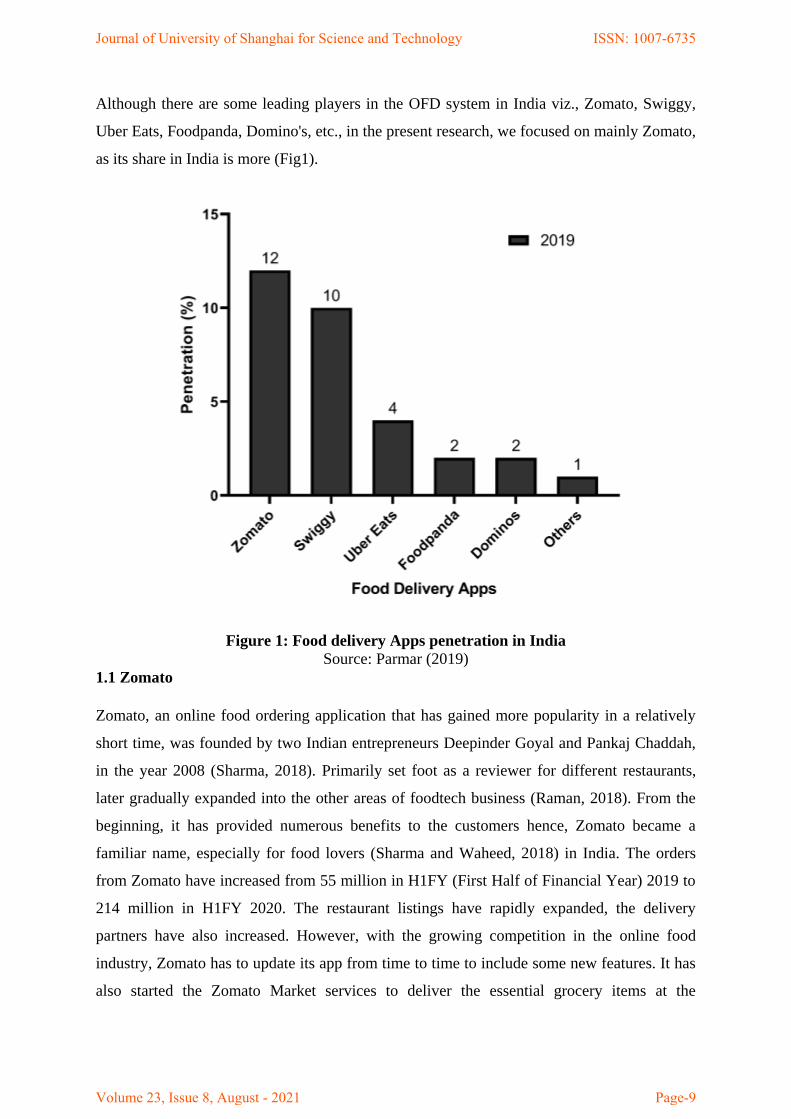
Although there are some leading players in the OFD system in India viz., Zomato, Swiggy,
Uber Eats, Foodpanda, Domino's, etc., in the present research, we focused on mainly Zomato,
as its share in India is more (Fig1).
Figure 1: Food delivery Apps penetration in India
Source: Parmar (2019)
1.1 Zomato
Zomato, an online food ordering application that has gained more popularity in a relatively
short time, was founded by two Indian entrepreneurs Deepinder Goyal and Pankaj Chaddah,
in the year 2008 (Sharma, 2018). Primarily set foot as a reviewer for different restaurants,
later gradually expanded into the other areas of foodtech business (Raman, 2018). From the
beginning, it has provided numerous benefits to the customers hence, Zomato became a
familiar name, especially for food lovers (Sharma and Waheed, 2018) in India. The orders
from Zomato have increased from 55 million in H1FY (First Half of Financial Year) 2019 to
214 million in H1FY 2020. The restaurant listings have rapidly expanded, the delivery
partners have also increased. However, with the growing competition in the online food
industry, Zomato has to update its app from time to time to include some new features. It has
also started the Zomato Market services to deliver the essential grocery items at the
Journal of University of Shanghai for Science and Technology ISSN: 1007-6735
Volume 23, Issue 8, August - 2021 Page-9
consumer's doorstep. Today, it is present in over 10,000 cities across the globe with over 1.4
million active restaurants (Chaudhary, 2019).
Only few studies are available with respect to the OFD system in tier III cities of India
particularly in the state of Punjab wherein the percentage of middle-class consumers is
increasing. As Zomato introduced recently in a tier- III city of Bathinda, there was a need to
examine which aspects could shape customers' perception, intention, and behaviour towards
the OFD app. The outcome of the study would help the policy makers and OFD players to
better understand the perceptions of consumers towards OFD system especially in a tier III
city like Bathinda and may take new initiative for the improvement of OFD business sector.
Hence, the present study aims at understanding the consumers attitude and preference
towards the OFD app Zomato in Bathinda city of Punjab.
2 Methodology
2. 1 Study area:
The study conducted in purposively selected Bathinda district of Punjab, India (Fig 2).
Bathinda district is in the Malwa region of Punjab. The districts encompass an area of 3,385
square kilometres (www.bathinda.nic.in). According to the area, Bathinda District is the
third-largest in Punjab (after Ludhiana District and Sangrur District) (www.bathinda.nic.in).
It is home to different religions, castes, cultures, and occupations. Zomato has started its
service in Bathinda on 7th
December 2018 (gadgets.ndtv.com) and it is in its nascent phase.
With the evolving lifestyle, however, many people can be observed ordering food online,
giving the industry the potential to expand as more and more people become aware of it.
Therefore, it is useful to identify the consumer attitude and perception towards food orders
using the Zomato app.
Journal of University of Shanghai for Science and Technology ISSN: 1007-6735
Volume 23, Issue 8, August - 2021 Page-10
Fig 2: Map of the study area (Source: Wikimedia)
2. 2 Source of data:
The primary data on customer socio-economic status, attitude, and perception of Zomato was
collected using a questionnaire through online mode using „Google Forms‟. The target
respondents were only those who used to be Zomato users. A list of those who ordered food
from Zomato collected from the Zomato office of Bathinda. From this list, 200 respondents
selected randomly and the respondents were pre-checked by contacting them personally
before the data was collected. After making sure they had or were using the Zomato App
service, a link of the „Google Forms‟ was sent to the respondent‟s email ids/ WhatsApp
numbers.
2.3 Analysis of data:
2.3.1 Random Forest (RF)
Random forest is an ensemble learning method based on classification and regression trees.
Each tree trained on a bootstrap sample and optimal variables at each split identified from a
random subset of all variables (Szymczak et al., 2019). The selecting criteria are different for
classification and regression problems. In addition to prediction, RFs can be used to estimate
variable importance measures to rank variables by predictive importance. (Szymczak et al.,
Journal of University of Shanghai for Science and Technology ISSN: 1007-6735
Volume 23, Issue 8, August - 2021 Page-11
2019) In order to find out which of the independent variables influence the dependent
variable i.e., Zomato orders, we performed a Random Forest algorithm using R software.
2.3.2 Spearman’s rank correlation
Spearman‟s rank correlation method was used to analyse the data in order to measure the
difference in the ranking attributes of the respondents (Kumar, 2016). It applied to data in the
form of ranks and was estimated using the following formula:
( )
( ) ( )
Where, dᵢ = difference of the ᵢth
pair and n = number of differences
3 Result and Discussion
After analysing the data, the results of the study are presented in the following tables.
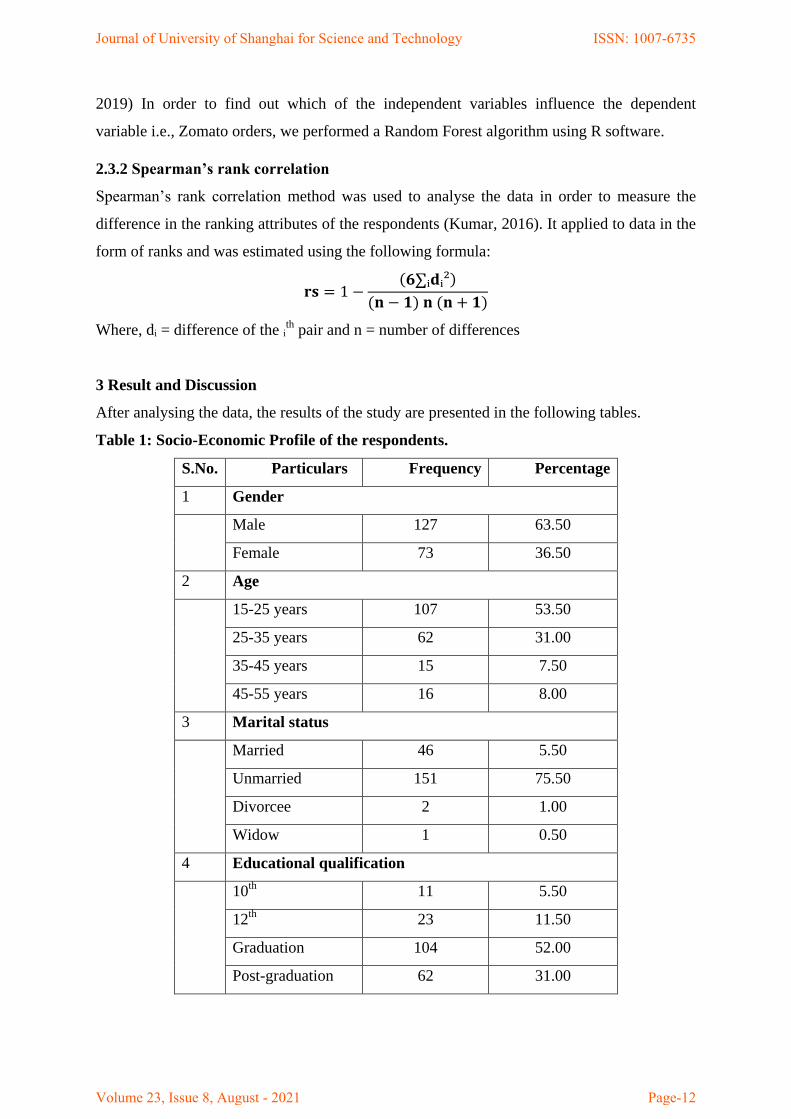
Table 1: Socio-Economic Profile of the respondents.
S.No. Particulars Frequency Percentage
1 Gender
Male 127 63.50
Female 73 36.50
2 Age
15-25 years 107 53.50
25-35 years 62 31.00
35-45 years 15 7.50
45-55 years 16 8.00
3 Marital status
Married 46 5.50
Unmarried 151 75.50
Divorcee 2 1.00
Widow 1 0.50
4 Educational qualification
10th
11 5.50
12th
23 11.50
Graduation 104 52.00
Post-graduation 62 31.00
Journal of University of Shanghai for Science and Technology ISSN: 1007-6735
Volume 23, Issue 8, August - 2021 Page-12
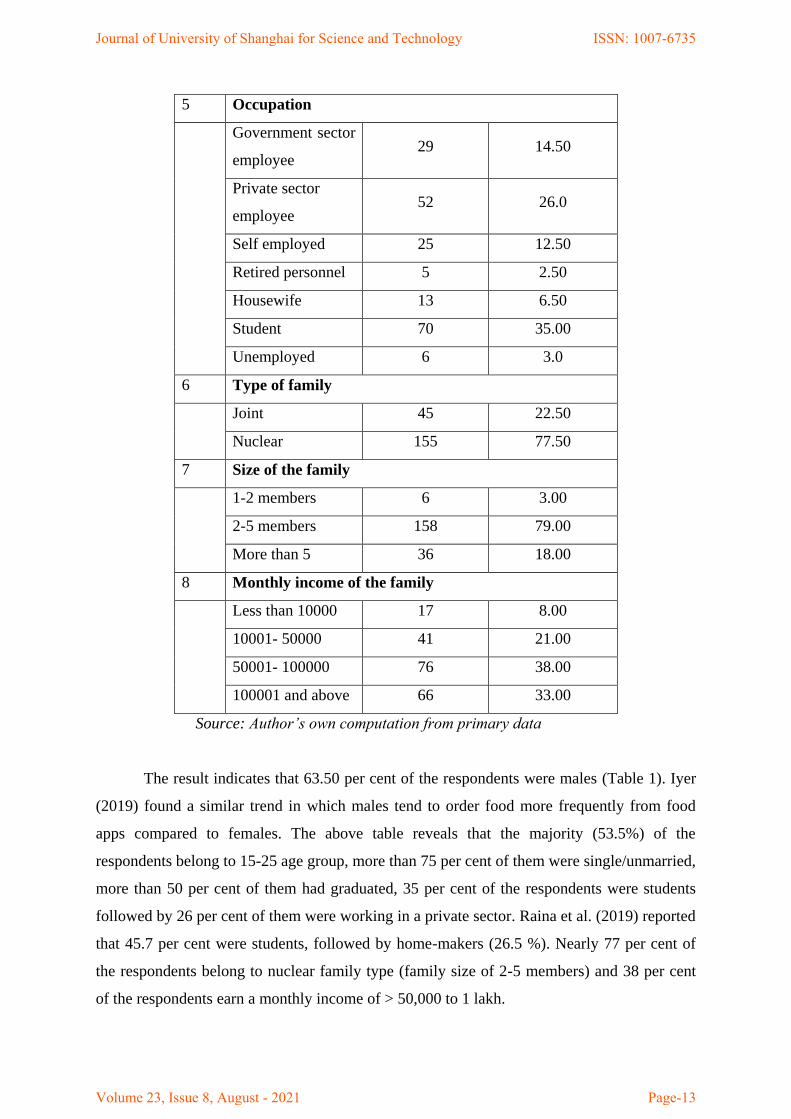
5 Occupation
Government sector
employee 29 14.50
Private sector
employee 52 26.0
Self employed 25 12.50
Retired personnel 5 2.50
Housewife 13 6.50
Student 70 35.00
Unemployed 6 3.0
6 Type of family
Joint 45 22.50
Nuclear 155 77.50
7 Size of the family
1-2 members 6 3.00
2-5 members 158 79.00
More than 5 36 18.00
8 Monthly income of the family
Less than 10000 17 8.00
10001- 50000 41 21.00
50001- 100000 76 38.00
100001 and above 66 33.00
Source: Author’s own computation from primary data
The result indicates that 63.50 per cent of the respondents were males (Table 1). Iyer
(2019) found a similar trend in which males tend to order food more frequently from food
apps compared to females. The above table reveals that the majority (53.5%) of the
respondents belong to 15-25 age group, more than 75 per cent of them were single/unmarried,
more than 50 per cent of them had graduated, 35 per cent of the respondents were students
followed by 26 per cent of them were working in a private sector. Raina et al. (2019) reported
that 45.7 per cent were students, followed by home-makers (26.5 %). Nearly 77 per cent of
the respondents belong to nuclear family type (family size of 2-5 members) and 38 per cent
of the respondents earn a monthly income of > 50,000 to 1 lakh.
Journal of University of Shanghai for Science and Technology ISSN: 1007-6735
Volume 23, Issue 8, August - 2021 Page-13
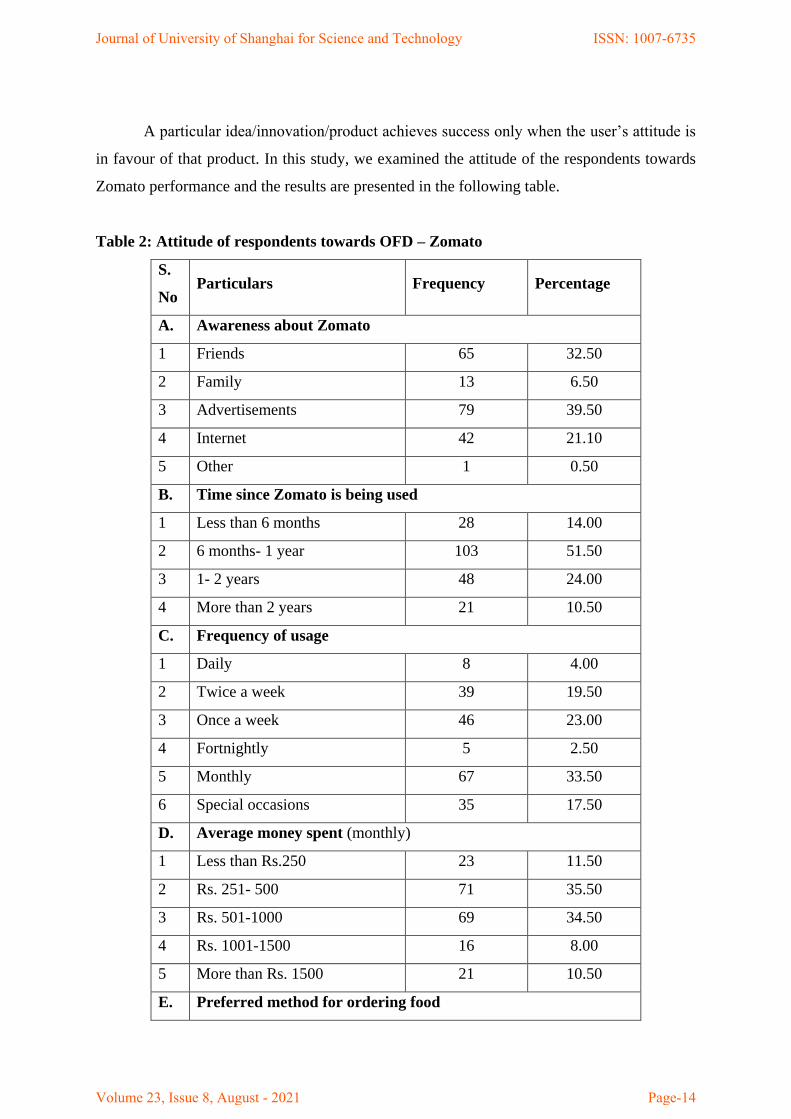
A particular idea/innovation/product achieves success only when the user‟s attitude is
in favour of that product. In this study, we examined the attitude of the respondents towards
Zomato performance and the results are presented in the following table.
Table 2: Attitude of respondents towards OFD – Zomato
S.
No Particulars Frequency Percentage
A. Awareness about Zomato
1 Friends 65 32.50
2 Family 13 6.50
3 Advertisements 79 39.50
4 Internet 42 21.10
5 Other 1 0.50
B. Time since Zomato is being used
1 Less than 6 months 28 14.00
2 6 months- 1 year 103 51.50
3 1- 2 years 48 24.00
4 More than 2 years 21 10.50
C. Frequency of usage
1 Daily 8 4.00
2 Twice a week 39 19.50
3 Once a week 46 23.00
4 Fortnightly 5 2.50
5 Monthly 67 33.50
6 Special occasions 35 17.50
D. Average money spent (monthly)
1 Less than Rs.250 23 11.50
2 Rs. 251- 500 71 35.50
3 Rs. 501-1000 69 34.50
4 Rs. 1001-1500 16 8.00
5 More than Rs. 1500 21 10.50
E. Preferred method for ordering food
Journal of University of Shanghai for Science and Technology ISSN: 1007-6735
Volume 23, Issue 8, August - 2021 Page-14
1 Mobile apps 197 98.50
2 Use of Desktop/Laptop 3 1.50
F. Mode of payment
1 Cash on delivery 70 35.00
2 Paytm 23 11.50
3 Debit card 45 22.50
4 Google pay 41 20.50
5 Credit card 11 5.50
6 Zomato credit 1 0.50
7 Phonepe 9 4.50
Source: Author’s own computation from primary data
Results from the table 2 indicate that around 40 per cent of the sample respondents came to
know about Zomato through advertisements followed by friends (32.5%) and internet
(21.1%). Prabhu et al. (2018) and Kanishka (2014) reported that the source of awareness
about Zomato was through friends and it was about 40% and 32 %, respectively.
More than half of the respondents (51.5 %) were using Zomato from past six months to a year
followed by 1- 2 years (24%), less than six months (14%) and more than two years (10.5%).
Vinaik et al. (2019) reported that most of the respondents were using Zomato from past 1-2
years.
Around 33.5 percent of the sample respondents used Zomato to order food only on special
occasions. Nearly 23 per cent of the respondents ordered food once a week from Zomato,
followed by twice a week (19.5%), monthly (17.5%), daily (4%) and fortnightly (2.5 %). In a
study by Beliya et al. (2019) found that most of the respondents used Zomato to order food
once in a week.
Around 35.5 percent of the respondents spent ` 250-500 on ordering food from Zomato,
followed by 34.5 percent spent ` 500-1000. In the study, Beliya et al. (2019) revealed that the
average money spent on ordering food from Zomato was ` 500-1000. In another study by
Trivedi (2018) also found similar results highlighting the average money spent on ordering
food online through Zomato to be ` 500-1000. However, the results of the current study
highlight that the average money spent by most of the respondents were ` 250-500 (35.50%),
followed by ` 500-1000 (34.50%).
Journal of University of Shanghai for Science and Technology ISSN: 1007-6735
Volume 23, Issue 8, August - 2021 Page-15

As much as 98.5 per cent of the respondents ordered food using Zomato mobile app while
only 1.50 per cent of the respondents preferred the Zomato website for ordering food.
Maheshwari. et al. (2019) found out that the majority of the respondents (67%) preferred
mobile apps as a medium to order food online. The reason could be the ease of using the
mobile application as compared to the website.
Around 35% of the respondents preferred cash on delivery, while 22.5% of respondents
preferred a Debit card as their mode of payment. The respondents also used UPI mode of
payment, like Google Pay (20.5%), followed by Paytm (11.50%) and Phonepe (4.5%). The
Credit card mode of payment was the least preferred by around 5.5 per cent of the
respondents.
The inbuilt app payment, i.e., Zomato Credit was used only by 0.50 per cent of the sample
respondents. In a study by Trivedi (2018) highlighted that the most preferred method of
payment was cash on delivery (78.80%) followed by Credit and Debit cards (39.10%).
Similarly, Parashar et al. (2017) found that Cash on delivery was the most preferred method
by 40 per cent of the respondents. Beliya et al. (2019) revealed that Paytm was the most
preferred method of payment.
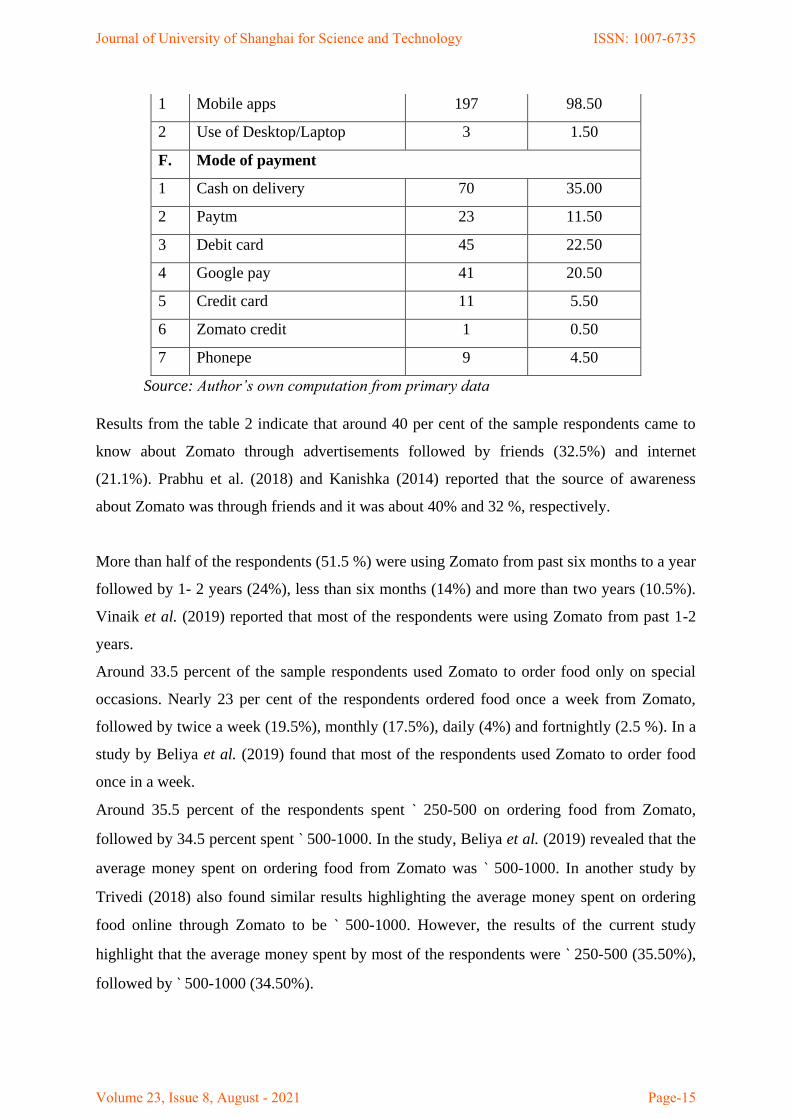
Results from Fig 3 revealed that most of the respondents used Zomato for ordering snacks.
These are small serves of food that are generally eaten between meals, which includes Pav
bhaji, different kinds of chaats (fruit, potato, etc.), Cheese balls, Cutlets and Kababs, etc.
After snacks, most of the respondents preferred ordering dinner, followed by lunch, breakfast,
and supper. Iyer (2019) found that most of the respondents preferred ordering dinner
(71.30%), followed by snacks (20.50%). Rathore et al. (2018) revealed that most of the
respondents preferred to order snacks (37.50%) from Zomato.
In terms of cuisine choice (Fig 4), the majority of the respondents preferred ordering North
Indian food, followed by Chinese and Italian with North Indian. Most of the respondents
preferred ordering more than one cuisine of food. Iyer (2019) found that most of the
respondents preferred North Indian cuisine (35.50%), followed by Chinese (24.20%).
Journal of University of Shanghai for Science and Technology ISSN: 1007-6735
Volume 23, Issue 8, August - 2021 Page-16
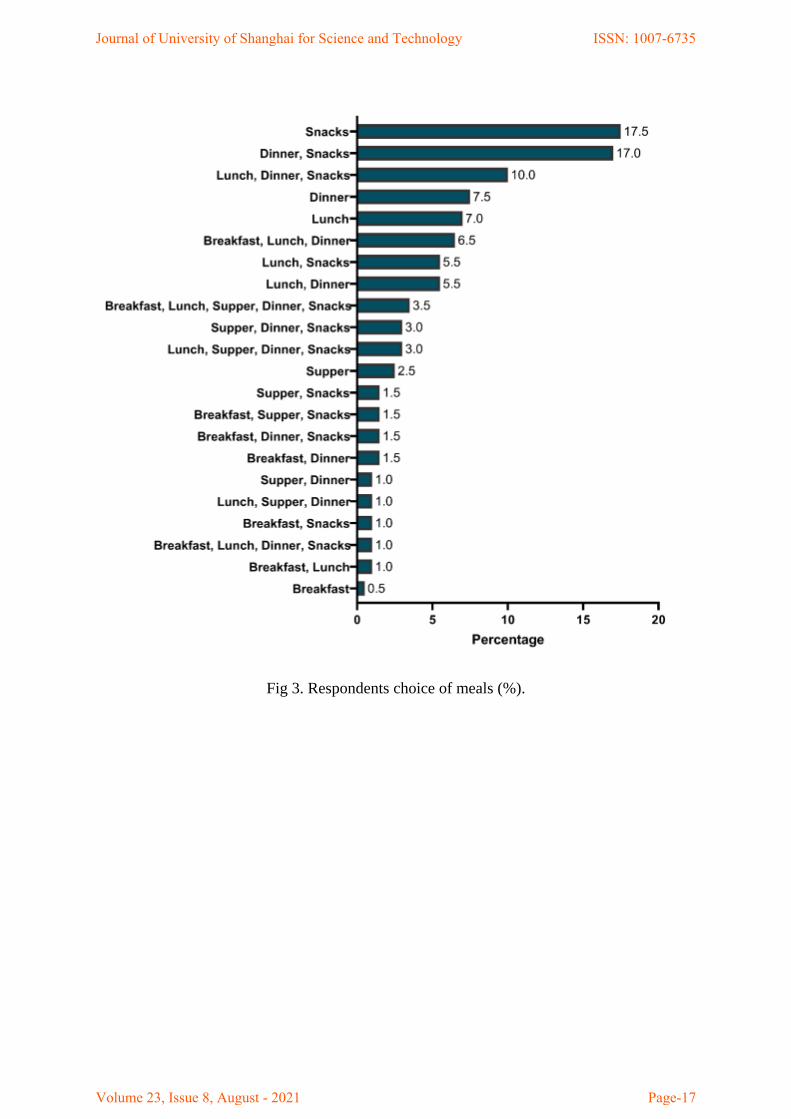
Fig 3. Respondents choice of meals (%).
Journal of University of Shanghai for Science and Technology ISSN: 1007-6735
Volume 23, Issue 8, August - 2021 Page-17
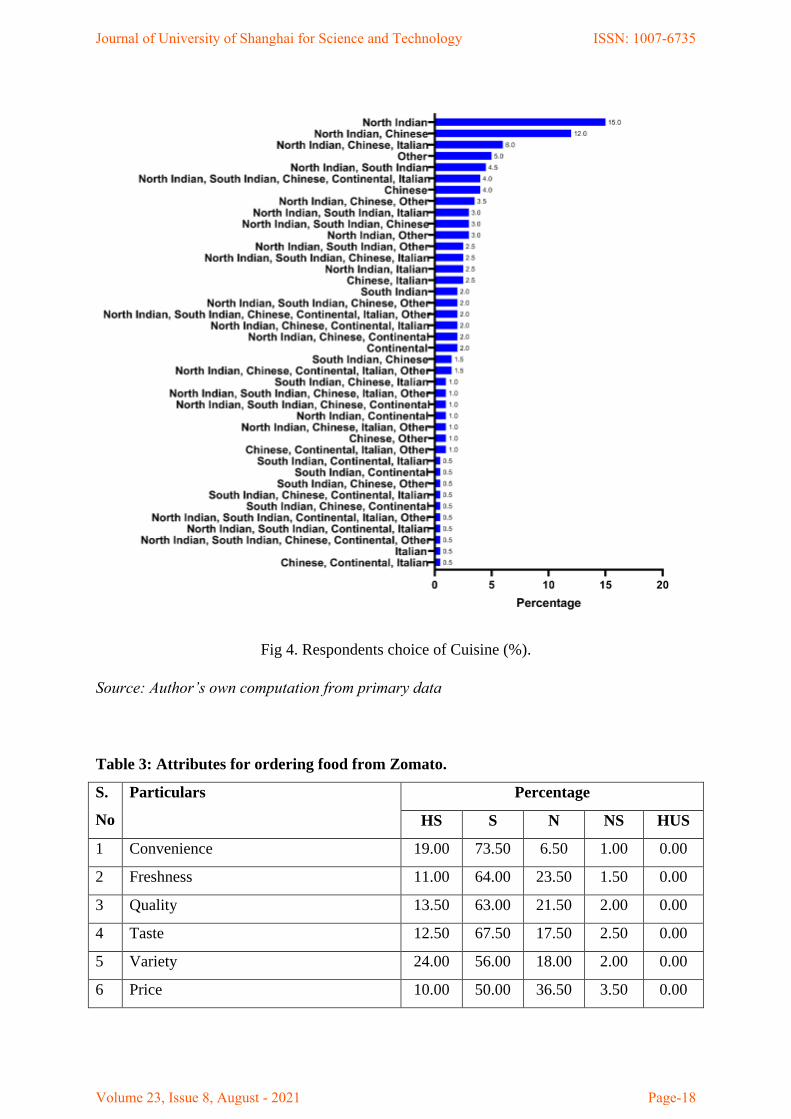
Fig 4. Respondents choice of Cuisine (%).
Source: Author’s own computation from primary data
Table 3: Attributes for ordering food from Zomato.
S.
No
Particulars Percentage
HS S N NS HUS
1 Convenience 19.00 73.50 6.50 1.00 0.00
2 Freshness 11.00 64.00 23.50 1.50 0.00
3 Quality 13.50 63.00 21.50 2.00 0.00
4 Taste 12.50 67.50 17.50 2.50 0.00
5 Variety 24.00 56.00 18.00 2.00 0.00
6 Price 10.00 50.00 36.50 3.50 0.00
Journal of University of Shanghai for Science and Technology ISSN: 1007-6735
Volume 23, Issue 8, August - 2021 Page-18
7 Transaction speed 20.50 56.50 21.00 2.00 0.00
8 User friendly 19.00 61.00 18.50 1.50 0.00
9 Digital payment 27.50 56.00 15.50 1.00 0.00
10 Reduces hurdles of preparing food at
home
24.50 58.00 16.50 1.00 0.00
11 First five order benefits 34.50 44.00 18.00 3.00 0.50
12 Referral coupon 17.00 47.50 29.00 6.00 0.50
13 Security 18.50 52.50 26.50 2.50 0.00
HS – Highly Satisfied, S- Satisfied, N- Neutral, NS- Not Satisfied and HUS- Highly
Unsatisfied
Source: Author’s own computation from primary data
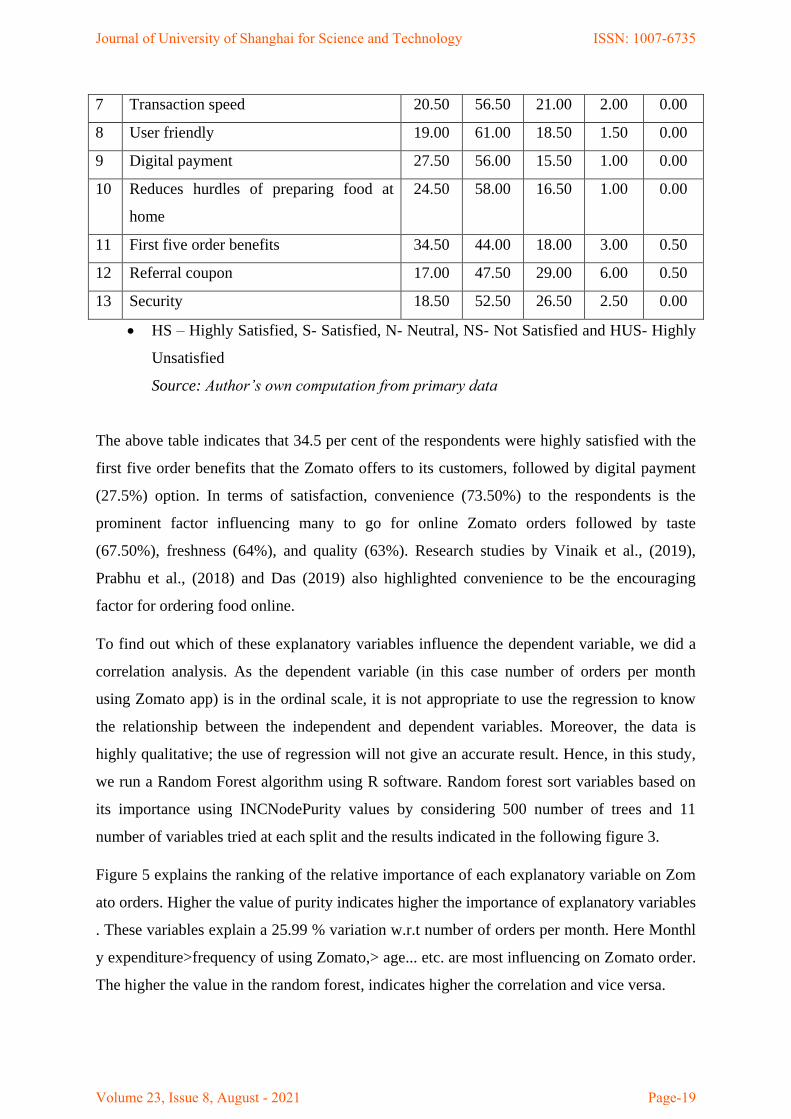
The above table indicates that 34.5 per cent of the respondents were highly satisfied with the
first five order benefits that the Zomato offers to its customers, followed by digital payment
(27.5%) option. In terms of satisfaction, convenience (73.50%) to the respondents is the
prominent factor influencing many to go for online Zomato orders followed by taste
(67.50%), freshness (64%), and quality (63%). Research studies by Vinaik et al., (2019),
Prabhu et al., (2018) and Das (2019) also highlighted convenience to be the encouraging
factor for ordering food online.
To find out which of these explanatory variables influence the dependent variable, we did a
correlation analysis. As the dependent variable (in this case number of orders per month
using Zomato app) is in the ordinal scale, it is not appropriate to use the regression to know
the relationship between the independent and dependent variables. Moreover, the data is
highly qualitative; the use of regression will not give an accurate result. Hence, in this study,
we run a Random Forest algorithm using R software. Random forest sort variables based on
its importance using INCNodePurity values by considering 500 number of trees and 11
number of variables tried at each split and the results indicated in the following figure 3.
Figure 5 explains the ranking of the relative importance of each explanatory variable on Zom
ato orders. Higher the value of purity indicates higher the importance of explanatory variables
. These variables explain a 25.99 % variation w.r.t number of orders per month. Here Monthl
y expenditure>frequency of using Zomato,> age... etc. are most influencing on Zomato order.
The higher the value in the random forest, indicates higher the correlation and vice versa.
Journal of University of Shanghai for Science and Technology ISSN: 1007-6735
Volume 23, Issue 8, August - 2021 Page-19
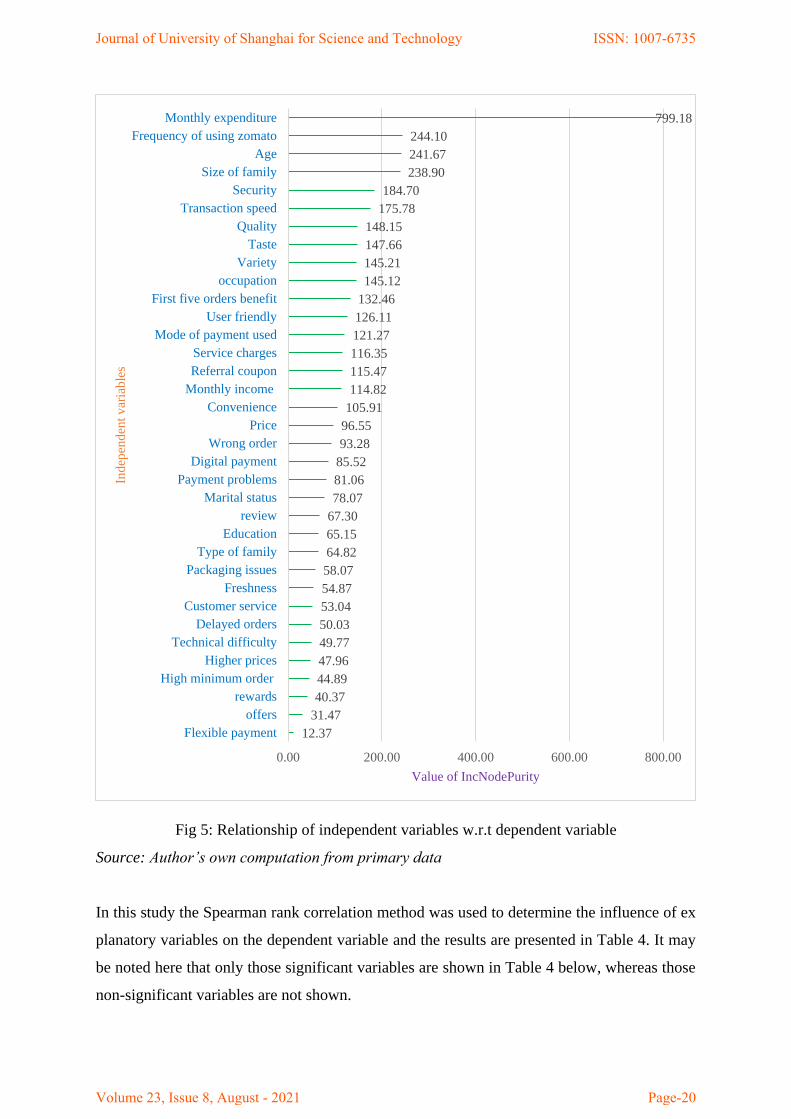
Fig 5: Relationship of independent variables w.r.t dependent variable
Source: Author’s own computation from primary data
In this study the Spearman rank correlation method was used to determine the influence of ex
planatory variables on the dependent variable and the results are presented in Table 4. It may
be noted here that only those significant variables are shown in Table 4 below, whereas those
non-significant variables are not shown.
12.37
31.47
40.37
44.89
47.96
49.77
50.03
53.04
54.87
58.07
64.82
65.15
67.30
78.07
81.06
85.52
93.28
96.55
105.91
114.82
115.47
116.35
121.27
126.11
132.46
145.12
145.21
147.66
148.15
175.78
184.70
238.90
241.67
244.10
799.18
0.00 200.00 400.00 600.00 800.00
Flexible payment
offers
rewards
High minimum order
Higher prices
Technical difficulty
Delayed orders
Customer service
Freshness
Packaging issues
Type of family
Education
review
Marital status
Payment problems
Digital payment
Wrong order
Price
Convenience
Monthly income
Referral coupon
Service charges
Mode of payment used
User friendly
First five orders benefit
occupation
Variety
Taste
Quality
Transaction speed
Security
Size of family
Age
Frequency of using zomato
Monthly expenditure
Value of IncNodePurity
Indep
enden
t v
aria
ble
s
Journal of University of Shanghai for Science and Technology ISSN: 1007-6735
Volume 23, Issue 8, August - 2021 Page-20
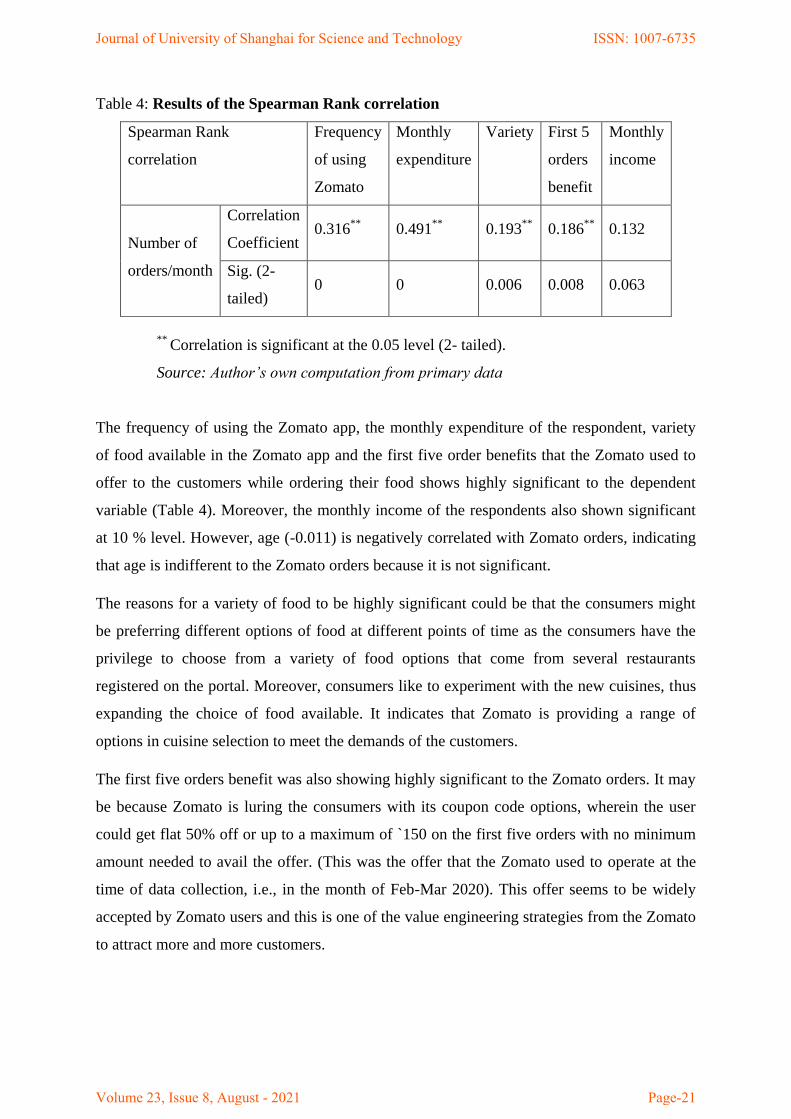
Table 4: Results of the Spearman Rank correlation
Spearman Rank
correlation
Frequency
of using
Zomato
Monthly
expenditure
Variety First 5
orders
benefit
Monthly
income
Number of
orders/month
Correlation
Coefficient 0.316
** 0.491
** 0.193
** 0.186
** 0.132
Sig. (2-
tailed) 0 0 0.006 0.008 0.063
**
Correlation is significant at the 0.05 level (2- tailed).
Source: Author’s own computation from primary data
The frequency of using the Zomato app, the monthly expenditure of the respondent, variety
of food available in the Zomato app and the first five order benefits that the Zomato used to
offer to the customers while ordering their food shows highly significant to the dependent
variable (Table 4). Moreover, the monthly income of the respondents also shown significant
at 10 % level. However, age (-0.011) is negatively correlated with Zomato orders, indicating
that age is indifferent to the Zomato orders because it is not significant.
The reasons for a variety of food to be highly significant could be that the consumers might
be preferring different options of food at different points of time as the consumers have the
privilege to choose from a variety of food options that come from several restaurants
registered on the portal. Moreover, consumers like to experiment with the new cuisines, thus
expanding the choice of food available. It indicates that Zomato is providing a range of
options in cuisine selection to meet the demands of the customers.
The first five orders benefit was also showing highly significant to the Zomato orders. It may
be because Zomato is luring the consumers with its coupon code options, wherein the user
could get flat 50% off or up to a maximum of `150 on the first five orders with no minimum
amount needed to avail the offer. (This was the offer that the Zomato used to operate at the
time of data collection, i.e., in the month of Feb-Mar 2020). This offer seems to be widely
accepted by Zomato users and this is one of the value engineering strategies from the Zomato
to attract more and more customers.
Journal of University of Shanghai for Science and Technology ISSN: 1007-6735
Volume 23, Issue 8, August - 2021 Page-21
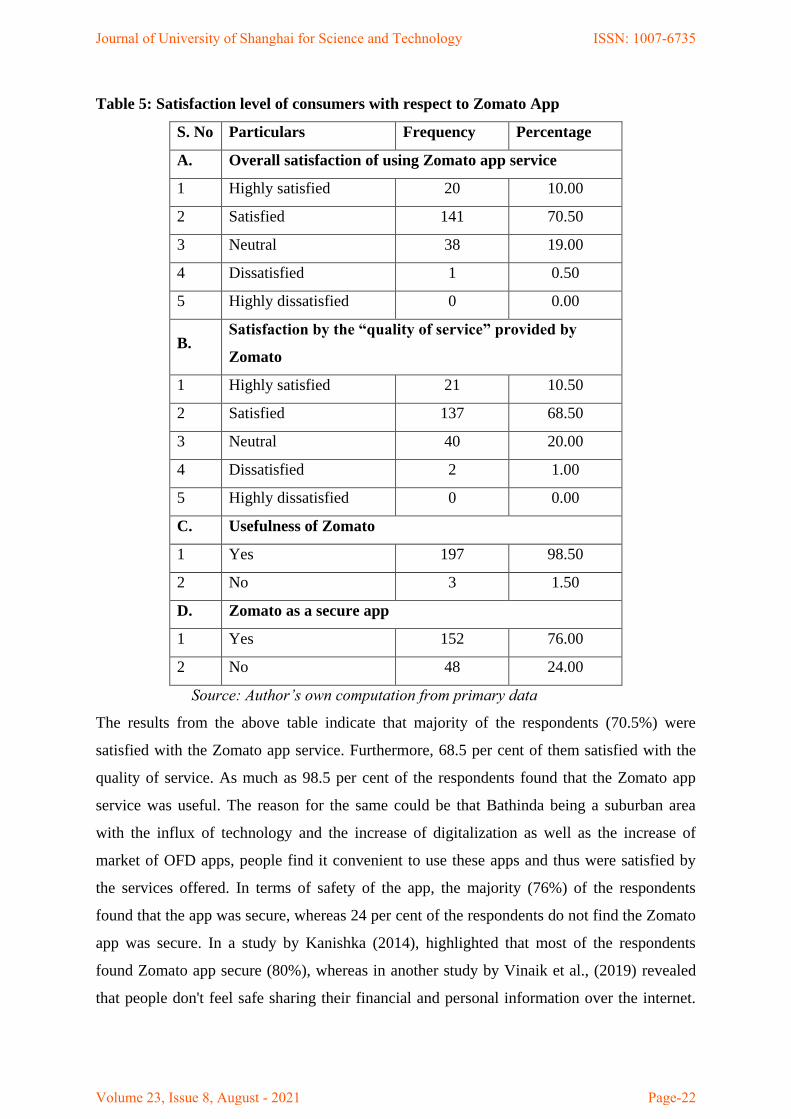
Table 5: Satisfaction level of consumers with respect to Zomato App
S. No Particulars Frequency Percentage
A. Overall satisfaction of using Zomato app service
1 Highly satisfied 20 10.00
2 Satisfied 141 70.50
3 Neutral 38 19.00
4 Dissatisfied 1 0.50
5 Highly dissatisfied 0 0.00
B. Satisfaction by the “quality of service” provided by
Zomato
1 Highly satisfied 21 10.50
2 Satisfied 137 68.50
3 Neutral 40 20.00
4 Dissatisfied 2 1.00
5 Highly dissatisfied 0 0.00
C. Usefulness of Zomato
1 Yes 197 98.50
2 No 3 1.50
D. Zomato as a secure app
1 Yes 152 76.00
2 No 48 24.00
Source: Author’s own computation from primary data
The results from the above table indicate that majority of the respondents (70.5%) were
satisfied with the Zomato app service. Furthermore, 68.5 per cent of them satisfied with the
quality of service. As much as 98.5 per cent of the respondents found that the Zomato app
service was useful. The reason for the same could be that Bathinda being a suburban area
with the influx of technology and the increase of digitalization as well as the increase of
market of OFD apps, people find it convenient to use these apps and thus were satisfied by
the services offered. In terms of safety of the app, the majority (76%) of the respondents
found that the app was secure, whereas 24 per cent of the respondents do not find the Zomato
app was secure. In a study by Kanishka (2014), highlighted that most of the respondents
found Zomato app secure (80%), whereas in another study by Vinaik et al., (2019) revealed
that people don't feel safe sharing their financial and personal information over the internet.
Journal of University of Shanghai for Science and Technology ISSN: 1007-6735
Volume 23, Issue 8, August - 2021 Page-22
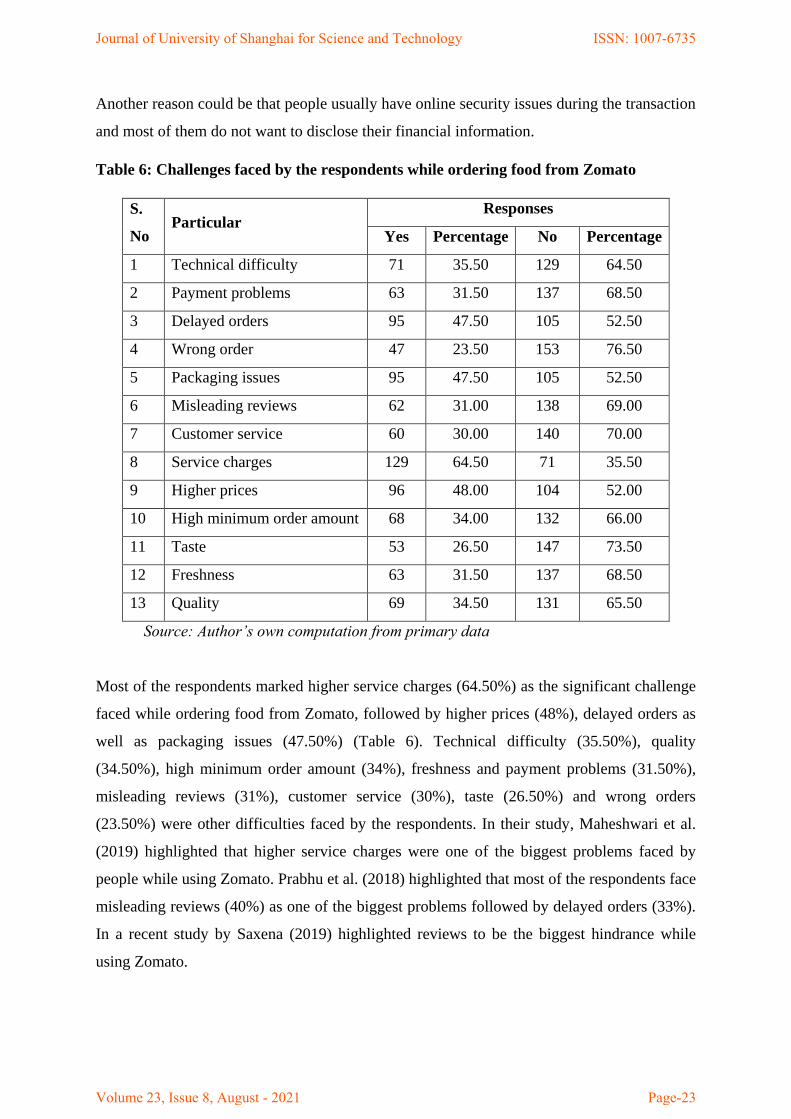
Another reason could be that people usually have online security issues during the transaction
and most of them do not want to disclose their financial information.
Table 6: Challenges faced by the respondents while ordering food from Zomato
S.
No Particular
Responses
Yes Percentage No Percentage
1 Technical difficulty 71 35.50 129 64.50
2 Payment problems 63 31.50 137 68.50
3 Delayed orders 95 47.50 105 52.50
4 Wrong order 47 23.50 153 76.50
5 Packaging issues 95 47.50 105 52.50
6 Misleading reviews 62 31.00 138 69.00
7 Customer service 60 30.00 140 70.00
8 Service charges 129 64.50 71 35.50
9 Higher prices 96 48.00 104 52.00
10 High minimum order amount 68 34.00 132 66.00
11 Taste 53 26.50 147 73.50
12 Freshness 63 31.50 137 68.50
13 Quality 69 34.50 131 65.50
Source: Author’s own computation from primary data
Most of the respondents marked higher service charges (64.50%) as the significant challenge
faced while ordering food from Zomato, followed by higher prices (48%), delayed orders as
well as packaging issues (47.50%) (Table 6). Technical difficulty (35.50%), quality
(34.50%), high minimum order amount (34%), freshness and payment problems (31.50%),
misleading reviews (31%), customer service (30%), taste (26.50%) and wrong orders
(23.50%) were other difficulties faced by the respondents. In their study, Maheshwari et al.
(2019) highlighted that higher service charges were one of the biggest problems faced by
people while using Zomato. Prabhu et al. (2018) highlighted that most of the respondents face
misleading reviews (40%) as one of the biggest problems followed by delayed orders (33%).
In a recent study by Saxena (2019) highlighted reviews to be the biggest hindrance while
using Zomato.
Journal of University of Shanghai for Science and Technology ISSN: 1007-6735
Volume 23, Issue 8, August - 2021 Page-23
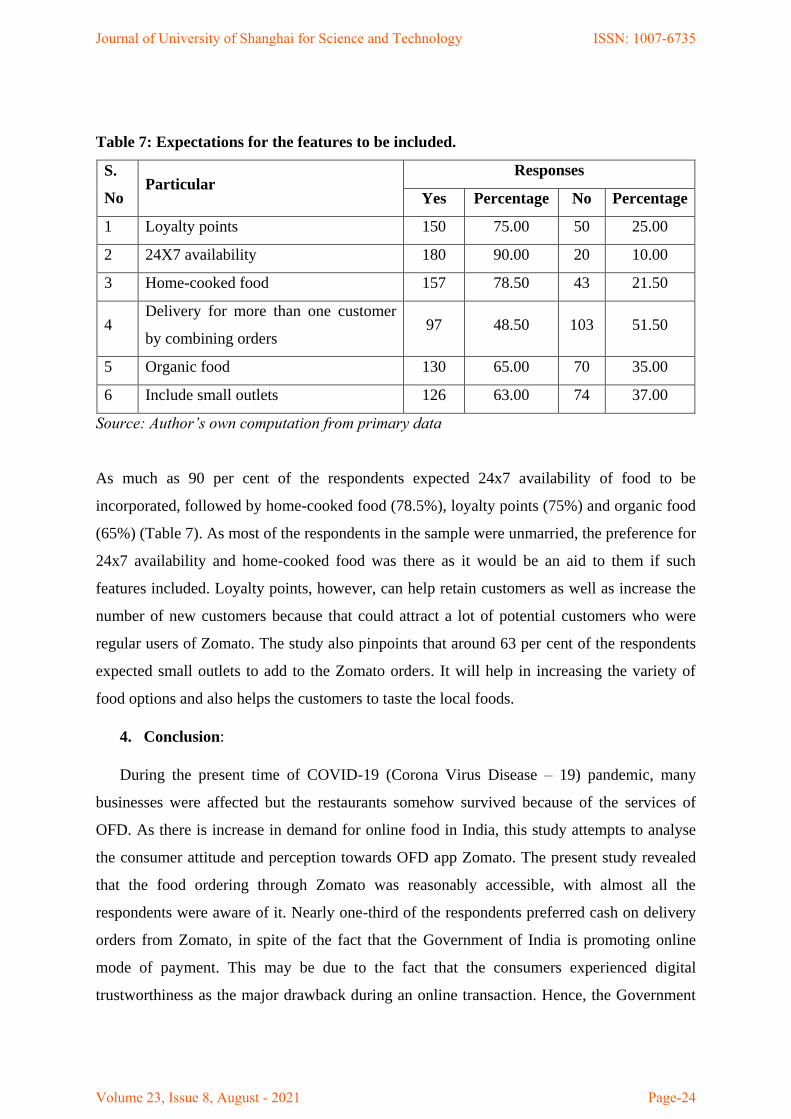
Table 7: Expectations for the features to be included.
S.
No Particular
Responses
Yes Percentage No Percentage
1 Loyalty points 150 75.00 50 25.00
2 24X7 availability 180 90.00 20 10.00
3 Home-cooked food 157 78.50 43 21.50
4 Delivery for more than one customer
by combining orders 97 48.50 103 51.50
5 Organic food 130 65.00 70 35.00
6 Include small outlets 126 63.00 74 37.00
Source: Author’s own computation from primary data
As much as 90 per cent of the respondents expected 24x7 availability of food to be
incorporated, followed by home-cooked food (78.5%), loyalty points (75%) and organic food
(65%) (Table 7). As most of the respondents in the sample were unmarried, the preference for
24x7 availability and home-cooked food was there as it would be an aid to them if such
features included. Loyalty points, however, can help retain customers as well as increase the
number of new customers because that could attract a lot of potential customers who were
regular users of Zomato. The study also pinpoints that around 63 per cent of the respondents
expected small outlets to add to the Zomato orders. It will help in increasing the variety of
food options and also helps the customers to taste the local foods.
4. Conclusion:
During the present time of COVID-19 (Corona Virus Disease – 19) pandemic, many
businesses were affected but the restaurants somehow survived because of the services of
OFD. As there is increase in demand for online food in India, this study attempts to analyse
the consumer attitude and perception towards OFD app Zomato. The present study revealed
that the food ordering through Zomato was reasonably accessible, with almost all the
respondents were aware of it. Nearly one-third of the respondents preferred cash on delivery
orders from Zomato, in spite of the fact that the Government of India is promoting online
mode of payment. This may be due to the fact that the consumers experienced digital
trustworthiness as the major drawback during an online transaction. Hence, the Government
Journal of University of Shanghai for Science and Technology ISSN: 1007-6735
Volume 23, Issue 8, August - 2021 Page-24
need to address the digital security issues and ensure digital safety measures so that many
will choose digital payments rather than cash on delivery, which helps in reducing the chance
of viral transmission through currency. The study also reveals that as the respondent‟s
monthly income increases, the number of orders that the respondent places may also increase.
If a regular monthly income option is available to the respondents in a tier III city, Zomato
orders will increase. Hence, the Tier-III cities will be the future growth promoters if the
Government will provide regular income-generating activities to the city dwellers.
The areas where regular income and a greater number of unmarried persons are there, in
such places the OFD services will be successful provided that there should be sufficient
options for the people to choose the variety of food/dishes and the company offers some
loyalty and benefit points to the customers. As the demand for online food orders is
increasing, there is an excellent opportunity to increase the business if the company will
incorporate 24x7 orders, home-cooked food in its menu and at the same time, offers the right
quality products at a reasonable price. As the business in Tier-III cities is increasing in India,
these factors need to be considered to capture and expand the market either by startups
through make in India or by those who already in the business of OFD.
Funding:
This research did not receive any specific grant from funding agencies in the public,
commercial, or not-for-profit sectors.
Author contributions statement:
Dr. Chidanand Patil devised the main conceptual idea and design of the study. Ms. Aarti
Rishi contributed in data collection and preparing the manuscript. Dr. Venu Prasad H. D.
provided support in analysis of data and interpretation of results. All authors contributed to
prepare and review the manuscript.
Journal of University of Shanghai for Science and Technology ISSN: 1007-6735
Volume 23, Issue 8, August - 2021 Page-25
Journal of University of Shanghai for Science and Technology ISSN: 1007-6735
Volume 23, Issue 8, August - 2021 Page-26
References:
Ajbani, L. (2019). Online Food Ordering and Delivery: Perception about Quality of Services
among Customers in Nashik. Journal of Engineering sciences, 10(11), 314-319.
Alalwan, A. A. (2020). Mobile food ordering apps: An empirical study of the factors
affecting customer e-satisfaction and continued intention to reuse. International
Journal of Information Management, 50: 28-44.
https://doi.org/10.1016/j.ijinfomgt.2019.04.008
Bagla, R. K. & Khan, J. (2017). Customers' Expectations and Satisfaction with Online Food
Ordering Portals. Prabandhan: Indian Journal of Management, 10(11): 31-44.
doi: 10.17010/pijom/2017/v10i11/119401
Bajaj, K. & Mehendale, S. (2016). Food-Delivery Start-Ups: In search of the Core.
Prabandhan: Indian Journal of Management, 9(10): 42-53.
doi:10.17010/pijom/2016/v9i10/103073.
Begum, A. (2020). Customer‟s attitude and satisfaction towards online food delivery services
in Tirunelveli city. Purakala, 31, 102-108.
Beliya, A., Kujur. R. & Verma, M. (2019). Satisfaction of consumers by using online food
services. International Journal of Humanities and Social Sciences (IJHSS), 8(4), 35-
44.
Chakraborty, D. (2019). Customer Satisfaction Towards Food Service Apps in Indian Metro
Cities. FIIB Business Review, 8(3): 245-255.
https://doi.org/10.1177/2319714519844651
Chaudhary, D. (2019). Zomato revenue triples to $206 mln in FY19. Available at
https://www.fortuneindia.com/enterprise/zomato-revenue-triples-to-206-mln-in-
fy19/103107#:~:text=Zomato%20is%20present%20in%20over,active%20users%20
on%20its%20platform. Accessed on 14th
January, 2020.
Das, J. (2018). Consumer perception towards „online food ordering and delivery services‟: an
empirical study. Journal of Management (JOM), 5(5): 155-163.
Dave, A. C. & Trivedi, R. (2019). Predicting Youngster‟s Attitude towards Online Food
Delivery. International Research Journal of Business Studies, 12(3): 289-299.
Dwivedi, A. & Desai, J. (2020). Food delivery apps: a paradigm shift in the making (A study
through ethical vantage point). National level conference on “Creativity and
sustainability”, 40(8), 549-561.
Journal of University of Shanghai for Science and Technology ISSN: 1007-6735
Volume 23, Issue 8, August - 2021 Page-27
Ganapathy, P. & Abu-Shanab, E. A. (2020). Customer Satisfaction with Online Food
Ordering Portals in Qatar. International Journal of E-Services and Mobile
Applications. 12(1): 57-79, doi:10.4018/IJESMA.2020010104
Ghosh, R. & Saha, R. (2018). A study of e-payment system on food delivery industry: a case
study on Swiggy. International journal on recent trends in business and tourism,
2(3): 19-25.
Hirschberg, C., Rajko, A., Schumacher, T. & Wrulich, M. (2016). The changing market for
food delivery. Available at https://www.mckinsey.com/industries/technology-media-
and-telecommunications/our-insights/the-changing-market-for-food-delivery
Accessed on 21st August, 2020.
Iyer, B. (2019). A study of consumer behaviour towards food ordering through mobile apps.
International Journal of Advance Research, Ideas and Innovations in Technology,
5(4), 360-366.
Jeyakumari, A. & Desai, J. (2020). A study on consumer expectations and satisfaction with
the online food ordering portals. Studies in Indian Places Names 40, 838-852.
Koiri, K., Mukherjee, S. & Dutta, S. (2019). A study on determining the factors impacting
consumer perception regarding the online food delivery apps in Guwahati. GIS
Business, 14(6), 521-542.
Kumar, R. (2016). Studies on training needs of goat farmers in Munger district of Bihar.
West Bengal University of Animal and Fishery Sciences.
Li, C., Mirosa, M. & Bremer, P. (2020). Review of Online Food Delivery Platforms and their
Impacts on Sustainability. Sustainability, 12(14), 5528, doi:10.3390/su12145528
Maheshwari, R., G, Swarnalatha. & T, Gayathri. (2019). A study on Consumer Satisfaction
towards Zomato Online Food Ordering With special reference to Coimbatore City.
International Journal of Trend in Scientific Research and Development, 3(6), 683-
686.
Mehta, G., Iyer, T. & Yadav, J. (2019). A study on adoption of social media by Food
Ordering & Delivering companies for successful development of Relationship
Marketing. International Journal of Research and Analytical Reviews, 6(2): 53-63.
Online Food Delivery - Ireland | Statista Market Forecast. Retrieved from
<https://www.statista.com/outlook/374/140/online-food-delivery/ireland> accessed
on May 05 2020.
Journal of University of Shanghai for Science and Technology ISSN: 1007-6735
Volume 23, Issue 8, August - 2021 Page-28
Panse, C., Rastogi, S. & Sharma. A. (2019). Understanding consumer behaviour towards
Utilization of online food delivery platforms. Journal of Theoretical and Applied
Information Technology, 97(16), 4353- 4364.
Parmar, B. (2019). Food Delivery Market Trends And Scope Of Mobile Applications In Food
Business By 2025. Available at https://www.icoderzsolutions.com/blog/food-
delivery-market-trends-and-scope-of-mobile-applications-in-food-business-by-2025/
Accessed on 12th
January, 2020.
Prabhash, M. (2020). The consumer perception on online food delivery system among youth
in Kerala. EPRA International Journal of Multidisciplinary Research, 6(2), 102-106.
Prabhu, A. & Dongre, R. (2018). Analysis of customer attitude towards electronic food
ordering. KIMI Hospitality Research Journal, 3(1), 1-6.
Raina, A., Rana, V. & Thakur, A. (2019). Popularity of online food ordering and delivery
services- a comparative study between Zomato, Swiggy and Uber eats in Ludhiana.
International Journal of Management, Technology and Engineering, 10(3), 6080-
6088.
Raman, P. (2018). Zomato: a shining armour in the foodtech sector. Journal of Information
Technology Case and Application Research, 20(3-4): 130-150, DOI:
10.1080/15228053.2018.1552396
Retrieved from "In Depth Interview with Pankaj Chaddah, Founder of Zomato". The Startup
Magazine. 7 November 2013.
Retrieved from "Update: Zomato breaks even in India; expands to New Zealand".
MediaNama.com. 26 July 2013. Accessed on May 08 2020.
Saxena, A. (2019). An Analysis of Online Food Ordering Applications in India: Zomato and
Swiggy. International Journal of Research in Engineering, IT and Social Sciences,
9, 13-21.
Sharma, K. & Waheed, K. (2018). Consumption of online food app services: An exploratory
study among college students in Dubai. Middle East Journal of Business, 13, 4-11.
Singh, A. & Nair, S. (2020). Consumer perception and attitude towards online ordering.
International Journal of Research in Engineering, Science and Management 3(5):
119-122.
Singh, R. K. & Verma, H. K. (2020). Influence of Social Media Analytics on Online Food
Delivery Systems. International Journal of Information System Modelling and
Design, 11(3): 1-21. DOI: 10.4018/IJISMD.2020070101
Journal of University of Shanghai for Science and Technology ISSN: 1007-6735
Volume 23, Issue 8, August - 2021 Page-29
Singh, S. (2019). The Soon To Be $200B Online Food Delivery Is Rapidly Changing The
Global Food Industry. Available at
https://www.forbes.com/sites/sarwantsingh/2019/09/09/the-soon-to-be-200b-online-
food-delivery-is-rapidly-changing-the-global-food-industry/#59187bb2b1bc
Accessed on 22nd
August, 2020.
Szymczak, S., Seifert, S. & Degenhardt, F. (2019). Evaluation of variable selection methods
for random forests and omics data set. Briefings in bioinformatics, 20(2), 492-503.
The Future of Online Food Industry: Guide for Aspiring Entrepreneurs. Retrieved from
<https://www.fatbit.com/fab/future-online-food-industry-guide-aspiring-
entrepreneurs/> accessed on May 03 2020.
Times of India Newspaper, Downloads of food delivery apps up, touches 46.4mn. Available
at
http://timesofindia.indiatimes.com/articleshow/69724198.cms?utm_source=contento
finterest&utm_medium=text&utm_campaign=cppst Accessed on 21st August, 2020.
Trivedi, S. (2018). Consumer perception about online sales of food in Indian consumer
market. Proceedings of Academics World 99th International Conference, Paris,
France, 27-29.
Vinaik, A., Goel, R., Sahai, S. & Garg, V. (2019). The Study of Interest of Consumers in
Mobile Food Ordering Apps. International Journal of Recent Technology and
Engineering (IJRTE), 8(1), 3424-3429.
Verma, P. (2020). The effect of presentation, product availability and ease upon transaction
reliability for online food delivery aggregator applications – moderated mediated
model. Journal of Foodservice Business Research, 23(4): 285-304, DOI:
10.1080/15378020.2020.1761586
Vidwans, V. (2018). Global Food Delivery & Takeaway Market Insights 2018–2021.
Available at https://medium.com/@vyomika/global-food-delivery-takeaway-market-
insights-2018-2021-48db8bbe650e Accessed on 21st August, 2020.
Xu, X. & Huang, Y. (2019). Restaurant information cues, Diners‟ expectations, and need for
cognition: Experimental studies of online-to-offline mobile food ordering. Journal of
Retailing and Consumer Services, 51: 231-241.
Journal of University of Shanghai for Science and Technology ISSN: 1007-6735
Volume 23, Issue 8, August - 2021 Page-30