factors that impede the progress, success, and persistence ... · museus, palmer, davis, and...
TRANSCRIPT

Academic Forum 32 (2014–15)
13
Biographical Sketch
Linda G. (Brown) English is a native of Prescott, Arkansas. She taught for twelve years in the
public schools of southwest Arkansas prior to returning to her alma mater, Henderson State
University in 2001 to teach. Currently, Linda is Professor of Counselor Education in the
Teachers College of her beloved Henderson.
Linda has been published in numerous regional, state and national publications, both
professional journals and socio-cultural venues, such as The Old Time Chronicle, The Southern
Standard, The Journal of Poetry Therapy and Tales from the South.
Linda lives in the farmhouse which is the setting for many of her stories with Buford and Babe,
her silver-point tabby and black Labrador retriever, respectively.
Factors that Impede the Progress, Success, and Persistence to Pursue STEM
education for Henderson State University Students Who Are Enrolled in
Honors College and in the McNair Scholars Program
Pamela Bax, Ed.D., Director of TRIO Programs
Martin Campbell, Ph.D., Professor of Organic Chemistry
Tanesha Eabron, HSU McNair Alum
David Thomson, Ph.D., Director of the Honors College
Abstract
The McNair Scholars Program is one of eight TRIO Programs funded by the United
States Department of Education. The McNair Scholars Program at Henderson State University
(HSU) is designed to prepare low-income, first-generation, and underrepresented
undergraduate students for doctoral studies through involvement in research and other scholarly
activities; summer internships; seminars and other educational activities; tutoring; academic
counseling; and activities designed to assist students in securing admission to and financial
assistance for enrollment in graduate programs. The principal investigator is Dr. Pamela Bax,
the Director of HSU’s TRIO Programs. The co-investigators are Dr. David Thomson, Director
of the Honors College, and Dr. Martin Campbell, Professor of Chemistry. The purpose of the
study is to understand the factors that impede and help the progress, success, and persistence of
underrepresented students of color to pursue STEM (Science, Technology, Engineering and
Math) education. Participants were selected from HSU’s Honors College who were enrolled in
STEM courses and students who were enrolled in the McNair Scholars Program and were
majors STEM-related fields. The study revealed that a lack of participation in McNair activities
and an absence of STEM role models were factors that impeded students’ progress and success
in STEM education. The study also revealed that encouragement from HSU faculty/staff,
participating in STEM precollege programs, and having a high interest in STEM education
were high motivating factors for the students to persist through STEM education.
A February 2012 report titled Engage to Excel: Producing One Million Additional
College Graduates with Degrees in Science, Technology, Engineering, and Mathematics shows
that the United States faces a shortage of STEM (Science, Technology, Engineering and
Mathematics) professionals (PCAST 2012). This report suggests that this country needs to
increase the number of students who enter and complete STEM education by at least 34%. The
report states that the United States graduates approximately 400,000 associate and bachelor

Academic Forum 32 (2014–15)
14
STEM degrees, but only 40% of the students who enroll in STEM majors actually complete
STEM degrees.
Literature Review
Strayhorn (2010) points out that even though STEM completion rates have increased
within the past decade, the percentage of students of color and women graduating with STEM
degrees are significantly smaller. There are varied reasons why students do not enroll, persist,
or complete STEM education.
As a way to understand the reasons why low-income, first-generation, or
underrepresented groups do not enroll or have success in STEM education, the principal and
co-investigators examined the body of literature on 1) enrollment data in STEM fields
comparing males to females, and the distribution of race/ethnicity of students who are enrolled
in Science and Engineering (S&E) and STEM education; 2) negative and positive factors that
influence intentions and success in STEM education; 3) persistence and graduation rates of
students in STEM majors; 4) programs/factors that help students progress and persist in STEM
fields; and 5) impact of TRIO programs on students’ success relative to persistence and
retention.
Enrollment Data in STEM Fields and Distribution of Race/Ethnicity in S&E
The National Science Board (NSB) indicates that males still dominate certain scientific
and engineering disciplines (NSB 2014). NSB states that, despite the fact that women have
shown some gains in the percentage of women who attain postsecondary degrees in STEM
fields, males still outnumber female students in postsecondary attainment in STEM fields. An
even more dismal picture is the fact that among women who are underrepresented in various
STEM fields, there is a much lower rate of enrollment both at the graduate and doctoral levels
for those who are underrepresented by race, ethnicity, and disability, with only one in five
undergraduates with a disability enrolled in an S&E field (NSB 2014). The National Science
Board (2014) reports that over the past 14 years, the proportion of baccalaureate degrees
awarded to women declined by 10% in computer science, 5% in mathematics, 2% in physics,
and 2% in engineering. This decline supports the NSB data that indicate that women
represented a much lower proportion of postsecondary attainment in engineering, computer
science, and physical sciences than men (NSB 2014). Nationally, of those students who were
conferred bachelor’s degrees in a STEM field, only 9% were African-Americans, 10%
Hispanics, 1% American Indian, 10% Asians, and 7% other races, compared to over 63%
white students (NSB, 2014).
As an example of the low STEM enrollment at HSU, Table 1 describes the number and
percentage of HSU undergraduate students, based on ethnicity, who are participating in STEM
degree programs. For the 2013 Fall/Spring academic year, 16.1% of the students who were
enrolled in STEM were African-American and 3.5% were Hispanics compared to 71.3% white
students (Henderson State University, Office of Institutional Research, 2014).

Academic Forum 32 (2014–15)
15
TABLE 1
Henderson State University
STEM Undergraduate Enrollment
2013 – Fall/Spring Academic Year
Ethnicity Students Percentage
African-American 102 16.1%
American Indian 2 0.3%
Asian American 6 0.9%
White 452 71.3%
Hispanic 22 3.5%
International 14 2.2%
2 or More Races 36 5.7%
Total of Undergraduates 634 100%
Source: HSU Institutional Research Office, August 19, 2014
Majors: Biology, Chemistry, Physics & Engineering, and Math
The National Science Board (2014) reports that despite the fact that 50% of Asian-
American freshmen indicated they intended to major in Science and Engineering (S&E), the
proportions were much lower for other ethnic groups. Forty-two percent (42%) of Latino
freshmen indicated they intended to major in S&E, compared to 37% of white students, 36% of
black students, and 33% of American Indian students (NSB 2014). Another report, Science and
Engineering Indicators 2014, confirms there were higher percentages of Asian-American
freshmen who planned to major in engineering, biological and agricultural science,
mathematics, statistics, or computer science than any other racial or ethnic group. However, at
the undergraduate level, there is a vast difference in the percentage between intended majors
and those actually completing degrees in STEM areas. The completion rates among STEM
majors reveals that for both sexes and among all ethnic and racial groups, the percentage of
students earning baccalaureate degrees in engineering is smaller than the percentage who
planned to major in that field. Among women, black, and Hispanic freshmen, the percentages
of those earning bachelor’s degrees in the natural sciences were smaller than the percentage of
those who planned to major in these fields (NSB 2014).
Negative and Positive Factors that Influence Intentions and Success in STEM education
A 2013 study was conducted using the social cognitive career theory (SCCT) to
examine the intentions of low-income and first-generation college students to major in math
and science education (Garriott, Flores, & Martens, 2013). The researchers relied on the SCCT
theory that suggests that learning experiences are correlated to career choice goals through
variables such as self-efficacy and outcome expectations. More importantly, the SCCT involves
interactions among self-efficacy [the degree which students believe that they are capable and
competent to achieve learning outcomes], outcome expectations, goals, choice, and
environmental factors. These researchers reveal that the SCCT suggests that for first-generation
students, social class may be a predictor of the students’ learning experiences. The researchers
point out that, according to Bloom (2007) and Bui (2002), low-income and first-generation
students traditionally have lower quality learning experiences in math and science than their
peers and have traditionally lower confidence in academic performance and less support for
attending college. The Garriott, et al. (2013) study included 341 high school students who were
Academic Forum 32 (2014–15)
16
participants in federal TRIO Upward Bound programs in the Midwest. These researchers
suggested that family-based interventions, peer-focused programming, mentoring, and
shadowing programs might enhance the participation of low-income, first-generation students
in math/science fields.
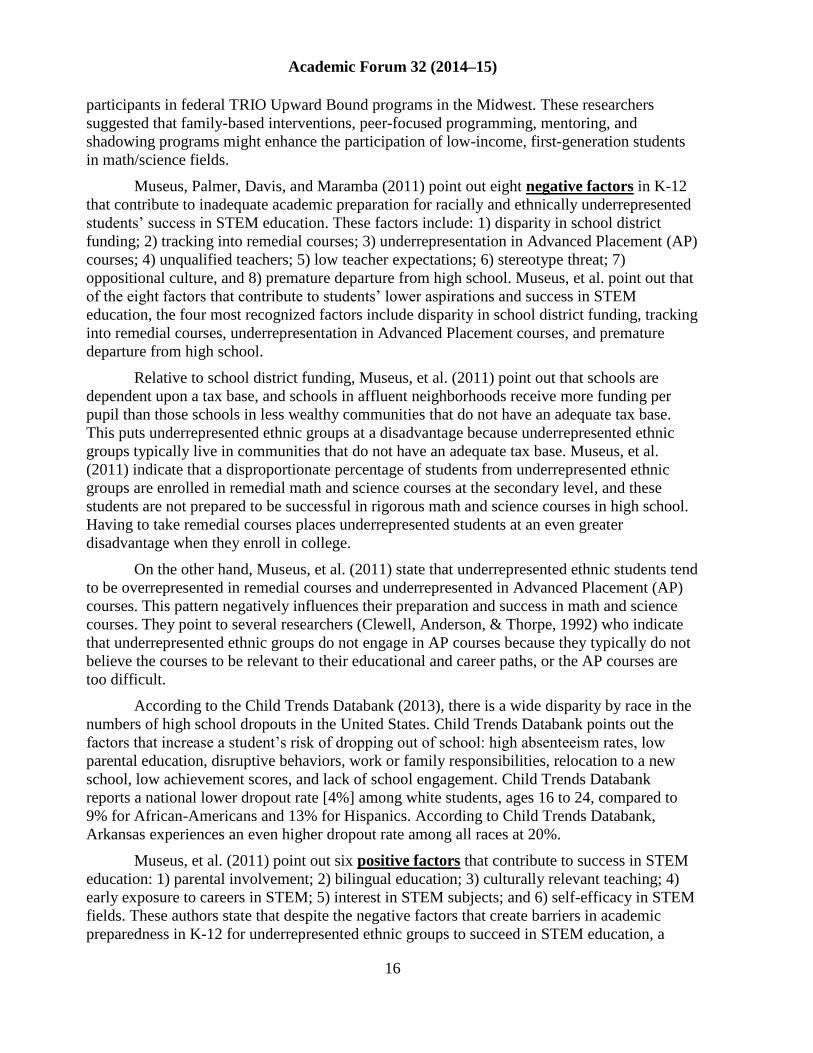
Museus, Palmer, Davis, and Maramba (2011) point out eight negative factors in K-12
that contribute to inadequate academic preparation for racially and ethnically underrepresented
students’ success in STEM education. These factors include: 1) disparity in school district
funding; 2) tracking into remedial courses; 3) underrepresentation in Advanced Placement (AP)
courses; 4) unqualified teachers; 5) low teacher expectations; 6) stereotype threat; 7)
oppositional culture, and 8) premature departure from high school. Museus, et al. point out that
of the eight factors that contribute to students’ lower aspirations and success in STEM
education, the four most recognized factors include disparity in school district funding, tracking
into remedial courses, underrepresentation in Advanced Placement courses, and premature
departure from high school.
Relative to school district funding, Museus, et al. (2011) point out that schools are
dependent upon a tax base, and schools in affluent neighborhoods receive more funding per
pupil than those schools in less wealthy communities that do not have an adequate tax base.
This puts underrepresented ethnic groups at a disadvantage because underrepresented ethnic
groups typically live in communities that do not have an adequate tax base. Museus, et al.
(2011) indicate that a disproportionate percentage of students from underrepresented ethnic
groups are enrolled in remedial math and science courses at the secondary level, and these
students are not prepared to be successful in rigorous math and science courses in high school.
Having to take remedial courses places underrepresented students at an even greater
disadvantage when they enroll in college.
On the other hand, Museus, et al. (2011) state that underrepresented ethnic students tend
to be overrepresented in remedial courses and underrepresented in Advanced Placement (AP)
courses. This pattern negatively influences their preparation and success in math and science
courses. They point to several researchers (Clewell, Anderson, & Thorpe, 1992) who indicate
that underrepresented ethnic groups do not engage in AP courses because they typically do not
believe the courses to be relevant to their educational and career paths, or the AP courses are
too difficult.
According to the Child Trends Databank (2013), there is a wide disparity by race in the
numbers of high school dropouts in the United States. Child Trends Databank points out the
factors that increase a student’s risk of dropping out of school: high absenteeism rates, low
parental education, disruptive behaviors, work or family responsibilities, relocation to a new
school, low achievement scores, and lack of school engagement. Child Trends Databank
reports a national lower dropout rate [4%] among white students, ages 16 to 24, compared to
9% for African-Americans and 13% for Hispanics. According to Child Trends Databank,
Arkansas experiences an even higher dropout rate among all races at 20%.
Museus, et al. (2011) point out six positive factors that contribute to success in STEM
education: 1) parental involvement; 2) bilingual education; 3) culturally relevant teaching; 4)
early exposure to careers in STEM; 5) interest in STEM subjects; and 6) self-efficacy in STEM
fields. These authors state that despite the negative factors that create barriers in academic
preparedness in K-12 for underrepresented ethnic groups to succeed in STEM education, a

Academic Forum 32 (2014–15)
17
stronger emphasis has to be placed on identifying successful strategies to deal with lack of
academic preparedness for these students.
As a way to understand the factors that sustain motivation to pursue STEM careers
among underrepresented ethnic groups, a group of researchers reports that minority training
programs, research experiences, and mentorships are key interventions to address motivation,
interest in, and pursuit of STEM education by underrepresented students. The findings of this
research show that students felt being a “scientist” was a central aspect of the student’s self-
identity (Hernandez, Woodcock, Schultz, Estrada, and Chance, 2012).
Persistence and Graduation Rates of Students in STEM Majors
Science and Engineering Indicators 2014 reports that the vast differences in completion
rates among science and engineering students by race or ethnicity are reflective of the
differences in college enrollment rates, college persistence, attainment rates, and high school
completion rates (National Science Board, 2014). Of those students who enroll in or graduate
from college in STEM fields, white students more often tend to choose S&E fields compared to
Black, Hispanic, American Indian, or Native Alaskan students. This report postulates that in
order to increase retention in STEM fields, universities should improve the quality of
undergraduate education in S&E by improving student learning. Moreover, graduating S&E
master’s students reported that their motivation and determination were factors that led to
successful completion of the S&E programs (NSB, 2014).
National Science Board (NSB) references a study conducted by the Council of Graduate
Schools (2013) that focused on S&E completion and attrition trends. The students who were
surveyed indicated that they experienced challenges in finding adequate time to manage school,
work, and family. Additionally, students who left their S&E programs reported that
interferences from employment, program structure, lack of adequate financial support, and lack
of support from faculty were major reasons that prevented them from earning their STEM
degrees (NSB 2014).
The STEM college program sponsored by the National Science Foundation at Robert
Morris University targeted students who were academically talented but did not have financial
support to pursue STEM education (Kalevitch, Maurer, Badger, Holdan, Iannelli, Sirinterlikci,
& Bernauer, 2012). The university selected twenty-one students who were pursuing
undergraduate STEM education and provided each of them with a stipend of $24,000 over their
four year undergraduate program. These students were enrolled in a cohort-based, living-
learning arrangement that included sharing a dorm, meeting places, and study spaces. The
students were involved in a two-week pre-college program that included testing to assess the
students’ level of readiness. Additionally, students participated in an orientation covering
community service, cultural activities, reading/writing strategies, note-taking, time
management, and critical thinking and decision-making skills. The students also received an
orientation about the university through information on financial aid, library resources, cultural
diversity, career services, and academic services. Of the original 21 students in the cohort, only
four left the program. The reasons offered for these students leaving were: 1) medical, 2)
disciplinary, 3) no longer eligible for scholarship due to financial Pell ineligibility, and 4)
transferred to another university closer to home. As a result of the students’ participation in the
STEM program at Robert Morris University, the retention rate was 81% (17 out of 21 students)
for the first year. In addition, when compared to the retention rate of the university as a whole,

Academic Forum 32 (2014–15)
18
the STEM students who participated in the cohort program showed an 18% increase in
retention for engineering students leading to 100% retention; math was 86% retention; and
science was 57% retention. Academically, the cohort performed well with an overall GPA of
3.29.
Programs/Factors That Help Students Progress and Persist in STEM Fields
In the article, A Qualitative Investigation of Factors Promoting the Retention and
Persistence of Students of Color in STEM (2014), the authors cite several researchers who
postulate that the United States must turn its attention to increasing college access, retention,
and persistence among underrepresented groups if it is to be successful in increasing the
production of STEM workers (Palmer, Maramba, & Dancy, 2011). These authors point to
several research efforts that suggest that supportive educational environments have been
positively linked to retention and persistence for students of color.
Pre-college programs, undergraduate STEM research experiences, and STEM
mentoring support are cited as factors that help promote retention and persistence of students of
color in STEM education. In a study conducted by Palmer, et al. (2011), these authors
investigated the influences of students to persist through STEM education. The surveyed
students reported the following were factors that promoted retention, persistence, and success
in pursing degrees in STEM fields:
Peer group support. Participants suggested that studying together helped them
understand the class materials more effectively and studying in peer groups
decreased pressure around exam time.
Involvement in STEM-related activities. The students commented on participating
in STEM student organizations and summer programs, being a teaching assistant,
and interacting with STEM alumni and STEM professionals.
Strong high school preparation. Students participated in advanced science classes in
high school and were encouraged by teachers who helped them pursue their science-
related fields (Palmer, et al., 2011).
Gilmer (2007) reports on a five-week Summer Bridge Program at Bowling Green State
University called AIMS (Academic Investment in Math and Science). This program was
designed to address the shortage of underrepresented students in STEM disciplines. The
program offered pre-college experience to high school graduates that enhanced their skills to
succeed once enrolled in college. The results of student participation in the AIMS program
showed that the GPAs of AIMS students were higher than those of non-AIMS participants, the
retention of AIMS scholars was better than that of non-AIMS participants, and the graduation
rate of AIMS scholars was higher than those of non-AIMS participants (Gilmer, 2007).
The Meyerhoff Scholars Program at the University of Maryland is a national model that
supports underrepresented ethnic students pursuing STEM education through the Meyerhoff
Summer Bridge Program. This program provides financial resources, academic, social support,
study groups, and summer research. The Meyerhoff Program has shown that students who
participate in this program are five times more likely to pursue STEM Ph.D. programs (Maton,
Pollard, Weise, & Hrabowski, 2012). The program reports qualitative data in which Meyerhoff
students have stated that precollege research, intrinsic math/science motivation, and summer

Academic Forum 32 (2014–15)
19
research experiences served as predictors to their successful entrance into STEM Ph.D.
programs.
In an article titled There Is Another World Out There: Students of Color and
Undergraduate STEM Research, Schwartz (2012) points out that, due to many obstacles and
barriers of staying enrolled for men and women of color who are pursuing STEM majors, they
are more likely to leave STEM majors and may drop out of college altogether. This conclusion
is based on studies that suggest once students enroll into college, they are faced with a myriad
of obstacles and challenges to stay enrolled. This article focuses on findings from a two-year
study examining student/faculty STEM mentoring relationships and their influence on retaining
students of color in sciences (Schwartz, 2012). The study was conducted at a public college and
was based on two theoretical frameworks: Critical Race Theory (CRT) and Cultural Historical
Activity Theory (CHAT). CRT suggests race is important in any discussion of education and
uses the voices of people of color to tell their stories. The researcher used CHAT to observe the
relationships within a system and how it relates to undergraduate research experiences. CHAT
views components of systems such as instruments, activities, people, environments, rules,
community needs, and outcomes and how they interrelate to produce learning. The results of
this study indicate that undergraduate research is beneficial, life changing, and transformational
for students of color. Also, the results revealed that undergraduate research relationships are
effective strategies for universities and colleges that wish to retain students of color as they
compensate for inadequate preparation in the sciences for underrepresented ethnic groups.1
Impact of TRIO Programs on Students’ Success Relative to Persistence and Retention
Strayhorn (2010) conducted a study among a racially/ethnically diverse group of
scholars who participated in the McNair Scholars Program at three research universities. The
purpose of the study was to examine the relationship between STEM graduate degree
aspirations and engagement in undergraduate research experiences (UGREs). The findings of
this study support the fact that engagement in UGREs has a positive influence on URGs plans
for STEM graduate study, with 19% indicating that their summer experience encouraged them
to consider graduate school and 77% indicated increased graduate degree aspirations.
More broadly, relative to the impact of student success, persistence, and retention, the
U.S. Department of Education’s Student Support Services (SSS) TRIO program has been found
to be an effective program to address retention and graduation (The Pell Institute, 2009).
TRIO programs are federally-funded support and outreach programs that provide
services for individuals from disadvantaged backgrounds. TRIO includes eight programs that
serve and assist individuals who are considered from low-income backgrounds, first-generation
college students, students underrepresented in their college fields, and individuals with
disabilities to progress through the academic pipeline from middle school to post-baccalaureate
programs.
1 The use of the term minority suggests that one race is superior over another race. For this reason, the
Principal Investigator does not use the term minority. Throughout this study, when sources use the term
underrepresented racial minorities (URMs), this principal investigator intentionally replaces and uses
the term underrepresented racial ethnic group, except in citations of the actual titles of the various
sources.

Academic Forum 32 (2014–15)
20
The Pell Institute reports that since 1997, the U.S. Department of Education has
conducted four studies that support data that participation in a TRIO program has made
significant impact on the educational outcomes of low-income students, first-generation
students, and students with disabilities. Of the 5,800 students who were tracked at 47
universities, comparing non-SSS participants to SSS-participants, students who participated in
the SSS TRIO programs were more likely to remain enrolled in college, earn more college
credits, and have higher GPAs than non-SSS students.
Methodology
The Director of HSU’s TRIO Programs served as the Principle Investigator (PI) for the
research study. The Director of HSU’s Honors College and a HSU chemistry professor served
as co-investigators. A graduate student who is a former McNair scholar assisted with the data
analysis for this study. The researchers’ original intent was to use a quasi-experimental design
to assign McNair Scholars to a treatment group who were receiving McNair interventions and
Honors College students to a control group who were not receiving McNair interventions as a
way to compare the two groups’ responses on the factors that helped the students’ progress,
success, and persistence through STEM education, and factors that helped the students consider
enrolling in graduate program to pursue STEM education.
It was also the original intent of the study to assess the factors that have impeded the
progress, success, and persistence through STEM education of low-income, first-generation
students, and underrepresented college students who were enrolled in HSU’s McNair Scholars
Program compared to those students who were enrolled in Honors College who were from low-
income, first-generation and underrepresented backgrounds. After the collection of data,
however, it was determined that the survey did not clearly identify low-income students based
on the meaning of low-income students whose family’s taxable income did not exceed 150% of
the poverty level for the preceding year; nor did the survey allow a distinction between students
who were enrolled in Honors College or the McNair Scholars Program. Thus, there was no way
to examine comparisons of the two groups of students on variables of ethnicity, low-income,
and first-generation status. Nevertheless, the study allowed researchers to assess the factors that
impeded the students’ progress and success in STEM education, factors that helped the
students’ progress, success, and persistence through STEM education, and factors that helped
the students consider enrolling in a graduate program to pursue STEM education.
The researchers sought to answer the questions: 1) What are factors that have impeded
the progress, success, and persistence through STEM education of low-income, first-
generation, and underrepresented college students enrolled in HSU’s McNair Scholars
Program, those who graduated from HSU and were former participants in HSU’s McNair
Scholars Program, and students who are enrolled in HSU’s Honors College? 2) What are
factors that helped the progress, success, and persistence through STEM education of low-
income, first-generation, and underrepresented college students enrolled in HSU’s McNair
Scholars Program, those who graduated from HSU and were former participants in HSU’s
McNair Scholars Program, and students enrolled in HSU’s Honors College?
Definition of Study Population
For the purpose of this study, the study sample consisted of students from HSU from the
following eight categories: 1) 18 years and older; 2) low-income; 3) first-generation; 4)

Academic Forum 32 (2014–15)
21
underrepresented in their STEM fields; 5) currently enrolled in HSU’s McNair Scholars
Program; 6) completed HSU’s McNair Scholars Program and are in STEM graduate school; 7)
enrolled in any HSU STEM classes, and 8) are undergraduate students who are enrolled in
HSU Honors College.
McNair Scholars are defined as individuals who are low-income and first-generation
college students currently enrolled in the HSU McNair Scholars Program.
HSU’s Honors College students are defined as individuals who are low-income and
first-generation college students currently enrolled in the HSU Honors College.
Low-Income students means individuals whose family’s taxable income for the
preceding year did not exceed 150 percent of the poverty level (E-Federal Code of Regulations,
2014).
First-Generation College students means 1) students whose natural or adoptive parents
did not receive a baccalaureate degree; (2) students who, prior to the age of 18, regularly
resided with and received support from only one parent and whose supporting parent did not
receive a baccalaureate degree; or (3) individuals who, prior to the age of 18, did not regularly
reside with or receive support from a natural or an adoptive parent (E-Federal Code of
Regulations, 2014).
Underrepresented students are individuals who are underrepresented in graduate
education including Blacks (non-Hispanic), Hispanics, American Indians, Alaska Natives,
Native Hawaiians, and Native American Pacific Islanders (E-Code of Federal Regulations,
2014). For the purposes of this study, the researcher used the terms McNair STEM Scholars
and HSU’s Honors College STEM students to refer to the two groups who participated in this
study.
Rationale for Study Population
Strayhorn (2010) points out that even though STEM completion rates have increased
within the past decade, the percentage of students of color and women graduating with STEM
degrees are significantly smaller. In addition, among women who are underrepresented in
various STEM fields, there is a much lower rate of enrollment both at the graduate and doctoral
levels for women in STEM fields who are underrepresented by race, ethnicity and disability
(NSB 2014). Schwartz (2012) reports that students of color who are STEM majors may leave
STEM education due to the challenges and barriers they face. Museus, et al. (2011) indicate
that despite the fact that there are negative factors that create barriers in academic preparedness
for underrepresented ethnic groups to succeed in STEM education, a stronger emphasis has to
be placed on identifying successful strategies to deal with lack of academic preparedness for
these students. Thus, there is a need for further studies to assess the effectiveness of
interventions and services in preparing underrepresented students of color, low income and first
generation students for undergraduate and graduate STEM education. HSU’s Honors College
students who were enrolled as STEM majors and McNair Scholars were selected as participants
in this study. The researches felt this group of students had the greatest experiences among
HSU undergraduate students on factors that impede their progress, success, and persistence to
pursue STEM education.

Academic Forum 32 (2014–15)
22
Questionnaire Phase
In developing the instruments for this study, the lead investigator, Dr. Pamela Bax,
HSU’s TRIO Director, met with Dr. Martin Campbell, HSU Professor of Organic Chemistry,
and Dr. David Thomson, HSU Director of Honors College, to review questions that might be
used for this study. The study attempted to answer the following questions: What are factors
that have impeded the progress, success, and persistence through STEM education of low-
income, first-generation, and underrepresented college students enrolled in HSU’s McNair
Scholars Program, those who graduated from HSU and were former participants in HSU’s
McNair Scholars Program, and students who are enrolled in HSU’s Honors College? 2) What
are factors that helped the progress, success, and persistence through STEM education of low-
income, first-generation, and underrepresented college students enrolled in HSU’s McNair
Scholars Program, those who graduated from HSU and were former participants in HSU’s
McNair Scholars Program, and students enrolled in HSU’s Honors College?
Instrument
The HSU McNair STEM Impact Study Survey asked students demographic information
about their gender, age, major, race, GPA, and income. In addition, the survey asked students
their classification, financial aid status, whether or not they are first-generation college
students, currently enrolled in STEM classes, ACT and SAT scores, and graduate school plans.
The survey was used to identify the factors that impeded and helped McNair Scholars and
HSU’s Honors College students prepare for undergraduate and graduate STEM education. The
survey consisted of 81 items on a five-point Likert Scale ranging from 1 (Strongly agree) to 5
(Not sure). The survey included 27 questions that asked students to agree or disagree with
statements relative to factors that helped their progress, success, or persistence through STEM
education and 46 questions that asked students to agree or disagree with the statements relative
to factors that impeded their progress, success, or persistence in STEM education. The survey
included eight questions that asked students to agree or disagree with the statements relative to
strategies and factors that have helped them consider enrolling in a graduate program to pursue
STEM education. The study received Institutional Review Board (IRB) expedited approval on
April 15, 2014, and the survey was uploaded electronically for students to complete. Students
in HSU’s Honors College and HSU’s McNair Scholars Program were notified by email of the
purpose of the study, and the email invited them to participate in the study by completing the
survey. Students were given a two-week period to complete the survey. At the end of the two
weeks, HSU’s Office of Advancement summarized the survey. After the survey was
summarized, the researchers began analysis of the data.
Profile of Institutional Programs
This study was conducted at Henderson State University (HSU), a four-year public
liberal arts university. HSU is located in the heart of southwest Arkansas and offers over
seventy-five undergraduate and graduate programs, earning the university its status as
Arkansas’s public liberal arts university. HSU is noted for its strong liberal arts heritage that is
the base of over seventy-five undergraduate and graduate programs, earning the university its
status as Arkansas’s public liberal arts university. HSU’s vision is to bridge the liberal arts and
professional aspirations to produce well-rounded graduates who are leaders in their careers and
communities (HSU, 2014-2020 Strategic Plan).

Academic Forum 32 (2014–15)
23
HSU has six TRIO educational programs and serves a total of 2,058 TRIO
participants/students enrolled in the following TRIO programs: 1) Educational Opportunity
Center (EOC) provides counseling and information on college admissions and financial aid to
qualified adults who want to enter or continue a program of postsecondary education; 2)
Student Support Services (SSS) provides opportunities for academic development, assists
students with basic college requirements, and motivates students toward the successful
completion of their postsecondary education; 3) Student Support Services-Disability (SSS-D)
Program promotes student learning, retention, graduation, and success for students with
disabilities; 4) Talent Search (TS) Program provides academic, career, and financial counseling
to middle and high school students and encourages them to graduate from high school and
continue on and complete their postsecondary education; 5) the Veterans Upward Bound
(VUB) Program assists veterans in the development of academic and other requisite skills
necessary for acceptance and success in a program of post-secondary education; and 6) Ronald
McNair Scholars Program prepares eligible students for doctoral studies through involvement
in research and other scholarly activities.
HSU’s McNair Scholars Program and HSU’s Honors College are both designed to
prepare students for undergraduate and graduate degree aspirations. The mission of the McNair
Scholars Program at HSU is to prepare low-income, first-generation, and underrepresented
undergraduates for research, scholarly activities, and graduate study at the doctoral level.
McNair Scholars participate in summer activities that include research, preparing for graduate
school, teaching, and mentoring. HSU’s McNair Scholars Program goal is to increase the
number of underrepresented students who enroll in doctoral programs. The Honors College
shares HSU’s goal “to excel in undergraduate education, always striving to enrich the quality of
learning and teaching.” The program consists of “actively recruiting, challenging, supporting,
and motivating students to achieve academic success” (HSU Honors College, 2014).
According to HSU’s Office of Institutional Research, the university had a total
enrollment of 3,400 undergraduate students for the 2013-2014 academic year. Table 2 describes
the enrollment based on ethnicity for undergraduate students at HSU. There is a higher
percentage (65.8%) of white students enrolled at HSU than African-Americans at 23.7% and
Hispanics at 3.6%.
TABLE 2
Henderson State University
Total Undergraduate Enrollment – Unduplicated
2013-2014 Academic Year
Ethnicity Students Percentage
African American 806 23.7%
American Indian 9 0.3%
Asian American 23 0.7%
White 2,238 65.8%
Hawaiian 0 0.0%
Hispanic 123 3.6%
International 31 0.9%
2 or more races 168 4.9%
Not reported/Unknown 2 0.1%
Total Undergraduate Enrollment 3,400 100%
Academic Forum 32 (2014–15)
24
Source: Henderson State University, Institutional Research Office, August 2014
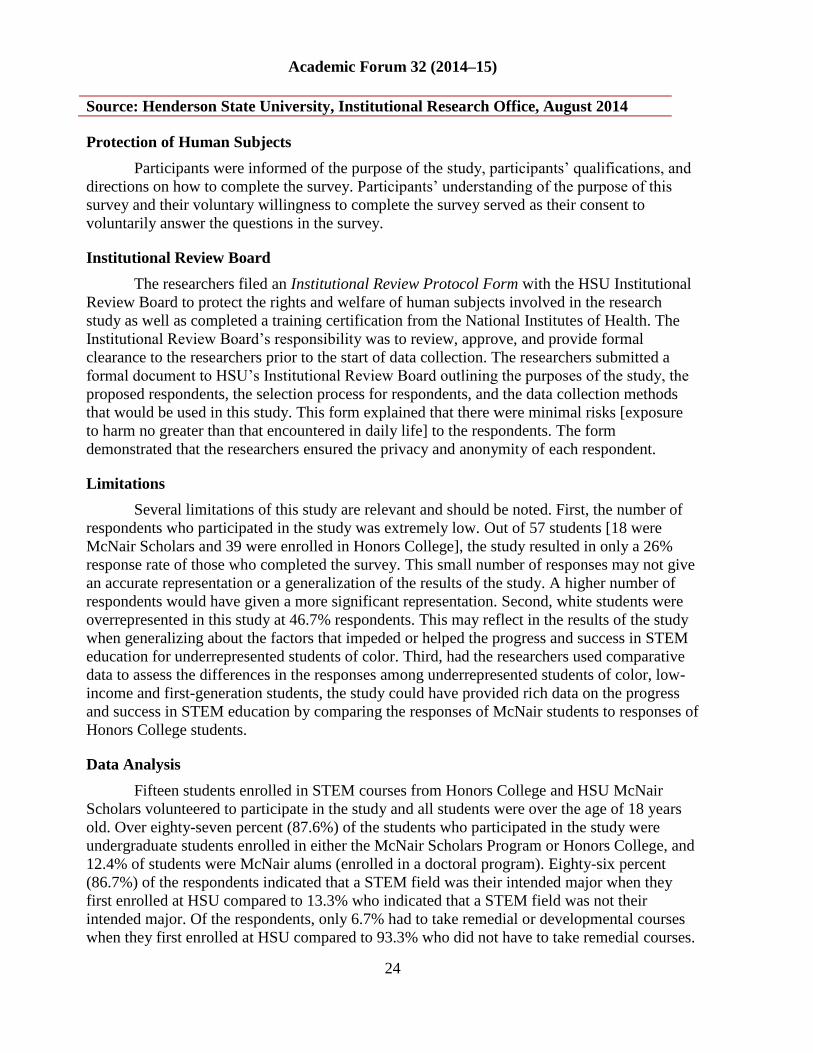
Protection of Human Subjects
Participants were informed of the purpose of the study, participants’ qualifications, and
directions on how to complete the survey. Participants’ understanding of the purpose of this
survey and their voluntary willingness to complete the survey served as their consent to
voluntarily answer the questions in the survey.
Institutional Review Board
The researchers filed an Institutional Review Protocol Form with the HSU Institutional
Review Board to protect the rights and welfare of human subjects involved in the research
study as well as completed a training certification from the National Institutes of Health. The
Institutional Review Board’s responsibility was to review, approve, and provide formal
clearance to the researchers prior to the start of data collection. The researchers submitted a
formal document to HSU’s Institutional Review Board outlining the purposes of the study, the
proposed respondents, the selection process for respondents, and the data collection methods
that would be used in this study. This form explained that there were minimal risks [exposure
to harm no greater than that encountered in daily life] to the respondents. The form
demonstrated that the researchers ensured the privacy and anonymity of each respondent.
Limitations
Several limitations of this study are relevant and should be noted. First, the number of
respondents who participated in the study was extremely low. Out of 57 students [18 were
McNair Scholars and 39 were enrolled in Honors College], the study resulted in only a 26%
response rate of those who completed the survey. This small number of responses may not give
an accurate representation or a generalization of the results of the study. A higher number of
respondents would have given a more significant representation. Second, white students were
overrepresented in this study at 46.7% respondents. This may reflect in the results of the study
when generalizing about the factors that impeded or helped the progress and success in STEM
education for underrepresented students of color. Third, had the researchers used comparative
data to assess the differences in the responses among underrepresented students of color, low-
income and first-generation students, the study could have provided rich data on the progress
and success in STEM education by comparing the responses of McNair students to responses of
Honors College students.
Data Analysis
Fifteen students enrolled in STEM courses from Honors College and HSU McNair
Scholars volunteered to participate in the study and all students were over the age of 18 years
old. Over eighty-seven percent (87.6%) of the students who participated in the study were
undergraduate students enrolled in either the McNair Scholars Program or Honors College, and
12.4% of students were McNair alums (enrolled in a doctoral program). Eighty-six percent
(86.7%) of the respondents indicated that a STEM field was their intended major when they
first enrolled at HSU compared to 13.3% who indicated that a STEM field was not their
intended major. Of the respondents, only 6.7% had to take remedial or developmental courses
when they first enrolled at HSU compared to 93.3% who did not have to take remedial courses.
Academic Forum 32 (2014–15)
25
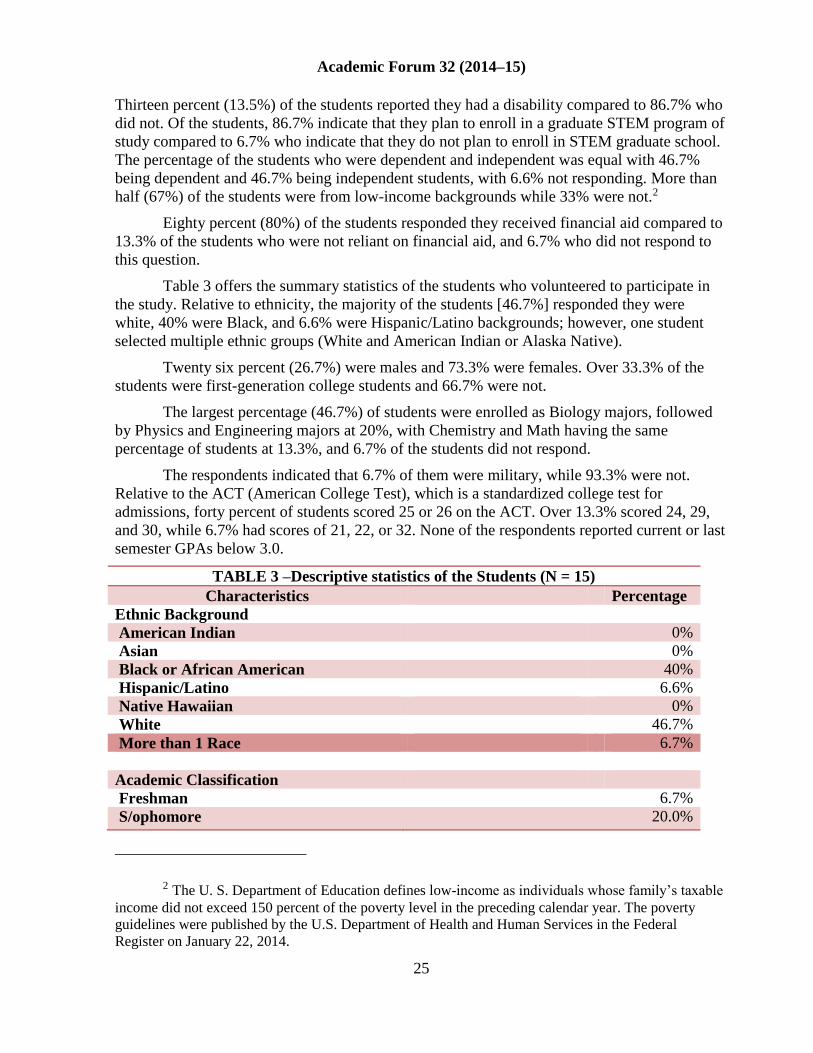
Thirteen percent (13.5%) of the students reported they had a disability compared to 86.7% who
did not. Of the students, 86.7% indicate that they plan to enroll in a graduate STEM program of
study compared to 6.7% who indicate that they do not plan to enroll in STEM graduate school.
The percentage of the students who were dependent and independent was equal with 46.7%
being dependent and 46.7% being independent students, with 6.6% not responding. More than
half (67%) of the students were from low-income backgrounds while 33% were not.2
Eighty percent (80%) of the students responded they received financial aid compared to
13.3% of the students who were not reliant on financial aid, and 6.7% who did not respond to
this question.
Table 3 offers the summary statistics of the students who volunteered to participate in
the study. Relative to ethnicity, the majority of the students [46.7%] responded they were
white, 40% were Black, and 6.6% were Hispanic/Latino backgrounds; however, one student
selected multiple ethnic groups (White and American Indian or Alaska Native).
Twenty six percent (26.7%) were males and 73.3% were females. Over 33.3% of the
students were first-generation college students and 66.7% were not.
The largest percentage (46.7%) of students were enrolled as Biology majors, followed
by Physics and Engineering majors at 20%, with Chemistry and Math having the same
percentage of students at 13.3%, and 6.7% of the students did not respond.
The respondents indicated that 6.7% of them were military, while 93.3% were not.
Relative to the ACT (American College Test), which is a standardized college test for
admissions, forty percent of students scored 25 or 26 on the ACT. Over 13.3% scored 24, 29,
and 30, while 6.7% had scores of 21, 22, or 32. None of the respondents reported current or last
semester GPAs below 3.0.
TABLE 3 –Descriptive statistics of the Students (N = 15)
Characteristics Percentage
Ethnic Background
American Indian 0%
Asian 0%
Black or African American 40%
Hispanic/Latino 6.6%
Native Hawaiian 0%
White 46.7%
More than 1 Race 6.7%
Academic Classification
Freshman 6.7%
S/ophomore 20.0%
2 The U. S. Department of Education defines low-income as individuals whose family’s taxable
income did not exceed 150 percent of the poverty level in the preceding calendar year. The poverty
guidelines were published by the U.S. Department of Health and Human Services in the Federal
Register on January 22, 2014.

Academic Forum 32 (2014–15)
26
Junior 13.3%
Senior 33.3%
Unknown or No Response 26.7%
Gender
Male 26.7%
Female 73.3%
First-Generation Status
Yes 33.3%
No 66.7%
STEM Majors
Biology 46.7%
Chemistry 13.3%
Physics & Engineering 20.0%
Math 13.3%
Unknown or No Response 6.7%
Military
Yes 6.7%
No 93.3%
ACT Scores
21 6.7%
22 6.7%
24 13.3%
25 20.0%
26 20.0%
29 13.3%
30 13.3%
32 6.7%
Table 4 reports students’ responses on factors that impeded their progress and success
through STEM education. While the largest percentage (53.3%) of students agreed that finding
adequate time to manage school, work, and family impeded their progress and success in
STEM, 46.7% of the students responded that the lack of participation in McNair activities
impeded their progress and success in STEM courses. Forty percent of the students agreed that
being unprepared for college life and poor time management skills impeded their progress in
STEM education. Additionally, 33.3% of students indicated that factors such as interferences
from program structure, lack of STEM role models, lack of connection from major to career
goal, stress caused by lack of balance for academic life and other responsibilities, low self-
confidence, and math anxiety impeded their progress and success in STEM education. Over
twenty-six (26.7%) of the students responded that interferences from employment, poor

Academic Forum 32 (2014–15)
27
organizational and study skills, high tuition, lack of STEM training programs, and low or no
parental education impeded their progress in STEM education. Twenty percent (20%) of the
students responded that lack of adequate financial support, lack of STEM faculty support, lack
of STEM mentorships, lack of research skills, little experience in approaching instructors, lack
of peer support group, lack of rigorous math/science in high school, lack of involvement in
STEM-related activities, and lack of school engagement impeded their progress and success in
STEM education.
TABLE 4 –Factors that have Impeded Progress and Success in STEM education
Factors Percentage
Blank Agree (Likert 1-2) Disagree (Likert 3-4) Not Sure
Finding adequate time to manage school, work, and family
0 (0.0%) 8 (53.3%) 7 (46.7%) 0 (0.0%)
Interferences from employment 1 (6.7%) 4 (26.7%) 10 (66.7%) 0 (0.0%)
Interferences from program structure 2 (13.3%) 5 (33.3%) 8 (53.3%) 0 (0.0%)
Lack of adequate financial support 0 (0.0%) 3 (20.0%) 12 (80.0%) 0 (0.0%)
Lack of STEM faculty support 0 (0.0%) 3(20.0%) 12 (80.0%) 0 (0.0%)
Lack of STEM mentorships 0 (0.0%) 3 (20.0%) 12 (80.0%) 0 (0.0%)
Unprepared for college life 0 (0.0%) 6 (40.0%) 9 (60.0%) 0 (0.0%)
Poor time management skills 0 (0.0%) 6 (40.0%) 9 (60.0%) 0 (0.0%)
Poor organizational and study skills 0 (0.0%) 4 (26.7%) 11 (73.3%) 0 (0.0%)
Inability to utilize technology 0 (0.0%) 0 (0.0%) 15 (100.0%) 0 (0.0%)
Low ACT and had to take remedial courses 0 (0.0%) 0 (0.0%) 15 (100.0%) 0 (0.0%)
Lack of research skills 0 (0.0%) 3 (20.0%) 12 (80.0%) 0 (0.0%)
Lacked strategies to recover from academic jeopardy or probationary status 0 (0.0%) 1 (6.7%) 14 (93.3%) 0 (0.0%)
Lack of STEM role models 0 (0.0%) 5 (33.3%) 10 (66.7%) 0 (0.0%)
Lack of connection from major to career goal 0 (0.0%) 5 (33.3%) 10 (66.7%) 0 (0.0%)
Little experience in approaching instructors 0 (0.0%) 3 (20.0%) 12 (80.0%) 0 (0.0%)
Had to take remedial courses in high school 0 (0.0%) 0 (0.0%) 15 (100.0%) 0 (0.0%)
Lack peer support group 0 (0.0%) 3 (20.0%) 12 (80.0%) 0 (0.0%)
Frustration from repeating developmental/remedial courses
0 (0.0%) 0 (0.0%) 15 (100.0%) 0 (0.0%)
Unsupportive college environment 0 (0.0%) 1 (6.7%) 14 (93.3%) 0 (0.0%)
Unsupportive family environment 0 (0.0%) 2 (13.3%) 13 (86.7%) 0 (0.0%)
Insufficient study rooms at college 0 (0.0%) 1 (6.7%) 14 (93.3%) 0 (0.0%)
Tuition is too high 0 (0.0%) 4 (26.7%) 11 (73.3%) 0 (0.0%)
Locations of certain student support offices are not centrally located or in convenient places
0 (0.0%) 0 (0.0%) 15 (100.0%) 0 (0.0%)
Certain programs are not designed for non-traditional age college students
0 (0.0%) 1 (6.7%) 12 (80.0%) 2 (13.3%)
Social and cultural deficiencies, including rural isolation
0 (0.0%) 2 (13.3%) 11 (73.3%) 2 (13.3%)
Stress caused by lack of balance for academic life and other responsibilities
0 (0.0%) 5 (33.3%) 10 (66.7%) 0 (0.0%)
Internet Access issues (i.e., dial-up, speed) 0 (0.0%) 1 (6.7%) 14 (93.3%) 0 (0.0%)
Lack of participation in AP courses in high school
0 (0.0%) 1 (6.7%) 14 (93.3%) 0 (0.0%)
Low teacher expectations 0 (0.0%) 1 (6.7%) 14 (93.3%) 0 (0.0%)
Premature departure from high school and had to obtain GED
0 (0.0%) 0 (0.0%) 15 (100.0%) 0 (0.0%)

Academic Forum 32 (2014–15)
28
STEM courses are too challenging 0 (0.0%) 0 (0.0%) 15 (100.0%) 0 (0.0%)
Low self confidence 0 (0.0%) 5 (33.3%) 10 (66.7%) 0 (0.0%)
No participation in Pre-College Program 0 (0.0%) 2 (13.3%) 13 (86.7%) 0 (0.0%)
Lack critical thinking/problem-solving skills 0 (0.0%) 1 (6.7%) 14 (93.3%) 0 (0.0%)
Lack of STEM training program(s) 0 (0.0%) 4 (26.7%) 10 (66.7%) 1 (6.70%)
Unqualified STEM teachers 0 (0.0%) 0 (0.0%) 15 (100.0%) 0 (0.0%)
My high school did not offer rigorous math/science courses
0 (0.0%) 3 (20.0%) 12 (80.0%) 0 (0.0%)
Lack of involvement in STEM-related activities 0 (0.0%) 3 (20.0%) 12 (80.0%) 0 (0.0%)
My ethnicity/race presented a challenge for me
0 (0.0%) 1 (6.7%) 14 (93.3%) 0 (0.0%)
I don’t believe STEM courses are relevant 0 (0.0%) 0 (0.0%) 15 (100.0%) 0 (0.0%)
Have math anxiety 0 (0.0%) 5 (33.3%) 10 (66.7%) 0 (0.0%)
My parent(s) have low or no education 0 (0.0%) 4 (26.7%) 11 (73.3%) 0 (0.0%)
Lack of school engagement 0 (0.0%) 3 (20.0%) 12 (80.0%) 0 (0.0%)
Had to transfer to another college 0 (0.0%) 1 (6.7%) 14 (93.3%) 0 (0.0%)
Lacked participation in McNair activities 0 (0.0%) 7 (46.7%) 7 (46.7%) 1 (6.7%)
Table 5 reports students’ responses on factors that helped their progress, success, or
persistence through STEM education. All of the students’ responses indicated that the
challenging environment and their sense of responsibility helped their progress and persistence
through STEM. Over 93.3% of the students agreed that having participated in a precollege
program, supportive educational environment, encouragement from HSU faculty/staff, having
their own interest in STEM subjects, high quality staff engagement, and having a high
motivation to get a STEM degree were factors that helped them progress and persist through
STEM education. While 86.7% of the students indicated that participation in HSU Honors
College Program helped their progress, success, and persistence through STEM education, only
53.3% of the students responded that participation in McNair Scholars Program helped their
progress and persistence through STEM education. Similarly, 86.7% of the students responded
that undergraduate research experiences, strong faculty support, encouragement from high
school teachers, and encouragement from family and friends were factors that helped them
progress and persist through STEM education. Sixty percent (60%) disagreed that being
bilingual/or having bilingual education were factors that helped them to progress and persist in
STEM education.
TABLE 5 –Factors that have Helped Progress, Success, & Persistence in STEM education
Factors Percentage
Blank Agree (Likert 1-
2) Disagree (Likert 3-
4) Not Sure
Having participated in a pre-college program 0 (0.0%)
14 (93.3%) 1 (6.7%) 0 (0.0%)
Participation in McNair Scholars Program 0 (0.0%)
8 (53.3%) 5 (33.3%) 2 (13.3%)
Participation in HSU Honors College Program
0 (0.0%)
13 (86.7%) 1 (6.7%) 1 (6.7%)
Undergraduate research experiences 0 (0.0%)
13 (86.7%) 1 (6.7%) 1 (6.7%)
Supportive educational environment 0 (0.0%)
14 (93.3%) 1 (6.7%) 0 (0.0%)
Have Peer Group Support 0 (0.0%)
11 (73.3%) 3 (20.0%) 1 (6.7%)
Studying with my peers 0 (0.0%)
11 (73.3%) 4 (26.7%) 0 (0.0%)

Academic Forum 32 (2014–15)
29
Being involved in STEM related activities 0 (0.0%)
12 (80.0%) 2 (13.3%) 1 (6.7%)
Strong high school STEM preparation 0 (0.0%)
10 (66.7%) 4 (26.7%) 1 (6.7%)
Strong faculty support 0 (0.0%)
13 (86.7%) 2 (13.3%) 0 (0.0%)
Encouragement from high school teachers 0 (0.0%)
13 (86.7%) 2 (13.3%) 0 (0.0%)
Encouragement from HSU faculty/staff 0 (0.0%)
14 (93.3%) 1 (6.7%) 0 (0.0%)
Encouragement from family/friends 0 (0.0%)
13 (86.7%) 2 (13.3%) 0 (0.0%)
Being the first in my family to go to college 0 (0.0%)
6 (40.0%) 8 (53.3%) 1 (6.7%)
Early exposure to STEM careers 1 (6.7%)
9 (60.0%) 5 (33.3%) 0 (0.0%)
Strong parental support and involvement 0 (0.0%)
12 (80.0%) 3 (20.0%) 0 (0.0%)
Being bilingual/or bilingual education 1 (6.7%)
3 (20.0%) 9 (60.0%) 2 (13.3%)
Culturally relevant teaching 0 (0.0%)
9 (60.0%) 6 (40.0%) 0 (0.0%)
My own interest in STEM subjects 0 (0.0%)
14 (93.3%) 1 (6.7%) 0 (0.0%)
High quality staff engagement 0 (0.0%)
14 (93.3%) 1 (6.7%) 0 (0.0%)
Challenging environment 0 (0.0%)
15 (100.0%) 0 (0.0%) 0 (0.0%)
Sense of responsibility 0 (0.0%)
15 (100.0%) 0 (0.0%) 0 (0.0%)
Cohort learning 0 (0.0%)
12 (80.0%) 2 (13.3%) 1 (6.7%)
University-offered STEM scholarships 0 (0.0%)
12 (80.0%) 2 (13.3%) 1 (6.7%)
Participating in Selection Weekend Activities 0 (0.0%)
2 (13.3%) 8 (53.3%) 5 (33.3%)
Being a part of a tight knit learning community
1 (6.7%)
10 (66.7%) 3 (20.0%) 1 (6.7%)
Being a part of STEM training program(s) 0 (0.0%)
10 (66.7%) 4 (26.7%) 1 (6.7%)
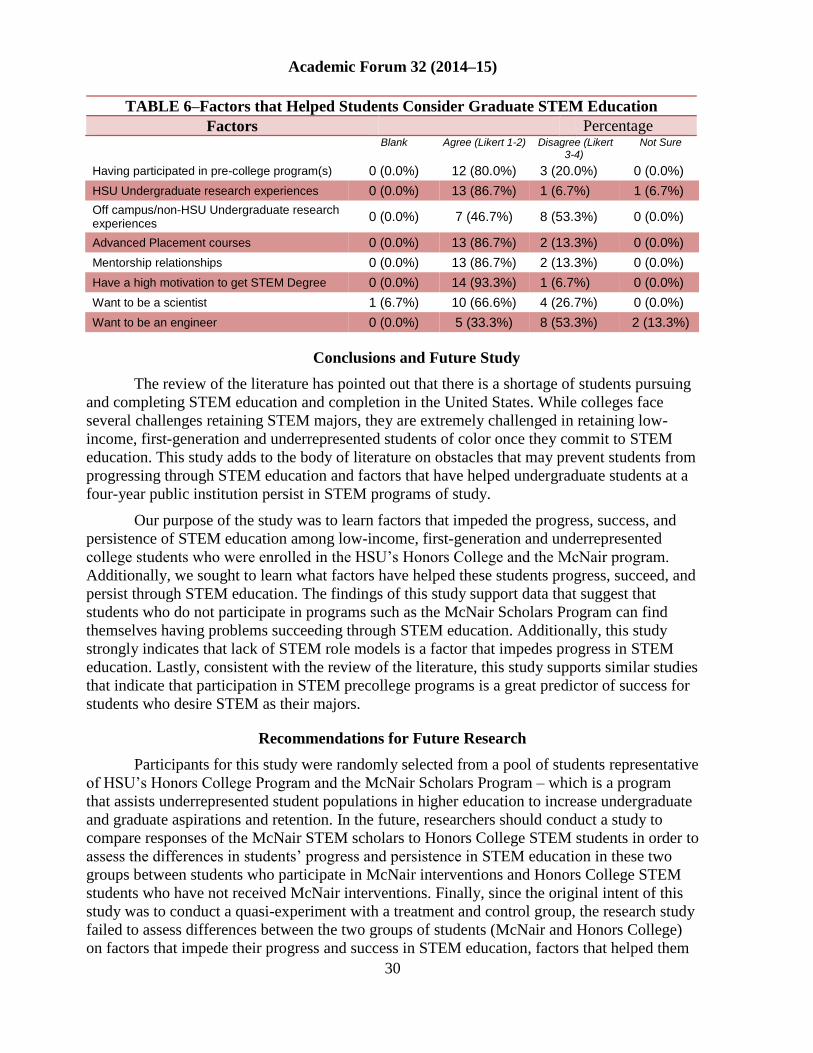
Table 6 reports students’ responses on strategies or factors that may have helped them
consider enrolling in a graduate program to pursue STEM education. The largest percentage
(93.3%) of the students responded that their high motivation to get STEM degrees helped them
to consider enrolling in STEM graduate education. The next largest percentage (86.7%) of
students responded that HSU’s undergraduate research experiences, Advanced Placement (AP)
courses, and mentor relationships helped their consideration to enroll in STEM graduate
programs of study. Additionally, 80% of the students responded that having participated in pre-
college programs helped them to consider pursuing graduate STEM education.
Academic Forum 32 (2014–15)
30
TABLE 6–Factors that Helped Students Consider Graduate STEM Education
Factors Percentage
Blank Agree (Likert 1-2) Disagree (Likert 3-4)
Not Sure
Having participated in pre-college program(s) 0 (0.0%) 12 (80.0%) 3 (20.0%) 0 (0.0%)
HSU Undergraduate research experiences 0 (0.0%) 13 (86.7%) 1 (6.7%) 1 (6.7%)
Off campus/non-HSU Undergraduate research experiences
0 (0.0%) 7 (46.7%) 8 (53.3%) 0 (0.0%)
Advanced Placement courses 0 (0.0%) 13 (86.7%) 2 (13.3%) 0 (0.0%)
Mentorship relationships 0 (0.0%) 13 (86.7%) 2 (13.3%) 0 (0.0%)
Have a high motivation to get STEM Degree 0 (0.0%) 14 (93.3%) 1 (6.7%) 0 (0.0%)
Want to be a scientist 1 (6.7%) 10 (66.6%) 4 (26.7%) 0 (0.0%)
Want to be an engineer 0 (0.0%) 5 (33.3%) 8 (53.3%) 2 (13.3%)
Conclusions and Future Study
The review of the literature has pointed out that there is a shortage of students pursuing
and completing STEM education and completion in the United States. While colleges face
several challenges retaining STEM majors, they are extremely challenged in retaining low-
income, first-generation and underrepresented students of color once they commit to STEM
education. This study adds to the body of literature on obstacles that may prevent students from
progressing through STEM education and factors that have helped undergraduate students at a
four-year public institution persist in STEM programs of study.
Our purpose of the study was to learn factors that impeded the progress, success, and
persistence of STEM education among low-income, first-generation and underrepresented
college students who were enrolled in the HSU’s Honors College and the McNair program.
Additionally, we sought to learn what factors have helped these students progress, succeed, and
persist through STEM education. The findings of this study support data that suggest that
students who do not participate in programs such as the McNair Scholars Program can find
themselves having problems succeeding through STEM education. Additionally, this study
strongly indicates that lack of STEM role models is a factor that impedes progress in STEM
education. Lastly, consistent with the review of the literature, this study supports similar studies
that indicate that participation in STEM precollege programs is a great predictor of success for
students who desire STEM as their majors.
Recommendations for Future Research
Participants for this study were randomly selected from a pool of students representative
of HSU’s Honors College Program and the McNair Scholars Program – which is a program
that assists underrepresented student populations in higher education to increase undergraduate
and graduate aspirations and retention. In the future, researchers should conduct a study to
compare responses of the McNair STEM scholars to Honors College STEM students in order to
assess the differences in students’ progress and persistence in STEM education in these two
groups between students who participate in McNair interventions and Honors College STEM
students who have not received McNair interventions. Finally, since the original intent of this
study was to conduct a quasi-experiment with a treatment and control group, the research study
failed to assess differences between the two groups of students (McNair and Honors College)
on factors that impede their progress and success in STEM education, factors that helped them

Academic Forum 32 (2014–15)
31
to persist in STEM education, and factors that helped them to consider enrolling in graduate
STEM education.
References
Bloom, J. (2007). Misreading social class in the journey towards college: Youth development
in urban America. Teachers College Record, 109, 343-368.
Bui, K. V. T. (2002). First-generation college students at a four-year university: Background
characteristics, reasons for pursuing higher education, and the first-year experience.
College Student Journal, 36, 3-11.
Child Trends Data Bank. (2013). High school dropout rates: Indicators on Children and Youth.
Clewell, B., Anderson, B., & Thorpe, M. (1991). Breaking the barriers: helping female and
minority students succeed in Mathematics and Science. San Francisco: Jossey-Bass,
1991.
Council of Graduates. (2014). Doctoral initiative on minority attrition and completion (NSF
grant No.1138814). Washington, DC.
Electronic Code of Federal Regulations, Part 647.7. Ronald E. McNair PostBaccalaureate
Achievement Program, Office of the Federal Register, (August 15, 2014).
Garriott, P. O., Flores, L. Y., & Martens, M. P. (2013). Predicting the math/science career goals
of low-income prospective first-generation college students. Journal of Counseling
Psychology, 60(2), 200-209. doi:10.1037/a0032074.
Gilmer, T. (2007). An understanding of the improved grades, retention and graduation rates of
STEM majors at the academic investment in math and science (AIMS) program of
Bowling Green State University (BGSU). Journal of STEM education: Innovations &
Research, 8(1/2), 11-21.
Henderson State University’s Honors College. (2014). Retrieved from
http://www.hsu.edu/interior2.aspx?id=1963.
Henderson State University. The 2014-2020 strategic plan, Beyond the Horizon, Retrieved from
www.hsu.edu/OurCampus/Strategic-plan/executive-summary.html.
Henderson State University. (2014). Unduplicated STEM undergraduate enrollment, Fall 2013-
Spring 2014. Retrieved from the Office of Institutional Research.
Henderson State University. (2014). Unduplicated total undergraduate enrollment, 2013-2014
Academic Year. HSU’s Office of Institutional Research.
Hernandez, P. R., Schultz, P., Estrada, M., Woodcock, A., & Chance, R. C. (2013). Sustaining
optimal motivation: A longitudinal analysis of interventions to broaden participation of
underrepresented students in STEM. Journal of Educational Psychology, 105(1), 89-
107. doi:10.1037/a0029691.
Kalevitch, M., Maurer, C., Badger, P., Holdan, G., Iannelli, J., Sirinterlikci, A., & Bernauer, J.
(2012). Building a Community of Scholars: One University's Story of Students Engaged
in Learning Science, Mathematics, and Engineering Through a NSF S-STEM Grant.
Journal of STEM education: Innovations & Research, 13(4), 34-42.
Academic Forum 32 (2014–15)
32
Maton, K. I., Pollard, S. A., McDougall Weise, T. V., & Hrabowski, F. A. (2012). Meyerhoff
Scholars Program: A Strengths-Based, Institution-Wide Approach to Increasing
Diversity in Science, Technology, Engineering, and Mathematics. Mount Sinai Journal
Of Medicine, 79(5), 610-623. doi:10.1002/msj.21341.
Museus, S., Palmer, R. T., Davis, R. J., & Maramba, D. C. (2011). Racial and ethnic minority
students' success in STEM education. Hoboken: New Jersey: Jossey-Bass, 2011.
National Science Board. (2014) Science and Engineering Indicators. Arlington, VA.
Palmer, R. T., Maramba, D. C., & Dancy, T. E. (2011). A qualitative investigation of factors
promoting the retention and persistence of students of color in STEM. The Journal of
Negro Education, 80(4), 491-504.
Pell Institute for the Study of Opportunity in Higher Education. (2009) National studies find
TRIO programs effective at increasing college enrollment and graduation. Washington,
D.C.
President’s Council of Advisors on Science and Technology (PCAST). (2012). Engage to
excel: Producing one million additional college graduates with degrees in science,
technology, engineering, and mathematics. Washington, DC.
Schwartz, J. (2012). There is another world out there: Students of color and undergraduate
STEM research. International Journal of Science in Society, 3(2), 35-52.
Strayhorn, T.L. (2010). Undergraduate research participation and STEM graduate degree
aspirations among students of color. New Directions for Institutional Research,
2010(148), (85-93. doi: 10.1002/ir.364.
United States Department of Education. (January 28, 2014). Federal TRIO Programs Current
Year Low-Income Levels. Retrieved from:
http://www2.ed.gov/about/offices/list/ope/trio/incomelevels.html.
Biographical Sketches
Dr. Pamela Bax is Director of TRIO Programs at HSU, where she has oversight management
and supervision of six federally-funded TRIO Programs that are designed to prepare students
for and enroll them in post-secondary education. Dr. Bax earned her Ed.D. from Northern
Illinois University in 1999; an Ed.S. degree in 1995 from Northern; a Master’s Degree in
Counseling Psychology from Chicago State University and a B.S. degree in Behavioral
Sciences in 1985 from National Louis University. Her entire adult life has been devoted toward
assisting individuals to become educated. Her philosophy is that every person deserves to
receive an education because education can transform human capabilities into achievement,
accomplishments, and potential.
Dr. Martin Campbell is a professor of organic chemistry at HSU. He received his B.S. degree
from Oregon State University in 1988 and worked six years in a government research lab
before attending Texas Tech University, where he completed his Ph.D. in 1999. After serving
as an instructor at Texas Tech, he joined the HSU faculty in 2001. Passionate about
undergraduate research, he maintains an active undergraduate research group, and served as the
University Undergraduate Research Director from 2005 until 2013. Dr. Campbell is a member

Academic Forum 32 (2014–15)
33
of the McNair Advisory Council, which reviews and recommends scholars for enrollment and
participation in HSU’s McNair Scholars Program.
Tanesha Eabron graduated in 2013 from HSU with a B.A. in Psychology. She is a member of
Psi Chi Honor Society and was inducted into McNair Scholars Program in 2012. Currently,
Tanesha is enrolled in the Clinical Mental Health Counseling program at John Brown
University. Tanesha served as the research assistant for the McNair research project, where she
was instrumental in conducting the literature review.
Dr. David Thomson is Honors College Director and Professor of English at HSU. He received
his B.A. and M.A. degrees from the University of Florida and his Ph.D. from the University of
Denver. He has served on the faculty at HSU since 1975.
Evaluation of Indefinite Integrals of 𝒔𝒆𝒄 𝒙 and 𝒄𝒔𝒄 𝒙 by the MUTOBO Method
Lloyd Edgar S. Moyo, Ph.D.
Associate Professor of Mathematics
Abstract
In most Calculus books, one finds well-known tricks for evaluating ∫ 𝐬𝐞𝐜 𝒙 𝒅𝒙 and ∫ 𝐜𝐬𝐜 𝒙 𝒅𝒙. In this
article, we give another method of evaluating these integrals.
Introduction
In most good Calculus books, one finds well-known tricks for evaluating ∫ 𝐬𝐞𝐜 𝒙 𝒅𝒙 and ∫ 𝐜𝐬𝐜 𝒙 𝒅𝒙,
namely
∫ sec 𝑥 𝑑𝑥 = ∫ sec 𝑥 ⋅ 1 𝑑𝑥 = ∫ sec 𝑥 ⋅sec 𝑥 + tan 𝑥
sec 𝑥 + tan 𝑥𝑑𝑥 = ∫
𝑠ec2 𝑥 + sec 𝑥 tan 𝑥
sec 𝑥 + tan 𝑥𝑑𝑥
= ∫1
𝑢𝑑𝑢, where 𝑢 = sec 𝑥 + tan 𝑥
= ln|𝑢| + 𝐶 = ln|sec 𝑥 + tan 𝑥| + 𝐶, and
∫ csc 𝑥 𝑑𝑥 = ∫ csc 𝑥 ⋅ 1𝑑𝑥 = ∫ csc 𝑥 ⋅csc 𝑥 + cot 𝑥
csc 𝑥 + cot 𝑥𝑑𝑥
= ∫csc2 𝑥 + csc 𝑥 cot 𝑥
csc 𝑥 + cot 𝑥𝑑𝑥 = ∫
1
𝑢𝑑𝑢, where 𝑢 = cot 𝑥 + csc 𝑥
= − ln|𝑢| + 𝐶 = − ln | csc 𝑥 + cot 𝑥| + 𝐶.
Some Calculus II instructors, the author included, have had a difficult time giving a convincing
answer when students ask them the following questions: How did you come up with this trick?
Is there another method to evaluate these integrals?
In this article, we give one additional method of evaluating these integrals. We call this method
the MUTOBO Method. Before we embark on this task, we need some preliminaries.
Preliminaries
In this section, we state and prove some key results that we will use in the MUTOBO Method to evaluate
∫ 𝐬𝐞𝐜 𝒙 𝒅𝒙 and ∫ 𝐜𝐬𝐜 𝒙 𝒅𝒙. We begin with