factsheet april 29th, 2016 - canara robeco mutual fund€¦ · how to read a factsheet disclaimers....
TRANSCRIPT

April 29th, 2016FACTSHEET

Index
ECONOMIC UPDATE ................................................................................................................................... 03
EQUITY MARKET REVIEW............................................................................................................................. 04
DEBT MARKET REVIEW ............................................................................................................................... 05
GOLD UPDATE ......................................................................................................................................... 06
CANARA ROBECO EQUITY DIVERSIFIED (CRED) ................................................................................................... 07
CANARA ROBECO EQUITY TAX SAVER (CRETS) .................................................................................................... 08
CANARA ROBECO LARGE CAP+ FUND (CRLCF) .................................................................................................... 09
CANARA ROBECO F.O.R.C.E FUND (CRFRC) ....................................................................................................... 10
CANARA ROBECO EMERGING EQUITIES (CREE).................................................................................................... 11
CANARA ROBECO INFRASTRUCTURE (CRI)......................................................................................................... 12
CANARA ROBECO BALANCE (CRB) .................................................................................................................. 13
CANARA ROBECO MONTHLY INCOME PLAN (CRMIP) .............................................................................................. 14
CANARA ROBECO INDIGO (Income from Debt Instruments & GOld) FUND (CRIF) ........................................................... 15
CANARA ROBECO INCOME (CRINC) ................................................................................................................. 16
CANARA ROBECO GILT PGS (CRGP)................................................................................................................. 17
CANARA ROBECO DYNAMIC BOND FUND (CRDBF) ................................................................................................ 18
CANARA ROBECO MEDIUM TERM OPPORTUNITIES FUND (CRMTOF) ............................................................................ 19
CANARA ROBECO SHORT TERM FUND (CRSTF).................................................................................................... 20
CANARA ROBECO SAVINGS PLUS FUND (CRSPF) .................................................................................................. 21
CANARA ROBECO TREASURY ADVANTAGE FUND (CRTAF) ........................................................................................ 22
CANARA ROBECO LIQUID (CRL) ..................................................................................................................... 23
CANARA ROBECO YIELD ADVANTAGE FUND (CRYAF).............................................................................................. 24
CANARA ROBECO GOLD SAVINGS FUND (CRGSF) ................................................................................................. 25
CANARA ROBECO GOLD EXCHANGE TRADED FUND (CRGETF) .................................................................................. 26
PERFORMANCE AT A GLANCE ....................................................................................................................... 27
SIP RETURNS........................................................................................................................................... 31
DIVIDEND HISTORY ................................................................................................................................... 35
DEFINITIONS ........................................................................................................................................... 37
HOW TO READ A FACTSHEET ........................................................................................................................ 38
DISCLAIMERS........................................................................................................................................... 39
ABOUT FEW SCHEMES OF CANARA ROBECO MUTUAL FUND
PERFORMANCE
DIVIDEND HISTORY
DEFINITION
MARKETS & BEYOND
SIP RETURNS
HOW TO READ A FACTSHEET
DISCLAIMERS

Economic Update
FY 17 started with RBI announcing 25 bps rate cut in repo rate and SLR, and also liquidity easing measures. Post the policy announcement, 10 year g-sec yields softened while equity markets witnessed some profit booking. Sentiments turned positive on back of positive domestic macro-economic data and forecast of above-normal monsoon. April'16 witnessed easing of CPI and expansion in IIP numbers. Crude oil price showed some signs of recovery and was hovering around ~$45 throughout the month. The bounce back in crude oil prices and encouraging trade data from China boosted global market sentiments. Towards the end of the month, sentiments deterred with Bank of Japan's decision of keeping the rates unchanged whilst holding further monetary stimulus. The US Federal Reserve maintained its status quo on key rates for the third time this year with no hint of future course of rate hikes in the next couple of months.
Equity markets were range bound in the month gone by. Markets did witnessed profit booking in rate sensitive sectors post the RBI's rate cut announcement. Market sentiments picked up in the second half of the month on back of IMD's (India Meteorological Department) forecast of an above-normal monsoon, decent earning season and crude oil prices stabilizing. The benchmark indices, S&P BSE Sensex and Nifty 50 gained by 1.04% and 1.44% respectively.
Retail inflation represented by CPI (Consumer Price Index) positively surprised markets by easing to a 6-month low of 4.83% in March'16 compared to 5.18% in February'16. The moderation in inflation was led by easing in core inflation and decline in food and fuel & light inflation. Wholesale inflation denoted by WPI (Wholesale price index) came in at -0.85% in March'16 lower than previous month's -0.91%. The better than expected inflation print bode well for markets as well as the economy.
After spending 3 months in negative territory , factory output finally rose to 2% in February'16 compared to -1.5% in January '16. The expansion in IIP was driven by robust Y-o-Y growth in electricity (9.6%) and mining (5%). On use-based classification, capital goods contracted by 9.8% (Y-o-Y) while basic & intermediate goods grew by 5.4% (Y-o-Y) &5.7% (Y-o-Y) respectively. The Consumer durables and Consumer non-durables have recorded Y-o-Y growth of 9.7% and – 4.2% respectively, with overall consumer growth being 0.8%.
Trade deficit for the month of March'16 contracted to USD 5.07 billion from USD 6.54 billion in February'16. The fall in crude oil prices has been favorable for India's import bill. Imports contracted by 21.56% y-o-y to USD 27.79 billion due to decline in oil & non-oil imports. The month witnessed oil imports shrinking by 35.3% (Y-o-Y) and non-oil imports declined by 17.92%. The global slowdown in major economies continues to impact India's export, leading to a decline of 5.47% (Y-o-Y) valuing USD 22.72 billion. The constant decline in trade deficit might augur well for FY 16 current account deficit (CAD).
As market expectations, RBI cut the repo rate by 25 bps to 6.5% in its first bi-monthly policy FY 16-17. It also reduced the minimum daily maintenance of the cash reserve ratio (CRR) from 95% of the requirement to 90% and reduced the SLR by 25bps from 21.50% to 21.25% of NDTL. Further, RBI narrowed the policy rate corridor from +/-100bps to +/-50bps with a view to ensuring finer alignment of the weighted average call rate (WACR) with the repo rate. Consequently, MSF (marginal standing facility) rate stands at 7% and reverse repo rate is 6%. The introduction of the marginal cost of funds based lending rate (MCLR) previously coupled with refinement in the liquidity management framework in the current monetary policy by RBI might help in improving transmission of rate cuts. . RBI further said that it will gradually move from a “deficit” to “neutral” liquidity conditions and to that effect it is likely to do more OMO purchases. It was further indicated that stance of monetary policy will remain accommodative for some time and they will monitor the macro-economic & financial developments before taking a call on interest rates
=Though global markets are showing signs of recovery, volatility may continue to prevail on China concerns, deflationary pressures in Europe and pace of US rate hikes. Market participants may continue to be driven by global sentiments. USD/INR is likely to be continue to be driven by global news
=With IMD's forecast, expectations of normal monsoon have increased. The progress of monsoon is likely to help in determining the inflation trajectory going forward.
=Market participants may likely track the 4th quarter corporate earnings season
=Though crude oil prices seem to be stabilizing, whether it is able to sustain at current levels or not might be keenly tracked by market participants as it is a crucial factor determining stability of global markets
Source:
* Bloomberg^ mospi.nic.in^^ICRA@Ministry of commerce**RBI
Market Performance*:
Inflation^^:
IIP^:
@Trade deficit :
RBI's monetary policy**:
Triggers
3
(as on April 29,2016)

Equity Market Review
Mr. Ravi Gopalakrishnan
Head - Equities
The first month of the Financial Year 2016-17 started with the Indian equity markets continuing to retain their positive momentum driven by increased government spending, partial recovery in commodity price, modest corporate earnings and strengthening rupee. The market sentiments were also driven by global cues, especially from the US and China. Both developed markets and emerging markets ended higher with some degree of stability and improved market sentiments on back of the policy decisions from major central banks and improved crude prices.
Indian equity market which had staged a rebound in March'16 and continued it's upwards trajectory in the month of April'16, triggered by better-than-expected industrial production and the forecast of an above-normal monsoon. Fed's decision to scale down the number of rate hikes for 2016 to two (from the earlier announced four), gave confidence to foreign investors making them net buyers in the equity market. However, towards the end of the month, markets were negatively impacted due to Bank of Japan's decision of not expanding monetary stimulus. From a long term perspective, Indian market is shaping up well due to the improved economic outlook and strengthening macros.
The Indian Equity markets rose in the month of April'16. On net basis India's bellwether indices viz. S&P BSE Sensex & Nifty 50 gained by 1.0% & 1.4% respectively, while S&P BSE Mid- cap index & S&P BSE Small-cap index saw an increase of 4.0% & 4.5% respectively. On the sector front, majority of the sectors were in green. S&P BSE Realty was the top gainer, rising by 10.4% followed by S&P BSE Metal and S&P BSE Power, which rose by 5.50% and 4.0% respectively. However, S&P BSE IT and S&P BSE Energy fell marginally by 0.5% and 1.4% respectively.
India's manufacturing upturn gathered momentum in the last month and the seasonally adjusted Nikkei India Manufacturing Purchasing Managers' Index (PMI) registered eight month high of 52.40 in the month of March'16 as compared to 51.10 in February'16. Also, the Nikkei services PMI increased to 54.30 in March'16 (Feb'16: 51.40) which had marked a joint-highest level, since June 2014 and pointed to a solid expansion of output. Indian services companies remained optimistic that activity will increase further over the coming 12 months. The level of confidence was at a nine-month high, with positivity linked to favourable government policies and forecasts of a pick-up in demand.
India's industrial output rose 2% in February'16 from -1.5% in Janaury'16, In terms of industries, sixteen out of the twenty two industry groups in the manufacturing sector showed positive growth during the month of February'16 as compared to the corresponding month of the previous year. For the month of February'16, the overall consumer goods remained flat with Consumer durables growing at 9.7% (Y-o-Y) while Consumer non–durables slackening to -4.2% (Y-o-Y). Sector-wise, electricity, mining and manufacturing growth stood at 9.6%, 5.0% and 0.7% respectively. As per the use-based classification, capital goods recorded negative growth of 9.8% whereas; intermediate goods and basic goods grew at 5.7% and 5.4% respectively.
FPIs (Foreign Portfolio Investor) were net buyers in the last month, showing confidence in the market supported by recovery in crude price and strengthening currency. Indian equities have been one of the preferred destinations for the FPIs with net inflow continuing for the second consecutive month; wherein the net investment has been Rs.7405 Crs. Whereas, the month of April'16 saw a marginal net outflow of Rs.127Crs* from the Mutual Fund as compared to the last month which had a net outflow of Rs.10,198 Crs.
On growth front, India appears to be on the right track; indicated by improving industrial production and improved performance of bellwether indices. Expectation of normal monsoons and implementation of 7th pay commission are likely to enhance the consumption demand in the economy. Going forward, economic recovery is likely to be driven by the infrastructure segment especially sectors viz. road construction, defense, power transmission and railways. Also, with the renewed focus on agriculture in the Budget and improved prospects of monsoon, we expect rural consumption to pick up. The near term market movements driven by 4Q corporate results as well the global trend suggest a gradual recovery, reinstating the expectations of better performance in the current financial year.
The earnings season so far has been in line with our expectations with no negative surprises. We expect the earnings in the coming quarter to be subdued and corporate earnings which remained muted is expected to improve as macro economic growth picks up and show its maximum impact in 2017-18. Indian economy is showing signs of improvement and we are likely to see momentum building up from the H2 of FY2017.
RBI and government have worked in tandem to get the interest rates down. Lowering interest rates will be less taxing on the corporates as their balance sheet shows lower interest costs. We expect support for domestic cyclicals and CAPEX industries to be the major beneficiaries of the declining interest rates. While India has a strong foot hold on the domestic front, short term volatilities could cause jitters in the markets on account of global cues. Such interim periods of heightened volatility should be viewed as opportunities and can be utilized to increase allocation toward equity assets. Seeing an opportunity, investors may adopt a SIP route to invest in equities in order to even out market volatility.
Source:
^MOSPI, ICRA`Markit **ICRA MFI Explorer, Data as on 29th April, 2016. *Mutual fund net inflow data is as of 22nd April, 2016
Market Performance**
Growth`
IIP^
FPI Inflows **
Outlook
4
(as on April 29,2016)

Debt Market Review
April'16 begun with the first monetary policy review for the fiscal year where RBI cut the policy rate to its lowest in the last 5 years and announcement of measures in its liquidity management stance. In addition to the affirmative step towards overhauling the liquidity framework, RBI emphasized on the need to infuse durable liquidity via asset purchases in the currency and bond markets. The market participants were expecting this long time pending rate cut and the initial reactions were the considerable easing of the bond yields. This was reflected in the 10 yr benchmark touching new highs. In addition, the expectation of good monsoon and easing inflationary pressures added a favourable impact on the bond market dynamics, impacting the softening of the yield noticeably. Retail and wholesale inflationary pressures still continue to augur well for the Indian fixed income markets being comfortably under RBI's radar. Towards the end of the month, the yields hardened on account of profit booking ahead of FOMC meeting and were at levels similar to the ones at the start of the month.
The RBI reduced the repo rate by 25bps and surprised the markets by announcing a new liquidity framework. Ever since RBI began easing monetary policy, it has cut the benchmark repo rate by a cumulative 150bps, which wasn't getting transmitted. Some of the reasons were high small savings rate, tight liquidity and expectation of high fiscal. Further, the RBI has shifted its focus from deficit systemic liquidity to neutral liquidity stance to alleviate the perennial shortage of liquidity in the past few months. To this effect RBI conducted OMO of 30,000 cr in April’16
For the month of March'16, CPI came in at 4.83% much lower than revised estimate of 5.26% in Feb-16. More importantly, Core CPI edged lower to 4.75% in March'16 as compared to 4.99% in Febraury'16. The fall in retail inflation could be attributed to a significant decline in prices of vegetables and pulses. Wholesale inflation (WPI) for the last month came in at -0.85% y-o-y and remained little flattish as compared to -0.91% seen in February'16 and remained in the negative territory for the 17th consecutive month. Lower than the expected retail inflation was augured well for the bond yields as they were seen softening from the previous level.
With global markets still struggling with low growth and disinflationary pressure, India's strong macros are likely to bring down CPI over longer periods of time. The news of the US Fed announcing reduction in the number of rate hikes from 4 to 2 in the current financial year, FIIs regained confidence in the emerging markets, including India. The positive FII print in the month of April'16 and the expected flows in the months to come may foster well for keeping inflation within the RBI's target range.
Post acknowledging the government's move of reduction in interest rates of traditional savings instruments, the RBI's rate cut has indicated that it will continue to manage the key rates to ensure reduction in bank lending rates. It will continue to keep a close watch on the macroeconomic and financial developments in the coming months. The stance of monetary policy is expected to remain “accommodative” for some time.
RBI's measures to keep the liquidity under check are seen to be long term measures which would gradually get the deficit towards neutral liquidity. RBI may further carry out regular OMO purchases to offset the tight market liquidity conditions as and when required. This is likely to put further downward pressures on yields and provide a “safety net” in an event of unfavourable global events.
In short term, markets are expected to remain volatile owing to uncertainties around the globe. However, the primary factor which could pan out in favour of Indian Economy is likely softening of inflation in the forthcoming months on back of expectations of 'normal' monsoons, staggered implementation of 7th CPC and benign commodity prices. In medium-to-long term we expect the global headwinds to settle down and inflation to follow the chalked RBI's target plan, albeit with a downward bias. Giving these conditions, and in the absence of any fresh new shocks from around the globe, there remains a good chance of a further rate cuts in the second half of the financial year. The new 10 year benchmark is expected to remain in range of 7.30-7.60% going ahead.
Source: ~ MOSPI, STCI PD, * RBI
RBI's First Bi-monthly Monetary Policy Statement, 2016-17^
CPI eased to a four-month low while WPI stayed in red~
Outlook:
Mr. Avnish JainHead - Fixed Income
5
(as on April 29,2016)

Gold Update
Overview:
Central Banks surprise markets:
US economic data watch:
Outlook:
Chart of the Month:
Gold prices (in dollar terms) have risen by over 20 per cent this year (till April 2016), making the yellow metal one of the best performing asset class so far in 2016. Investors returned to gold last month after the metal recorded its first negative monthly performance in March this year. The yellow metal rose 4.9% on a month on month basis, rising by more than $60 on the back of continued dollar weakness as US Dollar Index closed at 93.1, down 1.6% during the month. Gold prices in domestic currency terms also moved up even as the Indian rupee appreciated marginally by 0.12% to close at 66.33. The domestic Gold ETFs returned approximately 6% during the month of April 2016 with the discounts vis-à-vis gold prices improving to around 2% from 4% in March 2016. Gold prices remained within the range of $1220-1260 per troy ounce during most parts of the month before rallying towards the end of the month. The late rally in gold was the outcome of the central bank meetings in US and Japan.
The FOMC (Federal Open Market Committee) decided to maintain the target range of the federal funds rate at 0.25–0.5% after its meeting on April 27, 2016. This status quo meant that it would be the third successive meeting after the rate hike in December 2015, wherein there was no change made to the key rate citing slowdown in US and global growth while commenting that the labour market showed positive gains. The Bank of Japan also held off from expanding monetary stimulus contrary to market expectations even as appreciation in yen and weak consumption threatened to derail a fragile economic recovery. The surprise action led to some unwinding of the dollar positions which led to gold prices strengthening.
The March non-farm payroll report was a mixed bag as wages and jobs data improved but the unemployment rate ticked up. The payroll report showed a slightly higher than expected headline figure with 215,000 jobs added in March as against market expectations of 205,000. While the rate of unemployment moved up for the first time since May 2015 to 5%, the Labor force participation rate edged up again to 63%. Weak economic data in US also helped to support gold as the U.S. gross domestic product (GDP) rose 0.5% in the first quarter of 2016, marking its worst performance in two years.
Mario Draghi, the head of the European Central Bank (ECB), made clear during ECB's April 2016 policy meeting that he's ready to launch further stimulus if the eurozone economy should need it. The Bank of Japan also will not allow the currency to strengthen indefinitely, and is expected to announce more steps to ease monetary policy, through a hike in the monthly purchases of government bonds and exchange traded funds. The Federal Reserve which was looking at ways to try and raise rates also has generally become increasingly dovish since its rate hike in December, on the common concerns of low inflation and economic growth risks. The recent FOMC meeting also disappointed investors who expected Fed to be more confident of rate hikes. Higher rates would provide for more cushion in case of an economic contraction in the future. The current low level of interest rates in US allows very little room for further stimulus in order to spruce up markets.
The above mentioned uncertainty on central bank actions is expected to support gold prices, albeit volatility would persist. The current strength of the gold price is primarily a reflection of the recent weakness in the US dollar and economy which has typically remained weak in the first quarter. Any recovery in the US economy is expected to make gold prices vulnerable to temporary corrections going forward.
Also, as we had noted in our last update that silver was missing out vis-à-vis gold as Gold received interest as a crisis hedge. The month of April also saw silver catching up on lost ground which could indicate that there is a fear among investors that inflation will be spiralling out of control soon, or that the global economic outlook is negative.
The recently released GFMS Gold Survey for Q1 2016 showed that investment demand for gold showed signs of revival while physical demand weakened. Weak demand from China and India led to dampening of overall demand. Indian consumption was largely impacted in March on account of the nationwide strike by manufacturers and retailers protesting against the 1% excise duty levied in the Union Budget. However, with the strike having called off in the month of April, we have seen some revival in demand which is expected to continue into May due to upcoming festive demand for Akshaya Tritiya. The expectation of early monsoons which could boost rural demand for Gold is also expected to contribute to gold prices remaining supported in the near term.
Source: Bloomberg.
'AU'some Fact of the Month:
In 1869, two Australians unearthed the world's largest nugget of gold, the "Welcome Stranger," which measured 10 by 25 inches before it was melted down.
(Source: www.investinganswers.com)
6
Source: Bloomberg
(as on April 29,2016)

$Source ICRA MFI Explorer (for remaining disclaimer Please refer page no. 39) = # Monthend AUM as on 29.04.2016 = ^The expense ratios mentioned for the schemes excludes additional service tax on investment management fees.= for disclaimers. Please refer page no. 39
PRODUCT POSITIONING
Canara Robeco Equity Diversified follows a predominantly bottom-up investment approach with a focus on fundamentally sound companies which are likely to deliver superior capital appreciation over the long-term. The fund has a predominant focus on large caps with select high conviction mid cap ideas. The fund provides a blend of 'Growth' and 'Value' style of investing.
INVESTMENT STYLE
Growth Value Blend
Large Cap Mid Cap Small Cap
Diversified Thematic Sector
PORTFOLIO
Name of the Instruments % to NAV
Equities 95.05Listed 94.92Banks 22.04HDFC Bank Ltd 7.29State Bank of India 3.30IndusInd Bank Ltd 2.76Kotak Mahindra Bank Ltd 2.39Bank of Baroda 2.10ICICI Bank Ltd 1.78Yes Bank Ltd 1.44Axis Bank Ltd 0.98
Petroleum Products 9.80Reliance Industries Ltd 5.38Hindustan Petroleum Corporation Ltd 3.34Indian Oil Corporation Ltd 1.08
Software 9.67Infosys Ltd 7.62Tata Elxsi Ltd 1.39Take Solutions Ltd 0.66
Industrial Capital Goods 7.75Praj Industries Ltd 1.43Texmaco Rail & Engineering Ltd 1.37Bharat Electronics Ltd 1.15Honeywell Automation India Ltd 1.06ABB India Ltd 1.06Inox Wind Ltd 0.95Sanghvi Movers Ltd 0.73
Auto 6.31Tata Motors Ltd 2.72Ashok Leyland Ltd 1.56Tvs Motor Company Ltd 0.90Escorts Ltd 0.89Maruti Suzuki India Ltd 0.24
Cement 5.63Ultratech Cement Ltd 3.22The Ramco Cements Ltd 1.26ACC Ltd 1.15
Pharmaceuticals 4.83Sun Pharmaceutical Industries Ltd 1.90Divi’s Laboratories Ltd 1.17Strides Shasun Ltd 0.96Aurobindo Pharma Ltd 0.80
Chemicals 4.08Atul Ltd 1.43Solar Industries India Ltd 1.31Gujarat Fluorochemicals Ltd 0.87Pidilite Industries Ltd 0.47
Transportation 3.38Blue Dart Express Ltd 1.66Gateway Distriparks Ltd 0.88Transport Corporation of India Ltd 0.84
Auto Ancillaries 3.23WABCO India Ltd 2.04Bosch Ltd 1.19
Construction Project 2.83KEC International Ltd 1.06Engineers India Ltd 0.92Ashoka Buildcon Ltd 0.85
Consumer Non Durables 2.67Britannia Industries Ltd 1.31United Spirits Ltd 0.75Asian Paints Ltd 0.61
Industrial Products 2.11Timken India Ltd 1.06Bharat Forge Ltd 1.05
Engineering Services 1.70VA Tech Wabag Ltd 1.70
Gas 1.64Indraprastha Gas Ltd 1.64
Media & Entertainment 1.58Zee Entertainment Enterprises Ltd 1.58
Textile Products 1.25Arvind Ltd 1.25
Telecom - Services 1.24Tata Communications Ltd 1.24
Construction 1.13Simplex Infrastructures Ltd 0.62PNC Infratech Ltd 0.51
Finance 0.80LIC Housing Finance Ltd 0.80
Ferrous Metals 0.73Tata Steel Ltd 0.73
Oil 0.52Oil & Natural Gas Corporation Ltd 0.52
Unlisted 0.13Ferrous Metals 0.13Kudremukh Iron Ore Co Ltd 0.13
Money Market Instruments 3.34Reverse Repo (for India) 3.34
Net Current Assets 1.61
Grand Total ( Net Asset) 100.00
CANARA ROBECO EQUITY DIVERSIFIED (CRED)
lCapital appreciation over long term
lInvestment predominantly in equity and equity related securities
This product is suitable for investors who are seeking*:
*Investors should consult their financial advisers if in doubt whether the product is suitable for them
7
Investors understand that their principalwill be at Moderately High Risk
$QUANTITATIVE INFORMATION
Standard Deviation 17.80
Portfolio Beta 1.02
Portfolio Turnover Ratio 0.65 times
R-Squared 0.93
Sharpe Ratio 0.40
FUND INFORMATION
CATEGORY: Open Ended Equity Scheme
SCHEME OBJECTIVE: To generate capital appreciation by investing in equity and equity related securities. However, there can be no assurance that the investment objective of the scheme will be realized.
NAV: (as on April 29, 2016)Direct Plan - Dividend Option ` 38.41Regular Plan - Dividend Option ` 29.95Direct Plan - Growth Option ` 88.79Regular Plan - Growth Option ` 87.29
DATE OF ALLOTMENT: September 16, 2003
ASSET ALLOCATION:
Equity and equity related instruments: 85% -100%.
Money Market instruments : 0% - 15%
MINIMUM INVESTMENT:
Lumpsum: ̀ 5000 in multiples of ̀ 1 thereafter
Subsequent purchases: Minimum amount of ` 1,000 and multiples of ̀ 1 thereafter.
SIP/STP/SWP: For monthly frequency - ` 1000 and in multiples of ̀ 1 thereafter
For quarterly frequency - ̀ 2000 and in multiples of ̀ 1 thereafter
PLANS / OPTIONS :
Regular Plan- Growth Option Regular Plan- Dividend Reinvestment Option/ Payout Option
Direct Plan- Growth OptionDirect Plan- Dividend Reinvestment Option/ Payout Option
ENTRY LOAD: Nil
Expense Ratio^:
Regular Plan : 2.53%
Direct Plan : 1.82%
BENCHMARK: S&P BSE 200
FUND MANAGER: Mr. Ravi Gopalakrishnan
TOTAL EXPERIENCE: 23 Years
In Managing this Fund: Since 16-Sep-12
#Monthend AUM : 712.06 Crores
Monthly AVG AUM : ` 709.26 Crores
EXIT LOAD:
1% - If redeemed/switched out within 1 year from the date of allotment, Nil - if redeemed/switched out after 1 year from the date of allotment.
`
(as on April 29,2016)
RISKOMETER

$ (for remaining disclaimer Please refer page no. 39) Monthend AUM as on 29.04.2016 = ^The expense ratios mentioned for the schemes excludes additional service tax on investment management fees.
=Please refer page no. 39 for disclaimers.
Source ICRA MFI Explorer = #
CANARA ROBECO EQUITY TAX SAVER (CRETS)
PRODUCT POSITIONING
Canara Robeco Equity Tax Saver is an ELSS with a 3
year lock-in period providing Tax Benefits under Sec
80 C of Income Tax Act. The fund benefits from long
term investing due to its lock-in. The portfolio
consists of both large and mid cap stocks with a
'Growth' style of investing.
PORTFOLIO
Name of the Instruments % to NAV
Equities 93.17Listed 93.17Banks 22.76HDFC Bank Ltd 7.71IndusInd Bank Ltd 3.81State Bank of India 2.68ICICI Bank Ltd 2.31Kotak Mahindra Bank Ltd 2.16Axis Bank Ltd 2.02Bank of Baroda 1.18Yes Bank Ltd 0.89
Petroleum Products 10.88Reliance Industries Ltd 6.03Hindustan Petroleum Corporation Ltd 2.60Indian Oil Corporation Ltd 1.36Castrol India Ltd 0.89
Software 6.76Infosys Ltd 6.76
Industrial Products 6.11Bharat Forge Ltd 1.94Timken India Ltd 1.63FAG Bearings India Ltd 1.61Greaves Cotton Ltd 0.93
Pharmaceuticals 5.95Divi’s Laboratories Ltd 1.82Sun Pharmaceutical Industries Ltd 1.52Aurobindo Pharma Ltd 1.00Strides Shasun Ltd 0.90Hikal Ltd 0.71
Auto 5.61Tata Motors Ltd A (DVR) 3.26Tvs Motor Company Ltd 1.61Escorts Ltd 0.74
Chemicals 3.88Solar Industries India Ltd 1.76Atul Ltd 1.71Gujarat Fluorochemicals Ltd 0.41
Industrial Capital Goods 3.77Texmaco Rail & Engineering Ltd 1.23Honeywell Automation India Ltd 0.95ABB India Ltd 0.80Alstom T&D India Ltd 0.79
Construction Project 3.58KEC International Ltd 1.32Ashoka Buildcon Ltd 1.26NCC Ltd 1.00
Cement 3.54Ultratech Cement Ltd 2.97The Ramco Cements Ltd 0.57
Consumer Non Durables 3.44Britannia Industries Ltd 2.30CCL Products (India) Ltd 0.78Dabur India Ltd 0.36
Transportation 2.74Blue Dart Express Ltd 1.42Gateway Distriparks Ltd 1.01Container Corporation Of India Ltd 0.31
Auto Ancillaries 2.21WABCO India Ltd 1.73Precision Camshafts Ltd 0.48
Media & Entertainment 1.78Zee Entertainment Enterprises Ltd 1.05Dish TV India Ltd 0.73
Oil 1.73Oil & Natural Gas Corporation Ltd 1.73
Telecom - Services 1.66Tata Communications Ltd 1.66
Gas 1.30Indraprastha Gas Ltd 1.30
Hotels, Resorts And Other Recreational Activities 1.20The Indian Hotels Co Ltd 1.20
Finance 1.08Credit Analysis and Research Ltd 1.08
Engineering Services 1.05VA Tech Wabag Ltd 1.05
Construction 1.04Ahluwalia Contracts (India) Ltd 1.04
Minerals/Mining 0.77Coal India Ltd 0.77
Ferrous Metals 0.33Tata Steel Ltd 0.33
Money Market Instruments 6.15Reverse Repo (for India) 6.15
Net Current Assets 0.68
Grand Total ( Net Asset) 100.00
lCapital appreciation over long term
lInvestment in equity and equity related securities
This product is suitable for investors who are seeking*:
*Investors should consult their financial advisers if in doubt whether the product is suitable for them
8
Investors understand that their principalwill be at Moderately High Risk
$QUANTITATIVE INFORMATION
Standard Deviation 17.71
Portfolio Beta 1.01
Portfolio Turnover Ratio 0.53 times
R-Squared 0.93
Sharpe Ratio 0.54
FUND INFORMATION
CATEGORY: Open Ended Equity Linked Tax Saving Scheme
SCHEME OBJECTIVE:
(ELSS Scheme) Seeking to provide long term capital appreciation by predominantly investing in equities and to facilitate the subscribers to seek tax benefits as provided under Section 80 C of the Income Tax Act, 1961. However, there can be no assurance that the investment objective of the scheme will be realized.
NAV: (as on April 29, 2016)Direct Plan - Dividend Option ` 29.82Regular Plan - Dividend Option ` 22.02Direct Plan - Growth Option ` 44.66Regular Plan - Growth Option ` 44.00
DATE OF ALLOTMENT: March 31, 1993
ASSET ALLOCATION:
Equity and equity related instruments: 80%-100%.
Money Market instruments : 0% - 20%.
MINIMUM INVESTMENT:
Lumpsum: ̀ 500 in multiples of ̀ 1 thereafter
Subsequent purchases: Minimum amount of ` 500 and multiples of ̀ 1 thereafter.
SIP/STP/SWP: For monthly frequency - ` 500 and in multiples of ̀ 1 thereafter
For quarterly frequency - ` 1000 and in multiples of ̀ 1 thereafter
PLANS / OPTIONS :
Regular Plan- Growth Option Regular Plan- Dividend Payout Option
Direct Plan- Growth OptionDirect Plan- Dividend Payout Option
ENTRY LOAD: Nil
Expense Ratio^:
Regular Plan : 2.39%
Direct Plan : 1.80%
BENCHMARK: S&P BSE 100
FUND MANAGER: Mr. Yogesh Patil
TOTAL EXPERIENCE: 13 Years
In Managing this Fund: Since 1-Apr-16
#Monthend AUM : ` 796.18 Crores
Monthly AVG AUM : ` 793.17 Crores
EXIT LOAD: Nil
(as on April 29,2016)
RISKOMETER

$ (for remaining disclaimer Please refer page no. 39) Monthend AUM as on 29.04.2016 = ^The expense ratios mentioned for the schemes excludes additional service tax on investment management fees.= Please refer page no. 39 for disclaimers.
Source ICRA MFI Explorer = #
CANARA ROBECO LARGE CAP+ FUND (CRLCF)The sign (+) in the name of the fund has been used in terms of asset allocation and not in terms of return/yield.
PRODUCT POSITIONING
Canara Robeco Large Cap+ is an open ended fund which will invest in Top 150 companies based on their Market capitalization. The fund aims to benefit from the growing Indian economy by investing in large cap stocks as they have a potential to grow in tandem with Indian economy. The fund will also utilize the inputs from the internal quant model which will act as an idea generator
PORTFOLIO Name of the Instruments % to NAV
Equities 93.52Listed 93.52Banks 24.85HDFC Bank Ltd 8.79IndusInd Bank Ltd 3.04Kotak Mahindra Bank Ltd 2.57State Bank of India 2.49ICICI Bank Ltd 2.34Axis Bank Ltd 2.16Bank of Baroda 2.02Yes Bank Ltd 1.44
Petroleum Products 12.28Reliance Industries Ltd 6.11Hindustan Petroleum Corporation Ltd 4.20Indian Oil Corporation Ltd 1.97
Auto 9.49Ashok Leyland Ltd 2.73Tata Motors Ltd 2.03Tvs Motor Company Ltd 1.52Tata Motors Ltd A (DVR) 1.46Hero MotoCorp Ltd 1.38Maruti Suzuki India Ltd 0.37
Software 8.21Infosys Ltd 7.23Oracle Financial Services Software Ltd 0.98
Pharmaceuticals 8.09Sun Pharmaceutical Industries Ltd 2.87Divi’s Laboratories Ltd 1.63Cipla Ltd 1.46Aurobindo Pharma Ltd 1.29Alkem Laboratories Ltd 0.84
Cement 5.80Ultratech Cement Ltd 3.22ACC Ltd 1.96Shree Cement Ltd 0.62
Consumer Non Durables 4.39Asian Paints Ltd 1.99Britannia Industries Ltd 1.50United Spirits Ltd 0.90
Industrial Capital Goods 3.27ABB India Ltd 1.89Bharat Electronics Ltd 1.38
Finance 2.95Housing Development Finance Corporation Ltd 1.76LIC Housing Finance Ltd 1.19
Industrial Products 2.16Bharat Forge Ltd 1.13Cummins India Ltd 1.03
Auto Ancillaries 2.13Bosch Ltd 1.11Exide Industries Ltd 1.02
Media & Entertainment 1.97Zee Entertainment Enterprises Ltd 1.97
Oil 1.91Oil & Natural Gas Corporation Ltd 1.91
Transportation 1.50Container Corporation Of India Ltd 1.50
Minerals/Mining 1.45Coal India Ltd 1.45
Telecom - Services 1.36Tata Communications Ltd 1.36
Chemicals 1.05Pidilite Industries Ltd 1.05
Ferrous Metals 0.66Tata Steel Ltd 0.66
Money Market Instruments 5.09Reverse Repo (for India) 5.09
Net Current Assets 1.39
Grand Total ( Net Asset) 100.00
lCapital appreciation over long term
lInvesting in companies having a large market capitalization
This product is suitable for investors who are seeking*:
*Investors should consult their financial advisers if in doubt whether the product is suitable for them
9
Investors understand that their principalwill be at Moderately High Risk
$QUANTITATIVE INFORMATION
Standard Deviation 15.96
Portfolio Beta 0.92
Portfolio Turnover Ratio 0.46 times
R-Squared 0.95
Sharpe Ratio 0.42
(as on April 29,2016)
FUND INFORMATION
CATEGORY : Open Ended Equity Scheme
SCHEME OBJECTIVE :
The Investment Objective of the fund is to provide capital appreciation by predominantly investing in companies having a large market capitalization. However, there can be no assurance that the investment objective of the scheme will be realized.
NAV: (as on April 29, 2016)Direct Plan - Dividend Option ` 17.16Regular Plan - Dividend Option ` 14.39Direct Plan - Growth Option ` 17.23Regular Plan - Growth Option ` 16.77
DAT E OF ALLOTMENT : August 20, 2010
ASSET ALLOCATION :
Large Cap equity and equity related @Instruments : 65% - 100%. Domestic Debt and
Money Market Instruments (including securitized debt up to 10% of Avg AUM ): 0%- 35%.
@For the purpose of this Fund, Large Cap Companies are defined as those which are ranked from 1 to 150 on the basis of market capitalization at the time of investment. The ranking will be reviewed on the basis of market capitalisation of companies at the end of every calendar quarter.
MINIMUM INVESTMENT:
Lumpsum: ̀ 5000 in multiples of ̀ 1 thereafter
Subsequent purchases: Minimum amount of ` 1,000 and multiples of ̀ 1.00 thereafter.
SIP/STP/SWP: For monthly frequency - ̀ 1000 and in multiples of ̀ 1 thereafter
For quarterly frequency - ` 2000 and in multiples of ̀ 1 thereafter
PLANS / OPTIONS : Regular Plan- Growth Option Regular Plan- Dividend Reinvestment Option/ Payout Option
Direct Plan- Growth OptionDirect Plan- Dividend Reinvestment Option/ Payout Option
ENTRY LOAD: Nil
Expense Ratio^:
Regular Plan : 2.80%
Direct Plan : 1.66%
BENCHMARK : S&P BSE 100
FUND MANAGER : Mr. Ravi Gopalakrishnan
TOTAL EXPERIENCE : 23 Years
In Managing this Fund : Since 16-Sep-12
#Monthend AUM : ` 103.13 Crores
Monthly AVG AUM : ` 102.27 Crores
EXIT LOAD:
1% for all amounts if redeemed / switched-out within 1 year from the date of allotment. Nil if redeemed / switched-out after 1 year from the date of allotment.
RISKOMETER

Investors understand that their principalwill be at High Risk
$ (for remaining disclaimer Please refer page no. 39)= # Monthend AUM as on 29.04.2016 ^The expense ratios mentioned for the schemes excludes additional service
tax on investment management fees. =Please refer page no. 39 for disclaimers.
Source ICRA MFI Explorer =
=** Plan / Option close for subscription w.e.f 1st October 2012
CANARA ROBECO F.O.R.C.E FUND (CRFRC)
INVESTMENT STYLE
Growth Value Blend
Large Cap Mid Cap Small Cap
Diversified Thematic Sector
PRODUCT POSITIONING
Canara Robeco FORCE Fund is an open ended thematic fund predominantly investing in 3 sectors benefitting from the rising domestic demand i.e. Financial Services, Retail Consumption and Media & Entertainment. The fund will also look for opportunity to invest in few other companies which benefit from this theme not covered in the sectors mentioned above. The fund will invest in stocks across the Market Capitalisation range and will look to follow 'Growth' style of investing.
PORTFOLIO
Name of the Instruments % to NAV
Equities 96.24Listed 96.24Banks 39.05HDFC Bank Ltd 10.03ICICI Bank Ltd 4.60Axis Bank Ltd 4.56IndusInd Bank Ltd 4.39State Bank of India 3.93Kotak Mahindra Bank Ltd 3.48Yes Bank Ltd 3.13Bank of Baroda 2.29IDFC Bank Ltd 1.47DCB Bank Ltd 1.17
Media & Entertainment 18.39Zee Entertainment Enterprises Ltd 7.74Dish TV India Ltd 2.25D B Corp Ltd 2.04PVR Ltd 2.03TV18 Broadcast Ltd 1.57Jagran Prakashan Ltd 1.57HT Media Ltd 1.19
Consumer Non Durables 14.11I T C Ltd 5.19Britannia Industries Ltd 2.18Kansai Nerolac Paints Ltd 1.84CCL Products (India) Ltd 1.74Glaxosmithkline Consumer Healthcare Ltd 1.25United Spirits Ltd 0.97Jubilant Foodworks Ltd 0.94
Finance 8.51Housing Development Finance Corporation Ltd 3.86Credit Analysis and Research Ltd 1.43IIFL Holdings Ltd 1.18Cholamandalam Investment & Finance Co Ltd 1.09Sundaram Finance Ltd 0.95
Textile Products 4.69Arvind Ltd 1.89Raymond Ltd 1.59Siyaram Silk Mills Ltd 1.21
Consumer Durables 4.29Whirlpool Of India Ltd 2.46Century Plyboards (India) Ltd 1.83
Retailing 3.35Shopper’s Stop Ltd 1.22Aditya Birla Fashion and Retail Ltd 1.15Future Retail Ltd 0.98
Hotels, Resorts And Other Recreational Activities 1.81The Indian Hotels Co Ltd 1.81
Auto 1.14Tata Motors Ltd 1.14
Software 0.90NIIT Ltd 0.90
Money Market Instruments 3.53Reverse Repo (for India) 3.53
Net Current Assets 0.23
Grand Total ( Net Asset) 100.00
lCapital appreciation over long term
lInvesting in equity and equity related securities of companies in the Finance, Retail & Entertainment sectors
This product is suitable for investors who are seeking*:
*Investors should consult their financial advisers if in doubt whether the product is suitable for them
10
$QUANTITATIVE INFORMATION
Standard Deviation 20.51
Portfolio Beta 1.13
Portfolio Turnover Ratio 0.41 times
R-Squared 0.85
Sharpe Ratio 0.50
FUND INFORMATION
CATEGORY: Open Ended Equity Scheme
SCHEME OBJECTIVE: The objective of the Fund is to provide long - term capital appreciation by primarily investing in equity and equity related securities of companies in the Finance, Retail & Entertainment sectors. However, there can be no assurance that the investment objective of the scheme will be realized.
NAV: (as on April 29, 2016)
Direct Plan - Dividend Option ` 23.21Direct Plan - Growth Option ` 24.96Institutional Plan - Growth Option ** ` 24.37Regular Plan - Dividend Option ` 18.97Regular Plan - Growth Option ` 24.35
DATE OF ALLOTMENT: September 14, 2009
ASSET ALLOCATION: Equity and equity related instruments of companies in the Finance, Retail &
@Entertainment sector : 65% - 100%. Other Equity and equity related instruments : 0%-35%. Domestic Debt and Money Market instruments (Including securitised debt up to 10% of net assets) : 0% - 35%
@The scheme shall invest minimum 40% and maximum 65% in Finance Sector, minimum 15% and maximum 35% in Entertainment sector and minimum 10% and maximum 25% in Retail sector.
MINIMUM INVESTMENT :
Lumpsum: ̀ 5000 in multiples of ̀ 1 thereafter
Subsequent purchases: Minimum amount of ` 1000 and multiples of ̀ 1 thereafter.
SIP/STP/SWP: For monthly frequency - ̀ 1000 and in multiples of ̀ 1 thereafter
For quarterly frequency - ` 2000 and in multiples of ̀ 1 thereafter
PLANS / OPTIONS :
Regular Plan - Growth Regular Plan - Dividend Reinvestment Regular Plan - Dividend Payout
Direct Plan- Growth OptionDirect Plan- Dividend Reinvestment Option/ Payout Option
ENTRY LOAD: Nil
Expense Ratio^:
Regular Plan : 2.80%Direct Plan : 1.85%
BENCHMARK : Nifty 50
FUND MANAGER: 1) Mr. Krishna Sanghavi2) Mr. Hemang Kapasi
TOTAL EXPERIENCE: 1) 20Years 2) 10 Years
In Managing this Fund: 1) Since 16-Sep-122) Since 12-Jun-14
#Monthend AUM : ` 110.74 Crores
Monthly AVG AUM : ` 108.44 Crores
EXIT LOAD : 1.5% - If redeemed/switched out within 12 months from the date of allotment.
1% - If redeemed/switched out after 12 months but before 18 months from the date of allotment.
Nil - if redeemed/switched out after 18 months from the date of allotment.
(as on April 29,2016)
RISKOMETER

$ (for remaining disclaimer Please refer page no. 39) Monthend AUM as on 29.04.2016 = ^The expense ratios mentioned for the schemes excludes additional service tax on investment management fees. =***Rebranding by NSE vide press release dated 28th March, 2016 =Please refer page no. 39 for disclaimers.
Source ICRA MFI Explorer = #
CANARA ROBECO EMERGING EQUITIES (CREE)
INVESTMENT STYLE
Growth Value Blend
Large Cap Mid Cap Small Cap
Diversified Thematic Sector
PRODUCT POSITIONING
Canara Robeco Emerging Equities follows a bottom-
up approach to predominantly invest in a well
diversified portfolio of companies within small &
mid cap universe. The fund endeavours to identify
the stars of tomorrow within the segment.
PORTFOLIO Name of the Instruments % to NAV
Equities 96.87Listed 96.36Banks 10.62IndusInd Bank Ltd 3.65IDFC Bank Ltd 1.88Kotak Mahindra Bank Ltd 1.83DCB Bank Ltd 1.81Yes Bank Ltd 1.45
Construction Project 7.28Sadbhav Engineering Ltd 1.73NCC Ltd 1.48Ashoka Buildcon Ltd 1.43Techno Electric & Engineering Co Ltd 1.37Engineers India Ltd 1.27
Industrial Products 6.35FAG Bearings India Ltd 1.90Timken India Ltd 1.45Bharat Forge Ltd 1.40Greaves Cotton Ltd 1.05Finolex Industries Ltd 0.55
Industrial Capital Goods 6.27Praj Industries Ltd 1.80Honeywell Automation India Ltd 1.58Texmaco Rail & Engineering Ltd 1.23Sanghvi Movers Ltd 0.92Skipper Ltd 0.74
Cement 6.26The Ramco Cements Ltd 2.12JK Lakshmi Cement Ltd 1.67Century Textiles & Industries Ltd 1.28Orient Cement Ltd 1.19
Consumer Non Durables 5.91Britannia Industries Ltd 1.81Akzo Nobel India Ltd 1.51Eveready Industries India Ltd 1.32CCL Products (India) Ltd 1.27
Pharmaceuticals 5.69Divi’s Laboratories Ltd 2.32Strides Shasun Ltd 1.54Hikal Ltd 0.96Natco Pharma Ltd 0.87
Chemicals 5.66Atul Ltd 2.34Navin Fluorine International Ltd 1.86Solar Industries India Ltd 1.46
Finance 4.83Cholamandalam Investment & Finance Co Ltd 1.79Credit Analysis and Research Ltd 1.67IIFL Holdings Ltd 1.37
Petroleum Products 3.96Indian Oil Corporation Ltd 2.89Gulf Oil Lubricants India Ltd 1.07
Software 3.95Hexaware Technologies Ltd 1.51NIIT Ltd 1.36Tata Elxsi Ltd 1.08
Auto Ancillaries 3.88WABCO India Ltd 1.61Asahi India Glass Ltd 1.29Precision Camshafts Ltd 0.98
Power 3.35Cesc Ltd 1.82Kalpataru Power Transmission Ltd 1.53
Textile Products 3.16Arvind Ltd 1.77Raymond Ltd 1.39
Transportation 2.96Transport Corporation of India Ltd 1.65Gateway Distriparks Ltd 1.31
Auto 2.92Force Motors Ltd 1.85Escorts Ltd 1.07
Media & Entertainment 2.49TV18 Broadcast Ltd 1.46Dish TV India Ltd 1.03
Telecom - Services 2.33Tata Communications Ltd 2.33
Gas 1.82Indraprastha Gas Ltd 1.82
Hotels, Resorts And Other Recreational Activities 1.57The Indian Hotels Co Ltd 1.57
Engineering Services 1.56VA Tech Wabag Ltd 1.56
Retailing 1.36Future Retail Ltd 1.36
Consumer Durables 1.17Whirlpool Of India Ltd 1.17
Construction 1.01Ahluwalia Contracts (India) Ltd 1.01
Unlisted 0.51Finance 0.51Ujjivan Financial Services Ltd 0.51
Money Market Instruments 3.00Reverse Repo (for India) 3.00
Net Current Assets 0.13
Grand Total ( Net Asset) 100.00
lCapital appreciation over long term
lInvesting in diversified mid-cap stocks
This product is suitable for investors who are seeking*:
*Investors should consult their financial advisers if in doubt whether the product is suitable for them
11
Investors understand that their principalwill be at Moderately High Risk
$QUANTITATIVE INFORMATION
Standard Deviation 22.24
Portfolio Beta 1.11
Portfolio Turnover Ratio 0.5 times
R-Squared 0.89
Sharpe Ratio 1.14
(as on April 29,2016)
FUND INFORMATION
CATEGORY: Open Ended Equity Scheme.
SCHEME OBJECTIVE: To generate capital appreciation by primarily investing in diversified mid cap stocks. However, there can be no assurance that the investment objective of the scheme will be realized.
NAV: (as on April 29, 2016)Direct Plan - Dividend Option ` 41.53Regular Plan - Dividend Option ` 33.32Direct Plan - Growth Option ` 60.62Regular Plan - Growth Option ` 58.94
DATE OF ALLOTMENT: March 11, 2005
ASSET ALLOCATION: Mid & Small Cap equity and @equity related instruments : 65%-100%.
Equity & equity related instruments of Companies other than the above: 0% - 35%. Domestic Debt and Money Market Instruments: 0% - 35%.
@For the purpose of this Fund, Mid & Small Cap Companies are defined as those which are ranked from 151 to 500 on the basis of market capitalisation. The ranking will be reviewed periodically.
MINIMUM INVESTMENT:
Lumpsum: ̀ 5000 in multiples of ̀ 1 thereafter
Subsequent purchases: Minimum amount of ` 1,000 and multiples of ̀ 1 thereafter.
SIP/STP/SWP: For monthly frequency - ̀ 1000 and in multiples of ̀ 1 thereafter
For quarterly frequency - ` 2000 and in multiples of ̀ 1 thereafter
PLANS / OPTIONS :
Regular Plan- Growth Option Regular Plan- Dividend Reinvestment Option/ Payout Option
Direct Plan- Growth OptionDirect Plan- Dividend Reinvestment Option/ Payout Option
ENTRY LOAD: Nil
Expense Ratio^:
Regular Plan : 2.47%
Direct Plan : 1.40%
BENCHMARK***: Nifty Free Float Midcap 100(w.e.f.1st April, 2016)
FUND MANAGER: 1) Mr. Ravi Gopalakrishnan 2) Mr. Krishna Sanghavi
TOTAL EXPERIENCE: 1) 23 Years2) 20 Years
In Managing this Fund: 1) 16-Sep-122) 16-Sep-12
#Monthend AUM : ` 992.51 Crores
Monthly AVG AUM : ` 968.14 Crores
EXIT LOAD :
1% - If redeemed/switched out within 18 months from the date of allotment
Nil - if redeemed/switched out after 18 months from the date of allotment.
RISKOMETER

$ (for remaining disclaimer Please refer page no. 39) Monthend AUM as on 29.04.2016 = ^The expense ratios mentioned for the schemes excludes additional service tax on investment management fees.
=Please refer page no. 39 for disclaimers.
Source ICRA MFI Explorer = #
CANARA ROBECO INFRASTRUCTURE (CRI)
INVESTMENT STYLE
Growth Value Blend
Large Cap Mid Cap Small Cap
Diversified Thematic Sector
Canara Robeco Infrastructure endeavours to
capture opportunities in the infrastructure space,
through a predominantly large-cap oriented
portfolio. The fund follows a thematic approach
towards Infrastructure with a 'Growth' style of
investing. The fund aims to have concentrated
holdings on high conviction ideas.
PRODUCT POSITIONING
PORTFOLIO Name of the Instruments % to NAV
Equities 91.30Listed 91.30Cement 16.08Ultratech Cement Ltd 8.68Grasim Industries Ltd 4.39Orient Cement Ltd 3.01
Transportation 15.63Container Corporation Of India Ltd 6.96Blue Dart Express Ltd 4.18Gateway Distriparks Ltd 2.35Transport Corporation of India Ltd 2.14
Construction Project 11.64Sadbhav Engineering Ltd 5.04Ashoka Buildcon Ltd 3.87Larsen & Toubro Ltd 2.15Techno Electric & Engineering Co Ltd 0.58
Petroleum Products 11.48Indian Oil Corporation Ltd 4.83Hindustan Petroleum Corporation Ltd 4.72Bharat Petroleum Corporation Ltd 1.93
Power 8.95Power Grid Corporation Of India Ltd 8.95
Industrial Capital Goods 7.53Texmaco Rail & Engineering Ltd 3.64Praj Industries Ltd 2.35Inox Wind Ltd 1.05
TIL Ltd 0.31Salzer Electronics Ltd 0.18
Construction 5.16PNC Infratech Ltd 2.76Ahluwalia Contracts (India) Ltd 1.69Simplex Infrastructures Ltd 0.71
Engineering Services 3.95VA Tech Wabag Ltd 3.95
Finance 3.36Housing Development Finance Corporation Ltd 3.36
Industrial Products 2.52Bharat Forge Ltd 1.64Timken India Ltd 0.88
Oil 2.30Oil India Ltd 1.29Oil & Natural Gas Corporation Ltd 1.01
Telecom - Services 1.28Tata Communications Ltd 1.28
Auto Ancillaries 1.11Exide Industries Ltd 0.62Z.F. Steering Gear (India) Ltd 0.49
Gas 0.31GAIL (India) Ltd 0.31
Money Market Instruments 8.66Reverse Repo (for India) 8.66
Net Current Assets 0.04
Grand Total ( Net Asset) 100.00
lCapital appreciation over long term
lInvesting in equities and equity related instruments of companies in the infrastructure sector
This product is suitable for investors who are seeking*:
*Investors should consult their financial advisers if in doubt whether the product is suitable for them
12
Investors understand that their principalwill be at High Risk
$QUANTITATIVE INFORMATION
Standard Deviation 24.36
Portfolio Beta 1.30
Portfolio Turnover Ratio 0.27 times
R-Squared 0.84
Sharpe Ratio 0.54
FUND INFORMATION
CATEGORY: Open Ended Equity Scheme
S C H E M E O B J E C T I V E : To g e n e r a t e income/capital appreciation by investing in equities and equity related instruments of companies in the infrastructure sector. However, there can be no assurance that the investment objective of the scheme will be realized.
NAV: (as on April 29, 2016)Direct Plan - Dividend Option ` 25.96Regular Plan - Dividend Option ` 23.41Direct Plan - Growth Option ` 36.07Regular Plan - Growth Option ` 35.35
DATE OF ALLOTMENT: December 2, 2005
ASSET ALLOCATION: Equity and equity related instruments of companies in the Infrastructure sector including derivatives of such companies : 75% - 100%. Domestic Debt and Money Market instruments : 0% - 25%.
MINIMUM INVESTMENT:
Lumpsum: ̀ 5000 in multiples of ̀ 1 thereafter
Subsequent purchases: Minimum amount of ` 1,000 and multiples of ̀ 1 thereafter.
SIP/STP/SWP: For monthly frequency - ` 1000 and in multiples of ̀ 1 thereafter
For quarterly frequency - ̀ 2000 and in multiples of ̀ 1 thereafter
PLANS / OPTIONS : Regular Plan- Growth Option Regular Plan- Dividend Reinvestment Option/ Payout Option
Direct Plan- Growth OptionDirect Plan- Dividend Reinvestment Option/ Payout Option
ENTRY LOAD: Nil
Expense Ratio^:
Regular Plan : 2.74%
Direct Plan : 1.97%
BENCHMARK: S&P BSE 100
Fund Manager: Mr. Yogesh Patil
Total Experience: 13 Years
In Managing this Fund: Since 29-May-15(As Fund Manager)
Since 1- Dec-11(As Co-Fund Manager)
#Monthend AUM : ` 116.56 Crores
Monthly AVG AUM : ` 116.09 Crores
EXIT LOAD: 1% - If redeemed/switched out within 1 year from the date of allotment, Nil - if redeemed/switched out after 1 year from the date of allotment.
(as on April 29,2016)
RISKOMETER

$ (for remaining disclaimer Please refer page no. 39) Monthend AUM as on 29.04.2016 = ^The expense ratios mentioned for the schemes excludes additional service tax on investment management fees. = ***Rebranding by CRISIL Balanced Fund – Aggressive Index vide March 2016 review report = Please refer page no. 39 for disclaimers.
Source ICRA MFI Explorer = #
CANARA ROBECO BALANCE (CRB)
INVESTMENT STYLE
Growth Value Blend
Large Cap Mid Cap Small Cap
Diversified Thematic Sector
PRODUCT POSITIONING
Canara Robeco Balance aims to generating long-term capital appreciation through a prudent mix of equity and debt portfolio, making it more suitable for the average investor as it takes away the burden of focusing on asset allocation between equity & debt. The fund invests in a careful blend of select stocks and debt securities which effectively spreads the risk.
PORTFOLIO Name of the Instruments % to NAV
Equities 70.74Listed 70.74Banks 13.55HDFC Bank Ltd 2.67IndusInd Bank Ltd 2.46Kotak Mahindra Bank Ltd 1.92Bank of Baroda 1.32State Bank of India 1.27ICICI Bank Ltd 1.16Yes Bank Ltd 1.15DCB Bank Ltd 0.87Axis Bank Ltd 0.73Consumer Non Durables 6.75Britannia Industries Ltd 1.34Colgate Palmolive (India) Ltd 1.28CCL Products (India) Ltd 0.96I T C Ltd 0.88Akzo Nobel India Ltd 0.81Eveready Industries India Ltd 0.78Jubilant Foodworks Ltd 0.70Petroleum Products 5.98Reliance Industries Ltd 2.77Hindustan Petroleum Corporation Ltd 1.47Gulf Oil Lubricants India Ltd 1.21Mangalore Refinery & Petrochemicals Ltd 0.53Construction Project 4.98Techno Electric & Engineering Co Ltd 1.27Ashoka Buildcon Ltd 1.05NCC Ltd 0.95Engineers India Ltd 0.86KEC International Ltd 0.85Cement 4.93Ultratech Cement Ltd 1.60JK Lakshmi Cement Ltd 0.97Century Textiles & Industries Ltd 0.82Orient Cement Ltd 0.82Sanghi Industries Ltd 0.72Pharmaceuticals 3.80Divi’s Laboratories Ltd 1.66Cipla Ltd 1.59Natco Pharma Ltd 0.55Industrial Capital Goods 3.64ABB India Ltd 1.64Texmaco Rail & Engineering Ltd 0.83Sanghvi Movers Ltd 0.71Alstom T&D India Ltd 0.46Software 3.40Infosys Ltd 2.35NIIT Ltd 1.05Auto 3.19Tata Motors Ltd A (DVR) 2.01Force Motors Ltd 1.18Industrial Products 2.51Bharat Forge Ltd 1.14Timken India Ltd 0.74Mold Tek Packaging Ltd 0.63
ASSET ALLOCATION
lIncome/capital appreciation over long term
lInvesting in equity and equity related securities as well as fixed income securities (debt and money market securities)
This product is suitable for investors who are seeking*:
*Investors should consult their financial advisers if in doubt whether the product is suitable for them
13
Investors understand that their principalwill be at Moderately High Risk
Finance 2.24Cholamandalam Investment & Finance Co Ltd 1.15Credit Analysis and Research Ltd 1.09Textile Products 2.11Arvind Ltd 0.97Raymond Ltd 0.71Siyaram Silk Mills Ltd 0.43Chemicals 1.70Navin Fluorine International Ltd 1.70Power 1.48Cesc Ltd 1.48Transportation 1.35Transport Corporation of India Ltd 0.82Blue Dart Express Ltd 0.53Auto Ancillaries 1.33Precision Camshafts Ltd 0.72Banco Products (I) Ltd 0.61Minerals/Mining 1.10Coal India Ltd 1.10Telecom - Services 1.08Tata Communications Ltd 1.08Media & Entertainment 0.96Zee Entertainment Enterprises Ltd 0.96Gas 0.93Indraprastha Gas Ltd 0.93Construction 0.90Ahluwalia Contracts (India) Ltd 0.90Hotels, Resorts And Other Recreational Activities 0.86The Indian Hotels Co Ltd 0.86Engineering Services 0.70VA Tech Wabag Ltd 0.70Ferrous Metals 0.65Tata Steel Ltd 0.65Textiles - Synthetic 0.62Sarla Performance Fibers Ltd 0.62Debt Instruments 7.74Tata Sons Ltd 2.04L&T Housing Finance Ltd 1.62Power Grid Corporation of India Ltd 1.02Power Grid Corporation of India Ltd 1.02Power Grid Corporation of India Ltd 1.02ICICI Bank Ltd 1.02Money Market Instruments 3.24Reverse Repo (for India) 3.24Government Securities 13.707.88% GOI 19-MAR-30 4.118.13% GOI 22-JUN-45 2.108.17% GOI 01-DEC-44 2.108.24% GOI 10-NOV-33 2.109.23% GOI 23-DEC-43 1.168.83% GOI 12-DEC-41 1.127.59% GOI 20-MAR-29 1.01Net Current Assets 4.58
Grand Total ( Net Asset) 100.00
$QUANTITATIVE INFORMATION
Standard Deviation 14.97Portfolio Beta 1.27Portfolio Turnover Ratio 1.82 timesR-Squared 0.89Sharpe Ratio 0.71
FUND INFORMATION
CATEGORY: Open Ended Balance Scheme
SCHEME OBJECTIVE: To seek to generate long term capital appreciation and/or income from a portfolio constituted of equity and equity related securities as well as fixed income securities (debt and money market securities). However, there can be no assurance that the investment objective of the scheme will be realized.
NAV: Direct Plan - Monthly Divi. Option ` 74.74Regular Plan - Monthly Divi. Option ` 73.74Direct Plan - Growth Option ` 112.12Regular Plan - Growth Option ` 110.63
DATE OF ALLOTMENT: February 1, 1993
ASSET ALLOCATION: Equity and equity related instruments : 40% - 75%. Debt securities including Securitized debt having rating above AA or equivalent, Money Market Instruments & Govt. Securities : 25% - 60%.
MINIMUM INVESTMENT: Lumpsum: ̀ 5000 in multiples of ̀ 1 thereafterSubsequent purchases: Minimum amount of ` 1,000 and multiples of ̀ 1 thereafter.SIP/STP/SWP: For monthly frequency - ̀ 1000 and in multiples of ̀ 1 thereafterFor quarterly frequency - ` 2000 and in multiples of ̀ 1 thereafter
PLANS / OPTIONS : Regular Plan- Growth Option Regular Plan - Monthly Dividend Option* (Payout and Reinvestment)Direct Plan- Growth OptionDirect Plan - Monthly Dividend Option* (Payout and Reinvestment)*The quarterly dividend option has been renamed to monthly dividend option (w.e.f. 23 June, 2015)
ENTRY LOAD: Nil
Expense Ratio^:Regular Plan : 2.56%Direct Plan : 1.63%
BENCHMARK***: CRISIL Balanced Fund - Aggressive Index (w.e.f.4th April, 2016)
FUND MANAGER : 1) Mr. Krishna Sanghavi2) Mr. Avnish Jain
(for debt allocation)
TOTAL EXPERIENCE : 1) 20 Years2) 22 Years
In Managing this Fund: 1) Since 16-Sep-122) Since 7-Oct-13
#Monthend AUM : ` 492.55 Crores
Monthly AVG AUM : ` 483.90 Crores
EXIT LOAD: 1% - If redeemed/switched out within 1 year from the date of allotment, Nil - if redeemed/switched out after 1 year from the date of allotment.
(as on April 29, 2016)
(as on April 29,2016)
RISKOMETER
Equity 70.74%
CBLO/REPO/Reverse Repo & Net Current Assets 7.82%
NCDs/Bonds 7.73%
Treasury Bills/ Sovereign 13.70%

$ (for remaining disclaimer Please refer page no. 39) Monthend AUM as on 29.04.2016 = ^The expense ratios mentioned for the schemes excludes additional service tax on investment management fees.
= Please refer page no. 39 for disclaimers.
Source ICRA MFI Explorer = #
CANARA ROBECO MONTHLY INCOME PLAN (CRMIP)
PRODUCT POSITIONINGCanara Robeco Monthly Income Plan is a debt oriented hybrid fund which aims to generate regular income predominantly through exposure in debt instruments. Also a small participation in equity markets endeavours to boost portfolio returns.
QUANTITATIVE INFORMATION $
Yield to Maturity 8.03%Modified Duration 5.69 YearsAverage Maturity 11.69 Years
PORTFOLIO Name of the Instruments % to NAV
Equities 23.84Listed 23.84Banks 5.61HDFC Bank Ltd 1.29IndusInd Bank Ltd 0.84Bank of Baroda 0.78State Bank of India 0.49IDFC Bank Ltd 0.48ICICI Bank Ltd 0.40Yes Bank Ltd 0.39Karur Vysya Bank Ltd 0.34Axis Bank Ltd 0.32Kotak Mahindra Bank Ltd 0.28Software 2.08Infosys Ltd 1.42Oracle Financial Services Software Ltd 0.50Take Solutions Ltd 0.16Industrial Capital Goods 1.86ABB India Ltd 0.44Inox Wind Ltd 0.39Sanghvi Movers Ltd 0.31Alstom India Ltd 0.25Texmaco Rail & Engineering Ltd 0.24Alstom T&D India Ltd 0.23Cement 1.85Ultratech Cement Ltd 0.74ACC Ltd 0.55Orient Cement Ltd 0.36Century Textiles & Industries Ltd 0.20Petroleum Products 1.80Reliance Industries Ltd 0.90Hindustan Petroleum Corporation Ltd 0.59Gulf Oil Lubricants India Ltd 0.22Mangalore Refinery & Petrochemicals Ltd 0.09Auto 1.74Force Motors Ltd 0.54Ashok Leyland Ltd 0.52Escorts Ltd 0.32Tvs Motor Company Ltd 0.25Maruti Suzuki India Ltd 0.11Construction Project 1.64KEC International Ltd 0.53Engineers India Ltd 0.44Ashoka Buildcon Ltd 0.34Larsen & Toubro Ltd 0.33Consumer Non Durables 1.08United Spirits Ltd 0.34I T C Ltd 0.31CCL Products (India) Ltd 0.23Eveready Industries India Ltd 0.20Pharmaceuticals 0.99Divi’s Laboratories Ltd 0.28Sun Pharmaceutical Industries Ltd 0.27Alkem Laboratories Ltd 0.22Aurobindo Pharma Ltd 0.22Chemicals 0.96Navin Fluorine International Ltd 0.46Gujarat Fluorochemicals Ltd 0.26Atul Ltd 0.24Industrial Products 0.79Mold Tek Packaging Ltd 0.30Bharat Forge Ltd 0.28Timken India Ltd 0.21Construction 0.55Ahluwalia Contracts (India) Ltd 0.28PNC Infratech Ltd 0.27Media & Entertainment 0.52Zee Entertainment Enterprises Ltd 0.26Dish TV India Ltd 0.26Engineering Services 0.33VA Tech Wabag Ltd 0.33Oil 0.33Oil & Natural Gas Corporation Ltd 0.33Textile Products 0.33Arvind Ltd 0.17Siyaram Silk Mills Ltd 0.16Auto Ancillaries 0.31Z.F. Steering Gear (India) Ltd 0.31Finance 0.28
lIncome / Capital appreciation over medium term to long term
lInvestment in Debt instruments, MMI and small portion in equity
This product is suitable for investors who are seeking*:
*Investors should consult their financial advisers if in doubt whether the product is suitable for them
14
Investors understand that their principalwill be at Moderately High Risk
RATING PROFILE (% to net assets)
ASSET ALLOCATION
FUND INFORMATIONCATEGORY: Open Ended Debt SchemeSCHEME OBJECTIVE: To generate income by investing in a wide range of Debt Securities and Money Market instruments of various maturities and small portion in equities and Equity Related Instruments. However, there can be no assurance that the investment objective of the scheme will be realized.
NAV: (as on April 29, 2016)Direct Plan - Growth Option ` 47.2620Regular Plan - Growth Option ` 45.7588Direct Plan - Monthly Divi. Option ` 14.7925Regular Plan - Monthly Divi. Option ` 14.2860Regular Plan - Quarterly Divi. Option ` 14.5200Direct Plan - Quarterly Divi. Option ` 15.0534DATE OF ALLOTMENT: April 24, 1988ASSET ALLOCATION: Equity and equity related instruments :10%-25%. Debt securities (including Securitized debt) with Money Market Instruments : 75% - 90%.MINIMUM INVESTMENT: Lumpsum: ̀ 5000 in multiples of ̀ 1 thereafterSIP/STP/SWP: For monthly frequency - ̀ 1000 and in multiples of ̀ 1 thereafterFor quarterly frequency - ` 2000 and in multiples of ̀ 1 thereafterPLANS / OPTIONS : Regular Plan- Growth OptionRegular Plan - Monthly Dividend Payout / Reinvestment OptionRegular Plan- Quarterly Dividend Payout/ Reinvestment OptionDirect Plan- Growth OptionDirect Plan - Monthly Dividend Payout / Reinvestment OptionDirect Plan- Quarterly Dividend Payout/ Reinvestment OptionENTRY LOAD: Nil
Expense Ratio^: Regular Plan : 2.48% Direct Plan : 1.20%
BENCHMARK: Crisil MIP Blended IndexFUND MANAGER : 1) Mr. Avnish Jain
2) Mr. Ravi Gopalakrishnan(for equity allocation)
TOTAL EXPERIENCE : 1) 22 Years 2) 23 YearsIn Managing this Fund: 1) Since 7-Oct-13
2) Since 16-Sep-12
#Monthend AUM : ` 300.35 CroresMonthly AVG AUM : ` 298.69 Crores
EXIT LOAD: 1% - if redeemed/switched out within 1 year from the date of allotment.Nil – if redeemed / switched out after 1 year from the date of allotment.
MATURITY PROFILE% Allocation
0 to 3 Months 5.03%3 to 6 Months 1.00%6 to 12 Months 9.75%1 -2 years 8.91%Greater than 2 years 45.99%
(as on April 29,2016)
RISKOMETER
CBLO/REPO/Reverse Repo & Net Current Assets 11.17%
AAA & Equivalent 25.94%
Unit Funds 0.46%
Sovereign 46.74%
AA+ & Equivalent 5.68%
AA- & Equivalent 3.80%
A1+ & Equivalent 6.20%
CBLO/REPO/Reverse Repo & Net Current Assets 8.51%
NCDs/Bonds 26.98%
Treasury Bills/ Sovereign
35.60% Unit Funds 0.35%
Equity 23.83%
CDs4.72%
Housing Development Finance Corporation Ltd 0.28Gas 0.25Indraprastha Gas Ltd 0.25Telecom - Services 0.21Tata Communications Ltd 0.21Hotels, Resorts And Other Recreational Activities 0.18The Indian Hotels Co Ltd 0.18Trading 0.11Redington (India) Ltd 0.11Textiles - Synthetic 0.04Sarla Performance Fibers Ltd 0.04Money Market Instruments 4.72IDBI Bank Ltd 4.72Debt Instruments 26.98Tata Sons Ltd 5.02L&T Housing Finance Ltd 3.33Vedanta Ltd 2.89Power Grid Corporation of India Ltd 1.73Housing Development Finance Corporation Ltd 1.69Power Grid Corporation of India Ltd 1.67Power Grid Corporation of India Ltd 1.67Power Grid Corporation of India Ltd 1.67HDB Financial Services Ltd 1.66LIC Housing Finance Ltd 1.66Power Grid Corporation of India Ltd 1.66Housing Development Finance Corporation Ltd 1.00L&T Infrastructure Finance Ltd 1.00Housing Development Finance Corporation Ltd 0.33Government Securities 35.587.59% GOI 20-MAR-29 9.978.13% GOI 22-JUN-45 7.918.17% GOI 01-DEC-44 5.177.88% GOI 19-MAR-30 5.059.23% GOI 23-DEC-43 1.908.83% GOI 12-DEC-41 1.838.24% GOI 10-NOV-33 1.728.27% KERALA SDL 12-AUG-25 1.698.15% GOI 24-NOV-26 0.347.72% GOI 26-OCT-55 0.00Mutual Fund Investments 0.35Canara Robeco Saving Plus 0.35Reverse REPO 3.36Other Current Assets 5.17
Grand Total ( Net Asset) 100.00

$ (for remaining disclaimer Please refer page no. 39) Monthend AUM as on 29.04.2016 = ^The expense ratios mentioned for the schemes excludes additional service tax on investment management fees. = Please refer page no. 39 for disclaimers.
Source ICRA MFI Explorer = #
CANARA ROBECO INDIGO (Income from Debt Instruments & Gold) FUND (CRIF)
PRODUCT POSITIONING
The fund provides a unique combination of Debt and Gold (through Gold ETFs) in one fund. The fund aims to generate alpha through moderate duration play & by capturing the seasonal patterns in Gold. The fund acts as a portfolio diversifier and also provides a blend of accrual & capital appreciation to its investors. The fund through its Gold investment aims to generate additional yield without taking additional credit risk on the fixed income portfolio.
RATING PROFILE (% to net assets)
ASSET ALLOCATION
$$ Canara Robeco Blended Gold Index is a composite index of the Gold Index and CRISIL Short term Bond Fund Index
computed by CRISIL Limited for the purpose of benchmarking the performance of Canara Robeco InDiGo Fund. The Index shall not be copied, transmitted or distributed for any commercial use.
lIncome / Capital appreciation over medium term to short term
lInvestment in debt & money market securities along with investments in Gold ETFs
This product is suitable for investors who are seeking*:
*Investors should consult their financial advisers if in doubt whether the product is suitable for them
15
Investors understand that their principalwill be at Moderately High Risk
QUANTITATIVE INFORMATION $
Yield to Maturity 7.72%
Modified Duration 1.69 Years
Average Maturity 2.12 Years
MATURITY PROFILE% Allocation
Net Current Assets 8.77%
0 to 3 Months 6.94%
3 to 6 Months 10.20%
6 to 12 Months 16.21%
1 -2 years 5.21%
Greater than 2 years 30.07%
PORTFOLIO
Name of the Instruments % to NAV
Money Market Instruments 16.21IDBI Bank Ltd 16.21
Debt Instruments 45.47Power Finance Corporation Ltd 12.45Tata Global Beverages Ltd 10.20Power Grid Corporation of India Ltd 8.91Rural Electrification Corporation Ltd 8.70LIC Housing Finance Ltd 5.21
Mutual Fund Investments 22.60Canara Robeco Gold ETF 12.33Goldman Sachs Gold ETS 6.87Kotak Gold ETF 3.40
Reverse REPO 6.94
Other Current Assets 8.78
Grand Total ( Net Asset) 100.00
FUND INFORMATION
CATEGORY: Open Ended Debt Scheme
SCHEME OBJECTIVE:To generate income from a portfolio constituted of debt & money market securities along with investments in Gold ETFs. However, there can be no assurance that the investment objective of the scheme will be realized.
NAV: (as on April 29, 2016)Direct Plan - Growth Option ` 14.7414Regular Plan - Growth Option ` 14.4226Regular Plan - Quarterly Divi. Option ` 10.8523Direct Plan - Quarterly Divi. Option ` 11.4357
DATE OF ALLOTMENT: July 9, 2010
ASSET ALLOCATION: Indian Debt & Money Market Instruments :65-90%Gold ETFs:10-35%
MINIMUM INVESTMENT: Lumpsum: ̀ 5.000 in multiples of ̀ 1 thereafterSIP/STP/SWP: For monthly frequency - ̀ 1000 and in multiples of ̀ 1 thereafterFor quarterly frequency - ` 2000 and in multiples of ̀ 1 thereafter
PLANS / OPTIONS : Regular Plan- Growth OptionRegular Plan- Quarterly Dividend Payout/ Reinvestment Option
Direct Plan- Growth OptionDirect Plan- Quarterly Dividend Payout/ Reinvestment Option
ENTRY LOAD: Nil
Expense Ratio^:
Regular Plan : 2.47%
Direct Plan : 1.77%
BENCHMARK: Canara Robeco Blended Gold $Index
FUND MANAGER: 1) Mr. Avnish Jain2) Mr. Kiran Shetty
TOTAL EXPERIENCE: 1) 22 Years2) 9 Years
In Managing this Fund: 1) Since 7-Oct-132) Since 7-Oct-13
#Monthend AUM : ` 58.34 Crores
Monthly AVG AUM : ` 58.83 Crores
EXIT LOAD:
1% - if redeemed/switched out within 1 year from the date of allotment.Nil – if redeemed / switched out after 1 year from the date of allotment.
$
(as on April 29,2016)
RISKOMETER
CBLO/REPO/Reverse Repo & Net Current Assets 20.29%
AAA & Equivalent 45.57%
AA+ & Equivalent 13.18%
A1+ & Equivalent 20.95%
Gold ETFs 22.60%
CBLO/REPO/Reverse Repo & Net Current Assets 15.71%
CDs 16.21%
NCDs/Bonds 45.48%

Investors understand that their principalwill be at Moderate Risk
$ (for remaining disclaimer Please refer page no. 39) Monthend AUM as on 29.04.2016 = ^The expense ratios mentioned for the schemes excludes additional service tax on investment management fees.
= Please refer page no. 39 for disclaimers.
Source ICRA MFI Explorer = #
CANARA ROBECO INCOME (CRINC)
PORTFOLIO
Name of the Instruments Rating % to NAV
Debt Instruments 32.83Power Finance Corporation Ltd AAA(CRISIL) 7.36NTPC Ltd AAA(CRISIL) 7.31Rural Electrification Corporation Ltd AAA(CRISIL) 7.24Power Grid Corporation of India Ltd AAA(CRISIL) 3.65LIC Housing Finance Ltd AAA(CARE) 3.64Power Grid Corporation of India Ltd AAA(CRISIL) 3.63
Government Securities 54.678.13% GOI 22-JUN-45 Sovereign 15.018.24% GOI 10-NOV-33 Sovereign 11.287.88% GOI 19-MAR-30 Sovereign 11.028.17% GOI 01-DEC-44 Sovereign 7.528.40% GOI 28-JUL-24 Sovereign 3.787.68% GOI 15-DEC-23 Sovereign 3.657.16% GOI 20-MAY-23 Sovereign 2.128.47% MAHARASHTRA SDL 10-FEB-26 Sovereign 0.29
Reverse REPO 13.42
Other Current Assets -0.92
Grand Total ( Net Asset) 100.00
PRODUCT POSITIONING
Canara Robeco Income is an actively managed debt fund wherein the fund manager takes an active view of the interest rate movements. Based on the interest rate view, the duration of the portfolio will be decided along with the asset allocation pattern between sovereign & corporate bonds. As majority of the portfolio gets invested in high quality debt papers, it provides consistent accrual income to the portfolio.
RATING PROFILE (% to net assets)
ASSET ALLOCATION
lIncome / Capital appreciation over medium to long term
lInvestment in Debt and Money Market securities of different maturity and issuers of different risk profiles
This product is suitable for investors who are seeking*:
*Investors should consult their financial advisers if in doubt whether the product is suitable for them
16
QUANTITATIVE INFORMATION $
Yield to Maturity 7.69%
Modified Duration 6.49 Years
Average Maturity 13.14 Years
MATURITY PROFILE
% Allocation
Net Current Assets -0.94%
0 to 3 Months 13.42%
3 to 6 Months 3.64%
Greater than 2 years 83.87%
FUND INFORMATION
CATEGORY: Open Ended Debt Scheme
SCHEME OBJECTIVE:
To generate income through investment in debt
and money market securities of different
maturity and issuers of different risk profiles.
However, there can be no assurance that the
investment objective of the scheme will be
realized.
NAV: (as on April 29, 2016)Direct Plan - Quarterly Divi. Option ` 14.3569Regular Plan - Quarterly Divi. Option ` 14.0625Direct Plan - Growth Option ` 32.1176Regular Plan - Growth Option ` 31.4699
DATE OF ALLOTMENT: September 19, 2002
ASSET ALLOCATION:
Debt (Including Securitised Debt) : 50% - 100%.
Money Market Instruments / Call Money : 0% - 50%.
MINIMUM INVESTMENT:
Lumpsum: ̀ 5000 in multiples of ̀ 1 thereafter.
SIP/STP/SWP: For monthly frequency - ̀ 1000 and
in multiples of ̀ 1 thereafter
For quarterly frequency - ` 2000 and in multiples
of ̀ 1 thereafter
PLANS / OPTIONS :
Regular Plan- Growth Option Regular Plan - Quarterly Dividend Reinvestment Option/Payout Option
Direct Plan- Growth OptionDirect Plan - Quarterly Dividend Reinvestment Option/Payout Option
ENTRY LOAD: Nil
Expense Ratio^:
Regular Plan : 1.90%
Direct Plan : 1.14%
BENCHMARK: CRISIL Composite Bond Fund Index
FUND MANAGER: Mr. Avnish Jain
TOTAL EXPERIENCE: 22 Years
In Managing this Fund: Since 25-June-14
#Monthend AUM : ` 137.71 Crores
Monthly AVG AUM : ` 138.86 Crores
EXIT LOAD:
1.00% - If redeemed / switched out within 12
months from the date of allotment,
Nil - if redeemed / switched out after 12 months
from the date of allotment
(as on April 29,2016)
RISKOMETER
CBLO/REPO/Reverse Repo & Net Current Assets 12.49%
Treasury Bills/Sovereign 54.68%
AAA & Equivalent 32.83%
CBLO/REPO/Reverse Repo & Net Current Assets 12.49%
Treasury Bills/Sovereign 54.68%
NCDs/Bonds 32.83%

$ (for remaining disclaimer Please refer page no. 39) Monthend AUM as on 29.04.2016 = ^The expense ratios mentioned for the schemes excludes additional service tax on investment management fees. = Please refer page no. 39 for disclaimers.
Source ICRA MFI Explorer = #
CANARA ROBECO GILT PGS (CRGP)
PRODUCT POSITIONING
Canara Robeco Gilt PGS invests in G-Secs of varying
maturity issued by Reserve Bank of India (RBI).
Being invested in sovereign papers, the fund does
not expose its investors to Credit Risk as in the case
of other bond funds.
QUANTITATIVE INFORMATION $
Yield to Maturity 7.17%
Modified Duration 5.75 Years
Average Maturity 12.06 Years
MATURITY PROFILE% Allocation
Net Current Assets -35.40%
0 to 3 Months 47.04%
Greater than 2 years 88.36%
PORTFOLIO
Name of the Instruments Rating % to NAV
Government Securities 88.367.59% GOI 20-MAR-29 Sovereign 53.438.13% GOI 22-JUN-45 Sovereign 31.788.15% GOI 24-NOV-26 Sovereign 3.15
Reverse REPO 47.04
Other Current Assets -35.40
Grand Total ( Net Asset) 100.00
RATING PROFILE & ASSET ALLOCATION (% to net assets)
lRisk free return (except interest rate risk) and long term capital appreciation
l Investment only in government securities
This product is suitable for investors who are seeking*:
*Investors should consult their financial advisers if in doubt whether the product is suitable for them
17
Investors understand that their principalwill be at Moderate Risk
FUND INFORMATION
CATEGORY: Open-Ended dedicated Gilt scheme
SCHEME OBJECTIVE: To provide risk free return (except interest rate risk) and long term capital appreciation by investing only in Govt. Securities. However, there can be no assurance that the investment objective of the scheme will be realized.
NAV: (as on April 29, 2016)Direct Plan - Dividend Option ` 14.0575Regular Plan - Dividend Option ` 13.8672Direct Plan - Growth Option ` 41.2702Regular Plan - Growth Option ` 40.7514
DATE OF ALLOTMENT: December 29, 1999
ASSET ALLOCATION: Govt. Securities Money Market Instruments/Call Money : 0% - 100%.
MINIMUM INVESTMENT: Lumpsum: ̀ 5000 in multiples of ̀ 1 thereafter.SIP/STP/SWP: For monthly frequency - ̀ 1000 and in multiples of ̀ 1 thereafterFor quarterly frequency - ` 2000 and in multiples of ̀ 1 thereafter
PLANS / OPTIONS : Regular Plan- Growth Option Regular Plan- Dividend Reinvestment Option/ Payout Option
Direct Plan- Growth OptionDirect Plan- Dividend Reinvestment Option/ Payout Option
ENTRY LOAD: Nil
Expense Ratio^:
Regular Plan : 1.25%
Direct Plan : 0.70%
BENCHMARK: I-Sec-Li-Bex
FUND MANAGER: Mr. Girish Hisaria
TOTAL EXPERIENCE: 13 Years
In Managing this Fund: Since 24-Aug-14
#Monthend AUM : ` 65.37 Crores
Monthly AVG AUM : ` 66.49 Crores
EXIT LOAD : Nil
(as on April 29,2016)
RISKOMETER
Treasury Bills/Sovereign 88.36%
CBLO/REPO/Reverse Repo & Net Current Assets 11.64%

$ (for remaining disclaimer Please refer page no. 39) Monthend AUM as on 29.04.2016 = ^The expense ratios mentioned for the schemes excludes additional service tax on investment management fees.
= Please refer page no. 39 for disclaimers.
Source ICRA MFI Explorer = #
CANARA ROBECO DYNAMIC BOND FUND (CRDBF)
PRODUCT POSITIONING
Canara Robeco Dynamic Bond Fund intends to invest and trade in G-secs and Corporate Debt by identifying mispriced opportunities & capturing volatility trends. The fund aims at generating Alpha through free-style duration management depending on the interest rate view. At the same time it endeavours to capture accruals in the form of portfolio running yields on high-quality debt instruments.
PORTFOLIO
Name of the Instruments Rating % to NAV
Debt Instruments 18.30Rural Electrification Corporation Ltd AAA(CRISIL) 6.36Vedanta Ltd AA-(CRISIL) 5.55Power Grid Corporation of India Ltd AAA(CRISIL) 3.20Power Grid Corporation of India Ltd AAA(CRISIL) 3.19
Government Securities 71.617.59% GOI 20-MAR-29 Sovereign 38.177.72% GOI 25-MAY-25 Sovereign 32.138.15% GOI 24-NOV-26 Sovereign 1.31
Reverse REPO 34.00
Other Current Assets -23.91
Grand Total ( Net Asset) 100.00
QUANTITATIVE INFORMATION $
Yield to Maturity 7.44%
Modified Duration 4.74 Years
Average Maturity 7.42 Years
lIncome/ Capital appreciation over short to medium term
lInvestment in Debt and Money Market securities
This product is suitable for investors who are seeking*:
*Investors should consult their financial advisers if in doubt whether the product is suitable for them
18
Investors understand that their principalwill be at Moderate Risk
ASSET ALLOCATION
RATING PROFILE (% to net assets)
% Allocation
Net Current Assets -23.91%
0 to 3 Months 34.00%
1 -2 years 5.55%
Greater than 2 years 84.36%
MATURITY PROFILE
FUND INFORMATION
CATEGORY: Open Ended Debt Scheme
SCHEME OBJECTIVE: The objective of the Fund is to seek to generate income from a portfolio of debt and money market securities. However, there can be no assurance that the investment objective of the scheme will be realized and the Fund does not assure or guarantee any returns.
NAV: (as on April 29, 2016)Direct Plan - Dividend Option ` 13.5905Direct Plan - Growth Option ` 17.1500Regular Plan - Dividend Option ` 13.3734Regular Plan - Growth Option ` 16.8980
DATE OF ALLOTMENT: May 29, 2009
ASSET ALLOCATION: Government of india & Corporate Debt Securities
@(including Securitised Debt) : 0% - 100% Money Market Instruments : 0% - 100%.
@Excluding Debt/GOI Securities with initial maturity of less than one year and Treasury bills.
MINIMUM INVESTMENT : Lumpsum: ̀ 5000 in multiples of ̀ 1 thereafter.Subsequent purchases: Minimum amount of ` 1,000 and multiples of ̀ 1 thereafter.SIP/STP/SWP: For monthly frequency - ̀ 1000 and in multiples of ̀ 1 thereafter .For quarterly frequency - ` 2000 and in multiples of ̀ 1 thereafter.
PLANS / OPTIONS :Regular Plan - GrowthRegular Plan - Dividend ReinvestmentRegular Plan - Dividend Payout
Direct Plan- Growth OptionDirect Plan- Dividend Reinvestment Option/ Payout Option
Entry Load: Nil
Expense Ratio^:
Regular Plan : 1.75%
Direct Plan : 1.04%
Benchmark: CRISIL Composite Bond Fund Index
Fund Manager: Mr. Girish Hisaria
Total Experience: 13 Years
In Managing this Fund: Since 24-Aug-14
#Monthend AUM : ` 156.68 Crores
Monthly AVG AUM : ` 152.02 Crores
Exit Load:0.50% - If redeemed / switched out within six months from the date of allotment,Nil - if redeemed / switched out after six months from the date of allotment
(as on April 29,2016)
RISKOMETER
CBLO/REPO/Reverse Repo & Net Current Assets 10.10%
AA- & Equivalent5.55%
Treasury Bills/Sovereign 71.61%
AAA & Equivalent12.75%
CBLO/REPO/Reverse Repo & Net Current Assets 10.10%
NCDs/Bonds18.30%
Treasury Bills/ Sovereign71.61%
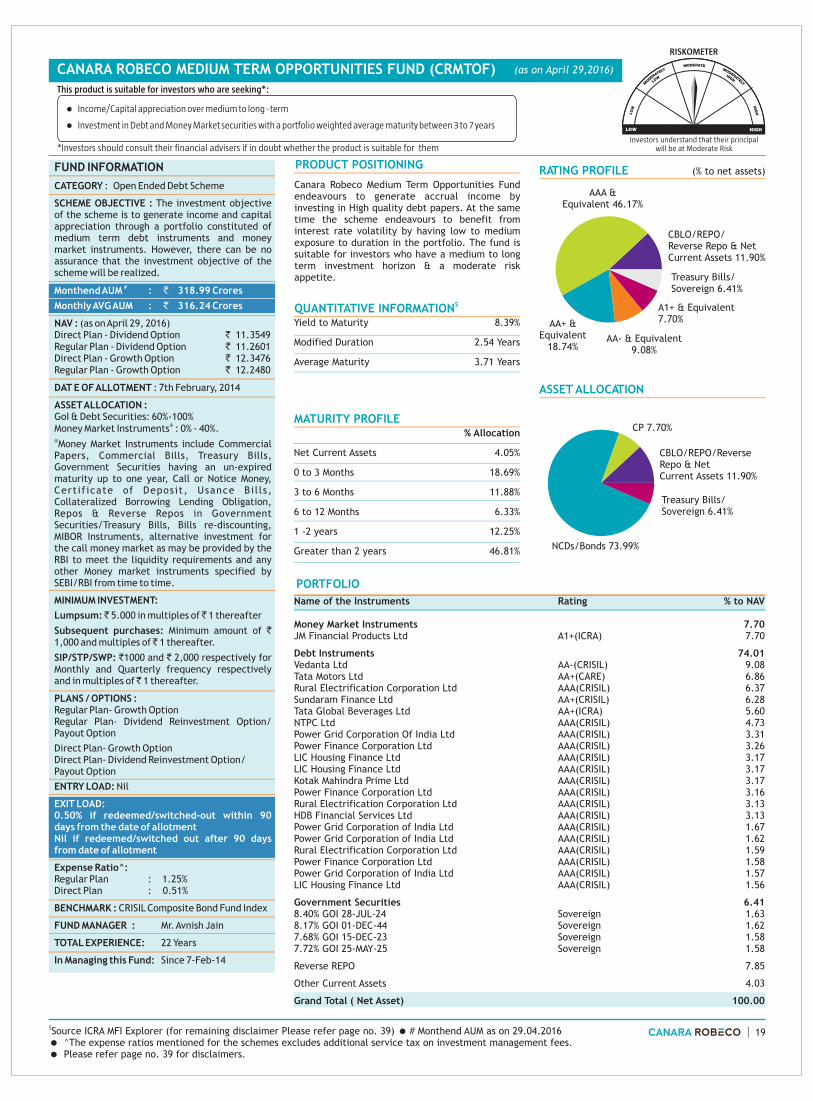
$ (for remaining disclaimer Please refer page no. 39) Monthend AUM as on 29.04.2016 = ^The expense ratios mentioned for the schemes excludes additional service tax on investment management fees. = Please refer page no. 39 for disclaimers.
Source ICRA MFI Explorer = #
CANARA ROBECO MEDIUM TERM OPPORTUNITIES FUND (CRMTOF)
PRODUCT POSITIONING
Canara Robeco Medium Term Opportunities Fund endeavours to generate accrual income by investing in High quality debt papers. At the same time the scheme endeavours to benefit from interest rate volatility by having low to medium exposure to duration in the portfolio. The fund is suitable for investors who have a medium to long term investment horizon & a moderate risk appetite.
ASSET ALLOCATION
PORTFOLIO
Name of the Instruments % to NAV
Money Market Instruments 7.70JM Financial Products Ltd A1+(ICRA) 7.70
Debt Instruments 74.01Vedanta Ltd AA-(CRISIL) 9.08Tata Motors Ltd AA+(CARE) 6.86Rural Electrification Corporation Ltd AAA(CRISIL) 6.37Sundaram Finance Ltd AA+(CRISIL) 6.28Tata Global Beverages Ltd AA+(ICRA) 5.60NTPC Ltd AAA(CRISIL) 4.73Power Grid Corporation Of India Ltd AAA(CRISIL) 3.31Power Finance Corporation Ltd AAA(CRISIL) 3.26LIC Housing Finance Ltd AAA(CRISIL) 3.17LIC Housing Finance Ltd AAA(CRISIL) 3.17Kotak Mahindra Prime Ltd AAA(CRISIL) 3.17Power Finance Corporation Ltd AAA(CRISIL) 3.16Rural Electrification Corporation Ltd AAA(CRISIL) 3.13HDB Financial Services Ltd AAA(CRISIL) 3.13Power Grid Corporation of India Ltd AAA(CRISIL) 1.67Power Grid Corporation of India Ltd AAA(CRISIL) 1.62Rural Electrification Corporation Ltd AAA(CRISIL) 1.59Power Finance Corporation Ltd AAA(CRISIL) 1.58Power Grid Corporation of India Ltd AAA(CRISIL) 1.57LIC Housing Finance Ltd AAA(CRISIL) 1.56
Government Securities 6.418.40% GOI 28-JUL-24 Sovereign 1.638.17% GOI 01-DEC-44 Sovereign 1.627.68% GOI 15-DEC-23 Sovereign 1.587.72% GOI 25-MAY-25 Sovereign 1.58
Reverse REPO 7.85
Other Current Assets 4.03
Grand Total ( Net Asset) 100.00
Rating
RATING PROFILE (% to net assets)
QUANTITATIVE INFORMATION $
Yield to Maturity 8.39%
Modified Duration 2.54 Years
Average Maturity 3.71 Years
MATURITY PROFILE% Allocation
Net Current Assets 4.05%
0 to 3 Months 18.69%
3 to 6 Months 11.88%
6 to 12 Months 6.33%
1 -2 years 12.25%
Greater than 2 years 46.81%
lIncome/Capital appreciation over medium to long - term
lInvestment in Debt and Money Market securities with a portfolio weighted average maturity between 3 to 7 years
This product is suitable for investors who are seeking*:
*Investors should consult their financial advisers if in doubt whether the product is suitable for them
19
Investors understand that their principalwill be at Moderate Risk
(as on April 29,2016)
FUND INFORMATION
CATEGORY : Open Ended Debt Scheme
SCHEME OBJECTIVE : The investment objective of the scheme is to generate income and capital appreciation through a portfolio constituted of medium term debt instruments and money market instruments. However, there can be no assurance that the investment objective of the scheme will be realized.
NAV : Direct Plan - Dividend Option 11.3549Regular Plan - Dividend Option ` 11.2601Direct Plan - Growth Option ` 12.3476Regular Plan - Growth Option ` 12.2480
DAT E OF ALLOTMENT : 7th February, 2014
ASSET ALLOCATION : GoI & Debt Securities: 60%-100%
@Money Market Instruments : 0% - 40%.@Money Market Instruments include Commercial Papers, Commercial Bills, Treasury Bills, Government Securities having an un-expired maturity up to one year, Call or Notice Money, Certif icate of Deposit, Usance Bi l ls, Collateralized Borrowing Lending Obligation, Repos & Reverse Repos in Government Securities/Treasury Bills, Bills re-discounting, MIBOR Instruments, alternative investment for the call money market as may be provided by the RBI to meet the liquidity requirements and any other Money market instruments specified by SEBI/RBI from time to time.
MINIMUM INVESTMENT:
Lumpsum: ̀ 5.000 in multiples of ̀ 1 thereafter
Subsequent purchases: Minimum amount of ` 1,000 and multiples of ̀ 1 thereafter.
SIP/STP/SWP: `1000 and ` 2,000 respectively for Monthly and Quarterly frequency respectively and in multiples of ̀ 1 thereafter.
PLANS / OPTIONS : Regular Plan- Growth Option Regular Plan- Dividend Reinvestment Option/ Payout Option
Direct Plan- Growth OptionDirect Plan- Dividend Reinvestment Option/Payout Option
ENTRY LOAD: Nil
Expense Ratio^:Regular Plan : 1.25%Direct Plan : 0.51%
BENCHMARK : CRISIL Composite Bond Fund Index
FUND MANAGER : Mr. Avnish Jain
22 Years
#Monthend AUM : ` 318.99 Crores
Monthly AVG AUM : ` 316.24 Crores
EXIT LOAD: 0.50% if redeemed/switched-out within 90 days from the date of allotmentNil if redeemed/switched out after 90 days from date of allotment
(as on April 29, 2016)`
TOTAL EXPERIENCE:
In Managing this Fund: Since 7-Feb-14
RISKOMETER
CBLO/REPO/Reverse Repo & Net Current Assets 11.90%
AAA & Equivalent 46.17%
AA+ & Equivalent
18.74%
Treasury Bills/Sovereign 6.41%
AA- & Equivalent9.08%
A1+ & Equivalent7.70%
CBLO/REPO/Reverse Repo & Net Current Assets 11.90%
NCDs/Bonds 73.99%
Treasury Bills/ Sovereign 6.41%
CP 7.70%

Investors understand that their principalwill be at Moderately Low Risk
$ (for remaining disclaimer Please refer page no. 39)= # Monthend AUM as on 29.04.2016 ^The expense ratios mentioned for the schemes excludes additional
service tax on investment management fees. = Please refer page no. 39 for disclaimers.
Source ICRA MFI Explorer =
=** Plan / Option close for subscription w.e.f 1st October 2012
CANARA ROBECO SHORT TERM FUND (CRSTF)
PRODUCT POSITIONING
Canara Robeco Short Term Fund is perfectly suited
for an investor who has a short term investment
horizon of 6 to 9 months and wishes to avoid high
volatility. In terms of risk return, Canara Robeco
Short Term Fund is positioned between Floating
Rate Funds & Medium Term Funds. The fund
generates income predominantly from accrual
yields on high quality Money Market Instruments,
while an active trading strategy is followed for
generating Alpha.
QUANTITATIVE INFORMATION $
Yield to Maturity 7.69%
Modified Duration 1.22 Years
Average Maturity 1.52 Years
PORTFOLIO
Name of the Instruments Rating % to NAV
Money Market Instruments 35.75Axis Bank Ltd A1+(CRISIL) 7.24Allahabad Bank A1+(ICRA) 7.23IDFC Bank Ltd A1+(ICRA) 7.23Godrej Industries Ltd A1+(ICRA) 7.21ICICI Bank Ltd A1+(ICRA) 6.84
Debt Instruments 50.26Power Grid Corporation of India Ltd AAA(CRISIL) 7.37Power Finance Corporation Ltd AAA(CRISIL) 7.35Can Fin Homes Ltd AAA(CARE) 7.34L&T Infrastructure Finance Ltd AA+(CARE) 7.29Rural Electrification Corporation Ltd AAA(CRISIL) 3.68Rural Electrification Corporation Ltd AAA(CRISIL) 3.68Kotak Mahindra Prime Ltd AAA(CRISIL) 3.67LIC Housing Finance Ltd AAA(CRISIL) 3.67L&T Housing Finance Ltd AA+(CARE) 3.64Indiabulls Housing Finance Ltd AAA(CARE) 1.45Housing Development Finance Corporation Ltd AAA(CRISIL) 1.12
Reverse REPO 12.06
Other Current Assets 1.93
Grand Total ( Net Asset) 100.00
ASSET ALLOCATION
RATING PROFILE (% to net assets)
% Allocation
Net Current Assets 1.91%
0 to 3 Months 40.97%
6 to 12 Months 17.85%
1 -2 years 10.93%
Greater than 2 years 28.34%
lIncome / capital appreciation over short term
lInvesting in short term to medium term debt and money market securities
This product is suitable for investors who are seeking*:
*Investors should consult their financial advisers if in doubt whether the product is suitable for them
20
FUND INFORMATION
CATEGORY: Open Ended Debt Scheme
SCHEME OBJECTIVE: The objective of the Fund is to generate income from a portfolio constituted of short to medium term debt and money market securities. However, there can be no assurance that the investment objective of the scheme will be realized.
NAV: (as on April 29, 2016)
Direct Plan - Growth Option ` 17.4301
Institutional Plan - Growth Option** ` 18.2110
Direct Plan - Monthly Dividend Option ` 10.2236
Regular Plan - Growth Option ` 17.2007
Regular Plan -
Monthly Dividend Option ` 10.2186
Regular Plan - Weekly Dividend Option ` 10.1238
Direct Plan - Weekly Dividend Option ` 10.1241
DATE OF ALLOTMENT: March 31, 2009
ASSET ALLOCATION:
Money Market Instruments/Debt Securities with less than 2 years residual maturity - 65% - 100%
Debt Securities with less than 5 years residual maturity (including Securitised Debt) - 0% - 35%
MINIMUM INVESTMENT :
Lumpsum: ̀ 5000 in multiples of ̀ 1 thereafter.
Subsequent purchases: Minimum amount of ` 1,000 and multiples of ̀ 1 thereafter.
SIP/STP/SWP: For monthly frequency - ̀ 1000 and in multiples of ̀ 1 thereafter .
For quarterly frequency - ` 2000 and in multiples of ̀ 1 thereafter.
PLANS / OPTIONS :
Regular Plan - Growth
Regular Plan - Weekly Dividend Reinvestment
Regular Plan - Monthly Dividend Reinvestment
Regular Plan - Monthly Dividend Payout
Direct Plan - Growth
Direct Plan - Weekly Dividend Reinvestment
Direct Plan - Monthly Dividend Reinvestment
Direct Plan - Monthly Dividend Payout
ENTRY LOAD: Nil
Expense Ratio^:
Regular Plan : 1.10%
Direct Plan : 0.60%
BENCHMARK : CRISIL Short Term Bond Fund Index
FUND MANAGER: Ms. Suman Prasad
TOTAL EXPERIENCE: 18 Years
In Managing this Fund: Since 12-Apr-11
#Monthend AUM : ` 137.34 Crores
Monthly AVG AUM : ` 136.36 Crores
EXIT LOAD :0.25% if redeemed/switched out within 60 days from the date of allotment.Nil - if redeemed/switched out after 60 days from the date of allotment.
(as on April 29,2016)
RISKOMETER
AAA & Equivalent 39.34%
A1+ & Equivalent 35.75%
AA+ & Equivalent
10.93%
CBLO/REPO/Reverse Repo & Net Current Assets 13.97%
CBLO/REPO/Reverse Repo & Net Current Assets 13.97%
NCDs/Bonds 50.28%
CDs 28.54%
CP 7.21%

$ (for remaining disclaimer Please refer page no. 39) Monthend AUM as on 29.04.2016 = ^The expense ratios mentioned for the schemes excludes additional service tax on investment management fees. = Please refer page no. 39 for disclaimers.
Source ICRA MFI Explorer = # 21
Investors understand that their principalwill be at Moderately Low Risk
RISKOMETER
FUND INFORMATION
PORTFOLIO
Name of the Instruments Rating % to NAV
Money Market Instruments 78.19Axis Bank Ltd A1+(CRISIL) 7.63Corporation Bank A1+(CRISIL) 4.60ICICI Bank Ltd A1+(ICRA) 4.60IDFC Bank Ltd A1+(ICRA) 4.05Dewan Housing Finance Corporation Ltd A1+(CRISIL) 4.05Indian Railway Finance Corporation Ltd A1+(CRISIL) 4.03State Bank Of Hyderabad A1+(ICRA) 3.97IDBI Bank Ltd A1+(CRISIL) 3.97JM Financial Products Ltd A1+(ICRA) 3.95Corporation Bank A1+(CRISIL) 3.85Export Import Bank Of India A1+(CRISIL) 3.85National Bank For Agriculture & Rural Development A1+(CRISIL) 3.85Andhra Bank A1+(CARE) 3.84IDBI Bank Ltd A1+(CRISIL) 3.84Andhra Bank A1+(CARE) 3.83Yes Bank Ltd A1+(ICRA) 3.82HDFC Bank Ltd A1+(CARE) 3.82Godrej Industries Ltd A1+(ICRA) 3.23Vijaya Bank A1+(CARE) 2.60Housing Development Finance Corporation Ltd A1+(ICRA) 0.81Debt Instruments 20.28Mahindra & Mahindra Financial Services Ltd AA+(CRISIL) 4.07Indiabulls Housing Finance Ltd AAA(CARE) 3.26Vedanta Ltd AA-(CRISIL) 3.15Mahindra & Mahindra Financial Services Ltd AA+(CRISIL) 2.45Rural Electrification Corporation Ltd AAA(CRISIL) 2.44Power Finance Corporation Ltd AAA(CRISIL) 1.64Bajaj Finance Ltd AAA(IND) 1.64Bajaj Finance Ltd AA+(CRISIL) 1.63Reverse REPO 1.35Other Current Assets 0.18
Grand Total ( Net Asset) 100.00
RATING PROFILE (% to net assets)
ASSET ALLOCATION
PRODUCT POSITIONING
Canara Robeco Savings Plus Fund aims at primarily generating accrual income from investments in money market and debt securities. The Scheme is ideally suited for investors looking at a comparatively lower risk strategy short term debt fund.
QUANTITATIVE INFORMATION$
Yield to Maturity 7.77%
Modified Duration 0.92 Years
Average Maturity 1.09 Years
MATURITY PROFILE
% Allocation
Net Current Assets 0.21%
0 to 3 Months 17.52%
3 to 6 Months 11.89%
6 to 12 Months 50.12%
1 -2 years 9.66%
Greater than 2 years 10.60%
lIncome / Capital Appreciation Over Short Term
lInvesting in Short Term Debt Instruments and Money Market Instruments with Weighted Average Portfolio Duration of Equal to or Less Than 1 Year
This product is suitable for investors who are seeking*:
*Investors should consult their financial advisers if in doubt whether the product is suitable for them
TOTAL EXPERIENCE: 1)2) 18 Years
In Managing this Fund: 1) Since 24-Aug-142) Since 12-Apr-11
13 Years
CATEGORY : Open Ended Debt Scheme
SCHEME OBJECTIVE : The fund seeks to generate income by investing in a portfolio comprising of short term debt instruments and money market instruments with weighted average portfolio duration of equal to or less than 1 year. However, there can be no assurance that the investment objective of the scheme will be realized.
NAV : Regular Plan - Daily Dividend Reinvestment Option ` 10.2600Direct Plan - Daily Dividend Reinvestment Option ` 10.2600Direct Plan - Dividend Option ` 21.3726Regular Plan - Dividend Option ` 21.2637Direct Plan - Growth Option ` 23.8645Regular Plan - Growth Option ` 23.7423Direct Plan - Monthly Dividend Option ` 10.2623Regular Plan - Monthly Dividend Option ` 10.2622Regular Plan - Weekly Dividend Option ` 10.2622Direct Plan - Weekly Dividend Option ` 10.2623
DATE OF ALLOTMENT : March 4, 2005
ASSET ALLOCATION : Indian Money Market Instruments : 70% - 100%Indian Debt Securities : 0-30%
MINIMUM INVESTMENT : Lumpsum: ̀ 5000 in multiples of ̀ 1 thereafterSIP/STP/SWP: For monthly frequency - ̀ 1000 and in multiples of ̀ 1 thereafterFor quarterly frequency - ̀ 2000 and in multiples of ̀ 1 thereafter
PLANS / OPTIONS :Regular Plan-Growth OptionRegular Plan- Dividend Reinvestment / Payout Option Regular Plan-Daily Dividend Reinvestment OptionRegular Plan-Weekly Dividend Payout/ Reinvestment OptionRegular Plan- Monthly Dividend Payout/ Reinvestment Option
Direct Plan-Growth OptionDirect Plan- Dividend Reinvestment / Payout OptionDirect Plan-Daily Dividend Reinvestment OptionDirect Plan-Weekly Dividend Payout/ Reinvestment OptionDirect Plan- Monthly Dividend Payout/ Reinvestment Option
ENTRY LOAD: Nil
BENCHMARK: Crisil Liquid Fund Index
FUND MANAGER: 1) Mr. Girish Hisaria2) Ms. Suman Prasad
#Monthend AUM : ` 613.41 Crores
Monthly AVG AUM : ` 614.97 Crores
(as on April 29, 2016)
Expense Ratio^:
Regular Plan : 0.55%
Direct Plan : 0.35%
EXIT LOAD: Nil
CBLO/REPO/Reverse Repo & Net Assets 1.56%
Current
AAA & Equivalent 8.98%
AA- & Equivalent 3.15% AA+ &
Equivalent 8.14%
A1+ & Equivalent 78.17%
CDs 62.10%
CP 16.07%
NCDs/Bonds20.27%
CBLO/REPO/Reverse Repo & Net Assets 1.56%
Current
CANARA ROBECO SAVINGS PLUS FUND (CRSPF) (as on April 29,2016)

$ (for remaining disclaimer Please refer page no. 39)= # Monthend AUM as on 29.04.2016 ^The expense ratios mentioned for the schemes excludes additional
service tax on investment management fees.= Please refer page no. 39 for disclaimers.
Source ICRA MFI Explorer =
=** Plan / Option close for subscription w.e.f 1st October 2012
CANARA ROBECO TREASURY ADVANTAGE FUND (CRTAF)
QUANTITATIVE INFORMATION $
Yield to Maturity 7.50%
Modified Duration 0.55 Years
Average Maturity 0.63 Years
ASSET ALLOCATION
RATING PROFILE (% to net assets)
PORTFOLIO
Name of the Instruments Rating % to NAV
Money Market Instruments 91.85Cholamandalam Investment & Finance Co Ltd A1+(ICRA) 24.34Axis Bank Ltd A1+(CRISIL) 11.08IDFC Bank Ltd A1+(ICRA) 11.07ICICI Bank Ltd A1+(ICRA) 10.48Corporation Bank A1+(CRISIL) 10.48Vijaya Bank A1+(CARE) 8.37IDBI Bank Ltd A1+(CRISIL) 5.55Andhra Bank A1+(CARE) 5.25Yes Bank Ltd A1+(ICRA) 5.23
Debt Instruments 5.63Power Finance Corporation Ltd AAA(CRISIL) 5.63
Reverse REPO 3.58
Other Current Assets -1.06
Grand Total ( Net Asset) 100.00
Canara Robeco Treasury Advantage Fund seeks to provide consistent income and liquidity through investments made primarily in money market and debt securities following a low risk strategy. The portfolio duration of the fund tends to be slightly higher than a liquid fund.
MATURITY PROFILE
% Allocation
Net Current Assets -1.05%
0 to 3 Months 55.62%
6 to 12 Months 39.80%
Greater than 2 years 5.63%
lIncome / capital appreciation over short term through a low risk strategy
lInvestment in a mix of Money Market Instrument & Debt Securities
This product is suitable for investors who are seeking*:
*Investors should consult their financial advisers if in doubt whether the product is suitable for them
22
Investors understand that their principalwill be at Moderately Low Risk
FUND INFORMATION
CATEGORY: Open Ended Debt Scheme
SCHEME OBJECTIVE: To generate income/capital appreciation through a low risk strategy by investment in Debt Securities and Money Market Instruments. However, there can be no assurance that the investment objective of the scheme will be realized.
NAV: (as on April 29, 2016)Direct Plan - Daily Dividend Reinvestment Option `1,240.7100Direct Plan - Dividend Option `1,338.5525Direct Plan - Growth Option `2,337.2438Institutional Plan - Daily Dividend Option** `1,240.7100Institutional Plan - Growth Option** `2,474.2016Direct Plan - Monthly Dividend Option `1,002.2087Retail Plan - Daily Dividend Option** `1,240.7100Retail Plan - Dividend Option** `1,658.8660Retail Plan - Growth Option** `2,410.3145Retail Plan - Monthly Divi. Option** `1,241.1731Retail Plan - Weekly Divi. Option** `1,241.1731Regular Plan - Daily Dividend Reinvestment Option** `1,240.7100Regular Plan - Growth Option `2,317.3630Regular Plan - Monthly Dividend Option `1,002.8425Regular Plan - Weekly Dividend Option `1,241.1942Direct Plan - Weekly Dividend Option `1,241.2419
DATE OF ALLOTMENT: Retail Plan : September 16, 2003Institutional Plan : August 21, 2007Regular Plan : July 14, 2008
ASSET ALLOCATION: MMI / Call / Debt Instruments with residual average maturity of equal or less than one year: 20% - 100%.Debt Instruments with residual average Maturity of more than one year (Including Securitised Debt) : 0% - 80%.
MINIMUM INVESTMENT : Lumpsum: ̀ 5000 in multiples of ̀ 1 thereafterSubsequent purchases: Minimum amount of ` 1,000 and multiples of ̀ 1 thereafter.SIP/STP/SWP: For monthly frequency - ̀ 1000 and in multiples of ̀ 1 thereafterFor quarterly frequency - ` 2000 and in multiples of ̀ 1 thereafter
PLANS / OPTIONS :Regular Plan - Growth OptionRegular Plan - Dividend Option : Daily Dividend ReinvestmentRegular Plan - Weekly Dividend ReinvestmentRegular Plan - Weekly Dividend PayoutRegular Plan - Monthly Dividend ReinvestmentRegular Plan - Monthly Dividend PayoutDirect Plan - Growth OptionDirect Plan - Dividend Option : Daily Dividend ReinvestmentDirect Plan - Weekly Dividend Reinvestment
#Monthend AUM : ` 89.71 Crores
Monthly AVG AUM : ` 94.99 Crores
Direct Plan - Weekly Dividend PayoutDirect Plan - Monthly Dividend ReinvestmentDirect Plan - Monthly Dividend PayoutDirect Plan - Dividend Payout
ENTRY LOAD: Nil
Expense Ratio^:
Regular Plan : 0.95%
Direct Plan : 0.25%
BENCHMARK: Crisil Liquid Fund Index
FUND MANAGER: 1) Mr. Girish Hisaria2) Ms. Suman Prasad
TOTAL EXPERIENCE: 1) 13 Years2) 18 Years
In Managing this Fund: 1) Since 24-Aug-142) Since 12-Apr-11
EXIT LOAD: Nil
(as on April 29,2016)
RISKOMETER
CBLO/REPO/Reverse Repo & Net
Assets 2.53%Current
AAA & Equivalent 5.63%
A1+ & Equivalent 91.84%
CDs 67.50%
CP 24.34%
CBLO/REPO/Reverse Repo & Net Current Assets 2.53%
NCDs/Bonds5.63%

Investors understand that their principalwill be at Low Risk
CANARA ROBECO LIQUID (CRL)
$ (for remaining disclaimer Please refer page no. 39)= # Monthend AUM as on 29.04.2016 ^The expense ratios mentioned for the schemes excludes
additional service tax on investment management fees.= Please refer page no. 39 for disclaimers.
Source ICRA MFI Explorer =
=** Plan / Option close for subscription w.e.f 1st October 2012
PRODUCT POSITIONING
Canara Robeco Liquid invests in only short-term money market instruments with a residual maturity upto 91 days. The fund aims to provide liquidity at all the time. The fund is suitable for investments with very short term horizon & to park surplus money.
QUANTITATIVE INFORMATION $
Yield to Maturity 7.51%
Modified Duration 0.09 Years
Average Maturity 0.10 Years
MATURITY PROFILE
% AllocationNet Current Assets 0.03%0 to 3 Months 99.97%
PORTFOLIO
Name of the Instruments Rating % to NAV
Money Market Instruments 98.16Syndicate Bank A1+(CARE) 9.26National Fertilizers Ltd A1+(CRISIL) 6.16National Bank For Agriculture & Rural Development A1+(CRISIL) 4.63Raymond Ltd A1+(CRISIL) 4.63Union Bank of India A1+(CRISIL) 3.09RBL Bank Ltd A1+(ICRA) 3.09Manappuram Finance Ltd A1+(CRISIL) 3.09IDBI Bank Ltd A1+(CRISIL) 3.08Axis Bank Ltd A1+(CRISIL) 3.08Dewan Housing Finance Corporation Ltd A1+(CRISIL) 3.08STCI Finance Ltd A1+(CRISIL) 3.08Godrej Industries Ltd A1+(ICRA) 3.08Vijaya Bank A1+(CARE) 2.78Small Industries Development Bank Of India A1+(CARE) 2.78Family Credit Ltd A1+(CARE) 2.78Allahabad Bank A1+(ICRA) 1.85RBL Bank Ltd 1.55Allahabad Bank A1+(ICRA) 1.55Andhra Bank A1+(CARE) 1.55RBL Bank Ltd 1.55Axis Finance Ltd A1+(IND) 1.55India Infoline Finance Ltd A1+(ICRA) 1.55India Infoline Finance Ltd A1+(ICRA) 1.55India Infoline Housing Finance Ltd A1+(ICRA) 1.55Vijaya Bank A1+(CARE) 1.54Andhra Bank A1+(CARE) 1.54Axis Bank Ltd A1+(CRISIL) 1.54Axis Bank Ltd A1+(CRISIL) 1.54ICICI Bank Ltd A1+(CRISIL) 1.54Cholamandalam Investment & Finance Co Ltd A1+(ICRA) 1.54ECL Finance Ltd A1+(CRISIL) 1.54Small Industries Development Bank Of India A1+(CARE) 1.54Reliance Capital Ltd A1+(ICRA) 1.54Dewan Housing Finance Corporation Ltd A1+(CRISIL) 1.54Navneet Education Ltd A1+(CRISIL) 1.54Mahindra & Mahindra Financial Services Ltd A1+(IND) 1.53IDBI Bank Ltd A1+(CRISIL) 1.24Syndicate Bank A1+(CARE) 1.24Housing Development Finance Corporation Ltd A1+(ICRA) 1.24National Bank For Agriculture & Rural Development A1+(CRISIL) 1.24Oriental Bank of Commerce A1+(CRISIL) 0.62IDFC Bank Ltd A1+(ICRA) 0.31IDBI Bank Ltd A1+(CRISIL) 0.31Union Bank of India A1+(CRISIL) 0.31Oriental Bank of Commerce A1+(CRISIL) 0.31Vijaya Bank A1+(CARE) 0.31Export Import Bank Of India A1+(CRISIL) 0.31Dewan Housing Finance Corporation Ltd A1+(CRISIL) 0.31Reverse REPO 1.41Treasury Bills 0.42Other Current Assets 0.01
Grand Total ( Net Asset) 100.00
lIncome/Capital appreciation over short term, while maintaining a level of high liquidity
lInvestment in a mix of Money Market Instrument & Debt Securities
This product is suitable for investors who are seeking*:
*Investors should consult their financial advisers if in doubt whether the product is suitable for them
23
FUND INFORMATIONCATEGORY: Open Ended Cash Management SchemeSCHEME OBJECTIVE: To enhance the income, while maintaining a level of liquidity through, investment in a mix of MMI & Debt securities. However, there can be no assurance that the investment objective of the scheme will be realized.
NAV: (as on April 29, 2016)Direct Plan - Daily Divi. Reinvestment Option `1,005.5000Direct Plan - Dividend Option `1,325.1628Direct Plan - Growth Option `1,850.9487Unclaimed Redmp & Dividend Plan-Direct Growth `1,005.3062Institutional Plan-Growth Option** `2,711.4631Insti. Plan-Daily Divi. Option** `1,005.5000Direct Plan-Monthly Divi. Option `1,000.8019Retail Plan-Monthly Divi. Option** `1,005.9018Retail Plan - Daily Divi. Option** `1,007.0000Retail Plan - Growth Option** `2,636.3015Retail Plan - Weekly Divi. Option** `1,005.9014Regular Plan - Daily Divi. Reinvestment Option `1,005.5000Regular Plan - Growth Option `1,847.9794Regular Plan - Monthly Divi. Option `1,000.7821Regular Plan - Weekly Divi. Option `1,000.7802Direct Plan - Weekly Divi. Option `1,000.7813DATE OF ALLOTMENT: Retail Plan : January 15, 2002Institutional Plan : May 31, 2004Regular Plan : July 15, 2008ASSET ALLOCATION: Money Market Instruments/call money:65%-100%Debt (including securitized debt) : 0% - 35%.MINIMUM INVESTMENT : Lumpsum: ̀ 5000 in multiples of ̀ 1 thereafterSubsequent purchases: Minimum amount of ` 1,000 and multiples of ̀ 1 thereafter.STP/SWP: For monthly frequency - ` 1000 and in multiples of ̀ 1 thereafterFor quarterly frequency - ` 2000 and in multiples of ̀ 1 thereafterPLANS / OPTIONS :Regular Plan - Growth OptionRegular Plan -Dividend Option : Daily Dividend ReinvestmentRegular Plan - Weekly Dividend ReinvestmentRegular Plan - Weekly Dividend payoutRegular Plan - Monthly Dividend ReinvestmentRegular Plan - Monthly Dividend PayoutDirect Plan - Growth OptionDirect Plan -Dividend Option : Daily Dividend ReinvestmentDirect Plan - Weekly Dividend ReinvestmentDirect Plan - Weekly Dividend payoutDirect Plan - Monthly Dividend ReinvestmentDirect Plan - Monthly Dividend PayoutDirect Plan - Dividend PayoutUnclaimed Redmp & Dividend Plan-Direct GrowthENTRY LOAD: Nil
Expense Ratio^:Regular Plan : 0.11% = Direct Plan : 0.09%BENCHMARK: Crisil Liquid Fund IndexFUND MANAGER: 1) Mr. Girish Hisaria
2) Ms. Suman PrasadTOTAL EXPERIENCE: 1)13 Years 2) 18 Years In Managing this Fund: 1) Since 24-Aug-14
2) Since 18-Mar-11
#Monthend AUM : ` 1,609.47 CroresMonthly AVG AUM : ` 1,914.47 Crores
EXIT LOAD: Nil
(as on April 29,2016)
RATING PROFILE (% to net assets) ASSET ALLOCATION
RISKOMETER
CBLO/REPO/Reverse Repo & Net Current Assets 1.44%
A1+ & Equivalent 98.12%
Treasury Bills/Sovereign 0.43%
CDs 41.66%
CP 53.36%
Fixed Deposit3.11%
CBLO/REPO/Reverse Repo & Net Current Assets 1.44%
Treasury Bills/ Sovereign0.43%

CBLO/REPO/Reverse Repo & Net Current Assets 27.54%
CP 8.53%
NCDs/Bonds 63.93%
$ (for remaining disclaimer Please refer page no. 39) Monthend AUM as on 29.04.2016 = ^The expense ratios mentioned for the schemes excludes additional service tax on investment management fees.
= Please refer page no. 39 for disclaimers.
Source ICRA MFI Explorer = #
CANARA ROBECO YIELD ADVANTAGE FUND (CRYAF)
PRODUCT POSITIONING
Canara Robeco Yield Advantage seeks to maximize returns through active management of the portfolio consisting of wide range of Debt and Money Market Instruments. The Fund takes Corporate Bond exposure (80-100%) with the aim to generate accrual returns. The scheme may also tactically allocate to money market and government securities (0-20%) to manage liquidity and generate capital appreciation
QUANTITATIVE INFORMATION $
Yield to Maturity 8.23%
Modified Duration 2.04 Years
Average Maturity 2.66 Years
MATURITY PROFILE
% Allocation
Net Current Assets 11.73%
0 to 3 Months 24.34%
1 -2 years 18.33%
Greater than 2 years 45.60%
PORTFOLIO
Name of the Instruments RATING % to NAV
Money Market Instruments 8.53Cholamandalam Investment & Finance Co Ltd A1+(ICRA) 8.53
Debt Instruments 63.93Power Grid Corporation of India Ltd AAA(CRISIL) 14.81Tata Motors Ltd AA+(CARE) 11.94Power Finance Corporation Ltd AAA(CRISIL) 8.92Indiabulls Housing Finance Ltd AAA(CARE) 8.58L&T Infrastructure Finance Ltd AA+(CARE) 5.74L&T Housing Finance Ltd AA+(CARE) 5.72Vedanta Ltd AA-(CRISIL) 5.53Blue Dart Express Ltd AA(ICRA) 1.34Blue Dart Express Ltd AA(ICRA) 0.77Blue Dart Express Ltd AA(ICRA) 0.58
Reverse REPO 15.81
Other Current Assets 11.73
Grand Total ( Net Asset) 100.00
ASSET ALLOCATION
RATING PROFILE (% to net assets)
lIncome/ Capital appreciation over medium term to long term.
lInvestment in a wide range of debt securities and Money Market Instruments of various maturities and risk profile and a small portion of investment in Equity and Equity Related Instruments
This product is suitable for investors who are seeking*:
*Investors should consult their financial advisers if in doubt whether the product is suitable for themInvestors understand that their principal
will be at Moderate Risk
FUND INFORMATION
CATEGORY: Open Ended Debt Scheme
SCHEME OBJECTIVE : To generate regular income by investing in a wide range of debt securities and Money Market Instruments of various maturities and risk profile and a small portion of investment in Equity and Equity Related Instruments. However, there can be no assurance that the investment objective of the Scheme will be realized.
NAV : (as on April 29, 2016)Direct Plan - Growth Option ` 14.5983Regular Plan - Growth Option ` 14.2470Direct Plan - Monthly Dividend Option ` 14.4103Regular Plan - Monthly Dividend Option ` 13.8783Regular Plan - Quarterly Dividend Option ` 14.0650Direct Plan - Quarterly Dividend Option ` 14.4178
DAT E OF ALLOTMENT : 25 April, 2011
ASSET ALLOCATION :
Indian Debt and Money Market Instruments: 90% - 100%
Equity and Equity related Instruments: 0% - 10%
MINIMUM INVESTMENT :
Lumpsum: ̀ 5.000 in multiples of ̀ 1 thereafter
SIP/STP/SWP: For monthly frequency - ̀ 1000 and in multiples of ̀ 1 thereafter
For quarterly frequency - ` 2000 and in multiples of ̀ 1 thereafter
PLANS/OPTIONS :
Regular Plan- Growth OptionRegular Plan- Monthly Dividend Payout / Reinvestment OptionRegular Plan- Quarterly Dividend Payout/ Reinvestment Option
Direct Plan- Growth OptionDirect Plan- Monthly Dividend Payout / Reinvestment OptionDirect Plan- Quarterly Dividend Payout/ Reinvestment Option
ENTRY LOAD: Nil
Expense Ratio^:
Regular Plan : 1.50%
Direct Plan : 0.77%
BENCHMARK: Crisil MIP Blended Index
FUND MANAGER : 1) Mr. Ravi Gopalakrishnan
2) Ms. Suman Prasad
TOTAL EXPERIENCE : 1) 23 Years
2) 18 Years
In Managing this Fund : 1) Since 16-Sep-12
2) Since 16-Sep-12
#Monthend AUM : ` 34.91 Crores
Monthly AVG AUM : ` 37.26 Crores
EXIT LOAD:
0.50% if redeemed/switched out within 180 days from the date of allotment.
Nil - if redeemed/switched out after 180 days from the date of allotment.
(as on April 29,2016)
24
RISKOMETER
CBLO/REPO/Reverse Repo & Net Current Assets 27.54%
AAA & Equivalent
32.31%
AA+ & Equivalent 23.41%
AA & Equivalent
2.69%
A1+ & Equivalent 8.53%
AA- & Equivalent5.53%

PORTFOLIO
Name of the Instruments % to NAV
Mutual Fund Investments 99.52Canara Robeco Gold ETF 99.52
Reverse REPO 0.73
Other Current Assets -0.25
Grand Total ( Net Asset) 100.00
$ (for remaining disclaimer Please refer page no. 39) Monthend AUM as on 29.04.2016 = ^The expense ratios mentioned for the schemes excludes additional service tax on investment management fees.= Please refer page no. 39 for disclaimers.
Source ICRA MFI Explorer = #
CANARA ROBECO GOLD SAVINGS FUND (CRGSF)
RATING PROFILE (% to net assets)
CBLO/REPO/Reverse Repo & Net Current Assets : 100.00%
PRODUCT POSITIONING
Canara Robeco Gold Savings Fund is aimed at investors who want to benefit from movements in gold prices without holding physical gold. It follows a passive investment strategy and seeks to provide returns that closely correspond to the returns provided by Canara Robeco Gold ETF.
ASSET ALLOCATION
lCapital appreciation that closely correspond to returns provided by Canara Robeco Gold Exchange Traded Fund
lInvestment in units of Canara Robeco Gold Exchange Traded Fund
This product is suitable for investors who are seeking*:
*Investors should consult their financial advisers if in doubt whether the product is suitable for them
MATURITY PROFILE
% Allocation
Net Current Assets -0.25%
Investors understand that their principalwill be at Moderately High Risk
(as on April 29,2016)
FUND INFORMATION
CATEGORY : An Open Ended Fund of Fund
SCHEME OBJECTIVE : The investment objective of the Scheme is to provide returns that closely correspond to the returns provided by Canara Robeco Gold Exchange Traded Fund .
NAV : Direct Plan - Dividend Option ` 9.2448Regular Plan - Dividend Option ` 9.2255Direct Plan - Growth Option ` 9.2583Regular Plan - Growth Option ` 9.2199
DAT E OF ALLOTMENT : June 25, 2012
ASSET ALLOCATION :
Units of Canara Robeco Gold ETF : 95%-100%Debt and Money Market Instruments (Including Cash Equivalent) and Mutual fund Schemes which invest predominantly in the money market securities or Liquid Schemes : 0%-5%
MINIMUM INVESTMENT:
Lumpsum: ̀ 5,000 in multiples of ̀ 1 thereafter
SIP/STP/SWP: - ̀ 500 and ̀ 1,000 respectively for Monthly and Quarterly frequency respectively and in multiples of ̀ 1 thereafter.
PLANS / OPTIONS :
Regular Plan- Growth Option Regular Plan- Dividend Reinvestment Option/ Payout OptionDirect Plan- Growth OptionDirect Plan- Dividend Reinvestment Option/Payout Option
ENTRY LOAD: Nil
Expense Ratio^:
Regular Plan : 0.80%Direct Plan : 0.44%
BENCHMARK : Price of Physical Gold
FUND MANAGER : 1) Mr. Avnish Jain2) Mr. Kiran Shetty
22 Years
#Monthend AUM : ` 74.63 Crores
Monthly AVG AUM : ` 73.76 Crores
EXIT LOAD:
2% if redeemed / switched – out within 1 year from the date of allotment
(as on April 29, 2016)
TOTAL EXPERIENCE: 1)2) 9 Years
In Managing this Fund: 1) Since 7-Oct-13
2) Since 25-Jun-15
25
RISKOMETER
Gold ETFs99.52%
CBLO/REPO/Reverse
Repo & Net Current Assets0.48%

$ (for remaining disclaimer Please refer page no. 39) Monthend AUM as on 29.04.2016 = ^The expense ratios mentioned for the schemes excludes additional service tax on investment management fees.
= Please refer page no. 39 for disclaimers.
Source ICRA MFI Explorer = # 26
CANARA ROBECO GOLD EXCHANGE TRADED FUND (CRGETF)
lCapital appreciation over long term that are in line with the performance of gold, subject to tracking errors
lInvestment predominantly in Gold bullion of 0.995 fineness
This product is suitable for investors who are seeking*:
*Investors should consult their financial advisers if in doubt whether the product is suitable for themInvestors understand that their principal
will be at Moderately High Risk
(as on April 29,2016)
PORTFOLIO
Name of the Instruments % to NAV
GOLD 995 1KG BAR 98.67
Reverse REPO 1.42
Other Current Assets -0.09
Grand Total ( Net Asset) 100.00
GOLD
PRODUCT POSITIONING
Canara Robeco Gold Exchange Traded Fund is for investors who want to benefit from movement in gold prices without holding physical gold. It follows passive investment strategy and is benchmarked to price of physical gold. It endeavours to track and provide returns similar to its benchmark ie. prices of domestic gold through investment in physical gold and money market instruments
RATING PROFILE (% to net assets)
CBLO/REPO/Reverse Repo & Net Current Assets : 100.00%
ASSET ALLOCATION
MATURITY PROFILE% Allocation
Net Current Assets -0.09%
TRACKING ERROR
Annualised Tracking error for Gold ETF as of 2016 is 0.08(Period: April 2013 to April 2016).
Source: Internal Calculation, Domestic Price of Gold- Nova Scotia Bank
April
FUND INFORMATION
CATEGORY : An Open Ended Exchange Traded Fund
SCHEME OBJECTIVE : The investment objective of the Scheme is to generate returns that are in line with the performance of gold, subject to tracking errors.
NAV : (as on April 29, 2016) : 2,836.1966
DAT E OF ALLOTMENT : 19th March 2012
ASSET ALLOCATION :
Physical Gold : 95%-100%
Debt & Money Market Instruments (including Cash & Cash equivalents): 0%-5%
The Scheme will invest in physical gold of the prescribed quality and standard.
MINIMUM INVESTMENT:
Directly with the Fund – Subscription / Redemption in exchange of Portfolio Deposit and Cash Component in creation unit size of 1,000 units and in multiples thereafter. # On the Exchange – 1 unit and in multiples of 1 unit thereafter.
# For Large Investors, subscriptions shall only be allowed by payment of requisite Cash through RTGS/NEFT or Funds Transfer Letter/ Transfer Cheque of a bank where the Scheme has a collection account.
PLANS / OPTIONS : Nil
Exchange Listed : National Stock Exchange / BSE
ENTRY LOAD: Nil -
Expense Ratio^:
Regular Plan : 1.00%Direct Plan : N.A.
BENCHMARK : Domestic Price of gold
FUND MANAGER : 1) Mr. Avnish Jain 2) Mr. Kiran Shetty
22 Years
#Monthend AUM : ` 83.07 Crores
Monthly AVG AUM : ` 81.70 Crores
EXIT LOAD: Nil - for redemption of the units through Stock Exchange.
`
TOTAL EXPERIENCE: 1)
2) 9 Years
In Managing this Fund: 1) Since 25-Jun-14
2) Since 1-Apr-12
Gold 98.67%
CBLO/REPO/Reverse
Repo & Net Current Assets1.33%
RISKOMETER

PERFORMANCE AT A GLANCE (as on March 31, 2016)
EQUITY SCHEMES
# # # $Scheme Benchmark = Additional Benchmark NAV per unit for since inception is as of and for others is as of beginning of the period. Load is not taken into consideration for computation of returns. Returns of dividend option under the scheme for the investor would be net of distribution tax as applicable.
= =31-March-2016
CANARA ROBECO INFRASTRUCTURE Fund Manager: Mr. Yogesh Patil
Period Returns (%) Current Value of Standard Investment of ` 10000
The past performance may or may not be sustained in the future. Returns are based on growth NAV of and are calculated on compounded annualized basis for a period of more than (or equal to) a year and absolute basis for a period less than a year. Inception Date: December 2, 2005
Regular plan
CANARA ROBECO EQUITY TAX SAVER Fund Manager: Mr. Krishna Sanghavi
Period Returns (%) Current Value of Standard Investment of ` 10000
The past performance may or may not be sustained in the future. Returns are based on dividend NAV of Regular plan assuming reinvestment of dividend and are calculated on compounded annualized basis for a period of more than (or equal to) a year and absolute basis for a period less than a year. Inception Date: March 31, 1993 = (w.e.f. 31.03.2016 Mr. Yogesh Patil is the Fund Manager of Canara Robeco Equity Tax Saver Fund)
CANARA ROBECO EMERGING EQUITIES Fund Manager: Mr. Ravi Gopalakrishnan / Mr. Krishna Sanghavi
Period Returns (%) Current Value of Standard Investment of ` 10000
The past performance may or may not be sustained in the future. Returns are based on growth NAV of and are calculated on compounded annualized basis for a period of more than (or equal to) a year and absolute basis for a period less than a year. Inception Date: March 11, 2005.
Regular plan
CANARA ROBECO EQUITY DIVERSIFIED Fund Manager: Mr. Ravi Gopalakrishnan
Period Returns (%) Current Value of Standard Investment of ` 10000
The past performance may or may not be sustained in the future. Returns are based on growth NAV of and are calculated on compounded annualized basis for a period of more than (or equal to) a year and absolute basis for a period less than a year. Inception Date: September 16, 2003
Regular plan
NAV Per Unit (`) Scheme Sensex Scheme
Since Inception (CAGR) 86.12 18.72 15.19 15.24 86120 58969 59283
31 Mar’2015 to ’2016 98.04 -12.16 -7.86 -9.36
14 to 15 70.11 39.84 31.93 24.89 NOT APPLICABLE
13 to 14 59.32 18.19 17.19 18.85
$ # ## # ##S&P BSE 200 S&P S&P BSE 200 S&P Sensex
31 Mar
31 Mar 31 Mar
31 Mar’20 31 Mar’20
’20 ’20
NAV Per Unit ( ) Scheme Scheme
Since Inception (CAGR) 35.21 12.95 10.66 10.58 35210 28488 28278
38.39 -8.28 -8.96 -9.36
23.13 65.97 28.32 24.89 NOT APPLICABLE
20.95 10.41 18.11 18.85
$ # ## # ## S&P BSE 100 S&P Sensex S&P BSE 100 S&P Sensex`
31 Mar’2015 to 31 Mar’2016
31 Mar’2014 to 31 Mar’2015
31 Mar’2013 to 31 Mar’2014
Scheme S&P BSE 100 Scheme
Since Inception (CAGR) 21.57 14.20 11.87 11.03 212628 132264 111123
25.94 -9.56 -8.96 -9.36
19.46 43.58 28.32 24.89 NOT APPLICABLE
17.15 17.84 18.11 18.85
$ # ## # ## NAV Per Unit ( ) S&P Sensex S&P BSE 100 S&P Sensex`
31 Mar’2015 to 31 Mar’2016
31 Mar’2014 to 31 Mar’2015
31 Mar’2013 to 31 Mar’2014
Scheme Nifty Free Float Scheme
Since Inception (CAGR) 56.59 16.96 13.62 12.55 56590 41062 36975
58.51 -3.28 -1.91 -9.36
31.44 86.10 50.96 24.89 NOT APPLICABLE
24.52 28.22 16.36 18.85
$ ## ## NAV Per Unit ( ) S&P Sensex S&P Sensex` Nifty Free Float # #Midcap 100 Midcap 100
31 Mar’2015 to 31 Mar’2016
31 Mar’2014 to 31 Mar’2015
31 Mar’2013 to 31 Mar’2014
CANARA ROBECO F.O.R.C.E FUND Fund Manager: Mr. Krishna Sanghavi / Mr. Hemang Kapasi
Period Returns (%) Current Value of Standard Investment of ` 10000
The past performance may or may not be sustained in the future. Returns are based on growth NAV and are calculated on compounded annualized basis for a period of more than (or equal to) a year and absolute basis for a period less than a year. Inception Date: September 14, 2009
Regular Plan Instt. Plan Nifty 50 Regular Plan Instt. Plan Nifty 50
Since Inception (CAGR) 23.44 13.89 13.91 7.54 7.06 23440 23460 16093 15629
25.31 -7.39 -7.38 -8.86 -9.36
16.97 49.15 49.09 26.65 24.89 NOT APPLICABLE
14.95 13.51 13.27 17.98 18.85
$ # ## # ## NAV Per Unit (`) S&P Sensex S&P Sensex
31 Mar’2015 to 31 Mar’2016
31 Mar’2014 to 31 Mar’2015
31 Mar’2013 to 31 Mar’2014
27
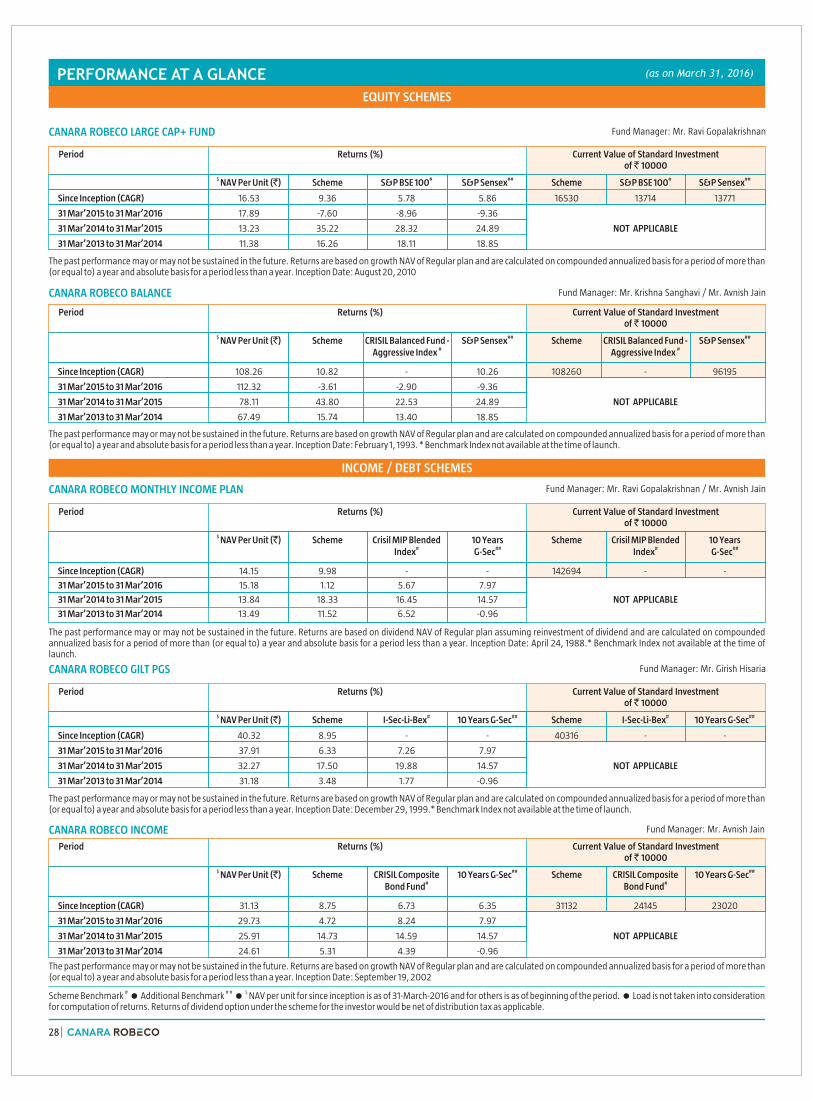
INCOME / DEBT SCHEMES
PERFORMANCE AT A GLANCE (as on March 31, 2016)
EQUITY SCHEMES
# # # $Scheme Benchmark = Additional Benchmark NAV per unit for since inception is as of and for others is as of beginning of the period. Load is not taken into consideration for computation of returns. Returns of dividend option under the scheme for the investor would be net of distribution tax as applicable.
= =31-March-2016
CANARA ROBECO LARGE CAP+ FUND Fund Manager: Mr. Ravi Gopalakrishnan
Period Returns (%) Current Value of Standard Investment of ` 10000
The past performance may or may not be sustained in the future. Returns are based on growth NAV of Regular plan and are calculated on compounded annualized basis for a period of more than (or equal to) a year and absolute basis for a period less than a year. Inception Date: August 20, 2010
NAV Per Unit ( ) Scheme Scheme
Since Inception (CAGR) 16.53 9.36 5.78 5.86 16530 13714 13771
17.89 -7.60 -8.96 -9.36
13.23 35.22 28.32 24.89 NOT APPLICABLE
11.38 16.26 18.11 18.85
$ # ## # ## S&P BSE 100 S&P Sensex S&P BSE 100 S&P Sensex`
31 Mar’2015 to 31 Mar’2016
31 Mar’2014 to 31 Mar’2015
31 Mar’2013 to 31 Mar’2014
CANARA ROBECO GILT PGS Fund Manager: Mr. Girish Hisaria
Period Returns (%) Current Value of Standard Investment of ` 10000
The past performance may or may not be sustained in the future. Returns are based on growth NAV of and are calculated on compounded annualized basis for a period of more than (or equal to) a year and absolute basis for a period less than a year. Inception Date: December 29, 1999.* Benchmark Index not available at the time of launch.
Regular plan
Scheme Scheme
Since Inception (CAGR) 40.32 8.95 - - 40316 - -
37.91 6.33 7.26 7.97
32.27 17.50 19.88 14.57 NOT APPLICABLE
31.18 3.48 1.77 -0.96
$ # # NAV Per Unit ( ) I-Sec-Li-Bex 10 Years I-Sec-Li-Bex 10 Years ## ##` G-Sec G-Sec
31 Mar’2015 to 31 Mar’2016
31 Mar’2014 to 31 Mar’2015
31 Mar’2013 to 31 Mar’2014
CANARA ROBECO BALANCE Fund Manager: Mr. Krishna Sanghavi / Mr. Avnish Jain
Period Returns (%) Current Value of Standard Investment of ` 10000
The past performance may or may not be sustained in the future. Returns are based on growth NAV of and are calculated on compounded annualized basis for a period of more than (or equal to) a year and absolute basis for a period less than a year. Inception Date: February 1, 1993. * Benchmark Index not available at the time of launch.
Regular plan
CANARA ROBECO MONTHLY INCOME PLAN Fund Manager: Mr. Ravi Gopalakrishnan / Mr. Avnish Jain
Period Returns (%) Current Value of Standard Investment of ` 10000
The past performance may or may not be sustained in the future. Returns are based on dividend NAV of Regular plan assuming reinvestment of dividend and are calculated on compounded annualized basis for a period of more than (or equal to) a year and absolute basis for a period less than a year. Inception Date: April 24, 1988.* Benchmark Index not available at the time of launch.
CANARA ROBECO INCOME Fund Manager: Mr. Avnish Jain
Period Returns (%) Current Value of Standard Investment of ` 10000
The past performance may or may not be sustained in the future. Returns are based on growth NAV of and are calculated on compounded annualized basis for a period of more than (or equal to) a year and absolute basis for a period less than a year.
Regular plan Inception Date: September 19, 2002
Scheme CRISIL Balanced Fund - Scheme
Since Inception (CAGR) 108.26 10.82 - 10.26 108260 - 96195
112.32 -3.61 -2.90 -9.36
78.11 43.80 22.53 24.89 NOT APPLICABLE
67.49 15.74 13.40 18.85
$ ## ## NAV Per Unit ( ) S&P Sensex S&P Sensex` CRISIL Balanced Fund -# # Aggressive Index Aggressive Index
31 Mar’2015 to 31 Mar’2016
31 Mar’2014 to 31 Mar’2015
31 Mar’2013 to 31 Mar’2014
Scheme 10 Years Scheme
Since Inception (CAGR) 14.15 9.98 - - 142694 - -
15.18 1.12 5.67 7.97
13.84 18.33 16.45 14.57 NOT APPLICABLE
13.49 11.52 6.52 -0.96
$ NAV Per Unit ( ) 10 Years `# ## # ##G-Sec G-Sec
31 Mar’2015 to 31 Mar’2016
31 Mar’2014 to 31 Mar’2015
31 Mar’2013 to 31 Mar’2014
Crisil MIP Blended Crisil MIP Blended Index Index
Scheme Scheme# #Bond Fund Bond Fund
Since Inception (CAGR) 31.13 8.75 6.73 6.35 31132 24145 23020
29.73 4.72 8.24 7.97
25.91 14.73 14.59 14.57 NOT APPLICABLE
24.61 5.31 4.39 -0.96
$ NAV Per Unit ( ) CRISIL Composite 10 Years CRISIL Composite 10 Years ## ##` G-Sec G-Sec
31 Mar’2015 to 31 Mar’2016
31 Mar’2014 to 31 Mar’2015
31 Mar’2013 to 31 Mar’2014
28

PERFORMANCE AT A GLANCE (as on March 31, 2016)
# # # $Scheme Benchmark = Additional Benchmark NAV per unit for since inception is as of and for others is as of beginning of the period. Load is not taken into consideration for computation of returns. Returns of dividend option under the scheme for the investor would be net of distribution tax as applicable.
= =31-March-2016
INCOME / DEBT SCHEMES
The past performance may or may not be sustained in the future. Returns are based on growth NAV of and are calculated on compounded annualized basis for a period of more than (or equal to) a year and absolute basis for a period less than a year.
Regular plan Inception Date: July 9, 2010
The past performance may or may not be sustained in the future. Returns are based on growth NAV of and are calculated on compounded annualized basis for a period of more than (or equal to) a year and absolute basis for a period less than a year.
Regular plan Inception Date: April 25, 2011
CANARA ROBECO YIELD ADVANTAGE FUND Fund Manager: Mr. Ravi Gopalakrishnan / Ms. Suman Prasad
Period Returns (%) Current Value of Standard Investment of ` 10000
CANARA ROBECO LIQUID Fund Manager: Mr. Girish Hisaria /Ms. Suman Prasad
Period Returns (%) Current Value of Standard Investment of ` 10000
The past performance may or may not be sustained in the future. Returns are based on growth NAV and are calculated on compounded annualized basis for a period of more than (or equal to) a year and absolute basis for a period less than a year. Inception Date: Retail Plan : January 15, 2002 =Institutional Plan : May 31, 2004 =Regular Plan : July 15, 2008. The face value was changed to ̀ 1000 w.e.f Aug 20, 2011
CANARA ROBECO TREASURY ADVANTAGE FUND Fund Manager: Mr. Girish Hisaria /Ms. Suman Prasad
Period Returns (%) Current Value of Standard Investment of ` 10000
The past performance may or may not be sustained in the future. Returns are based on growth NAV and are calculated on compounded annualized basis for a period of more than (or equal to) a year and absolute basis for a period less than a year. Inception Date: Retail Plan : September 16, 2003 =Institutional Plan : August 21, 2007 =Regular Plan : July 14, 2008. The face value was changed to ̀ 1000 w.e.f Aug 20, 2011
CANARA ROBECO SAVINGS PLUS FUND Fund Manager: Mr. Girish Hisaria /Ms. Suman Prasad
Period Returns (%) Current Value of Standard Investment of ` 10000
The past performance may or may not be sustained in the future. Returns are based on growth NAV of and are calculated on compounded annualized basis for a period of more than (or equal to) a year and absolute basis for a period less than a year. Inception Date: March 4, 2005
Regular plan
CANARA ROBECO INDIGO FUND Fund Manager: Mr. Avnish Jain / Mr. Kiran Shetty
Period Returns (%) Current Value of Standard Investment of ` 10000
Scheme Scheme
Since Inception (CAGR) 14.22 6.33 8.39 6.71 14216 15868 14513
13.55 4.89 9.73 7.97
13.21 2.59 4.46 14.57 NOT APPLICABLE
12.89 2.47 3.82 -0.96
$ NAV Per Unit ( ) 10 Years 10 Years ## ##` Robeco G-Sec Canara Robeco G-Sec# # Blended Gold Index Blended Gold Index
31 Mar’2015 to 31 Mar’2016
31 Mar’2014 to 31 Mar’2015
31 Mar’2013 to 31 Mar’2014
Canara
Scheme Scheme
Since Inception (CAGR) 14.14 6.65 8.54 7.27 14138 14987 14140
13.29 6.41 5.67 7.97
12.38 7.32 16.45 14.57 NOT APPLICABLE
11.55 7.17 6.52 -0.96
$ NAV Per Unit ( ) 10 Years 10 Years ## ##` Crisil MIP G-Sec Crisil MIP G-Sec# # Blended Index Blended Index
31 Mar’2015 to 31 Mar’2016
31 Mar’2014 to 31 Mar’2015
31 Mar’2013 to 31 Mar’2014
Retail # ## # ##Unit ( ) Plan Plan Plan Fund Index T-Bill Plan Plan Plan Fund Index T-Bill
Since Inception (CAGR) 2,620.72 7.01 7.40 8.20 - 5.94 26207 26950 18367 - 22711
2,429.41 7.87 8.11 8.12 8.06 7.69
2,246.19 8.16 8.64 8.95 8.98 8.74
2,076.71 8.16 8.82 9.39 9.54 5.84
Last 7 Days - 0.27 0.28 0.28 0.30 0.16 NOT APPLICABLE
Last 14 Days - 0.40 0.41 0.41 0.42 0.27
Last 30 Days - 0.76 0.78 0.77 0.84 0.64
$ NAV Per Instt. Regular Crisil Liquid 364 Day Retail Instt. Regular Crisil Liquid 364 Day `
31 Mar’2015 to 31 Mar’2016
31 Mar’2014 to 31 Mar’2015
31 Mar’2013 to 31 Mar’2014
Retail # ## # ##Unit ( ) Plan Plan Plan Fund Index Plan Plan Plan Fund Index
Since Inception (CAGR) 2,398.26 7.22 8.07 8.35 6.92 5.85 23983 24614 23052 23145 20400
2,223.81 7.84 8.09 8.18 8.06 7.69
2,048.87 8.54 9.02 9.36 8.98 8.74 NOT APPLICABLE
1,893.41 8.21 8.81 9.37 9.54 5.84
$ NAV Per Instt. Regular Crisil Liquid 364 Day Retail Instt. Regular Crisil Liquid 364 Day`
31 Mar’2015 to 31 Mar’2016
31 Mar’2014 to 31 Mar’2015
31 Mar’2013 to 31 Mar’2014
T-Bill T-Bill
Scheme Scheme# ## # ##Fund Index Fund Index
Since Inception (CAGR) 23.59 8.05 7.30 6.10 23589 21825 19284
21.77 8.36 8.06 7.69
19.98 8.96 8.98 8.74 NOT APPLICABLE
18.30 9.19 9.54 5.84
$ NAV Per Unit ( ) Crisil Liquid 364 Day Crisil Liquid 364 Day`
31 Mar’2015 to 31 Mar’2016
31 Mar’2014 to 31 Mar’2015
31 Mar’2013 to 31 Mar’2014
T-Bill T-Bill
29

CANARA ROBECO MEDIUM TERM OPPORTUNITIES FUND
Fund Manager: Mr. Avnish Jain
The past performance may or may not be sustained in the future. Returns are based on growth NAV of and are calculated on compounded annualized basis for a period of more than (or equal to) a year and absolute basis for a period less than a year.
Regular plan
Inception Date: 7th February, 2014
Period Returns (%)
PERFORMANCE AT A GLANCE (as on March 31, 2016)
INCOME / DEBT SCHEMES
# # # $Scheme Benchmark = Additional Benchmark NAV per unit for since inception is as of and for others is as of beginning of the period. Load is not taken into consideration for computation of returns. Returns of dividend option under the scheme for the investor would be net of distribution tax as applicable.
= =31-March-2016
The past performance may or may not be sustained in the future. Returns are based on growth NAV and are calculated on compounded annualized basis for a period of more than (or equal to) a year and absolute basis for a period less than a year. Inception Date: March 31, 2009 =The Benchmark of Canara Robeco Short Term Fund has been changed Crisil Liquid Fund Index to CRISIL Short Term Bond Fund Index with effect from 19th May, 2014.
CANARA ROBECO SHORT TERM FUND Fund Manager: Ms. Suman Prasad
Period Returns (%) Current Value of Standard Investment of ` 10000
Regular # ## # ##Unit ( ) Plan Plan Bond Fund Index G-Sec Plan Plan Index G-Sec
Since Inception (CAGR) 17.09 7.95 8.84 7.98 6.09 17095 18098 17120 15132
15.90 7.49 11.99 8.47 7.97
14.52 9.54 9.53 10.32 14.57 NOT APPLICABLE
13.42 8.15 7.99 8.86 -0.96
$ NAV Per Instt. Crisil Short Term 10 Years Regular Instt. 10 YearsCrisil Short Term` Bond Fund
31 Mar’2015 to 31 Mar’2016
31 Mar’2014 to 31 Mar’2015
31 Mar’2013 to 31 Mar’2014
CANARA ROBECO DYNAMIC BOND FUND Fund Manager: Mr. Girish Hisaria
Period Returns (%) Current Value of Standard Investment of ` 10000
The past performance may or may not be sustained in the future. Returns are based on growth NAVof and are calculated on compounded annualized basis for a period of more than (or equal to) a year and absolute basis for a period less than a year.
Regular plan Inception Date: May 29, 2009
Regular Scheme# ## # ##Bond Fund G-Sec Bond Fund G-Sec
Since Inception (CAGR) 16.75 7.83 7.63 5.72 16748 16544 14632
15.88 5.47 8.24 7.97
13.76 15.38 14.59 14.57 NOT APPLICABLE
12.93 6.40 4.39 -0.96
$ NAV Per Unit ( ) Crisil Composite 10 Years Crisil Composite 10 Years`Plan
31 Mar’2015 to 31 Mar’2016
31 Mar’2014 to 31 Mar’2015
31 Mar’2013 to 31 Mar’2014
The past performance may or may not be sustained in the future. Returns are based on growth NAV of and are calculated on compounded annualized basis for a period of more than (or equal to) a year and absolute basis for a period less than a year.
Regular plan Inception
Date: 25th June, 2012
CANARA ROBECO GOLD SAVINGS FUND
Fund Manager: Mr. Avnish Jain / Mr. Kiran Shetty
Period Returns (%)
Scheme Price of
Since Inception (CAGR) 8.79 -3.38 -0.54
8.33 5.51 11.45
9.29 -10.38 -5.57
$ NAV Per #Unit (`) Physical Gold
31 Mar’2015 to 31 Mar’2016
31 Mar’2014 to 31 Mar’2015
31 Mar’2013 to 31 Mar’2014 9.78 -4.98 -7.03
CANARA ROBECO GOLD EXCHANGE TRADED FUND
Fund Manager: Mr. Avnish Jain / Mr. Kiran Shetty
The past performance may or may not be sustained in the future. Returns are based on growth NAV of and are calculated on compounded annualized basis for a period of more than (or equal to) a year and absolute basis for a period less than a year.
Regular plan Inception
Date: 19th March, 2012
Period Returns (%)
Scheme Domestic Price
Since Inception (CAGR) 2,700.35 -0.87 1.22
2,523.86 6.99 11.45
$ NAV Per #Unit (`) of Gold
31 Mar’2015 to 31 Mar’2016
31 Mar’2014 to 31 Mar’2015 2,821.50 -10.55 -5.57
31 Mar’2013 to 31 Mar’2014 2,963.65 -4.80 -7.03
Scheme Crisil Composite
Since Inception (CAGR) 12.15 9.50 11.28 10.86
10.18 11.41 14.59 14.57
$ NAV Per #Unit (`) Bond Fund Index
##10 Years G-Sec
31 Mar’2015 to 31 Mar’2016 11.34 7.09 8.24 7.97
31 Mar’2014 to 31 Mar’2015
30

SIP RETURNS (as on March 31, 2016)
EQUITY SCHEMES
CANARA ROBECO EQUITY DIVERSIFIED Fund Manager: Mr. Ravi Gopalakrishnan
CANARA ROBECO EQUITY TAX SAVER Fund Manager: Mr. Krishna Sanghavi
CANARA ROBECO BALANCE Fund Manager: Mr. Krishna Sanghavi / Mr. Avnish Jain
CANARA ROBECO F.O.R.C.E FUND Fund Manager: Mr. Krishna Sanghavi / Mr. Hemang Kapasi
CANARA ROBECO EMERGING EQUITIES Fund Manager: Mr. Ravi Gopalakrishnan / Mr. Krishna Sanghavi
31
Since Inception 5 yr 3 yr 1 yr
Total Amt invested 790000 600000 360000 120000
Market Value 1220406 848022 431141 112804
Scheme Returns 13.03% 13.81% 12.07% -10.93%
NIFTY 50 7.41% 8.05% 5.19% -7.07%
Sensex 6.89% 7.42% 3.68% -8.21%
Inception Date 14-Sep-09
#
##S&P BSE
1. Investment date is taken to be 1st of the month or subsequent day if 1st is a holiday and investment of ̀ 10000 is taken. Returns are as on and are CAGR. 2. The calculations are # ## based on the regular growth plan NAVs. 3. Past performance may or may not be sustained in the future. Scheme Benchmark , Additional benchmark
31-March-2016
Since Inception 20 YR 15 YR 10 yr 7 yr 5 yr 3 yr 1 yr
Total Amt invested 2780000 2400000 1800000 1200000 840000 600000 360000 120000
Market Value 17541148 13785495 7474262 2380851 1356589 849455 438061 116651.3
Scheme Returns 13.75% 15.31% 17.20% 13.14% 13.45% 13.88% 13.17% -5.13%
CRISIL Balanced Fund - Aggressive Index NA NA NA 8.59% 8.39% 8.75% 7.09% -1.47%
Sensex 11.76% 12.22% 13.19% 7.37% 7.37% 7.42% 3.68% -8.21%
Inception Date 01-Feb-93
#
##S&P BSE
Since Inception 10 yr 7 yr 5 yr 3 yr 1 yr
Total Amt invested (INR) 1510000 1200000 840000 600000 360000 120000
Market Value (INR) 3968025 2235724 1228582 771028 399809 111654
Scheme Returns 14.36% 11.96% 10.68% 9.97% 6.93% -12.63%
#S&P BSE 200 10.96% 8.66% 8.57% 9.23% 6.78% -7.08%
Sensex 7.95% 7.37% 7.37% 7.42% 3.68% -8.21%
Inception Date 16-Sep-03
##S&P BSE
Since Inception 10 yr 7 yr 5 yr 3 yr 1 yr
Total Amt invested (INR) 1330000 1200000 840000 600000 360000 120000
Market Value (INR) 3964109 3339895 1915641 1128002 538078 114210
Scheme Returns 18.51% 19.43% 23.15% 25.54% 27.93% -8.82%
Nifty Free Float Midcap 100 12.15% 11.85% 12.58% 14.68% 16.58% -4.08%
Sensex 8.79% 7.37% 7.37% 7.42% 3.68% -8.21%
Inception Date
#
##S&P BSE
11-Mar-05
Since Inception 7 yr 5 yr 3 yr 1 yr
Total Amt invested (INR) 860000 840000 600000 360000 120000
Market Value (INR) 1392233 1306881 815053 419493 114561
Scheme Returns 13.19% 12.41% 12.20% 10.19% -8.29%
BSE 100 8.50% 7.44% 7.99% 4.28% -7.27%
Sensex 7.95% 7.37% 7.42% 3.68% -8.21%
#S&P
##S&P BSE
Inception Date (Canara Robeco Equity Taxsaver – Reg Growth Plan) 02-Feb-09
(w.e.f. 31.03.2016 Mr. Yogesh Patil is the Fund Manager of Canara Robeco Equity Tax Saver Fund)

SIP RETURNS (as on March 31, 2016)
32
EQUITY SCHEMES
CANARA ROBECO LARGE CAP+ FUND Fund Manager: Mr. Ravi Gopalakrishnan
CANARA ROBECO INFRASTRUCTURE Fund Manager: Mr. Yogesh Patil
DEBT SCHEMES
CANARA ROBECO GILT PGS Fund Manager: Mr. Girish Hisaria
Since Inception 5 yr 3 yr 1 yr
Total Amt invested 680000 600000 360000 120000
Market Value 911154 782319 407545 116200
Scheme Returns 10.23% 10.55% 8.22% -5.82%
BSE 100 7.56% 7.99% 4.28% -7.27%
Sensex 6.94% 7.42% 3.68% -8.21%
Inception Date 20-Aug-10
#S&P
##S&P BSE
1. Investment date is taken to be 1st of the month or subsequent day if 1st is a holiday and investment of ̀ 10000 is taken. Returns are as on and are CAGR. 2. The calculations are # ##based on the regular growth plan NAVs. 3. Past performance may or may not be sustained in the future. Scheme Benchmark , Additional benchmark
31-March-2016
Since Inception 15 YR 10 yr 7 yr 5 yr 3 yr 1 yr
Total Amt invested 1960000 1800000 1200000 840000 600000 360000 120000
Market Value 4187274 3581093 2021111 1287671 762510 417399 125469
Scheme Returns 8.68% 8.63% 10.06% 11.99% 9.52% 9.85% 8.56%
Isec Li Bex NA NA 9.23% 9.59% 10.31% 10.98% 9.41%
10yr G Sec Index NA NA 17.25% 7.28% 8.18% 9.30% 9.70%
Inception Date
#
##
29-Dec-99
CANARA ROBECO INCOME Fund Manager: Mr. Avnish Jain
Since Inception 10 yr 7 yr 5 yr 3 yr 1 yr
Total Amt invested 1630000 1200000 840000 600000 360000 120000
Market Value 3105336 1921056 1124263 741975 407622 123894
Scheme Returns 8.99% 9.10% 8.19% 8.43% 8.24% 6.07%
Crisil Composite Bond Fund Index 7.34% 8.08% 8.66% 9.31% 10.02% 9.05%
10yr G Sec Index 6.41% 17.25% 7.28% 8.18% 9.30% 9.70%
Inception Date
#
##
19-Sep-02
CANARA ROBECO MONTHLY INCOME PLAN Fund Manager: Mr. Ravi Gopalakrishnan / Mr. Avnish Jain
Since Inception 10 yr 7 yr 5 yr 3 yr 1 yr
Total Amt invested 1610000 1200000 840000 600000 360000 120000
Market Value 3314986 1957672 1154348 753695 408223 120581
Scheme Returns 10.16% 9.46% 8.93% 9.06% 8.34% 0.90%
Crisil MIP Blended Index NA 8.35% 8.69% 9.24% 9.42% 6.67%
10yr G Sec Index NA 17.25% 7.28% 8.18% 9.30% 9.70%
Inception Date 24-April-88
#
##
Since Inception 10 yr 7 yr 5 yr 3 yr 1 yr
Total Amt invested (INR) 1210000 1200000 840000 600000 360000 120000
Market Value (INR) 2261178 2162708 1281377 853808 460857 114748.9
Scheme Returns 11.17% 11.34% 11.86% 14.08% 16.72% -8.01%
BSE 100 8.35% 8.05% 7.44% 7.99% 4.28% -7.27%
Sensex 7.91% 7.37% 7.37% 7.42% 3.68% -8.21%
#S&P
##S&P BSE
Inception Date 02-Dec-05

Since Inception 5 yr 3 yr 1 yr
Total Amt invested 830000 600000 360000 120000
Market Value 1130762 756843 412113 124791
Scheme Returns 8.80% 9.22% 8.98% 7.48%
Crisil Composite Bond Fund Index 8.69% 9.31% 10.02% 9.05%
10yr G Sec Index 7.32% 8.18% 9.30% 9.70%
#
##
Inception Date 29-May-09
SIP RETURNS (as on March 31, 2016)
DEBT SCHEMES
33
1. Investment date is taken to be 1st of the month or subsequent day if 1st is a holiday and investment of ̀ 10000 is taken. Returns are as on and are CAGR. 2. The calculations are # ##based on the regular growth plan NAVs. 3. Past performance may or may not be sustained in the future. Scheme Benchmark , Additional benchmark
31-March-2016
CANARA ROBECO DYNAMIC BOND FUND Fund Manager: Mr. Girish Hisaria
CANARA ROBECO TREASURY ADVANTAGE FUND Fund Manager: Mr. Girish Hisaria /Ms. Suman Prasad
CANARA ROBECO SHORT TERM FUND Fund Manager: Ms. Suman Prasad
CANARA ROBECO INDIGO FUND Fund Manager: Mr. Avnish Jain / Mr. Kiran Shetty
Since Inception 7 yr 5 yr 3 yr 1 yr
Total Amt invested 920000 840000 600000 360000 120000
Market Value 1312334 1150098 752168 410645 125176
Scheme Returns 8.71% 8.83% 8.97% 8.74% 8.09%
Crisil Liquid Fund Index 8.21% 8.36% 8.66% 8.58% 8.04%
1 yr T- bill index 7.04% 7.20% 7.69% 7.93% 7.52%
Inception Date 14-July-08
#
##
Since Inception 5 yr 3 yr 1 yr
Total Amt invested 690000 600000 360000 120000
Market Value 792497 667428 383907 124106.6
Scheme Returns 4.76% 4.21% 4.22% 6.40%
Composite Gold Index 7.21% 6.81% 7.72% 12.56%
10yr G Sec Index 7.85% 8.18% 9.30% 9.70%
Inception Date
#
#v
09-Jul-10
CANARA ROBECO SAVINGS PLUS FUND Fund Manager: Mr. Girish Hisaria /Ms. Suman Prasad
Since Inception 10 yr 7 yr 5 yr 3 yr 1 yr
Total Amt invested 1330000 1200000 840000 600000 360000 120000
Market Value 2160032 1862056 1148263 750703 410211 125326
Scheme Returns 8.43% 8.51% 8.78% 8.90% 8.66% 8.33%
Crisil Liquid Fund Index 7.68% 7.95% 8.36% 8.66% 8.58% 8.04%
1 yr T- bill index 6.61% 6.73% 7.20% 7.69% 7.93% 7.52%
Inception Date
#
##
04-Mar-05
Since Inception 7 yr 5 yr 3 yr 1 yr
Total Amt invested 850000 840000 600000 360000 120000
Market Value 1117236 1130564 743268 407953 124805
Scheme Returns 7.60% 8.35% 8.50% 8.29% 7.50%
Crisil Short-Term Bond Fund Index 8.67% 8.69% 9.14% 9.23% 8.62%
10 YR G-sec Index 7.25% 17.25% 8.18% 9.30% 9.70%
#
##
Inception Date 31-Mar-09
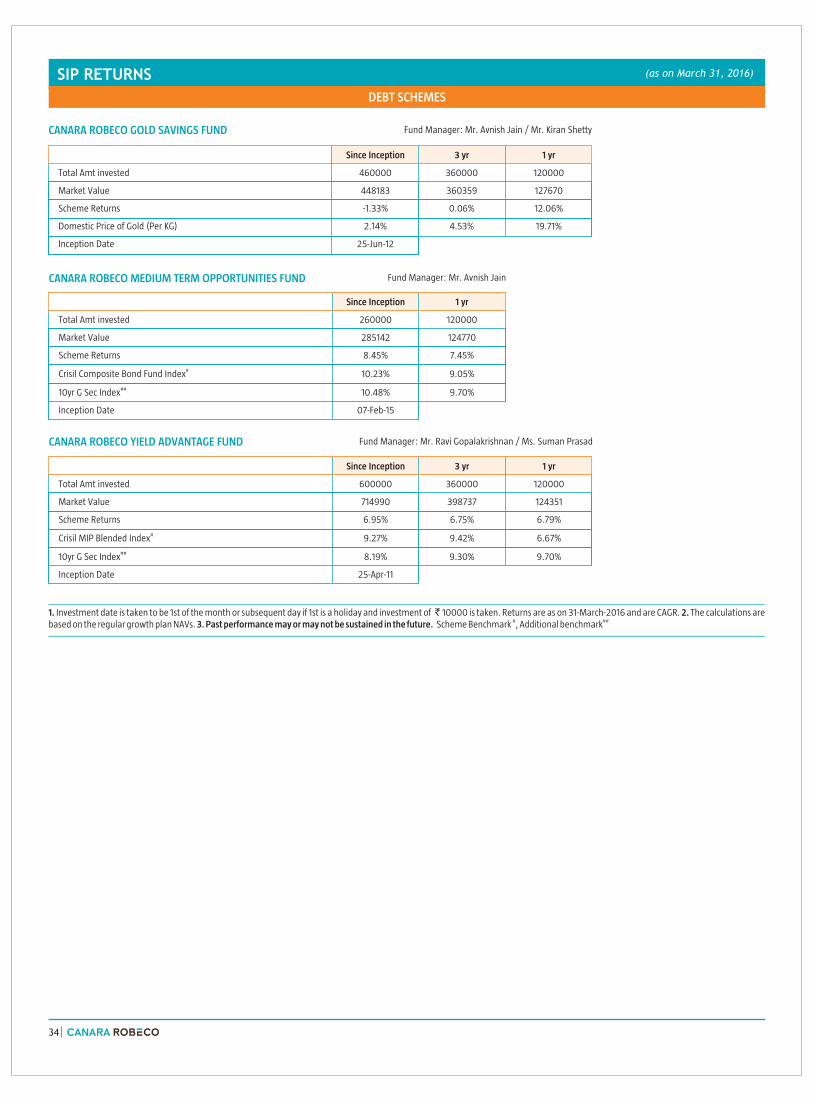
SIP RETURNS (as on March 31, 2016)
34
DEBT SCHEMES
CANARA ROBECO MEDIUM TERM OPPORTUNITIES FUND Fund Manager: Mr. Avnish Jain
CANARA ROBECO YIELD ADVANTAGE FUND Fund Manager: Mr. Ravi Gopalakrishnan / Ms. Suman Prasad
Since Inception 1 yr
Total Amt invested 260000 120000
Market Value 285142 124770
Scheme Returns 8.45% 7.45%
Crisil Composite Bond Fund Index 10.23% 9.05%
10yr G Sec Index 10.48% 9.70%
Inception Date 07-Feb-15
#
##
Since Inception 3 yr 1 yr
Total Amt invested 600000 360000 120000
Market Value 714990 398737 124351
Scheme Returns 6.95% 6.75% 6.79%
Crisil MIP Blended Index 9.27% 9.42% 6.67%
10yr G Sec Index 8.19% 9.30% 9.70%
Inception Date 25-Apr-11
#
##
1. Investment date is taken to be 1st of the month or subsequent day if 1st is a holiday and investment of ̀ 10000 is taken. Returns are as on and are CAGR. 2. The calculations are # ##based on the regular growth plan NAVs. 3. Past performance may or may not be sustained in the future. Scheme Benchmark , Additional benchmark
31-March-2016
CANARA ROBECO GOLD SAVINGS FUND Fund Manager: Mr. Avnish Jain / Mr. Kiran Shetty
Since Inception 3 yr 1 yr
Total Amt invested 460000 360000 120000
Market Value 448183 360359 127670
Scheme Returns -1.33% 0.06% 12.06%
Domestic Price of Gold (Per KG) 2.14% 4.53% 19.71%
Inception Date 25-Jun-12

Canara Robeco Infrastructure
30.08.2013 0.85 13.80
22.08.2014 1.30 24.08
28.08.2015 1.65 25.91
Direct Plan
30.08.2013 0.85 14.08
22.08.2014 1.30 24.73
Regular Plan
Date ofdeclaration (Record Date)
Dividend Distribution
per unit*
NAV as on the date
of declaration
DIVIDEND HISTORY
* On face value of ̀ 10. = For Daily, Weekly & Monthly dividend history of Canara Robeco Liquid Fund, Canara Robeco Treasury Advantage Fund & Canara Robeco Short Term Fund Visit : www.canararobeco.com
Past performance may or may not be sustained in the future. Pursuant to payment of dividend, the NAV of the dividend option of the scheme would fall to the extent of payout and statutory levy (if applicable).
Date ofdeclaration (Record Date)
Dividend Distribution
per unit*
NAV as on the date
of declaration
Canara Robeco F.O.R.C.E Fund
26.07.2013 0.85 14.5100
25.07.2014 1.00 17.7100
31.07.2015 1.30 22.4700
Regular Plan
35
Date ofdeclaration (Record Date)
Dividend Distribution
per unit*
NAV as on the date
of declaration
Canara Robeco Savings Plus Fund
09.12.2005 0.3267 (Others) 10.4499
0.3508 (Ind. & HUF) 10.4499
28.02.2011 0.50 14.4809
09.03.2011 0.50 14.0135
Canara Robeco Monthly Income Plan(Monthly Dividend Option)
Date ofdeclaration (Record Date)
Dividend Distribution
per unit*
NAV as on the date
of declaration
28.11.2014 0.10 15.1372
26.12.2014 0.10 14.9373
30.01.2015 0.10 15.3602
27.02.2015 0.10 15.3610
27.03.2015 0.10 15.1380
24.04.2015 0.10 15.0939
29.05.2015 0.10 15.1024
26.06.2015 0.10 14.9300
31.07.2015 0.10 15.1793
28.08.2015 0.10 14.8552
24.09.2015 0.10 14.7969
30.10.2015 0.10 14.9194
27.11.2015 0.10 14.7981
23.12.2015 0.10 14.6799
29.01.2016 0.10 14.2831
26.02.2016 0.10 13.7064
23.03.2016 0.10 14.1969
29.04.2016 0.10 14.2860
Direct Plan
28.11.2014 0.10 15.4074
26.12.2014 0.10 15.2145
30.01.2015 0.10 15.6577
27.02.2015 0.10 15.6685
27.03.2015 0.10 15.4504
24.04.2015 0.10 15.4145
29.05.2015 0.10 15.4372
26.06.2015 0.10 15.2789
31.07.2015 0.10 15.5567
28.08.2015 0.10 15.2409
24.09.2015 0.10 15.1972
30.10.2015 0.10 15.3481
27.11.2015 0.10 15.2409
23.12.2015 0.10 15.1358
29.01.2016 0.10 14.7477
26.02.2016 0.10 14.1659
23.03.2016 0.10 14.6850
29.04.2016 0.10 14.7925
Quarterly Dividend Option
Regular Plan
31.12.2014 0.30 15.4497
27.03.2015 0.30 15.5593
26.06.2015 0.30 15.3524
29.09.2015 0.30 15.2783
23.12.2015 0.30 15.1088
23.03.2016 0.30 14.6277
Direct Plan
31.12.2014 0.30 15.7555
27.03.2015 0.30 15.8980
26.06.2015 0.30 15.7287
29.09.2015 0.30 15.7097
23.12.2015 0.30 15.5900
23.03.2016 0.30 15.1422
Regular Plan
Date ofdeclaration (Record Date)
Dividend Distribution
per unit*
NAV as on the date
of declaration
Canara Robeco Large Cap+ Fund
28.11.2014 1.20 17.45
27.11.2015 1.25 15.81
Regular Plan
Date ofdeclaration (Record Date)
Dividend Distribution
per unit*
NAV as on the date
of declaration
Canara Robeco Equity Tax Saver
Regular Plan
20.12.2013 0.75 18.48
10.10.2014 1.00 24.68
27.02.2015 1.00 27.22
06.11.2015 1.00 24.49
26.02.2016 0.89 20.15
Date ofdeclaration (Record Date)
Dividend Distribution
per unit*
NAV as on the date
of declaration
Canara Robeco Emerging Equities
22.06.2007 3.00 15.39
Regular Plan
29.11.2013 1.05 17.58
28.11.2014 2.70 35.38
27.11.2015 2.20 37.54
Date ofdeclaration (Record Date)
Dividend Distribution
per unit*
NAV as on the date
of declaration
Canara Robeco Balance
Regular Plan
Monthly Dividend Option
30.10.2015 0.60 79.35
27.11.2015 0.60 79.60
24.12.2015 0.60 78.77
29.01.2016 0.60 73.73
26.02.2016 0.60 66.55
23.03.2016 0.60 72.18
29.04.2016 0.60 73.74
Direct Plan
Monthly Dividend Option
30.10.2015 0.60 80.06
27.11.2015 0.60 80.36
24.12.2015 0.60 79.58
29.01.2016 0.60 74.54
26.02.2016 0.60 67.34
23.03.2016 0.60 73.10
29.04.2016 0.60 74.74
Date ofdeclaration (Record Date)
Dividend Distribution
per unit*
NAV as on the date
of declaration
Canara Robeco Income
Regular Plan
31.12.2014 0.21 14.0731
27.03.2015 0.20 14.2034
26.06.2015 0.20 13.9535
29.09.2015 0.20 14.2348
23.12.2015 0.20 14.0407
23.03.2016 0.20 14.0555
Quarterly Dividend Option - Direct Plan
31.12.2014 0.21 14.2334
27.03.2015 0.20 14.3886
26.06.2015 0.20 14.1591
29.09.2015 0.20 14.4701
23.12.2015 0.20 14.2951
23.03.2016 0.20 14.3356
Quarterly Dividend Option -
Date ofdeclaration (Record Date)
Dividend Distribution
per unit*
NAV as on the date
of declaration
Canara Robeco Equity Diversified
14.10.2011 1.00 23.03
Regular Plan
25.10.2013 2.10 27.99
17.10.2014 2.80 34.20
30.10.2015 2.50 34.57

Date ofdeclaration (Record Date)
Dividend Distribution
per unit*
NAV as on the date
of declaration
Canara Robeco Yield Advantage Fund
29.01.2016 0.06 13.7680
26.02.2016 0.06 13.6589
23.03.2016 0.06 13.7920
29.04.2016 0.06 13.8783
Direct Plan
29.01.2016 0.06 14.0913
26.02.2016 0.06 13.9859
23.03.2016 0.06 14.1293
29.04.2016 0.06 14.4103
Quarterly Dividend Option
Regular Plan
23.03.2016 0.18 14.0967
Direct Plan
23.03.2016 0.18 14.4357
Monthly Dividend Option
Regular Plan
DIVIDEND HISTORY
Date ofdeclaration (Record Date)
Dividend Distribution
per unit*
NAV as on the date
of declaration
Canara Robeco Gilt PGS Fund
20.12.2013 0.37 12.3226
20.06.2014 0.35 12.8805
31.12.2014 0.40 13.6628
26.06.2015 0.40 13.5912
23.12.2015 0.40 13.7057
Direct Plan
20.12.2013 0.37 12.3426
20.06.2014 0.35 12.9282
31.12.2014 0.40 13.7442
26.06.2015 0.40 13.7047
23.12.2015 0.40 13.8634
Regular Plan
Date ofdeclaration (Record Date)
Dividend Distribution
per unit*
NAV as on the date
of declaration
Canara Robeco Dynamic Bond Fund
20.12.2013 0.37 12.2913
20.06.2014 0.35 12.6800
31.12.2014 0.39 13.3433
26.06.2015 0.40 13.2629
23.12.2015 0.40 13.3071
Direct Plan
20.12.2013 0.37 12.3200
20.06.2014 0.35 12.7361
31.12.2014 0.39 13.4389
26.06.2015 0.40 13.4008
23.12.2015 0.40 13.4853
Regular Plan
Date ofdeclaration (Record Date)
Dividend Distribution
per unit*
NAV as on the date
of declaration
Canara Robeco InDiGo
Regular Plan
26.09.2014 0.15 10.7078
31.12.2014 0.10 10.6805
27.03.2015 0.10 10.6885
26.06.2015 0.10 10.6283
29.09.2015 0.10 10.6462
23.12.2015 0.10 10.5251
23.03.2016 0.10 10.7848
Quarterly Dividend Option
Direct Plan
26.09.2014 0.15 11.1222
31.12.2014 0.10 11.1219
27.03.2015 0.10 11.1533
26.06.2015 0.10 11.1158
29.09.2015 0.10 11.1592
23.12.2015 0.10 11.0548
23.03.2016 0.10 11.3515
Quarterly Dividend Option
36
* On face value of ̀ 10. = For Daily, Weekly & Monthly dividend history of Canara Robeco Liquid Fund, Canara Robeco Treasury Advantage Fund & Canara Robeco Short Term Fund Visit : www.canararobeco.com
Past performance may or may not be sustained in the future. Pursuant to payment of dividend, the NAV of the dividend option of the scheme would fall to the extent of payout and statutory levy (if applicable).
Date ofdeclaration (Record Date)
Dividend Distribution
per unit*
NAV as on the date
of declaration
Canara Robeco Medium TermOpportunities Fund
28.11.2014 0.32 10.9937
29.05.2015 0.30 11.1100
27.11.2015 0.30 11.2040
Direct Plan
28.11.2014 0.32 11.0052
29.05.2015 0.30 11.1324
27.11.2015 0.30 11.2594
Regular Plan

Total Expense Ratio
Expressed as an annualized percentage, it is the ratio of all the expenses of the fund to the total assets of the fund and includes the fund management fees paid to the asset management company for managing the fund's assets.
Sharp Ratio
The Sharpe Ratio, named after its founder, the Nobel Laureate William Sharpe, is a measure of risk-adjusted returns. It is calculated using standard deviation and excess return to determine reward per unit or risk.
Beta Ratio
Beta is a measure of an investment's volatility vis-à-vis the market. Beta of less than 1 means that the security will be less volatile than the market. A beta of greater than 1 implies that the security's price will be more volatile than the market.
Portfolio Turnover Ratio
It is a measure of how often assets within a fund are churned.
Modified Duration
Modified duration is the price sensitivity and the percentage change in price for a unit changes in yield.
Average Maturity
It is the weighted average of residual maturity of debt securities in a fund portfolio
Portfolio Yield
Weighted Average valuation yield of the assets
Standard Deviation
Standard Deviation is a statistical measure of the range of an investment's performance. When a mutual fund has a high standard deviation, its means its range of performance is wide, implying greater volatility.
Risk Free Return
It represents the rate of return an investor could have earned by investing in a security which is believed to have zero investment risk over the specified period of time.
Tracking Error
Tracking error is a measure of how closely is a scheme able to imitate the index to which it is benchmarked. It is the standard deviation of the difference between the scheme and index returns.
R-Squared:
It is a statistical measure of how closely the portfolio returns are correlated with its benchmark.
DEFINITIONS
37

Fund ManagerAn employee of the asset management company who manages investments of the scheme. He is usually part of a larger team of fund managers and research analysts.
Minimum Application Amount for Fresh SubscriptionThis is the minimum investment amount for a new investor in a mutual fund scheme
Application Amount for Fresh SubscriptionThis is the minimum investment amount for a new investor in a mutual fund scheme.
Minimum Additional AmountThis is the minimum investment amount for an existing investor in a mutual fund scheme.
Yield to MaturityThe Yield to Maturity or the YTM is the rate of return anticipated on a bond if held until Maturity. YTM is expressed as an annual rate. The YTM factors in the bond's current market price, par value, coupon interest rate a d time to maturity.
SIPSIP or systematic investment plan works on the principle of making periodic investments of a fixed sum. It works similar to a recurring bank deposit. For instance, an investor may opt for an SIP that invests Rs. 500 every 15th of the month in an equity fund for a period of three years.
NAVThe NAV or the net asset value is the total asset value per unit of the mutual fund after deducting all related and permissible expenses. The NAV is calculated at the end of every business day. It is the value at which the investor enters or exits the mutual fund.
BenchmarkA group of securities, usually a market index, whose performance is used as a standard or benchmark to measure investment performance of mutual funds, among other investments. Some typical benchmarks include the Nifty, Sensex, BSE200, BSE500, 10 –Year Gsec.
Entry LoadA mutual fund may have a sales charge or load at the time of entry and/or exit to compensate the distributor/agent.
Entry load is charged at the time an investor purchases the units of a mutual find. The entry load is added to the prevailing NAV at the time of investment. For instance, if the NAV is Rs. 100 and the exit load is 1%, the investor will enter the fund at Rs. 101.
Exit LoadExit load is charged at the time an investor redeems the units of mutual fund. The exit load is reduced from the prevailing NAV at the time of redemption. The investor will receive redemption proceed at net value of NAV less Exit Load. For instance if the NAV is Rs. 100 and the exit load is 1% the investor will receive Rs. 99
Modified DurationModified duration is the price sensitivity and the percentage change in price for a unit changes in yield.
Standard DeviationStandard Deviation is a statistical measure of the range of an investment's performance. When a mutual fund has a high standard deviation, its means its range of performance is wide, implying greater volatility.
Sharpe Ratio The Sharpe Ratio, named after its founder, the Nobel Laureate William Sharpe, is a measure of risk-adjusted returns. It is calculated using standard deviation and excess return to determine reward per unit or risk.
BetaBeta is a measure of an investment's volatility vis-à-vis the market. Beta of less than 1 means that the security will be less volatile than the market. A beta of greater than 1 implies that the security's price will be more volatile than the market.
AUMAUM or assets under management refers to recent / updated cumulative market value of investments of a scheme managed by the mutual fund.
HoldingsThe holdings or the portfolio is a mutual fund's latest or updated reported statement of investments/securities. These are usually displayed in terms of percentage to net assets or the rupee value or both. The objective is to give investors an idea of where their money is being invested by the fund manager.
Nature of SchemeThe investment objective and underlying investments determine the nature of the mutual fund scheme. For instance, a mutual fund that aims at generating capital appreciation by investing in stock markets is an equity fund or growth fund. Likewise, a mutual fund that aims at capital preservation by investing in debt markets is a debt fund or income fun. Each of these categories may have sub-categories.
Rating ProfileMutual funds invest in securities after evaluating their creditworthiness a disclosed by the ratings. A depiction of the mutual fund in various investments based on their ratings becomes the rating profile of the fund. Typically, this is a feature of debt funds.
HOW TO READ A FACTSHEET
38
BRANCH OFFICES Toll Free No : 1800 209 2726 Website : www.canararobeco.com
Disclaimer : The information used towards formulating the outlook have been obtained from sources published by third parties. While such publications
are believed to be reliable, however, neither the AMC, its officers, the trustees, the Fund nor any of their affiliates or representatives assume any
responsibility for the accuracy of such information and assume no financial liability whatsoever to the user of this document. The document is solely for
the information and understanding of intended recipients only. Internal views, estimates, opinions expressed herein may or may not materialize. These
views, estimates, opinions alone are not sufficient and should not be used for the development or implementation of an investment strategy. Forward
looking statements are based on internal views and assumptions and subject to known and unknown risks and uncertainties which could materially impact
or differ the actual results or performance from those expressed or implied under those statements.
Mutual Fund investments are subject to market risks, read all scheme related documents carefully.
DISCLAIMERS (as on April 29,2016)
Ahmedabad: Tel: (079) 40278936 Bangalore : Tel.: (080) 39871400-01 Chandigarh : Tel: (0172) 2648007 Chennai : Tel.: (044) 28492596-98 Goa : Tel.: (0832) 2422415, 6450631
Hyderabad : Tel.: (040) 39132301 /02 Indore : Tel.: (0731) 6451222 Jaipur: Tel.: +(141) 4010281 Kochi : Tel.: (0484) 2364846/36 Kolkata : Tel.: (033) 30584716 - 19 Lucknow :
Tel.: ( 522) 4026560 Mangalore : Tel: (0824) 2448804 Mumbai : Tel.: (022) 66585000/18, 66585085-86 New Delhi : Tel.: (011) 23326417 Pune : Tel.: (020) 30923820-24
Patna: Tel (0612) 3223911 Surat : Tel.: (0261) 6554243, 6641345
Note: The disclosures relating to portfolio Turn over Ratio (for equity segment) is based on the aggregate market value of equity as on 29.04.2016. The disclosures of average
maturity period relates to the debt component of the portfolio as on 29.04.2016.
Unclaimed Dividends : Those Investors who have not received/encashed the Dividends distributed by the Schemes, may write to respective registrar, duly furnishing the Name
of the Scheme, Folio No. and Details of the Dividends not received.
$Note :
Risk ratios calculated for schemes having minimum three year performance
For schemes having completed 4-6 years, 4 year data point considered.
For schemes having more than 6 year tenuer, 6 year data point is considered.
Risk Free Rate of Return : 6.57% (MIBOR as of April 29, 2016)
For the calculation of risk ratios monthly absolute returns calculated at monthly frequency are used
39
