faculty of economic sciences, communication and it349567/fulltext01.pdf · faculty of economic...
TRANSCRIPT

Karlstads universitet 651 88 Karlstad Tfn 054-700 10 00 Fax 054-700 14 60
[email protected] www.kau.se
Faculty of Economic Sciences, Communication and IT
Yaniv Ben Or
Measuring For Improvement
A study of production processes’ effectiveness and the potential for improvements at Nobel Biocare
Degree Project of 30 credit points
Master of Science in Engineering:
Industrial Engineering and Management
Date/Term: Spring 2010
Supervisor: Mikael Johnson
Examiners: Mikael Johnson
Berndt Andersson

Yaniv Ben Or – Measuring For Improvement
1
Acknowledgements
This thesis paper constitutes the final task of my master’s education in industrial engineering and management at Karlstad’s University. The study was conducted at Nobel Biocare’s production plant in Karlskoga, Sweden.
I would like to thank my supervisor at the university, Mikael Johnson, for being supportive and for the contribution of insights and ideas to the study. Additionally, I would like to express my appreciation for the plant manager, Arne Lind, who made this study possible and been a great source of inspiration. Thanks to my supervisor at the plant, Per Magnus Funke for the introduction and for the support during the study. Furthermore, I would like to thank the staff of the production plant for the helpfulness and openness and in particular Jörgen Jonsson and Per Eriksson for the engagement and interest in the study.
Last, but definitely not least, all the gratitude to my wonderful wife Anneli for being understanding and supportive and my beloved daughter Leah, which although was just a new born, allowed me to sleep at nights during the study period.
Yaniv Ben Or
Karlstad 2010
Email: [email protected]

Yaniv Ben Or – Measuring For Improvement
2
Abstract
Purpose: this thesis study aims to provide an analysis and an assessment of the current operations’ performance effectiveness at Nobel Biocare’s production plant in Karlskoga, Sweden and to describe the potential for improvement. It intends to clarify the importance of performance measurement and explain Overall Equipment Effectiveness (OEE) metrics in particular. Furthermore, it strives to identify causes for inefficiency in production and suggest recommendations to minimize losses.
Methodology: the study is using both qualitative and quantitative approaches in parallel as measurements are implemented to discover effectiveness rates and detect causes for production losses while assessments are made using different models, such as the Capability Maturity Model (CMM) and OEE assessments, in order to evaluate the current development level and the potential for improvement.
Findings: the research finds that major losses are closely related to frequency of changeovers in machining processes, where average effectiveness rates were 68%. In surface treatment and packaging equipment inspected, the values were found to be between 46% and 59% as the major common cause was the absence of work due to unstable flow of orders. Assessing process orientation and maturity levels, the findings indicate on high levels in general. However, areas of weakness were identified in the different processes in which the potential for improvement is embedded. In those areas, lower OEE values were registered; low levels of maturity and process orientation were found, as low development of losses improvement were assessed. The study finally suggests that the areas of weakness suffer from lack of learning orientation that is ought to be improved and at the same time, a variety of specific recommendations are provided.
Keywords: Total Productive Maintenance (TPM), Overall Equipment Effectiveness (OEE), Process Improvement, Lean Production.
Yaniv Ben Or – Measuring For Improvement
3
Contents
1. Introduction ............................................................................................................................. 5
1.1 Problem background ......................................................................................................... 6
1.2 Purpose .............................................................................................................................. 6
1.3 Delimitations ..................................................................................................................... 7
1.4 Layout ................................................................................................................................ 8
2. Nobel Biocare .......................................................................................................................... 9
2.1 Company history ................................................................................................................ 9
2.2 Products ........................................................................................................................... 10
2.3 The Karlskoga plant ........................................................................................................ 12
3. Theoretic framework ............................................................................................................ 14
3.1 Process ............................................................................................................................. 14
3.1.1 Process definition ..................................................................................................... 14
3.1.2 Process classifications .............................................................................................. 15
3.1.3 Process orientation in a brief .................................................................................... 16
3.1.4 Process management in a brief ................................................................................. 16
3.1.5 Process measurement ............................................................................................... 16
3.2 Total Productive Maintenance (TPM) ............................................................................. 19
3.2.1 Six big losses limit equipment effectiveness ............................................................ 21
3.2.2 Chronic losses and sporadic losses ........................................................................... 22
3.2.3 Improving setup and adjustments and SMED .......................................................... 23
3.3 Overall Equipment Effectiveness (OEE) ......................................................................... 24
3.3.1 What is OEE? ........................................................................................................... 24
3.3.2 OEE metrics ............................................................................................................. 25
3.3.3 OEE modifications ................................................................................................... 27
3.3.4 OEE critics ............................................................................................................... 27
3.3.5 OEE assessment ....................................................................................................... 27
3.4 Analysis and assessment models and methods ................................................................ 29
3.4.1 The Capability Maturity Model (CMM) .................................................................. 29
3.4.2 Process Audit ............................................................................................................ 30
3.4.3 Failure Mode and Effect Analysis (FMEA) ............................................................. 30
3.4.4 Value analysis .......................................................................................................... 32
3.4.5 Cause - Effect diagrams ........................................................................................... 33
3.4.6 Why-why analysis .................................................................................................... 33
4. Method ................................................................................................................................... 34
4.1 Strategy ............................................................................................................................ 34
4.1.1 Business and management research methods ........................................................... 34
4.1.2 Quantitative and qualitative research ....................................................................... 34
4.1.3 Deductive and inductive research ............................................................................ 35
4.1.4 Choice of strategy ..................................................................................................... 35
4.2 Implementation ................................................................................................................ 36
4.2.1 Observations ............................................................................................................. 37
4.2.2 Interviews ................................................................................................................. 37
4.2.3 Secondary data analysis ........................................................................................... 38
4.2.4 Research layout ........................................................................................................ 39

Yaniv Ben Or – Measuring For Improvement
4
4.2.5 Process measurement methodology ......................................................................... 39
4.3 Credibility and quality of findings ................................................................................... 43
4.3.1 Reliability ................................................................................................................. 43
4.3.2 Replication ............................................................................................................... 44
4.3.3 Validity ..................................................................................................................... 44
4.3.4 Credibility of interviews and observations ............................................................... 45
5. Results .................................................................................................................................... 46
5.1 Results for machining sub-process .................................................................................. 46
5.1.1 Deco 10 machines .................................................................................................... 46
5.1.2 Willemin machines ................................................................................................... 50
5.2 Results for surface treatment processes .......................................................................... 55
5.2.1 TiUnite ..................................................................................................................... 55
5.2.2 MaskPad ................................................................................................................... 58
5.3 Results for Packaging ...................................................................................................... 60
5.3.1 Sleeve machine ......................................................................................................... 60
6. Analysis .................................................................................................................................. 62
6.1 Machining ........................................................................................................................ 62
6.1.1 Deco 10 machines .................................................................................................... 63
6.1.2 Willemin machines ................................................................................................... 66
6.1.3 Analysis of major downtime causes ......................................................................... 68
6.1.4 Additional recommendations and comments ........................................................... 77
6.1.5 Overall Equipment Effectiveness (OEE) assessment ............................................... 79
6.2 Surface treatment ............................................................................................................. 81
6.2.1 TiUnite ..................................................................................................................... 81
6.2.2 MaskPad ................................................................................................................... 86
6.2.3 OEE assessment ....................................................................................................... 88
6.3 Packaging ........................................................................................................................ 90
6.3.1 Sleeve machine ......................................................................................................... 90
6.4 Process orientation and maturity .................................................................................... 91
6.5 Implementation and credibility assessment ..................................................................... 94
6.5.1 OEE measurements .................................................................................................. 94
6.5.2 Secondary data ......................................................................................................... 95
7. Discussion ............................................................................................................................... 96
8. Conclusions .......................................................................................................................... 101
9. Final words .......................................................................................................................... 103
� References ............................................................................................................................ 104
Appendix A: process map-machining .......................................................................................... 108
Appendix B: process audit ........................................................................................................... 109
Appendix C: Deco 10 OEE .......................................................................................................... 112
Appendix D: stop time division for Deco 10 ............................................................................... 114
Appendix E: stop time division Willemin .................................................................................... 119
Appendix F: paper forms .............................................................................................................. 120
Appendix G: OEE example .......................................................................................................... 127

Yaniv Ben Or – Measuring For Improvement
5
1. Introduction
The development toward a global economy in recent decades and the last global economic recession has intensified the need of manufacturing companies to improve their competitiveness. In order to remain and improve the ability to compete in the market, optimizing productivity has become a central issue that can be achieved by detection and elimination of production losses. At present, the dominating trends in the improvement work arena are mostly focused on Lean production, Lean management and on Six Sigma. These programs have a great deal in common with Total Quality Management (TQM), and even with the popular ISO 9000 quality management systems (Klefsjö et al. 2008).
All the named above improvement programs include the adoption of process perspective, process orientation and management while process measurement and evaluation plays an important role for understanding the current performance of operations and recognizing improvement possibilities.
According to Russell & Taylor (2003), making a production system lean and agile to be able to adapt to changing customer demands is a wise approach when pressure on manufacturers intensifies for quicker response and shorter cycle times. The term Just In Time (JIT) was originally coined to describe the Toyota Production System and it is recognized today as one of the most effective manufacturing operations in the world. JIT requires that only necessary unites would be provided in necessary quantities at necessary time. The concept is based on the recognition that if you produce only what you need when you need it, there is no room for error. For JIT to succeed, many fundamental elements must be in place including steady production, flexible resources, extremely high quality, no machine breakdowns, reliable suppliers, quick machine setups and a great deal of discipline to maintain other elements. Lower inventory levels are beneficial as they reveal errors and bottlenecks more quickly and give staff an opportunity to solve them. Production in small lots requires less space and capital investment in comparison with systems that incur large inventories, allowing the physical movement of processes closer together which simplifies transportation between stations.
Inventory levels can be perceived as equivalent to water flowing on a bed of rocks. When the level of water is high, smooth sailing is allowed and rocks are unexposed. Similarly, high levels of inventory hide problems. When the levels are reduced, problems/rocks are exposed and can be removed from the river, permitting the boat to gain progress quicker than before.
The production plant of Nobel Biocare in Karlskoga, Sweden is facing similar challenges. As the corporation moves to minimize costs by lowering inventory levels, the plant is striving to adjust for effective production of smaller volumes of a larger number of production batches and improving efficiency becomes a necessity.

Yaniv Ben Or – Measuring For Improvement
6
Figure 1: Reducing the level of inventory (water) allows operations management (the ship) to see
the problems in the operations (the rocks) and work to reduce them (Slack et al. 2010, p.433).
1.1 Problem background The company in which the study was conducted is the world leader in the production of esthetic dental solutions. Nobel Biocare offers a large number of products including standard titanium implants and abutments in different shapes and sizes and individualized prosthetics. The plant in Karlskoga is responsible for the production of core assortment and spare parts including 950 different parts. The major production equipment in the plant includes CNC/milling machines for titanium production, milling machines for ceramic production and automatic cells for cleaning, surface treatment, laser marking and assembly. The production system implemented at the factory today includes some of the basic elements of JIT manufacturing such as cellular layouts; pull triggered production, production control and small-lot production. The move in the direction of Just In Time manufacturing has created new urgent challenges for efficient production operations at the Karlskoga plant. In order to maintain lower inventory levels and at the same time provide a large assortment of products on time to customers, flexibility in production is required. This move creates the need for production in a larger number of smaller production batches for daily shipments. Production in smaller batches increases the number of different procedures such as order initiations, kitting, setups, adjustments, inspections, packaging-adjustments and others which challenges the efficiency of operations and production line flow. As a result, there is an imperative requirement for improvement of processes by understanding how the current situation looks like and by identifying possibilities and potential for improvement of manufacturing processes.
1.2 Purpose In order to obtain a view of present effectiveness levels of manufacturing processes and evaluate operations’ productivity, a systematical analysis is required and measurement of processes is vital. This thesis aims to explore the current operations performance effectiveness and to describe the potential for improvement at the Nobel Biocare’s production plant in Karlskoga. An additional objective of the study is to identify major causes of production inefficiencies. The study approaches this challenge from different levels and points of view as it evaluates both the strategic and the shop floor levels using both qualitative assessments and quantitative measurements, applying different tools and models. In addition, general recommendations regarding improvement efforts and specific improvement proposals are ought to be provided.
Yaniv Ben Or – Measuring For Improvement
7
Aiming to achieve superiority in investigating the named issues, various tools and models are studied and used in the thesis as described below:
Overall Equipment Effectiveness (OEE) metrics are used as a modern approach for production effectiveness measurement and identification of production losses. In order to use the metrics continuously in the future, there is a need to gather knowledge on OEE, to identify what should be measured and how. In addition, possible benefits from implementing the metrics are evaluated.
Failure Mode and Effect Analysis (FMEA) is a method for analyzing risks, providing a framework to rank risks based on the parameters of severity, occurrence and detection. It is applied in the study to analyze machine stop causes detected by OEE measurements.
OEE Assessment is a model of possible levels of Overall Equipment Effectiveness used for evaluation of progress levels in relation to different types of losses limiting equipment effectiveness.
Capability Maturity Model (CMM) is used to describe the maturity level of process focus and control while indicating on the current level, on the goals for reaching the next level and on improvement potential.
Process Audit is aimed to identify problems and possibilities from a process-orientation perspective.
Value Analysis is an analysis method to classify activities in sub-processes, it used in the study to identify whether activities should be developed, minimized or eliminated.
Cause – Effect diagrams are used to identify and describe the causes of machine downtime.
Why-why analysis is a method used to identify the root causes of problems and it is used in the study.
1.3 Delimitations Due to time constraints, the study focuses on equipment that is perceived by plant management as central and it is interesting in particular to gather knowledge on production activities involving this equipment. Furthermore, focus is on production processes and analyzing unplanned downtime. Measurements of machine inactivity time were registered manually to avoid costly installations.

Yaniv Ben Or – Measuring For Improvement
8
1.4 Layout
� Chapter 1 - Introduction: in this chapter, the background to the thesis problem is presented and goals are defined.
� Chapter 2 - Nobel Biocare: the company is introduced. The history of the company, its products and production site are briefly described.
� Chapter 3 - Theoretic framework: the theoretic background needed to understand the study is presented. Main subjects are processes, Total Productive Maintenance, Overall Equipment Effectiveness and different methods and analysis techniques used in the study.
� Chapter 4 - Method: the strategy chosen for the study is explained, the implementation is described and the assurance of findings’ credibility is enlightened.
� Chapter 5 - Results: the results of OEE measurements for the different equipment inspected are presented in various ways.
� Chapter 6 - Analysis: OEE results are explained and analyzed, major downtime causes are analyzed in detail, recommendations for improvement are provided and production operations are assessed.
� Chapter 7 - Discussion: study is summarized; findings and important issues are enlightened.
� Chapter 8 - Conclusions: findings are briefly described and formulated. � Chapter 9 - Final words: closing the study. � References - all the references used in the study are listed. � Appendix - here you can find process maps, process audit questionnaire, detailed results,
paper forms used in the study (Swedish) and OEE calculation example.

Yaniv Ben Or – Measuring For Improvement
9
2. Nobel Biocare
This chapter is dedicated to briefly present Nobel Biocare. The introduction of the company starts with a short presentation of the historical development of the company until current time
and continues with information about the company’s products. Finally, the company’s production
site in Karlskoga is described.
The Nobel Biocare group is a producer of dental medical devices and it is the world leader innovative restorative and esthetic dental solutions. The company provides dental professionals with a variety of science-based solutions including dental implants, ceramic crowns, bridges and laminates, software and tools for planning treatments- CAD/CAM, scanners and biomaterials (Nobel Biocare website 2010a).
2.1 Company history
The company was built upon two Swedish innovations: the revolutionary discovery of Professor Per-Ingvar Brånemark in 1953 that titanium integrates with living bone which he named Osseo-integration, and a process developed in 1983 by Dr Matts Andersson for the industrialized production of individualized dental prosthetics, referred as Procera.
After the approval of Swedish health authorities in 1978 of the insertion of implants for clinical purposes, Brånemark and Bofors agreed to a partnership, which led to the founding of Nobelpharma in 1981. The American food and drug Administration (FDA) approved the use of titanium dental implants in the states in 1982. In 1988 Nobelpharma acquired the Procera Technology, which was introduced to the market and approved by the Swedish National Board of Health in 1989. Nobelpharma was listed in the Stockholm Stock Exchange in 1994. The company was renamed Nobel Biocare in 1996. The company acquired the leading American firm Steri-Oss Inc., and became in a couple of years the definite global leader in restorative and esthetic dentistry. The surface treatment TiUnite, which is a biomaterial surface aimed to enhance osseointegration and improve anchorage to the bone, was applied to Brånemark system implants in 2000.
Nobel Biocare Holding AG, the current parent company, was founded and headquartered in Zurich, Switzerland, in 2002 and was admitted to the SIX Swiss Exchange. The company’s approach of being a ‘full-solution provider’ began in 2002 and in 2005 was followed by the introduction of the first guided surgery system called Nobel Guide. In 2008, a new product with a new implant design called Nobel Active was launched (Nobel Biocare website 2010b).
Today, Nobel Biocare has over 2,500 employees across the world and has the largest share of the global dental market with a distribution network covering more than 70 countries. The company has the highest percentage share of American and Asian markets. The company has six state of the art manufacturing facilities. Three facilities for standard products are placed in Karlskoga (Sweden), Yorba Linda (USA) and Tel-Aviv (Israel). Three sites for production of individualized

Yaniv Ben Or – Measuring For Improvement
10
products are located in Stockholm (Sweden), Mahwah (USA) and Tokyo (Japan) (Nobel Biocare website 2010c).
2.2 Products
The solutions Nobel Biocare offers for the treatment processes of dental professionals are digitalized with the goal of enhancing the predictability of treatments, improving efficiency, quality and reducing patient chair time.
Nobel Biocare offers a comprehensive portfolio of standardized solutions including implants and abutments in different shapes and sizes designed to enhance soft tissue volume and allow immediate loading and function. The large variation at portfolio gives dental professionals more treatment options and high flexibility. The implants are made of titanium, which is exceptionally strong, compatible for medical use and integrates with the bone. The surface technologies further enhance integration with bone.
The individualized prosthetics manufactured with the Procera technology are easy to use, optimally fitting and fully ceramic. Professionals are offered with customized tooth and implant retained crowns, bridges, abutments, removable solutions and veneers. These are produced by computer aided design (CAD) technology and computer assisted manufacturing (CAM) industrial production processes. The prosthetics are made from materials that offer a high degree of biocompatibility, stability and reliability including the ceramics zirconia and alumina as well as titanium. Figure 2 on the next page shows the different components of Nobel Biocare’s dental implant solution (Nobel Biocare website 2010c).

Yaniv Ben Or – Measuring For Improvement
11
Figure 2: Implant description, (Nobel Biocare website 2010c).

Yaniv Ben Or – Measuring For Improvement
12
2.3 The Karlskoga plant Nobel Biocare operations in Karlskoga are responsible for the manufacturing of core assortment and spare part products in titanium material within the following brands: Brånemark System®, NobelReplace™, NobelDirect™, NobelSpeedy™ and NobelActive.
In addition, custom device products, all standard ceramic products within the named brands, verification prototypes and clinical trial products are manufactured at the Karlskoga plant. Altogether, the assortment sourced from the plant includes 946 different parts.
The number of employees is around 160 of which 36 overhead staff. The total space of the plant is 6600 m2 of which 4500 m2 are dedicated to manufacturing. Plant capacity in term of major production equipment is including 59 CNC/milling machines for titanium production of which 12 machines are combined into 4 cells. In addition, there are 4 milling machines for ceramic production and 10 automatic cells for cleaning, surface treatment, laser marking and assembly. In 2008, the number of machine units produced was 3.800 Millions.
After the start of the cooperation between Bofors AB and professor Brånemark in 1978, the plant in Karlskoga was founded and the first implant was delivered in 1983. One year later, Nobel Biocare production (Bofors Biomekanik) was founded and the facility was expanded in 1988. In 1994, the plant was certified according to ISO 9000 and the manufacturing of the Procera products and Ti copings began. In 2008, a new manufacturing concept called Nobel Biocare Production System (NPS) was implemented. It is a concept of continuous flow that is fully digitalized and automated as described in the figure 3 below:
Figure 3: Production concept (internal document)
The production process after order load can be divided to three sub-processes of machining, surface treatment and packaging. During the machining process, CNC / milling machines are used to turn titanium and ceramic to items as screws, abutments and implants. The items continue

Yaniv Ben Or – Measuring For Improvement
13
in small containers by an automated convoy system or manually by personnel to the next sub process. Main activities in sub processes are controlled, signed and registered by a computer based system.
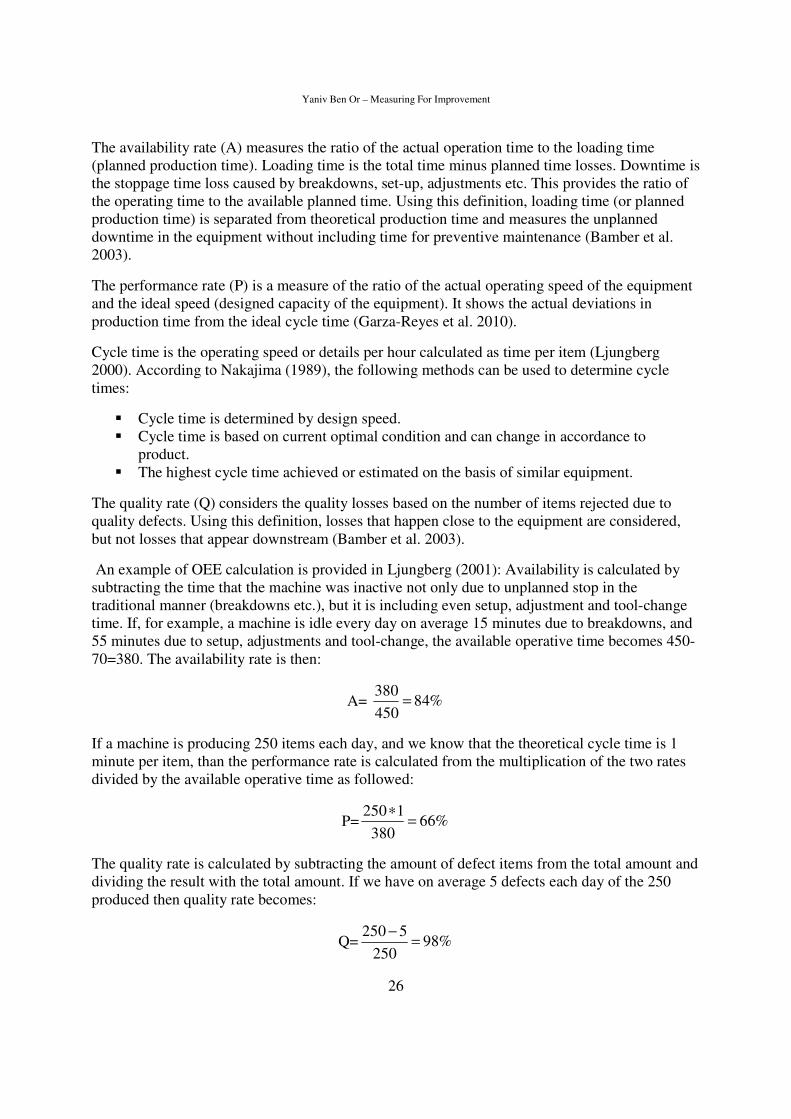
Figure 4: Deco 10 CNC milling machine produced by Tornos Switzerland (Tornos website 2010).
Two types of machines were inspected in the machining sub process: Deco 10, as the one shown in the picture and Willemin machines. In the surface treatment sub processes, MaskPad cells and TiUnite cells were examined. The MaskPad cells are in charge of setting ring pads to items and color marking them as well if needed. TiUnite cells are responsible for processing the surface of items to create the TiUnite surface. In addition, in the packaging sub-process, a Sleeve machine was studied.

Yaniv Ben Or – Measuring For Improvement
14
3. Theoretic framework
In this chapter, the theoretical framework that was reviewed and constitutes the foundation for
the study is presented. Aiming to create a valuable understanding of the issues concerning this
study, there is a need to gather knowledge on organizational processes and the way they are
approached in literature in the context of operations and quality management. Furthermore, it is
necessary to realize the meaning of process measurement and the ways processes can be
assessed and analyzed for the goal of organizational improvement. Finally, it is vital to become
familiar with the concept of Total Productive Maintenance and Overall Equipment Effectiveness
metrics and assessment applied in the study.
This chapter therefore opens with the definition of a process and continues with briefs about
process classifications, process orientation and process management. The subject of process
measurement is described in detail since it is a primer issue in the study. This is followed by a
presentation of the concept of Total Productive Maintenance (TPM), adopted by Nobel Biocare
as a part of Lean management approach while the metrics of Overall Equipment Effectiveness
(OEE) are explained and clarified. Lastly, the variety of models and methods used in the study to
analyze and assess processes and improvement potential are described.
3.1 Process
3.1.1 Process definition The word process originates from the notations “processus” and “procedere” in Latin, which means “advancement “or “move ahead”. The word process is used in everyday life to represent different courses of events and development with time (Bergman & Klefjö 2007). According to Ljungberg & Larsson (2001), it is vital to have a definition for a process and understand what it means in order to have the ability and knowledge to develop processes. Furthermore, a process is often described as a chain of activities while the named authors suggest the following three definitions:
� “A process is a collection of linked activities which transform an input for the creation of
an output”
� “A process is a chain of activities that in a repeatable flow, creates value for the customer.”
� “ A process is a repeatedly used network of ordered linked activities which exploits
resources and information to transform “object in” to “object out”, from identification to
satisfaction of customer needs” (Ljungberg & Larsson 2001, p.44).
The first definition is simple and is appropriate for technicians and mechanics that often lack understanding of organizations as social systems and perceive a process as some kind of a machine that is in charge of transforming an input to an output. This definition is built on the assumption that a process is a closed system that can be fully controlled and cause and effect can be easily analyzed. The second definition on the other hand, enlightens even the repeatability of a process and its creation of value for the customer. The third definition however, is more of a complete description of the containment of a process and its relation to the environment as it better describes reality. Additionally, this definition enlightens the requirement of information

Yaniv Ben Or – Measuring For Improvement
15
and resources needed to achieve results. Human resources and others are vital for creation of value and the ability of transformation of a process. According to the authors, organizations often adopt a mechanic perspective of processes since it is simplified and easier to work with, while this perspective is limited and might prevent organizations from working with more abstract processes that are vital as well such as processes related to management and development. Furthermore, Bergman & Klefjö (2007), emphasize that in reality processes are related to people or individuals and the coordination and agreements between them. This is important because the main potential for improvement today can be found in administrative workflows since improvements in manufacturing processes have often already been made. Based on the knowledge enlightened by all the named authors, the third definition by Ljugberg & Larsson (2001) seems to be most valuable as it describes a broader perspective that considers the interactions with resources and the environment and it is therefore chosen for this study. This definition is the most inclusive and can be most beneficial for fulfilling possibilities for improvement. A process that is consisting of a network of activities, producing a value adding result and is repeated in time is described in figure 5:
Figure 5: The core characteristics of a process (Ljungberg 2002)
3.1.2 Process classifications
Processes in a company can be explained as a network of activities and can be classified according to different criteria as noted in Bergman & Klefjö (2007). A classification that is related to the number of people involved in the process and the interface positions, distinguishes between individual processes, vertical processes and horizontal processes. Individual processes are carried out by individual, vertical processes are activities associated with a certain department, function or unit while horizontal processes cut through the company across several functions or departments. Another way to classify processes is to structure them by their aims which often lead to the division to three types:
� Core processes – aimed to fulfill the requirements of external customers and to refine the products provided by the organization, this processes include product development processes, production and distribution processes.
� Supporting processes – whose task is to provide resources for the main processes and have internal customers. Example of this type of processes are recruitment, maintenance and information processes.
Yaniv Ben Or – Measuring For Improvement
16
� Management processes – are aimed to make decisions on the targets and strategies of the organization and to implement improvements in other organizational processes. These processes have internal customers and they include processes for strategic planning, targeting and auditing.
3.1.3 Process orientation in a brief
Process orientation is an approach aiming to change the function-oriented view of the form, system, structure, attitudes, values and culture of an organization and to relate these factors to a process context (Ljungberg & Larsson 2001). Process focus means to redirect attention from individual products to focus on the activity chains that create them. Additionally, process orientation means that the question “how is the outcome produced?” is more significant, rather than “who does what?”. Process focus allows employees to better understand how they contribute to the end result, and it generates better chances to create a shared vision. In many organizations, process descriptions are used, that in fact are just new names for old functions and similarly, staff and financial managers have renamed and became process owners of their area of responsibility. In regards to this, it is claimed that the organization became process oriented. In order to identify processes correctly, the following questions can be asked: who is the customer or the supplier of the process? Is there repetitiveness? (Bergman & Klefjö 2007)
3.1.4 Process management in a brief
The adoption of a process view and continuously improving processes has led to the philosophy of process management which was originally developed at IBM where focus on business processes has became central in the work for quality improvement. The concept of process management has been applied to many key processes and generated excellent results. A central principle in process management is to adopt a holistic view of the organization and particularly improve the quality, efficiency and adaptability of processes. The methodology of process management is based on a procedure consisting of the following steps: organization for
improvement – the appointment of process owner and a process improvement team, understanding the process – this step includes defining the interfaces and identification of process customers and suppliers, process mapping and work flow documentation. Process
observation – the establishment of control points and the implementation of regular measurements. The final step is a continuous improvement of the process – measurement is analyzed and used for process improvement. There are three important roles in process management: a process owner, who is responsible for the strategic decisions that concern the process, a process manager who bares the responsible for how the process is controlled operatively, and a competence supplier responsible for supplying appropriate competence in the process (Bergman & Klefjö 2007).
3.1.5 Process measurement
Since the year 2000 when the latest version of ISO 2000 family of standards was launched, process performance measurement has been a topic of great interest among industrial managers. The IS0 9001:2001standard relates to the process approach as a basic management principle informing that desired results are achieved more efficiently when activities and related resources are managed as a process. The term performance is linked to a range of other terms and concepts such as effectiveness, efficiency, productivity, yield, capability, quality and more. The main purpose of process measurement is to provide objective and relevant data about the real behavior of the process to the process owner as described by Nenadál (2008).
Yaniv Ben Or – Measuring For Improvement
17
“Measurement can provide knowledge, and knowledge is the prerequisite for change”
(Ljungberg 1998, p.11). To develop or to change a measurement system is to change the way people act and how they perceive their contribution to the targets and strategy of their organization. Measurement can generate knowledge that can affect people. It can provide employees the required information for sufficient motivation and commitment, for flexibility, responsiveness, quality and other characteristics. Process measurement and its insights can support and ease the establishment of a process view, encourage process orientation and process management. Studies have highlighted the connection between the existence of quantitative facts and the awareness of one’s own level of superiority. In addition, measurement has been identified as a key competency for the achievement of world-class logistics (Ljungberg 1998).
Measuring the right things is significant, but it is not enough. There is a need to measure properly as well as it is important to consider in advance the things that are about to happen and things that might go wrong. Ljungberg & Larsson (2001) give an interesting example of a company that noticed that their trucks were used ineffectively and therefore installed measurement instruments in the trucks which registered the length of time the trucks were used. Shortly after the installation, the trucks needed serious coupling reparations. The reason was that truck drivers did not only drive around unnecessarily with or without freight, but also used the coupling to make the truck move even, for example, when they were waiting for orders, shipments and when they simply talked to each other. The conclusion from this example is not that the decision to measure was wide of the mark, but that the measurement was applied wrongly. In this mentioned case, later measurements based on frequency studies provided a clear view of the whole truck fleet instead of each individual truck and granted useful information on factory flow. Occasionally people believe that companies measure too much and that there is no need for measurements at all. People holding the last view forget that by definition of law, accounting reports require measurements. On the other hand, all kinds of incorrect measurements can be seen as unnecessary, which cannot be said in general on measurements. In a world of continuous improvements, driving a business without relevant measurements can be compared to participating in an orientation contest without having a map or a compass and trying to win over well-trained and equipped competitors. The chances to win a contest under such conditions are minimal since without measurements, it is hard to know where you are and where you are going.
The importance of measurements “To measure” does not mean only the determination of quantitative values of different outcomes such as costs in monetary terms, or time in hours for supply of orders. Qualitative observations might be as important while yes/no questions or an evaluation scale could be used to answer questions. We can distinguish between soft and hard factors, when the last often refers to as quantitative values such as costs, time and physical dimensions while soft factors have usually the characteristics of a more subjective evaluation that is not less important. Even qualitative evaluations can provide quantitative values as, for example, values on a scale. The importance of measurement is that it is aimed to provide the foundation to base action on, action that would lead the organization in a direction to reach its goals. In addition, it is important that measurement would indicate if the organization is moving towards the right direction after action was taken as well. The choice of measurement must be considered carefully and systematically. Considering, for example, an airplane pilot who wants to fly his or her plane from destination A to B, what components are required to be included in his or her measurement system? A compass would show the direction without indicating when he or she arrive. A speedometer and a clock might be

Yaniv Ben Or – Measuring For Improvement
18
useful assuming that a map is in hand, while a ruler would be needed as well in order to use the map, but can these instruments alone guarantee a secure flight? An altimeter would also be valuable to indicate about elevation levels. These instruments are all aimed to gather direct measurements. Nevertheless, indirect measurements such as measurement of weather conditions, of flight traffic and conditions at departure and destination locations might be valuable as well. Running a company with the aid of financial measurements alone can be compared to a pilot with an access to one instrument solely (Ljungberg & Larsson 2001).
Why measure? Why should we measure the processes of an organization? While the answer seems to be obvious and there are many reasons for measurements, according to Ljungberg & Larsson (2001) many organizations do not make impressive efforts to establish effective measurement systems for their processes. There is therefore a reason to emphasize the long list of motives and benefits of measurements.
� Measurement answers the question where? and whither? without measurements it is hard to know where you stand, where you are going, what have been accomplished and what is left to achieve. It is hard to improve without measurements, which play a central role for change and development. Absence of measurement often indicates that the performance or property in matter do not develop greatly and effectively.
� Measurement prepares for action. It makes it possible to manage and adjust the organization in line with markets and surroundings changing requirements already at an early stage.
� Measurements allow comparison (benchmarking). Relevant key figures make it possible to compare with competitors or other organizations with similar processes and to easily learn from each other’s strengths and weaknesses.
� Measurement leads to focused management. The expression “things that are measured get done” is not only an assumption, it is a fact. Measurement focuses attention on the important things and affects human behavior.
� Measurements identify problems. They ease the identification and understanding of problems as they not only discover problems and possibilities, they can reveal myths of the root and effect of problems, which problems are most severe and who is responsible for the problems.
� Measurement creates a common language. It can be a way to guaranty that everyone speaks the same language which is important especially in international organization were same terms can have different meanings. Similarly, a “well done” stake in France or Great Britain does not mean the same thing. When something is measured it has to be defined and specified.
� Measurements clarify the relation between effort and result. Efforts of an individual or a team become more effective with the aid of measurements since they indicate on the value and meaning of the efforts. Measurements contribute to the creation of inspiration, not only for control as traditionally considered.
� Measurement motivates. Fast follow up and feedback not only simplify the performance of a task, but motivate for it.
� Measurement eases delegation. Things that are measured are easy to follow and the need to participate in everything and know what is happening is reduced as the measurement

Yaniv Ben Or – Measuring For Improvement
19
system enables the responsible manager to be away for a couple of weeks and when returning, after 5 minutes study, who he/she need to talk to.
� Measurement gives a motive for change. Objective facts and the recognition of them provide a view of the reality as it is and thus, motivating for a change. The gap between the whishes or vision and reality gives inspiration for change.
� Measurement is vital for continuous improvement. It is the motor driving for continuous change as the decision to solve a specific problem should be based not only on its severity, but also on its frequency of occurrence. Even small problems can be harmful if they occur often and simple frequency register can change the view regarding problem ranking.
It is not hard to show the necessity and importance of measurements. It is a central issue for effective management and development of organizations. However, it is hard to measure correctly and it is essential to keep in mind that the purpose of measurements is never to draw diagrams, but to provide knowledge. A well-formed measurement system constitutes a link between strategy and the everyday operations. There is an intimate relation between what we can define and understand, and what we measure and develop. We cannot manage and develop the things that we cannot communicate, we cannot communicate the things that we cannot measure, we cannot measure what we cannot define and we cannot define the things we do not understand. Measurement system development, just like organizations should be perceived as a social system rather than a mechanical system. This implies that development and change of measurements mean change of human behavior and the way humans understand their contribution to fulfill goals. It is therefore that measurement should be perceived in a wider perspective and not only as a method to register data. In order to gather meaningful and correct knowledge, the “right things” are required to be measured in relation to the organization’s values and ambitions (Ljungberg & Larsson 2001). Robson (2004) considers the last issue by answering the question “how does measurement affect human behavior and motivation?” He states that when a person assesses the difference between two values of a measure and the deficiency is perceived as important, the person will be motivated to act. The traditional arrangement in manufacturing was to have operators operating the equipment and inspectors inspecting the products, which often led to resentment and conflicts between operators and inspectors and created high levels of faulty components. This was a result of little ownership of the problem by the people who could affect it most. When operators were skilled to perform the inspection instead of the inspectors, quality, Motivation and ownership were all increased. Another important way in which control systems can affect the behavior of people is based on complexity theory, which has been able to demonstrate that incredibly complex, self-organizing behaviors observed in nature can emerge from the interaction of a small set of control systems. Relating this to process performance measurement, it suggests that the most effective forms of organizations, capable of dealing with unexpected events, are most likely to occur when a small number of critical measures to the success of the process are monitored by the people involved in the process.
3.2 Total Productive Maintenance (TPM) Once organizational goals and visions are defined and there is an understanding of what is needed to be achieved, the challenging stage reveals, which is driving a change in practice. There are today many concepts for companies wishing to develop and change such as Business Process Reengineering (BPR), Continuous Improvement Process (CIP), Just-In-Time (JIT), Total Quality Management (TQM) and Total Productive Maintenance (TPM). According to Ljungberg (2000),
Yaniv Ben Or – Measuring For Improvement
20
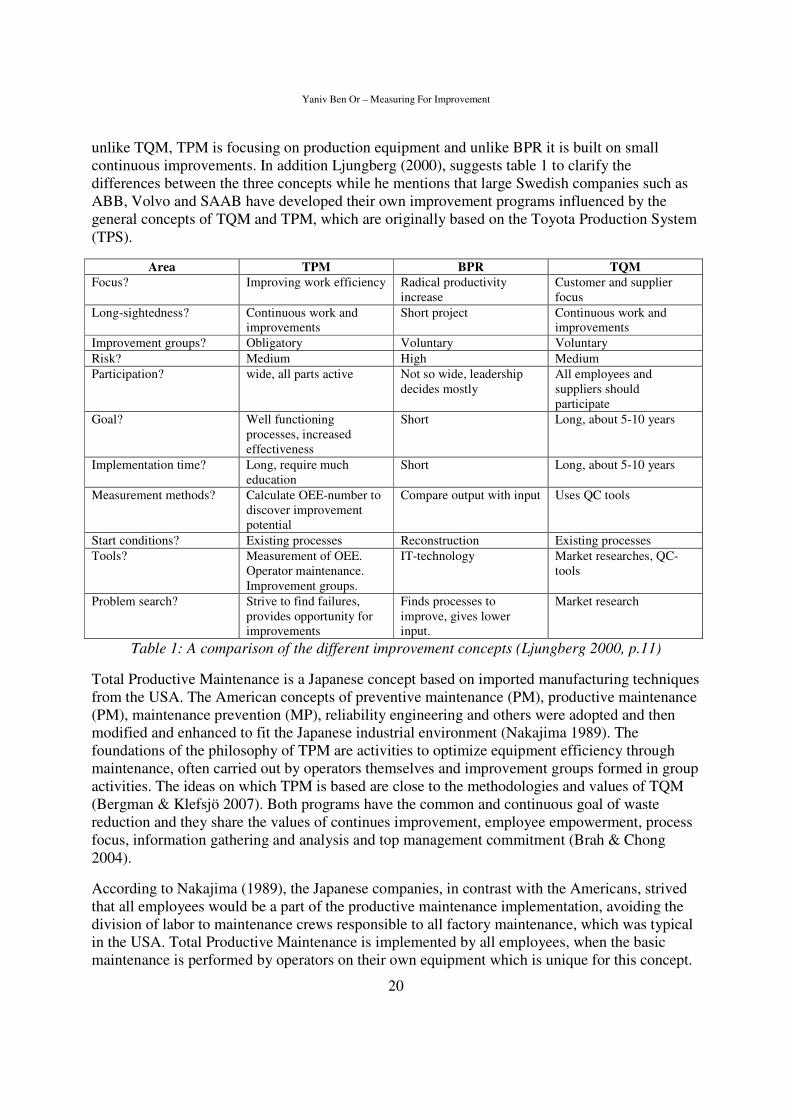
unlike TQM, TPM is focusing on production equipment and unlike BPR it is built on small continuous improvements. In addition Ljungberg (2000), suggests table 1 to clarify the differences between the three concepts while he mentions that large Swedish companies such as ABB, Volvo and SAAB have developed their own improvement programs influenced by the general concepts of TQM and TPM, which are originally based on the Toyota Production System (TPS).
Area TPM BPR TQM
Focus? Improving work efficiency Radical productivity increase
Customer and supplier focus
Long-sightedness? Continuous work and improvements
Short project Continuous work and improvements
Improvement groups? Obligatory Voluntary Voluntary Risk? Medium High Medium Participation? wide, all parts active Not so wide, leadership
decides mostly All employees and suppliers should participate
Goal? Well functioning processes, increased effectiveness
Short Long, about 5-10 years
Implementation time? Long, require much education
Short Long, about 5-10 years
Measurement methods? Calculate OEE-number to discover improvement potential
Compare output with input Uses QC tools
Start conditions? Existing processes Reconstruction Existing processes Tools? Measurement of OEE.
Operator maintenance. Improvement groups.
IT-technology Market researches, QC-tools
Problem search? Strive to find failures, provides opportunity for improvements
Finds processes to improve, gives lower input.
Market research
Table 1: A comparison of the different improvement concepts (Ljungberg 2000, p.11)
Total Productive Maintenance is a Japanese concept based on imported manufacturing techniques from the USA. The American concepts of preventive maintenance (PM), productive maintenance (PM), maintenance prevention (MP), reliability engineering and others were adopted and then modified and enhanced to fit the Japanese industrial environment (Nakajima 1989). The foundations of the philosophy of TPM are activities to optimize equipment efficiency through maintenance, often carried out by operators themselves and improvement groups formed in group activities. The ideas on which TPM is based are close to the methodologies and values of TQM (Bergman & Klefsjö 2007). Both programs have the common and continuous goal of waste reduction and they share the values of continues improvement, employee empowerment, process focus, information gathering and analysis and top management commitment (Brah & Chong 2004).
According to Nakajima (1989), the Japanese companies, in contrast with the Americans, strived that all employees would be a part of the productive maintenance implementation, avoiding the division of labor to maintenance crews responsible to all factory maintenance, which was typical in the USA. Total Productive Maintenance is implemented by all employees, when the basic maintenance is performed by operators on their own equipment which is unique for this concept.

Yaniv Ben Or – Measuring For Improvement
21
The word “total” in “total productive maintenance” is referred to three important features: total participation as already mentioned, total preventive maintenance and total effectiveness. TPM was introduced in Japan in late 70’s and since then became widely accepted. For example, TPM provides essential support for the famous Toyota Production System. The success of TPM depends on the abilities to predict the maintenance needs by continuously knowing the condition of equipment. Predictive maintenance is a key feature in TPM as modern techniques for monitoring and to diagnose equipment conditions under operation that should be used in order to identify signs of deterioration and imminent failure. TPM aims to increase effectiveness of equipment to reach its full potential and remain at that level. Both workers and machinery should function steadily under optimal conditions with no breakdowns and no defects. There are however, difficulties that limit equipment effectiveness, which can be categorized to six types of losses.
3.2.1 Six big losses limit equipment effectiveness
The six big losses were presented in Nakajima (1989) and are mentioned frequently in studies and literature concerning OEE and TPM such as Ljungberg (2000), Fleischer et al. (2006), Huang et al. (2003), Muthiah & Huang (2007), De Ron & Rooda (2006), Muchiri & Pintelon (2008), and Dal et al. (2000) among others.
Breakdown losses Breakdowns cause two types of losses: time losses and defective products. Equipment failures that are sudden, dramatic or unexpected are referred as sporadic breakdowns and are usually obvious and easy to correct. These breakdowns account for a large part of the total losses and that is the reason that a great deal of time and effort is invested on a search to eliminate them. On the other hand, frequent or chronic minor losses are often ignored and become neglected when efforts to cure them fail.
Setup and adjustment losses These losses result from downtime and defective products that occurring when production of one item ends and equipment is adjusted to meet the requirements of a different item. Setup time can be reduced by making a clear distinction between setup operations that must be performed when the machine is down and operations that can be performed when machine is still running.
Idling and minor stoppage losses In contrast to breakdowns, minor stoppages occur when production is interrupted by a temporary malfunction or when a machine is idling. An example of such a stop is when some work-pieces block the top of a chute, causing the equipment to idle. Removing the obstructing pieces is restoring normal production. Such small problems often affect equipment effectiveness dramatically and while easily remedied, they are easily overlooked due to quantification difficulties.
Reduced speed losses These losses refer to the speed differences between the actual operating speed and the equipment design speed. Although these losses constitute a large obstacle to equipment effectiveness, they are typically overlooked in equipment operation. The losses should be studied carefully aiming to eliminate the gap between the design speed and the actual speed. Different reasons might cause speed losses. Some examples are mechanical problems, defective quality and fear for abusing or

Yaniv Ben Or – Measuring For Improvement
22
overtaxing the equipment. Deliberately increasing the operation speed can contribute to problem solving by revealing latent defects in equipment conditions.
Quality defects and rework These losses in quality are caused by malfunctioning production equipment and can be separated to two groups of sporadic defects and chronic ones. The first include sudden increases in the quantity of defect or other dramatic phenomena. The causes of chronic defects are difficult to identify and in order to reduce them a careful investigation is required. The main goal, as always, is to eliminate the defects completely.
Startup losses These are yield losses that occur during the early stages of production, from machine start up to stabilization. The volume of these losses varies depending on the stability of the process, equipment maintenance level, technical skills of operators and more. The volume of these losses is surprisingly high and the possibility of eliminating them is often hidden due to uncritical acceptance of their inevitability.
The improvement goals for the preceding losses are set in the following table:
Type of Loss Goal Explanation
1. Breakdown losses 0 Reduce to zero for all equipment 2. Setup and adjustment losses minimize Reduce setups to less than ten minutes 3. Speed losses 0 Bring actual operation speed up to
design speed; then make improvements to surpass design speed
4. Idling and minor stoppage losses 0 Reduce to zero for all equipment 5. Quality defect and rework losses 0 Extremely slight occurrences acceptable 6. Startup (yield) losses minimize
Table 2: Improvement goals for chronic losses (Nakajima 1989, p.31)
3.2.2 Chronic losses and sporadic losses
Chronic losses refer to losses that occur repeatedly within a range of distribution when sudden outbreaks that go beyond this range are referred to as sporadic. These sporadic outbreaks might be formed as an increase in the quantity of a particular phenomenon or a completely different one. To overcome the sporadic losses, restoration of conditions is needed, since they are usually trigged by condition changes. On the other hand, the remedy to chronic losses is innovation. Since the roots of these problems are hidden in the structure of equipment and the methods used, the problems tend to resist traditional remedies. The losses can only be reduced by breakthrough thinking and creative methods and by deserting conventional tactics. In the case of sporadic losses, the relationships between causes and effects are relatively simple to trace while for chronic losses the relationship is often unclear (Nakajima 1989). The table below describes the characteristics of each loss:
Loss Obvious Hidden
� Sporadic breakdowns Chronic breakdowns
x x
� Setup and adjustment x x � Idling and minor stoppage x � Speed x � Sporadic quality defects
Chronic quality defects x
x
Table 3: Characteristics of loss, (Nakajima 1989, p.43)
Yaniv Ben Or – Measuring For Improvement
23
3.2.3 Improving setup and adjustments and SMED
The space of time between the instance when the production of one product is completed, and the time when standard quality is attained for the production of the next product, is referred to as downtime due to setup and adjustments. This time may include the time required to remove dies and jigs, clean up, prepare dies and jigs for the next product, reassemble the equipment and adjust it, perform trial runs and adjust until acceptable product quality and reliability is achieved. Setup and adjustment should be performed quickly and correctly which requires planning and a systematic inquiry to identify ways to reduce time without reducing accuracy (Nakajima 1989). As described in Russell and Taylor (2003), Shigeo Shingo was a consultant hired by Toyota to study die setup in order to reduce changeover times and teach the techniques to workers and suppliers. Shingo proved to be a genius at the task as he succeeded to reduce a 1000-ton press from 6 hours to 3 minutes using a system he called single minute exchange of dies (SMED). The system, which can be applied to any type of setup, is based on the following principles:
1. Separate internal and external setup. Internal setup is referred to activities that can be performed only when the equipment is stopped and cannot take place until the equipment is finished with previous operation. External setup means activities that can take place while the machine is running and can be performed in advance to save time when setting up the machine. By the time machine is finished processing one product, worker should have completed the external setup and be ready to perform the internal setup for the next product. This concept alone can help reducing setup time by 30-50 percent.
2. Convert internal setup to external setup. Many external setup tasks are hidden in internal setup time and it is important to make sure that operating conditions such as gathering tools and fixtures, preheating and injection mold or centering a die is prepared in advance.
3. Streamline all aspects of setup. Organizing the workplace properly, locating tools and dies near their point of use and keeping machines and fixtures in good shape, external activities can be reduced. Simplifying or eliminating adjustments can assist to minimize internal setup activities. Preceding desired settings, using quick fasteners and locator pins, preventing misalignment and making movements easier are all examples of procedures to reduce internal setup time.
4. Perform setup activities in parallel or eliminate them entirely. Adding an extra person to perform a setup can reduce setup time considerably. Often, two people can perform a setup in less than half the time needed by a single person. The standardization of components, parts and raw materials can reduce and even eliminate setup requirements.
In order to gain an objective view of the setup process, it is useful to involve workers and engineers for the task of setup time reduction. Videotaping the setup process can help the team generate ideas as well as applying motion and time study principles. Once the new setup procedures are formed and have been agreed on, they need to be practiced until they can be practiced perfectly.
As mentioned in Singh & Khanduja (2010), it is important to analyze the targeted equipment from the theory of constraints (TOC) point of view, and identify if the target is a bottleneck. Only when the target is a bottleneck, SMED activities should be applied since applying to non-bottleneck resources that already work with relatively high capacities has only limited value and do not require immediate attention. The theory of constraints was originally introduced by the

Yaniv Ben Or – Measuring For Improvement
24
Israeli researcher Eli Goldratt and described in his novel “The Goal”. The idea behind the theory is to focus attention on the capacity constraint or bottleneck parts of the operation by identifying the location of the constraint, removing it and moving on to the next one. According to Goldratt, the bottleneck should be the control point of the whole process and it is referred to as “the drum” since it sets the beat for the rest of the following process. Since the capacity of the bottleneck is insufficient, it should be working all the time and a buffer of inventory should be kept in front of it to assure it has work. In addition, there is a need for a “rope”- communication between the bottleneck and earlier parts of the process whose production in full capacity would accumulate before the bottleneck (Slack et al. 2010).
3.3 Overall Equipment Effectiveness (OEE)
3.3.1 What is OEE? Since competitiveness of manufacturing companies highly depends on the availability and productivity of their facilities as enlightened by Fleischer et al. (2006), reliable metrics for performance measurements are highly appreciated. Although the use of measurements and analysis by manufacturing companies has been studied for decades, traditional metrics capture only part of the performance of manufacturing equipment and are therefore not very helpful for the identification of problems that is vital for increasing productivity (Huang et al. 2003). As a part of the total productive maintenance (TPM) concept that was launched by Seiichi Nakajima in the 1980s, a quantitative metrics called overall equipment effectiveness (OEE) was provided for measuring the productivity of individual manufacturing equipment in a factory. The concept of OEE was recognized in the late 1980s and early 1990s as a fundamental method for measuring equipment (Muthiah & Huang 2007), it is becoming increasingly popular (Slack et al. 2010) and has been widely used as a quantitative tool in the semiconductor manufacturing operations (Huang et al. 2003). Semiconductor Equipment and Materials International (SEMI) developed a standard for defining and measuring OEE that was described in SEMI (2001). OEE is a simple and clear overall metric and is therefore appreciated by managers due to its aggregating approach instead of many detailed metrics (De Ron & Rooda 2006). Manufacturers in other industries have also adopted it in order to improve the utilization of their assets (Muchiri & Pintelon 2008).
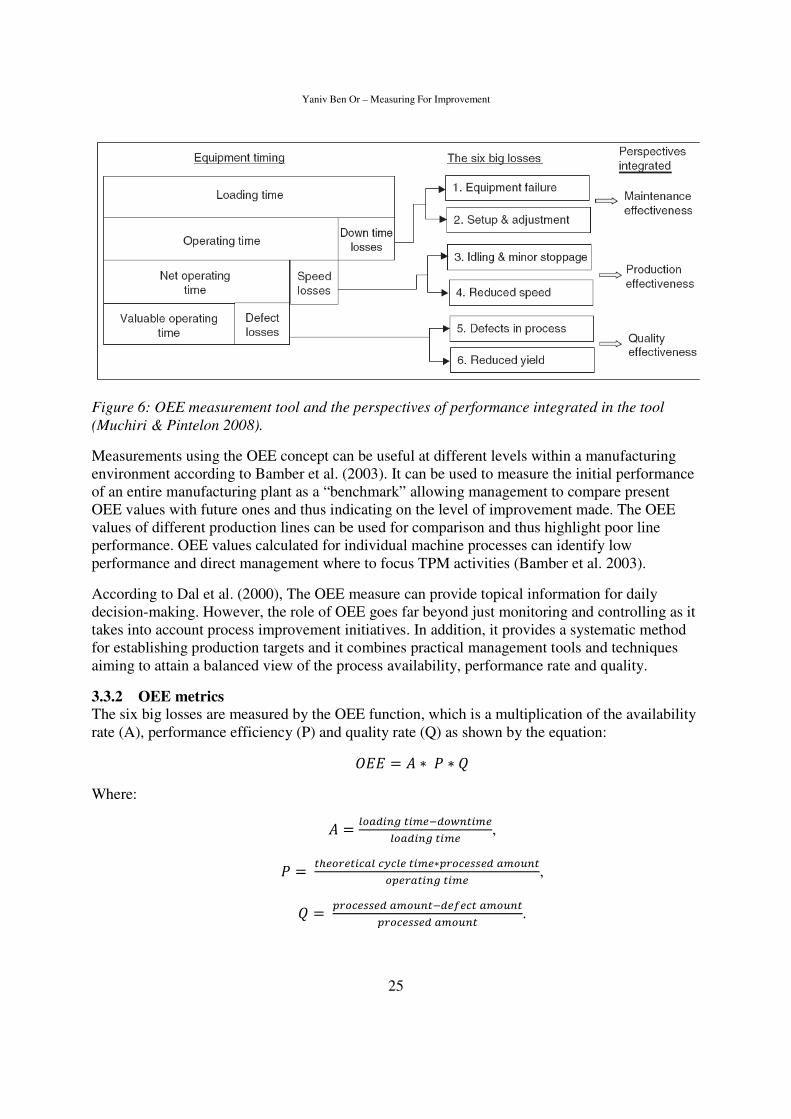
OEE is defined as a measure of the total equipment performance that, in other words, is meant to show the degree to which the equipment is doing what it is supposed to do (Williamson 2006). It is a tool based on three factors that can be used to analyze equipment performance including availability efficiency, performance efficiency and quality efficiency. OEE is used for the identification of production losses that are related to equipment with the purpose of improving the total performance of the asset. These losses are categorized in aim to provide the foundation for improvement priorities setting and to help with the initiation of root cause analysis. It can be used for revealing hidden capacity in manufacturing processes (Muchiri & Pintelon 2008) and when measured repeatedly, it can be used to trace and track improvements or decline in equipment effectiveness over a time period (Dal et al. 2000). OEE is designed to identify losses that cause reduction in equipment effectiveness by absorbing resources without creating value. According to Nakajima (1989) the losses are categorized to six big losses that should be eliminated in order to achieve overall equipment effectiveness. The losses are: breakdown, set-up and adjustment, idling and minor stoppage, reduced speed, and quality defect and rework (see more details in 3.2.1). The relation between the six big losses and equipment timing is described in figure 6:
Yaniv Ben Or – Measuring For Improvement
25
Figure 6: OEE measurement tool and the perspectives of performance integrated in the tool
(Muchiri & Pintelon 2008).
Measurements using the OEE concept can be useful at different levels within a manufacturing environment according to Bamber et al. (2003). It can be used to measure the initial performance of an entire manufacturing plant as a “benchmark” allowing management to compare present OEE values with future ones and thus indicating on the level of improvement made. The OEE values of different production lines can be used for comparison and thus highlight poor line performance. OEE values calculated for individual machine processes can identify low performance and direct management where to focus TPM activities (Bamber et al. 2003).
According to Dal et al. (2000), The OEE measure can provide topical information for daily decision-making. However, the role of OEE goes far beyond just monitoring and controlling as it takes into account process improvement initiatives. In addition, it provides a systematic method for establishing production targets and it combines practical management tools and techniques aiming to attain a balanced view of the process availability, performance rate and quality.
3.3.2 OEE metrics
The six big losses are measured by the OEE function, which is a multiplication of the availability rate (A), performance efficiency (P) and quality rate (Q) as shown by the equation:
��� = � ∗ � ∗ �
Where:
� =�� �� � ������� ��
�� �� � ��,
� = ������ �� ���� � ��∗�������� �����
����� �� � ��,
� = �������� ������������ �����
�������� �����.
Yaniv Ben Or – Measuring For Improvement
26
The availability rate (A) measures the ratio of the actual operation time to the loading time (planned production time). Loading time is the total time minus planned time losses. Downtime is the stoppage time loss caused by breakdowns, set-up, adjustments etc. This provides the ratio of the operating time to the available planned time. Using this definition, loading time (or planned production time) is separated from theoretical production time and measures the unplanned downtime in the equipment without including time for preventive maintenance (Bamber et al. 2003).
The performance rate (P) is a measure of the ratio of the actual operating speed of the equipment and the ideal speed (designed capacity of the equipment). It shows the actual deviations in production time from the ideal cycle time (Garza-Reyes et al. 2010).
Cycle time is the operating speed or details per hour calculated as time per item (Ljungberg 2000). According to Nakajima (1989), the following methods can be used to determine cycle times:
� Cycle time is determined by design speed. � Cycle time is based on current optimal condition and can change in accordance to
product. � The highest cycle time achieved or estimated on the basis of similar equipment.
The quality rate (Q) considers the quality losses based on the number of items rejected due to quality defects. Using this definition, losses that happen close to the equipment are considered, but not losses that appear downstream (Bamber et al. 2003).
An example of OEE calculation is provided in Ljungberg (2001): Availability is calculated by subtracting the time that the machine was inactive not only due to unplanned stop in the traditional manner (breakdowns etc.), but it is including even setup, adjustment and tool-change time. If, for example, a machine is idle every day on average 15 minutes due to breakdowns, and 55 minutes due to setup, adjustments and tool-change, the available operative time becomes 450-70=380. The availability rate is then:
A= %84450
380=
If a machine is producing 250 items each day, and we know that the theoretical cycle time is 1 minute per item, than the performance rate is calculated from the multiplication of the two rates divided by the available operative time as followed:
P= %66380
1250=
∗
The quality rate is calculated by subtracting the amount of defect items from the total amount and dividing the result with the total amount. If we have on average 5 defects each day of the 250 produced then quality rate becomes:
Q= %98250
5250=
−
Yaniv Ben Or – Measuring For Improvement
27
Finally, the Overall Equipment Effectiveness is a multiplication of the rates:
OEE= %54%98%66%84 =∗∗
Due to the fact that OEE is defined and used differently under varying circumstances by companies, figures of the optimal OEE are hard to identify and compare (Bamber et al. 2003). According to Nakajima (1989), under ideal conditions organizations should have A > 0.90, P > 0.95 and Q > 0.99. The resulted OEE value becomes OEE > 0.84 for world class firms and this figure can be used for benchmarking as a typical capability of manufacturing.
3.3.3 OEE modifications
According to Garza-Reyes et al. (2010), the concept of OEE has developed and evolved since it was introduced by Nakajima in the 80s. Due to its increasing use in industry and its effectiveness of measurement for individual equipment, further research has attempted to broaden the application scope of OEE to entire processes or manufacturing plants. The scope of OEE use has also been expanded to include more elements of performance than just availability, performance and quality. Some examples of such expansions are Sherwin (2000) who measures the performance of a whole process, Nachiappan and Anantharam (2006) who defined overall line effectiveness, Braglia et al. (2009) who assessed the performance of a production line, Oechsner et al. (2003) proposed a measurement to the performance of an entire factory while Garza-Reyes (2008) developed overall resource effectiveness that considers material efficiency and variations in material and process costs.
3.3.4 OEE critics
Although the studies reviewed are generally positive and recognize the benefits and importance of OEE metrics, there are arguments about weakness of OEE and suggestions for modifications and focus change. A number of studies examining OEE metrics such as (Huang et al. 2003, Muchiri & Pintelon 2008, Oechsner et al. 2003, Scott & Pisa 1998) mention the argument that OEE is limited to measure productivity behavior of individual equipment and therefore may be insufficient as focus should be set on the performance of the whole factory. The integrated production system as a whole is ought to be highly efficient, instead of individual equipment. De Ron & Rooda (2006) are reviewing other arguments stating that OEE does not take into account all factors that reduce capacity utilization as planned down time and lack of material and personnel. In addition, the named authors argue that an appropriate time basis is the available time instead of loading time and a number of studies that support this view are provided. Lastly, they state that the accuracy of OEE values is determined by the quality of the collected data.
3.3.5 OEE assessment
Nakajima (1989) suggests a qualitative approach for assessment of the Overall Equipment Effectiveness presented in the following table on the next page:

Yaniv Ben Or – Measuring For Improvement
28
Assessment Level 1 Level 2 Level 3 Level 4
1. Breakdown losses 1. Combination of sporadic and chronic breakdowns 2. BM >PM 3. Significant breakdown losses 4. Autonomous operator maintenance not organized 5. Unstable life spans Equipment weaknesses are unrecognized
1. Sporadic breakdowns 2. PM≈BM 3. Breakdown losses still significant 4. Autonomous maintenance being organized 5. Parts life spans estimated 6. Equipment weaknesses well acknowledged 7. MI (maintainability improvement) applied on the above points
1. Time based maintenance established 2. PM>BM 3. Breakdown losses less than 1% 4. Autonomous maintenance activities well- established 5. Parts life spans lengthened
1. Condition-based maintenance established 2. PM 3. Breakdown losses 0.1%-0 4. Autonomous maintenance activities stable and refined 5. Parts life spans predicted 6. Reliable and maintainable design developed
2. Setup and adjustment losses
1. No control- laissez
faire production by operators 2. Work procedures disorganized and setup/adjustment time varies Widely
1. Work procedures organized (e.g. internal and external setup distinguished) 2. Setup/adjustment time unstable 3. Problems to be improved identified
1. Moving internal setup operations into external setup time 2. Adjustment mechanisms identified and well understood
1. Setup time less than 10 minutes 2. Immediate product changeover by eliminating adjustments
3. Speed losses 1. Equipment specifications not well understood 2. No speed standards (by product and machinery)
1. Problems related to speed losses analyzed -Mechanical problems -Quality problems 2. Tentative speed standards set and maintained by product 3. Speed vary slightly
1. Necessary improvements being implemented 2. -Speed is set by the product -Cause and effect relationship predicted between the problem and the precision of the equipment , jigs, and tools 3. Small speed losses
1. Operation speed increased to design speed or beyond through equipment improvements 2. Speed standard set and maintained by product (final standards) 3. Zero speed losses
4. Idling and minor stoppage losses
1. Losses from minor stoppages unrecognized 2. Unstable operating conditions due to fluctuation in frequency and location of losses
1. Minor stoppage losses analyzed quantitatively -Frequency and location of occurrence -Volume lost 2. Losses categorized and outbreak mechanism analyzed; preventive measures taken on trial-and-error basis
1. All causes of minor stoppages analyzed, all solutions implemented, conditions favorable
1. Zero minor stoppages ( unmanned operation possible)
5. Quality defect and rework losses (startup losses included)
1. Chronic quality problems are neglected 2. Many successful remedial actions have been taken
1. Chronic quality problems quantified -Details of defect, frequency -Volume lost 2. Losses categorized and outbreak mechanism explained; preventive measures taken on trial and error basis
1. All causes of chronic quality defects analyzed, all solutions implemented, conditions favorable 2. Automatic in-process detection off defects under study
1. Quality losses=0.1%-0
Table 4: OEE assessment model, (Nakajima 1989, p.32)

Yaniv Ben Or – Measuring For Improvement
29
3.4 Analysis and assessment models and methods
3.4.1 The Capability Maturity Model (CMM)
The CMM was originally developed as an assisting tool for US department of defense to choose contract software providers. The model was adopted by commercial organizations worldwide and adapted to various forms such as the software engineering institute aimed to improve the production of software (Williams 2008). This model is described by Bergman & Klefjö (2007) as an interesting evaluation model appropriate for quality improvement programs. The model is based on a hierarchical organization of software development in five levels:
� Initial process - the software process at this level is characterized as ad hoc or even chaotic, when success is achieved only due to the skills and competence of individual employees. Projects here are regarded as completely unique ones while there is no learning from one project to the next. Only a few processes are defined and are appropriately supported.
� Repeatable process - at this level, basic project management processes are launched with the aim of tracing cost, schedule and functionality. Earlier project successes can be repeated due to established process disciplines allowing managers to base planning on experience from previous projects.
� Defined process - the software process at this level is documented, standardized and integrated into a standard for management and engineering activities. A process for development and maintenance of the software is established and well documented. There is a project group for each project, identifying the sub processes and the management of the process is well defined. As a result, costs, timetables, functionality and quality are followed up. There is an understanding among people involved of the importance of a well-defined and visible process.
� Managed process - the software and product quality is derived from quantifiable targets and measurements that are well understood and controlled, achieved with the aid of well defined and stable measuring methods. The process at this level is monitored by facts collection, providing the ability to identify variation and eliminate it for improvement.
� Optimizing process – at this level of maturity, process improvements are based on quantitative feedback and from innovative ideas and technologies and improvements are natural parts of the continuous work. As the organization moves up these five levels, the processes are believed to improve their predictability, effectiveness and control.
Figure 7: An illustration of the Capability Maturity Model’s different levels.
Yaniv Ben Or – Measuring For Improvement
30
For each level of the named above, key areas for improvement can be identified when the sequential structure provides a frame for the improvement process. The goal is to reach the next maturity level, concerning a number of different characteristics. To reach this goal, there is a need to define a working method. Such methodologies however, are not provided in the CMM, and only the results that they lead to and requirement to be fulfilled should be well described and documented (Bergman & Klefjö 2007). The model is broadly implemented only within the IT/software industries; however studies suggest employing it in different fields. SPICE is a version of the model designed specifically for construction enterprises (Amaratunga et al. 2002). Different studies suggest using the model in other contexts such as Facility Management (Hinks 1998), Medical Security (Williams 2008), Supply Chain Management (Lockamy & MCcormac 2004) and Reliability engineering for electronics companies (Tiku et al. 2007).
3.4.2 Process Audit
According to Ljungberg & Larsson (2001), process audit is a comprehensive evaluation of a process and its environment aiming to identify problems and possibilities, to recognize how progressed the process work is and to provide the foundation for priority decisions. While it is not as process-specific and detailed as process analysis, the audit is implemented with focus on a process, but it is raising questions about its environment and the entire organization. The audit begins with a number of comprehensive “yes/no” questions intending to provide a general view of the current status. If the answer “no” is dominating, it means that the organization is in a very early stage of its process-based activity development. Some examples of questions are given as followed:
� Has the organization identified its core processes? � Has the organization mapped its core processes? � Have main customers and their requirements and expectations been identified? � Is the organization adapted to focus on processes? � Have process-owners been appointed? � Is there a process oriented measurement system? � Is there someone responsible for the measurement system? � Are different parts of the organization using similar methods for process development? � What measured result has been achieved through process improvements?
Although these questions are relatively easy to answer, they indicate a great deal about the organization’s real development work relating to process orientation. If the dominating answer is “yes”, there is a reason to go forward with elaborating questions considering issues such as process identification, process design, organization, process measurement, performance and more.
3.4.3 Failure Mode and Effect Analysis (FMEA)
FMEA is a methodology specified to evaluate a system, design, process, or service for possible ways in which failures can occur. Each failure whether it is a problem, an error, a risk or concern is considered while an estimation of its occurrence, severity and detection is made. Then, an evaluation is made if it is necessary to take action, to plane or ignore in order to minimize the probability or the effect of failure. This approach is simple and at the same time straightforward, might be either quantitative or qualitative and defined to optimize the system, design, process, product or service (Stamatis 1995).

Yaniv Ben Or – Measuring For Improvement
31
The analysis (FMEA) is an effective problem prevention methodology that can easily interface with many reliability-engineering methods (Tay & Lim 2006). The goal of the analysis is to prevent processes from building failure possibilities. The implementation of the analysis is done in order to anticipate failure possibilities and to find means for minimizing risks that failures develop through the use of competencies and earlier experiences (Britsman et al. 1993). Traditionally, FMEA determines a Risk Priority Number (RPN) by multiplying three input factors: severity, occurrence and detect as shown below:
DetectionOccureneceSevirityRPN ××=
Experts should estimate these three factors in accordance with the scale from “1” to “10” when their estimation should base on common evaluation criteria (Tay & Lim 2006). According to Britsman et al. (1993), the implementation of a process FMEA can be divided into three central phases: the creation of a flow scheme, form fillings and identification of needed measures. For the evaluation of the factors in general, the following is suggested:
� Occurrence: review the different failure types and their triggering reasons; estimate how frequent they occur in the discussed operation based on the collected data. Quantify the occurrence on a scale from “1” to “10” when “1” means that the failure is unlikely to occur and “10” means that the failure is highly likely to occur.
� Severity: for every failure cause, choose an effect number based on a scale from “1” to “10”. Evaluate even the effect on the production plant or facility. It is appropriate to note separately what each effect number means. For example, number 8 could stand for “a risk for oil leak”.
� Detection: usually a process is monitored or controlled in some way. Evaluate how effective is the monitoring and control with respect to each failure cause, again on a scale from “1” to “10”, estimate the probability of detection.
It is important to note recommended measures to avoid failures and make use of ideas and proposals that are noted. Some ideas can be easily implemented while some might require additional deeper investigation. According to Britsman et al. (1993), in some situations there is no idea to evaluate the probability of detection. Tay & Lim (2006) suggest a framework for the FMEA as illustrated in figure 8 shown on the next page.

Yaniv Ben Or – Measuring For Improvement
32
Figure 8: The FMEA procedure (Tay & Lim 2006)
3.4.4 Value analysis
Ljungberg & Larsson (2001) suggest the value analysis as a method to analyze processes. The method implicates the classification of activities of a sub-process to the following categories:
� Value adding activities – activities that contribute directly to solve customer problems and satisfy customer requirements. These are activities that customer can easily be willing to pay for. The challenge is to develop these activities since an activity that is value adding does not mean that it is fully satisfies customers or that it is effective.
� Non-value adding activities – activities that do not create value for customers, but are necessary to perform to allow the organization or process to function. These could also be activity that creates value to another important stakeholder than customer. Examples of typical activities are warehousing, waiting, moving, controlling and managing. These activities are ought to be minimized.
� Wastage – these are activities that neither create value for the customer nor for other stakeholder. These activities should be eliminated.
These activities may seem easy to classify, however in reality that is not always the case. It is hard to determine exactly and objectively which activities are value adding and which are not, while classification on a more subjective evaluation basis is applicable. The reason to classification difficulties is related to the fact that the activities involve people that hold different views and knowledge, and that they are related to other activities and stakeholders’ requirements. Traditionally, organization succeeded to eliminate waste since waste is easy to identify and “feels

Yaniv Ben Or – Measuring For Improvement
33
wrong”, while non-value adding activities were less in focus and their internal value was taken for granted.
3.4.5 Cause - Effect diagrams
The cause - effect diagrams, also known as fishbone diagrams or Ishikawa diagrams, are a method that is effective in particular for assisting the search for the root causes of problems. The method is to consider questions such as what, when, where, how and why regarding causes of the problem considered, and moreover to identify possible answers in an explicit structured way. The diagrams have become extensively used in improvement programs since they provide a way for structuring brainstorming sessions (Slack et al. 2010). An example of diagram used to deal with a problem of service engineers returning from customer due to absence of spares and equipment is provided in figure 9 below.
Figure 9: Cause – Effect diagram of unscheduled returns, (Slack et al. 2010, p.561).
3.4.6 Why-why analysis
This analysis starts by stating the problem and asking why that problem is occurring. When the reasons for problem are identified, each reason is considered and again the question why is asked, this time regarding the occurrence of the reasons. The procedure continues until no more answers to the question why can be generated or alternatively, until causes seems self contained and can be addressed (Slack et al. 2010).

Yaniv Ben Or – Measuring For Improvement
34
4. Method
In this chapter, the methodology applied in the study is explained. At first, basic business and
management research methods are reviewed and followed by a description of the strategy chosen
for the study. Additionally, the implementation procedures are presented and clarified in detail.
Finally, the chapter continues portraying the measures taken to assure the credibility and quality
of the study.
4.1 Strategy
4.1.1 Business and management research methods The choice of an appropriate methodology for the study is an essential issue for the success of fulfilling the predetermined goals that were stated in 1.2. It is therefore of highly importance to consider seriously the strategy to be taken and choose the most suitable approach. Bryman & Bell (2007) highlights that there are two points which are relevant in particular for research in the area of management and business. The first point is considering the methods of management and business research. The methods are not simply neutral tools, they are tied to different perspectives that social scientists embrace about the nature of social reality and how it should be studied. The second point regards the way that research methods and practice are linked with the wider social scientific enterprise. The data of the research are usually collected in relation to an organizational problem or on a topic related to a specific opportunity. Research on decision making processes that led to a specific disaster is an example of the last. Cooper & Emory (1995) distinguish between different types of studies. Reporting is an elementary level of an inquiry that is made for summarizing data, often statistics. Description tries to answer questions as who, what, when, where and sometimes how. This type of study aims to describe or define a subject by creating a profile of a group of problems, people or events. Explanation on the other hand, goes beyond just describing and attempts to clarify the causes of the phenomenon that the descriptive study only observed. Lastly, prediction tries not only to explain an event after it has occurred, but to predict when it will occur. Zikmund (1997) distinguishes in a similar way, between exploratory studies, descriptive research and in addition causal research, which is aimed to identify the cause and effect relationship between variables. The last named type is equivalent to the type defined by Cooper & Emory (1995) as prediction. Authors of literature concerning research methods such as Bryman & Bell (2007), Darmer & Freytag (1995), Ljungberg & Larsson (2001), Cooper & Emory (1995) and Saunders et al. (2000), frequently make a distinction between quantitative and qualitative research and between deductive and inductive theory. Furthermore, the subject of having a scientific method for the research is commonly highlighted in business and management research methods literature. This information was considered for choosing the strategy for the study and is discussed in detail in 4.1.4.
4.1.2 Quantitative and qualitative research
The distinction between qualitative and quantitative research strategies is referred to characteristics of the data that is collected and analyzed. Quantitative research is regarded to a study in which measurements are employed and data is constituted of numbers or other values while data that cannot be expressed in a similar way is considered as qualitative. Besides of this basic definition, there are fundamental differences between quantitative and qualitative research

Yaniv Ben Or – Measuring For Improvement
35
strategies. Quantitative techniques are aimed to indicate something about few variables from a representing sample when issues examined are identical for the sample group and can be compared (Darmer & Freytag 1995). The quantitative study entails a deductive approach to the relationship between theory and research; it is formed by techniques similar to those used in natural sciences and embodies the view of a social reality as an external objective observation (Bryman & Bell 2007). Qualitative research on the other hand, is aimed to create a holistic view for approaching problems and is dealing with a large number of variables regarding a limited sample group. It is characterized by a high level of flexibility and adaptation to individuals (Darmer & Freytag 1995). It emphasizes an inductive approach, of theory generation, to the relationship between theory and research. Qualitative research focuses on the ways in which individuals interpret their social world and social reality is seen as shifting property of individuals’ creation. While quantitative research is perceived as oriented towards objectivism, qualitative is related to constructionism. The strategies can be employed separately or can be combined or integrated in different ways. Qualitative research can be used to guide quantitative research and vice versa, or alternatively, both can be implemented in parallel (Bryman & Bell 2007). Both quantitative and qualitative research types are used in this thesis as enlightened in the section about choice of strategy, section 4.1.4.
4.1.3 Deductive and inductive research
Deductive theory is focusing on the most common view of nature of the linkage between theory and research. The researcher deduces a hypothesis based on the existing knowledge and of theoretical considerations regarding a particular domain. The hypothesis must be subjected to empirical study. The researcher needs to translate concepts that are embedded within the hypothesis into operational terms so that entities become researchable (Bryman & Bell 2007). Deduction is described as a form of inference that implied to be conclusive, when the conclusion must follow from reasons given, which represent a proof. A correct deduction means that the reasons given must agree with the real world and be true. The deduction is valid in the cases when it is impossible for the conclusions to be false as long as the premises are true. By deduction, we test whether the hypothesis is capable of explaining the condition of the event. This bond between reasons and conclusion is found to be much stronger in comparison to induction (Cooper & Emory 1995). Inductive theory, on the other hand, is very different. To induce means to draw a conclusion from at least one particular fact or piece of evidence while conclusions explain facts and facts support the Conclusions. The nature of inductive reasoning is that the conclusion is only a hypothesis. It is a single explanation among possible others that fit the fact. Induction occurs when we observe a fact and ask ”why is this?” We develop an explanation, a hypothesis in an attempt to answer the question (Cooper & Emory 1995). An induction is when the researcher draw conclusions based on what the finding suggest for theory that prompted the study. The findings of the study are related to theory, associated with a certain domain of enquiry (Bryman & Bell 2007). This thesis is not intending to test hypothesis, it is aimed to explore effectiveness levels and describe improvement potential based on collected data and therefore has an inductive nature as considered in more detail in the following lines.
4.1.4 Choice of strategy
In order to maintain a good research, the characteristics of a scientific method, which are highlighted in business and management research methods literature such as Cooper & Emory (1995) among others, are employed in the study. The meaning of this attempt is to achieve a superior research through defining the purpose of the research in precision, describing the
Yaniv Ben Or – Measuring For Improvement
36
procedures in detail, planning carefully to yield results that are objective, reporting and estimating how the procedural design affects the findings, choosing appropriate analysis methods and justifying the conclusions by the data of the research.
While the study adopts the approach of reporting and description research aiming to provide an overview of the current situation, it is only a first step of the reasoning that is necessary for building up the foundation for the more meaningful stages of the study, attempting to explain and trying to answer why the facts, such as OEE results are as they are. The research evolves and, in a limited manner, tries to predict what actions would improve the current situation by providing recommendations and suggestions.
The research is designed to inspect effectiveness levels, using scientific methods, in order to quantify the proportion of different losses that limit equipment effectiveness. It can be best described as a bottom up approach, which is locating production losses by evidence and quantified facts and then try to explain why they occur. The reasoning that follows the main goals of the study is to draw conclusions in accordance to that the findings suggest, and has an obvious inductive nature.
Considering the main aim of the study, which is to investigate the current effectiveness levels of manufacturing operations, the causes of inefficiencies and potential for improvement as described in detail in 1.2, there is a motivated reason to investigate shop floor operations by quantitative measurement that would provide an objective, independent and realistic view over the levels of effectiveness of processes. Quantitative metrics such as Overall Equipment Effectiveness (OEE) which are explained in detail in section 3.3, chosen for the study, provide information about the proportions of different production losses and can aid to identify inefficiencies in a systematic way allowing to compare different processes to each other and to set quantitative targets for improvement programs. However, to develop a fruitful and effective analysis, there is a need to accommodate the measurements with an in-depth investigation of process inefficiency causes that can practically be achieved through aiding qualitative research. With the purpose of learning about processes and their performance, observations are required and interviews with involved personnel should be carried out. In order to gain the ability to provide an objective measurement of current effectiveness levels and to develop a suitable analysis, a mixed approach of both quantitative and qualitative nature was chosen for the study. Additionally, aiming to maintain a comprehensive analysis of losses that occur in production processes and to evaluate potential for improvement, a multi-dimensional approach is taken which elevates the analysis frame from the shop floor level to strategic managerial level. For this aim, maturity and process orientation levels are inspected and resources are assessed. This approach helps to cover possible causes of production losses that are linked to organizational and to managerial inefficiencies, allowing the identification of improvement potential at these levels as well.
4.2 Implementation The study was carried out at place of the Nobel Biocare plant in Karlskoga, Sweden, under a period of about twenty weeks in which literature was collected and studied while measurements, observations and interviews were employed on daily basis, allowing the author to study the organization and its operations carefully. Additional information was collected from Nobel Biocare’s website and intranet.

Yaniv Ben Or – Measuring For Improvement
37
The work started with a comprehensive literature review. Karlstad’s University’s library was the main source of printed literature while databases such as Emerald and Business Source Premier were searched for academic publications and earlier studies available online.
In the study, the core process of production was primarily examined. The process was divided to three sub processes: machining (CNC/milling), surface treatment and packaging. For each sub process, OEE values were measured for some equipment while other techniques and models such as OEE assessment, process audit, Capability Maturity Model and value analysis were applied to build up a broad analysis.
4.2.1 Observations
When research questions and objectives are concerned with what people do, watching them doing it is an obvious way to find out and discover relevant information. Observation involves systematically observing, recording, describing and analyzing people’s behavior. Two types of observations can be distinguished: participant observation is qualitative and emphasizes on discovering the meanings that people attach to their actions. In sociology context, participant observation is where the researcher attempts to participate fully in the lives and activities of subjects and therefore becomes a member of their group which enables the researcher to share their experiences by “feeling” it from the inside. Structured observation, on the other hand, is quantitative and is more concerned with the frequency of those actions. The degree of predetermined structure in structured observation is higher than in participant observation. The observation is systematic and it is focusing on quantifying behavior (Saunders et al. 2000). “Scientific observation is the systematic process of recording the behavioral patterns of people,
objects, and occurrences without questioning or communicating with them. The researcher
utilizing the observation method of data collection witness and records the information as events
occur or compiles evidence from records of past events” (Zikmund 1997).
The approach for observations taken in this study depended on the objective that each specific observation aimed to achieve. While a structured observation was performed to determine, for example, downtime loss for OEE calculation that was characterized by quantifying machine down time causes to indicate how often stops occur, an observation of a participant nature was needed to investigate why these stops occur and what can be done to minimize or eliminate them. In other words, both research methods were found to be useful for the overall research strategy.
4.2.2 Interviews
An interview can be used to gather valid and reliable data that are relevant to the questions and objectives of the research. The term interview is used in reality as a general notation for several types of interviews including highly structured interviews using standardized questions or informal interviews and unstructured conversations. Interviews may be categorized to structured
interviews, semi-structured interviews or unstructured interviews (Saunders et al. 2000). Semi and unstructured interviews are sometimes referred to as qualitative interviews (Bryman & Bell 2007). Structured interviews use questionnaires based on predetermined, standardized or identical collection of questions that often have pre-coded answers. Under a semi-structured interview, the researcher uses a list of themes and questions that may vary from interview to interview. In addition, the order of questions may be varied depending of the way conversation develops. According to the nature of this interview type, data will be recorded by note taking or by tape recording the conversation. Unstructured interviews are informal and are used to explore in depth an area of interest. Although there are no predetermined questions, the researcher needs to have a

Yaniv Ben Or – Measuring For Improvement
38
clear idea about aspects of exploration while the interviewee is allowed to talk freely about events, behavior and beliefs considering the topic area (Saunders et al. 2000, Bryman & Bell 2007).
In this study, the different types of interviews were used. While some analysis was done by the use of questionnaires, such as process audit where process managers had to answer a list of predetermined yes/no questions, aimed to identify general patterns of process orientation, semi-structured interviews were used to explain the relationship between different activities or variables and production losses. Informal, unstructured interviews in the form of open conversations took place as well by nature, since the author of this thesis practiced the study at the factory and met relevant key personnel on daily basis. Altogether, a very large number of interviews were conducted during the study and the interviews that were often continuous, carried out under several occasions and maintained a qualitative character. For practical reasons and due to the large number of interviewees, interviews and conversations, the collected information is not referred to each specific date and name of interviewee. However, the following key personal that were primarily interviewed during the study are listed below:
� Plant manager: Arne Lind � Production manager: Stefan Eriksson � Production packaging supervisor: Jörgen Jonsson � Project manager – process development: Peter Gustavsson � Logistics / Planning manager: Anna-Lena Lundkvist � Service department manager: Per Magnus Funke � Process manager – machining: Per Eriksson � Process manager – machining: Anders Wåhlstedt � Process manager – surface treatment and packaging: Jerker Kensen � Process manager – surface treatment and packaging: Dejan Radesjö � Engineering: Harri saks � Engineering: Karinsson Jan
In addition, other staff including a large number of machine and cell operators and setup personnel were interviewed a large number of times.
4.2.3 Secondary data analysis
Information sources for studies can be classified into primary and secondary data. Primary data come from the original sources and are collected in the aim of answering our specific research question. Studies made by others for their own purposes represent secondary data (Cooper & Emory 1995). Bryman & Bell (2007) suggest that this is not necessarily a valid definition since there are cases when a researcher decides to rework the data of an early study that he or she conducted and it can be difficult to know where primary and secondary analysis start and finish.
The purposes for using secondary data are to fill the need for a specific reference on some point and to gather information on some early exploration that can contribute to the present study. Additionally, it can be used as the sole basis for a research study when primary research cannot be conducted due to physical, legal, or cost limitations. Secondary sources can be categorized into internal sources of organizational data and external sources that are created outside the organization and are published (Cooper & Emory 1995).
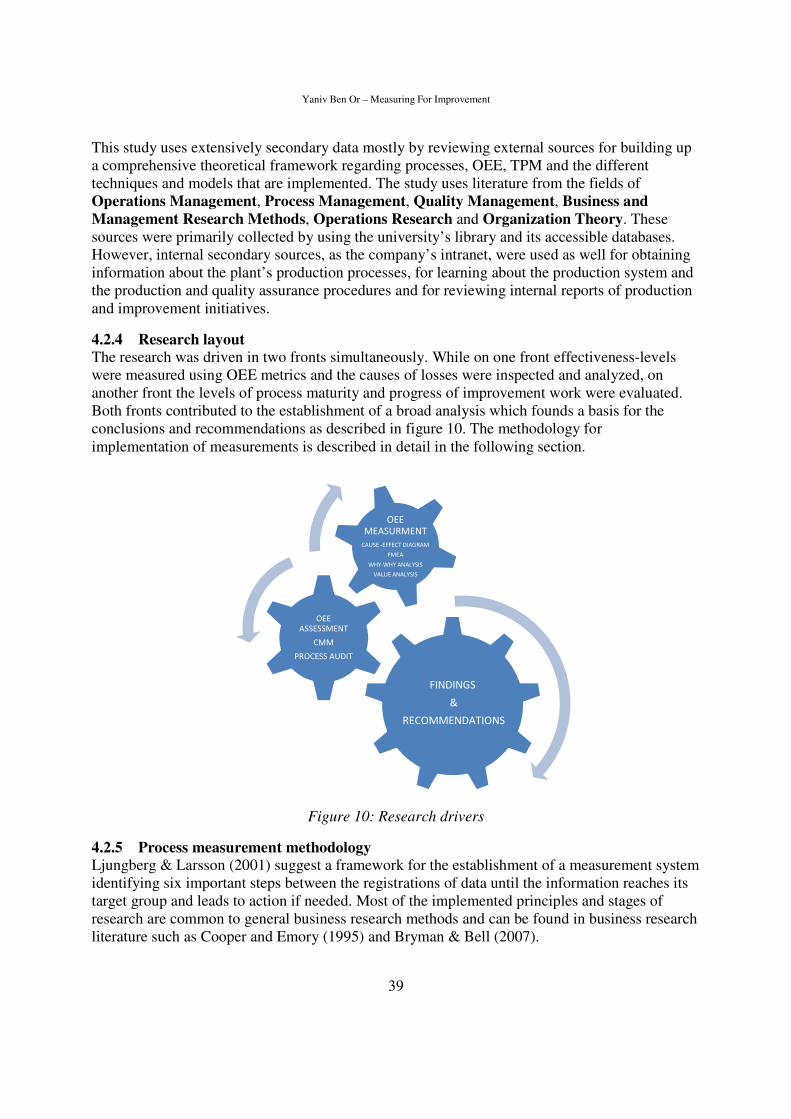
Yaniv Ben Or – Measuring For Improvement
39
This study uses extensively secondary data mostly by reviewing external sources for building up a comprehensive theoretical framework regarding processes, OEE, TPM and the different techniques and models that are implemented. The study uses literature from the fields of Operations Management, Process Management, Quality Management, Business and
Management Research Methods, Operations Research and Organization Theory. These sources were primarily collected by using the university’s library and its accessible databases. However, internal secondary sources, as the company’s intranet, were used as well for obtaining information about the plant’s production processes, for learning about the production system and the production and quality assurance procedures and for reviewing internal reports of production and improvement initiatives.
4.2.4 Research layout
The research was driven in two fronts simultaneously. While on one front effectiveness-levels were measured using OEE metrics and the causes of losses were inspected and analyzed, on another front the levels of process maturity and progress of improvement work were evaluated. Both fronts contributed to the establishment of a broad analysis which founds a basis for the conclusions and recommendations as described in figure 10. The methodology for implementation of measurements is described in detail in the following section.
Figure 10: Research drivers
4.2.5 Process measurement methodology
Ljungberg & Larsson (2001) suggest a framework for the establishment of a measurement system identifying six important steps between the registrations of data until the information reaches its target group and leads to action if needed. Most of the implemented principles and stages of research are common to general business research methods and can be found in business research literature such as Cooper and Emory (1995) and Bryman & Bell (2007).
FINDINGS
&
RECOMMENDATIONS
OEE
ASSESSMENT
CMM
PROCESS AUDIT
OEE
MEASURMENT
CAUSE -EFFECT DIAGRAM
FMEA
WHY-WHY ANALYSIS
VALUE ANALYSIS
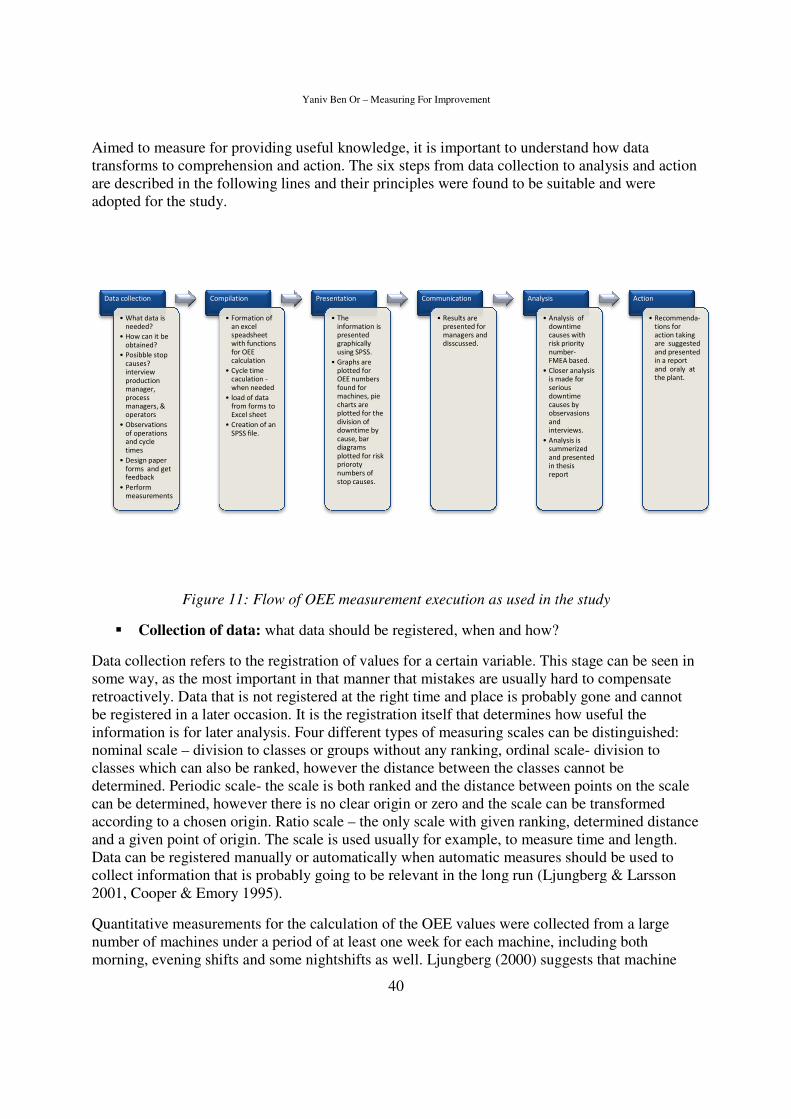
Aimed to measure for providingtransforms to comprehension and action. The six steps from data collection to analysis and action are described in the following lines and their principles were adopted for the study.
Figure 11: Flow o
� Collection of data: what data should be registered, when and how?
Data collection refers to the registration of values for a some way, as the most important in that manner that mistakes are usually hard to compensate retroactively. Data that is not registered at the right time and place is probably gone and cannot be registered in a later occasion. It is the registration itselfinformation is for later analysis. Four different types of measuring scales can be distinguished: nominal scale – division to classes or groups without any ranking, ordinal scaleclasses which can also be rankeddetermined. Periodic scale- the scale is both ranked and the distance between points on the scale can be determined, however there is no clear origin or zero and the scale can be transformed according to a chosen origin. Ratio scale and a given point of origin. The scale is used usually for example, to measure time and length. Data can be registered manually or automatically when automatic measures collect information that is probably going to be relevant in the long run (Ljungberg & Larsson 2001, Cooper & Emory 1995).
Quantitative measurements for the calculation of the OEE values were collected from a large number of machines under a period of at least one week for each macmorning, evening shifts and some nightshifts as well
Data collection
• What data is
needed?
• How can it be
obtained?
• Posibble stop
causes?
interview
production
manager,
process
managers, &
operators
• Observations
of operations and cycle
times
• Design paper
forms and get feedback
• Perform
measurements
Compilation
• Formation of
an excel
speadsheet
with functions
for OEE
calculation
• Cycle time
caculation -
when needed
• load of data
from forms to
Excel sheet
• Creation of an
SPSS file.
Yaniv Ben Or – Measuring For Improvement
40
ing useful knowledge, it is important to understand how data and action. The six steps from data collection to analysis and action
are described in the following lines and their principles were found to be suitable and were
low of OEE measurement execution as used in the study
what data should be registered, when and how?
Data collection refers to the registration of values for a certain variable. This stage can be seen inas the most important in that manner that mistakes are usually hard to compensate
retroactively. Data that is not registered at the right time and place is probably gone and cannot be registered in a later occasion. It is the registration itself that determines how useful the information is for later analysis. Four different types of measuring scales can be distinguished:
division to classes or groups without any ranking, ordinal scaleclasses which can also be ranked, however the distance between the classes cannot be
the scale is both ranked and the distance between points on the scale can be determined, however there is no clear origin or zero and the scale can be transformed
a chosen origin. Ratio scale – the only scale with given ranking, determined distance and a given point of origin. The scale is used usually for example, to measure time and length. Data can be registered manually or automatically when automatic measures collect information that is probably going to be relevant in the long run (Ljungberg & Larsson
).
Quantitative measurements for the calculation of the OEE values were collected from a large r a period of at least one week for each machine, including both
and some nightshifts as well. Ljungberg (2000) suggests that machine
Presentation
• The
information is
presented
graphically
using SPSS.
• Graphs are
plotted for
OEE numbers
found for
machines, pie
charts are
plotted for the
division of
downtime by
cause, bar
diagrams
plotted for risk
prioroty
numbers of
stop causes.
Communication
• Results are
presented for
managers and
disscussed.
Analysis
• Analysis of
downtime
causes with
risk priority
number
FMEA based.
• Closer analysis
is made for
serious
downtime
causes by
observasions
and
interviews.
• Analysis is
summerized
and presented
in thesis
report
knowledge, it is important to understand how data and action. The six steps from data collection to analysis and action
found to be suitable and were
used in the study
what data should be registered, when and how?
variable. This stage can be seen in as the most important in that manner that mistakes are usually hard to compensate
retroactively. Data that is not registered at the right time and place is probably gone and cannot that determines how useful the
information is for later analysis. Four different types of measuring scales can be distinguished: division to classes or groups without any ranking, ordinal scale- division to
, however the distance between the classes cannot be the scale is both ranked and the distance between points on the scale
can be determined, however there is no clear origin or zero and the scale can be transformed the only scale with given ranking, determined distance
and a given point of origin. The scale is used usually for example, to measure time and length. Data can be registered manually or automatically when automatic measures should be used to collect information that is probably going to be relevant in the long run (Ljungberg & Larsson
Quantitative measurements for the calculation of the OEE values were collected from a large hine, including both
Ljungberg (2000) suggests that machine
Analysis of
downtime
causes with
risk priority
number-
FMEA based.
Closer analysis
is made for
serious
downtime
causes by
observasions
and
interviews.
Analysis is
summerized
and presented
in thesis
report
Action
• Recommenda-
tions for
action taking
are suggested
and presented
in a report
and oraly at
the plant.

Yaniv Ben Or – Measuring For Improvement
41
stops would be registered manually by operators using paper forms, or by the use of a computer. To make the measurement easy, low cost and not disturbing operations, paper forms were designed to be filled by machine operators as shown in appendix F. The registrations of time when machines are inactive can be characterized as a ratio scale measurement since it is ranked, with determined distances and a known zero point. Stop time registration was grouped to different time intervals in order to make the form-filling task easy and not time consuming. The variable categories of stop causes were based on observations and interviews while there was a room left in the paper forms for additional stop causes that might occur. The definitions of stop categories for each measurement are presented in relation to relevant results for each type of equipment. Since cycle times varies for the production of different items, the accurate cycle times were collected as defined in each and every item’s production program when available. When not available, data was collected by observations and cycle times were calculated and estimated as detailed in the following compilation section.
� Compilation – how should data be treated to be transformed to information?
This step regards the way that the collected measurements are treated and structured. It can be related to calculations according to a formula or structuring the data, for example, in a histogram. The compilation of the data can be achieved automatically whether data was collected automatically or not. The used formulas should be as simple and understandable as possible. Measurements that are presented in percentage might veil problems and possibilities in comparison to absolute numbers as sometimes small percentage might be equivalent to large sums of money and therefore should be neglected (Ljungberg & Larsson 2001).
Quantitative measurements for the calculation of the OEE values were collected from a large number of machines under a period of at least one week for each machine, including morning, evening and night shifts. To make the measurement easy, low costly and not disturbing operations, paper forms were designed to be filled by machine operators as shown in appendix F. Stop time registration was grouped to different time lengths in order to make the form-filling task easy and not time consuming. The categories of stops were based on observation and interviews while there was a room left in the forms for additional stop causes that might occur. The definitions of stop categories are presented with relevant results. The data was collected in the following way: a mean value of each time length group was taken for each stop registry. This means that if two stops were marked in the group of 3-10 minutes, stop time was calculated to be 2*6.5=13 minutes. Similarly, if three stops were marked for the group 10-20 minutes, stop time was calculated to be 45 minutes and so on. Since morning and evening shifts overlap 6 minutes, 3 minutes were disregarded from each shift length.
Cycle times used for OEE calculations represent the average time it takes for the equipment to process one item when conditions are optimal and no unnecessary stops occur. It is worth to mention that this is not necessarily the time it takes to produce one single item since equipment often processes several items in parallel. For Deco 10 machines, cycle times were calculated for each paper form on the basis of weighted average according to the amount of each item produced based on the cycle times given in machine drive programs. This means that if a machine produced under the inspected time period 50 items of type A and 30 items of type B the cycle time used for the period would be 50*average cycle time for production of one type A item + 30*average cycle time for production of a single type B item divided in 80, the total amount of items. In this way of calculation, the most accurate average cycle time is obtained in accordance

Yaniv Ben Or – Measuring For Improvement
42
to the product mix. For Willemin machines, cycle times were calculated as weighted averages based on counted time as shown on machine computer in accordance to product mix.
Cycle time for TiUnite cells was gathered through observations. It was found to depend on both products and the size of batches and was calculated based on observation in accordance. The average cycle time for one item for the production of a 48-item batch is longer than for a 240 item batch. TiUnite cells treat item cassettes in parallel by the robotic arm screwing items and by processing the surface of items on another cassette when it is a 240-item batch, but not when the cell is processing a 48-item batch. An average cycle time was estimated for each batch size for processes where nitrogen was used and for processes it was not used, which are shorter. Then, in accordance to the mix of batch-sizes and types of process, cycle time was estimated. The calculated average cycle time for the period of inspection that was used for the OEE calculations was found to be 0.4 minutes/item for the two cells processing occasionally with Nitrogen – cells 912 and 922 and 0.36 minutes/item for other cell - 872. Cycle times for MaskPad cells were observed and calculated in dependence to product mix and batch size in similar way as for TiUnite. The average cycle time found for the MaskPad cells for the inspected period was 0.36 minutes/item. Notice that these cycle times represent the average time for processing an item of the different batch sizes and products altogether.
The cycle time for the sleeve machine was observed using the average cycle time notation on the machines computer. The average time observed that was used for the calculation is 04:17 seconds/item or 0.0695 minutes/item.
Planned stop time caused by, for example, planned maintenance; information meeting and operator absence was disregarded from the OEE calculation. The data was calculated by the use of an Excel spread sheet.
� Presentation – how should results be presented?
Once the compilation of measured data is done, results can be analyzed and presented graphically in order to encourage people involved to become engaged for the analysis. The use of illustrations and diagrams can awake interest even among people who are not familiar with the numerical material. A good image can ease the interpretation of numerical measurement values in contrast to the study of tables or other numerical presentations. Many times, the way in which information is presented is crucial for the ability of people to understand and accept the information (Ljungberg & Larsson 2001). Bryman & Bell (2007) suggest the use of SPSS software to edit graphic presentation of the data.
The results of the measurements were plotted graphically to visualize key figures using SPSS. For example, OEE and factors means for a group of machines and OEE means for each machine were plotted in bar diagrams, and figures such as distribution of down time causes were plotted in pie diagrams.
� Communication – to who should information be communicated?
A good presentation of the results does not guarantee that the information is distributed to the relevant target group. Results must be communicated to people in concern that can influence them or have an interest in them. The ability to see for individuals to see, discover relations and make analysis is away more valuable than to receive conclusions presented from the hands of

Yaniv Ben Or – Measuring For Improvement
43
another person. Information must be traceable and provided in various ways to ensure it is available when it most needed (Ljungberg & Larsson 2001).
The results from measurements were presented to managers concerned. Process managers, production manager and plant manager received the results. The results were discussed with managers and machine operators in order to encourage their involvement and interest and their insights were registered to aid the analysis.
� Analysis – who should analyze what and how? � Action – What decisions or actions should the information lead to?
The analysis step is characterized of follow up and identification of problems and opportunities. While the way that the first four steps preceded can be documented in details, the effectiveness of last two steps of analysis and action is highly depended on organizational culture. Even if the last two steps cannot be described in the same level of details and precision of the first four, they are important since they constitute the final consideration of the way gathered information should be used. The meaning of measurement is not to create diagrams and tables, but to form the foundation for management and development, enabling relevant and intelligent analysis. When it is hard to realize what analysis could be made with the aid of measurements and what decisions or action could be based on measurements, the accuracy and usability of measurement should be questioned. In addition, measurement should be specified in detail, to ensure measurement is performed homogenously in the long term (Ljungberg & Larsson 2001).
The calculated OEE values were used to identify low efficiency levels that indicate where problems can be found and their influence on effectiveness. Down time causes were analyzed to provide a ranking of machine stop-causes, considering their probabilities and severity based on FMEA risk analysis. Statistical presentation and analysis was performed by using SPSS computer software, which is possibly the most widely used computer software for the analysis of quantitative data for social sciences, according to Bryman & Bell (2007). Highly ranked down time causes were examined in more detail by observations and interviews. Recommendations for action taking were considered as well and they are presented in this thesis report.
4.3 Credibility and quality of findings There are different prominent criteria for evaluating business and management research. According to Bryman & Bell (2007), the criteria are reliability, replication and validity while Cooper & Emory (1995) focus on reliability and validity. Other considerations that may influence credibility and quality of findings through interviews and observations are presented in the following lines as well.
4.3.1 Reliability
Reliability is particularly at issue when the research has a quantitative character. The researcher of a quantitative study is often concerned with the question of whether a measure is stable or not and whether the results of the study are repeatable. The measures in question of consistency are usually developed for concepts in business and management in particular. Stability is one of the three meanings of the term, and the way of testing it is the test retest method. The meaning of this is that a measure should be administrated to the same sample on several occasions. If the measure is stable over time, we can be confident that the results relating to that measure for a sample of respondents do not fluctuate. Other factor of reliability is the internal reliability. This issue
Yaniv Ben Or – Measuring For Improvement
44
concerns with the question whether or not the indicators that constitute the scales or index are consistent or whether or not respondent scores on any indicator are related to their scores on other indicators. Lastly, an additional factor is inter-observer consistency/equivalence. It is important to consider this factor particularly when subjective judgment is involved in recording observations or the translation of data into categories where more than one observer is involved since there is a possibility that their decisions suffer from a lack of consistency (Bryman & Bell 2007, Cooper & Emory 1995).
Aiming to assure reliability of the measurements conducted during the study, the three named factors were seriously considered and measures were taken based on the recommendations found in literature. Relating to stability, OEE measurements were conducted usually on a large number of similar machines during a period of time that showed stable results. Machines that were included in the research were followed during different shifts over at least one week. To assure inter-observer consistency that was required since the measurement were observed by a large number of operators, standardized paper forms were designed. The author of this thesis, together with process managers, informed operators about the measurement, explaining how to use the forms correctly. In addition, in order to avoid errors, the paper forms always included space for descriptions, for situations of which operators were not sure how to categorize stop causes. This information was then reviewed by the researcher and the optimal categorizing was made retroactively by the researcher. In addition, the researcher visited operators frequently during measurement and was available for answering questions and clarifying issues that were unclear.
4.3.2 Replication
Replication or replicability is another criterion of research. It regards situations where researchers choose to replicate the findings of others due to different reasons. A reason for researchers to replicate can be a feeling that the original to not fit with other evidence and findings. Replication can only take place if the study is replicable and if the researcher does not describe in detail the procedures of the study, replication is impossible. In order to assess the reliability of a measure of a concept, the procedures must be replicable by someone else (Bryman & Bell 2007).
This point is significant for this study regarding OEE measurements in particular, since reliability here can only be achieved if the measurement procedures that were used in the study are replicable. It is therefore vital to describe procedures of measurement and explain in detail how the data were collected and complied. This important information can be found in section 4.2.5 that deals with process measurement methodology.
4.3.3 Validity
This criterion is highlighted by Bryman & Bell (2007) as the most important. Validity is concerned with the integrity of the findings that were based on a piece of research. It is regarding whether or not a measure or an indicator of a concept really measures that concept. There are different ways for establishing validity. Face validity is an essentially intuitive process in which other people, often with experience and expertise in the field are asked whether or not the measure seems to be getting at the concept in focus. Concurrent validity concerns the employment of a criterion on which cases are known to differ, and that is relevant for the study. Predictive validity is similar to the previous named, only that the researcher takes future levels of the criterion rather than employing the criterion simultaneously. Construct validity is recommended by some writers. The researcher is encouraged to deduce hypothesis from a theory that is relevant to the concept. The researcher anticipates the results and tests its theory. Cooper

Yaniv Ben Or – Measuring For Improvement
45
& Emory (1995) classify validity to content, criterion related and construct. Content validity is concerning the question whether or not the measuring instrument contains a representative sample of the universe of subject of interest. Criterion-related validity is a form of validity that reflects the success of measures used for prediction or estimation. Construct validity is when the researcher wishes to measure the presence of abstract characteristics for which empirical validation seems impossible. Here both the measuring instrument and theory being used are considered.
Although the different writers formulate and coin the diverse ways for validity establishment in their own ways, the main concerns relay on similar principles. Those were applied in this study to establish validity. For example, when designing the paper forms that were used to measure machine inactivity, production managers, process managers and operators were consulted for feedback and ideas. Similarly, engineers were consulted to evaluate the validity of cycle times used for calculation of OEE values for Deco 10 and Willemin machines, while production and process manager were consulted validating cycle times for surface treatment equipment that were found through observations. In addition, information was gathered from production and process managers about the knowledge that they already had and experiences that are related to effectiveness measurement.
4.3.4 Credibility of interviews and observations
� Observations: The collection of data using observations has some disadvantages that must be taken in consideration. Saunders et al. (2000) highlight a number of disadvantages as followed: participant observation – can be very time consuming, can pose ethical dilemmas for the researcher, there can be high levels of role conflicts for the researcher and significant observer bias due to the closeness of researcher to the situation observed may occur. Structured observation – the observer must be in the research settings when the phenomena take place, research results are limited to obvious indicators at the surface from which the researcher makes inferences and data can be slow and expensive to collect. In addition, there are threats to validity and reliability as follows: subject error may cause data to be unreliable and therefore subjects should be chosen carefully to be “normal” examples of the studied population. Time error – it is essential that the time of the conducted observation does not provide data, which are untypical for the total time period of interest. Observer effect – a powerful threat to validity and reliability, occurs as the observation changes the nature the observed behaviour due to the fact that the subject is conscious of being observed.
� Interviews: There are many factors that should be considered in order to avoid sources of bias in qualitative interviews. The actions of the interviewer are vital and the following should be considered: the interviewer should be well prepared and ready for the interview; relevant information should be supplied to the interviewee to gain credibility, the appearance of the interviewer should be appropriate. In addition, the nature of the opening comments at the first few minutes may have impact on the outcome of the interview and should strengthen interviewee’s confidence. The researcher’s approach and behavior impact the course of the interview, the researcher’s ability to demonstrate attentive listening skills and the approach to recording information (Saunders et al. 2000).
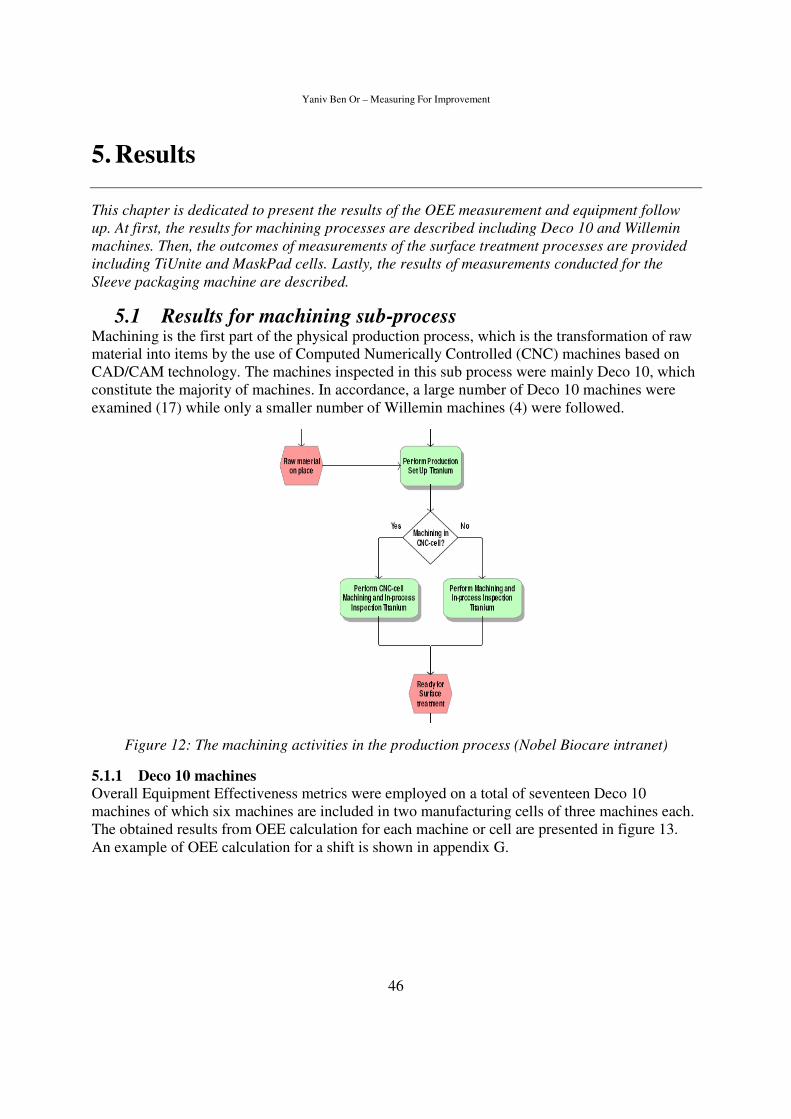
Yaniv Ben Or – Measuring For Improvement
46
5. Results
This chapter is dedicated to present the results of the OEE measurement and equipment follow
up. At first, the results for machining processes are described including Deco 10 and Willemin
machines. Then, the outcomes of measurements of the surface treatment processes are provided
including TiUnite and MaskPad cells. Lastly, the results of measurements conducted for the
Sleeve packaging machine are described.
5.1 Results for machining sub-process Machining is the first part of the physical production process, which is the transformation of raw material into items by the use of Computed Numerically Controlled (CNC) machines based on CAD/CAM technology. The machines inspected in this sub process were mainly Deco 10, which constitute the majority of machines. In accordance, a large number of Deco 10 machines were examined (17) while only a smaller number of Willemin machines (4) were followed.
Figure 12: The machining activities in the production process (Nobel Biocare intranet)
5.1.1 Deco 10 machines
Overall Equipment Effectiveness metrics were employed on a total of seventeen Deco 10 machines of which six machines are included in two manufacturing cells of three machines each. The obtained results from OEE calculation for each machine or cell are presented in figure 13. An example of OEE calculation for a shift is shown in appendix G.
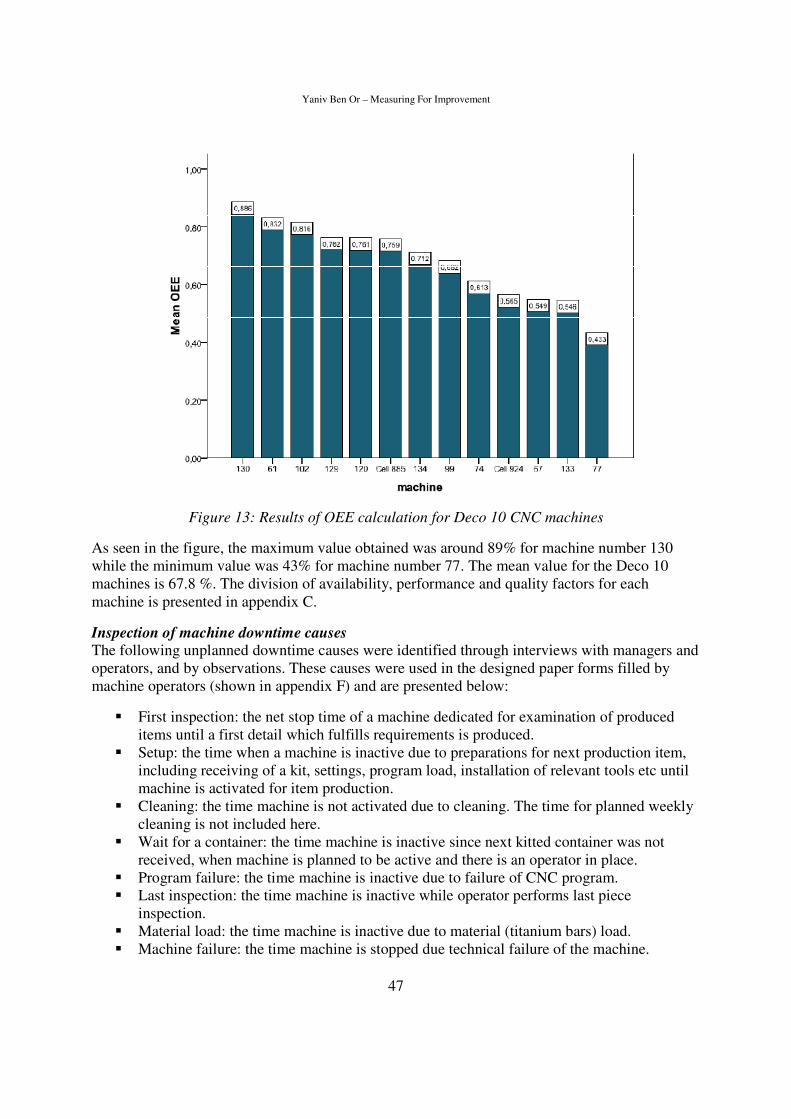
Yaniv Ben Or – Measuring For Improvement
47
Figure 13: Results of OEE calculation for Deco 10 CNC machines
As seen in the figure, the maximum value obtained was around 89% for machine number 130 while the minimum value was 43% for machine number 77. The mean value for the Deco 10 machines is 67.8 %. The division of availability, performance and quality factors for each machine is presented in appendix C.
Inspection of machine downtime causes The following unplanned downtime causes were identified through interviews with managers and operators, and by observations. These causes were used in the designed paper forms filled by machine operators (shown in appendix F) and are presented below:
� First inspection: the net stop time of a machine dedicated for examination of produced items until a first detail which fulfills requirements is produced.
� Setup: the time when a machine is inactive due to preparations for next production item, including receiving of a kit, settings, program load, installation of relevant tools etc until machine is activated for item production.
� Cleaning: the time machine is not activated due to cleaning. The time for planned weekly cleaning is not included here.
� Wait for a container: the time machine is inactive since next kitted container was not received, when machine is planned to be active and there is an operator in place.
� Program failure: the time machine is inactive due to failure of CNC program. � Last inspection: the time machine is inactive while operator performs last piece
inspection. � Material load: the time machine is inactive due to material (titanium bars) load. � Machine failure: the time machine is stopped due technical failure of the machine.

Yaniv Ben Or – Measuring For Improvement
48
� Missing tools: the time machine is inactive because tools are not in place. Operator is waiting or searching for tools.
� Tool change: the time machine is inactive while operator is changing a tool, excluding change under setups.
Additionally, the following reasons for machine stops were identified from the filled paper forms:
� Setup other machine: machine is inactive while operator is busy performing a setup on another machine.
� Test drive: machine was active for testing during a shift, without producing useful items. Production temporarily stopped.
� Machine was stopped while operator performed inspection of items after detection of failure.
� Network unavailable: machine was not active while operator was unable to start production due to a network problem.
� Other: other reasons include adjustment of oil jets, material jammed in glide case, oil change, full Hommel (measurement equipment) database, lamp change, Vision database clearance and calibration of cell’s robot.
Planned downtime was excluded from measurements. Reasons for planned downtime are absence of employees, weekly cleanings, machine reparation/service, employee education and schooling and information meetings.
The following causes for machine stop were gathered under the inspection of the process, from interviews with employees and production managers and from observations and stop time journals. The causes are described in the cause and effect diagram below:
Figure 14: Cause and effect diagram illustrating different causes for production stop of Deco 10
machines
The division of stop time in relation to the different causes is illustrated in the pie chart given in following figure:

Yaniv Ben Or – Measuring For Improvement
49
Figure 15: Pie chart illustrating the share of each stop-cause from the total stop-time for Deco
10 machines.
The chart is following the list to the right when each cause is represented by a color. It can be read in accordance to the list starting from middle top in counter-clock direction. As seen in the chart, setup time is the primer cause of machine downtime, obtaining about half of the total stop time.
The main causes for machine down time categorized in figure 15 by “other” are as named before. In addition appendix D is showing pie charts for stop cause division for each machine or cell.

Yaniv Ben Or – Measuring For Improvement
50
The following table shows the average unplanned time loss for an 8 hours shift due to different reasons:
Unplanned downtime cause Average time loss per
8 hours shift
(minutes)
Setup 34 Material load 1 First inspection 4 Last inspection 2.5 Machine failure 4.5 Program failure 0.5 Search / wait for tools 0.15 Tool change 3 Wait for a container / pallets 6 Cleaning 3 Setup other machine 4.5 Inspection due to failure 1.5 Test drive 1 Network unavailable 0.5 Other 2.5 Total unplanned downtime ≈68.5
Table 5: Average time loss during an 8 hours Deco 10 shift due to different causes.
Total inspected time of Deco 10 machines was about 1070 planned production hours. Planned time loss due to education, information, meetings, planned maintenance,or caused by absence of work force are excluded.
5.1.2 Willemin machines
The results of OEE mean values and the division to factors of availability, performance and quality that were obtained for Willemin machines are given in figure 16 for each inspected machine used for titanium production. Average results for the 3 inspected machines are shown in figure 17 on the coming page.

Yaniv Ben Or – Measuring For Improvement
51
Figure 16: Obtained OEE factors for each Willemin machine producing titanium items
Figure 17: Average results for OEE and factors levels for 3 titanium producing Willemin
machines
As figures 16 and 17 indicate, the average OEE value obtained is about 68% and varies between 66% and 72% for the different machines. Availability loss is the major trigger for OEE reduction while quality losses are considerable as well.

Yaniv Ben Or – Measuring For Improvement
52
The causes for machine downtime that were identified for Deco 10 machines shown in the previous section stand for Willemin machines as well. However, additional stop causes were identified or modified as listed:
� Adjustments - in the middle of batch production. � Operator unavailable: performing other tasks such as setup of other machine and working
on other processes while machine of interest is inactive. � Wait for profile-projector: machine is inactive while operator waits in queue to perform
inspection using a profile projector. � Backside milling: reworking the backside of items due to a technical problem.
The share of each unplanned downtime cause of the total downtime is shown in figure 18.
Figure 18: The share of each downtime cause of the total for titanium milling Willemin machine.
As figure 18 indicates the main reason for unplanned production stops are setups which obtain about 46% of total unplanned stop time. Other major causes are machine failure – about 14%, operators performing setup on other machines and other tasks – about 9% and adjustments in the middle of batches – about 6.5%. Causes regarded as “other” include backside milling and wait time for profile projector. The share of stop causes in respect to each machine can be found in appendix E. The following table shows the average unplanned time loss for an 8 hours shift due to different identified reasons.

Yaniv Ben Or – Measuring For Improvement
53
Unplanned downtime cause Average time loss per 8
hours shift (minutes)
Setup 38 Material load 1 First inspection 3 Last inspection 2 Machine failure 11 Program failure 0.1 Search / wait for tools 0.15 Tool change 4.5 Wait for a container / pallets 1 Cleaning 3.2 Operators busy - other tasks 7.5 Adjustments in the middle of production 5.5 Wait for profile projector 1 Backside milling 4.5 Total unplanned downtime ≈83.5
Table 6: Average time loss during an 8 hours shift of titanium milling Willemin machine due to
different causes.
OEE values were obtained for ceramic milling Willemin machine number 111 as well. Additional machine inactivity causes were identified for the ceramic milling machine: sintering & oven load and kitting failure. OEE and factors’ values that were obtained are shown in the following figure:
Figure 19: OEE and factor values for machine 111 used for milling ceramic items
As shown in the figure, the OEE value obtained for the machine is around 73% when the major cause for losses is machine unavailability due to different reasons. The value for quality is around 96% and performance around 100%. The share of each stop reason of the total stop time is described in figure 20 on the following page.
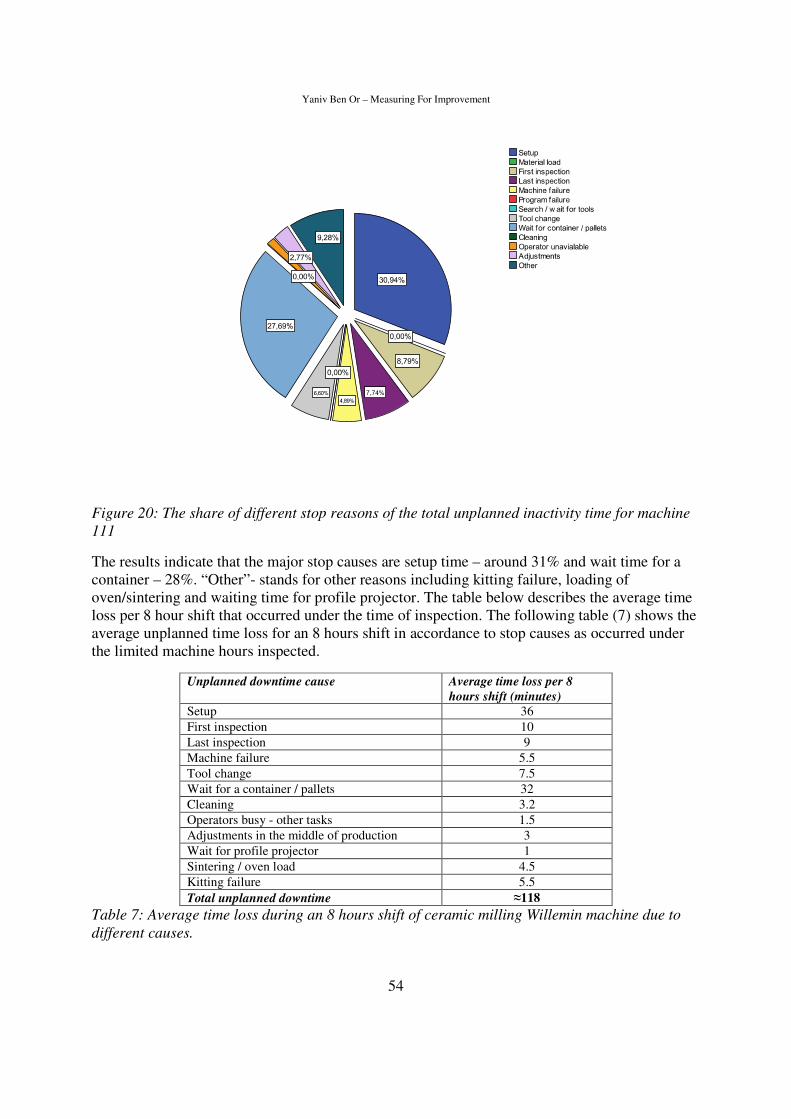
Yaniv Ben Or – Measuring For Improvement
54
Figure 20: The share of different stop reasons of the total unplanned inactivity time for machine
111
The results indicate that the major stop causes are setup time – around 31% and wait time for a container – 28%. “Other”- stands for other reasons including kitting failure, loading of oven/sintering and waiting time for profile projector. The table below describes the average time loss per 8 hour shift that occurred under the time of inspection. The following table (7) shows the average unplanned time loss for an 8 hours shift in accordance to stop causes as occurred under the limited machine hours inspected.
Unplanned downtime cause Average time loss per 8
hours shift (minutes)
Setup 36 First inspection 10 Last inspection 9 Machine failure 5.5 Tool change 7.5 Wait for a container / pallets 32 Cleaning 3.2 Operators busy - other tasks 1.5 Adjustments in the middle of production 3 Wait for profile projector 1 Sintering / oven load 4.5 Kitting failure 5.5 Total unplanned downtime ≈118
Table 7: Average time loss during an 8 hours shift of ceramic milling Willemin machine due to
different causes.

Yaniv Ben Or – Measuring For Improvement
55
5.2 Results for surface treatment processes Two different types of process cells used for surface treatment processes were inspected in the study. One type of cells is the TiUnite cells. Each TiUnite cell is a combination of a robotic arm that is loading and reloading items from pellets to cassettes and back while the other function of the cell includes a chemical process, cleaning and drying the implants that are screwed to a cassette. The other cells that were inspected are the MaskPad cells. The cells are a combination of a robotic arm that is responsible for setting ring pads on the implants and robotic arms that are receiving the implants and coloring them. The MaskPad can be used for both setting pads and coloring or for setting ring pads only. All 3 MaskPad cells and TiUnite cells were inspected.
5.2.1 TiUnite
The results of the OEE value mean and the different OEE factors are described in following figure 21 below:
Figure 21: OEE and factor values for TiUnite cells used for surface processing
The OEE mean value obtained for the cells is 60% with only small variations between the cells and between the divisions of the factors for each cell. Average availability value obtained was 75%, performance value was 84% and quality value was 95%.
Inspection of cell downtime causes The following unplanned downtime causes were identified through interviews with production and process managers, cell operators and by observations. The identified causes were included in the paper forms that were filled by operators. The used form can be found in appendix F. the following main causes were included in the forms:
� Change of item / cassette: a change of a cassette when the operator prepares the cell to start process a lot.

Yaniv Ben Or – Measuring For Improvement
56
� Cassette change during operation: cell operation was stopped for cassette change during operation due a failure.
� Stripes change: changing or setting the appropriate stripes on the cassettes when preparing the cell for processing of a new lot.
� Machine failure - operator aided: cell operation was stopped due to failure in the cell that was repaired by an operator.
� Machine failure – technician aided: cell operation was stopped due to failure in the cell that was repaired by a technician.
� Alarm – leakage test: cell operation was stopped as the cell alarmed for leakage. � Alarm – other: cell operation was stopped due to other alarms. � Get tool / cassettes: cell was inactive while operator brought tools or cassettes. � Wait for work: cell is inactive while there is no container with items at place for the next
processing. � Cleaning: cell is inactive while operators perform daily cleaning for maintenance of the
cells. � Operators unavailable: cell is inactive while operator is busy performing other tasks. � Electrolyte change: cell is inactive while operator is changing the electrolyte.
In addition, the following causes for cell stops were indicated in the paper forms:
� Electrolyte contact problem: process failed due to a contact problem. � Grinding of items: cell is inactive while operator is grinding items, manual rework of
defects. � Other: other reasons for cell inactivity include too high temperature in pool, restart of
computers, missing electrolyte and preparation of electrolyte.
Planned downtime was excluded from the calculations. Downtime causes were ordered in a cause and effect diagram as followed:
Figure 22: Cause and effect diagram illustrating different causes for processing stops of TiUnite
cells
The share of each stop cause of the total stop time is illustrated in the following pie chart:

Yaniv Ben Or – Measuring For Improvement
57
Figure 23: Pie chart illustrating the share of each stop-cause of the total stop-time for TiUnite
cells.
Based on the collected data, an average time loss per shift was calculated in accordance to the different stop reasons as described in table 8:
Unplanned downtime cause Average time loss per 8
hours shift (minutes)
Change of item/cassette 22.5 Cassette change during operation 1.5 Stripes change 4 Machine failure: operator aided 3.5 Machine failure: technician aided 1.5 Alarm: leakage test 5.5 Alarm: other 3.5 Get tools/cassettes 0.5 Wait for work 38.5 Cleaning 3.5 Operators busy – other tasks 24.5 Electrolyte change 10 Electrolyte contact problem 1.5 Grinding of items 3 Other 1 Total unplanned downtime ≈124.5
Table 8: average time loss during an 8 hours shift in accordance to loss causes

Yaniv Ben Or – Measuring For Improvement
58
Each of the cells was inspected under a period longer than one week including all shifts. Planned time loss was excluded.
5.2.2 MaskPad
Another type of surface treatment cells that was inspected is the MaskPad. The results of the calculated OEE mean and factors values are shown in the bar chart in figure 24:
Figure 24: OEE and factors values obtained for MaskPad cells
The calculated OEE mean value obtained was 46%. The average availability value calculated was 57%, the average performance value was 81% and the quality value was almost 100%. Only small variations in the results of the different cells were registered and can be neglected.
The reasons for unplanned downtime for the MakPad cells were identified at first through interviews and observations. The identified reasons are:
� Setup: preparing the cell for processing the next lot. � First item inspection: once the first item is processed, operator stops operation and
performs a visual inspection of the item. � Last item inspection: machine is inactive while operator visually inspects the last
processed item. � Machine failure – operator aided: cell operation was stopped due to failure in the cell that
was repaired by an operator. � Machine failure – technician aided: cell operation was stopped due to failure in the cell
that was repaired by a technician. � Alarm: cell operation was stopped due to alarms. � Get ring pads: cell is inactive while operator is getting ring pads. � Wait for work: cell is inactive while there is no container with a lot at place for the next
processing. � Cleaning: cell is inactive while operators perform daily cleaning for maintenance of the
cells.

Yaniv Ben Or – Measuring For Improvement
59
� Operators unavailable: cell is inactive while operator is busy performing other tasks.
The shares of the different causes of cell inactivity are shown in the pie chart in figure 25:
Figure 25: The share of each inactivity reason of the total unplanned stop time for MaskPad cells
The following table is describing calculated average unplanned time losses for an 8 hours shift of a MaskPad cell:
Unplanned downtime cause Average time loss per 8
hours shift (minutes)
Setup 15 First item inspection 1.5 Last item inspection 1 Machine failure: operator aided 5 Machine failure: technician aided 19.5 Alarms 10 Get ring pads 0.5 Wait for work 128 Cleaning 4 Operators busy - other tasks 20 Other 0.5 Total unplanned downtime ≈205
Table 9: Average time loss during an 8 hours shift of a MaskPad cell.

Yaniv Ben Or – Measuring For Improvement
60
5.3 Results for Packaging A single sleeve machine was inspected in packaging processes.
5.3.1 Sleeve machine
The results of the OEE mean value and the different factors are described in the figure 26:
Figure 26: OEE and factor values for the Sleeve machine
The mean OEE value obtained for the machine is 47%. The average availability rate was found to be 50%, the performance rate 92% and there no quality losses were registered.
Inspection of downtime causes The following downtime causes were identified through interviews with production and process managers and machine operators. The causes were listed in a paper form designed to register inactivity time of the machine. The following reasons for inactivity were identified:
� Setup: preparing the machine for operation, item change. � Material load during production: operator stops the machine for material loading. � Writing failure: machine stopped due to failure of writing function. � Sleeve feeding failure: machine was stopped due to failure in feeding sleeves. � Stopper feeding failure: machine was stopped due to failure in feeding stoppers. � Sleeve jammed: machine was stopped due to a jammed sleeve. � Other machine failures. � Alarms: machine was stopped due to different alarms. � Wait for a technician: machine is inactive due to failure and needed to be repaired by a
technician. � Wait for work: machine is inactive as long as there is no work to perform. � Cleaning: machine is inactive while operator cleans it. � Operator unavailable: machine is inactive while operator is performing other tasks.

Yaniv Ben Or – Measuring For Improvement
61
The share of each stop cause is shown in the pie chart in figure 27.
Figure 27: The share of each inactivity reason of the total unplanned stop time for Sleeve
machine
Based on the registered data, an average time loss per shift was calculated to each of the reasons and described in table 10:
Unplanned downtime cause Average time loss per 8
hours shift (minutes)
Setup 18.5 Material load during batch 1.5 Sleeve feeding failure 26.5 Stopper feeding failure 15 Sleeved jammed 1 Other machine failure 2.5 Alarms 1.5 Wait for work 172 Cleaning 7 Operators busy - other tasks 12.5 Total unplanned downtime ≈258
Table 10: Average time loss during an 8 hours shift of the Sleeve machine.

Yaniv Ben Or – Measuring For Improvement
62
6. Analysis
In this chapter, Analysis is conducted for each of the equipment inspected as the downtime causes
are ranked and major causes are analyzed in more detail. OEE assessments are conducted for
the sub processes followed by an analysis of overall process orientation and maturity analysis.
Lastly, the chapter ends with a self assessment of the implementation and credibility of the
findings.
6.1 Machining A good starting point when considering the activities which cause machines to idle is to categorize the different stops in accordance to their value contribution. A value analysis for the registered different unplanned downtime causes is suggested in table 11 below:
Downtime cause Value
adding
Non-value
adding
Wastage
Machine setup x Wait for a container x Machine failure x First item inspection x Cleaning x Tool change x Last item inspection x Program failure x Material load / change x Search / wait for tools x Setup of other machine / operator performing other tasks
x
Test drive x Inspection due to failure x Network unavailable x
Table 11: Value analysis of unplanned downtime causes
The analysis can be helpful as it clarifies the approach that should be taken to deal with each of the stops. Quality inspections of produced items are value adding since items are used for medical applications, are designed to integrate in human body and defective products may have serious consequences. Quality assurance of the items is required by authorities and is vital for the success of the product. These vital causes should be further developed. Other procedures that are required for the production, but not add value for the product or customer such as cleaning and setups are categorized as non-value adding. These activities should be minimized. Finally, unnecessary downtime causes that do not add any value such as unavailable network or machine and program failures should be eliminated.

Yaniv Ben Or – Measuring For Improvement
63
6.1.1 Deco 10 machines
As shown in figure 13, section 5.1.1 (results chapter), OEE values obtained for Deco 10 machines varies widely. While machine number 130 shown a maximum effectiveness value of 89%, processes involving machine 77 were less effective and the value obtained was 43%. In order to investigate what are the reasons for this variation, the unplanned downtime causes for each machine were considered and interviews were made with production and process managers and with operators. Considering machines 130 and 129 that are placed beside each other, these machines are usually used for screw production by one operators each shift. The machines have shown high values of effectiveness, 89% and 77%, and can be characterized as machines that are inactive only under a very short time each shift. The reason to this is that they seldom require time consuming setups and usually produce large batches, of 240 items each, of similar products. There was no time lost for waiting for a kitted container. Machine 130, which had the highest OEE value of all Deco 10 machines, is often producing several batches in a row of the same item and thus require almost no setup time at all. This type of production requires fewer adjustments and is more repetitive and predictable for the operator. Machine 61 is used for production of screws as well, has shown high OEE values as well with an average of 83%. This machine had also shown very small time loss due to setup. The machine has often an operator dedicated for it, who is not operating another machine simultaneously. Other machines that showed high OEE values were machines 102 and 120, which produce Nobel Active type items. These machines showed relatively modest time loss due to setups, no waiting time to get the next container was registered and were characterized by large batch production. However, there was significant time loss due to machine failure. Regarding the two machine cells that were examined, the results showed significant difference in the levels of effectiveness between the two cells. While cell 885 obtained the OEE value of 76%, cell 924’s value was 57%. Cell 885 often produced large batches of 240 items each while cell 924 often produced smaller batches of 96 items each requiring setups more frequently. The rest of machines that had lower values had considerable time loss due to setups, producing often smaller batches. Machines 77 and 74 obtained low OEE values of 61% and 43% respectively, and can be characterized as machines of which complicated setups are concentrated. The machines are operated by staff that is skilled to perform complicated setups. Both machines are operated by the same person each shift. The results for these machines have shown great loss of time due to setups and they were also often inactive while operator performed a setup on the other machine.
Although Deco 10 machines are quite similar to one another, the way they are used is often determining the resulted effectiveness values. Generally, it is clearly shown that machines that usually produce in smaller batches and require time consuming setups are losing a great deal of available machine time which results in lower OEE values. Frequent setups are followed by adjustments and item inspections that are time consuming as well and leave less available time for production. Many adjustments and inspections mean not only loss of time, but also a larger number of scrapped items which is expressed in the OEE calculation in lower quality values. In addition, small batch production increases the occurrence of stops between jobs and thus increases the probability that machine time would be lost when, for example, the operator is on break or busy setting up another machine. It also increases the probability that machine time would be lost while operator is waiting for the next kitted container to start the next job. It is worth to mention that while most operators are responsible for the operation of two machines that are placed beside one another, some operate machines that are places not beside one another, some operate 3 machines together with another operator, and some operate only one machine

Yaniv Ben Or – Measuring For Improvement
64
while others operate a cell of 3 machines by themselves. Naturally, an operator responsible for a larger number of machines is likely to respond more slowly to machine stops which results in increased availability losses.
Several reasons can cause losses that are expressed in the OEE calculations as performance losses. Interviews with engineers responsible for the Deco 10 machines indicate that machines cannot run slower than they should since all the milling process and schemes are computer controlled. The speed of the machines can be reduced manually; however it is controlled by a button that is positioned in the front of each machine in a very visible spot which makes the probability of operators running the machine slowly unlikely. As mentioned earlier, time for operator breaks was not excluded from operation time in the study and was not regarded as planned machine downtime since operators are instructed to leave machines operating during breaks. However, when a machine stops and operator is not in place, time would be lost and might not be well estimated or registered. This can result in OEE terms as performance or speed losses although the real reason for the loss of time is related to operation time availability. Similarly, if operator did not register all machine stops due to other reasons, it result a performance losses as well. Another reason for performance losses is a technical problem of item spill in the machine. The problem occurs when a processed item is on its way out from the machine and is shifted by oil jets to fall down inside the machine. These items are often not collected and are not reported as spoilage either; they are thrown away together with metal splints that are gathered in the oil pool. Other items that end up in a similar way are items that are under production when machine is stopped by operator, these are released by the machine to fall in the oil pool as well. Finally, the cycle time calculated by CNC programs for an amount of items per hour does not include the time that it takes for the machine to load new material from the magazine. This time is estimated to be only a number of seconds each shift and can be neglected. Nevertheless, the cycle time represents the time it takes to produce each item under continuous production. It does not represent the time to produce a single item non-continuously, as done when adjusting the machine for production. This fact was not considered in the OEE calculation and might be seen as performance losses, especially for machines that performed many adjustments.
Prioritizing downtime causes for improvement An analysis based on the principles of Failure Mode and Effect Analysis was conducted for the different downtime causes in order to help identify the most significant causes for losses and prioritize them in accordance. The probabilities of occurrence (O) were divided on a scale for 1 to 10 based on their occurrence frequencies (N). The severity (S) was also scaled from 1 to 10 in accordance to the mean inactivity time in minutes by each cause. The table on the next page shows in parentheses how frequencies and severity levels were obtained. These factors were multiplied to form the risk priority number showed to the right (RPN).

Yaniv Ben Or – Measuring For Improvement
65
Table 12: FMEA-based analysis of stop causes for Deco10 machines
The results were plotted in a bar chart which is given in figure 28 below:
Figure 28: Bar chart describing risk priority number of each downtime cause
The diagram is showing downtime causes ranked by their calculated risk priority number. A value analysis was made to provide first guidelines on how to approach each cause. The analysis was earlier shown in table 11. Value-adding activities should be developed, non-value adding activities should be minimized and wastage should be eliminated. As visualized in the previous diagram, setup is by far the unplanned downtime cause that should be primely prioritized, however the loss of time due to a wait for a kitted container, machine failure and first item inspection are not neglected and shoud be highly prioritized after setup.The time loss due to
Stop cause N (O) Mean (S) RPN
Setup 58 (10) 78 (6) 60 Material load/change 14 (2) 7 (1) 2
First inspection 33 (6) 16 (2) 12 Last inspection 34 (6) 10 (1) 6 Machine failure 9 (2) 66 (6) 12 Program failure 2 (1) 38 (3) 3
Search/wait for tools 3 (1) 8 (1) 1 Tool change 32 (6) 12 (1) 6
Wait for a container 11 (2) 75 (6) 12 Cleaning 54 (9) 8 (1) 9
Setup other machine 5 (1) 116 (9) 9 Inspection due to failure 2(1) 38 (3) 3
Test drive 2(1) 60 (5) 5 Network 3(1) 15 (1) 1

Yaniv Ben Or – Measuring For Improvement
66
operator performing a setup on another machine is related to setup, but actualy caused by organization and allocation of work force resources. The major causes that were obtained in the analysis were inspected more closely by the author and are detailed in 6.1.3.
6.1.2 Willemin machines
As described in 5.1.2 (the results chapter), the obtained OEE results for Willemin machines used for titanium production did not show significant variations. Calculated mean values for the machines were between 66% and 73%. The division to three factors of availability, performance and quality however, varies and we can identify that machine 92 suffered less from availability losses in comparison to the other two machines inspected. According to process manager and operators, machine 92 is characterized as a machine that usually produces repeatable items and therefore requires fewer setups. This is expressed in a low percent of time losses due to setups as can be shown in the machine specific downtime division shown in Appendix E. OEE values for this machine though, were not higher than the other machines due to lower quality and performance values. The reason for lower quality and performance is related to a technical problem causing the machine to produce defected items that were lost, items which required rework, backside milling and adjustments of pressure. In addition, the operator of machine 92 was often busy operating another machine which contributed time losses to machine 92. Considering the results of the three inspected Willemin machines in comparison to the results obtained for Deco 10 machines, it is worth to mention that the quality losses and levels of rejected items are higher for Willemin machines. While the average quality rate for Deco 10 machines was 95%, for Willemin machines the average quality rate obtained was 88%. additionally, as indicated in chapter 5, average time losses per shift for Willemin machines are higher than for Deco 10 machines since Willemin machines need to be adjusted in the middle of production, there is a problem that requires reworking the backsides of items, operators are more often busy performing other tasks and there are often queues for the profile projector. The obtained performance rates for Willemin machines were more accurate since cycle times used in the calculation were based on registered time and not theoretic times. In addition, since machines produce one item at a time and does not produce two items in parallel as Deco 10 machines, the time lost for the production of items that were rejected under first item adjustments is expressed accurately in OEE means which also explaining the higher obtained performance values for Willemin machines.
Prioritizing downtime causes for improvement An analysis based on FMEA principles was conducted for the data collected for Willemin machines in a similar way that the analysis of Deco 10 machines was carried out. Table 13 shows the details of the analysis followed by figure 29 describing the rank in a bar chart. Notice that the analysis is individual for these machines and not related to other FMEA analysis.

Yaniv Ben Or – Measuring For Improvement
67
Stop cause N (P) Mean (S) RPN
Setup 16 (9) 61 (4) 36 Material load/change 9 (5) 2,5 (1) 5
First inspection 15 (8) 5,3 (1) 8 Last inspection 16 (9) 3,3 (1) 9 Machine failure 1 (1) 297 (10) 10 Program failure 1 (1) 1,5 (1) 1
Search/wait for tools 3 (2) 1,3 (1) 2 Tool change 11 (6) 10 (1) 6
Wait for container 4 (2) 4,5 (1) 2 Cleaning 12 (7) 6,8 (1) 7
Operator unavailable 4 (2) 47,8 (3) 6 Adjusments 18 (10) 7,6 (1) 10
Wait for p-projector 9 (5) 6,2 (1) 5 Setup other machine 2 (1) 23 (2) 1
Backside milling 2 (1) 59 (4) 4 Table 13: FMEA based analysis of stop causes for Willemin machines
Figure 29: Bar chart describing risk priority number of each downtime cause
The chart is indicating that the downtime cause which should be prioritized is setups, similar to the highest ranked cause for Deco 10 machines. Next ranked are adjustments that are required in the middle of batch production due to technical limitations. These are followed by machine failures and inspections.
Willemin machine 111, used for production of ceramic items, was inspected as well and showed an obtained OEE average value of 73%. The study of the machine indicated on similar downtime causes as the other three machines inspected. An additional downtime causes identified for this machine was sintering/oven-load and a kitting failure. High downtime losses were registered for inspections due to queues for the profile projector. Since only a small number of machine hours

Yaniv Ben Or – Measuring For Improvement
68
were followed due to low production demands, the data’s reliability can be questioned and therefore not analyzed here in more detail.
Specific recommendations for Willemin machines The problem of required adjustments in the middle of production should be considered in the improvement work. There is a need to find and develop technical solutions. It can be a good idea to include the required pressure levels that are needed to be set for each item in the item’s production instructions, in order to avoid unnecessary errors.
The quality rates for Willemin machines showed large percentage of rejected items. The causes for these losses should be examined and improved. Notice that since the machine is processing each item at a time and cycle times are relatively long, rejected items cause significant losses of available machine time and therefore this issue should be prioritized.
The queues for the profile projector were mentioned often by operators and noted in paper forms. It can be beneficial to purchase an additional projector. The registered data however, did not provide an indication that there are severe losses due to this reason or that the issue should be highly prioritized.
Machine operators that work with ceramic products are often busy performing other tasks to process further items after machining. However, operators use alarm clocks to indicate when machines are expected to clear producing batches in order to avoid unnecessary machine inactivity. This awareness for reducing machine stop time is reflected in the relative short stop times due to operator unavailability, considering the other tasks that are performed simultaneously.
6.1.3 Analysis of major downtime causes
� Setups As indicated clearly in the analysis, setups are the major cause for downtime losses of the machining sub process; these occur frequently and consume significant time. This is definitely the most “burning” problem to deal with. The approach to deal with this problem, as mentioned in the value analysis, is to minimize and simplify setups. This type of losses is one of the major six losses that limit equipment effectiveness, described by Nakajima (1989) under the scope of his TPM concept. The time it takes to set up a machine for the production of a new item is depending on the differences in dimensions and shapes between items. Less complicated setups require a change of length between items; more complicated setups require a change of shape between families of items and of product families. Complex setups involve the change of diameter as well and are most time consuming. In order to avoid complicated setups, machines were grouped into families of similar items. Complex setups are usually performed by setup staff. While machine operation procedures are defined, standardized and well understood by operators, setup procedures can be described as confused, uncertain and not well understood. Operator setup skills vary, procedures are not written or documented and setups are performed differently by different operators. Setup and adjustment times are inconsistent.
Single Minute Exchange of Dies (SMED) is a methodology designed to deal with this type of problems and shorten setup times as explained in 3.2.3. During the period of this study, the plant has adopted this methodology and groups of employees including operators and setup staff has

Yaniv Ben Or – Measuring For Improvement
69
been formed for this cause, and started SMED activities to improve setups guided by managers. The work of one group was observed for this study. Group sessions began with setup staff performing complicated setups on machines while other members observed. The activities performed under setup were registered and times were noted. In addition, the movements of the person performing setup were drawn in a diagram as shown in figure 30, while the number of footsteps was counted by a device carried by setup performer.
Figur 30: Diagram describing the registered movements of a setup performer (Nobel Biocare
intranet 2010)
Other sessions of the group included discussions about the observed setups the possible separations to internal and external setup. The observed setups revealed that there are some actions that were performed while machine was inactive, that can be performed in advance instead and save unnecessary downtime. In addition, almost half of the time registered from setup start until appropriate parts were produced was dedicated to trial and error experimentations to adjust equipment for production. Finally, as indicated in figure 30, there was a considerable movement by setup performer around the machine. In the continuing sessions, the group had discussed improvement proposals and made an analysis to rank the proposals according to their costs and implementation possibilities. The proposals for improvements include better preparation of tools and measuring instruments in advance, better measurement methods and instruments, having setup staff more available, standardized work procedures, better computers etc. While these lines are written, SMED activities continue at the plant and setup staff is focusing on the establishment of standard work procedures.
Assessment and recommendations In light of the severity of losses due to setups, the establishment of improvement groups using SMED methodology seems to be the right decision. As operators suggested, there is a need to improve measuring equipment and methods in order to minimize downtime due to adjustments. This seems to be one of the greatest challenges for this initiative. There is a need to standardize procedures and to separate internal and external setup. However, in order to achieve optimal results, it can be beneficial to consider the following issues. The people that take part of the improvement activities should be encouraged to open their minds and think above the procedures that are dictated today by the production system. Procedures can be changed if proven to be
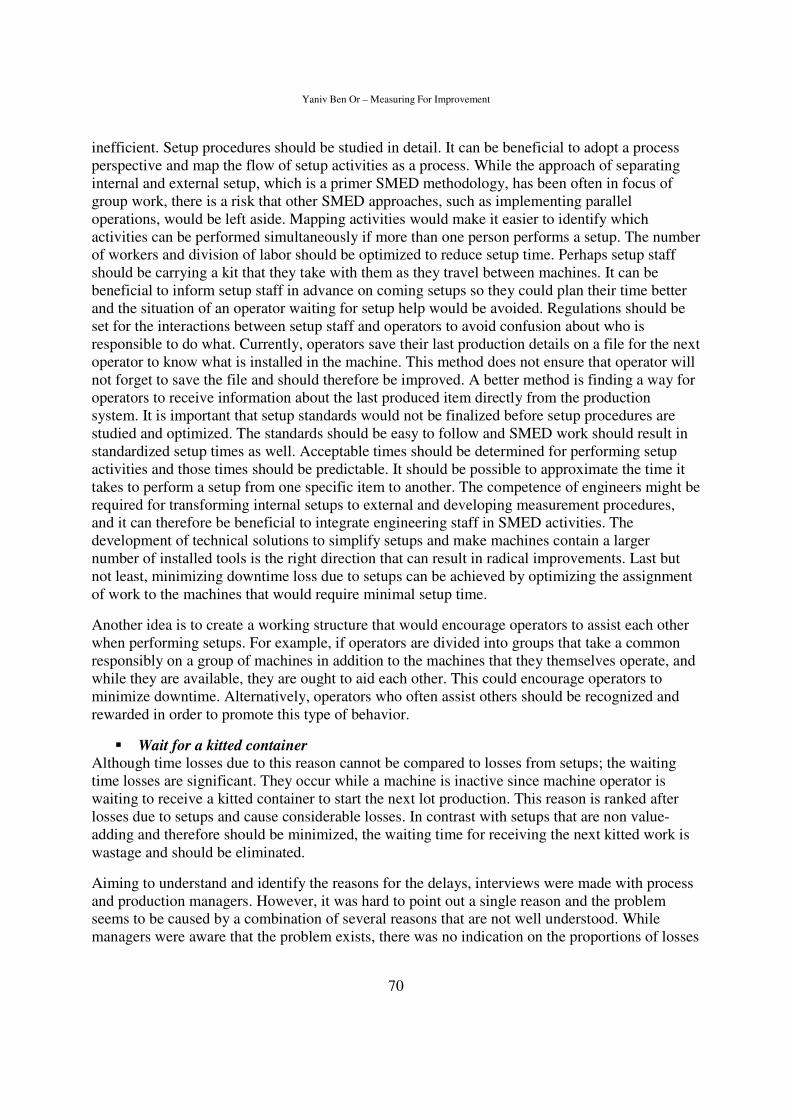
Yaniv Ben Or – Measuring For Improvement
70
inefficient. Setup procedures should be studied in detail. It can be beneficial to adopt a process perspective and map the flow of setup activities as a process. While the approach of separating internal and external setup, which is a primer SMED methodology, has been often in focus of group work, there is a risk that other SMED approaches, such as implementing parallel operations, would be left aside. Mapping activities would make it easier to identify which activities can be performed simultaneously if more than one person performs a setup. The number of workers and division of labor should be optimized to reduce setup time. Perhaps setup staff should be carrying a kit that they take with them as they travel between machines. It can be beneficial to inform setup staff in advance on coming setups so they could plan their time better and the situation of an operator waiting for setup help would be avoided. Regulations should be set for the interactions between setup staff and operators to avoid confusion about who is responsible to do what. Currently, operators save their last production details on a file for the next operator to know what is installed in the machine. This method does not ensure that operator will not forget to save the file and should therefore be improved. A better method is finding a way for operators to receive information about the last produced item directly from the production system. It is important that setup standards would not be finalized before setup procedures are studied and optimized. The standards should be easy to follow and SMED work should result in standardized setup times as well. Acceptable times should be determined for performing setup activities and those times should be predictable. It should be possible to approximate the time it takes to perform a setup from one specific item to another. The competence of engineers might be required for transforming internal setups to external and developing measurement procedures, and it can therefore be beneficial to integrate engineering staff in SMED activities. The development of technical solutions to simplify setups and make machines contain a larger number of installed tools is the right direction that can result in radical improvements. Last but not least, minimizing downtime loss due to setups can be achieved by optimizing the assignment of work to the machines that would require minimal setup time.
Another idea is to create a working structure that would encourage operators to assist each other when performing setups. For example, if operators are divided into groups that take a common responsibly on a group of machines in addition to the machines that they themselves operate, and while they are available, they are ought to aid each other. This could encourage operators to minimize downtime. Alternatively, operators who often assist others should be recognized and rewarded in order to promote this type of behavior.
� Wait for a kitted container Although time losses due to this reason cannot be compared to losses from setups; the waiting time losses are significant. They occur while a machine is inactive since machine operator is waiting to receive a kitted container to start the next lot production. This reason is ranked after losses due to setups and cause considerable losses. In contrast with setups that are non value-adding and therefore should be minimized, the waiting time for receiving the next kitted work is wastage and should be eliminated.
Aiming to understand and identify the reasons for the delays, interviews were made with process and production managers. However, it was hard to point out a single reason and the problem seems to be caused by a combination of several reasons that are not well understood. While managers were aware that the problem exists, there was no indication on the proportions of losses

Yaniv Ben Or – Measuring For Improvement
71
due to this problem and the question that rose when approaching this problem was how come the problem was not treated?
The examination of activities that are previous to arrival of a kitted container to machines has shown that once an order is triggered by the SAP information system in use, orders are registered by the planning unit. Then a proposal to assign the orders is created by the unit on a schedule scheme using an excel sheet. Machining process managers of the production unit consider the assignment proposal and modify the schedule in respect to setup requirements in different machines. Once the scheme is modified, and if there is no other kitted container on its way to a machine, machining process managers initiate the next order to machine in the production system. The managers assure that there will not be more that one container in place for order under machining process and one additional kitted container for the next order. The initiated orders are then kitted in a kitting station that is integrated in the surface treatment unit. The container then travels by a convoy system or taken manually by operators to machines.
Figure 31: Managers’ responsibilities in respect to order flow
The flow of activities and responsibilities are described in figure 31. As shown, there are three different managers responsible for the different activities in the flow. A planning manager is responsible for order registration and proposing machine schedule. A machining process manager is responsible to modify, confirm the schedule and initiate orders. A third manager, surface treatment process manager is responsible for kitting the order. Machine setup and production process of the order are in the responsibility area of the machining process manager. According to Ljungberg & Larsson (2001), the borders of managers’ responsibility areas can be illogical in relation to the overall process. For each activity, the relevant manager is responsible for the resources, to drive the work and for developments. This seems to be an explanation to the reasons this problem has not yet been solved.

Yaniv Ben Or – Measuring For Improvement
72
A why-why analysis was conducted to help identify and describe the reasons for the waiting time losses based on information gathered through interviews with relevant managers.
Figure 32: Why-why analysis
As the analysis revealed, there are a number of major reasons that can cause delays for machine operators in receiving a kitted container to start the next production. The reasons include the situation when order was not initiated since machining process managers did not manage to initiate a new order on time while machine was working on an earlier order because they were busy with other tasks. Another reason is that since the staff that kits the containers is working on several tasks simultaneously, not all orders are kitted as soon as they should be, which causes delays for containers ought to be sent. Additional reasons are that there are no containers or pallets in hand to be used for the order which delays kitting. Lastly, the production system which triggers the kitting is prioritizing orders based on predetermined parameters that primarily consider a priority number between 1 and 3. Then, the system considers the delivery dates and lastly, the order of initiation. None of the parameters take in consideration whether the machine is currently producing another order or not. This grounds the situation when orders for machines that are producing at the time are kitted before orders for machines that are inactive, while operators wait for the next kitted order.
Recommendations Too many different managers are involved in the order flow. For example, the responsibility of surface treatment processes managers for kitting (marked in red color in figure 32) seems to be derived from the physical position of the installed convoy system’s kitting station rather than from a logical flow of activities. Once the number of responsible managers is minimized, managers would be able to identify problems and take actions more easily. Simplifying this flow should help to solve the problem.
An investigation of the number of pallets and containers should be conducted to examine if there is a need to purchase more units. Fluctuations in demanded products might, for some periods of time, entail a larger number of pellets of a certain sort. Additional containers or pallets might be required to avoid unnecessary wait.

Yaniv Ben Or – Measuring For Improvement
73
The production system should be developed to take in consideration, when prioritizing orders, machine availability – if the relevant machine currently producing orders or not. Orders for machines that are “waiting” should be kitted before orders for machines that are in operation.
Since process managers are not available for initiating orders at all times, it might be beneficial to remove the initiation of orders from their activities. Orders can instead be initiated by operators, kitting workers or planning unit staff.
The current flow of order schedule begins with a suggestion by the planning unit and then a modification by process-managers. The flow is designed to compensate the inefficiencies of the production system. Vital information regarding setup times between items and assignments of item orders to machines is missing, creating the requirement for manual aid. Further development of the production system should include this information to allow an automatic flow. Once setup and adjustment procedures are standardized and setup time from one item to another can be approximated and predicted, it would be possible to optimize work assignment to machines intelligently, to avoid unnecessary time loss due to setups.
The optimization of work assignment to machines, based on the time it would take to perform setup between items, is vital for minimizing unnecessary complicated setups. This can be achieved for example, by using methods known in literature of Operations Research field. It is a linear programming problem that can be solved by the Simplex algorithm or alternatively, by the Hungarian method as described in the following example borrowed from Winston (1999):
We assume that we have four machines and each machine must be assigned to complete one job. Our goal is to minimize the total setup time needed for the four jobs. The time required to set up each machine for each job is given in table 14.
Time (hours)
Job 1 Job 2 Job 3 Job 4
Machine 1 14 5 8 7
Machine 2 2 12 6 5
Machine 3 7 8 3 9
Machine 4 2 4 6 10
Table 14: Setup times
We need to determine which machine should be assigned to each job. We define for ��� !,#,$,% , when ��� ! if machine i is assigned for job j and ��� & if machine i is not assigned. The problem can be formulated as:
Min * = 14�!! + 5�!# + 8�!$ + 7�!% + 2�#! + 12�## + 6�#$ + 5�#% + 7�$! + 8�$# + 3�$$ + 9�$% + 2�%!
+ 4�%# + 6�%$ + 10�%%
When
�!! + �!# + �!$ + �!% = 1 (Machine constraints)
�#! + �## + �#$ + �#% = 1
�$! + �$# + �$$ + �$% = 1
�%! + �%# + �%$ + �%% = 1

Yaniv Ben Or – Measuring For Improvement
74
�!! + �#! + �$! + �%! = 1 (Job constraints)
�!# + �## + �$# + �%# = 1
�!$ + �#$ + �$$ + �%$ = 1
�!% + �#% + �$% + �%% = 1
� 6 = 0 or � 6 = 1
The problem now can be solved as a balanced transportation problem, ignoring the restrictions that � 6 = 0 or 1. The problem can alternatively be solved by using the Hungarian method, carrying out the following operations:
For each row, we substract the row minimum from each element in the row
14 5 8 7 Row min = 5 2 12 6 5 Row min = 2
7 8 3 9 Row min = 3
2 4 6 10 Row min = 4
Table 15: The matrix
After substracting the minimium from each row we find the minimum in each column
9 0 3 2 0 10 4 3
4 5 0 6
0 2 4 8
Column min 0 Column min 0 Column min 0 Column min 2
Table 16: The matrix after row minimums are substracted
We subtract the minimum from each column as well, and draw the minimum number of lines that are needed to cover all the zeros in the reduced matrix.
9 0 3 0 0 10 4 1
4 5 0 4
0 2 4 6
Table 17: The matrix after column minimums are substracted
If four lines are required (for a 4x4 matrix) an optimal solution is available among the covered zeros. If fewer than four are needed we find the smallest nonzero element in the reduced matrix that is uncovered by lines and subtract it from each element that is uncovered by a line. Then we add it to each element that is covered by two lines.
10 0 3 0 0 9 3 0
5 5 0 4
0 1 3 5
Table 18: Four lines required, optimal solution available

Yaniv Ben Or – Measuring For Improvement
75
To find the optimal assignment, we choose the elements in columns where there is only one zero. We therefore choose elements �!# in column 2 and �$$ in column 3. Now, the using columns and rows cannot be used again, so we choose �#% in column 4. For column 1 we have �%! left. The optimal solution obtains from the chosen elements according to the values we had in the start matrix. The minimum setup times obtained indicates that a total of 5+5+3+2=15 hours are required.
In order to integrate the method for practical daily work of order assignment, it can be beneficial to develop the production system to assign work automatically based on this method. A low cost alternative is that staff bases their assignment decision by using a solver such as the Excel solver included in Microsoft Office package. Notice that not all combinations of item setups’ times must be found. A good approximation can be obtained by dividing all items into groups and estimating the time for setting up a machine for an item from one group to another item from another group. By working in the suggested means, the person using the solver would not be required to have knowledge on items to obtain the optimal assignment. This means that machining process managers who currently assign or modify jobs would not be required to perform this task. Notice that letting operators assign jobs to their machines does not guarantee that the total setup time will be minimized. As one operator minimizes the setup time of his/her machine, another operator is left to perform a time consuming setup, based on the previous example.
� Machine failure Although time loss due to machine failure is not as significant as the losses due to setups, there are considerable losses due to machine failure as the priority analysis indicates. Losses due to machine failure can be expressed not only as registered in direct OEE values, but there are also flexibility losses due to breakdowns that can force process managers to assign orders to other machines that require complicated setups, and might therefore require longer lead times. As mentioned earlier, severe breakdowns not repaired during one shift were regarded as planned downtime since process managers did not assign operators for these machines. These breakdowns were therefore excluded and are not expressed in the OEE measurements and the real proportions of the problem are larger than indicated. While a certain level of machine failures are usually accepted in manufacturing, Nakajima (1989) suggests that the goal should be to eliminate machine failures and the TPM approach is not to except breakdowns at all. In addition he identifies breakdown causes as a combination of the following: operating standards not followed, deterioration unchecked, inherent design weakness, inadequate skills and basic conditions neglected.
In order to gather an understanding of the routines and maintenance activities used for the machines, service manager and operators have been interviewed. Currently, machine operators repair small failures depending on their competencies and skills while complicated failures are repaired by service staff. The repairs by service staff are registered and saved in a database. The registered data includes the date, machine, name of service employee and a general description of the failure. According to the service manager, collected data is general and there is no easy way to gather relevant data from the database in order to use the information for analysis and decision making. The maintenance activities of the machines are performed by operators and service staff. Operators perform daily and weekly maintenance while service staff performs occasional maintenance. The activities are in accordance to recommendations from the manufacturer and from experience based maintenance developed at the plant. There are paper check sheets for

Yaniv Ben Or – Measuring For Improvement
76
operator maintenance activities that require signatures. However, there are indications that maintenance activities are not always performed properly, based on information gathered by interviews.
Recommendations The considerable time losses due to machine failures show that the current preventive maintenance activities are not very efficient. The collected data has no means as long as it is rarely used. It is therefore recommended to further develop data collection and maintenance activities. It is necessary to collect data that can be used to analyze machine breakdown causes, identify the reasons for the breakdowns that have most severe consequences and based on analysis, develop preventive maintenance standard activities. It is important that all types of breakdowns should be considered. Minor failures that can be repaired by operators must be considered and therefore registered and analyzed as well, aiming to reduce down time losses. There is a risk that this type of breakdowns would be accepted and become chronic since it is not directly the responsibility of the service unit. On the other hand, the responsibility of operator maintenance belongs to the production unit while service unit must deal with the consequences. It would be wise to avoid such organizational weaknesses, by expanding the cooperation between the units, especially for maintenance development. “Operators and maintenance personnel must
reach a mutual understanding and share responsibility for equipment” (Nakajima 1989). It can be beneficial to form development groups including operators, engineers and service staff for the development. Preventive maintenance activities need to be assured and there is a need to develop routines to control these activities.
A good starting point would be to develop data collection. Under the time that this study was conducted, service manager has shown awareness and interest to collect data in a way that the data would be useful for maintenance development. It is recommended that the data would be able to constitute the foundation for machine-breakdown risk analysis such as FMEA. This possibility was suggested and discussed with the manager who has designed an electronic sheet for breakdown data collection. The sheet includes data factors that can be used to perform the analysis. There would be registration of inactivity time for machines due to breakdowns and other costs which can be used to estimate the severity. The data can be used to estimate the probability of occurrence and failure reasons would be registered in more detail, allowing the manager to conduct the analysis.
The collection of data and analysis, however are just a start in the right direction. There is a need to develop an improvement program based on the analysis and the experience of operators, service staff and engineering. There are personnel in the plant that have competence and experience in failure mode analysis methodologies that can be suitable to assist organizing working methods to analyze machine breakdowns. A good idea is to adopt the four phase implementation program suggested by Nakajima (1989) shown in table 19:

Yaniv Ben Or – Measuring For Improvement
77
Phase 1 Phase 2 Phase 3 Phase 4
Stabilize mean time
between failure
Lengthen equipment
life
Periodically restore
deterioration
Predict equipment life
Restore unchecked
deterioration
-Deal with visible defects Prevent accelerated
deterioration
-Set basic equipment conditions
Correct design
weaknesses
-Correct weaknesses in strength and precision -Select parts conformable to operating conditions -Correct weaknesses to prevent overloading Eliminate sporadic
breakdowns -Improve operating and maintenance skills -Prevent misoperation -Prevent repair errors Restore external
appearance of
equipment
Restore deterioration
at regular intervals
-Estimate life span of equipment -Set standards for periodic inspection and testing -Set standards for periodic parts replacement -Improve maintainability Use the senses to detect
internal deterioration
-Identify deterioration that gives warning signs -Identify types of warning signs given -Learn to detect warning signs
Predict equipment life
using diagnostic
techniques
-Clarify and adhere to operating standards Perform technical
analysis of catastrophic
failures
-Analyze rupture faces -Analyze material fatigue -Analyze gear tooth flanks etc. -Take measures to extend equipment life -Conduct periodic restoration based on predicted life
Table 19: Zero breakdowns in four phases (Nakajima 1989, p.104)
� First item inspection The first item inspection is a procedure that follows setups in which equipment is adjusted until the machine produces items that fulfill requirements. A high level of precision of item dimensions was determined with consideration to quality assurance of medical products since items are made to be integrated in the human body and slight deviations can risk the health of the patients who receive the items/implants. Obtaining precision is therefore a value adding activity that is directly connected to customer satisfaction and to the performance of products. As mentioned earlier, the adjustments of the machine to produce accepted items consume considerable time and material and therefore should be developed and simplified, for example by using better adjustments methods and equipment. This problem can be addressed by SMED activities that are already discussed in this section, in the part dealing with setups, and thus are not developed further here.
6.1.4 Additional recommendations and comments
The layout of the production facility is not optimal since a number of machines are located separately and are not connected to the convoy system, which requires operators to travel around the plant to the kitting station in order to return and get containers.
Regarding Deco 10 robot-cells, it is important to notice that since there are three machines included in the cell that process the same order, time loss for the cell as a whole is equivalent to time loss for three machines, which means in other words that the cells are more sensible for losses. If, for example, the cell is inactive for 10 minutes while waiting for the kitted container of the next job to arrive, the total machine time loss is 30 minutes. Similarly, when cells are inactive due to inspection of items or other reasons, there are time losses for 3 machines. Since each order is performed by 3 machines, there is a larger number of rejected items/wasted items for each

Yaniv Ben Or – Measuring For Improvement
78
order due to adjustments and, for example, items left in machines when the amount of ordered items is obtained.
Production of small batches such as 48-item and 96-item batches in cells is inefficient. The operator sets-up the first machine and activates it, then perform a setup on the second machine and activate it as well, and then sets the third machine. In small batch production by a cell, until the third machine is set for production, the other two machines have already finished or almost finished processing the order. Sometimes the operator chooses on this basis to activate only two machines which mean an unnecessary waste of resources. Production of small batches by a cell should therefore be avoided.
Robot-cells as they are currently used are a source for flexibility losses. There are four cells including 12 machines altogether that are capable producing four different orders simultaneously. The 12 machines, if used differently, were able to produce 12 orders simultaneously. This means that we have flexibility losses equivalent to 8 machines. This information is significant particularly when flexibility is vital for avoiding unnecessary setups. The cells are beneficial for mass production and should be kept to allow production of larger volumes if needed. Another problem considering the cells is that the cells are not similar which requires operators to have knowledge of how to use each cell. This is an obstacle for flexibility in assigning operators to cells. A good idea is to develop the cells further in the future for making the cells similar and to allow production of three different orders by each cell. The automatic inspection of items by the Vision system that is used in the robot-cells is capable of performing the last named task.

Yaniv Ben Or – Measuring For Improvement
79
6.1.5 Overall Equipment Effectiveness (OEE) assessment Assessment Level 1 Level 2 Level 3 Level 4
1. Breakdown losses 1. Combination of sporadic and chronic breakdowns 2. BM >PM 3. Significant breakdown losses 4. Autonomous operator maintenance not organized 5. Unstable life spans Equipment weaknesses are unrecognized
1. Sporadic breakdowns 2. PM≈BM 3. Breakdown losses still significant 4. Autonomous maintenance being organized 5. Parts life spans estimated 6. Equipment weaknesses well acknowledged 7. MI (maintainability improvement) applied on the above points
1. Time based maintenance established 2. PM>BM 3. Breakdown losses less than 1% 4. Autonomous maintenance activities well- established 5. Parts life spans lengthened
1. Condition-based maintenance established 2. PM 3. Breakdown losses 0.1%-0 4. Autonomous maintenance activities stable and refined 5. Parts life spans predicted 6. Reliable and maintainable design developed
2. Setup and adjustment losses
1. No control- laissez
faire production by operators 2. Work procedures disorganized and setup/adjustment time varies Widely
1. Work procedures organized (e.g. internal and external setup distinguished) 2. Setup/adjustment time unstable 3. Problems to be improved identified
1. Moving internal setup operations into external setup time 2. Adjustment mechanisms identified and well understood
1. Setup time less than 10 minutes 2. Immediate product changeover by eliminating adjustments
3. Speed losses 1. Equipment specifications not well understood 2. No speed standards (by product and machinery)
1. Problems related to speed losses analyzed -Mechanical problems -Quality problems 2. Tentative speed standards set and maintained by product 3. Speed vary slightly
1. Necessary improvements being implemented 2. -Speed is set by the product -Cause and effect relationship predicted between the problem and the precision of the equipment , jigs, and tools 3. Small speed losses
1. Operation speed increased to design speed or beyond through equipment improvements 2. Speed standard set and maintained by product (final standards) 3. Zero speed losses
4. Idling and minor stoppage losses
1. Losses from minor stoppages unrecognized 2. Unstable operating conditions due to fluctuation in frequency and location of losses
1. Minor stoppage losses analyzed quantitatively -Frequency and location of occurrence -Volume lost 2. Losses categorized and outbreak mechanism analyzed; preventive measures taken on trial-and-error basis
1. All causes of minor stoppages analyzed, all solutions implemented, conditions favorable
1. Zero minor stoppages ( unmanned operation possible)
5. Quality defect and rework losses (startup losses included)
1. Chronic quality problems are neglected 2. Many successful remedial actions have been taken
1. Chronic quality problems quantified -Details of defect, frequency -Volume lost 2. Losses categorized and outbreak mechanism explained; preventive measures taken on trial and error basis
1. All causes of chronic quality defects analyzed, all solutions implemented, conditions favorable 2. Automatic in-process detection off defects under study
1. Quality losses=0.1%-0
Table 20: OEE assessment for machining sub-process - current levels marked in red color

Yaniv Ben Or – Measuring For Improvement
80
� Breakdown losses – level 2
The level which describes breakdown losses best is level 2. Machine breakdowns are still significant. There are defined autonomous maintenance activities performed daily and weekly by operators that include cleanings, lubrications and controls, and periodic maintenance performed by the service unit. These activities however, are neither sufficient nor optimal which results in machine breakdowns. There is no well-functioning method to control operators’ maintenance activities. Equipment weaknesses are well acknowledged to service personnel and engineers, based on experience. Breakdown maintenance activities are time consuming and reduce valuable availability time of machines. Additionally, Breakdowns occur due to misoperation of the machines. There are no statistical methods used to study failure distributions. Machine failure data is collected, but cannot be tracked easily and therefore is not useful. The underlying failure mechanisms are not being analyzed systematically.
� Setup and adjustments losses – level 1
The most appropriate level to describe setup and adjustment losses was found to be level 1. Operators perform setups in their own individual ways since there are no well-organized work procedures to perform setups. Setup and adjustment time varies widely. External and internal setup is not distinguished. However, under the period that this study was conducted, there have been efforts to develop setups in SMED improvement groups. The problems to improve are identified and there is an ongoing study to organize setup work procedures. Once procedures are decided and new routines are officially adopted, level 2 would be more appropriate to describe the losses.
� Speed losses – level 4
The CNC machines used for production of items are controlled by a computer and the machine operates in accordance to a programmed scheme, ensuring that cycle times maintain. There are ongoing efforts to modify programs in order to shorten and optimize cycle times. It is possible for operators to reduce speed manually, but there is no indication of someone doing this. Speed losses are negligent. For Willemin machines however, programmed time schemes are not as visible as for Deco 10, speeds were set on trial and error basis and it is harder to determine whether speeds are optimal, level therefore might be lower.
� Idling and minor stoppage losses – level 4
Due to the same reasons that were named for speed losses, the computer controlled machines ensure cycle times. Minor stoppages occur seldom due to minor jams and failures and are neglected. Unmanned operation of Deco 10 machines is possible. Willemin machines however, require frequent stops for adjustments which do not allow unmanned operation. The level that describes Willemin machines best is level 2 since conditions are not favorable.
� Quality defect and rework losses – level 3
There is a well developed quality assurance and control system integrated in operations. There is an automatic in process detection of defects as machines perform numerical control and the level of precision is high. There is, in addition, manual in process detection of defects to ensure precision and avoid unnecessary rejections. There are controls of measurement instruments by the

Yaniv Ben Or – Measuring For Improvement
81
quality unit. Conditions are mostly favorable. Rejected item occur during adjustments that follow setups, due to failures in machine, tool fatigue etc. Causes of chronic defects are analyzed and solutions are implemented. Defect levels however, are higher than 0.1%.
6.2 Surface treatment The analysis started, as for machining sub-process, by conducting a value analysis of the different unplanned reasons for cell inactivity for both types of cells. The analysis suggests categorizing the stops as shown in table 21 below:
Downtime cause Cell
type
Value
adding
Non-value
adding
Wastage
Setup M x Cassette / batch change T x Stripes change T x x First item inspection M x Last item inspection M x Cleaning M+T x Machine failure: operator aided M+T x Machine failure: technician aided M+T x Alarm: general M+T x x Alarm: leakage test T x Get tools / cassettes T x Wait for work M+T x Operator unavailable-other tasks M+T x Electrolyte change T x Electrolyte contact problem T x Item grinding T x Get ring pads M x Cassette change during lot process T x
Table 21: Value analysis of unplanned downtime causes
The notation of cell type by the letter T means that the stop cause is relevant for TiUnite cells; M means that the stop cause is relevant for MaskPad cells, while M+T means that the cause is relevant for both. Notice that Stripes change and Alarms:general are marked twice. Stripes
change is categorized as wastage in the situations when it is possible to prepare the stripes on the cassette in advance, and it is not done. Alarms: general is categorized as wastage in those cases when the alarm is a false alarm.
6.2.1 TiUnite
As obtained in the measurement outcomes, the average OEE value for the cells was around 59%. The main losses identified were availability losses when availability rate was only around 75%, performance was about 84% while quality was 95%. Few reasons were identified as causes for the resulted performance rates: in the situations when a cell started processing with the use of nitrogen after a period of time when nitrogen was not in use, it takes long time for the cell to receive nitrogen which causes delays in processing the items.
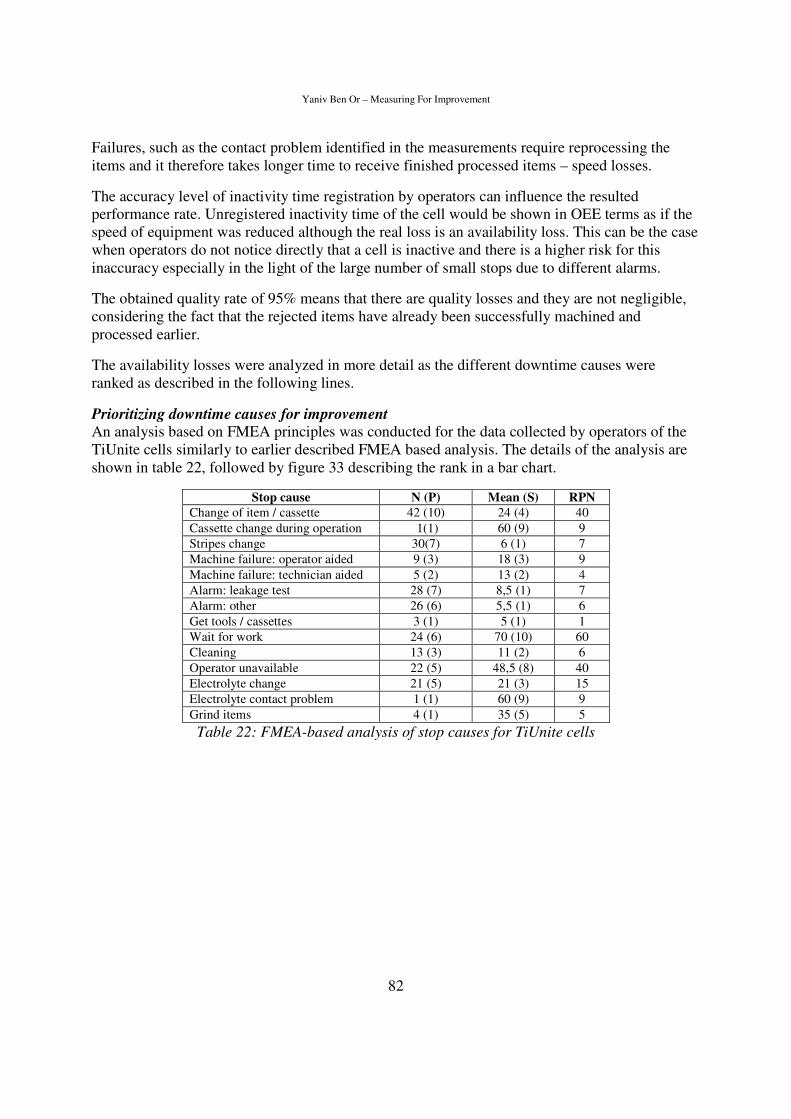
Yaniv Ben Or – Measuring For Improvement
82
Failures, such as the contact problem identified in the measurements require reprocessing the items and it therefore takes longer time to receive finished processed items – speed losses.
The accuracy level of inactivity time registration by operators can influence the resulted performance rate. Unregistered inactivity time of the cell would be shown in OEE terms as if the speed of equipment was reduced although the real loss is an availability loss. This can be the case when operators do not notice directly that a cell is inactive and there is a higher risk for this inaccuracy especially in the light of the large number of small stops due to different alarms.
The obtained quality rate of 95% means that there are quality losses and they are not negligible, considering the fact that the rejected items have already been successfully machined and processed earlier.
The availability losses were analyzed in more detail as the different downtime causes were ranked as described in the following lines.
Prioritizing downtime causes for improvement An analysis based on FMEA principles was conducted for the data collected by operators of the TiUnite cells similarly to earlier described FMEA based analysis. The details of the analysis are shown in table 22, followed by figure 33 describing the rank in a bar chart.
Stop cause N (P) Mean (S) RPN
Change of item / cassette 42 (10) 24 (4) 40 Cassette change during operation 1(1) 60 (9) 9 Stripes change 30(7) 6 (1) 7 Machine failure: operator aided 9 (3) 18 (3) 9 Machine failure: technician aided 5 (2) 13 (2) 4 Alarm: leakage test 28 (7) 8,5 (1) 7 Alarm: other 26 (6) 5,5 (1) 6 Get tools / cassettes 3 (1) 5 (1) 1 Wait for work 24 (6) 70 (10) 60 Cleaning 13 (3) 11 (2) 6 Operator unavailable 22 (5) 48,5 (8) 40 Electrolyte change 21 (5) 21 (3) 15 Electrolyte contact problem 1 (1) 60 (9) 9 Grind items 4 (1) 35 (5) 5 Table 22: FMEA-based analysis of stop causes for TiUnite cells

Yaniv Ben Or – Measuring For Improvement
83
Figure 33: Bar chart describing risk priority number of each downtime cause
The chart indicates that the downtime cause that should be in the center of attention is regarding the time in which machines are inactive due to absence of work during a shift, whereas there are operators assigned to operate those machines. Following this cause, the next highly ranked issues to consider are the time when machines are inactive while operators prepare the cell for processing a new item. This includes the change of a cassette, if necessary. Another issue is the situations in which cells are inactive while operators are busy performing other tasks.
The major reason for downtime, absence of work for the cells, is directly related to the inefficiencies in the synchronization of order flow and fluctuations in production. The cause for undesired waiting time between jobs for the TiUnite cell is due to the fact that the flow of items is not smooth and balanced. While sometimes cells are inactive while there is no new job to process, in some situations there is a stream of jobs and a queue builds. However, observations have shown that in the period of inspection the situation of a queue building was rather uncommon. The flow of items to TiUnite cells is related as well to allocation of operators and can in particular be related to night shifts in which usually only a smaller number of jobs were registered. The flow of items to the cells during nights is often not a continuous one and cell operators during nights are often assigned to perform other tasks during the shift. Since operators are assigned to perform other tasks in situations that there is not much job for the TiUnite cells to process, the situation of a cell that is inactive due to unavailability of operator occurs. This is another highly ranked cause for downtime as shown in the bar chart. Production managers face the challenge of optimizing allocation of operators in order to balance flow. It is therefore necessary to have flexible human resources.
The change of processed item type from one job to another requires few operations including change of cassettes and can be seen as a setup. Although each individual setup is not very time consuming, the total time that is spent each shift for this cause while machine is inactive is significant and therefore should be highly prioritized for improvement as well.
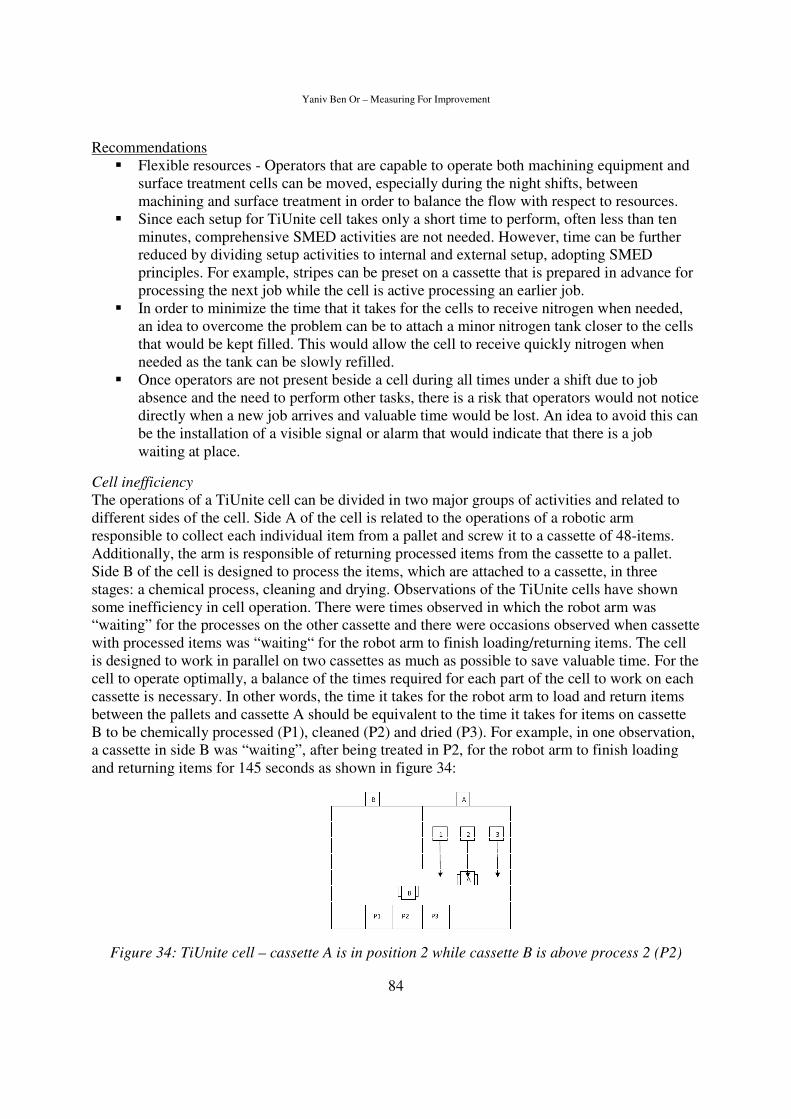
Yaniv Ben Or – Measuring For Improvement
84
Recommendations � Flexible resources - Operators that are capable to operate both machining equipment and
surface treatment cells can be moved, especially during the night shifts, between machining and surface treatment in order to balance the flow with respect to resources.
� Since each setup for TiUnite cell takes only a short time to perform, often less than ten minutes, comprehensive SMED activities are not needed. However, time can be further reduced by dividing setup activities to internal and external setup, adopting SMED principles. For example, stripes can be preset on a cassette that is prepared in advance for processing the next job while the cell is active processing an earlier job.
� In order to minimize the time that it takes for the cells to receive nitrogen when needed, an idea to overcome the problem can be to attach a minor nitrogen tank closer to the cells that would be kept filled. This would allow the cell to receive quickly nitrogen when needed as the tank can be slowly refilled.
� Once operators are not present beside a cell during all times under a shift due to job absence and the need to perform other tasks, there is a risk that operators would not notice directly when a new job arrives and valuable time would be lost. An idea to avoid this can be the installation of a visible signal or alarm that would indicate that there is a job waiting at place.
Cell inefficiency
The operations of a TiUnite cell can be divided in two major groups of activities and related to different sides of the cell. Side A of the cell is related to the operations of a robotic arm responsible to collect each individual item from a pallet and screw it to a cassette of 48-items. Additionally, the arm is responsible of returning processed items from the cassette to a pallet. Side B of the cell is designed to process the items, which are attached to a cassette, in three stages: a chemical process, cleaning and drying. Observations of the TiUnite cells have shown some inefficiency in cell operation. There were times observed in which the robot arm was “waiting” for the processes on the other cassette and there were occasions observed when cassette with processed items was “waiting“ for the robot arm to finish loading/returning items. The cell is designed to work in parallel on two cassettes as much as possible to save valuable time. For the cell to operate optimally, a balance of the times required for each part of the cell to work on each cassette is necessary. In other words, the time it takes for the robot arm to load and return items between the pallets and cassette A should be equivalent to the time it takes for items on cassette B to be chemically processed (P1), cleaned (P2) and dried (P3). For example, in one observation, a cassette in side B was “waiting”, after being treated in P2, for the robot arm to finish loading and returning items for 145 seconds as shown in figure 34:
Figure 34: TiUnite cell – cassette A is in position 2 while cassette B is above process 2 (P2)

Yaniv Ben Or – Measuring For Improvement
85
Other observations showed that the robot arm is idling sometimes during the operation. It is idle, for example, while cassette A is in position 3 and cassette B is in P3. Although there are 3 different possible positions for cassette A in side A of the cell, the robot arm can only reach items in positions 1 and 2. According to this reason, always when there is a cassette in P3, the robot arm is idling. The cells were further observed and the findings indicate that the inefficiency depends on the number of items that the cassette contains.
Observations showed that the robot arm located in side A of the cell require 12.7 seconds to perform a load of an item to a cassette and return another item to a pallet while only loading or only returning items require 6.6 seconds. To load an empty 48-item cassette or to return items from a cassette without reloading would therefore require 48 ∗ 6.6 ≈ 317 seconds. For the robot arm to perform a simultaneous load and return of a 48-item cassette would require 48 ∗ 12.7 ≈
610 seconds. The processing time for items that are on a cassette varies in dependence to the surface area the items and whether or not processes involve nitrogen. In one observation using nitrogen, a 240 item batch required for processing the first cassette 1020 seconds while each additional cassette processing required additional 830 seconds. Taking in mind the limitation that robot arm cannot reach items on cassette A in position 3 while cassette B is in P3 (drying) as showed in the figure 34, we need to add the idling time when calculating minimum time for loading/returning items on cassette A. The length of this time is equivalent to P3 time and was observed to be 120 seconds. In addition, we assume 30 seconds for shifting between cassettes. Based on this information, we calculate the minimum time for processing the 240-item batch. Considering the operations of the robot arm, we calculate the time to be:
9:;<� = 317 + 30 + 317 + 30 + 610 + 30 + 610 + 30 + 610 + 30 + 317 + 30 + 317 = 3278 seconds.
Due to the above named limitation, we need to add 120 seconds for each cassette load, we obtain:
9:;<�∗ = 3278 + 120 ∗ 5 = 3878 seconds.
Time for processing the 240 items (5 cassettes) in side B is calculated to be:
9:;<= = 30 + 1020 + 30 + 830 + 30 + 830 + 30 + 830 + 30 + 830 + 30 = 4520 seconds.
We obtained a gap of 1212 seconds between the operations while the time for the whole process is dictated by the longer operation time, and would therefore require 4520 seconds.
Now, assume we use cassettes that can carry 60 items each (so we can still use the same 240-item pallets) instead of the 48-item cassettes that are currently used. We will need to process now only 4 cassettes. For the robot arm to load an empty cassette would now require 6.6 ∗ 60 = 396 seconds and to perform simultaneous load/return would require12.7 ∗ 60 = 762 seconds. We calculate the times as we did before as follows:
9:;<� = 396 + 30 + 396 + 30 + 762 + 30 + 762 + 30 + 396 + 30 + 396 = 3258 seconds
We add again 120 seconds for each cassette load due to the limitation, we obtain:
9:;<�∗ = 3258 + 120 ∗ 5 = 3858 seconds.
9:;<= = 30 + 1020 + 30 + 830 + 30 + 830 + 30 + 830 + 30 = 3660 seconds.

Yaniv Ben Or – Measuring For Improvement
86
As we see, we obtained a more balanced operation that would require 3858 seconds to treat the surfaces of 240 items. A reduction of 14% can be achieved in this specific case. Notice that if the robot arm was capable of reaching items from position 3, the processing time obtained would have been 3630 seconds, which is a reduction of 19%. The condition for the stated to be valid is that the time of the 3 processes does not change if amount of items on a cassette is larger. This reasoning is correct according to the production supervisor.
The last example had shown that having a 48-item cassette for a 240-item batch is not the optimal size for all products and using 60-item cassettes for batches using nitrogen processing can be beneficial, particularly when the surface area is above average in comparison to the different available assortment of implants.
6.2.2 MaskPad
As shown in the results, the OEE mean value calculated for the MaskPad cells was about 46%. A low availability rate of 57% was registered. A modest performance rate of 81% was obtained while a high quality rate of almost 100% was recorded. The MaskPad cells can be characterized as equipment of high quality rates and low usage rates since the major availability losses are absence of work.
Performance losses obtained in the results may be somewhat exaggerated since there is a risk that not all inactivity time was registered due to the fact that the cells are not in constant usage and while operated, suffer from a large number of minor stops due to different alarm. This requires that operators remain beside cell during all shift time in order to get accurate levels. In reality, operator frequently estimated the inactivity time.
There are speed losses of the cells that depend on failures or delays of the robotic arms ability to attach ring pads to items that are expressed in the performance rate.
The availability losses were analyzed in more detail as the different downtime causes were ranked as described in the following lines.
Prioritizing downtime causes for improvement An analysis based on FMEA principles was conducted for the data collected by operators of the MakPad cells. The details of the analysis are shown in table 23, followed by figure 35 describing the rank in a bar chart.
Stop cause N (P) Mean (S) RPN
Setup 27 (9) 19 (2) 18 First item inspection 29(10) 1,7 (1) 10 Last item inspection 25(8) 1,3 (1) 8 Machine failure: operator aided 13 (4) 12,6 (1) 4 Machine failure: technician aided 10 (3) 66 (4) 12 Alarms 30 (10) 10,8 (1) 10 Get ring pads 4 (1) 3 (1) 1 Wait for work 28 (9) 154 (10) 90 Cleaning 12 (4) 10,6 (2) 8 Operator unavailable 17 (6) 40,7 (3) 18 Table 23: FMEA-based analysis of stop causes for MaskPad cells

Yaniv Ben Or – Measuring For Improvement
87
Figure 35: Bar chart describing risk priority number of each downtime cause
As showed in the bar chart, the most obvious downtime cause is the absence of work. The next ranked issues to prioritize improvement on are losses due to setups and operator availability. The MaskPad cells are located between TiUnite cells and are often operated by same operators charged on the function of TiUnite cells. The major downtime causes such as the wait for work, setups and unavailability of operators are common to both types of cells, although their proportions vary. The recommendations regarding flexible resources, setups and making the arrival of new jobs more visible are common to the MaskPad cells.
The older MaskPad cell suffers from a problem of false alarms of item drop. The alarms are frequent and occur with every operation. Although the problem is obvious, it is chronic and accepted.
Cell inefficiently used The MaskPad cell’s operation can be divided into two functions. One function is putting the ring pads on items and the other in an additional color mark of the items. Items can be set with rings pads only or alternatively both set with pads and colored mark. An observation of one of the newer cells was made in order to record cycle times for the calculation of OEE values has surprisingly shown that the cycle time for setting the items only required 21 seconds for certain items while the time required for the cell to perform both pad setting and color mark required between 17-21 seconds for different items. Additional observation of the time required only for pad setting has shown that the cell is capable to perform the same task in 14 seconds. This indicates that in programs of some details, there are inefficiencies for the performance of pad setting only. An explanation to this is that due to some reason, the cycle time for setting the ring pads only is delayed while robot arm is idle for few seconds to synchronize with the color coding function, although the color function is not used. This observation showed unnecessary inefficiency time losses that are equivalent to 33%. It could be a good idea to examine the programs and repair them if needed, to avoid the inefficiency.
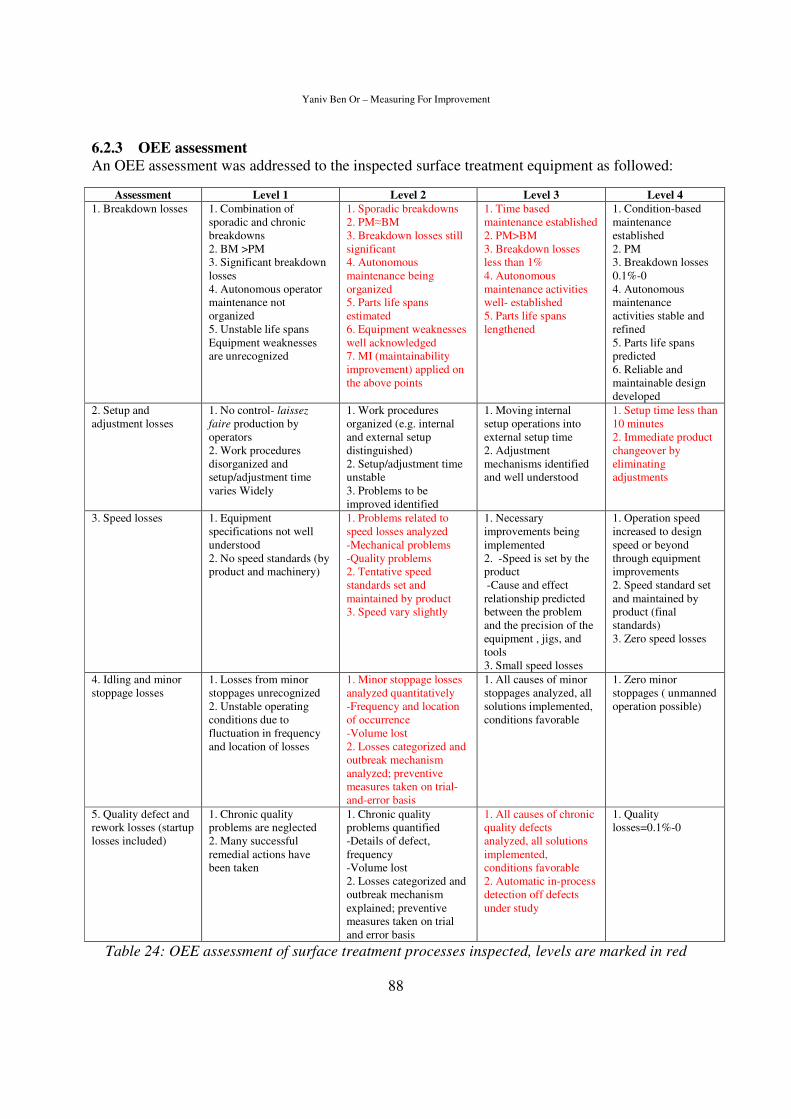
Yaniv Ben Or – Measuring For Improvement
88
6.2.3 OEE assessment
An OEE assessment was addressed to the inspected surface treatment equipment as followed:
Assessment Level 1 Level 2 Level 3 Level 4
1. Breakdown losses 1. Combination of sporadic and chronic breakdowns 2. BM >PM 3. Significant breakdown losses 4. Autonomous operator maintenance not organized 5. Unstable life spans Equipment weaknesses are unrecognized
1. Sporadic breakdowns 2. PM≈BM 3. Breakdown losses still significant 4. Autonomous maintenance being organized 5. Parts life spans estimated 6. Equipment weaknesses well acknowledged 7. MI (maintainability improvement) applied on the above points
1. Time based maintenance established 2. PM>BM 3. Breakdown losses less than 1% 4. Autonomous maintenance activities well- established 5. Parts life spans lengthened
1. Condition-based maintenance established 2. PM 3. Breakdown losses 0.1%-0 4. Autonomous maintenance activities stable and refined 5. Parts life spans predicted 6. Reliable and maintainable design developed
2. Setup and adjustment losses
1. No control- laissez
faire production by operators 2. Work procedures disorganized and setup/adjustment time varies Widely
1. Work procedures organized (e.g. internal and external setup distinguished) 2. Setup/adjustment time unstable 3. Problems to be improved identified
1. Moving internal setup operations into external setup time 2. Adjustment mechanisms identified and well understood
1. Setup time less than 10 minutes 2. Immediate product changeover by eliminating adjustments
3. Speed losses 1. Equipment specifications not well understood 2. No speed standards (by product and machinery)
1. Problems related to speed losses analyzed -Mechanical problems -Quality problems 2. Tentative speed standards set and maintained by product 3. Speed vary slightly
1. Necessary improvements being implemented 2. -Speed is set by the product -Cause and effect relationship predicted between the problem and the precision of the equipment , jigs, and tools 3. Small speed losses
1. Operation speed increased to design speed or beyond through equipment improvements 2. Speed standard set and maintained by product (final standards) 3. Zero speed losses
4. Idling and minor stoppage losses
1. Losses from minor stoppages unrecognized 2. Unstable operating conditions due to fluctuation in frequency and location of losses
1. Minor stoppage losses analyzed quantitatively -Frequency and location of occurrence -Volume lost 2. Losses categorized and outbreak mechanism analyzed; preventive measures taken on trial-and-error basis
1. All causes of minor stoppages analyzed, all solutions implemented, conditions favorable
1. Zero minor stoppages ( unmanned operation possible)
5. Quality defect and rework losses (startup losses included)
1. Chronic quality problems are neglected 2. Many successful remedial actions have been taken
1. Chronic quality problems quantified -Details of defect, frequency -Volume lost 2. Losses categorized and outbreak mechanism explained; preventive measures taken on trial and error basis
1. All causes of chronic quality defects analyzed, all solutions implemented, conditions favorable 2. Automatic in-process detection off defects under study
1. Quality losses=0.1%-0
Table 24: OEE assessment of surface treatment processes inspected, levels are marked in red

Yaniv Ben Or – Measuring For Improvement
89
� Breakdown losses – MaskPad: level 2, TiUnite: level 3.
The level which describes breakdown losses best for MaskPad cells is level 2 while level 3 is appropriate for TiUnite cells. The breakdowns are still significant. There are defined autonomous maintenance activities performed daily and weekly by operators that include cleaning and maintaining the cells, and there are periodic maintenance performed by the service unit. These activities however, are more sufficient for TiUnite cells than MaskPad, based on the findings. However, since the number of cells is small. There is a need to follow the cells longer time to draw confident conclusions. Equipment weaknesses are well acknowledged to service personnel and engineers, based on experience. Breakdown maintenance activities are time consuming and reduce valuable availability time of machines. There are no statistical methods used to study failure distributions that lead to breakdowns. Failure data is collected, but cannot be tracked easily and therefore is not useful. The underlying failure mechanisms are not being analyzed systematically.
� Setup and adjustments losses – level 4
Setups are simple and not time consuming and can be performed in single minutes. Although losses for each set up are minor, setups can be further optimized in order to minimize time by, for example, moving internal setup activities to be externally performed in advance.
� Speed losses – level 2
There are speed losses due to inefficiencies that were found in both the TiUnite and MaskPad cells as described earlier. These losses are hidden and chronic, and therefore do not receive much attention. Additionally, speed of TiUnite processing using nitrogen varies and is depended on the time required for the nitrogen to reach the cells.
� Idling and minor stoppage losses – level 2
There is a significant problem of minor stoppage related to different alarms. Some of the alarms are false and chronic. Unmanned operation is impossible due to this reason.
� Quality defect and rework losses – level 3
There is a well developed quality assurance and control system integrated in operations. There is an automatic in process detection of defects as cells perform numerical control and the level of precision is high. There is, in addition, manual in process detection of defects to ensure precision avoid unnecessary rejections. There are controls of measurement instruments by the quality unit. Conditions are mostly favorable. However, negligible losses were registered for the MaskPad cells while more significant losses that cause the rejection of items occur in TiUnite cells’ processes.

Yaniv Ben Or – Measuring For Improvement
90
6.3 Packaging
6.3.1 Sleeve machine
In packaging processes only a single Sleeve machine was examined, a general analysis was conducted.
The analysis starts with categorizing the various causes for machine downtime in accordance to their value contribution as shown in table 25:
Downtime cause Value
adding
Non-value
adding
Wastage
Machine setup x Material load during batch x Writing failure x Sleeve feeding failure x Stopper feeding failure x Other machine failure x Alarms x Wait for a technician x Wait for work x Cleaning x Operator unavailable x Sleeve jammed x
Table 25: Value analysis of unplanned downtime causes
Prioritizing downtime causes for improvement An analysis based on FMEA principles was conducted for the data collected for the Sleeve machine as earlier analysis was carried out. Table 26 shows the details of the analysis followed by figure 36 describing the rank in a bar chart.
Stop cause N (P) Mean (S) RPN
Machine setup 8 18 (2) 16
Material load during batch 4 3 (1) 12
Sleeve feeding failure 8 25 (3) 24
Stopper feeding failure 7 16 (2) 14
Other machine failure 4 5 (1) 4
Alarms 3 3 (1) 3
Wait for work 7 187 (10) 70
Cleaning 6 9 (1) 6
Operator unavailable 3 31 (3) 9
Sleeve jammed 4 2 (1) 4
Table 26: FMEA based analysis of stop causes for the Sleeve machine

Yaniv Ben Or – Measuring For Improvement
91
Figure 36: Bar chart describing risk priority number of each downtime cause
As shown in the chart, the main cause for downtime losses is waiting time for work by far in similarity to surface treatment equipment and MaskPad in particular. Machine operation failures are chronic as they occur frequently a large number of times each shift and do not allow unmanned operation. These major downtime causes should be highly prioritized in improvement efforts.
6.4 Process orientation and maturity A process audit was conducted in order to study and evaluate production sub-processes for identification of problems and possibilities and to provide an insight of the progress level of development and process orientation. The information was gathered from observations and from interviews with the production manager, process managers, a process coordinator and Nobel Biocare’s intranet. At first, basic questions were asked as suggested by Ljungberg & Larsson (2001) and described in 3.4.2. The basic questions proved to be easy to answer when the dominating answer was “yes”. The organization has identified its core processes, the processes are mapped, and the organizational structure is suitable to focus on processes. There are appointed process owners, process managers and process coordinators. The measurement systems are process oriented and there are managers appointed to take responsibility of the measurements. There are common methods in use for the development of production sub-processes. However, similar methods are currently not in use in the supporting maintenance processes. These findings indicate that in general, the organization is managing process-based development activities. Following these results, there was a clear reason to continue with an in-depth examination. The second step of the audit was chosen to focus on issues that are linked to the goals of the study. The chosen subjects were therefore measurements and knowledge of process performance, understanding of a process perspective, forms of structure and responsibilities and systematicity in improvement work.

Yaniv Ben Or – Measuring For Improvement
92
A questionnaire was formed for this cause and is shown in appendix B. The answers to the questions were again mostly positive indicating on a high level of process orientation. The main production activities are identified, documented and there are manuals and production instructions for the use of operators available in a computer-based system. The production system is responsible for automatic interactions and information flows from sub-processes. Records are collected and saved. There is a well-developed quality assurance system that controls the inputs and outputs of the process and there are defined routines for controls of both inputs and outputs of the production process. There are well established routines that consider process environment. Data from processes is used for measurement of several Key Performance Indicators (KPI) including lead time follow, produced volumes, quality, productivity and reworks.
The plant has implemented ISO 9000 quality system and was certified in 1994. In addition, the plant has adopted the ISO 13485:2003 standard for requirements and regulatory of quality management systems for medical devices, and received certification in 2004. The production site has been audited by externals to examine the compliance of the quality system all along the production line for meeting specifications, and regarding the resulted quality of the products. However, the processes audit conducted in this thesis study indicated that while there is a high level of process orientation especially in quality assurance and the physical flows of material and produced items; the situation is somewhat different when other support and managerial processes are considered. The lower levels of process orientation in the approach to analyze setups and in maintenance processes that were named before are examples of this. The adoption of a process perspective and focus among managers varies. An explanation to the gap between process focus in quality assurance and physical flows and other support and managerial processes can be that historically, the driving forces to adoption of a process focus have been external requirements from authorities and that external competence was involved. For example, external know-how was involved in designing the production system, layout and flows.
As been reviewed in 3.4.1, the Capability Maturity Model (CMM) was originally designed to assist the evaluation of software producers and was modified to fit other industries and contexts. Adopting the CMM, in order to describe the level of production processes maturity level, it is suitable to modify the model to adapt for the manufacturing context of the plant. The five levels of maturity were therefore redefined as followed:
� Initial process – the production processes at this level are characterized as confused. Core processes are not identified and not mapped. Production layout is not process oriented and the process has not been designed on an end to end basis. There is only a general or partial documentation of the process. Different local IT systems support the process. Managers follow basic cost and quality metrics and are skilled in problem solving.
� Repeatable process – at this level, earlier improvements are documented and there are established disciplines allowing managers to learn from the experiences of earlier improvement projects. There are informal process owners responsible to improve the process. The process is measured by several indicators, allowing managers to compare performance to customer needs and perform a root cause analysis of errors. Improvement results have been measured.

Yaniv Ben Or – Measuring For Improvement
93
� Defined process – the process has been redesigned from end to end to optimize its performance. The process is documented and mapped entirely. The inputs and outputs of the process are fitted and agreed upon. There are official process owners appointed. The process has an IT system based on functional components to support it. The process is measured from end to end, allowing managers to compare performance to benchmarks. Managers are skilled in teamwork.
� Managed process – at this level of maturity, the process has been designed to fit other processes of the organization. Product quality is derived from quantifiable targets and measurements that are well-understood and controlled. Measurement methods are stable and well defined. Process is managed based on statistical methods and metrics that are derived from the strategic goals of the organization. The IT system is integrated and designed with the process and other IT systems of the organization. Managers are skilled at business decision making. Managers communicate on a daily basis the process’s metrics for awareness and motivation.
� Optimizing process – at this level of maturity, process improvements are based on quantitative feedback, from innovative ideas and technologies. Improvements are natural part of the continuous work. The process owner is a member of the organization’s most senior decision making body. The process is measured continuously while metrics include indicators of inputs, outputs, operation, resources and effectiveness. Managers are skilled at change management and change implementation, they are aware of signs indicating that the process should change and propose improvements of the process.
In accordance to this modified model suggested, the level of optimizing process describes best the improvement work that consider the quality and performance of products. However, the level that describes the entire production processes, including work procedures of production and machine setup, measurement methods and supportive management is the managed process level since the high level is not uniform with considerations of overall aspects.
Figure 37: An illustration of the overall Capability Maturity Model level of the plant’s
production processes.

Yaniv Ben Or – Measuring For Improvement
94
Notice that the level that best describe the supporting maintenance processes is lower, level 2 seems to be most appropriate.
6.5 Implementation and credibility assessment The author of this thesis would like to note that the study period at the plant has left a good overall impression of a well organized and structured work place with an open atmosphere and that an excellent corporation was experienced with involved staff of all levels.
Carrying out the study at the plant has been allowing the author to perform a large number of interviews and observations and provided an extensive access to vital information that has contributed greatly to the quality and accuracy of the study and to the experience of the author.
Considering the scope of the study and the predetermined time frame, the methods implemented and the organization of time for the project has proven to be efficient and fruitful. The possibility to conduct continuous interviews and discussions and the open atmosphere at the plant has strengthened the reliability of the methods and findings as the author was able to gather necessary information when needed and to validate assumptions.
Naturally, the participation of the author at the plant while conducting the study has created social connections that potentially could influent the opinions and assessments of the author. However, awareness to the risks embedded in a participating roll has contributed the author to maintain an objective perspective and to express the findings independent and concrete.
To assure the accuracy of the measurements, paper forms that were filled only partly or incorrectly were excluded from the calculations.
Specific issues regarding the secondary data and OEE measurements might be beneficial to consider in order to understand the findings better and to optimize in case a replicated study is conducted or continuous measurements are implemented at the plant. The issues are described in the next listed points.
6.5.1 OEE measurements
� Data for the calculation of equipment effectiveness was collected under a limited time period. Although a large percentage of the equipment were inspected of each type, fluctuations in production might cause variations in production time since the frequencies and lengths of procedures that cause time loss are highly depended on the product mix and variations of produced items. The results therefore, are ought to be considered as a snapshot measurement for that time of inspection. However, when a large numbers of machines producing a variety of items daily were inspected under a week or more each, and since process managers confirmed that the mix of product in the time of measurement could be regarded as typical, the results can be seen as representative for the period of time in which the study was conducted.
� Regarding operators time breaks during shifts, time was not excluded from shifts since operators leave machines operating as they go to their breaks. Not all machining operators take breaks simultaneously, allowing operators that are in place to react to stops. This assumption however, that machines operate during breaks, has limited accuracy since machines can become inactive during breaks. Even when there are other operators at place, it is possible that operators do not react immediately when a machine of another

Yaniv Ben Or – Measuring For Improvement
95
operator has stopped, and might not perform complicated tasks on a machine that another operator is responsible for. This might cause lower performance rates obtaining in calculations since time for breaks was not excluded.
� The real proportions of machine inactivity due to breakdowns are not captured in the study since the study considered machines that were planned for production and had an operator during the time inspected. Machines that had severe problems and were inactive during entire shifts, had no operator and their unavailability was regarded therefore as planned downtime.
� The accuracy of data collected by operators is highly depended on the engagement and evaluations of the operators themselves. This can be expressed particularly in relation to the resulted division to performance and availability rates. While the number of defect items can be better controlled, there is no easy way to guarantee that all machine stops were actually registered. However, this is not affecting the resulted OEE values since the operating time (load time – down time) has no influence on the OEE values as shown in the equation below:
��� =>?@A:BC 9:;< − A?EB9:;<
>?@A:BC 9:;<×
9ℎ<?H<9:I@> IJI>< 9:;< × KH?I<LL<A @;?MB9
?K<H@9:BC 9:;<×
KH?I<LL<A @;?MB9 − A<N<I9 @;?MB9
KH?I<LL<A @;?MB9
� The used method to measure OEE for Deco 10 machines registered all machine stop time. Regarding setup and adjustments, only the time of machine inactivity during adjustments was registered. Cycle times for the machines are in accordance to machine operation under production of items. The cycle times are dictated by the machines’ computer and are precise. However, during adjustments, the machines are frequently operated to produce single items instead of two items simultaneously. Furthermore, during adjustments some items are dropped into the oil pool and not counted as rejected items. These reasons might cause the number of rejected items and speed losses not to be accurate which is expressed in exaggerated performance losses to compensate the availability and quality losses while the OEE values remain accurate. To avoid this inaccuracy in future measurements, all adjustment time should be regarded as availability losses.
6.5.2 Secondary data
The study relays on literature and databases that were excellently provided by the services of the university’s library. However, while most important literature is available and most scientific publications can be accessed; there might have been some sources that were not accessible and therefore absent from the foundation of the theoretical frame of the study.

Yaniv Ben Or – Measuring For Improvement
96
7. Discussion
The study was conducted in light of the challenges that Nobel Biocare’s production plant in Karlskoga is currently facing. The move in the direction of JIT manufacturing has brought problems in operations to the surface and made inefficiencies more visible. Aiming to reduce disturbances, gathering knowledge on effectiveness rates and identifying improvement potential becomes essential.
A good starting point to approach these issues and to base a good foundation for the study was clarifying the importance and the need of process measurement. A literature review was carried out with a focus on presenting the process concept as explained in process theory. Process perspective, process management and the linkage between process measurement and process improvement were therefore enlightened in 3.1. The review has shown that measurement of processes is closely related to improvement management as it constitutes a directive instrument for managers to base strategic decisions on, to understand performance, identify problems and prepare for action. It focuses the attention of management on important things to improve, it creates a common language and it inspires and motivates for improvement. It is the motor driving for continuous change.
Once the importance of process measurement and process perspective was clarified, implementing measurements on production processes was necessary for identifying effectiveness levels and detecting problems. Overall Equipment Effectiveness (OEE) metrics were used for this cause. OEE are reliable metrics for performance measurement that consider availability, performance and quality. An introduction to OEE and explanation of the metrics are presented in detail in 3.3. The metrics are a measurement method to discover improvement potential and they are a tool to achieve improvement used in Total Productive Maintenance (TPM) improvement efforts. TPM is the subject of 3.2. OEE measurements were implemented during the study on different equipment used for the production processes. The production process as a whole was divided into sub processes that were in focus during the study. The outcomes are described in detail in chapter 5. The equipment which was inspected for the machining sub process was Deco 10 and Willemin CNC/milling machines. In surface treatment, TiUnite and MaskPad cells were examined while in packaging the Sleeve machine was studied.
The measurement of production processes effectiveness using OEE metrics has been confirmed and demonstrated in the study as a powerful method for identification of production losses. As many of the authors that are mentioned in 3.3 state, it successfully contributes to gain an overall view of losses related to equipment operation. As experienced in this study, it is important to note that the OEE measurements give an indication of low efficiencies and point out where there are problems. Since it measures the equipment operation processes and not only the equipment itself, it can indicate on problems that are related to work methods and staff as well. Operator problems are identified easily when different operators of the same equipment obtain varying OEE values frequently. It is important to mention that low OEE values can be related to competency problem of the operators, but this is not necessarily the case. If an operator requires more time to perform activities such as setups, it can be expressed in lower OEE values. However, it can also indicate that the operator is extremely meticulous when performing inspections of items which results in

Yaniv Ben Or – Measuring For Improvement
97
larger amounts of rejected items. Thus, the benefit of the metrics in such cases is the identification of problems.
Another benefit that was experienced during the study is that by filling the paper form, operators become more aware of downtime losses and their causes. Though, more accurate measurements can be obtained by registering machine stops by signals directly from the machines.
The measurements demonstrated in this study aimed primarily to identify inefficiency related to equipment. OEE metrics however, do not provide an indication of the total capacity usage rate of resources since planned downtime is excluded. Planned downtime can be included in the calculation of OEE capacity usage rate by simply adding the planned downtime to the loading time at the availability denominator as shown below:
O =>?@A:BC 9:;< − MBK>@BB<A A?EB9:;<
>?@A:BC 9:;< + K>@BB<A A?EB9:;<×
9ℎ<?H<9:I@> IJI>< 9:;< × KH?I<LL<A @;?MB9
?K<H@9:BC 9:;<×
KH?I<LL<A @;?MB9 − A<N<I9 @;?MB9
KH?I<LL<A @;?MB9
According to studies concerning OEE metrics such as Dal et al. (2000), the metrics are beneficial in particular as an indicator of improvement. This advantage though, was not tested in the study, since examining it entails a longitudinal research. Thus, it can be interesting in particular, relating to the ongoing improvement initiatives at the plant, to measure effectiveness before and after the implementation of improvements.
Mean OEE value obtained for Deco 10 machines and machine-cells was about 68% while a large variation was found between the different machines. OEE values as high as around 89% which are defined by Nakajima (1989) and others as world class rates, were recorded for the most effective machine while meager values as 43% were calculated for the least effective Deco 10 machine. A similar average value of 68% was obtained for Willemin machines. The reasons for availability losses of the machines are identified in 5.1, as an analysis of the major down time causes is provided in 6.1. Clearly, the most time consuming activities that causes machine downtime for both types of equipment are setups. Setups according to the finding, causes time losses of around 35 minutes on average of each 8 hour shift. Notice that this value does not include first item inspections during adjustments. Other major downtime causes include waiting time for machines to receive a kitted container, machine breakdowns and item inspections. The variations in effectiveness levels between the machines depend greatly on the frequency and type of setups. Machines that usually produce similar items and require simple setups and at the same time are usually assigned to produce larger batches, of 240 items, are characterized by high effectiveness levels while machines that are frequently configured and their setups are complicated, show meager levels. It is worth to notice at this point that the linkage between the different downtime causes needs to be understood. There are other downtime causes which are closely related to the frequency of new job assignment, that occur usually before or after setups. These include waiting time for a container, inspections, and adjustments. Additionally, downtime was registered while operators were setting up other machines, which is also related to the frequency of new orders and the complexity of setups. Finally, the issue of flexibility is vital for avoiding setups and it is important to notice that machine breakdowns, engineering activities etc reduce flexibility and therefore more complicated setups are required due to the smaller number of available machines.

Yaniv Ben Or – Measuring For Improvement
98
For surface treatment and packaging processes, three types of equipment were inspected: TiUnite and MaskPad cells and a Sleeve machine. The results are presented in 5.2-5.3. The OEE average value for TiUnite cells was 59% and there were only small variations between the cells. The main cause for cells inactivity was the absence of work. The reason for this is both unsynchronized flow of jobs to cells and fluctuations in demand: absence of orders in respect to planned production hours. Other major reasons for cells inactivity were unavailable operators and configuring the cells for new items. Regarding MaskPad cells, the obtained average OEE value was 46% and here, as well, only small variations between the cells were noted. Similarly to the results of TiUnite cells, inactivity due to a wait for work was the major cause of cell inactivity. However, this cause for the MaskPad cells deviate greatly as the major downtime cause in respect to the other causes greatly affected the resulted OEE value. Detailed analysis for both TiUnite and MaskPad cells can be found in 6.2. The Sleeve machine was generally analyzed in 6.3.
The analysis indicates what improvement efforts should focus on at this point of time. Improvement efforts for the machining sub-process should focus primarily on activities that reduce setup times and even more important, on finding ways to eliminate or avoid unnecessary setups, keeping in mind that setups are related to additional losses, such as adjustment time and adjustment items. Furthermore, the other highly ranked causes should be considered as well. On the other hand, losses for surface treatment cells were caused by absence of work and unavailability of operators. The interface of these causes is related to the optimization of operator assignment to equipment in accordance to the flow of orders, which is the challenge that production managers face. The analysis of the different equipment inspected is followed by recommendations that can be found in chapter 6 as well.
The equipment inspected showed less effective results when producing batches of smaller amounts of items. Concerning the machining sub process, more losses were related to smaller batches due to frequent setups, adjustments time, waiting time for a kitted container, a larger number of scrapped items and more time dedicated for inspections. Deco 10 robot-cells are particularly sensitive to small batch production as they result in a deliberate inactivation of one of the machines. The average cycle time for an item processed in MakPad cells and particularly in TiUnite cells are slower for smaller batches. Furthermore, configurations of the cells for item change over are also time-consuming.
In order to obtain an image of the weaknesses and strengths of production operations, OEE assessments were made as process audits and the CMM model were applied. The outcomes indicate on areas that can be improved. The progress of improvement work in consideration to different aspects of production is not uniform. Process audits confirmed a high level of process orientation in the physical processes of manufacturing, treating and packing the items and in the fields of quality assurance and product reliability in particular. Regarding process measurements, there are well established methods to measure almost all aspects of the production processes.

Yaniv Ben Or – Measuring For Improvement
99
Figure 38: Measuring a process, based on Ljungberg & Larsson (2001)
However, the measurement of effectiveness levels is missing and therefore, implementation of OEE measurement on regular basis seems to be the appropriate development to cover all process features. An additional measurement that is ought to be improved is breakdowns information.
A rather weak process perspective was found in setup activities and maintenance management methods. The overall level of maturity of production processes was evaluated as level 4: managed process. OEE assessments that were conducted found setups and breakdowns to be weaknesses of the machining processes while speed losses, minor stoppage losses, and breakdowns were found to be the weaknesses of surface treatment and packaging processes. These findings demonstrate the close relation between process orientation and maturity to operation effectiveness. To the opinion of the author, the weaknesses and strengths of the operations at the plant are closely related to the learning orientation in particular. In fields of weaknesses, such as maintenance and setup activities, usually frail single loop learning can be found, while in fields of excellence such as quality assurance, we find a well functioning double loop orientation. In fields of weakness, the solid establishment of single loop learning is necessary for improvement and development of a double loop learning orientation should be a future goal.
Morgan (2006) explains the conditions for single loop learning orientation as followed:
� “Systems must have the capacity to sense, monitor and scan significant aspects of their environment.”
� “They must be able to relate this information to the operating norms that guide system
behavior.”
� “They must be able to detect significant deviations from these norms.”
� “They must be able to initiate corrective action discrepancies are detected”
Fulfilling all these conditions creates a continuous process of information exchange between a system and its environment. This allows the system to monitor changes and initiate responses and creates intelligent, self regulating operations. These learning abilities however, are limited to the operation norms and standards guiding it. Once the action defined by those norms is not suitable for dealing with the changes developing, the system breaks down and initiates a process of negative feedback, maintaining an unsuitable pattern of behavior. Double loop learning on the other hand, is the ability to self questioning by systems that are able to learn to learn and self organize.

Yaniv Ben Or – Measuring For Improvement
100
Based on the finding of the study, current improvement efforts should strive for development of learning abilities in fields of weaknesses since they embed more potential for improvement. Improvement of machining should focus on setup and adjustment improvement activities, minimizing unnecessary wait time for kitted containers and analysis of breakdowns and maintenance development. In field of strengths such as quality assurance, the potential for improvement is rather limited and focus should be on optimizing activities. The focus in the inspected surface treatment processes should be on optimizing assignment of staff to equipment in accordance to the flow of orders and eliminating unnecessary inefficiencies as false alarms. In addition, specific recommendations were given such as enlarge amount of items on cassettes of TiUnite cells, nitrogen tank for TiUnite processes and MaskPad inefficient cycle time that should be considered. Finally, the production system (EBR) should be optimized and better exploited. The possibility to change the prioritizing schedule along the production line from the current FIFO to prioritize in accordance to order delivery dates should be examined.
In consideration to all the above named issues and the experience of the author during the study, the inefficiencies identified were usually related to the size of batches and frequencies of changeovers as the plant was designed for mass production. These inefficiencies are additional production costs that should be compared to the benefits gained from lowering inventory levels, in order to find the optimal size of batches and inventory.
Lastly, there is no doubt, in the opinion of the writer of this thesis, that the plant is moving in the right direction. There is a great deal of awareness and engagement of both management and staff for development. The study was formed to provide valuable insights that would help managers planning the improvement work in both the short and long term and hopefully would be found useful.
Take measures and keep on the good work!

Yaniv Ben Or – Measuring For Improvement
101
8. Conclusions
In this study, the effectiveness of production operations at Nobel Biocare’s production plant in Karlskoga were measured using OEE metrics while assessments of the progress of operations improvement in terms of TPM and equipment effectiveness losses were carried out. Furthermore, the maturity levels of production processes were evaluated as well as process orientation and focus were considered.
The study finds a variation of effectiveness levels in the machining processes of the Deco 10 CNC machines. The levels vary between 43% and 89%, when the average level was 68%. The main reasons for availability losses were primarily related to the frequency of new job assignments to machines and the complexity level of setups. Machines that produce smaller batches required frequently time consuming setups, adjustments, inspections and suffered more often from unnecessary waiting time to receive containers of new jobs. Machining processes using Willemin machines were found to have similar average value of effectiveness. However, the results did not vary much between the different Willemin machines inspected. The major causes for availability losses were generally similar to Deco 10 findings, with the exception of an additional cause of adjustments in the middle of batch production. Lower levels of improvement work progress in equipment effectiveness for machining were assessed primarily in setup and adjustment losses and in breakdown losses. In addition, significant losses due to unnecessary wait time for new jobs were found. There is therefore a greater potential for development in these fields and they should be in focus for current improvement work.
Findings of measurements of surface treatment equipment using TiUnite cells indicated an average OEE value of 59%. Major availability downtime causes were waiting time for work, operators unavailable and changeovers. There were also considerable quality losses of 5% registered. The results for MaskPad cells showed an average OEE value of 46%. The primer downtime cause was waiting time for work. Quality losses for MaskPad cells however, were found to be minor. The Sleeve packaging machine showed average effectiveness of 47%. The major downtime cause was, here as well, absence of work. However, there were some chronic machine failures detected which cause considerable downtime losses as well. OEE assessments of the inspected surface treatment processes found speed losses and minor stoppage losses to be fields in which improvement work is less developed for both cell types and the Sleeve machine. Breakdown losses development was also assessed to have a lower level for the MaskPad cells. The greater potential for improvement is embedded in these issues. Future goals however, should be focused on reaching the next level in accordance to the OEE assessment model.
The study has shown that all inspected equipment losses in both machining and surface treatment are related to the size of batches. Frequent activities such as setups and the usage of cell production are main causes for inefficiency of machining equipment while the design of cells in surface treatment requires longer cycle times for small batch production.
The overall maturity level and orientation was found to be high particularly in the fields of quality and product reliability assurance, however lower levels were identified in maintenance and setup improvement work. The study finds a linkage between lower effectiveness levels; lower OEE development levels found in assessments and lower levels of process maturity and

Yaniv Ben Or – Measuring For Improvement
102
orientation, suggesting that the fields of weakness commonly suffer from lack of learning orientation that is ought to be developed.

Yaniv Ben Or – Measuring For Improvement
103
9. Final words
This study focuses on challenges that a manufacturing plant faces due to a move of inventory reduction and small batch production. The research suggests a multi dimensional approach of production losses detection using OEE metrics and in parallel conducting OEE assessments and process maturity and orientation assessments using the Capability Maturity Model and process audits, for the identification of current effectiveness levels and improvement potential. It can be interesting in particular for companies taking a similar move or considering it. The study demonstrates how quantitative measurements of effectiveness can be combined with analysis techniques and assessment models in order to draw a broad image of the causes for effectiveness losses and the potential for improvement.

Yaniv Ben Or – Measuring For Improvement
104
� References
Amaratunga, D., Sarshar, M. & Baldry D. (2002), Process improvement in facilities management: the SPICE approach, Business Process Management, [online], 8 (4), 318-337.
Bamber, C.J., Castka, P., Sharp, J.M. & Motara, Y. (2003), Cross-functional team working for overall equipment effectiveness (OEE). Journal of Quality in Maintenance, [online], 9 (3), 223-238. Bergman, B. & Klefsjö, B. (2007), Kvalitet från behov till användning. Lund: Studentlitteratur.
Brah, S.A. & Chong, W.K. (2004), Relationship between total productive maintenance and performance, International journal of production research, [online], 42 (12), 2383-2401.
Britsman C., Å. Lönnqvist & S. O. Ottsson (1993), Handbok I FMEA Failure Mode and Effect
Analysis, Uppsala: Förlags AB Industrylitteratur.
Bryman, A. & Bell, E. (2007), Business research methods – 2nd
edition, NewYork: Oxford university press.
Cooper, D. R. & Emory, C. W. (1995), Business research methods – 5th edition, USA: Irwin.
Dal, B., Tugwell, P. & Greatbanks, R. (2000), Overall equipment effectiveness as a measure of operational improvement: A practical analysis, International Journal of Operations and
Production Management, [online], 20 (12), 1488-1505. Darmer, P. & Freytag, P. V. (1995), Företagsekonomisk undersökningsmetodik, Lund: Studentlitteratur. De Ron, A. J. & Rooda J.E. (2006), OEE and equipment effectiveness: an evaluation, International Journal of Production Research, [online], 44 (23), 4987-5003.
Fleischer, J., Weismann, U. and Niggeschmidt, S.(2006), Calculation and optimisation model for costs and effects of availability relevant service elements, Proceedings of LCE2006. Garza-Reyes, J.A., Eldridge, S., Barber, K.D., Archer, E. and Peacock, T. (2008), Overall resource effectiveness (ORE) – an improved approach for the measure of manufacturing effectiveness and support for decision-making, Proceedings of the 18th International Conference
on Flexible Automation and Intelligent Manufacturing (FAIM), Skövde, Sweden, 30 June-2 July. Garza-Reyes, J. A., Eldridge S., Barber, K. D. & Soriano-Meyer, H. (2010), Overall equipment effectiveness (OEE) and process capability (PC) measures: A relationship analysis, International
Journal of Quality & Reliability Management, [online], 27 (1), 48-62. Hinks, J. (1998), A conceptual model for the interrelationship between information technology and facilities management process capability. MCB University Press, [online], 16 (9/10), 233-245.
Yaniv Ben Or – Measuring For Improvement
105
Huang, S. H., Dismukes, J. P., Su, J. S. Q., Razzak, M. A., Bodhale, R. & Robinson, D. E. (2003), Manufacturing productivity improvement using effectiveness metrics and simulation analysis, International journal of production research, [online], 41 (3), 513-527. Huang, S. H. & Muthiah K. M. N. (2007), Overall throughput effectiveness (OTE) metric for factory-level performance monitoring and bottleneck detection, International Journal of Production Research, [online], 45 (20), 4753-4769. Klefjsö, B., Bergqiust B. & Garvare R. (2008), Quality management and business excellence, customers and stakeholders – do we agree on what we are talking about, and does it matter?, The
TQM journal, [online], 20 (2), 120-129.
Lockamy, A. & McCormack K. (2004), The development of a supply chain management process maturity model using the concepts of business process orientation, Supply Chain Management:
An International Journal, [online], 9 (4), 272-278.
Ljungberg, A. (1998), Measurement Systems and process Orientation with focus on the order process, Lund: Lund University. Ljungberg, A. (2002), Process Measurement, International Journal of Physical Distribution and
Logistics Management, [online], 32 (4), 254-272. Ljungberg, A. & Larsson, E. (2001), Processbaserad verksamhetsutveckling, Lund: Studentlitteratur.
Ljungberg, Ö. (2000), TPM Vägen till ständiga förbättringar, Lund: Studentlitteratur.
Morgan, G. (2006), Images of organization, USA: Sage publications Inc.
Muchiri, P. & Pintelon L. (2008), Performance measurement using overall equipment effectiveness (OEE): literature review and practical application discussion. International Journal of Production
Research, [online], 46 (13), 3517-3535.
Nachiappan, R.M. and Anantharam, N. (2006), Evaluation of overall line effectiveness (OLE) in a continuous product line manufacturing system, Journal of Manufacturing Technology
Management, [online], 17 (7), 987-1008.
Nakajima, S. (1989), TPM development program implementing Total Productive Maintenance, Cambridge MA: Productivity Press.
Nenadál, J. (2008), Process performance measurement in manufacturing organizations, International Journal of Productivity and Performance Management, [online], 57 (6), 460-467. Nobel Biocare intranet (2010). Nobel Biocare website (2010)a, Our company. [online] available: http://corporate.nobelbiocare.com/en/our-company/default.aspx?v=1 (2010-3-2).

Yaniv Ben Or – Measuring For Improvement
106
Nobel Biocare website (2010)b, Our company - company profile. [online] available: http://corporate.nobelbiocare.com/en/our-company/company-profile/default.aspx?v=1 (2010-4-1). Nobel Biocare website (2010)c, Corporate fact sheet. [online] available: http://corporate.nobelbiocare.com/en/our-company/default.aspx?v=1 (2010-4-1). Oechsner, R., Pfeffer, M., Pfitzner, L., Binder, H., Muller, E. and Vonderstrass, T. (2003), From overall equipment efficiency (OEE) to overall fab effectiveness (OFE), Material Science in
Semiconductor Processing, [online], 5 (4), 9-333. Robson, I. (2004), From process measurement to performance improvement, Business Process
Management Journal, [online], 10 (5), 510-521.
Russel, R. S. & Taylor B. W. (2003), Operations Management - 4th edition, New Jersey: Pearson
Education International.
Saunders, M., Lewis, P. & Thornhill, A. (2000), Research Methods for Business Students 2nd
edition, London: Pearson Education. Scott, D. and Pisa, R. (1998), Can overall factory effectiveness prolong Moore’s Law? Solid State
Technology, [online], 41 (3), 75-82. SEMI (2001), Standard for Definition and Measurement of Equipment Reliability, Availability
and Maintainability, SEMI E10-0701, (Semiconductor Equipment and Material International: Mt. View, CA). Sherwin, D. (2000), A review of overall models for maintenance management, Journal of Quality
in Maintenance Engineering, [online], 6 (3), 64-137. Singh, B. J. & Khanduja, D. (2010), Reflective Practice SMED: for quick changeovers in foundry SMEs, International Journal of Productivity and Performance Management, [online], 59 (1), 98-116. Slack, N., Chambers, S. & Johnston, R. (2010), Operations Management 6th edition, Essex, England: Pearson Education Limited.
Stamatis, D. H. (1995), Failure Mode and Effect Analysis FMEA from theory to action, Wisconsin: ASQC Quality Press.
Tay, K. M. & LIM, C. P. (2006), Fuzzy FMEA with a guided rules reduction system for prioritization of failures, International Journal of Quality & Reliability Management, [online], 23 (8), 1047-1066.
Tiku, S., Azarian, M. & Petch, M. (2007), Using a reliability capability maturity model to benchmark electronics companies. International Journal of Quality & Reliability Management, [online], 24 (5), 547-563.

Yaniv Ben Or – Measuring For Improvement
107
Tornos website 2010, Deco 7/10a, [online] available: http://www.tornos.com/prd-ds10a-e.html (2010-3-3).
Williams, P. (2008), A practical application of CMM to medical security capability. Information
Management & Computer Security, [online], 16 (1), 58-73.
Williamson, R.M. (2006), Using Overall Equipment Effectiveness: the Metric and the Measures, Strategic Work Systems: Columbus, OH. [Online] Available at: http://www.swspitcrew.com/articles/OEE 0206.pdf (2010-3-22). Winston, W. L. (1999), Operations research – applications and algorithms 3
rd edition, Belmont
California: ITP.
Zikmund, W. G. (1997), Business research methods 5th
edition, Florida: The Dryden Press.

Yaniv Ben Or – Measuring For Improvement
108
Appendix A: process map-machining
Goods IN Kga MCO KgaProductionSchedulingSchedule
Production
Raw materialon place
ProductionPreparation
done
Productionorder
Perform ProductionSet Up Titanium
Perform CNC-cellMachining and In-process
Inspection Titanium
Surface treatmentKga
PerformKitting
Machining inCNC-cell?
Yes N o
Perform Machining andIn-process Inspection
Titanium
Maintenance
Calibration
Machining Titanium Kga
PerformOrder Init
Rea dy forSurface
trea tment
R ework
Quality lev el
KPI
Lead time
KPI
Productiv ity
KPI
Volym
KPI
Repair (rej ect)
KPI
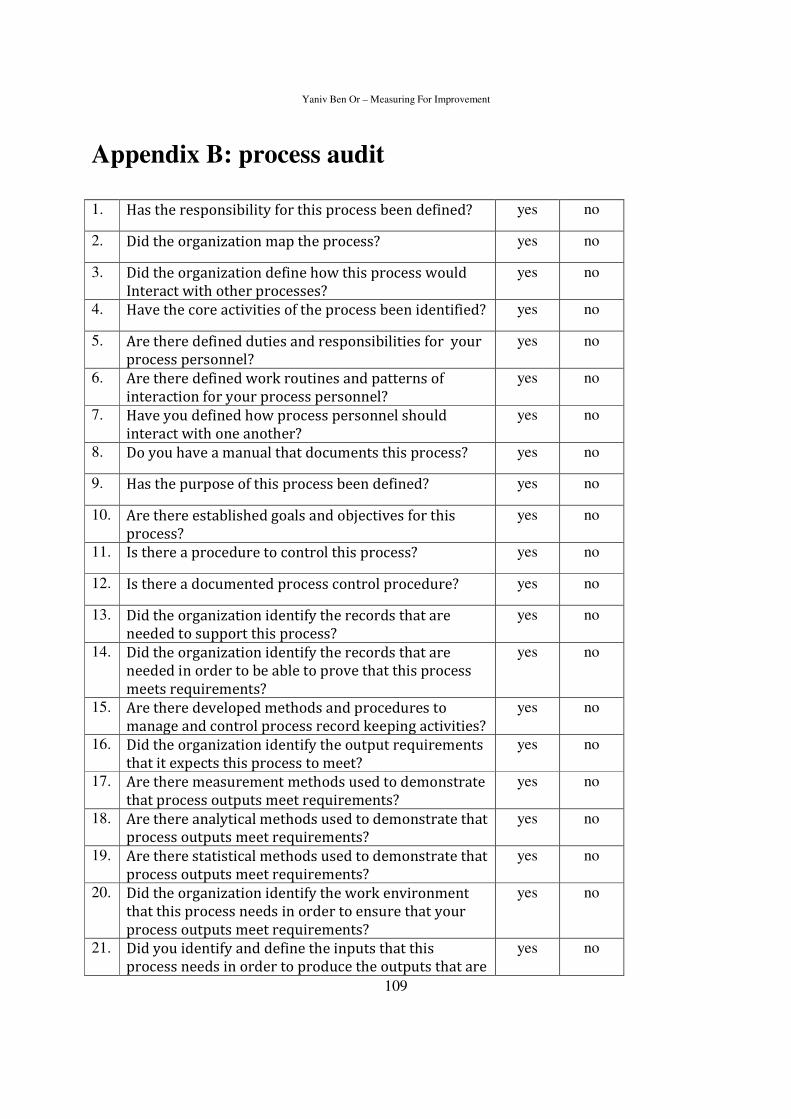
Yaniv Ben Or – Measuring For Improvement
109
Appendix B: process audit
1. Has the responsibility for this process been defined? yes no
2. Did the organization map the process? yes no
3. Did the organization define how this process would
Interact with other processes?
yes no
4. Have the core activities of the process been identified? yes no
5. Are there defined duties and responsibilities for your
process personnel?
yes no
6. Are there defined work routines and patterns of
interaction for your process personnel?
yes no
7. Have you defined how process personnel should
interact with one another?
yes no
8. Do you have a manual that documents this process? yes no
9. Has the purpose of this process been defined? yes no
10. Are there established goals and objectives for this
process?
yes no
11. Is there a procedure to control this process? yes no
12. Is there a documented process control procedure? yes no
13. Did the organization identify the records that are
needed to support this process?
yes no
14. Did the organization identify the records that are
needed in order to be able to prove that this process
meets requirements?
yes no
15. Are there developed methods and procedures to
manage and control process record keeping activities?
yes no
16. Did the organization identify the output requirements
that it expects this process to meet?
yes no
17. Are there measurement methods used to demonstrate
that process outputs meet requirements?
yes no
18. Are there analytical methods used to demonstrate that
process outputs meet requirements?
yes no
19. Are there statistical methods used to demonstrate that
process outputs meet requirements?
yes no
20. Did the organization identify the work environment
that this process needs in order to ensure that your
process outputs meet requirements?
yes no
21. Did you identify and define the inputs that this
process needs in order to produce the outputs that are
yes no

Yaniv Ben Or – Measuring For Improvement
110
required by your process customers? (Outputs from
this process are used by customers from other
processes.)
22. Do your input definitions consider requirements that
your process outputs must meet?
yes no
23. Are there specific requirements that process inputs
must meet?
yes no
24. Have you figured out what kind of information you
need to have about this process?
yes no
25. Have you figured out what kind of information you
need to have in order to be able to evaluate the
effectiveness of this process?
yes no
26. Do you have access to information you need to have in
order to be able to identify opportunities to improve
the effectiveness of this process?
yes no
27. Do you share process information with process
personnel?
yes no
28. Have you identified process monitoring needs and
requirements?
yes no
29. Are there defined methods to monitor the
effectiveness of this process?
yes no
30. Are there developed ways for monitoring process
outputs?
yes no
31. Are measurement methods in use to demonstrate that
this process meets requirements?
yes no
32. Are measurement methods in use to improve the
effectiveness of this process?
yes no
33. Can the used measurement methods prove that this
process is capable of achieving planned results?
yes no
34. Are statistical methods used to demonstrate that this
process meets requirements?
yes no
35. Are there statistical methods in use to improve the
effectiveness of this process?
yes no
36. Have you defined acceptable levels of competence for
your process personnel?
yes no
37. Are there well developed training and awareness
programs showing personnel how to achieve process
goals and objectives?
yes no
38. Do you have the resources needed to support this
process?
yes no
39. Do you have the resources needed to manage and
control this process?
yes no
40. Do you have the needed resources to monitor the
effectiveness of this process?
yes no

Yaniv Ben Or – Measuring For Improvement
111
41. Do you have the resources needed to measure the
effectiveness of this process?
yes no
42. Do you have the appropriate technology needed to
support the process?
yes no

Yaniv Ben Or – Measuring For Improvement
112
Appendix C: Deco 10 OEE

Yaniv Ben Or – Measuring For Improvement
113

Yaniv Ben Or – Measuring For Improvement
114
Appendix D: stop time division for Deco 10

Yaniv Ben Or – Measuring For Improvement
115

Yaniv Ben Or – Measuring For Improvement
116

Yaniv Ben Or – Measuring For Improvement
117
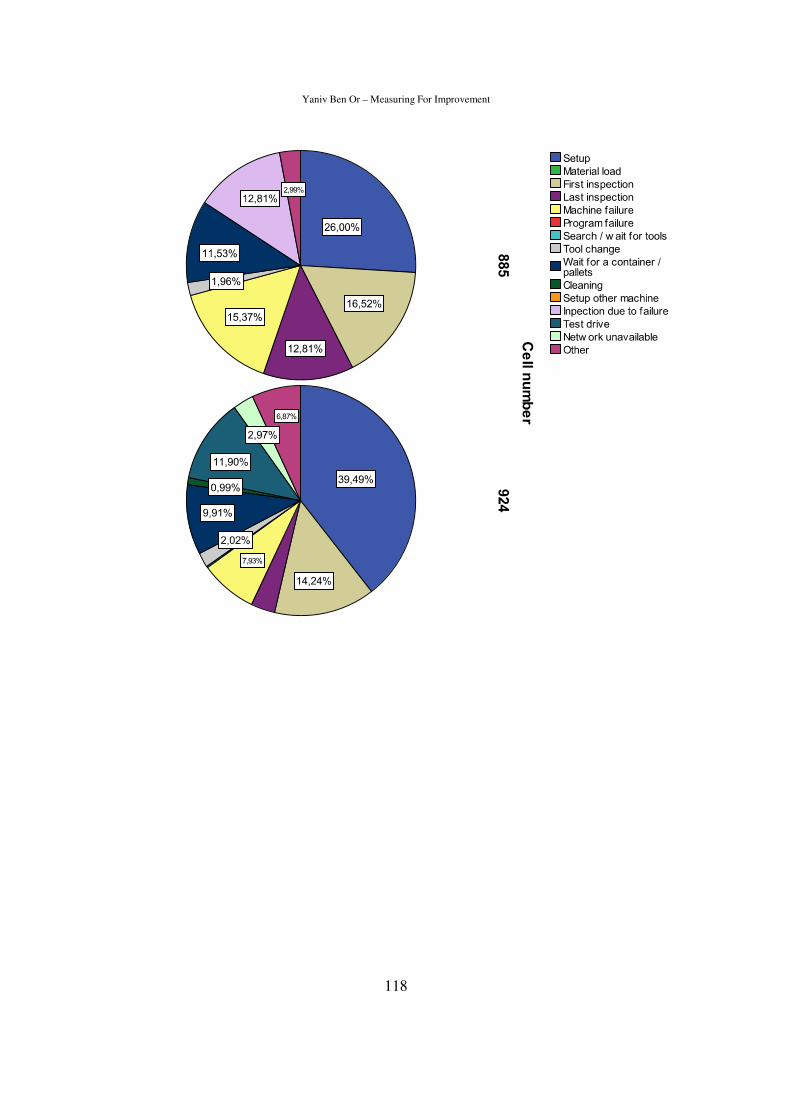
Yaniv Ben Or – Measuring For Improvement
118
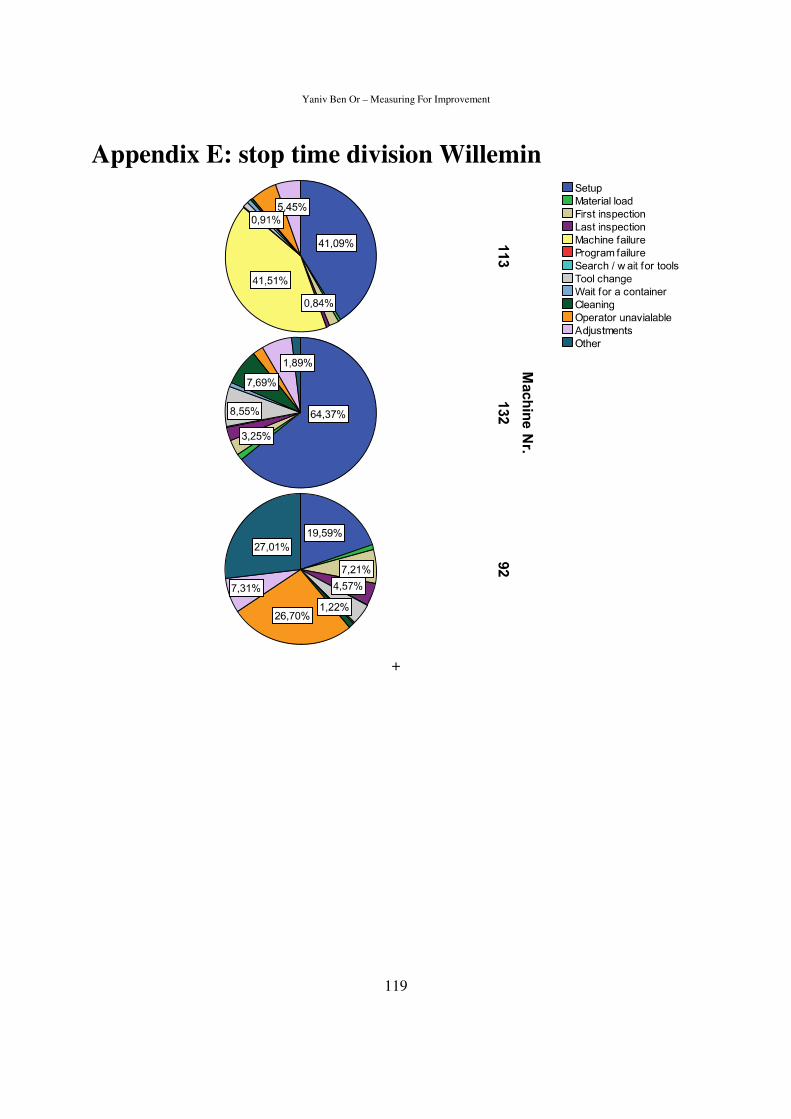
Yaniv Ben Or – Measuring For Improvement
119
Appendix E: stop time division Willemin
+
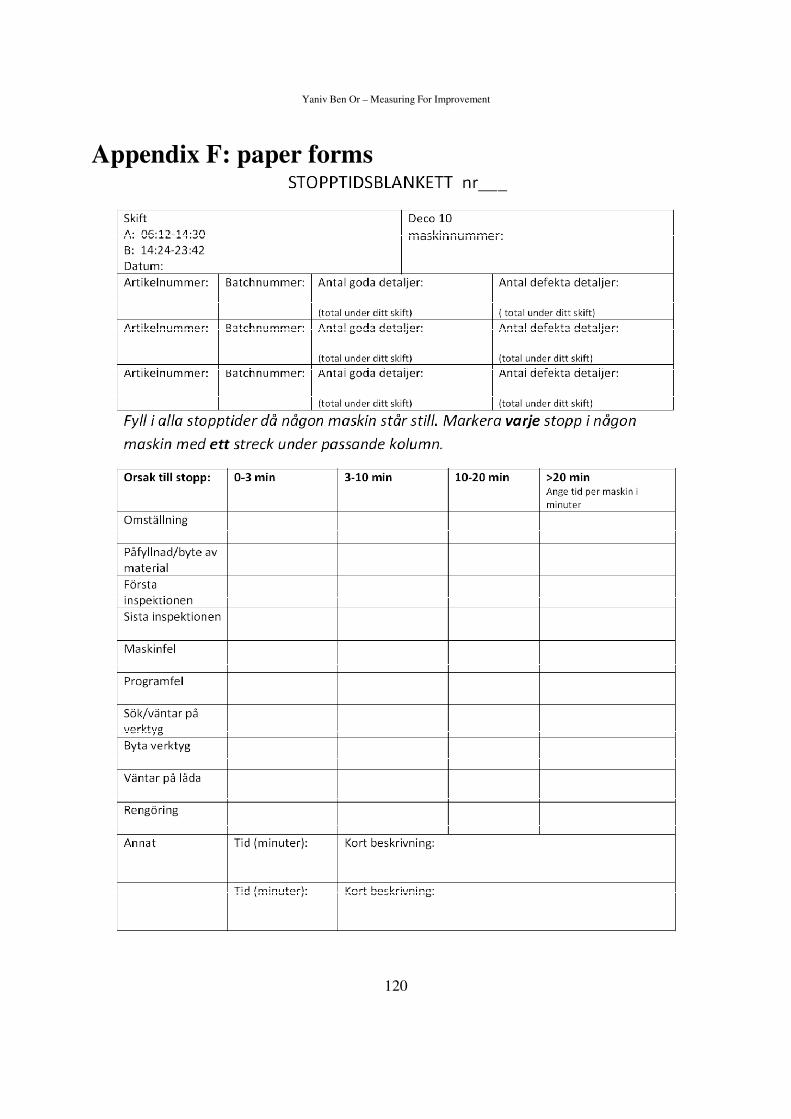
Yaniv Ben Or – Measuring For Improvement
120
Appendix F: paper forms

Yaniv Ben Or – Measuring For Improvement
121

Yaniv Ben Or – Measuring For Improvement
122

Yaniv Ben Or – Measuring For Improvement
123

Yaniv Ben Or – Measuring For Improvement
124

Yaniv Ben Or – Measuring For Improvement
125

Yaniv Ben Or – Measuring For Improvement
126

Yaniv Ben Or – Measuring For Improvement
127
Appendix G: OEE example