failure rate studies and design alternatives for …
TRANSCRIPT

University of Kentucky University of Kentucky
UKnowledge UKnowledge
University of Kentucky Master's Theses Graduate School
2004
FAILURE RATE STUDIES AND DESIGN ALTERNATIVES FOR FAILURE RATE STUDIES AND DESIGN ALTERNATIVES FOR
STANDUP FORKLIFT TRUCKS STANDUP FORKLIFT TRUCKS
Srinivas Jagarlamudi University of Kentucky, [email protected]
Right click to open a feedback form in a new tab to let us know how this document benefits you. Right click to open a feedback form in a new tab to let us know how this document benefits you.
Recommended Citation Recommended Citation Jagarlamudi, Srinivas, "FAILURE RATE STUDIES AND DESIGN ALTERNATIVES FOR STANDUP FORKLIFT TRUCKS" (2004). University of Kentucky Master's Theses. 328. https://uknowledge.uky.edu/gradschool_theses/328
This Thesis is brought to you for free and open access by the Graduate School at UKnowledge. It has been accepted for inclusion in University of Kentucky Master's Theses by an authorized administrator of UKnowledge. For more information, please contact [email protected].

ABSTRACT OF THESIS
FAILURE RATE STUDIES AND DESIGN ALTERNATIVES FOR STANDUP FORKLIFT TRUCKS
Standup forklift trucks are extensively used primarily for material handling in high density warehouses. These forklifts over the years have been involved in severe accidents causing injuries and taking lives of the operator and that of people on the floor. The major accidents involving these trucks are tip-over, off the dock accidents, compartment intrusions and under the rack injuries. The objective of the work is to analyze the accident data and to provide a conceptual design to ensure safety of the operator riding the standup forklift trucks. The operator is assumed to be safe when retained within the compartment similar to that of the safe space environment of a sit down forklift truck or tractors. Thus a door on the standup forklift would provide a safer compartment. This design would help in preventing severe injuries to the operator in case of any accidents. The important criterion of this design is to provide a door with latch and slide mechanism to ensure easy egress and ingress of the operator. The compartment is designed ergonomically for 95th percentile industrial male population. The accident data is studied by performing statistical and failure analysis. Weibull plots are fitted for life time distribution data and are found to be of increasing rate. This suggests that present safety precautions are increasingly ineffective. Keywords: Standup Forklift, Workplace design, Door design, Ergonomics, Operator safety, Operator comfort, Failure rates
Srinivas Jagarlamudi
Date: 12/09/2004
Copyright © Srinivas Jagarlamudi 2004

FAILURE RATE STUDIES AND DESIGN ALTERNATIVES FOR STANDUP FORKLIFT TRUCKS
By
Srinivas Jagarlamudi
Dr. Ottfried J. Hahn (Director of Thesis)
Dr. George Huang
(Director of Graduate Studies)
Date: 12/09/2004

RULES FOR THE USE OF THESIS
Unpublished theses submitted for the Master’s degree and deposited in the University
of Kentucky library are as a rule open for inspection, but are to be used only with due
regard to the rights of the authors. Bibliographical references may be noted, but
quotations or summaries of parts may be published only with the permission of the
author, and with the usual scholarly acknowledgements.
Extensive copying or publication of the thesis in whole or in part also requires the
consent of the Dean of the Graduate School of the University of Kentucky.

THESIS
Srinivas Jagarlamudi
The Graduate School
University of Kentucky
2004

FAILURE RATE STUDIES AND DESIGN ALTERNATIVES
FOR STANDUP FORKLIFT TRUCKS
THESIS
A thesis submitted in partial fulfillment of the requirements for the
degree of Master of Science in Mechanical Engineering
in the College of Engineering at the
University of Kentucky
By
Srinivas Jagarlamudi
Lexington, Kentucky
Director: Dr Ottfried J. Hahn
(Professor of Mechanical engineering)
Lexington, Kentucky
2004
Copyright © Srinivas Jagarlamudi 2004

TO MY SISTER AND TO MY PARENTS.

ACKNOWLEDGMENTS
First and foremost I would like to express my sincere gratitude to my advisor
and thesis chair Dr. Ottfried J. Hahn for his timely advice and effort towards the
completion of this thesis. I wish to thank the thesis committee: Dr. Kaveh A. Tagavi
and Dr. Marwan Khraisheh for providing insights that guided and challenged my
thinking, substantially improving the finished product.
In addition to this I would like to thank my sister, my parents and friends
from whom I received equally important assistance. Their advice and support have
been vital through out. Once again, I wish to thank my thesis committee for their time
and for their valuable advices and suggestions.
iii

TABLE OF CONTENTS
ACKNOWLEDGEMENTS………………………………………………………...iii
LIST OF TABLES…………………………………………………………………vii
LIST OF FIGURES……………………………………………………………….viii
LIST OF FILES………………………………………………………………….....ix
CHAPTER 1: INTRODUCTION…………………………………………………...1
1.1 BACKGROUND……………………………………………………………...1
1.2 FORKLIFT TRUCK CLASSIFICATION……………………………………3
1.3 OBJECTIVE…………………………………………………………………..5
CHAPTER 2: LITERATURE REVIEW……………………………………………6
CHAPTER 3: DESIGN ALTERNATIVES FOR STANDUP FORKLIFT
TRUCKS……………………………………………………………..9
3.1 INTRODUCTION…………………………………………………………….9
3.2 DESIGN TO FIT BODY POSTURE…………………….…………………...9
3.2.1 Human Physical Dimensions…………………………………………….10
3.2.2 Operator Space Envelope Dimensions…………………………………...11
3.3 DESIGN OF STANDUP OPERATOR COMPARTMENT AND DOOR….12
3.3.1 INTRODUCTION TO PRO-ENGINEER ................................................13
3.3.1.1 Feature Based Modeling…………………………………………….13
3.3.1.2 Design Intent………………………………………………………...14
3.3.1.3 Parametric Features………………………………………………….15
3.3.1.4 Associativity………………………………………………………...15
3.4 OPERATOR COMPARTMENT………………………………………………19
iv

3.5 DESIGN OF DOOR…………………………………………………………21
3.6 DESIGN ALTERNATIVES AND BENCHMARKING……………………22
CHAPTER 4: ANALYSIS OF ACCIDENT DATA……………………………...24
4.1 INTRODUCTION…………………………………………………………...24
4.2 COMPARISON OF ACCIDENT DATA……………………………………27
4.3 INCIDENT RATES OF ACCIDENTS……………………………………...29
CHAPTER 5: FAILURE RATE MODELS OF FORKLIFT TRUCK
ACCIDENTS……………………………………………………….32
5.1 INTRODUCTION…………………………………………………………...32
5.2 RELIABILITY, LIFETIME DISTRIBUTIONS, LIFETIME DISTRIBUTION
MODELS…………………………………………………………………….32
5.2.1 Reliability………………………………………………………………...32
5.2.2 Lifetime Distributions……………………………………………………32
5.2.2.1 Survivor Function……………………………………………………33
5.2.2.2 Probability Density Function………………………………………...33
5.2.2.3 Hazard Function……………………………………………………...33
5.2.3 Lifetime Distribution Models……………………………………………33
5.2.3.1 The Exponential Distribution………………………………………...34
5.2.3.2 The Normal Distribution……………………………………………..34
5.2.3.3 The Lognormal Distribution…………………………………………35
5.2.3.4 The Weibull Distribution…………………………………………….35
5.3 MINITAB ANALYSIS………………………………………………………36
5.3.1 Goodness-of-Fit………………………………………………………….37
v

5.3.2 Lifetime Distribution Plots………………………………………………38
5.4 RESULTS AND DISCUSSION…………………………………………….38
CHAPTER 6: CONCLUSIONS…………………………………………………...43
6.1 INTRODUCTION…………………………………………………………...43
6.2 CONCLUSIONS…………………………………………………………….43
6.2.1 Design Options…………………………………………………………..43
6.2.2 Data Analysis…………………………………………………………….44
6.3 REMARKS………………………………………………………………….45
APPENDIX A: MINITAB ANALYSIS…………………………………………...46
APPENDIX B: STANDUP FORKLIFT TRUCK PICTURES……………………56
APPENDIX C: STANDUP FORKLIFT TRUCKS DATA…… …………………59
REFERENCES…………………………………………………………………….63
VITA……………………………………………………………………………….65
vi

LIST OF TABLES
Table 1.1.a: Industrial Truck Association Classification System………………….4
Table 1.1.b: Industrial Truck Association Classification System………………….5
Table 3.1: Design parameters of the compartment………………………………...20
Table 4.1.a: Accident Data………………………...……………………………….25
Table 4.1.b: Accident Data…………………………...……………………………26
Table 4.2: Comparison of total number of accidents………………………………27
Table 4.3: Comparative analysis of accident type per year………………………..28
Table 4.4: Incident rate of accidents……………………………………………….30
Table 5.1: Results from MINITAB analysis……………………………………….39
vii

LIST OF FIGURES
Figure 1.1: Types of standup forklift trucks………………………………………...2
Figure 3.1: Anthropometric Data in Standing Position……………………………10
Figure 3.2: Operator space envelope dimensions………………………………….11
Figure 3.3: Orthogonal view of standup forklift truck design……………………..17
Figure 3.4: Wire frame model of standup forklift truck……………………………18
Figure 3.5: Orthographic view of operator compartment…………………………..19
Figure 3.6: Front view of door……………………………………………………...21
Figure 4.1: Plot of Accident Comparison…………………………………………..29
Figure 4.2: Incident rates of accidents per year…………………………………….31
Figure 5.1: Weibull plot of total number of accidents……………………………...40 Figure 5.2: Weibull plot of tip over accidents……………………………………....40
Figure 5.3: Weibull plot of off the dock accidents………………………………….41
Figure 5.4: Weibull plot of forks trailing collisions…………………………………41
Figure 5.5: Weibull plot of forks trailing collisions with leg injuries……………….42
viii

LIST OF FILES
Jagarlamudi.pdf…………………………………………………..…………1.38 MB
ix

CHAPTER 1
INTRODUCTION
1.1 BACKGROUND
Since the advent of mechanization, manual handling has been replaced by the use of
mechanized lifting and transport equipment. The most successful workhorse for
materials handling is the forklift truck. It was invented by Clark material handling
about hundred years ago. These Forklift trucks also popularly known as industrial
trucks are frequently used in manufacturing industry on shop floors for material
handling and storage and are individually operated by an operator. The need to
operate and maneuver in narrow aisles on shop floors led to the introduction of
standup narrow aisle trucks in to the material handling industry. Narrow aisle trucks
are designed to use less floor space by stacking products vertically along aisles 5 to
10 feet wide [1]. These Standup forklift trucks have been through lot of design
changes over a period of time for ease of operation, superior visibility, to maximize
the operator safety and for controllability to avoid accidents. The latest standup fork
lift trucks in the industry are manufactured with operator side stance to create new
market share and improve productivity of operator. In these types of trucks, the
operator faces the left side of the truck thus having maximum visibility in forward
direction with forks leading and in backward direction with forks trailing.
The operator in standup forklift truck with side stance position uses his back
to rest on the right side of the truck for good forward and backward vision. Control
of these forklift trucks is by means of break pedal located under the left foot, a
steering wheel controlled by left hand and control lever operated by right hand.
1

Forward and reverse motion of the truck is controlled by control lever and braking is
done by lifting the left foot or reversing the drive motor called plugging. The operator
uses his left leg to control the motion of forklift truck. So, the forklift moves when the
operator presses his left leg against the brake pedal and forklift comes to rest when
the foot is lifted of the brake pedal.
Narrow aisle straddle truck Narrow aisle reach truck
Standup counterbalanced truck Standup order picker truck
Figure 1.1: Types of standup forklift trucks
2

1.2 FORKLIFT TRUCK CLASSIFICATION
Fork lift trucks in general are classified accordingly by operator stance as sit-down
forklift truck and stand-up forklift trucks. These Forklift trucks are further classified
according to the driving power, lifting capacity, operator stance, and type of tires used
and the mode of offsetting the weight of payload. The type of driving power depends
on service for which truck is intended. For outdoor operations trucks with internal
combustion engines gasoline, diesel, propane or compressed natural gas are used.
These internal combustion engine trucks are used when length of operation is
extended and heavy duty operations are required. Forklifts that operate on electric
power uses a battery to supply electricity and are limited to use in indoor operations
because of their low material handling efficiency and the time required for recharging
and replacing the battery.
Forklift trucks classified with respect to the mode of offsetting the weight of payload
are counterbalanced trucks and trucks with forks extending forward of the truck. In
the counterbalanced trucks a counter weight is generally attached to the rear of the
truck. Generally, batteries are used as counterweight system for electrically powered
forklift trucks. These counterbalanced rider trucks are widely used during operations
requiring great mobility. The order-picker trucks with forward facing arms are used
in warehouses to take goods to and from shelves with operator platform on the forks.
Side loader truck carries load from the side and are used for carrying and staking
bulky and heavy items. Turret trucks have a rotating fork and can be used for stacking
at right angles to the forklift and these trucks generally have a high lift capacity [1].
3

The industrial truck association, US industry’s primary trade classified the forklifts
into seven different classes and are shown in the table provided below.
Table 1.1.a: Industrial Truck Association Classification System
Class Motive power Description
Class 1 Electric Counterbalanced rider:
Stand-up or Three-wheel sit-
down
Class 2 Electric Narrow-aisle:
High-lift straddle, Order
picker,
Reach-type outrigger, Side-
loaders, turret trucks, swing
mast and convertible
turret/stock picker
Low-lift pallet and
platform(rider)
Class 3 Electric Hand trucks:
Low-lift platform
Low-lift walkie pallet
Low-lift walkie/center
control
Reach-type outrigger
High-lift straddle
4

Table 1.1.b: Industrial Truck Association Classification System
Class 4 Internal Combustion
Engine
Fork, counterbalanced,
cushion tire
Class 5 Internal Combustion
Engine
Fork, counterbalanced,
pneumatic tire
Class 6 Electric or Internal
Combustion Engine
Tractor, sit-down rider, draw
bar pull over 999lbs.
Class 7 Electric or Internal
Combustion Engine
Rough terrain forklift truck
Source: Industry and Trade Summary: Forklift trucks and related vehicles
1.3 OBJECTIVE
The primary objective of the work is to analyze the safety of the operator’s
compartment, design rear post and to conceptually design a door to protect the
operator without compromising on rapid egress from the forklift as per standard
ASME B56.1 [2]. Then ergonomic design of operator compartment for 95th percentile
industrial male population, design alternatives for standup forklifts is done to achieve
target. Statistical and failure analysis of the forklifts accident data is performed in
support of the design for standup forklift trucks.
5

CHAPTER 2
LITERATURE REVIEW
The safety of the operator associated with forklift trucks has been a major cause for
material handling industry over a period of time. Many safety guidelines have been
incorporated by Occupational Safety and Health Administration (OSHA). OSHA
proposed those operator training guidelines in OSHA 1910.178 [3]. The applicable
standard ASME B56.1 [2] for low lift and high lift industrial trucks suggests a
compartment design facilitating easy egress and ingress and operator restraints to
retain the operator within the compartment in case of a tip-over or off the dock
accidents. In the sit down forklift trucks the operator can be restrained in the seat with
out falling by means of a seat belt in case of a tip-over or off the dock accident. Thus
a person operating sit down forklift trucks is safer in the case when tip-over or off the
dock accidents occur.
Crockett and Miller [4] performed simulations on tip-over and off the dock accidents
of standup forklift trucks with and without door with the help of three operators in
order to determine the injury potential and to calculate the egress time. These
experiments suggested an average additional egress time of 0.83 seconds that would
severely compromise the safety of operator in a situation where in the operator has to
egress rapidly. These studies did not consider improved step height and planned door
action in their studies to reduce the egress time. These rapid egress situations
generally arise when tip-over or off the dock accidents occur. Operator can easily exit
the forklift with forks leading but his ability to jump clear off the forklift with forks
trailing in an off the dock accident leading to fatal injuries or even causing death of
6
the operator. These injuries usually occur when the operator in the standup forklift is
not retained within the operator compartment [5].
Mohamad, Watkins, Sadegh and Dunlap [6] investigated potential injury to operators
of standup forklift trucks with operator confined in the compartment by means of
door using computer simulations with biodynamic model and experimental setup with
an Hybrid III, 50th percentile male anthropometric test device. They calculated head
impact velocity and proposed not to implement doors on standup forklift trucks. This
is in stark contrast with the sit down forklift where the safest place is the seat. The
study also did not consider restraint of person in falling by hand hold and operator
with helmet.
Harris & DeRosia [7] investigated loss of stability and falling of the operator during
normal operations in warehouses. The paper performed simulations and concluded
that operator often loses stability due to unanticipated accelerations and decelerations
causing the operator to fall. This study further supported the use of door to retain the
operator and to prevent serious lower body injuries.
Carlin & Sances, Jr. [8] discussed forklift overturns and head injuries with the help of
hybrid II dummies, side impact dummies and stunt men on forklifts of different
manufacturers. The investigation concluded that dummy lacked ability to hold on to
the truck during accidents. The operator was either crushed or death occurred when
jumped or was thrown out by an overturning truck. The work supported the idea of
retaining the operator within the compartment by means of restraints. The operator
would sustain fewer injuries by remaining in the forklift. The study also showed that
7

the head of the operator always struck the ground regardless of restraint systems and
thus means to prevent head injuries has to be addressed.
Failure analysis associates [9] performed a comparative analysis of accidents
involving forklift trucks and analyzed in terms of accident type and type of injury.
These accident categories were applied to the data compiled by California’s
department of industrial relations, mine safety and health administration and Clark
Equipment Company. Comparison of accident reports provided information for
forklift truck designers as to the accident patterns and frequencies of industrial truck
accidents to incorporate necessary design changes in order to prevent the accidents
and to incorporate necessary design alternatives. No changes in the workspace were
proposed in the paper as has been seen in many other industrial operators work
stations such as tractors, dozers etc.
8

CHAPTER 3
DESIGN ALTERNATIVES FOR STANDUP FORKLIFT TRUCKS
3.1 INTRODUCTION
Ergonomics is the application of scientific principles, methods, and data drawn from a
variety of disciplines to the development of engineering systems in which people play
a significant role. These engineering systems vary from use of simple tool by a
consumer to multiperson sociotechnical systems [10]. An ergonomics approach to the
design of workstations attempts to achieve balance between the worker capabilities
and work requirements to optimize worker productivity and the total system [11]. The
standup forklift truck operator compartment has to be designed ergonomically for
better performance, operator comfort and safety of the operator.
3.2 DESIGN TO FIT BODY POSTURE
Often in industry the workstations are designed in an arbitrary fashion giving little
consideration to anthropometric measurements of the user. The physical dimensions
of operator are significantly important in the design of workstation for safety and
productivity. Inadequate postures due to improperly designed work place can result
into static muscle efforts resulting in muscle fatigue and aggravating operator related
health hazards. So, in designing an operator compartment it is necessary to obtain
information on task performance, equipment and working posture. Thus it is
appropriate to design primarily by considering effects of anthropometry and locations
of the machine elements on posture, reach, vision and interference of the body with
the machine.
9

3.2.1 Human Physical Dimensions
Figure 3.1: Anthropometric Data in Standing Position
Source: SAE J833 May 1989
10
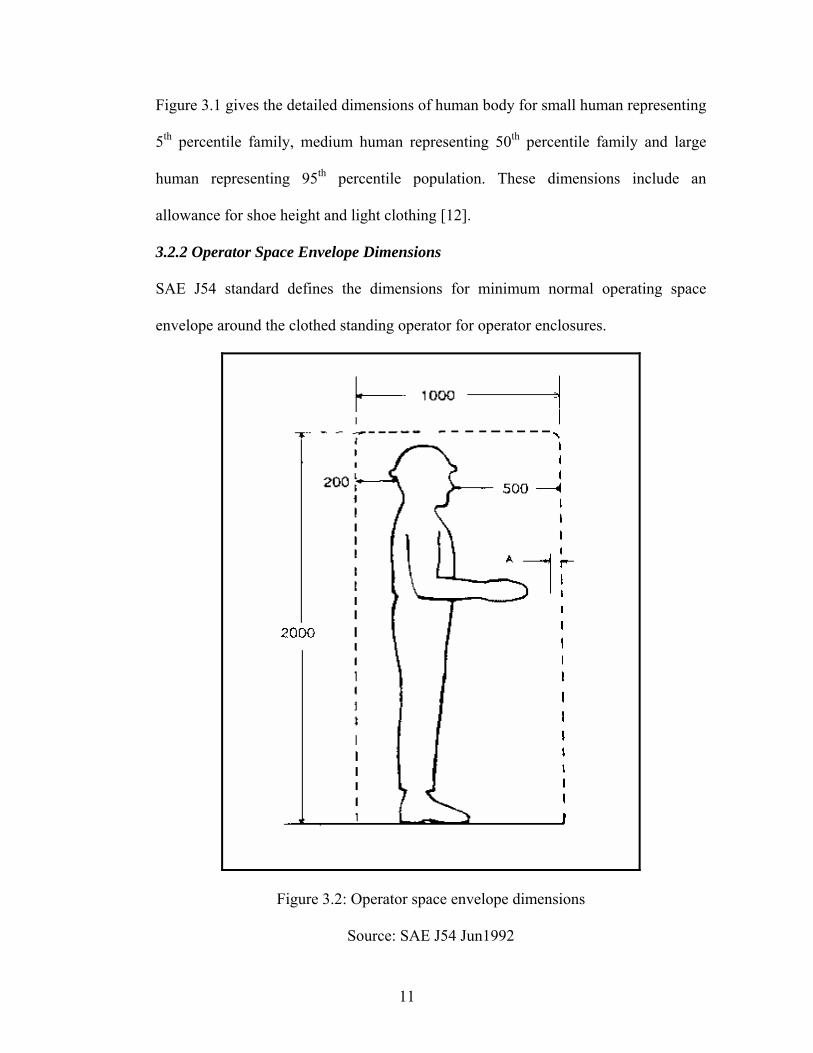
Figure 3.1 gives the detailed dimensions of human body for small human representing
5th percentile family, medium human representing 50th percentile family and large
human representing 95th percentile population. These dimensions include an
allowance for shoe height and light clothing [12].
3.2.2 Operator Space Envelope Dimensions
SAE J54 standard defines the dimensions for minimum normal operating space
envelope around the clothed standing operator for operator enclosures.
Figure 3.2: Operator space envelope dimensions
Source: SAE J54 Jun1992
11

According to the standard [13] the operator enclosure minimum space envelope may
be smaller than specified in the figure 2.2 in condition where the reduced operator
space envelope for a particular machine application allows for adequate operator
performance. The internal operator space envelope width may be reduced to a
minimum of 670mm to accommodate a 95th percentile operator with heavy clothing.
But it cannot accommodate 95th percentile operator if the width is reduced less than
670mm.
3.3 DESIGN OF STANDUP FORKLIFT OPERATOR COMPARTMENT AND
DOOR
The standup forklift compartment is designed with respect to the guidelines provided
by the SAE standards. Since many tip over, and most off dock accidents are emergent
events, the primary goal for protection in tip over and off the dock accidents should
be to prevent the operator from being thrown out of the compartment. In order to
prevent death or serious injuries due to the crushing of the operator by the forklift, the
operator and all body parts has to be retained within the compartment. According to
ASME B56.1, the operator protection means shall be designed so as not to interfere
with the normal operation of the controls and to allow getting on and off the truck
easily and permitting rapid exit in case of an emergency.
The issue of providing the door for standup forklift trucks has been a major debate in
the industry over the last several decades. The procedure for sit down forklifts in case
of accidents is to stay with the machine. Standup trucks with forks leading and with
no door allow exit in case of an off the dock accident by stepping off the forklift by
sensing the impending accident. But the operator ability to clear off the truck can be
12

seriously compromised when the truck is operated with forks trailing. In the case of a
lateral tip-over the operator can exit from the truck by stepping backward, but the
inability of the operator to be clear of the truck may lead to severe amputations or
even lead to death. Injuries to operators left legs form the major percentage of
accidents involving standup forklift trucks. OSHA in its safety guideline mandates the
need for operator left leg to remain within the compartment while operating. The
operator while braking is in a single limb stance posture [7]. So, in the process of
deceleration the operator momentum is directed towards the entry of forklift.
Deceleration of forklift results in loss of postural stability of the operator and thus it is
important to arrest the loss of balance, falling and injuries during operation of standup
forklift truck. The above mentioned safety issues are addressed by providing the
operator restraint in the form of door to standup forklift trucks.
3.3.1 Introduction to Pro/Engineer
Pro/engineer is a 3D feature-based parametric solid modeler enabling to create true
3D solid models of the designs. Pro/engineer enables to work with feature based
modeling, parametric relationships and associativity. Objects designed in
pro/engineer can be shared with many applications.
3.3.1.1 Feature based modeling
Parametric modeling systems are often referred to as feature based modelers. A
feature is a primary component that can be created or used to build a three
dimensional part. Pro/engineer models are feature based, which means they are
composed of one or many features. These features may comprise either a positive
space or negative space. Positive space features are composed with actual mass and
13

negative space feature is where a part has a segment cut away or subtracted. During
the sketching of the feature, design intent is developed in the model by adding
dimensions and constraints to the sketch.
Some examples of features are
Datum planes, which are two dimensional invisible flat planes usually used
for referencing to create other features.
Datum axes and curves, which are basically two and three dimensional lines,
used for referencing during modeling.
Protrusions, which create solid material either from sketched sections or
from existing features within the model.
Cuts, which are similar to protrusions except that they remove material from
the model.
3.3.1.2 Design Intent
Design intent is the capability unique to parametric modeling packages compared to
other forms of CAD. Most CAD packages have the ability to display the design but
fail to hold the actual vector data required for construction. Design intent is the
intellectual arrangement of assemblies, parts, features and dimensions to solve the
design problem. Tools for incorporating design intent are
Assembly constraints used to form relationships between components of a
design.
Dimensional relationships capture the design intent between features in a
part and in between parts of an assembly. A dimensional relationship is an explicit
way to relate features in a design.
14

Dimensioning scheme is extremely important for design intent. The
placement of dimensions within the section or feature should match the intent of
design
References are created within part and assembly modeling there by creating
a parent-child relationship. An example of reference within part mode is to use edges
of existing features. Thus changes in edge of parent feature results in corresponding
change in child feature.
Feature constraints are used, if design requires a feature element be
constrained to other element. Examples of feature constraints are perpendicular,
parallel, tangent and equal length.
3.3.1.3 Parametric Features
Design created with pro/engineer can be parametric. Parametric models use
dimensions and other parameters within the model to control the physical shape of the
model. This controlling happens by means of using rules or equations called
relationships.
3.3.1.4 Associativity
Pro/engineer is an integrated, fully associative computer aided mechanical design
package. Pro/engineer is the fundamental application in a powerful suite of tools
capable of an integrated and concurrent environment. Objects created in one module
of pro/engineer and can used with other applications. Due to associativity, changes
made to an object in one mode reflects in other modes,
15
Basic modules in Pro/engineer are
Sketch Mode: Sketch mode uses two-dimensional approach where feature
entities are sketched and then three- dimensional construction operators such as
extrude, revolve can be invoked. Sketches can be created separately from part and
assembly environments and can be saved for future use.
Part Mode: Part mode is used to create solid and surface models. This is the
primary design environment and objects created in this mode can be subsequently
used in for drawing and manufacturing modes.
Drawing Mode: drawing mode is used to create engineering drawings of
models created. Drawing mode takes existing part or an assembly to produce an
orthographic drawing. It is also used to produce detailed drawings with section and
auxiliary views.
Assembly Mode: Assembly module is used to create assembly of design
components into a final design solution.
16

Figure 3.3: Orthogonal view of standup forklift truck design
17

Figure 3.4: Wire frame model of standup forklift truck.
The standup forklift truck in the above figure is an ergonomic design of operator
compartment with respect to the guidelines provided by SAE standards and
conceptual design of providing a door to restraint operator within the compartment
without compromising on rapid ingress and egress as stressed by industrial trucks
standard.
18

3.4 OPERATOR COMPARTMENT
Back Rest
Knee Pad
Step Height
Figure 3.5: Orthographic view of operator compartment
All dimensions in millimeters.
19

Table 3.1: Design parameters of the compartment:
Parameter Dimension in millimeters
Step Height 180
Entrance width 500
Height of the cab 1200
Width of the cab 1200
Length of the cab 1000
Width of back rest 400
Knee cap 150
Counter weight width 600
The step height is reduced from normal height of 11 inches used by forklift
manufacturers to reduce the time taken to ingress and egress. The standard step height
of 180mm or approximately seven and quarter of an inch is considered. In a side
stance forklift truck, back rest plays an important role by providing cushion to the
back of the operator and enhancing operator stability. A knee cap is provided to
reduce the fatigue on operator knee. Due to the absence of suspension system in
present day forklift trucks, floor padding is provided to protect operator from
vibrations caused due to uneven floors. Posts are provided to prevent injuries to the
operator caused when the trucks accidentally pass below the racks while traveling in
backward direction. Hand rails are provided for the operator to hold on to the forklift
and to avoid being thrown out of the compartment.
20
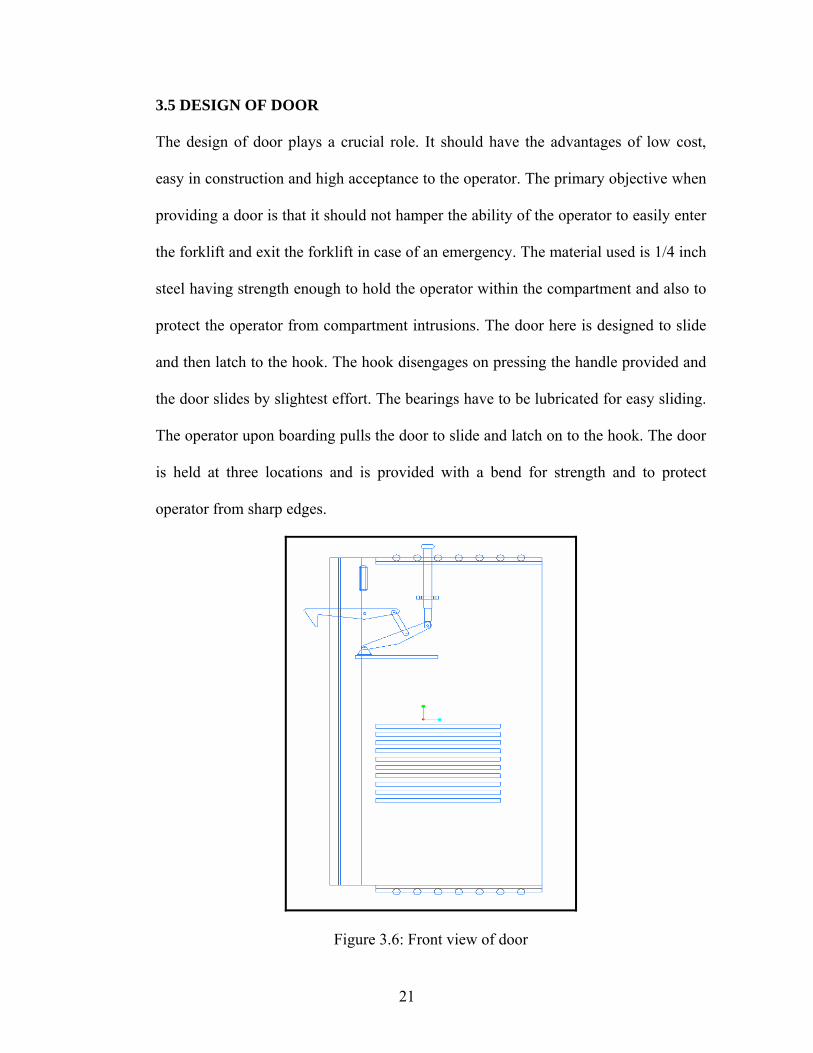
3.5 DESIGN OF DOOR
The design of door plays a crucial role. It should have the advantages of low cost,
easy in construction and high acceptance to the operator. The primary objective when
providing a door is that it should not hamper the ability of the operator to easily enter
the forklift and exit the forklift in case of an emergency. The material used is 1/4 inch
steel having strength enough to hold the operator within the compartment and also to
protect the operator from compartment intrusions. The door here is designed to slide
and then latch to the hook. The hook disengages on pressing the handle provided and
the door slides by slightest effort. The bearings have to be lubricated for easy sliding.
The operator upon boarding pulls the door to slide and latch on to the hook. The door
is held at three locations and is provided with a bend for strength and to protect
operator from sharp edges.
Figure 3.6: Front view of door
21

3.6 DESIGN ALTERNATIVES AND BENCHMARKING
The safety and comfort of the operator of standup forklift trucks has to be improved
to protect and improve the stability in case of accidents. These design changes can be
achieved by a method known as benchmarking. Benchmarking is a continuous
improvement process measuring products, services and practices against competitors
of companies recognized as industry leaders [14]. Benchmarking provides a way to
improve products and methods to achieve the desired targets.
Design features of race car interiors and restraints for the safety of the operator during
collisions can be incorporated. Head and neck support (HANS) to prevent the head
from snapping forward or to the side during collisions is attached to the helmet. This
restraint would avoid serious head and neck injuries. Window openings are covered
by mesh made from nylon webbing. This webbing helps keep the drivers arms from
flailing out during accidents.
Safety factor associated with tractors, dozers and sit down forklifts is to protect the
operator in roll over accidents. The operator compartment is provided with a rollover
protective structure (ROPS) and compartment of some trucks are enclosed to prevent
operator from being pinned by over head guard.
Severe and permanent head injuries can result from falling onto a hard surface from a
height of just two feet. Standard dock heights are generally four feet and the
equivalent impact on operator head in an off dock accident can be similar to that of
rodeo barrel hit by a bull weighing 3000 to 4000 pounds. The barrel material is made
out of aluminum and some made out of steel or fiberglass with rubber or nylon
22

padding to protect the clown. Helmet made out of rodeo barrel material has to be
mandated to prevent head injuries due to the impact with ground.
Atlet Inc. a Swedish forklift truck manufacturer designed narrow aisle trucks with
operator seat eliminating standup postures. The industry has solutions for the safety
associated with operator in sit down postures. Schaeff Inc. manufacturing w-series
warehouse forklifts and echo series forklifts have operator compartment door as an
optional and safety feature.
23

CHAPTER 4
ANALYSIS OF ACCIDENT DATA
4.1 INTRODUCTION
A comparative analysis of reported accidents involving standup forklift trucks was
performed. Analysis and comparison of the accident data from accident reports
provides information to the equipment designer so that design attention can be
focused onto most frequent and serious accidents. Thus accident data can also be used
as guide by designer in the process of any design modifications involving the
equipment to avoid major and severe accidents [9]. The data from Table 4.1 provides
the information of all the accidents involving standup forklift trucks over the years
spanning from 1978 to 2002, the number of hours of operation per year and also the
number of accidents that were serious in nature [5]. This data is further classified
according to the type of accidents involving standup forklift trucks that posed severe
threat to operator safety such as off the dock accidents, tip over accidents and
accidents occurring with forks trailing. These forks trailing collisions are further
divided into accidents involving left leg injuries and accidents without left leg
injuries. The other types of accidents are beyond the consideration of this study.
24

Table 4.1.a: Accident Data
Year Number of Hour/YearSerious
accidents Accidents Off dock
Active Trucks for year for year accidents
1978 1629 520000 0 6 1 1979 2209 706000 5 7 1 1980 3099 1160000 5 16 1 1981 4176 1780000 5 10 2 1982 5091 2154000 16 28 5 1983 6276 2058000 11 16 0 1984 8291 2842000 18 22 3 1985 10711 4588000 17 30 5 1986 13238 5074000 29 38 2 1987 16126 5594000 26 54 6 1988 19326 6296000 38 78 8 1989 22843 7106000 42 65 5 1990 25947 8194000 49 109 7 1991 28213 7988000 50 93 8 1992 31162 6686000 52 112 7 1993 34161 7956000 49 126 8 1994 35869 8840000 69 153 8 1995 37835 8004000 55 168 16 1996 40560 9006000 72 211 22 1997 44056 11044000 70 184 11 1998 47562 13288000 60 237 16 1999 52239 14118000 65 241 19 2000 55579 17548000 65 200 13 2001 62361 18668000 33 150 16 2002 65475 16250000 44 149 10
25

Table 4.1.b Accident Data
Tip Over Accidents
Other Accidents
Forks Trailing Collisions
Forks Trailing Collisions/ Left
Leg Injuries
Forks Trailing Collisions/Other
1 1 3 0 3 0 3 3 2 1 4 3 8 4 4 3 0 5 4 1 1 7 15 7 8 2 6 8 5 3 3 5 11 7 4 3 10 12 7 5 1 13 22 7 15 11 14 23 7 16 9 32 29 16 13 10 18 32 18 14 14 31 57 30 27 16 21 48 22 26 22 29 54 28 26 21 35 62 35 27 26 46 73 37 36 23 56 73 34 39 33 58 98 42 56 36 47 90 34 56 36 78 107 38 69 32 95 95 34 61 21 71 95 37 58 14 54 66 25 41 16 54 69 22 47
26

4.2 COMPARISON OF ACCIDENT DATA
According to [9], the accident frequency is defined by the ratio of the number of
times an accident occurs during a certain activity divided by the total number of
opportunities that accident occurs during that activity. The choice of the denominator
allows the comparison of accident frequencies of different events. The accident
fraction used in this comparison is in terms of the percentage of total number of
accidents. Table 4.2 illustrates the comparison of accident types in terms of total
number of accidents. It can be noted that forks trailing collisions form major
percentage of accidents followed by tip-over and off the dock accidents respectively.
Table 4.2: Comparison of Total Number of Accidents
COMPARISON OF ACCIDENTS
Type of Accident Number Percentage of Accidents of Accidents
Forks trailing collisions 1158 46.26
Off Dock Accidents 200 7.99 Tip over Accidents 358 14.30
Other Accidents 787 31.44
Total Accidents 2503 100.00
Table 4.3 provides the comparison of accident types in terms of the percentage of
total number of accidents per every year. Figure 4.1 is the graph plotted with
percentage of accidents per year on y-axis and the percentage of accident types per
year on x-axis. From the graph, it is imperative that forks trailing collisions form
major percentage of total number of accidents involving standup forklift trucks. The
graph also illustrates that the tip over accidents, off the dock accidents, and forks
27

trailing collisions combined forming major percentage of accidents and following a
constant rate starting from the early nineties.
Table 4.3: Comparative analysis of accident type per year
Year Percentage of Percentage of Percentage of Percentage of Tip Over Off the Dock collisions with Leg injuries Accidents Accidents forks trailing with forks trailing
1978 16.67 16.67 50.00 0.00 1979 0.00 14.29 42.86 28.57 1980 25.00 6.25 50.00 25.00 1981 30.00 20.00 50.00 40.00 1982 3.57 17.86 53.57 25.00 1983 12.50 0.00 50.00 31.25 1984 13.64 13.64 50.00 31.82 1985 10.00 16.67 40.00 23.33 1986 2.63 5.26 57.89 18.42 1987 20.37 11.11 42.59 12.96 1988 11.54 10.26 37.18 20.51 1989 15.38 7.69 49.23 27.69 1990 12.84 6.42 52.29 27.52 1991 17.20 8.60 51.61 23.66 1992 19.64 6.25 48.21 25.00 1993 16.67 6.35 49.21 27.78 1994 16.99 5.23 47.71 24.18 1995 13.69 9.52 43.45 20.24 1996 15.64 10.43 46.45 19.91 1997 19.57 5.98 48.91 18.48 1998 15.19 6.75 45.15 16.03 1999 13.28 7.88 39.42 14.11 2000 10.50 6.50 47.50 18.50 2001 9.33 10.67 44.00 16.67 2002 10.74 6.71 46.31 14.77
28

Comparision of Accident Data
-10.00
0.00
10.00
20.00
30.00
40.00
50.00
60.00
70.00
80.00
90.00
1978
1981
1984
1987
1990
1993
1996
1999
2002
Year of Accident
Perc
enta
ge o
f Tot
al A
ccid
ents
percentage of serious accidents
percentage of tipover accidents
percentage of off-dock accidents
percentage of accidents with forkstrailing
percentage of left leg injuries withforks trailing
Figure 4.1: Plot of Accident Comparison
4.3 Incident Rates of Accidents:
US Department of labor, bureau of labor statistics [15] defined an equation to
calculate the incident rates of accidents and work related injuries. These incident rates
can be used to show relative level of injuries and illnesses among different industries
or incidents within one organization. The equation to determine the incident rate is
given by
Incident rate = (Number of Accidents*200,000)/Employee hours worked (4.1)
The number of hours worked did not include any non working time and it is
calculated based on eight hours per day. The value 200,000 providing standard base is
calculated taking into consideration the equivalent of 100 employees working for 40
hours per week and 50 weeks per year. Table 4.4 shows the incident rates of accidents
per year, tip over accidents, off the dock accidents, forks trailing collisions, and forks
trailing collisions with left leg injuries.
29

Table 4.4: Incident rate of accidents
Year Hour/Year Incident rate of accidents
per year
Incident rate of off dock accidents
Incident rate of tip over accidents
Incident rate of
forks trailing collisions
Incident rate of
forks trailing/leg injuries
1978 520000 2.31 0.38 0.38 1.15 0.00 1979 706000 1.98 0.28 0.00 0.85 0.57 1980 1160000 2.76 0.17 0.69 1.38 0.69 1981 1780000 1.12 0.22 0.34 0.56 0.45 1982 2154000 2.60 0.46 0.09 1.39 0.65 1983 2058000 1.55 0.00 0.19 0.78 0.49 1984 2842000 1.55 0.21 0.21 0.77 0.49 1985 4588000 1.31 0.22 0.13 0.52 0.31 1986 5074000 1.50 0.08 0.04 0.87 0.28 1987 5594000 1.93 0.21 0.39 0.82 0.25 1988 6296000 2.48 0.25 0.29 0.92 0.51 1989 7106000 1.83 0.14 0.28 0.90 0.51 1990 8194000 2.66 0.17 0.34 1.39 0.73 1991 7988000 2.33 0.20 0.40 1.20 0.55 1992 6686000 3.35 0.21 0.66 1.62 0.84 1993 7956000 3.17 0.20 0.53 1.56 0.88 1994 8840000 3.46 0.18 0.59 1.65 0.84 1995 8004000 4.20 0.40 0.57 1.82 0.85 1996 9006000 4.69 0.49 0.73 2.18 0.93 1997 11044000 3.33 0.20 0.65 1.63 0.62 1998 13288000 3.57 0.24 0.54 1.61 0.57 1999 14118000 3.41 0.27 0.45 1.35 0.48 2000 17548000 2.28 0.15 0.24 1.08 0.42 2001 18668000 1.61 0.17 0.15 0.71 0.27 2002 16250000 1.83 0.12 0.20 0.85 0.27
Incident rates in the table are calculated using the equation 4.1. The number of
accidents provided in table 4.1 and the hours per year of forklift truck operation is
30

used to determine the incident rates. A sample incident rate calculation is shown
below.
Incident rate of accidents per year during 1978:
Number of accidents = 6
Hours of operation per year = 52000 hrs
Incident rate = (6*200,000)/52000 = 2.31
Incident Rates of Accident Data
-1.00
0.00
1.00
2.00
3.00
4.00
5.00
1978
1980
1982
1984
1986
1988
1990
1992
1994
1996
1998
2000
2002
Year of Accidents
Inci
dent
Rat
e
incident rates of accidentsper year
incident rates of off dockaccidents
incident rates of tipoveraccidents
incident rates of forkstrailing collisions
incident rates of forkstrailing collisons with leginjuries
Figure 4.2: Incident rates of accidents per year
The plot of incident rates in the figure 4.2 is plotted with year of accident on x-axis
and incident rate on y-axis. A trend line for the incident rates is added. The trend of
incident rates is of increasing order for all the type of accidents stressing the
importance of design changes in order to protect the operator in case of the above
accidents. This analysis further supports the idea of providing operator restraint in the
form of door and other restraints such as hand hold to retain arms and the head in the
compartment.
31

CHAPTER 5
FAILURE RATE MODELS OF FORKLIFT TRUCK ACCIDENTS
5.1 INTRODUCTION
The accident data is used in order to determine the failure rate models of the accident
types involving standup forklift trucks. The above analysis is performed on tip over
accidents, off the dock accidents, forks trailing collisions and forks trailing collisions
causing left leg injuries while operating standup forklift trucks. The data is tested for
the goodness-of-fit and a best lifetime distribution model is fitted using a statistical
software MINITAB.
5.2 RELIABILITY, LIFETIME DISTRIBUTIONS, LIFETIME DISTRIBUTION
MODELS
5.2.1 Reliability
Reliability is the probability that a system, vehicle, machine, device, and so on, will
perform its intended function under encountered operating conditions, for a specified
period of time. However the product is considered to have failed if it fails to meet the
specifications over a given period of time. Unreliability can be defined as the
probability that the product fails to meet the specifications over given time period
[16].
5.2.2 Lifetime Distributions
Lifetime distribution representation is helpful in determining the risk associated with
the item over a period of time. Three types of representation of lifetime distribution
are the survivor function, probability density function and the hazard function.
32

5.2.2.1 Survivor Function
Survivor function is defined as probability of an item functioning at any time t:
S(t) = P[T ≥ t] t ≥ 0
The survivor function is also known as reliability function and a complimentary
cumulative distribution function. It is assumed that S(t) = 1 for all t < 0 [16].
5.2.2.2 Probability Density Function
Probability density function is defined by f(t) = -S’(t) and is used to indicate the
likelihood of failure at any time, t. The probability density function also illustrates the
relationship between cumulative distribution function F(t) and the survivor function
S(t) for a lifetime. The probability of failure between time interval [a, b] is calculated
by . ( )dttfbTapb
a∫=≤≤ ][
5.2.2.3 Hazard Function
Hazard rate function or failure rate function is the best representation indicating the
risk associated with an item at any given time t. The hazard rate representation is
useful in comparing the way risks change over time for several populations of items
by plotting the hazard function on a single axis [17]. Hazard rate function is defined
by the ratio of probability density function to the survivor function.
Hazard function is given by, ( ) ( )( ) 0; ≥= ttstfth
5.2.3 Lifetime Distribution Models
The theoretical population models used to describe unit lifetimes are known as
Lifetime Distribution Models. The population is generally considered to be the entire
possible unit lifetimes for all of the units that are in use. A random sample of size n
33

from this population is the collection of failure times observed for a randomly
selected group of n units.
5.2.3.1 The Exponential Distribution
The constant failure rate model for continuously operating systems leads to an
exponential distribution. Replacing the time-dependent failure rate λ(t) by a constant
λ in probability density function, . tetf λλ −=)(
Similarly, the cumulative distribution function is given by F(t) = te λ−−1
And the reliability is given by . tetR λ−=)(
5.2.3.2 The Normal Distribution
To describe the time dependence of reliability problems, the PDF for the normal
distribution is given by ]2
)(exp[21)( 2
2
σµ
πσ−
−=ttf ; where µ is the mean time to
fail.
The corresponding cumulative distribution function is given by
⎥⎦
⎤⎢⎣
⎡ −−= ∫
∞−2
2
2)'(exp
21)(
σµ
πσttF
t
'dt
The normal distributions are used to describe the reliability of equipment that is quite
different from that to which constant failure rates are applicable. It is useful in
describing reliability in situations in which there is a reasonably well-defined wear
out time, µ. This may be the case for example, in describing the life of a tread on a
tire or the cutting edge on a machine tool. In these situations the life may be given as
34

a mean value and an uncertainty. Uncertainty in the life of unit is measured in terms
of intervals in time in the case of normal distribution.
5.2.3.3 The Lognormal Distribution
The lognormal is a related distribution that has been found to be useful in describing
failure distributions for a variety of situations. It is particularly appropriate when the
time of failure is associated with a large uncertainty therefore the variance of the
distribution will be a large function of the mean time to failure (MTTF). However, it
is still possible to state a failure and to estimate with it the probability that the time to
failure lies within some factor say n. and also if it is known that 90% of the failures
are within a factor of n of some time t0, then 9.000 =
⎭⎬⎫
⎩⎨⎧ ≤≤ ntt
nt
p
The PDF for the time to failure is then given by ( )⎪⎭
⎪⎬⎫
⎪⎩
⎪⎨⎧
⎥⎦
⎤⎢⎣
⎡⎟⎟⎠
⎞⎜⎜⎝
⎛−=
2
02 ln
21exp
21
tt
ttf
ωπω
and the corresponding cumulative distribution function is given by
( ) ⎥⎦
⎤⎢⎣
⎡⎟⎟⎠
⎞⎜⎜⎝
⎛=
0
ln1tttF
ωφ .
In lognormal distribution model the failure rate can be either increasing or decreasing
depending on the value of ω. The log normal distribution is frequently used to
describe fatigue and other phenomenon caused by aging or wear in failure rates that
increase with time.
5.2.3.4 The Weibull Distribution
The weibull distribution is one of the most widely used in reliability calculations and
with an appropriate choice of parameters can be used to model variety of failure rate
35

behaviors. These include, as special case, the constant failure rate, in addition to
modeling increasing failure rates. The weibull distribution may be formulated in
either a two or three parameter form.
The two-parameter weibull distribution, assumes that the failure rate is in the form of
a power law given by ( )1−
⎟⎠⎞
⎜⎝⎛=
β
θβλ tt
t where β is the shape parameter or Weibull
slope and θ is the scale parameter or characteristic life.
The equation for probability density function is given by
( ) .exp
1
⎥⎥⎦
⎤
⎢⎢⎣
⎡⎟⎠⎞
⎜⎝⎛−⎟
⎠⎞
⎜⎝⎛=
− mm ttmtFθθθ
and the cumulative distribution function is given by ( )⎥⎥⎦
⎤
⎢⎢⎣
⎡⎟⎠⎞
⎜⎝⎛−−=
mttFθ
exp1
5.3 MINITAB ANALYSIS
Numerous calculations involved in theoretical analysis of failure data can be
eliminated by using statistical analysis software like MINITAB. MINITAB is an easy
to use statistical analysis software tool that provides wide range of data analysis
capabilities. It can be used to analyze data and present in graphical representation.
The steps involved in performing analysis using MINITAB are
Feeding the data into MINITAB excel sheet.
Performing reliability/ survival distribution analysis to check for goodness
of fit.
Lifetime distribution plot.
36

The spread sheet of the accident data of standup forklift trucks is imported into
MINITAB in order to perform the analysis. The frequencies used in analyzing the
data are the number of hours the trucks were operated per year. After importing the
data, the following commands are selected from the drop down menu to perform the
reliability distribution analysis of the data.
The sequence of the selection is Stat > Reliability/Survival > Distribution Analysis
(Right Censoring) > Distribution ID Plot. Distribution ID Plot (Right Censoring) is
used in order to determine the distribution that fits best to the data by comparing how
closely the plot points lie to the best-fit lines of a probability plot and providing
goodness-fit measures to help determine the best distribution.
5.3.1 Goodness – of – Fit
MINITAB provides two types of goodness of fit measures to determine the best fit.
They are
Anderson – Darling test for maximum likelihood and least square estimation
methods
Pearson correlation coefficient for least square estimation method.
The Anderson-Darling statistic is the measure of how far the plot points fall from the
fitted line in a probability plot. The statistic is a weighted squared distance from the
plot points to the fitted line with larger weights in the tails of the distribution.
MINITAB uses an adjusted Anderson-Darling statistic, because the statistic changes
when a different plot point method is used. The Pearson correlation measures the
strength of the linear relationship between the X and Y variables on a probability plot
[18].
37

A smaller Anderson-Darling statistic indicates that the distribution fits the data better.
The correlation ranges between 0 and 1, with higher values indicating a better fitting
distribution [18].
5.3.2 Lifetime Distribution Plots
Once the best lifetime distribution model is determined from the Anderson-Darling
goodness of fit test, the lifetime distribution representations and the life time
distribution model is plotted. The following commands are selected from the drop
down menu.
Stat > Reliability/Survival > Distribution Analysis (Right Censoring) > Distribution
Overview Plot.
Distribution Overview Plot is used to generate a layout of plots that allows viewing
the life data in different ways on one graph. A parametric overview plot of the best
distribution of the data includes a probability plot for the selected distribution, a
survival or reliability plot, a probability density function, and a hazard plot.
5.4 RESULTS AND DISCUSSION
The Anderson-Darling coefficient for goodness of fit from the post processor of the
MINITAB for all the accident data resulted in a minimum value for weibull
distribution showing it to be the best fit and those values are tabulated in table 5.1.
The Pearson correlation coefficient is neglected as the method used for distribution
analysis is of maximum likelihood estimation. The distribution overview plots of the
accident types are shown in the Figures 5.1 to 5.5. The weibull distribution plots for
the total number of accidents per year, tip over accidents, off the dock accidents,
forks trailing collisions and forks trailing collisions with left leg injuries are of
38

increasing rate as the values of the shape parameters from table 5.1 are greater than
one. The hazard plots are of increasing rate with time and reliability and the survivor
plot is that of a decreasing order. Thus the accidents involving standup forklift trucks
are of increasing rate with the time.
Table 5.1: Results from MINITAB Analysis
Type of Accident
Anderson-Darling coefficient Shape Parameter
Number of accidents per year 47.017 2.54
Tip over accidents 7.437 2.67
Off the dock accidents 3.478 2.19
Forks trailing collisions 22.755 2.50
Forks trailing collisions with left leg injuries 13.503 2.48
39

Hour/Year
2000
0000
1500
0000
1000
0000
5000
000
7.5000E-08
5.0000E-08
2.5000E-08
0.0000E+00
Hour/Year
Per
cen
t
100000000100000001000000100000
99.99
9050
10
1
0.01
Hour/Year
Perc
ent
2000
0000
1500
0000
1000
0000
5000
000
100
50
0
Hour/Year
Rat
e
2000
0000
1500
0000
1000
0000
5000
000
0.0000006
0.0000004
0.0000002
0.0000000
Table of Statistics
Median 10561948IQR 6412810Failure 2503Censor 0AD* 47.017
Shape
Correlation 0.970
2.53679Scale 12203668Mean 10831917StDev 4574829
Probability Density Function
Survival Function Hazard Function
Distribution Overview Plot for Hour/YearLSXY Estimates-Complete Data
Weibull
Figure 5.1: Weibull plot of total number of accidents
Hour/Year
2000
0000
1500
0000
1000
0000
5000
000
7.5000E-08
5.0000E-08
2.5000E-08
0.0000E+00
Hour/Year
Per
cent
100000001000000
99.99
90
50
10
1
Perc
ent
2000
0000
1500
0000
1000
0000
5000
000
100
50
0
Hour/Year
Rat
e
2000000015000000100000005000000
0.0000006
0.0000004
0.0000002
0.0000000
Table of Statistics
Median 10194262IQR 5869773Failure 358Censor 0AD* 7.437
Shape
Correlation 0.959
2.67579Scale 11690758Mean 10393243StDev 4184866
Probability Density Function
Survival Function Hazard Function
Distribution Overview Plot for Hour/YearLSXY Estimates-Complete Data
Weibull
Figure 5.2: Weibull plot of tip over accidents
40

Hour/Year
PD
F
20000000100000000
7.5000E-08
5.0000E-08
2.5000E-08
0.0000E+00
Hour/Year
Pe
rce
nt
100000001000000
99.990
50
10
1
0.1
Hour/Year
Pe
rce
nt
20000000100000000
100
50
0
Hour/Year
Ra
te
20000000100000000
0.00000045
0.00000030
0.00000015
0.00000000
Table of Statistics
Median 10080506IQR 7086320Failure 200Censor 0AD* 3.478
Shape
Correlation 0.973
2.19021Scale 11916751Mean 10553643StDev 5084248
Probability Density Function
Survival Function Hazard Function
Distribution Overview Plot for Hour/YearLSXY Estimates-Complete Data
Weibull
Figure 5.3: Weibull plot of off the dock accidents
Hour/Year
PD
F
2000
0000
1500
0000
1000
0000
5000
000
7.5000E-08
5.0000E-08
2.5000E-08
0.0000E+00
Hour/Year
Perc
en
t
100000001000000100000
99.99
9050
10
1
0.01
Hour/Year
Per
cen
t
2000
0000
1500
0000
1000
0000
5000
000
100
50
0
Hour/Year
Ra
te
2000
0000
1500
0000
1000
0000
5000
000
0.00000045
0.00000030
0.00000015
0.00000000
Table of Statistics
Median 10436621IQR 6426230Failure 1158Censor 0AD* 22.755
Shape
Correlation 0.969
2.50129Scale 12083615Mean 10721490StDev 4585682
Probability Density Function
Survival Function Hazard Function
Distribution Overview Plot for Hour/YearLSXY Estimates-Complete Data
Weibull
Figure 5.4: Weibull plot of forks trailing collisions
41

Hour/Year
2000
0000
1500
0000
1000
0000
5000
000
7.5000E-08
5.0000E-08
2.5000E-08
0.0000E+00
Hour/Year
Per
cen
t
100000001000000
99.99
90
50
10
1
Hour/Year
Per
cen
t
2000
0000
1500
0000
1000
0000
5000
000
100
50
0
Hour/Year
Rat
e
2000
0000
1500
0000
1000
0000
5000
000
0.0000006
0.0000004
0.0000002
0.0000000
Table of Statistics
Median 9847382IQR 6107339Failure 502Censor 0AD* 13.503
Shape
Correlation 0.967
2.48322Scale 11413551Mean 10125189StDev 4358839
Probability Density Function
Survival Function Hazard Function
Distribution Overview Plot for Hour/YearLSXY Estimates-Complete Data
Weibull
Figure 5.5: Weibull plot of forks trailing collisions with leg injuries
42
CHAPTER 6
CONCLUSIONS
6.1 INTRODUCTION
Accidents involving standup forklift trucks have been a major concern for the
material handling and storage industry over the past years. The safety of the operator
associated with these trucks is seriously jeopardized in the case of a tip over or off the
dock accidents, compartment intrusions, under the rack collisions, arms or head out of
the compartment and also leg injuries due to the loss of stability. These accidents can
lead to death or cause severe injuries to the operator such as broken bones and
amputations. This work included alternatives to be made to the standup forklift
trucks, detailed accident and failure rate analysis of the accidents.
6.2 CONCLUSIONS
6.2.1 Design Options
The safety of the operator can be improved by providing alternatives to the existing
design of the standup forklift trucks. One such alternative is to provide a door to
protect the operator. Since the industry standard mandates productivity vs. safety,
easy ingress and egress of the forklift trucks, the proposal of door for standup forklift
trucks is seriously opposed. The reason for opposing is that a door would increase the
time to ingress and egress. This can be overcome by reducing the step height to seven
and a quarter inch from the ground thereby reducing the time delay by one-third to
two-thirds of a second. The sliding mechanism of the door also aids in reducing the
time delay. More over doors to the standup forklift trucks would prevent lower body
injuries caused due to the compartment intrusions. Door to the forklift truck would
43

arrest loss of balance of the operator while braking and there by preventing left leg
injuries. While applying braking the operator loses stability and may result in the
crushing of left leg. Figure B.3 shows the pictures of forklifts with hits on the step
thus stressing the importance of restraint in the form of door to arrest loss of balance.
It is important to provide posts to protect the operator when hit by the racks in a
situation where the trucks accidentally slide below the racks. Hand rails are provided
in posts so that operator can hold on to the forklift. The pictures of forklifts hit by the
racks are shown in figure B.2 of appendix B.
The operator compartment is designed to fit 95th percentile population. The
ergonomics of the compartment is addressed by providing back rest, knee pad and
padding to the floor to protect the operator from shocks and vibrations resulting from
uneven floors.
6.2.2 Data Analysis
The accident data of standup forklift trucks is statistically analyzed and failure rates
of the accidents are computed according to the accident type. The accident types
considered were tip over and off the dock accidents, forks trailing collisions and
collisions involving left leg injuries. The incident rate of the accidents involving
standup forklift trucks is found to be of increasing order for all the accident types.
The forks trailing collisions constituted major percentage of accidents followed by tip
over and off the dock accidents respectively.
The accident data is also analyzed using Minitab software to determine the failure
rates. The data is best fitted by checking Anderson-Darling and Pearson correlation
coefficient tests. The goodness of fit from above tests showed weibull distribution to
44

be the best lifetime distribution for all the accident types being considered. The shape
parameter from the weibull distribution for all the accident types had a value greater
than one indicating increasing failure rate.
6.3 REMARKS
The accidents involving standup forklift trucks found to be of increasing
order.
The training of the operators as per recommended standards failed to reduce
the accidents.
Operator safety warrants necessary design changes to the standup forklift
trucks.
Design changes had to be made to prevent accidents and to protect the
operator in case of an accident.
Bench marking results in getting the desired objectives.
The safety features similar to that of tractors and race cars can be incorporated
into the standup forklift trucks.
Door would protect operator in case of a tip over, off the dock accidents and
forks trailing collisions. If door used would arrest loss of balance and prevent
leg injuries. Ford used 100 forklift trucks with doors and reported no injuries.
Posts would protect the operator from under the rack hits.
Padding results in ergonomic comfort and more stability to the operator.
The injury severity to the operator head in case of a tip over or off the dock
accidents is reduced by mandating helmet that would absorb the impact
energy of collision with ground.
45

APPENDIX A
MINITAB ANALYSIS
Reliability Distribution Analysis of Total Number of Accidents
Distribution ID Plot: Hour/Year Using frequencies in Accidents per year Goodness-of-Fit Anderson-Darling Correlation Distribution (adj) Coefficient Weibull 47.017 0.970 Lognormal 63.242 0.923 Exponential 875.736 * Loglogistic 57.695 0.928 3-Parameter Weibull 59.619 0.976 3-Parameter Lognormal 54.226 0.974 2-Parameter Exponential 810.206 * 3-Parameter Loglogistic 69.498 0.963 Smallest Extreme Value 221.114 0.930 Normal 66.491 0.971 Logistic 93.458 0.957 Table of Percentiles Standard 95% Normal CI Distribution Percent Percentile Error Lower Upper Weibull 1 1990458 66858.4 1863638 2125907 Lognormal 1 3182028 54218.7 3077517 3290089 Exponential 1 74157.7 1223.99 71797.1 76595.9 Loglogistic 1 2856202 66427.1 2728930 2989409 3-Parameter Weibull 1 1788092 144418 1505037 2071146 3-Parameter Lognormal 1 1982368 131408 1724813 2239924 2-Parameter Exponential 1 591482 1188.52 589158 593816 3-Parameter Loglogistic 1 1868548 132524 1608807 2128290 Smallest Extreme Value 1 -2067498 211038 -2481125 -1653870 Normal 1 852572 160015 538948 1166196 Logistic 1 101914 168328 -228002 431830 Weibull 5 3784410 88062.1 3615688 3961005 Lognormal 5 4413709 61030.1 4295699 4534962 Exponential 5 378474 6246.79 366427 390918 Loglogistic 5 4434979 74541.0 4291262 4583510 3-Parameter Weibull 5 3906798 106514 3698035 4115561 3-Parameter Lognormal 5 4210101 105981 4002381 4417820 2-Parameter Exponential 5 885034 6065.80 873224 897003 3-Parameter Loglogistic 5 4458070 101939 4258273 4657868 Smallest Extreme Value 5 3153751 157266 2845516 3461986 Normal 5 3772823 128332 3521298 4024349 Logistic 5 3952525 123849 3709786 4195264 Weibull 10 5026104 94855.0 4843588 5215497 Lognormal 10 5254804 64839.5 5129245 5383436 Exponential 10 777416 12831.4 752669 802976 Loglogistic 10 5412502 76649.2 5264338 5564836
46

3-Parameter Weibull 10 5258407 98948.7 5064471 5452342 3-Parameter Lognormal 10 5484542 96058.3 5296271 5672813 2-Parameter Exponential 10 1269863 12459.6 1245676 1294520 3-Parameter Loglogistic 10 5789384 91208.1 5610620 5968149 Smallest Extreme Value 10 5459583 134205 5196546 5722620 Normal 10 5329598 113490 5107161 5552035 Logistic 10 5695582 107216 5485442 5905723 Weibull 50 10561948 97536.3 10372500 10754856 Lognormal 50 9722440 93302.1 9541280 9907039 Exponential 50 5114474 84415.4 4951671 5282631 Loglogistic 50 9722440 90193.1 9547262 9900832 3-Parameter Weibull 50 10699451 95797.0 10511693 10887210 3-Parameter Lognormal 50 10516295 87065.2 10345651 10686940 2-Parameter Exponential 50 5453500 81969.6 5295186 5616547 3-Parameter Loglogistic 50 10381612 85858.4 10213332 10549891 Smallest Extreme Value 50 11494153 79320.7 11338687 11649619 Normal 50 10821138 85650.0 10653267 10989009 Logistic 50 10821138 86943.3 10650732 10991544 Table of MTTF Standard 95% Normal CI Distribution Mean Error Lower Upper Weibull 10831917 91120 10654789 11011989 Lognormal 10910138 109394 10697823 11126668 Exponential 7378627 121786 7143751 7621225 Loglogistic 10959323 106373 10752807 11169806 3-Parameter Weibull 10773233 85452 10605750 10940717 3-Parameter Lognormal 10807609 86660 10637760 10977459 2-Parameter Exponential 7637559 118257 7409261 7872892 3-Parameter Loglogistic 10800025 88761 10626056 10973993 Smallest Extreme Value 10819207 84738 10653124 10985290 Normal 10821138 85650 10653267 10989009 Logistic 10821138 86943 10650732 10991544 Distribution Overview Plot: Hour/Year Using frequencies in Accidents per year Goodness-of-Fit Anderson-Darling Correlation Distribution (adj) Coefficient Weibull 47.017 0.970
47

Reliability Distribution Analysis of Tip-Over Accidents
Distribution ID Plot: Hour/Year Using frequencies in Tip-Over Accidents Goodness-of-Fit Anderson-Darling Correlation Distribution (adj) Coefficient Weibull 7.437 0.959 Lognormal 9.302 0.914 Exponential 130.787 * Loglogistic 7.725 0.924 3-Parameter Weibull 10.245 0.971 3-Parameter Lognormal 7.479 0.976 2-Parameter Exponential 121.377 * 3-Parameter Loglogistic 8.501 0.971 Smallest Extreme Value 32.644 0.928 Normal 9.314 0.973 Logistic 11.414 0.966 Table of Percentiles Standard 95% Normal CI Distribution Percent Percentile Error Lower Upper Weibull 1 2095153 170892 1785611 2458354 Lognormal 1 3279601 139339 3017564 3564393 Exponential 1 71754.6 3144.00 65849.6 78189.0 Loglogistic 1 2928000 177630 2599754 3297692 3-Parameter Weibull 1 1787644 437099 930947 2644341 3-Parameter Lognormal 1 2141055 339842 1474976 2807134 2-Parameter Exponential 1 589042 3048.02 583098 595046 3-Parameter Loglogistic 1 1817684 339816 1151657 2483712 Smallest Extreme Value 1 -1559331 489008 -2517769 -600893 Normal 1 1158651 394878 384704 1932598 Logistic 1 344344 428738 -495967 1184655 Weibull 5 3852701 218707 3447030 4306114 Lognormal 5 4469332 154211 4177077 4782036 Exponential 5 366210 16045.8 336073 399049 Loglogistic 5 4457561 193193 4094546 4852761 3-Parameter Weibull 5 3988430 297271 3405790 4571071 3-Parameter Lognormal 5 4259045 268171 3733440 4784651 2-Parameter Exponential 5 872578 15556.0 842615 903606 3-Parameter Loglogistic 5 4409676 260703 3898707 4920644 Smallest Extreme Value 5 3277313 368992 2554103 4000523 Normal 5 3862268 316129 3242667 4481869 Logistic 5 3952172 309165 3346221 4558123 Weibull 10 5041931 233019 4605297 5519963 Lognormal 10 5271113 162392 4962249 5599201 Exponential 10 752224 32959.4 690320 819678 Loglogistic 10 5391648 195114 5022478 5787954 3-Parameter Weibull 10 5322909 256834 4819523 5826295 3-Parameter Lognormal 10 5460773 240436 4989528 5932019 2-Parameter Exponential 10 1244278 31953.2 1183201 1308508 3-Parameter Loglogistic 10 5711023 230527 5259198 6162848 Smallest Extreme Value 10 5413294 317505 4790996 6035593 Normal 10 5303556 279180 4756373 5850739
48
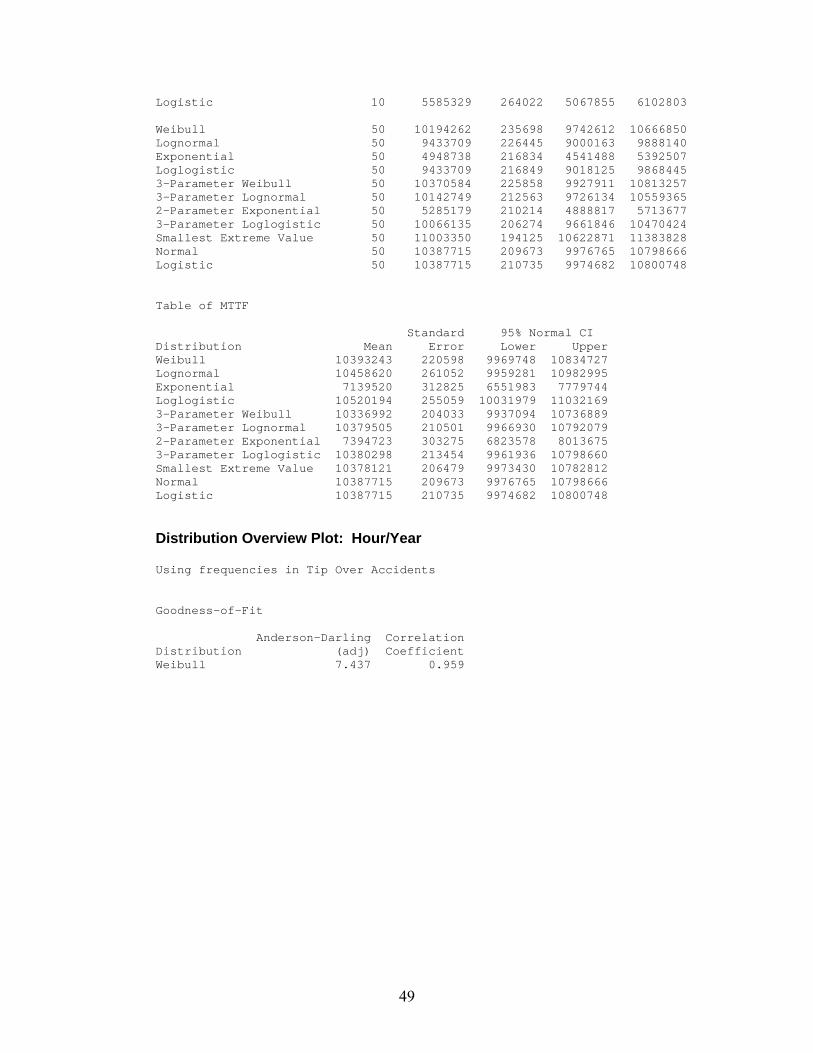
Logistic 10 5585329 264022 5067855 6102803 Weibull 50 10194262 235698 9742612 10666850 Lognormal 50 9433709 226445 9000163 9888140 Exponential 50 4948738 216834 4541488 5392507 Loglogistic 50 9433709 216849 9018125 9868445 3-Parameter Weibull 50 10370584 225858 9927911 10813257 3-Parameter Lognormal 50 10142749 212563 9726134 10559365 2-Parameter Exponential 50 5285179 210214 4888817 5713677 3-Parameter Loglogistic 50 10066135 206274 9661846 10470424 Smallest Extreme Value 50 11003350 194125 10622871 11383828 Normal 50 10387715 209673 9976765 10798666 Logistic 50 10387715 210735 9974682 10800748 Table of MTTF Standard 95% Normal CI Distribution Mean Error Lower Upper Weibull 10393243 220598 9969748 10834727 Lognormal 10458620 261052 9959281 10982995 Exponential 7139520 312825 6551983 7779744 Loglogistic 10520194 255059 10031979 11032169 3-Parameter Weibull 10336992 204033 9937094 10736889 3-Parameter Lognormal 10379505 210501 9966930 10792079 2-Parameter Exponential 7394723 303275 6823578 8013675 3-Parameter Loglogistic 10380298 213454 9961936 10798660 Smallest Extreme Value 10378121 206479 9973430 10782812 Normal 10387715 209673 9976765 10798666 Logistic 10387715 210735 9974682 10800748 Distribution Overview Plot: Hour/Year Using frequencies in Tip Over Accidents Goodness-of-Fit Anderson-Darling Correlation Distribution (adj) Coefficient Weibull 7.437 0.959
49

Reliability Distribution Analysis of Off the Dock Accidents
Distribution ID Plot: Hour/Year Using frequencies in Off the dock accidents Goodness-of-Fit Anderson-Darling Correlation Distribution (adj) Coefficient Weibull 3.478 0.973 Lognormal 5.931 0.922 Exponential 57.931 * Loglogistic 5.157 0.928 3-Parameter Weibull 4.102 0.981 3-Parameter Lognormal 3.909 0.976 2-Parameter Exponential 52.662 * 3-Parameter Loglogistic 4.689 0.968 Smallest Extreme Value 17.032 0.934 Normal 4.997 0.973 Logistic 6.548 0.962 Table of Percentiles Standard 95% Normal CI Distribution Percent Percentile Error Lower Upper Weibull 1 1458809 210593 1099308 1935876 Lognormal 1 2554249 177971 2228202 2928006 Exponential 1 75342.1 4503.57 67012.7 84706.8 Loglogistic 1 2229262 223788 1831099 2714003 3-Parameter Weibull 1 1136515 581646 -3490.62 2276521 3-Parameter Lognormal 1 1164062 517318 150139 2177986 2-Parameter Exponential 1 592603 4374.57 584091 601239 3-Parameter Loglogistic 1 916570 533169 -128422 1961561 Smallest Extreme Value 1 -3509187 815090 -5106733 -1911641 Normal 1 -211467 615609 -1418039 995106 Logistic 1 -1144336 660299 -2438498 149826 Weibull 5 3070439 304139 2528633 3728338 Lognormal 5 3715267 209604 3326348 4149658 Exponential 5 384519 22984.6 342009 432313 Loglogistic 5 3706258 267899 3216684 4270344 3-Parameter Weibull 5 3179042 397414 2400124 3957960 3-Parameter Lognormal 5 3464187 399214 2681741 4246633 2-Parameter Exponential 5 890752 22326.2 848051 935603 3-Parameter Loglogistic 5 3652709 396118 2876332 4429087 Smallest Extreme Value 5 2155515 605691 968382 3342647 Normal 5 2923582 492314 1958664 3888499 Logistic 5 3035124 480751 2092869 3977379 Weibull 10 4265152 340062 3648111 4986560 Lognormal 10 4536689 228015 4111095 5006342 Exponential 10 789833 47212.2 702514 888006 Loglogistic 10 4665237 282645 4142890 5253442 3-Parameter Weibull 10 4535971 362377 3825726 5246217 3-Parameter Lognormal 10 4793253 358734 4090147 5496360 2-Parameter Exponential 10 1281609 45859.8 1194805 1374719 3-Parameter Loglogistic 10 5070215 349706 4384802 5755627 Smallest Extreme Value 10 4657187 515968 3645908 5668466 Normal 10 4594864 434408 3743441 5446288
50
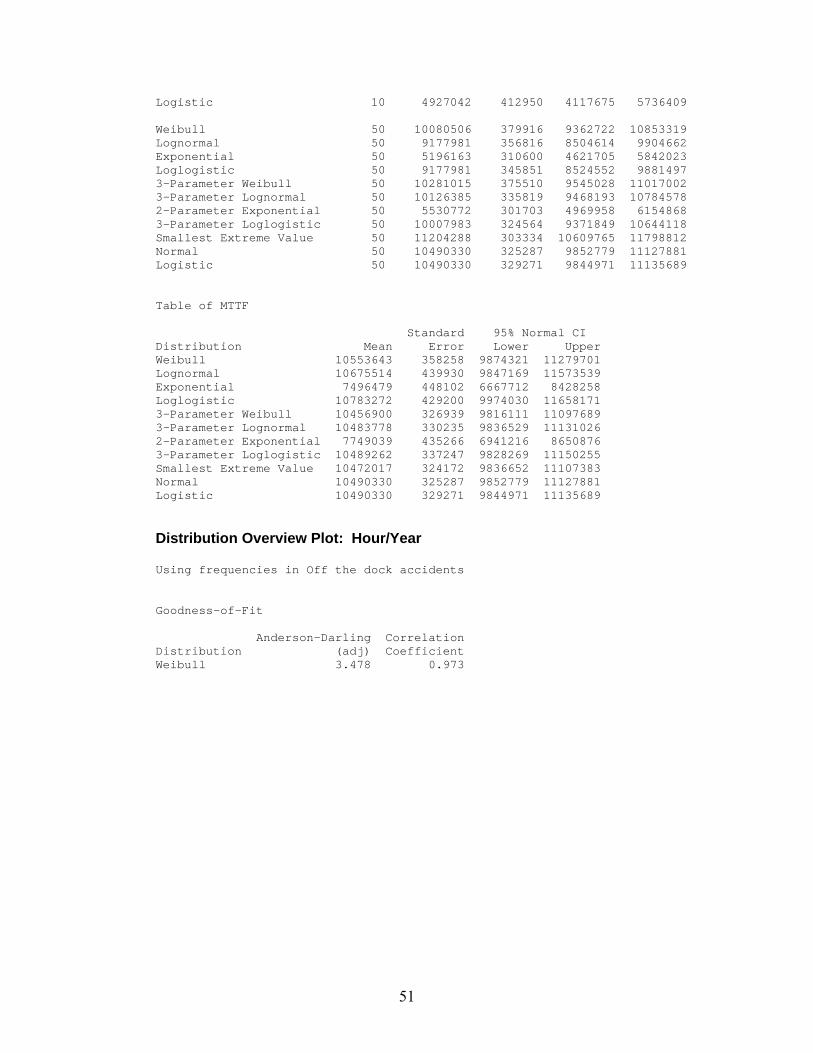
Logistic 10 4927042 412950 4117675 5736409 Weibull 50 10080506 379916 9362722 10853319 Lognormal 50 9177981 356816 8504614 9904662 Exponential 50 5196163 310600 4621705 5842023 Loglogistic 50 9177981 345851 8524552 9881497 3-Parameter Weibull 50 10281015 375510 9545028 11017002 3-Parameter Lognormal 50 10126385 335819 9468193 10784578 2-Parameter Exponential 50 5530772 301703 4969958 6154868 3-Parameter Loglogistic 50 10007983 324564 9371849 10644118 Smallest Extreme Value 50 11204288 303334 10609765 11798812 Normal 50 10490330 325287 9852779 11127881 Logistic 50 10490330 329271 9844971 11135689 Table of MTTF Standard 95% Normal CI Distribution Mean Error Lower Upper Weibull 10553643 358258 9874321 11279701 Lognormal 10675514 439930 9847169 11573539 Exponential 7496479 448102 6667712 8428258 Loglogistic 10783272 429200 9974030 11658171 3-Parameter Weibull 10456900 326939 9816111 11097689 3-Parameter Lognormal 10483778 330235 9836529 11131026 2-Parameter Exponential 7749039 435266 6941216 8650876 3-Parameter Loglogistic 10489262 337247 9828269 11150255 Smallest Extreme Value 10472017 324172 9836652 11107383 Normal 10490330 325287 9852779 11127881 Logistic 10490330 329271 9844971 11135689 Distribution Overview Plot: Hour/Year Using frequencies in Off the dock accidents Goodness-of-Fit Anderson-Darling Correlation Distribution (adj) Coefficient Weibull 3.478 0.973
51

Reliability Distribution Analysis of Forks Trailing Collisions
Distribution ID Plot: Hour/Year Using frequencies in Forks Trailing Collisions Goodness-of-Fit Anderson-Darling Correlation Distribution (adj) Coefficient Weibull 22.755 0.969 Lognormal 30.645 0.922 Exponential 396.539 * Loglogistic 26.980 0.928 3-Parameter Weibull 28.775 0.976 3-Parameter Lognormal 25.413 0.974 2-Parameter Exponential 366.045 * 3-Parameter Loglogistic 31.119 0.964 Smallest Extreme Value 108.018 0.928 Normal 31.922 0.970 Logistic 43.116 0.958 Table of Percentiles Standard 95% Normal CI Distribution Percent Percentile Error Lower Upper Weibull 1 1920798 95932.7 1741683 2118333 Lognormal 1 3095495 78609.3 2945195 3253465 Exponential 1 73915.7 1800.01 70470.6 77529.2 Loglogistic 1 2768181 97137.7 2584195 2965268 3-Parameter Weibull 1 1704508 213947 1285180 2123836 3-Parameter Lognormal 1 1910632 192438 1533460 2287804 2-Parameter Exponential 1 591232 1747.68 587816 594667 3-Parameter Loglogistic 1 1754250 195754 1370579 2137920 Smallest Extreme Value 1 -2206936 308816 -2812204 -1601668 Normal 1 723003 235800 260844 1185163 Logistic 1 -54179.8 248957 -542127 433767 Weibull 5 3685425 127552 3443719 3944095 Lognormal 5 4312198 88854.2 4141517 4489914 Exponential 5 377239 9186.62 359656 395681 Loglogistic 5 4326843 109417 4117618 4546699 3-Parameter Weibull 5 3805500 156553 3498662 4112338 3-Parameter Lognormal 5 4112019 154733 3808747 4415290 2-Parameter Exponential 5 883753 8919.53 866443 901409 3-Parameter Loglogistic 5 4338669 149971 4044731 4632608 Smallest Extreme Value 5 3024820 230576 2572899 3476741 Normal 5 3648507 189089 3277899 4019114 Logistic 5 3812400 182296 3455105 4169694 Weibull 10 4914393 137981 4651262 5192409 Lognormal 10 5145740 94607.6 4963614 5334549 Exponential 10 774879 18870.0 738763 812760 Loglogistic 10 5296374 112576 5080262 5521678 3-Parameter Weibull 10 5149714 144762 4865986 5433442 3-Parameter Lognormal 10 5375524 140290 5100561 5650487 2-Parameter Exponential 10 1267233 18321.4 1231828 1303656 3-Parameter Loglogistic 10 5669171 133831 5406867 5931475 Smallest Extreme Value 10 5335293 197015 4949151 5721435 Normal 10 5208082 167206 4880363 5535800 Logistic 10 5562686 157397 5254194 5871178
52

Weibull 50 10436621 143658 10158821 10722018 Lognormal 50 9598011 137198 9332839 9870717 Exponential 50 5097783 124142 4860183 5346998 Loglogistic 50 9598011 132159 9342447 9860566 3-Parameter Weibull 50 10580504 140904 10304338 10856670 3-Parameter Lognormal 50 10390663 128311 10139177 10642148 2-Parameter Exponential 50 5436199 120533 5205018 5677648 3-Parameter Loglogistic 50 10266610 125718 10020207 10513012 Smallest Extreme Value 50 11382008 117002 11152689 11611327 Normal 50 10709497 126149 10462250 10956745 Logistic 50 10709497 127864 10458889 10960106 Table of MTTF Standard 95% Normal CI Distribution Mean Error Lower Upper Weibull 10721490 134293 10461485 10987957 Lognormal 10803429 161544 10491403 11124734 Exponential 7354546 179100 7011762 7714087 Loglogistic 10859415 157090 10555848 11171712 3-Parameter Weibull 10660643 125664 10414346 10906939 3-Parameter Lognormal 10695886 127651 10445695 10946077 2-Parameter Exponential 7612599 173893 7279293 7961167 3-Parameter Loglogistic 10690656 130487 10434907 10946405 Smallest Extreme Value 10705703 124924 10460856 10950551 Normal 10709497 126149 10462250 10956745 Logistic 10709497 127864 10458889 10960106 Distribution Overview Plot: Hour/Year Using frequencies in Forks Trailing Collisions Goodness-of-Fit Anderson-Darling Correlation Distribution (adj) Coefficient Weibull 22.755 0.969
53

Reliability Distribution Analysis of Forks Trailing Collisions with Left Leg Injuries
Distribution ID Plot: Hour/Year Using frequencies in Forks Trailing Collisions with left leg injuries Goodness-of-Fit Anderson-Darling Correlation Distribution (adj) Coefficient Weibull 13.503 0.967 Lognormal 15.797 0.927 Exponential 162.527 * Loglogistic 13.146 0.933 3-Parameter Weibull 16.133 0.970 3-Parameter Lognormal 13.057 0.970 2-Parameter Exponential 143.685 * 3-Parameter Loglogistic 13.695 0.964 Smallest Extreme Value 61.052 0.914 Normal 17.816 0.964 Logistic 20.915 0.955 Table of Percentiles Standard 95% Normal CI Distribution Percent Percentile Error Lower Upper Weibull 1 1790167 130060 1552572 2064124 Lognormal 1 2875674 113316 2661939 3106570 Exponential 1 71534.2 2674.33 66480.1 76972.6 Loglogistic 1 2558416 141487 2295608 2851312 3-Parameter Weibull 1 1602863 298600 1017617 2188109 3-Parameter Lognormal 1 1839167 270236 1309513 2368820 2-Parameter Exponential 1 773866 2566.03 768853 778912 3-Parameter Loglogistic 1 1579684 289017 1013221 2146147 Smallest Extreme Value 1 -2436003 434823 -3288240 -1583767 Normal 1 356378 349505 -328640 1041396 Logistic 1 -472609 375901 -1209361 264143 Weibull 5 3451110 175505 3123714 3812820 Lognormal 5 4024132 128422 3780139 4283874 Exponential 5 365085 13648.8 339290 392841 Loglogistic 5 4028638 159239 3728319 4353149 3-Parameter Weibull 5 3521903 220944 3088861 3954945 3-Parameter Lognormal 5 3826565 216557 3402121 4251010 2-Parameter Exponential 5 1052653 13096.1 1027296 1078637 3-Parameter Loglogistic 5 3981306 217782 3554460 4408151 Smallest Extreme Value 5 2658071 329373 2012511 3303631 Normal 5 3223740 280540 2673892 3773589 Logistic 5 3341285 270061 2811975 3870594 Weibull 10 4611589 191742 4250686 5003134 Lognormal 10 4813582 136874 4552653 5089466 Exponential 10 749914 28035.8 696929 806926 Loglogistic 10 4947878 163335 4637884 5278592 3-Parameter Weibull 10 4774514 204349 4373998 5175030 3-Parameter Lognormal 10 4989366 197544 4602187 5376544 2-Parameter Exponential 10 1418128 26900.5 1366372 1471844 3-Parameter Loglogistic 10 5236916 192735 4859163 5614669 Smallest Extreme Value 10 4907740 284043 4351026 5464454
54

Normal 10 4752321 248260 4265739 5238902 Logistic 10 5067721 230720 4615519 5519924 Weibull 50 9847382 207987 9448056 10263585 Lognormal 50 9055137 199273 8672872 9454251 Exponential 50 4933542 184442 4584968 5308616 Loglogistic 50 9055137 189634 8690985 9434547 3-Parameter Weibull 50 9962447 206533 9557650 10367244 3-Parameter Lognormal 50 9751241 190575 9377721 10124761 2-Parameter Exponential 50 5391350 176973 5055412 5749612 3-Parameter Loglogistic 50 9662358 182236 9305183 10019533 Smallest Extreme Value 50 10795326 174566 10453182 11137469 Normal 50 10144402 187788 9776344 10512461 Logistic 50 10144402 189502 9772986 10515819 Table of MTTF Standard 95% Normal CI Distribution Mean Error Lower Upper Weibull 10125189 194426 9751202 10513519 Lognormal 10225552 235918 9773460 10698557 Exponential 7117597 266094 6614711 7658714 Loglogistic 10288636 229825 9847905 10749092 3-Parameter Weibull 10082260 185237 9719201 10445319 3-Parameter Lognormal 10126362 190000 9753969 10498754 2-Parameter Exponential 7465563 255318 6981551 7983130 3-Parameter Loglogistic 10127906 193778 9748107 10507704 Smallest Extreme Value 10136819 185653 9772946 10500692 Normal 10144402 187788 9776344 10512461 Logistic 10144402 189502 9772986 10515819 Distribution Overview Plot: Hour/Year Using frequencies in Forks Trailing Collisions with left leg injuries Goodness-of-Fit Anderson-Darling Correlation Distribution (adj) Coefficient Weibull 13.503 0.967
55

APPENDIX B
STANDUP FORKLIFT TRUCK PICTURES
Figure B.1: Side-stance stand-up forklift truck
56

Figure B.2: Hit by racks
57

Figure B.3: Hits on step
58

APPENDIX C
STANDUP FORKLIFT TRUCKS DATA
Table C.1.a: Standup electric forklifts prior to 2002
Source: Lambert Coffin
59

Table C.1.b: Standup electric forklifts prior to 2002
Source: Lambert Coffin
60

Table C.2.a: Latest standup forklifts
61

Table C.2.b: Latest standup forklifts
62

REFERENCES
1. Peder A. Anderson “Industry & Trade Summary: Forklift Trucks and Related
Vehicles” USITC Publication 2954, April 1996.
2. American Society of Mechanical Engineers “Safety Standard for Low Lift and
High Lift Trucks” ASME B56.1-2000.
3. Occupational Safety and Health Standard (OSHA) “Powered Industrial Trucks”
1910.178.
4. Jennifer D. Crockett and David A. Miller “Stand-Up Rider fork Lift Truck
Operator Safety” SERA-Vol. 4, Safety Engineering and Risk Analysis, ASME
1995.
5. Crown Stand-Up Forklift Accident Data.
6. Mohamad Zoghi-Moghadam, Charles B. Watkins, Ali Sadegh and Dan Dunlap “
Simulation of Stand-Up Lift Truck Accidents To Evaluate Their Design And
Operator Training Implications” Proceedings of IMECE2002, ASME
International Mechanical engineering congress & Exposition, November 17-22,
2002.
7. Gerald F. Harris and John DeRosia “Dynamic Postural Stability testing During
Standup Forklift (Lift Truck) Operation” Proceedings of IMECE’03, 2003 ASME
International Mechanical Engineering Congress, November 15-21, 2003.
8. Fred H. Carlin and Anthony Sances, Jr. “Fork Lift Overturns and Head injury”
Proceedings of the 22nd Annual EMBS International Conference, July 23-28,
2000, Chicago, IL.
63

9. Roger L. McCarthy, Robert K. Taylor, Garrison Kost, Neil J. Robinson Christine
T. Wood “ Comparative Analysis of Industrial Lift Truck (Forklift) accidents”
Proceedings of American Society of Mechanical Engineers, Winter Annual
Meeting, Dallas, TX, November 1990.
10. K.H.E. Kroemer, H.B. Kroemer, K.E. Kroemer-Elbert “Ergonomics: How to
Design for Ease and Efficiency” Prentice Hall, New Jersey 07632.
11. Biman Das and Arijit K. Sengupta “Industrial Workstation Design: A Systematic
Ergonomics Approach” Applied Ergonomics, Vol 27, No.3, pp. 157-163, 1996.
12. SAE Standard “Human Physical Dimensions” SAE J833, May 1989.
13. SAE standard “Operator Space Envelope Dimensions for Off-Road Machines”
SAE J54, June 1992.
14. O.J.Hahn “Benchmarking Guide” Office of Nuclear Business Leadership Process
Optimization and Benchmarking Team.
15. http://www.bls.gov/iif/osheval.htm, US Department of Labor, Bureau of Labor
Statistics: Injuries, Illness, Fatalities.
16. John P. Bentley “An Introduction to Reliability & Quality Engineering” John
Wiley & Sons, Inc, New York, 1993.
17. Lawrence M. Leemis “Reliability: Probabilistic Models and Statistical Methods”
Prentice-Hall, New Jersey 07458.
18. MINITAB Help Documentation.
64

VITA
Date and Place of Birth
January 16th, 1980 at Hyderabad, India
Education
Bachelor of Engineering from Vasavi College of Engineering affiliated to
Osmania University, India (2002)
Work Experience
Teaching Assistant at University of Kentucky, Department of Mechanical
Engineering (October 2002 – May 2003)
Activities
Student member, American Society of Mechanical Engineers (ASME)
Member, Child Relief and Youth (CRY)
65