fairmont subdivision baton rouge home sales update 2014
DESCRIPTION
Fairmont Subdivision Baton Rouge Home Sales Update 2014 Full Blog Post: http://activerain.trulia.com/blogsview/4538296/fairmont-subdivision-baton-rouge-appraiser-home-sales-update-2014 Published by Bill Cobb, Greater Baton Rouge's Home Appraiser 225-293-1500 http://www.homeappraisalsbatonrouge.com Based on information from Greater Baton Rouge Association of REALTORS®\MLS for period 07/01/2011 to 09/30/2014, extracted on 10/26/2014.TRANSCRIPT

FAIRMONT
SUBDIVISION
BATON
ROUGE HOME
SALES
Q3 2011 VS
Q3 2014
Based on information from
Greater Baton Rouge
Association of REALTORS®\MLS
for period Q3 2011 to Q3 2014,
extracted on 10/26/2014.


GREATER BATON ROUGE HOME SALES REPORT BY BILL COBB, GREATER
BATON ROUGE’S HOME APPRAISER
225-293-1500
HTTP://WWW.BATONROUGEHOUSINGREPORTS.COM
HTTP://WWW.BATONROUGEREALESTATEAPPRAISAL.COM

Q3-2014143,000
Q3-20110
%N/A
Change143,000
Q3-2011 vs Q3-2014: The median sold price : The percent change calculation is N/AMedian Sold Price by quarter
Accurate Valuations Group
Q3-2011 vs. Q3-2014
William Cobb
Clarus MarketMetrics® 10/26/2014Information not guaranteed. © 2014 - 2015 Terradatum and its suppliers and licensors (www.terradatum.com/about/partners).
1/2
MLS: GBRAR Bedrooms:AllAll
Construction Type:All3 Year Quarterly SqFt:
Bathrooms: Lot Size:All All Square FootagePeriod:All
Subdivision:Property Types: : Residential
FairmontPrice:

Median Sold Price by quarterQ3-2011 vs Q3-2014: The median sold price : The percent change calculation is N/A
Accurate Valuations GroupWilliam Cobb
Sold Median Price Units Avg DOMTime Period
Q3 2014 143,000 2 141
Q2 2014 144,500 2 44
Q1 2014 145,500 1 169
Q4 2013 0Q3 2013 144,000 1 39
Q2 2013 157,750 2 56
Q1 2013 98,250 2 112
Q4 2012 0Q3 2012 205,000 1 311
Q2 2012 91,000 1 345
Q1 2012 150,000 1 184
Q4 2011 142,500 1 60
Q3 2011 0
Clarus MarketMetrics® 10/26/2014Information not guaranteed. © 2014 - 2015 Terradatum and its suppliers and licensors (www.terradatum.com/about/partners).
22/

Q3-20142
Q3-20110
%N/A
Change2
Q3-2011 vs Q3-2014: The number of Sold properties : The percent change calculation is N/ASold Properties by quarter
Accurate Valuations Group
Q3-2011 vs. Q3-2014
William Cobb
Clarus MarketMetrics® 10/26/2014Information not guaranteed. © 2014 - 2015 Terradatum and its suppliers and licensors (www.terradatum.com/about/partners).
1/2
MLS: GBRAR Bedrooms:AllAll
Construction Type:All3 Year Quarterly SqFt:
Bathrooms: Lot Size:All All Square FootagePeriod:All
Subdivision:Property Types: : Residential
FairmontPrice:

Sold Properties by quarterQ3-2011 vs Q3-2014: The number of Sold properties : The percent change calculation is N/A
Accurate Valuations GroupWilliam Cobb
Time Period
Full Market
Units Median Price Avg DOM
Bank Properties
Units % Bank Median Price
Non-Bank Properties
Units % Non-Bank Median Price
Q3 2014 143,0002 141 0 0.0 2 100.0 143,000
Q2 2014 144,5002 44 0 0.0 2 100.0 144,500
Q1 2014 145,5001 169 0 0.0 1 100.0 145,500
Q4 2013 0 0 0
Q3 2013 144,0001 39 0 0.0 1 100.0 144,000
Q2 2013 157,7502 56 0 0.0 2 100.0 157,750
Q1 2013 98,2502 112 1 50.0 80,000 1 50.0 116,500
Q4 2012 0 0 0
Q3 2012 205,0001 311 0 0.0 1 100.0 205,000
Q2 2012 91,0001 345 1 100.0 91,000 0 0.0
Q1 2012 150,0001 184 0 0.0 1 100.0 150,000
Q4 2011 142,5001 60 0 0.0 1 100.0 142,500
Q3 2011 0 0 0
Clarus MarketMetrics® 10/26/2014Information not guaranteed. © 2014 - 2015 Terradatum and its suppliers and licensors (www.terradatum.com/about/partners).
22/
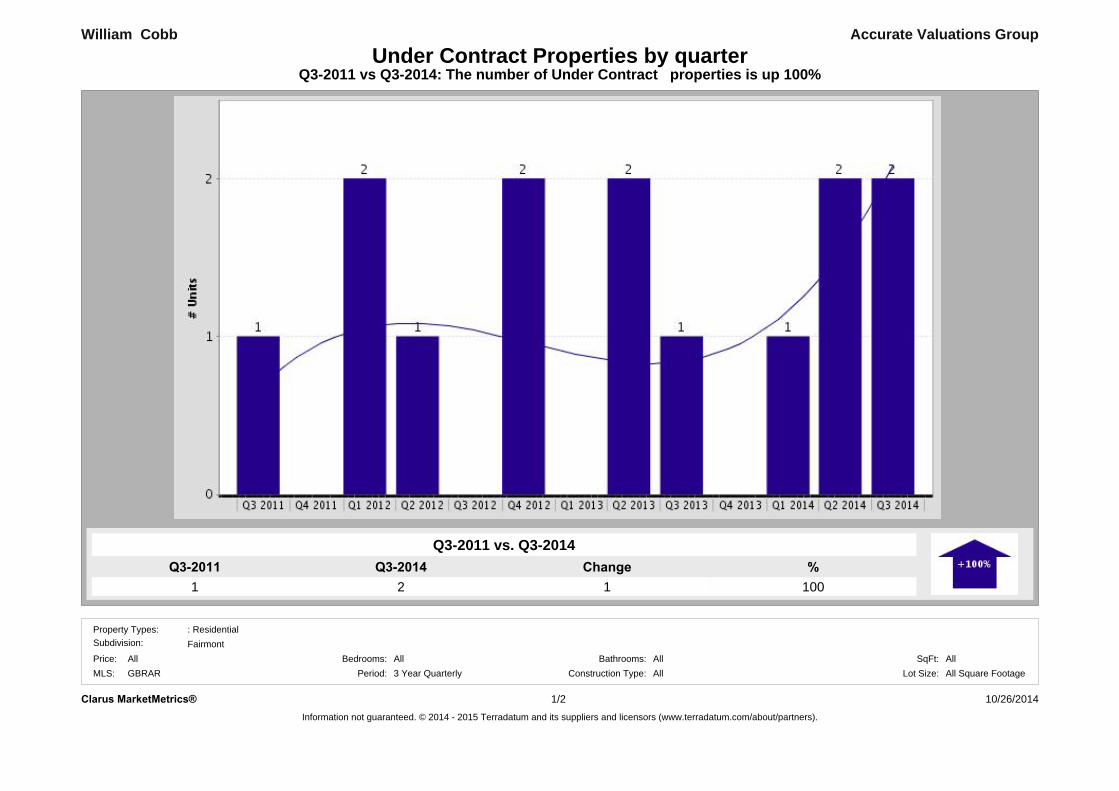
Q3-20142
Q3-20111
%100
Change1
Q3-2011 vs Q3-2014: The number of Under Contract properties is up 100%Under Contract Properties by quarter
Accurate Valuations Group
Q3-2011 vs. Q3-2014
William Cobb
Clarus MarketMetrics® 10/26/2014Information not guaranteed. © 2014 - 2015 Terradatum and its suppliers and licensors (www.terradatum.com/about/partners).
1/2
AllBathrooms: SqFt:All
: Residential
All Square FootageConstruction Type: Lot Size:GBRAR
Fairmont
Period: 3 Year QuarterlyPrice:MLS:
All AllAll
Property Types:
Bedrooms:
Subdivision:

Under Contract Properties by quarterQ3-2011 vs Q3-2014: The number of Under Contract properties is up 100%
Accurate Valuations GroupWilliam Cobb
Median Price UnitsUnits Median Price% Non-Bank
Full Market
% BankAvg DOMMedian Price
Bank Properties
Units
Non-Bank Properties
Time PeriodQ3 2014 146,9502 141 146,950100.020.00Q2 2014 146,4502 44 146,450100.020.00Q1 2014 149,0001 169 149,000100.010.00Q4 2013 0 00Q3 2013 149,5001 39 149,500100.010.00Q2 2013 161,4502 56 161,450100.020.00Q1 2013 0 00Q4 2012 109,9002 112 119,90050.0199,90050.01Q3 2012 0 00Q2 2012 207,0001 311 207,000100.010.00Q1 2012 122,4502 264 154,90050.0190,00050.01Q4 2011 0 00Q3 2011 150,0001 60 150,000100.010.00
Clarus MarketMetrics® 10/26/2014Information not guaranteed. © 2014 - 2015 Terradatum and its suppliers and licensors (www.terradatum.com/about/partners).
22/

Q3-20141
Q3-20110
%N/A
Change1
Q3-2011 vs Q3-2014: The number of Expired properties : The percent change calculation is N/AExpired Properties by quarter
Accurate Valuations Group
Q3-2011 vs. Q3-2014
William Cobb
10/26/2014Clarus MarketMetrics® 1/2
MLS: GBRAR Bedrooms:AllAll
Construction Type:All3 Year Quarterly SqFt:
Bathrooms: Lot Size:All All Square FootagePeriod:All
Subdivision:Property Types: : Residential
FairmontPrice:

Expired Properties by quarterQ3-2011 vs Q3-2014: The number of Expired properties : The percent change calculation is N/A
Accurate Valuations GroupWilliam Cobb
Median Price Units% BankAvg DOMUnits Median Price
Bank Properties
Units
Non-Bank Properties
% Non-Bank Median Price
Full Market
Q3 2014 135,0001 178 0 0.0 1 100.0 135,000Q2 2014 0 0 0Q1 2014 0 0 0Q4 2013 0 0 0Q3 2013 139,2002 215 0 0.0 2 100.0 139,200Q2 2013 134,9003 143 2 66.7 133,700 1 33.3 145,000Q1 2013 145,4502 123 0 0.0 2 100.0 145,450Q4 2012 129,0001 183 0 0.0 1 100.0 129,000Q3 2012 142,5001 179 0 0.0 1 100.0 142,500Q2 2012 145,5001 183 0 0.0 1 100.0 145,500Q1 2012 185,0003 97 0 0.0 3 100.0 185,000Q4 2011 0 0 0Q3 2011 0 0 0
Clarus MarketMetrics® 10/26/2014Information not guaranteed. © 2014 - 2015 Terradatum and its suppliers and licensors (www.terradatum.com/about/partners).
22/

Q3-2014141
Q3-201160
%135
Change81
Q3-2011 vs Q3-2014: The average days on market is up 135%The Average Days on Market by quarter
Accurate Valuations Group
Q3-2011 vs. Q3-2014
William Cobb
FairmontAll 3 Year Quarterly
Subdivision:Period:Price:
Property Types: : Residential
10/26/20141/2Clarus MarketMetrics®
All Square FootageBedrooms: All AllSqFt:
All Lot Size:Bathrooms:AllConstruction Type:MLS: GBRAR

The Average Days on Market by quarterQ3-2011 vs Q3-2014: The average days on market is up 135%
Accurate Valuations GroupWilliam Cobb
# UC UnitsAvg DOMTime PeriodQ3 2014 2141Q2 2014 244Q1 2014 1169Q4 2013 0Q3 2013 139Q2 2013 256Q1 2013 0Q4 2012 2112Q3 2012 0Q2 2012 1311Q1 2012 2264Q4 2011 0Q3 2011 160
Clarus MarketMetrics® 2/2 10/26/2014Information not guaranteed. © 2014 - 2015 Terradatum and its suppliers and licensors (www.terradatum.com/about/partners).

Q3-20145
Q3-20115
%0
Change0
Q3-2011 vs Q3-2014: The number of For Sale properties has not changedFor Sale Properties by quarter
Accurate Valuations Group
Q3-2011 vs. Q3-2014
William Cobb
Clarus MarketMetrics® 10/26/2014Information not guaranteed. © 2014 - 2015 Terradatum and its suppliers and licensors (www.terradatum.com/about/partners).
1/2
MLS: GBRAR Bedrooms:AllAll
Construction Type:All3 Year Quarterly SqFt:
Bathrooms: Lot Size:All All Square FootagePeriod:All
Subdivision:Property Types: : Residential
FairmontPrice:

For Sale Properties by quarterQ3-2011 vs Q3-2014: The number of For Sale properties has not changed
Accurate Valuations GroupWilliam Cobb
Median Price UnitsUnits Median Price% Non-Bank
Full Market
% BankAvg DOMMedian Price
Bank Properties
Units
Non-Bank Properties
Time Period
Q3 2014 142,5005 127 0 0.0 5 100.0 142,500Q2 2014 144,4006 84 0 0.0 6 100.0 144,400Q1 2014 146,4504 102 0 0.0 4 100.0 146,450Q4 2013 149,0002 96 0 0.0 2 100.0 149,000Q3 2013 148,7504 134 0 0.0 4 100.0 148,750Q2 2013 146,4508 109 2 25.0 133,700 6 75.0 148,200Q1 2013 145,0009 85 2 22.2 133,700 7 77.8 146,000Q4 2012 131,9506 126 2 33.3 117,400 4 66.7 136,950Q3 2012 134,9005 101 1 20.0 134,900 4 80.0 135,750Q2 2012 138,7006 119 1 16.7 134,900 5 83.3 142,500Q1 2012 167,4008 159 1 12.5 90,000 7 87.5 179,900Q4 2011 169,9506 130 1 16.7 90,000 5 83.3 185,000Q3 2011 154,9005 72 1 20.0 90,000 4 80.0 172,450
Clarus MarketMetrics® 10/26/2014Information not guaranteed. © 2014 - 2015 Terradatum and its suppliers and licensors (www.terradatum.com/about/partners).
22/

Q3-20141
Q3-20113
%-67
Change-2
Q3-2011 vs Q3-2014: The number of New properties is down -67%New Properties by quarter
Accurate Valuations Group
Q3-2011 vs. Q3-2014
William Cobb
Clarus MarketMetrics® 10/26/2014Information not guaranteed. © 2014 - 2015 Terradatum and its suppliers and licensors (www.terradatum.com/about/partners).
1/2
MLS: GBRAR Bedrooms:AllAll
Construction Type:All3 Year Quarterly SqFt:
Bathrooms: Lot Size:All All Square FootagePeriod:All
Subdivision:Property Types: : Residential
FairmontPrice:

New Properties by quarterQ3-2011 vs Q3-2014: The number of New properties is down -67%
Accurate Valuations GroupWilliam Cobb
Median Price UnitsUnits Median Price% Non-Bank
Full Market
% BankMedian Price
Bank Properties
Units
Non-Bank Properties
Time PeriodQ3 2014 135,9001 0 0.0 1 100.0 135,900Q2 2014 144,9003 0 0.0 3 100.0 144,900Q1 2014 139,4502 0 0.0 2 100.0 139,450Q4 2013 149,0001 0 0.0 1 100.0 149,000Q3 2013 149,0001 0 0.0 1 100.0 149,000Q2 2013 149,5001 0 0.0 1 100.0 149,500Q1 2013 146,4506 1 16.7 132,500 5 83.3 147,900Q4 2012 122,9502 1 50.0 99,900 1 50.0 146,000Q3 2012 144,9001 0 0.0 1 100.0 144,900Q2 2012 129,0003 1 33.3 134,900 2 66.7 124,450Q1 2012 161,2002 0 0.0 2 100.0 161,200Q4 2011 165,2502 0 0.0 2 100.0 165,250Q3 2011 190,0003 0 0.0 3 100.0 190,000
Clarus MarketMetrics® 10/26/2014Information not guaranteed. © 2014 - 2015 Terradatum and its suppliers and licensors (www.terradatum.com/about/partners).
22/

Q3-2011 vs Q3-2014: The number of for sale properties has not changed and the number of sold properties : The percent change calculation is N/A
Accurate Valuations Group
Q3-2011 vs. Q3-2014
5 0
William Cobb
5Q3-2014
Supply & Demand by quarter
ChangeQ3-2011 %0
Q3-2011 Q3-2014 %0 N/A
Q3-2011 vs. Q3-2014
2Change
2
Clarus MarketMetrics® 10/26/2014Information not guaranteed. © 2014 - 2015 Terradatum and its suppliers and licensors (www.terradatum.com/about/partners).
1/2
MLS: GBRAR Bedrooms:AllAll
Construction Type:All3 Year Quarterly SqFt:
Bathrooms: Lot Size:All All Square FootagePeriod:All
Subdivision:Property Types: : Residential
FairmontPrice:

Supply & Demand by quarterQ3-2011 vs Q3-2014: The number of for sale properties has not changed and the number of sold properties : The percent change calculation is N/A
William Cobb Accurate Valuations Group
For Sale Sold# Properties
Avg DOM Avg DOM# Properties
Time Period
Q3 2014 127 1415 2Q2 2014 84 446 2Q1 2014 102 1694 1Q4 2013 962 0Q3 2013 134 394 1Q2 2013 109 568 2Q1 2013 85 1129 2Q4 2012 1266 0Q3 2012 101 3115 1Q2 2012 119 3456 1Q1 2012 159 1848 1Q4 2011 130 606 1Q3 2011 725 0
Clarus MarketMetrics® 10/26/2014Information not guaranteed. © 2014 - 2015 Terradatum and its suppliers and licensors (www.terradatum.com/about/partners).
22/

Q3-2011 vs Q3-2014: The median price of for sale properties is down -8% and the median price of sold properties : The percent change calculation is N/A
Accurate Valuations Group
Q3-2011 vs. Q3-2014
154,900 -8
William Cobb
142,500Q3-2014
Median For Sale vs Median Sold
ChangeQ3-2011 %-12,400
Q3-2011 Q3-2014 %0 N/A
Q3-2011 vs. Q3-2014
143,000Change143,000
Clarus MarketMetrics® 10/26/2014Information not guaranteed. © 2014 - 2015 Terradatum and its suppliers and licensors (www.terradatum.com/about/partners).
1/2
MLS: GBRAR Bedrooms:AllAll
Construction Type:All3 Year Quarterly SqFt:
Bathrooms: Lot Size:All All Square FootagePeriod:All
Subdivision:Property Types: : Residential
FairmontPrice:

Median For Sale vs Median SoldQ3-2011 vs Q3-2014: The median price of for sale properties is down -8% and the median price of sold properties : The percent change calculation is N/A
Accurate Valuations GroupWilliam Cobb
For SaleMedian SoldMedianFor Sale # Properties # PropertiesSold Price Difference
Time Period
Q3 2014 5 2142,500 143,000 500Q2 2014 6 2144,400 144,500 100Q1 2014 4 1146,450 145,500 -950Q4 2013 2 0149,000 -149,000Q3 2013 4 1148,750 144,000 -4,750Q2 2013 8 2146,450 157,750 11,300Q1 2013 9 2145,000 98,250 -46,750Q4 2012 6 0131,950 -131,950Q3 2012 5 1134,900 205,000 70,100Q2 2012 6 1138,700 91,000 -47,700Q1 2012 8 1167,400 150,000 -17,400Q4 2011 6 1169,950 142,500 -27,450Q3 2011 5 0154,900 -154,900
Clarus MarketMetrics®Information not guaranteed. © 2014 - 2015 Terradatum and its suppliers and licensors (www.terradatum.com/about/partners).
10/26/201422/