fairmount and unimin to create...
TRANSCRIPT
May 2018
Fairmount and Unimin to create Covia
A Compelling Strategic Transaction Creating a Leader
in Proppant and Industrial Materials Solutions
2
Disclaimer and Forward Looking Statements
CAUTIONARY STATEMENT REGARDING FORWARD-LOOKING INFORMATION
This presentation contains statements which, to the extent they are not statements of historical or present fact, constitute “forward-looking” statements within the
meaning of Section 21E of the Securities Exchange Act of 1934, as amended, and the Private Securities Litigation Reform Act of 1995. All forward-looking
statements involve risks and uncertainties that may cause actual results to differ materially from those expressed or implied in the forward-looking statements.
Important factors that could cause actual results to differ materially from those anticipated or implied in forward looking s tatements are described in the registration
statement on Form S-4 filed by Unimin Corporation (“Unimin”) under "Risk Factors," and in Fairmount Santrol’s Form 10-K under the heading “Cautionary Statement
Regarding Forward-Looking Information”, as well as the information included in Fairmount Santrol’s Current Reports on Form 8-K and other factors that are set forth
in management’s discussion and analysis of Fairmount Santrol’s most recently filed reports with the Securities and Exchange Commission (“SEC”). Additional
important factors that could cause actual results to differ materially from those indicated by forward-looking statements include risks and uncertainties relating to: the
proposed transaction (the “merger”) with Unimin not being timely completed, if completed at all; if the merger is completed, the impact of any undertakings required by
the parties in order to obtain regulatory approvals; prior to the completion of the merger, Unimin’s and/or Fairmount Santrol ’s respective businesses experiencing
disruptions due to transaction-related uncertainty or other factors making it more difficult to maintain relationships with employees, business partners or governmental
entities; the industry may be subject to future regulatory or legislative actions that could adversely affect Unimin’s and/or Fairmount Santrol’s respective businesses;
and the parties being unable to successfully implement integration strategies. While Unimin and/or Fairmount Santrol may elec t to update forward-looking statements
at some point in the future, Unimin and Fairmount Santrol specifically disclaim any obligation to do so, even if estimates change and, therefore, you should not rely on
these forward-looking statements as representing our views as of any date subsequent to today.
Additional Information
FAIRMOUNT SANTROL STOCKHOLDERS ARE ENCOURAGED TO READ THE PROXY STATEMENT, DATED APRIL 26, 2018, FOR THE SPECIAL MEETING
OF FAIRMOUNT SANTROL STOCKHOLDERS SCHEDULED TO BE HELD ON MAY 25, 2018 AS FILED WITH THE SEC ON SCHEDULE 14A AND THE UNIMIN
REGISTRATION STATEMENT AND ANY OTHER RELEVANT DOCUMENTS FILED WITH THE SEC, INCLUDING THE PROXY STATEMENT/PROSPECTUS
THAT IS PART OF THE REGISTRATION STATEMENT BECAUSE THEY CONTAIN IMPORTANT INFORMATION ABOUT THE MERGER. The final proxy
statement/prospectus will be mailed to stockholders of Fairmount Santrol. Investors and security holders will be able to obtain the documents free of charge at the
SEC’s website, www.sec.gov, or from Fairmount Santrol at its website, www.Fairmount Santrol.com.
Participants in Solicitation
Fairmount Santrol and its respective directors and executive officers may be deemed to be participants in the solicitation of proxies in respect of the merger.
Information concerning Fairmount Santrol’s participants is set forth in the proxy statement, dated April 6, 2017, for Fairmount Santrol’s 2017 Annual Meeting of
stockholders as filed with the SEC on Schedule 14A. Additional information regarding the interests of such participants in the solicitation of proxies in respect of the
merger is included in the registration statement and proxy statement/prospectus and other relevant materials filed with the SEC.
3
Disclaimer and Forward Looking Statements
Note on Combined Company Data
The combined company information included in this presentation has been prepared based on the arithmetic sum of the historical results of Fairmount Santrol and
Unimin, and was not prepared in accordance with Regulation S-X of the SEC’s rules for pro forma financial information, and you should therefore not place undue
reliance on this information. For a presentation of the combined company results for the year-ended December 31, 2017, on a pro forma basis, prepared in
accordance with the pro forma requirements of Regulation S-X, see Unimin’s Form S-4 which has been filed with the SEC.
Financial Forecasts
The information contained herein includes certain financial forecasts, statements, estimates and projections (collectively, t he “financial forecasts”) with respect to,
among other matters, anticipated future performance of Fairmount Santrol and Unimin and anticipated industry trends. These financial forecasts are inherently based
on various estimates and assumptions that are subject to the judgment of those preparing them. These financial forecasts are also subject to significant economic,
competitive, industry and other uncertainties and contingencies, all of which are difficult or impossible to predict and many of which are beyond the control of
Fairmount Santrol and Unimin. There can be no assurance that these financial forecasts will be realized or that actual result s will not be significantly higher or lower
than forecasted. The financial forecasts cover multiple years and become subject to greater uncertainty with each successive year. In addition, the financial forecasts
also reflect assumptions that are subject to change and do not reflect revised prospects for Fairmount Santrol’s and Unimin’s businesses, changes in general
business or economic conditions or any other transaction or event that has occurred or that may occur and that was not anticipated at the time the financial forecasts
were prepared. The financial forecasts were not prepared with a view toward public disclosure or toward complying with U.S. GAAP, the published guidelines of the
SEC regarding projections and the use of non-GAAP measures or the guidelines established by the American Institute of Certified Public Accountants for preparation
and presentation of prospective financial information. As a result, the inclusion of the financial forecasts in this document should not be relied on as necessarily
predictive of actual future events or results. None of Unimin, Fairmount Santrol or their respective affiliates, advisors, officers, directors or other representatives can
provide any assurance that actual results will not differ from the financial forecasts presented herein. None of Unimin, Fairmount Santrol or their respective affiliates,
advisors, officers, directors or representatives has made or makes any representation regarding the combined company’s ultimate performance compared to the
information contained in the financial forecasts or that forecast results will be achieved.

Section 1
Significant Value Delivered to
Fairmount ShareholdersCovia
5
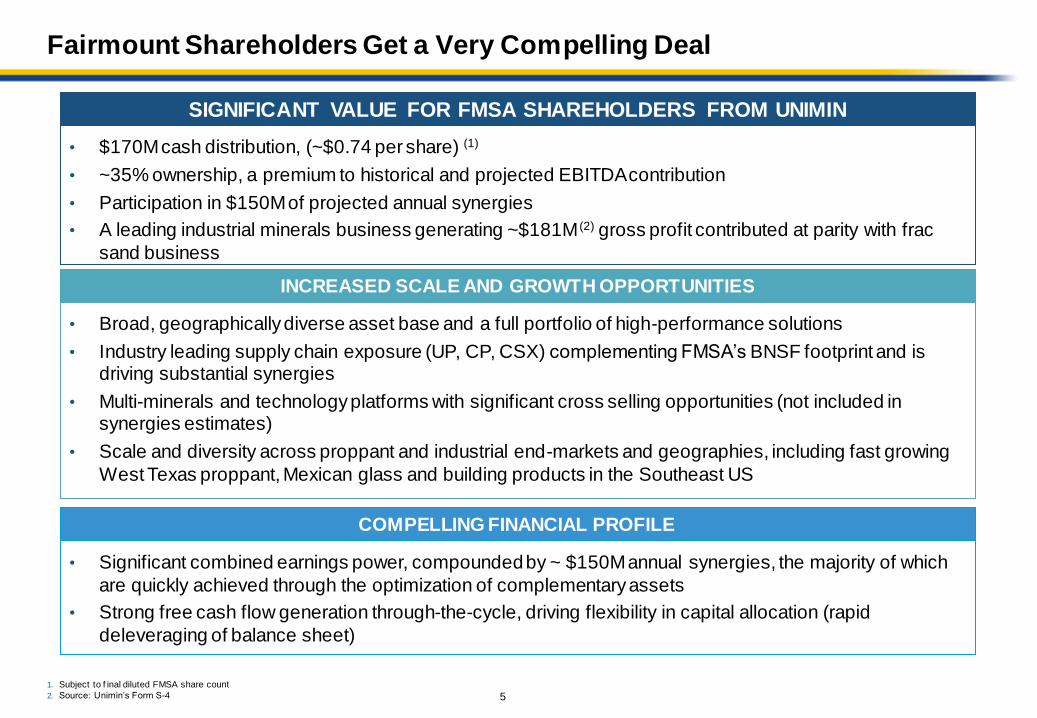
Fairmount Shareholders Get a Very Compelling Deal
1. Subject to f inal diluted FMSA share count
2. Source: Unimin’s Form S-4
INCREASED SCALE AND GROWTH OPPORTUNITIES
SIGNIFICANT VALUE FOR FMSA SHAREHOLDERS FROM UNIMIN
• $170M cash distribution, (~$0.74 per share) (1)
• ~35% ownership, a premium to historical and projected EBITDA contribution
• Participation in $150M of projected annual synergies
• A leading industrial minerals business generating ~$181M (2) gross profit contributed at parity with frac
sand business
• Broad, geographically diverse asset base and a full portfolio of high-performance solutions
• Industry leading supply chain exposure (UP, CP, CSX) complementing FMSA’s BNSF footprint and is driving substantial synergies
• Multi-minerals and technology platforms with significant cross selling opportunities (not included in synergies estimates)
• Scale and diversity across proppant and industrial end-markets and geographies, including fast growing
West Texas proppant, Mexican glass and building products in the Southeast US
COMPELLING FINANCIAL PROFILE
• Significant combined earnings power, compounded by ~ $150M annual synergies, the majority of which
are quickly achieved through the optimization of complementary assets
• Strong free cash flow generation through-the-cycle, driving flexibility in capital allocation (rapid
deleveraging of balance sheet)

6
35% Ownership Implies a Premium Even at Equal Multiples
Implied Value Contribution to Combined Company (1) (2)
1. Relativ e cumulativ e EBITDA contribution (like-f or-like basis). Adjusted f or net debt as of Dec-17 (Fairmount: $637M; Unimin: $800M) by apply ing the implied Fairmount Santrol EBITDA multiple to Unimin EBITDA (f or each period)
2. Adj. EBITDA 2015-17A with adjustments
Capital structure adjusted for relative debt contribution
Equally values every dollar of EBITDA – excludes any premium for predictable industrial business
UniminFairmount Santrol
72%
28%
Cumulative EBITDA
2015-17A
35% Ownership
for FMSA
7
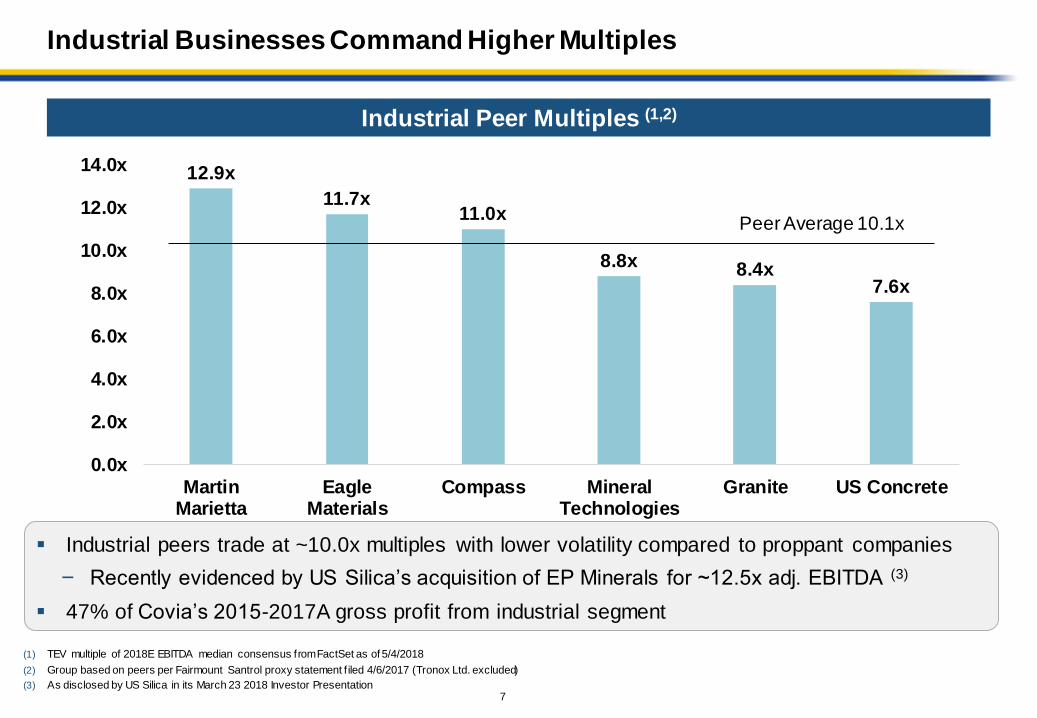
12.9x
11.7x11.0x
8.8x 8.4x7.6x
0.0x
2.0x
4.0x
6.0x
8.0x
10.0x
12.0x
14.0x
MartinMarietta
EagleMaterials
Compass MineralTechnologies
Granite US Concrete
Industrial peers trade at ~10.0x multiples with lower volatility compared to proppant companies
- Recently evidenced by US Silica’s acquisition of EP Minerals for ~12.5x adj. EBITDA (3)
47% of Covia’s 2015-2017A gross profit from industrial segment
Industrial Peer Multiples (1,2)
(1) TEV multiple of 2018E EBITDA median consensus from FactSet as of 5/4/2018
(2) Group based on peers per Fairmount Santrol proxy statement f iled 4/6/2017 (Tronox Ltd. excluded)
(3) As disclosed by US Silica in its March 23 2018 Investor Presentation
Peer Average 10.1x
Industrial Businesses Command Higher Multiples

8
Substantial Identified Synergies
Immediate and Substantial Synergies Expected at Low Implementation Costs (1)
Origin-Destination
Pair Optimization
Account
Consolidation
Procurement
SG&A
• Targeted synergies of approximately $150M annually
• 50% of synergies expected within 12 months and full run-rate achieved within 24 months
• Additional synergies from capex optimization of $30-40M over three years
• Strong potential for incremental synergies not included in $150M
- Identified operational improvements
- Cross selling (Industrial + Energy)
- Identified terminals optimization and unit train upgrades
Synergy estimates developed through third party industry model incorporating significant
in-basin capacity build
1. Synergy split based on 2020 annual estimates by category
Rigorous synergy analysis performed by leading consultants over two months in clean room setting
$150M of Run-Rate Annual Synergies
9
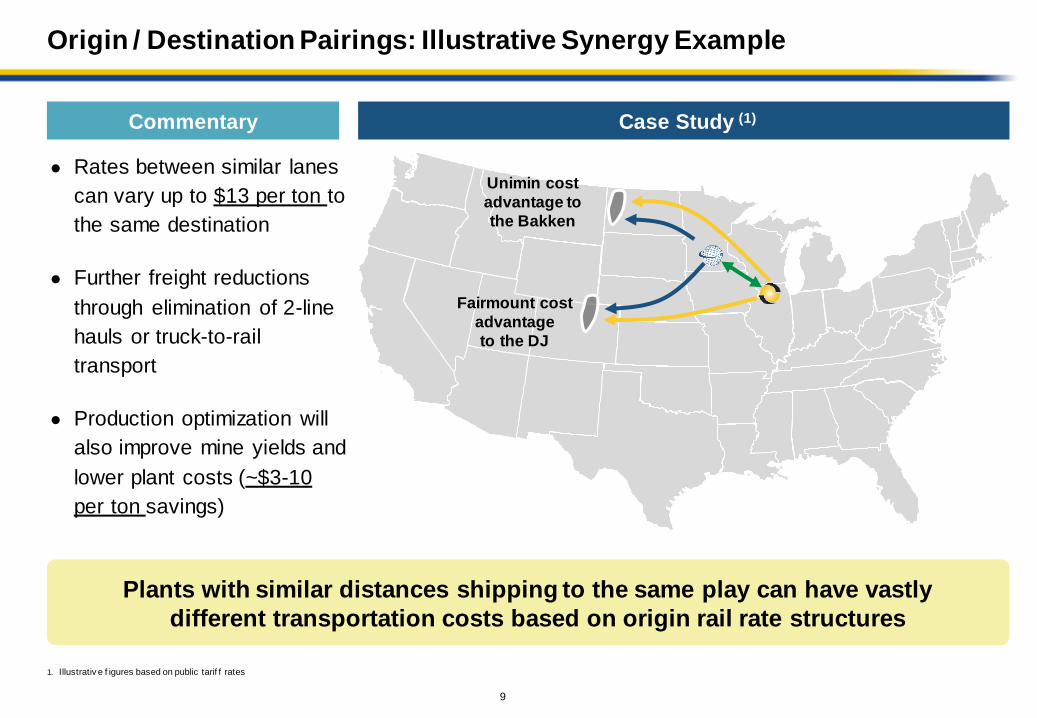
● Rates between similar lanes
can vary up to $13 per ton to
the same destination
● Further freight reductions
through elimination of 2-line
hauls or truck-to-rail
transport
● Production optimization will
also improve mine yields and
lower plant costs (~$3-10
per ton savings)
Fairmount cost
advantage
to the DJ
Unimin cost
advantage to
the Bakken
1. Illustrativ e f igures based on public tarif f rates
Plants with similar distances shipping to the same play can have vastly
different transportation costs based on origin rail rate structures
Commentary Case Study (1)
Origin / Destination Pairings: Illustrative Synergy Example

10
Roadmap to Completion
Positioned for Day 1 Readiness and Synergy Capture
Form S-4 Effective
US Anti-Trust Clearance
Management Appointment
Integration Planning (Ongoing)
Mexican Anti-Trust Clearance
New Name Established – Covia (Ticker: CVIA)
Shareholder Vote (May 25, 2018)
Shareholder Approval
Regulatory Approval
Integration Preparation

Section 2
Key Investment HighlightsCovia
12
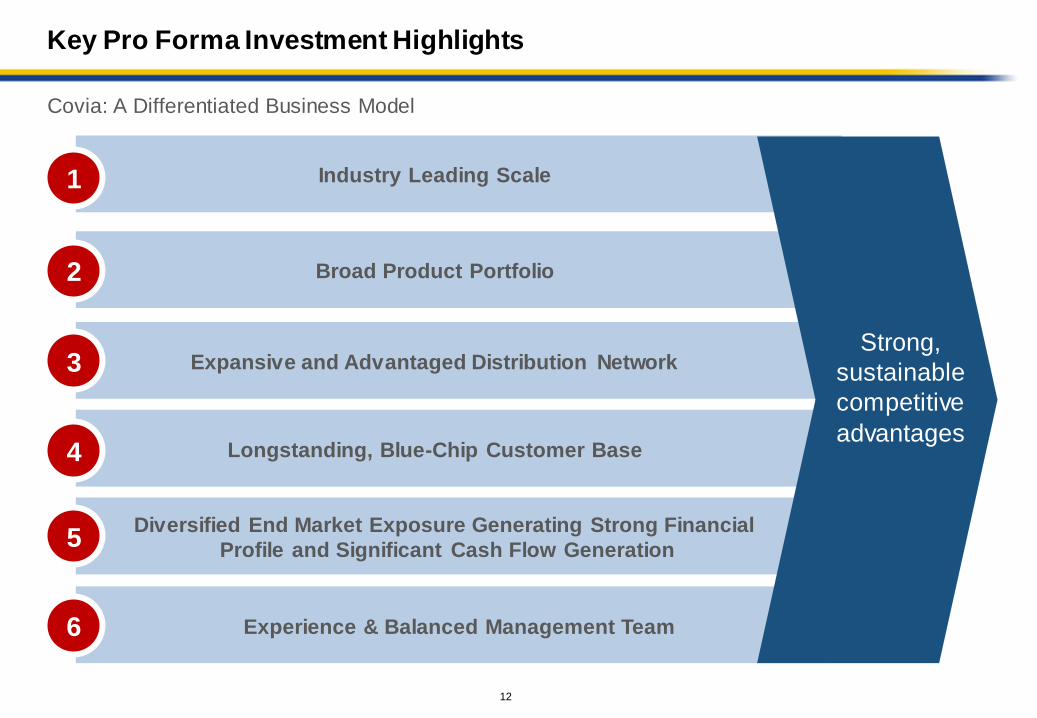
Industry Leading Scale
Covia: A Differentiated Business Model
Expansive and Advantaged Distribution Network
Broad Product Portfolio
Longstanding, Blue-Chip Customer Base
Diversified End Market Exposure Generating Strong Financial
Profile and Significant Cash Flow Generation
1
2
4
5
3
Key Pro Forma Investment Highlights
Experience & Balanced Management Team6
Strong,
sustainable
competitive
advantages
13
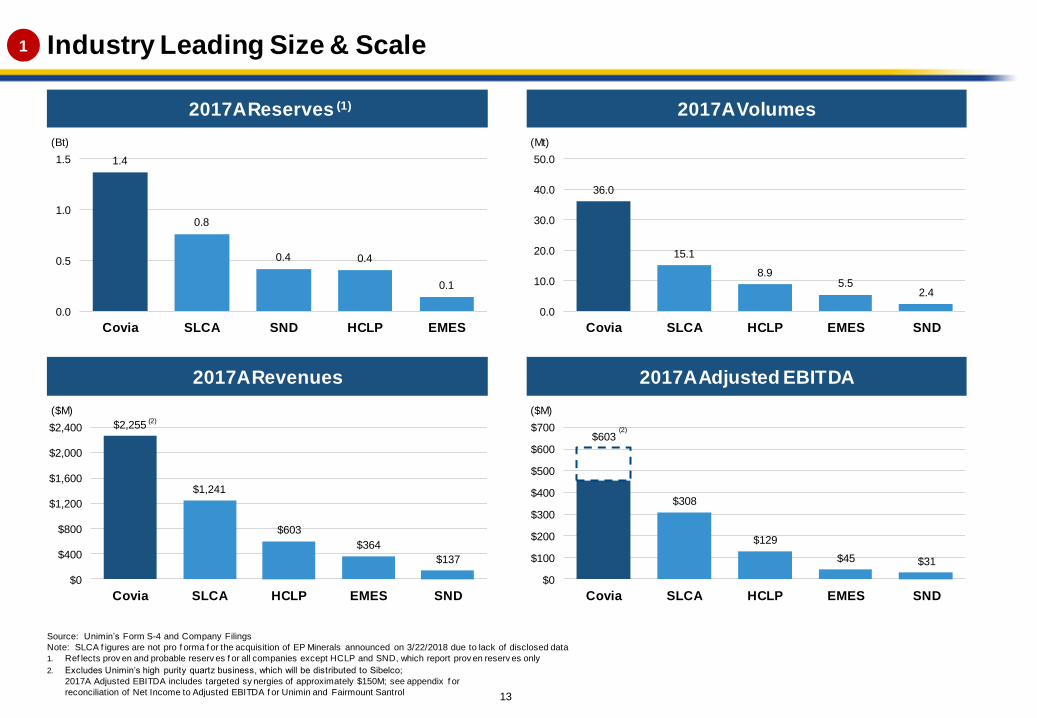
2017A Reserves (1)
1.4
0.8
0.4 0.4
0.1
0.0
0.5
1.0
1.5
Covia SLCA SND HCLP EMES
(Bt)
Source: Unimin’s Form S-4 and Company Filings
Note: SLCA f igures are not pro f orma f or the acquisition of EP Minerals announced on 3/22/2018 due to lack of disclosed data
1. Ref lects prov en and probable reserv es f or all companies except HCLP and SND, which report prov en reserv es only
2. Excludes Unimin’s high purity quartz business, which will be distributed to Sibelco;
2017A Adjusted EBITDA includes targeted sy nergies of approximately $150M; see appendix f or
reconciliation of Net Income to Adjusted EBITDA f or Unimin and Fairmount Santrol
2017A Volumes
36.0
15.1
8.95.5
2.4
0.0
10.0
20.0
30.0
40.0
50.0
Covia SLCA HCLP EMES SND
(Mt)
2017A Adjusted EBITDA
$603
$308
$129
$45 $31
$0
$100
$200
$300
$400
$500
$600
$700
Covia SLCA HCLP EMES SND
($M)
(2)
Industry Leading Size & Scale1
2017A Revenues
$2,255
$1,241
$603
$364
$137
$0
$400
$800
$1,200
$1,600
$2,000
$2,400
Covia SLCA HCLP EMES SND
($M)(2)
14
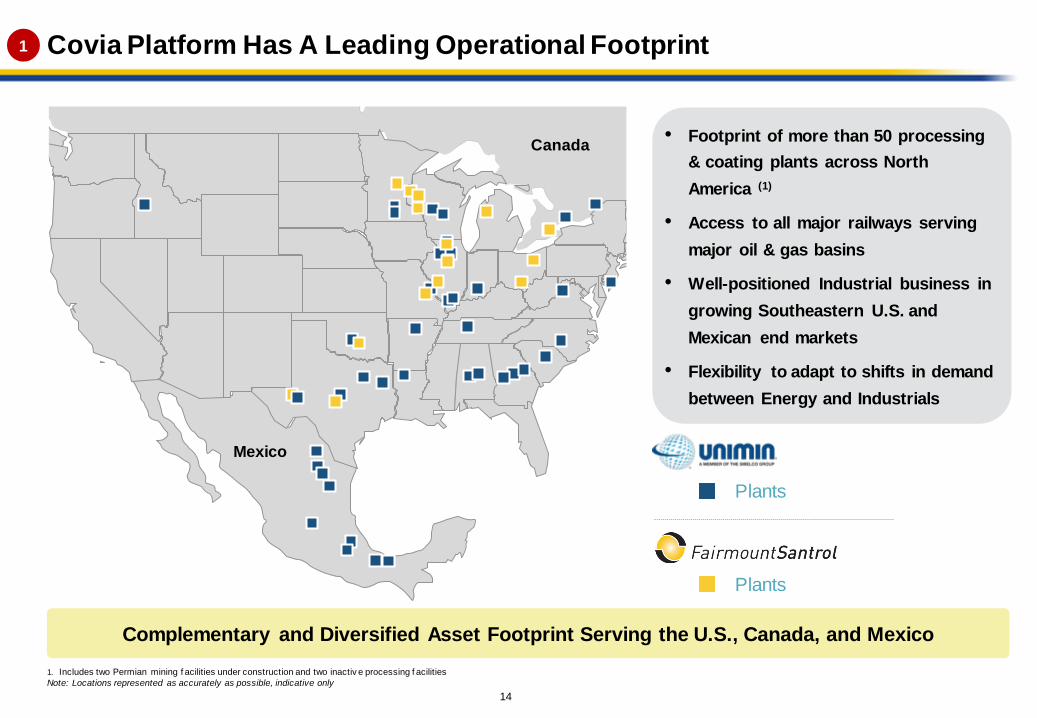
Covia Platform Has A Leading Operational Footprint
1. Includes two Permian mining f acilities under construction and two inactiv e processing f acilities
Note: Locations represented as accurately as possible, indicative only
• Footprint of more than 50 processing
& coating plants across North
America (1)
• Access to all major railways serving
major oil & gas basins
• Well-positioned Industrial business in
growing Southeastern U.S. and
Mexican end markets
• Flexibility to adapt to shifts in demand
between Energy and Industrials
Mexico
Canada
1
Plants
Plants
Complementary and Diversified Asset Footprint Serving the U.S., Canada, and Mexico

15
Broad Product Portfolio
Wide Range of Customer Segments
GlassConstruction
& Building
Products
CeramicsCoatings &
Polymers
Metals &
CastingsFiltrationOil & Gas
High-Purity
Sands
High quality silica sand for O&G and
Industrial end-markets
Custom
Blending
Custom blends of sand, aggregates,
minerals, colorants and other materials
DustShield
Chemical solution that will lower the
amount of respirable
crystalline silica
Propel SSP®
Optimizes production and
yields significant operational efficiencies
Resin Products
Resin systems and advanced resin
coated products for O&G and Industrial
end-markets
Silica-free materials that serve critical
functions for customers at
relatively low cost
Nepheline Syenite
& Other Minerals
Sports &
Recreation
2 Broadest Suite of Products in Our Industry
16
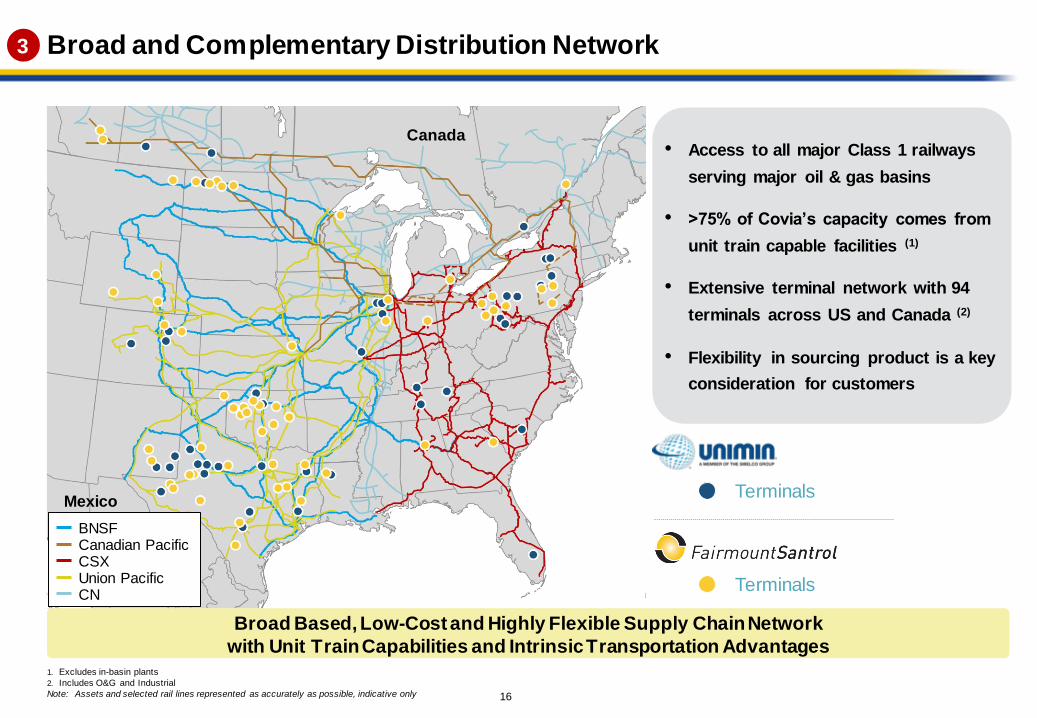
Broad and Complementary Distribution Network3
Terminals
Terminals
Mexico
Canada
Canadian PacificBNSF
CSX
CN
1. Excludes in-basin plants
2. Includes O&G and Industrial
Note: Assets and selected rail lines represented as accurately as possible, indicative only
Broad Based, Low-Cost and Highly Flexible Supply Chain Network
with Unit Train Capabilities and Intrinsic Transportation Advantages
• Access to all major Class 1 railways
serving major oil & gas basins
• >75% of Covia’s capacity comes from
unit train capable facilities (1)
• Extensive terminal network with 94
terminals across US and Canada (2)
• Flexibility in sourcing product is a key
consideration for customers
Union Pacific

17
1719
36
Unit-Train
Terminals
Other
Terminals
1. Regional ref lects trucking and barge
2. Unimin f igures include owned and exclusiv ely controlled terminals as well as
expansions currently underway , but exclude 3rd party terminals utilized
• Combined distribution network has access to all major Class 1 railroads
• Combined terminal network increases throughput capacity and network flexibility
• Increased unit train terminals allow for more effective and efficient shipments to better serve customers
Annual Oil & Gas Terminal
Throughput Capacity (Mt) (2)
Highly Complementary Large-Scale
Terminal Network
Other
Other
Proppant Rail and Regional Capacity (1)
Access To Major Rail Lines – Enhances Flexibility and Diversity
Regional
Regional
Regional
3 Diversified, Strong & Highly Complementary Logistics Network
CoviaCovia

18
Selected Industrial Customers
Longstanding, Blue-Chip Customer Base
Selected Energy Customers
4
• A leading asset footprint and national logistics network allows Covia to serve blue-chip
customers across end markets
• Broad and loyal customer base comprised of S&P 500 and industry-leading companies
• Long-standing relationships with very high renewal rates driven by:
Commitment to quality and reliability as critical supplier to customer operations
Close integration with customer operations
>2,000 (1)
Total Customers
>75%of Tons Sold to
Contracted Customers
1. Ref lects preliminary estimate of Covia’s consolidated total customers. Unimin
currently serv es more than 1,400 Industrial customers and approximately
1,500 total customers. Fairmount Santrol currently has ov er 75 Energy
customers and ov er 830 customers across all end markets

19
Silica
Nephelin
e
Syenite
Value
Added
Products
Clays
LimeFeldspar Others
United
States
Mexico
Canada RoW
Industrial
40%Energy
60%
Diversity Across Segments, Geographies and Minerals 5
2017A Covia Industrial Revenues
Variety of Minerals
Diverse Geographies
Complementary Segments Drive Value
Covia 2017A
Volumes by Segment

20
Resilient Cash Flow Generation Through-the-Cycle5
Covia’s Significant Adjusted EBITDA Through-The-Cycle (1) (2) (3)
Energy SegmentIndustrial Segment Synergies
$450
$235
$603
$689
2015 2016 2017 LTM Q1‘18
1. Excludes Unimin’s high purity quartz business, which will be distributed to Sibelco; includes targeted
sy nergies of approximately $150M in 2017 & LTM Q1‘18 and $110M in 2015 & 2016
2. SG&A and other corporate cost items allocated by v olume contribution
3. See appendix f or reconciliation of Net Income to Adjusted EBITDA f or Unimin and Fairmount Santrol
4. LTM Q1‘18 Pro Forma Adjusted EBITDA ref lects preliminary Unimin estimates f or the LTM period
ended 3/31/2018. Cov ia’s f igures, including sy nergies, ref lect midpoint of estimated range of $688M
to $690M
• Covia to be further supported by substantial synergy realization
• Industrial business provides resilient EBITDA base through the business cycle
(4)

21
Q1’18 LTM Tons Sold 37.1M
Q1’18 LTM Revenue $2.4B
Q1’18 LTM Adj. EBITDA (1) $537M
Q1’18 LTM Adj. EBITDA + Synergies (1) (2) $687M
3/31/18 Net Debt (2025 $1.65Bn Maturity) $1,605M
Net Debt / Q1’18 LTM Adj. EBITDA + Synergies (2) 2.3x
Source: Unimin’s Form S-4, Company f ilings, and preliminary management estimates
1. Cov ia LTM Q1‘18 Pro Forma Adjusted EBITDA, excluding sy nergies, ref lects low end of estimated range of
$537M to $540M
2. Assumes targeted run-rate sy nergies of approximately $150M
Anticipate ~2x net leverage,
excluding synergies, in 2018
Strong Pro Forma Business and Financial Profile
Covia
5
22
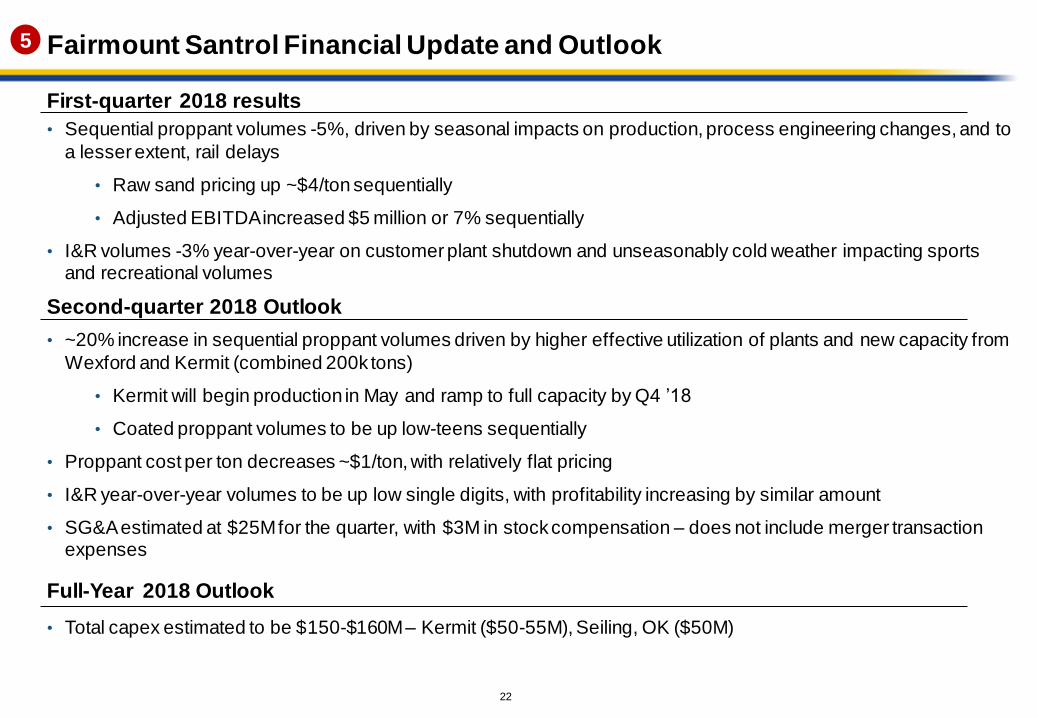
Fairmount Santrol Financial Update and Outlook
• Sequential proppant volumes -5%, driven by seasonal impacts on production, process engineering changes, and to
a lesser extent, rail delays
• Raw sand pricing up ~$4/ton sequentially
• Adjusted EBITDA increased $5 million or 7% sequentially
• I&R volumes -3% year-over-year on customer plant shutdown and unseasonably cold weather impacting sports and recreational volumes
First-quarter 2018 results
• ~20% increase in sequential proppant volumes driven by higher effective utilization of plants and new capacity from
Wexford and Kermit (combined 200k tons)
• Kermit will begin production in May and ramp to full capacity by Q4 ’18
• Coated proppant volumes to be up low-teens sequentially
• Proppant cost per ton decreases ~$1/ton, with relatively flat pricing
• I&R year-over-year volumes to be up low single digits, with profitability increasing by similar amount
• SG&A estimated at $25M for the quarter, with $3M in stock compensation – does not include merger transaction expenses
Second-quarter 2018 Outlook
Full-Year 2018 Outlook
• Total capex estimated to be $150-$160M – Kermit ($50-55M), Seiling, OK ($50M)
5
23
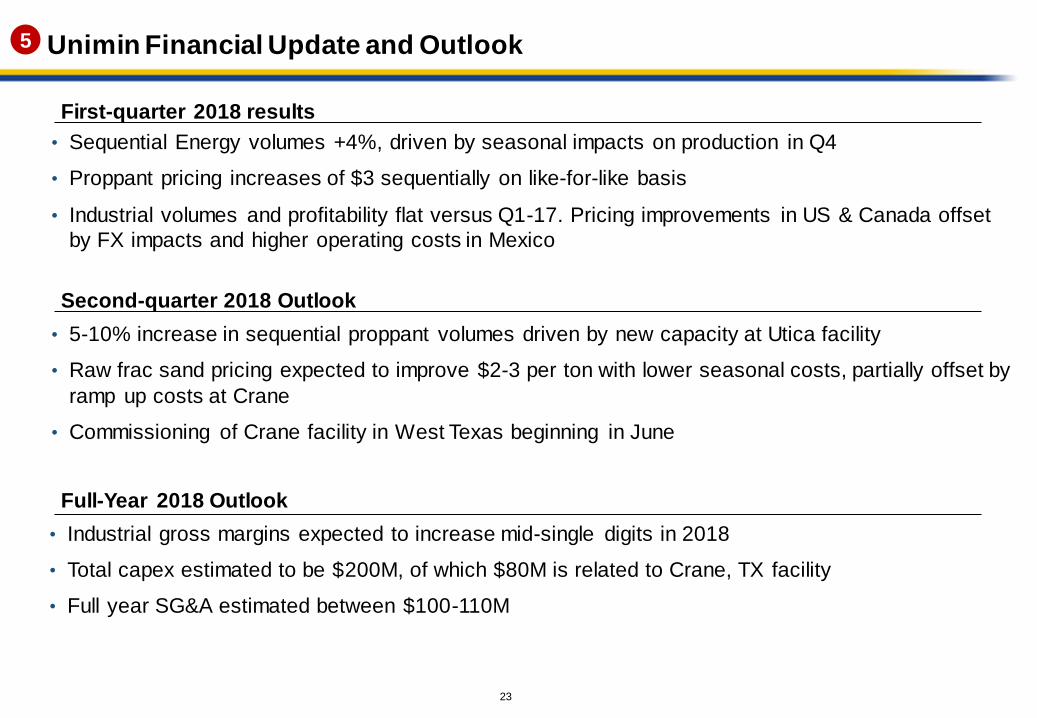
Unimin Financial Update and Outlook
• Sequential Energy volumes +4%, driven by seasonal impacts on production in Q4
• Proppant pricing increases of $3 sequentially on like-for-like basis
• Industrial volumes and profitability flat versus Q1-17. Pricing improvements in US & Canada offset
by FX impacts and higher operating costs in Mexico
First-quarter 2018 results
• 5-10% increase in sequential proppant volumes driven by new capacity at Utica facility
• Raw frac sand pricing expected to improve $2-3 per ton with lower seasonal costs, partially offset by
ramp up costs at Crane
• Commissioning of Crane facility in West Texas beginning in June
Second-quarter 2018 Outlook
Full-Year 2018 Outlook
• Industrial gross margins expected to increase mid-single digits in 2018
• Total capex estimated to be $200M, of which $80M is related to Crane, TX facility
• Full year SG&A estimated between $100-110M
5
24
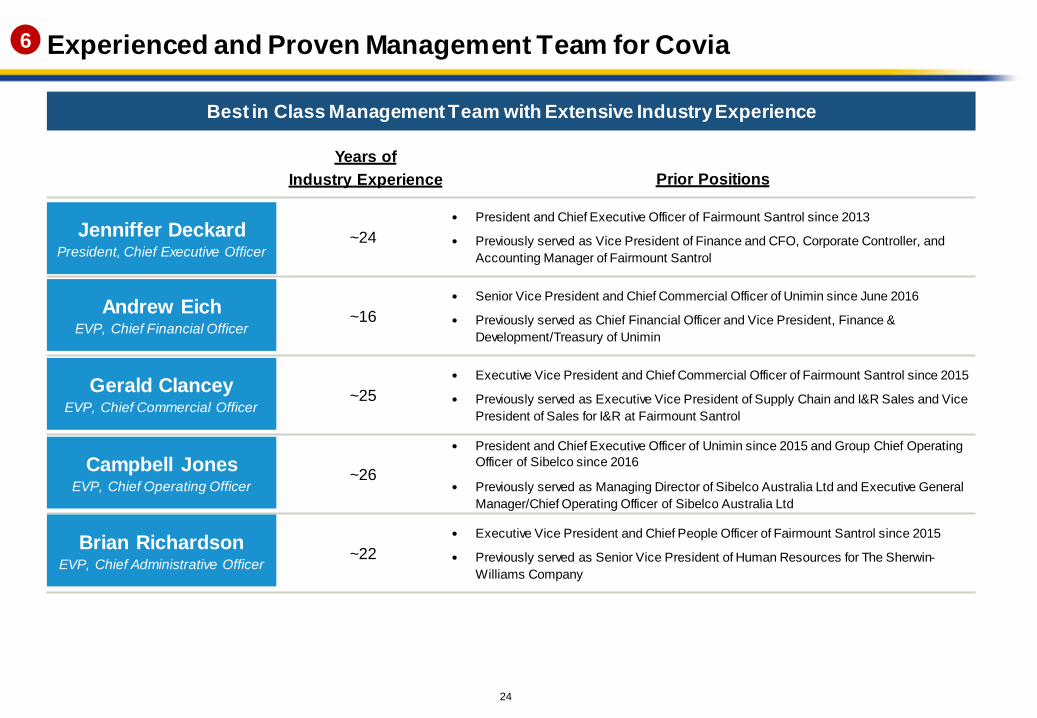
Experienced and Proven Management Team for Covia
Best in Class Management Team with Extensive Industry Experience
Years of
Industry Experience Prior Positions
~24
President and Chief Executive Officer of Fairmount Santrol since 2013
Previously served as Vice President of Finance and CFO, Corporate Controller, and
Accounting Manager of Fairmount Santrol
~16
Senior Vice President and Chief Commercial Officer of Unimin since June 2016
Previously served as Chief Financial Officer and Vice President, Finance &
Development/Treasury of Unimin
~25
Executive Vice President and Chief Commercial Officer of Fairmount Santrol since 2015
Previously served as Executive Vice President of Supply Chain and I&R Sales and Vice
President of Sales for I&R at Fairmount Santrol
~26
President and Chief Executive Officer of Unimin since 2015 and Group Chief Operating
Officer of Sibelco since 2016
Previously served as Managing Director of Sibelco Australia Ltd and Executive General
Manager/Chief Operating Officer of Sibelco Australia Ltd
~22
Executive Vice President and Chief People Officer of Fairmount Santrol since 2015
Previously served as Senior Vice President of Human Resources for The Sherwin-
Williams Company
Jenniffer DeckardPresident, Chief Executive Officer
Andrew EichEVP, Chief Financial Officer
Brian RichardsonEVP, Chief Administrative Officer
Gerald ClanceyEVP, Chief Commercial Officer
Campbell JonesEVP, Chief Operating Officer
6
Section 3
Industry UpdateCovia

26
2018 Tailwinds in Industrial End-Markets
Industrial Production
+3.2% YoY growth vs. 2.0% in 2017 (1)
Consumer Confidence at 130.8 (2)
highest level since 2000 and above
2017 average of 120.5
2018 Construction
Spending Forecast +4.0% (4)
Foundry Spending Growth
+4.7% vs. 2017 (3)
Industrial profitability aided by macro tailwinds and:
• Pricing increases
• Mix shift to higher-margin products
Note: Data as of March 2018
Source:
1. Bloomberg
2. Conference Board
3. American Foundry Society4. American Institute of Architects
27
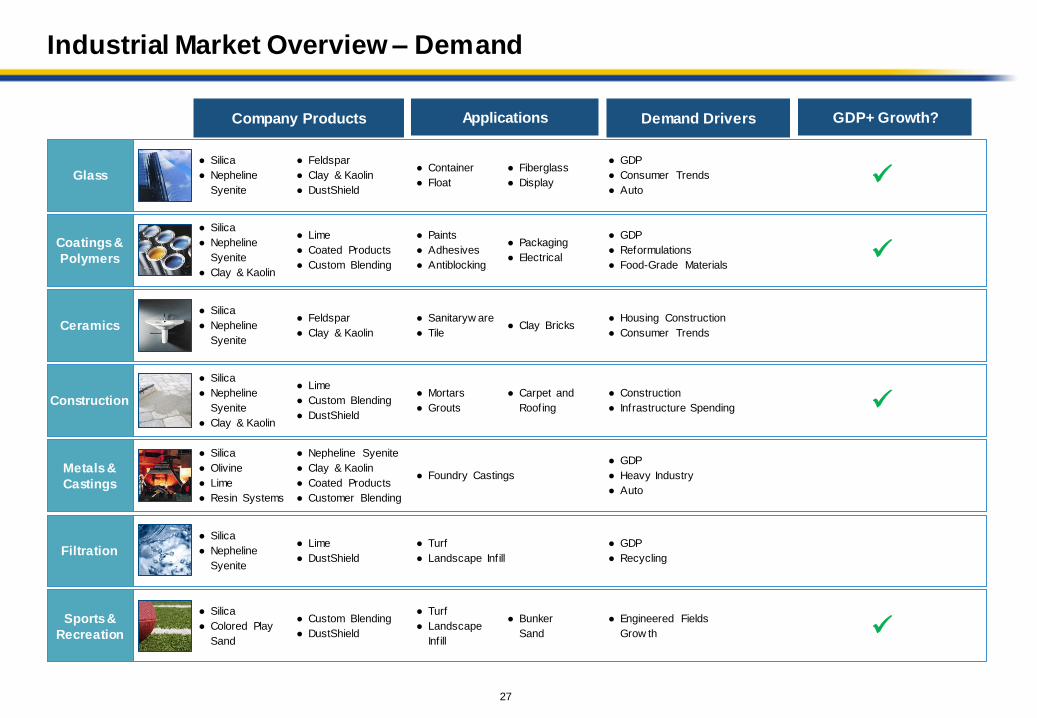
GDP+ Growth?
Industrial Market Overview – Demand
Company Products Demand DriversApplications
● GDP
● Consumer Trends
● Auto
● Silica
● Nepheline
Syenite
● Container
● Float
● Feldspar
● Clay & Kaolin
● DustShield
● Fiberglass
● DisplayGlass
● Housing Construction
● Consumer Trends
● Silica
● Nepheline
Syenite
● Sanitaryw are
● Tile
● Feldspar
● Clay & Kaolin● Clay BricksCeramics
● Construction
● Infrastructure Spending
● Silica
● Nepheline
Syenite
● Clay & Kaolin
● Mortars
● Grouts
● Lime
● Custom Blending
● DustShield
● Carpet and
RoofingConstruction
● GDP
● Heavy Industry
● Auto
● Silica
● Olivine
● Lime
● Resin Systems
● Foundry Castings
● Nepheline Syenite
● Clay & Kaolin
● Coated Products
● Customer Blending
Metals &
Castings
● GDP
● Reformulations
● Food-Grade Materials
● Silica
● Nepheline
Syenite
● Clay & Kaolin
● Paints
● Adhesives
● Antiblocking
● Lime
● Coated Products
● Custom Blending
● Packaging
● Electrical
Coatings &
Polymers
● GDP
● Recycling
● Silica
● Nepheline
Syenite
● Turf
● Landscape Infill
● Lime
● DustShieldFiltration
● Engineered Fields
Grow th
● Silica
● Colored Play
Sand
● Turf
● Landscape
Infill
● Custom Blending
● DustShield
● Bunker
Sand
Sports &
Recreation

28
Expected Increase in Proppant Demand for 2018
2018 Proppant demand forecasted to reach 100 million tons (vs. ~75 million tons in 2017)
500
550
600
650
700
750
800
850
U.S. HORIZONTAL LAND RIG COUNT
Higher average rig count vs. 2017
Increasing proportion of horizontal vs. vertical wells
Higher proportion of wells drilled actually completed
Ratio of completed wells vs. drilled wells expected
to be over 1.00 vs. 0.86 in 2017
AVERAGE PROPPANT TONS
PER U.S. HORIZONTAL WELL
2015 2016 2017 2018 Est.
4,600 -
5,000
5,600 -
6,000
3,600 -
4,000
6,500 -
7,000
Modestly longer laterals
More stages per well
Higher proppant loading per lateral foot
Increasing Number of Well Completions (1) Higher Proppant Intensity Per Well (2)
1. Baker Hughes US horizontal land rig count
2. Combined Company management estimates based on public E&P presentations and
internal estimates + PacWest Consulting Partners
29
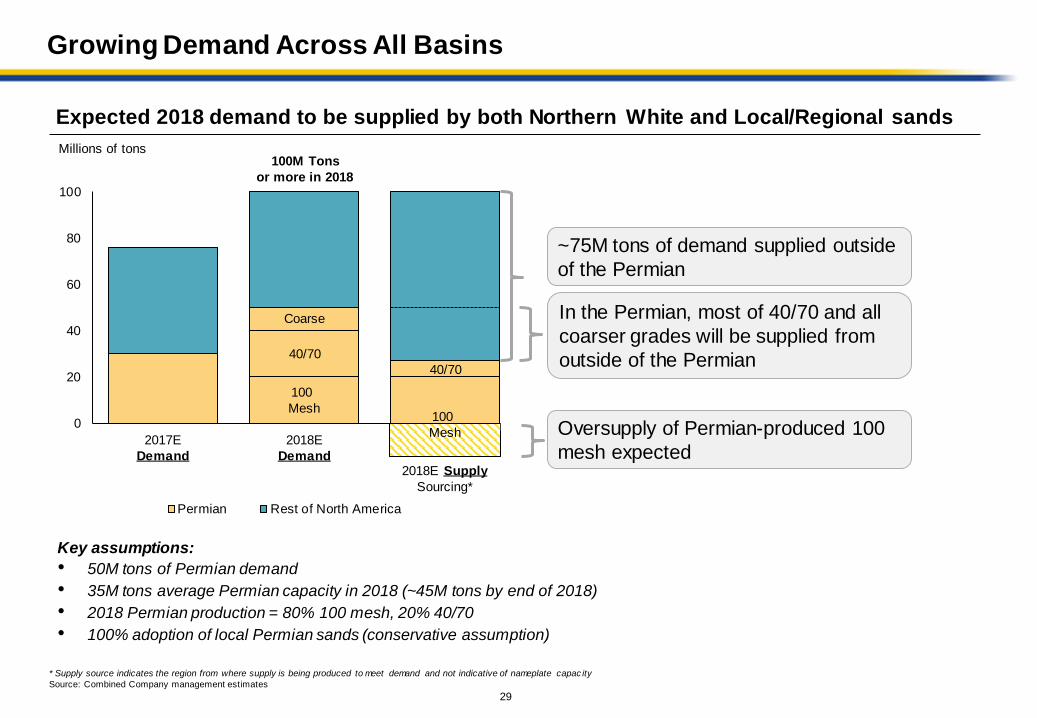
Growing Demand Across All Basins
Expected 2018 demand to be supplied by both Northern White and Local/Regional sands
Millions of tons
0
20
40
60
80
100
Permian Rest of North America
100M Tons
or more in 2018
Coarse
40/70
100
Mesh
40/70
~75M tons of demand supplied outside
of the Permian
Key assumptions:
• 50M tons of Permian demand
• 35M tons average Permian capacity in 2018 (~45M tons by end of 2018)
• 2018 Permian production = 80% 100 mesh, 20% 40/70
• 100% adoption of local Permian sands (conservative assumption)
* Supply source indicates the region from where supply is being produced to meet demand and not indicative of nameplate capac ity
Source: Combined Company management estimates
2017E
Demand
2018E
Demand2018E Supply
Sourcing*
100
Mesh
In the Permian, most of 40/70 and all
coarser grades will be supplied from
outside of the Permian
Oversupply of Permian-produced 100
mesh expected
30
100 Mesh 40/70
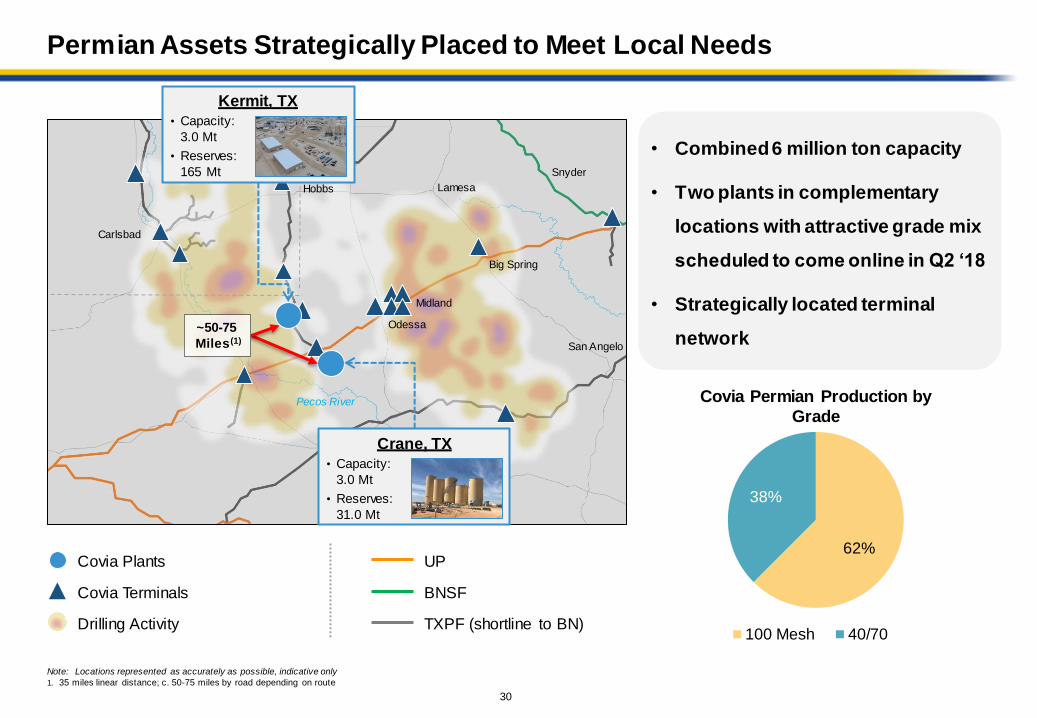
Permian Assets Strategically Placed to Meet Local Needs
• Combined 6 million ton capacity
• Two plants in complementary
locations with attractive grade mix
scheduled to come online in Q2 ‘18
• Strategically located terminal
network
Carlsbad
Hobbs Lamesa
Snyder
Big Spring
Midland
Odessa
San Angelo
Pecos River
~50-75
Miles(1)
Note: Locations represented as accurately as possible, indicative only
1. 35 miles linear distance; c. 50-75 miles by road depending on route
Covia Permian Production by
Grade
62%
38%
UP
BNSF
TXPF (shortline to BN)
Covia Terminals
Drilling Activity
Covia Plants
Kermit, TX
• Capacity:
3.0 Mt
• Reserves:
165 Mt
Crane, TX
• Capacity:
3.0 Mt
• Reserves:
31.0 Mt

31
Well Suited to Meet Demand Across All Basins
Operational & Logistics Footprint
Source: Management estimates
Northern White Supplier of Choice in All Basins
~75M tons Northern White Demand Mix
(Permian + Rest of North America)
33%
42%
25%
Combined CompanyIndustry
• Production by grade well balanced to meet demand
• Scale, plant locations and terminal network make Covia a low-cost supplier of high quality sands in all basins
Production Mix Outside of Permian
31%
41%
28%
100 Mesh 40/70 Coarse
20%
30%50%
Logistics network allows cost-
competitive distribution into all basins
32
A Compelling Strategic Combination
Creating a Leader in Proppants and Industrial Materials Solutions
Procurement
• Transaction creates significant value for FMSA shareholders:
$170 million cash consideration
Approximately 35% ownership of stronger, more diverse company
Strong case for multiple uplift
$150M in annual synergies, with upside from cross-selling
• Highly complimentary combination of products, plants, logistical assets,
geographies and end-markets served
Covia will be extremely well-positioned to meet proppant and industrial
demand cost-effectively
• Strong financial profile with ability to generate strong earnings in all parts of the
industry cycle
Diversity in products and markets contributes to stability of earnings
AppendixCovia

34
A Fully Integrated I&R Products Solutions Provider
Diverse base of >800 customers and multiple product lines contribute to the more steady dynamics of I&R
PRODUCTS /CHARACTERISTICS
TARGET M ARKETS
99.9% pure silica Engineered sand-based resin products
Expert custom blends of sand, aggregates,
minerals, colorants and
other materials
Traditional foundry resin systems & proprietary
resins for advanced
resin-coated proppants
Building Products
Foundries
Glass Manufacturing
Golf Courses
Water Filtration
Foundries Building Products
Specialty Products
Sports & Recreation
- Colored Play Sand
- Sports Turf
Foundries
HIGH-PURITY SANDSENGINEERED
RESIN-COATED SANDSCUSTOM BLENDING
HIGH-PERFORMANCE
RESIN SYSTEMS
Continued Focus on Shifting Sales Mix Towards Higher Margin Value-Added Products
Tons Sold
Gross Profit
per ton
Gross Profit
2015A
2.3M
$18.7
$43M
2016A
2.5M
$18.8
$47M
2017A
2.5M
$21.8
$54M
CAGR (1)
4.1%
7.6%
2017A Revenue By Product
34%
66%
Raw
Sand
Value
Added
1. Ref lects 2014A – 2017A CAGR
12.3%
35
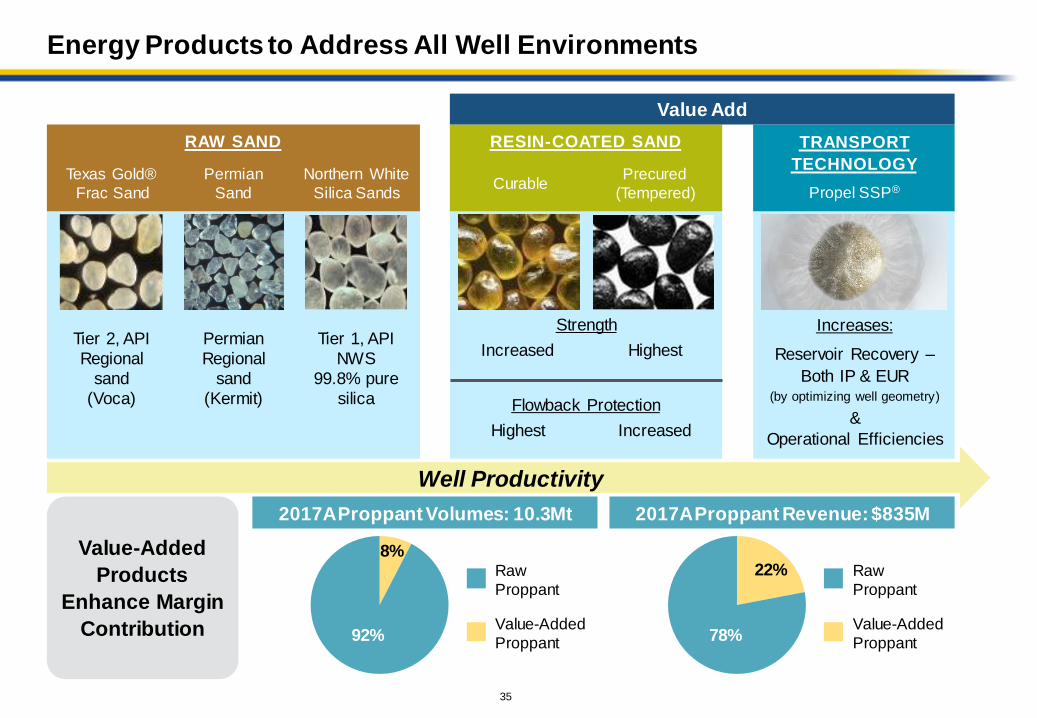
Energy Products to Address All Well Environments
RAW SAND
Tier 1, API
NWS
99.8% pure
silica
Northern White
Silica Sands
Tier 2, API
Regional
sand
(Voca)
Texas Gold®
Frac Sand
Permian
Regional
sand
(Kermit)
Permian
Sand
Increases:
Reservoir Recovery –
Both IP & EUR(by optimizing well geometry)
&
Operational Efficiencies
Propel SSP®
TRANSPORT
TECHNOLOGY
Flowback Protection
Strength
Increased Highest
Highest Increased
Curable
RESIN-COATED SAND
Precured
(Tempered)
Value Add
Well Productivity
2017A Proppant Revenue: $835M
Raw
Proppant
Value-Added
Proppant
2017A Proppant Volumes: 10.3Mt
Raw
Proppant
Value-Added
Proppant
Value-Added
Products
Enhance Margin
Contribution
8%
92%
22%
78%
36
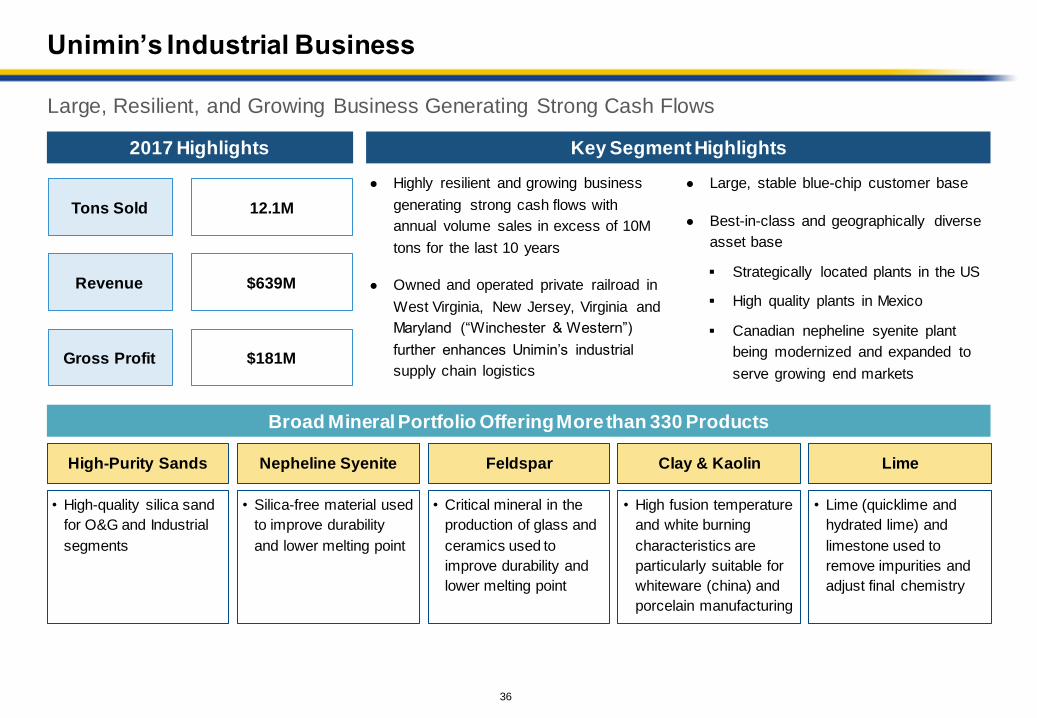
Unimin’s Industrial Business
Large, Resilient, and Growing Business Generating Strong Cash Flows
● Highly resilient and growing business
generating strong cash flows with
annual volume sales in excess of 10M
tons for the last 10 years
● Owned and operated private railroad in
West Virginia, New Jersey, Virginia and
Maryland (“Winchester & Western”)
further enhances Unimin’s industrial
supply chain logistics
Key Segment Highlights2017 Highlights
• Silica-free material used
to improve durability
and lower melting point
Nepheline Syenite
Broad Mineral Portfolio Offering More than 330 Products
Clay & Kaolin
• High fusion temperature
and white burning
characteristics are
particularly suitable for
whiteware (china) and
porcelain manufacturing
● Large, stable blue-chip customer base
● Best-in-class and geographically diverse
asset base
Strategically located plants in the US
High quality plants in Mexico
Canadian nepheline syenite plant
being modernized and expanded to
serve growing end marketsGross Profit $181M
Tons Sold 12.1M
$639MRevenue
High-Purity Sands
• High-quality silica sand
for O&G and Industrial
segments
Feldspar
• Critical mineral in the
production of glass and
ceramics used to
improve durability and
lower melting point
Lime
• Lime (quicklime and
hydrated lime) and
limestone used to
remove impurities and
adjust final chemistry
37
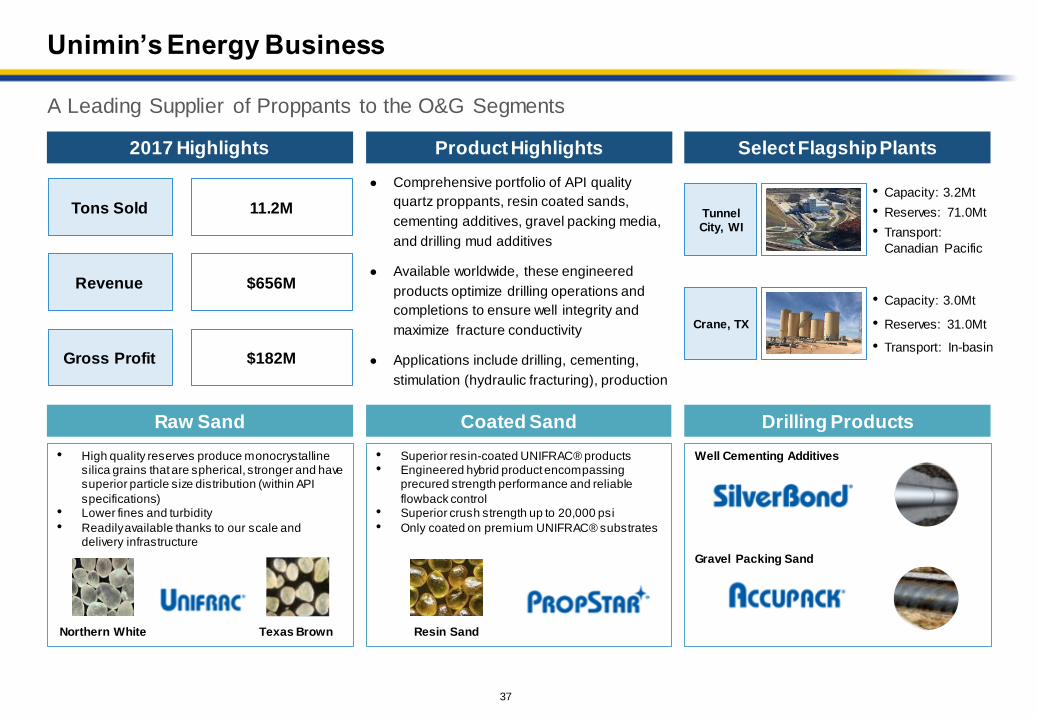
Unimin’s Energy Business
A Leading Supplier of Proppants to the O&G Segments
Well Cementing Additives
Gravel Packing Sand
Product Highlights
• High quality reserves produce monocrystalline silica grains that are spherical, stronger and have superior particle size distribution (within API
specifications)• Lower fines and turbidity
• Readily available thanks to our scale and delivery infrastructure
Select Flagship Plants
• Superior resin-coated UNIFRAC® products• Engineered hybrid product encompassing
precured strength performance and reliable
flowback control• Superior crush strength up to 20,000 psi
• Only coated on premium UNIFRAC® substrates
● Comprehensive portfolio of API quality
quartz proppants, resin coated sands,
cementing additives, gravel packing media,
and drilling mud additives
● Available worldwide, these engineered
products optimize drilling operations and
completions to ensure well integrity and
maximize fracture conductivity
● Applications include drilling, cementing,
stimulation (hydraulic fracturing), production
Crane, TX
• Capacity: 3.0Mt
• Reserves: 31.0Mt
• Transport: In-basin
Tunnel City, WI
• Capacity: 3.2Mt
• Reserves: 71.0Mt
• Transport:
Canadian Pacific
2017 Highlights
Raw Sand Coated Sand Drilling Products
Gross Profit $182M
Tons Sold 11.2M
$656MRevenue
Resin SandNorthern White Texas Brown
38
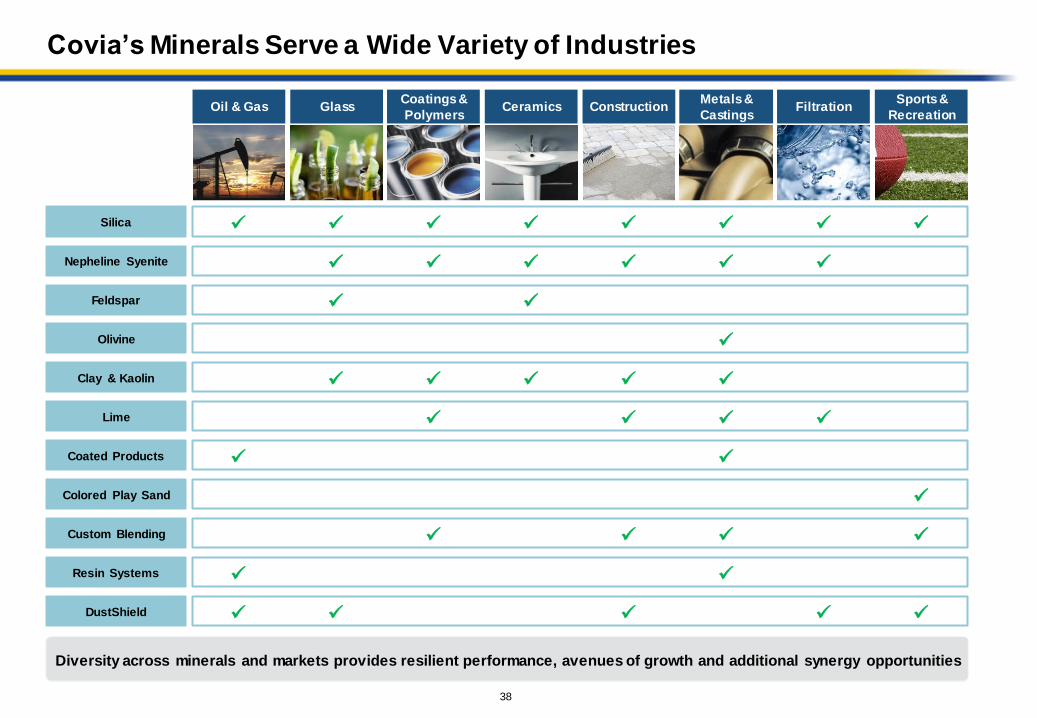
Covia’s Minerals Serve a Wide Variety of Industries
Silica
Nepheline Syenite
Feldspar
Olivine
Clay & Kaolin
Ceramics
Lime
Coated Products
DustShield
Glass
Filtration
Colored Play Sand
Custom Blending
Coatings &
Polymers
Sports &
Recreation
Resin Systems
Metals &
Castings
Oil & Gas
Construction
Diversity across minerals and markets provides resilient performance, avenues of growth and additional synergy opportunities
Covia Financials
40
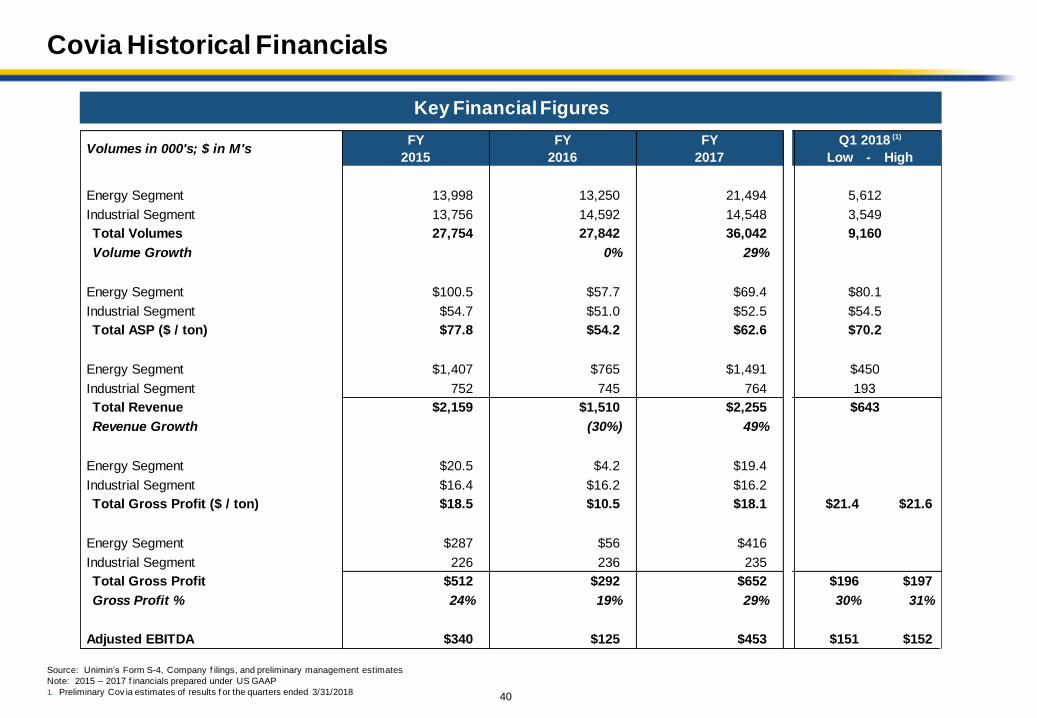
Covia Historical Financials
Key Financial Figures
Source: Unimin’s Form S-4, Company f ilings, and preliminary management estimates
Note: 2015 – 2017 f inancials prepared under US GAAP
1. Preliminary Cov ia estimates of results f or the quarters ended 3/31/2018
Volumes in 000's; $ in M'sFY
2015
FY
2016
FY
2017
Q1 2018 (1)
Low - High
Energy Segment 13,998 13,250 21,494 5,612
Industrial Segment 13,756 14,592 14,548 3,549
Total Volumes 27,754 27,842 36,042 9,160
Volume Growth 0% 29%
Energy Segment $100.5 $57.7 $69.4 $80.1
Industrial Segment $54.7 $51.0 $52.5 $54.5
Total ASP ($ / ton) $77.8 $54.2 $62.6 $70.2
Energy Segment $1,407 $765 $1,491 $450
Industrial Segment 752 745 764 193
Total Revenue $2,159 $1,510 $2,255 $643
Revenue Growth (30%) 49%
Energy Segment $20.5 $4.2 $19.4
Industrial Segment $16.4 $16.2 $16.2
Total Gross Profit ($ / ton) $18.5 $10.5 $18.1 $21.4 $21.6
Energy Segment $287 $56 $416
Industrial Segment 226 236 235
Total Gross Profit $512 $292 $652 $196 $197
Gross Profit % 24% 19% 29% 30% 31%
Adjusted EBITDA $340 $125 $453 $151 $152
41
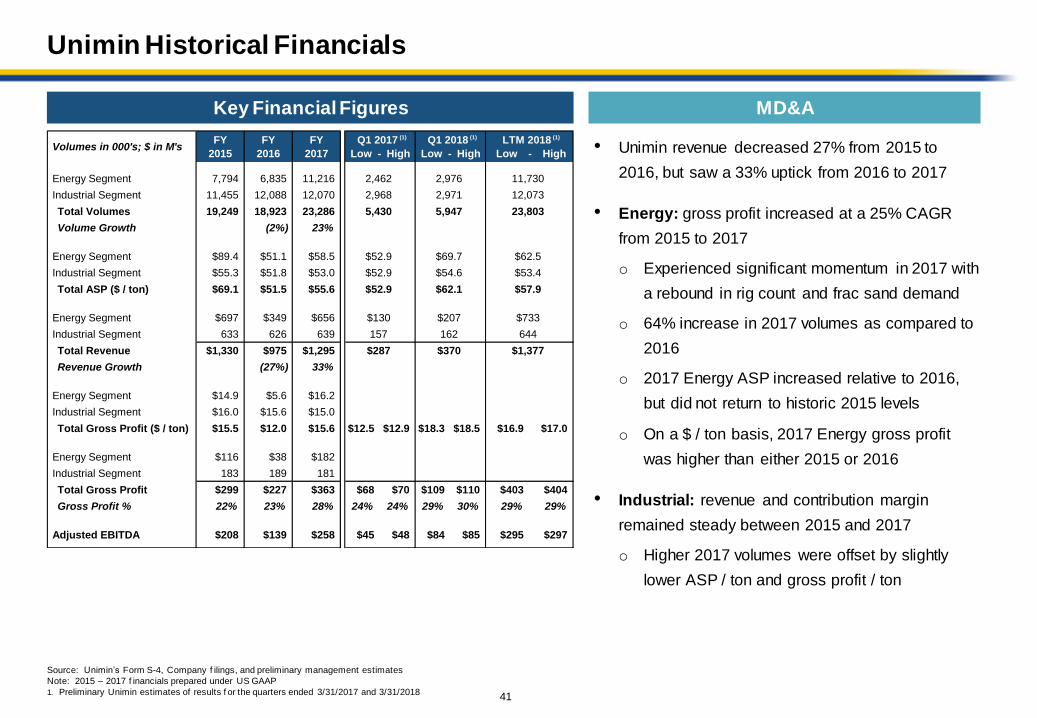
Unimin Historical Financials
• Unimin revenue decreased 27% from 2015 to
2016, but saw a 33% uptick from 2016 to 2017
• Energy: gross profit increased at a 25% CAGR
from 2015 to 2017
o Experienced significant momentum in 2017 with
a rebound in rig count and frac sand demand
o 64% increase in 2017 volumes as compared to
2016
o 2017 Energy ASP increased relative to 2016,
but did not return to historic 2015 levels
o On a $ / ton basis, 2017 Energy gross profit
was higher than either 2015 or 2016
• Industrial: revenue and contribution margin
remained steady between 2015 and 2017
o Higher 2017 volumes were offset by slightly
lower ASP / ton and gross profit / ton
Volumes in 000's; $ in M'sFY
2015
FY
2016
FY
2017
Q1 2017 (1)
Low - High
Q1 2018 (1)
Low - High
LTM 2018 (1)
Low - High
Energy Segment 7,794 6,835 11,216 2,462 2,976 11,730
Industrial Segment 11,455 12,088 12,070 2,968 2,971 12,073
Total Volumes 19,249 18,923 23,286 5,430 5,947 23,803
Volume Growth (2%) 23%
Energy Segment $89.4 $51.1 $58.5 $52.9 $69.7 $62.5
Industrial Segment $55.3 $51.8 $53.0 $52.9 $54.6 $53.4
Total ASP ($ / ton) $69.1 $51.5 $55.6 $52.9 $62.1 $57.9
Energy Segment $697 $349 $656 $130 $207 $733
Industrial Segment 633 626 639 157 162 644
Total Revenue $1,330 $975 $1,295 $287 $370 $1,377
Revenue Growth (27%) 33%
Energy Segment $14.9 $5.6 $16.2
Industrial Segment $16.0 $15.6 $15.0
Total Gross Profit ($ / ton) $15.5 $12.0 $15.6 $12.5 $12.9 $18.3 $18.5 $16.9 $17.0
Energy Segment $116 $38 $182
Industrial Segment 183 189 181
Total Gross Profit $299 $227 $363 $68 $70 $109 $110 $403 $404
Gross Profit % 22% 23% 28% 24% 24% 29% 30% 29% 29%
Adjusted EBITDA $208 $139 $258 $45 $48 $84 $85 $295 $297
MD&AKey Financial Figures
Source: Unimin’s Form S-4, Company f ilings, and preliminary management estimates
Note: 2015 – 2017 f inancials prepared under US GAAP
1. Preliminary Unimin estimates of results f or the quarters ended 3/31/2017 and 3/31/2018
42
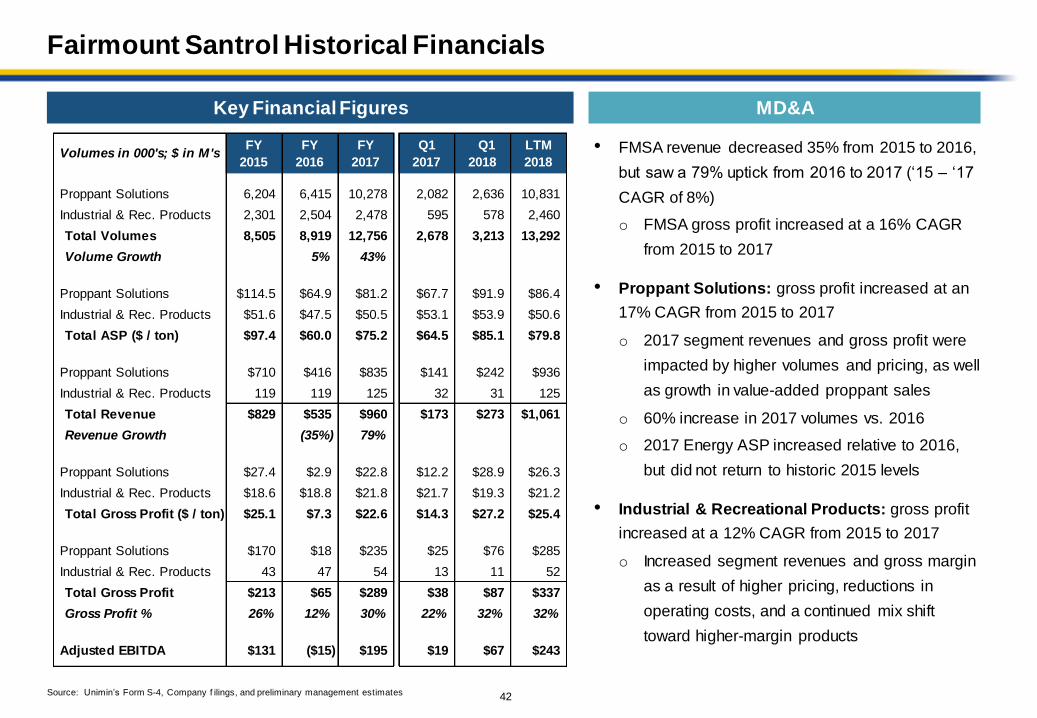
Fairmount Santrol Historical Financials
• FMSA revenue decreased 35% from 2015 to 2016,
but saw a 79% uptick from 2016 to 2017 (‘15 – ‘17
CAGR of 8%)
o FMSA gross profit increased at a 16% CAGR
from 2015 to 2017
• Proppant Solutions: gross profit increased at an
17% CAGR from 2015 to 2017
o 2017 segment revenues and gross profit were
impacted by higher volumes and pricing, as well
as growth in value-added proppant sales
o 60% increase in 2017 volumes vs. 2016
o 2017 Energy ASP increased relative to 2016,
but did not return to historic 2015 levels
• Industrial & Recreational Products: gross profit
increased at a 12% CAGR from 2015 to 2017
o Increased segment revenues and gross margin
as a result of higher pricing, reductions in
operating costs, and a continued mix shift
toward higher-margin products
MD&A
Source: Unimin’s Form S-4, Company f ilings, and preliminary management estimates
Volumes in 000's; $ in M'sFY
2015
FY
2016
FY
2017
Q1
2017
Q1
2018
LTM
2018
Proppant Solutions 6,204 6,415 10,278 2,082 2,636 10,831
Industrial & Rec. Products 2,301 2,504 2,478 595 578 2,460
Total Volumes 8,505 8,919 12,756 2,678 3,213 13,292
Volume Growth 5% 43%
Proppant Solutions $114.5 $64.9 $81.2 $67.7 $91.9 $86.4
Industrial & Rec. Products $51.6 $47.5 $50.5 $53.1 $53.9 $50.6
Total ASP ($ / ton) $97.4 $60.0 $75.2 $64.5 $85.1 $79.8
Proppant Solutions $710 $416 $835 $141 $242 $936
Industrial & Rec. Products 119 119 125 32 31 125
Total Revenue $829 $535 $960 $173 $273 $1,061
Revenue Growth (35%) 79%
Proppant Solutions $27.4 $2.9 $22.8 $12.2 $28.9 $26.3
Industrial & Rec. Products $18.6 $18.8 $21.8 $21.7 $19.3 $21.2
Total Gross Profit ($ / ton) $25.1 $7.3 $22.6 $14.3 $27.2 $25.4
Proppant Solutions $170 $18 $235 $25 $76 $285
Industrial & Rec. Products 43 47 54 13 11 52
Total Gross Profit $213 $65 $289 $38 $87 $337
Gross Profit % 26% 12% 30% 22% 32% 32%
Adjusted EBITDA $131 ($15) $195 $19 $67 $243
Key Financial Figures
43
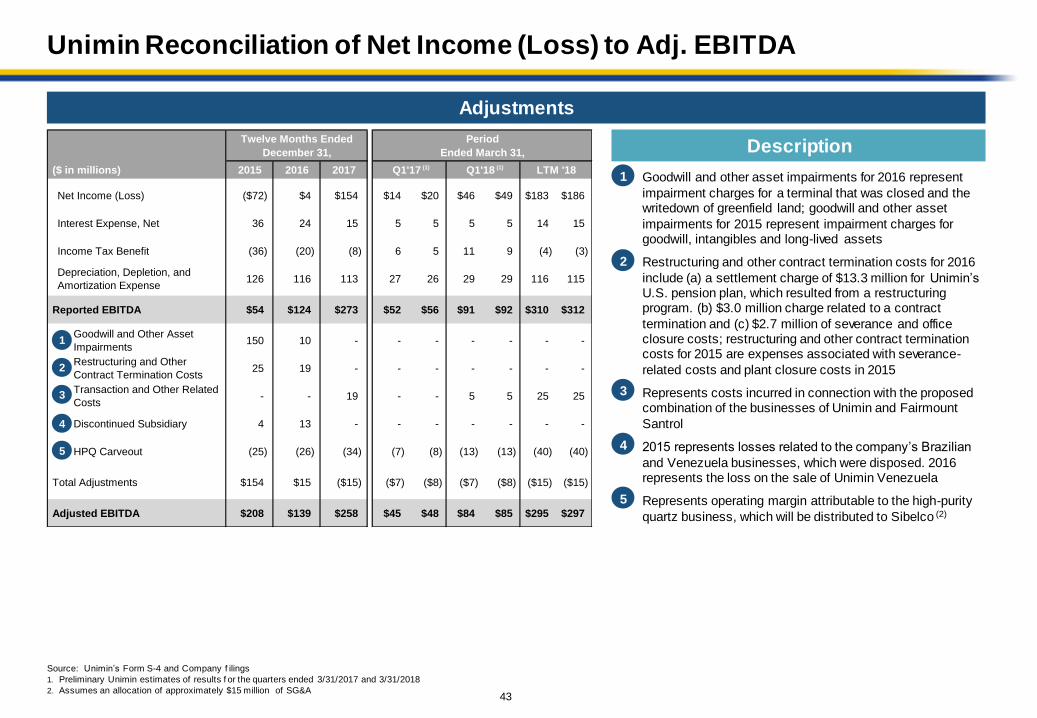
Unimin Reconciliation of Net Income (Loss) to Adj. EBITDA
Twelve Months Ended
December 31,
Period
Ended March 31,
($ in millions) 2015 2016 2017 Q1'17 (1) Q1'18 (1) LTM '18
Net Income (Loss) ($72) $4 $154 $14 $20 $46 $49 $183 $186
Interest Expense, Net 36 24 15 5 5 5 5 14 15
Income Tax Benefit (36) (20) (8) 6 5 11 9 (4) (3)
Depreciation, Depletion, and
Amortization Expense126 116 113 27 26 29 29 116 115
Reported EBITDA $54 $124 $273 $52 $56 $91 $92 $310 $312
Goodwill and Other Asset
Impairments150 10 - - - - - - -
Restructuring and Other
Contract Termination Costs25 19 - - - - - - -
Transaction and Other Related
Costs- - 19 - - 5 5 25 25
Discontinued Subsidiary 4 13 - - - - - - -
HPQ Carveout (25) (26) (34) (7) (8) (13) (13) (40) (40)
Total Adjustments $154 $15 ($15) ($7) ($8) ($7) ($8) ($15) ($15)
Adjusted EBITDA $208 $139 $258 $45 $48 $84 $85 $295 $297
Adjustments
Description
• Goodwill and other asset impairments for 2016 represent
impairment charges for a terminal that was closed and the writedown of greenfield land; goodwill and other asset
impairments for 2015 represent impairment charges for goodwill, intangibles and long-lived assets
• Restructuring and other contract termination costs for 2016
include (a) a settlement charge of $13.3 million for Unimin’sU.S. pension plan, which resulted from a restructuring program. (b) $3.0 million charge related to a contract
termination and (c) $2.7 million of severance and office closure costs; restructuring and other contract termination costs for 2015 are expenses associated with severance-
related costs and plant closure costs in 2015
• Represents costs incurred in connection with the proposed combination of the businesses of Unimin and Fairmount
Santrol
• 2015 represents losses related to the company’s Brazilian
and Venezuela businesses, which were disposed. 2016 represents the loss on the sale of Unimin Venezuela
• Represents operating margin attributable to the high-purity
quartz business, which will be distributed to Sibelco (2)
1
2
3
4
5
1
2
3
4
5
Source: Unimin’s Form S-4 and Company f ilings
1. Preliminary Unimin estimates of results f or the quarters ended 3/31/2017 and 3/31/2018
2. Assumes an allocation of approximately $15 million of SG&A
44
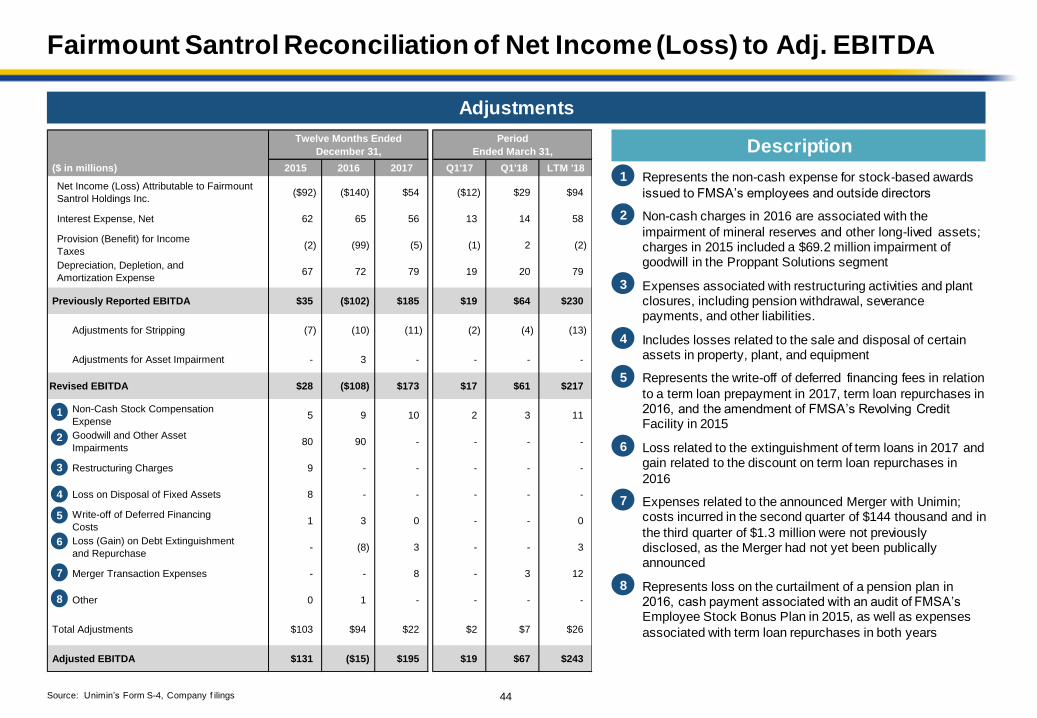
Fairmount Santrol Reconciliation of Net Income (Loss) to Adj. EBITDA
Description
• Represents the non-cash expense for stock-based awards
issued to FMSA’s employees and outside directors
• Non-cash charges in 2016 are associated with the
impairment of mineral reserves and other long-lived assets; charges in 2015 included a $69.2 million impairment of goodwill in the Proppant Solutions segment
• Expenses associated with restructuring activities and plant closures, including pension withdrawal, severance payments, and other liabilities.
• Includes losses related to the sale and disposal of certain assets in property, plant, and equipment
• Represents the write-off of deferred financing fees in relation
to a term loan prepayment in 2017, term loan repurchases in 2016, and the amendment of FMSA’s Revolving Credit Facility in 2015
• Loss related to the extinguishment of term loans in 2017 and gain related to the discount on term loan repurchases in
2016
• Expenses related to the announced Merger with Unimin; costs incurred in the second quarter of $144 thousand and in
the third quarter of $1.3 million were not previously disclosed, as the Merger had not yet been publically announced
• Represents loss on the curtailment of a pension plan in 2016, cash payment associated with an audit of FMSA’s Employee Stock Bonus Plan in 2015, as well as expenses
associated with term loan repurchases in both years
Twelve Months Ended
December 31,
Period
Ended March 31,
($ in millions) 2015 2016 2017 Q1'17 Q1'18 LTM '18
Net Income (Loss) Attributable to Fairmount
Santrol Holdings Inc.($92) ($140) $54 ($12) $29 $94
Interest Expense, Net 62 65 56 13 14 58
Provision (Benefit) for Income
Taxes(2) (99) (5) (1) 2 (2)
Depreciation, Depletion, and
Amortization Expense67 72 79 19 20 79
Previously Reported EBITDA $35 ($102) $185 $19 $64 $230
Adjustments for Stripping (7) (10) (11) (2) (4) (13)
Adjustments for Asset Impairment - 3 - - - -
Revised EBITDA $28 ($108) $173 $17 $61 $217
Non-Cash Stock Compensation
Expense5 9 10 2 3 11
Goodwill and Other Asset
Impairments80 90 - - - -
Restructuring Charges 9 - - - - -
Loss on Disposal of Fixed Assets 8 - - - - -
Write-off of Deferred Financing
Costs1 3 0 - - 0
Loss (Gain) on Debt Extinguishment
and Repurchase- (8) 3 - - 3
Merger Transaction Expenses - - 8 - 3 12
Other 0 1 - - - -
Total Adjustments $103 $94 $22 $2 $7 $26
Adjusted EBITDA $131 ($15) $195 $19 $67 $243
Adjustments
1
2
3
4
5
6
7
8
6
7
8
1
2
3
4
5
Source: Unimin’s Form S-4, Company f ilings