fall 2011 final p -...
TRANSCRIPT

FALL 2011 FINAL PROJECT
Student 2THE COOPER UNION FOR THE ADVANCEMENT OF SCIENCE AND ART
ChE142: Mass Transfer and Separation Process PrinciplesProfessor B. Davis
Fall 2011
Date of Submission: Monday, December 12, 2011

ChE142 Final Project Student 2
MEMO
To: Benjamin Davis, Project Manager, C Squared Consulting Associates, 41 Cooper Square, NY,NY 10003From: Student 2, Design Engineer, C Squared Consulting Associates, 41 Cooper Square, NY, NY10003Subject: Initial Proposal for Separation of a Four Component MixtureDate: Monday, December 12, 2011
This is a memo regarding an initial proposal for a separation plant to separate a 1000 kg mixtureof ethylbenzene (90%), ethanol (8%), ammonia (1%) and hydrogen sulfide (1%). Thermodynamicdata was based on the Peng-Robinson model (including data to calculate minimum work). Sepa-ration units were sized and costed. Sizing was done using Pro/II and confirmed by graphical andanalytical methods. Costing was based on Analysis, Synthesis, and Design of Chemical Processes,by Turton et al., 2nd edition.
This initial design is comprised of four distillation columns and a membrane. It separates themixture to four streams with at least 99% purity by mole while expending less than ten times theminimum work required to perform such a separation. The sizes of these columns are quite smallwhere diameters range from 0.2 to 1 ft and heights range from 10 to 24 ft. It is probable thatthese columns cannot physically be built and stand. Based on Turton et al., the linear velocity wasassumed to be 2 ft/sec. The extremely small diameters of two of the columns (Column 2 and Col-umn 3 in the PFD, See Appendix I) were calculated because diameter sizing is based on vapor flowrates. Vapor flow rates depend on the amount of light key components in the column. Ammoniaand ethanol in columns 2 and 3, respectively, are quite low in comparison to the amount of heavykey present (ethanol and ethylbenzene respectively). Consequently, the cost of the column shellsand trays are low as well, totaling about $29,000. Reboilers and condensers were sized to haveareas ranging from 1.4×10⁻⁴ to 5.4×10⁻² m2 and costing was based on prices for kettle reboilersand double pipe condensers. Costing for these heat exchangers were overestimated because cost-ing information was only valid for equipment larger than those specified in this PFD. Total costsfor heat exchangers came to $33,000.
The thermoplastic polyphenylene sulfide membrane that is used to further separate a mixturelargely composed of ammonia and hydrogen sulfide has an area of 1.5×106 ft2 and a thickness of0.00085 mil. The pressure of the feed entering the membrane is 29 psia and the pressure on thepermeate side of the membrane is 2 psia. Professional Plastics (www.professionalplastics.com)was used to cost the polyphenylene sulfide film used for the membrane. DIPPR was used to deter-mine permeance for this material. Cost per membrane was roughly $22,000.
Taking into account the utilities that are needed for the condensers and reboilers, and annualmembrane replacements for a ten-year plant life, capital costs and annual costs for that time periodtotal to about $300,000. This is relatively cheap for a plant but the lack of feasibility for buildingsuch a plant due to the size of the columns suggests that further examination of the process is nec-essary. Safety issues should be explored if such pressure conditions are considered when buildinga membrane.
See appendices for a PFD of this design and other related details. Let me know if you have anyquestions and I will keep you posted on future work.
2
ChE142 Final Project Student 2
Appendices
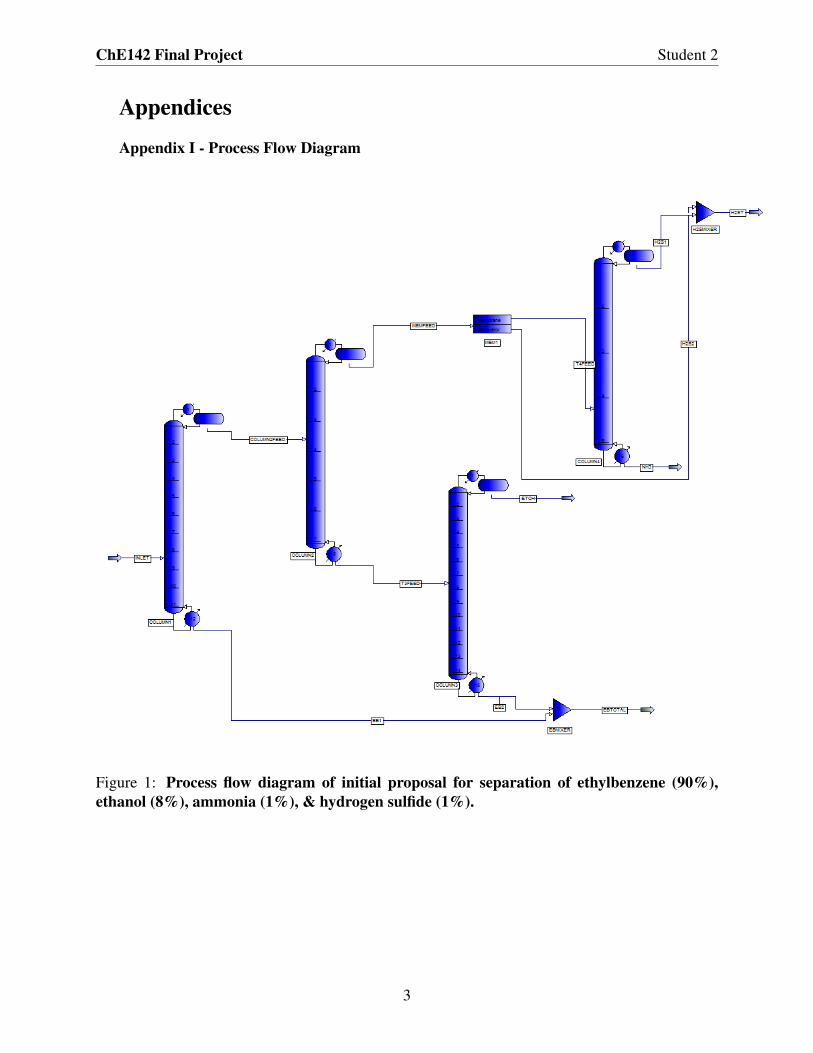
Appendix I - Process Flow Diagram
Figure 1: Process flow diagram of initial proposal for separation of ethylbenzene (90%),ethanol (8%), ammonia (1%), & hydrogen sulfide (1%).
3
ChE142 Final Project Student 2
Appendix I (cont’d)
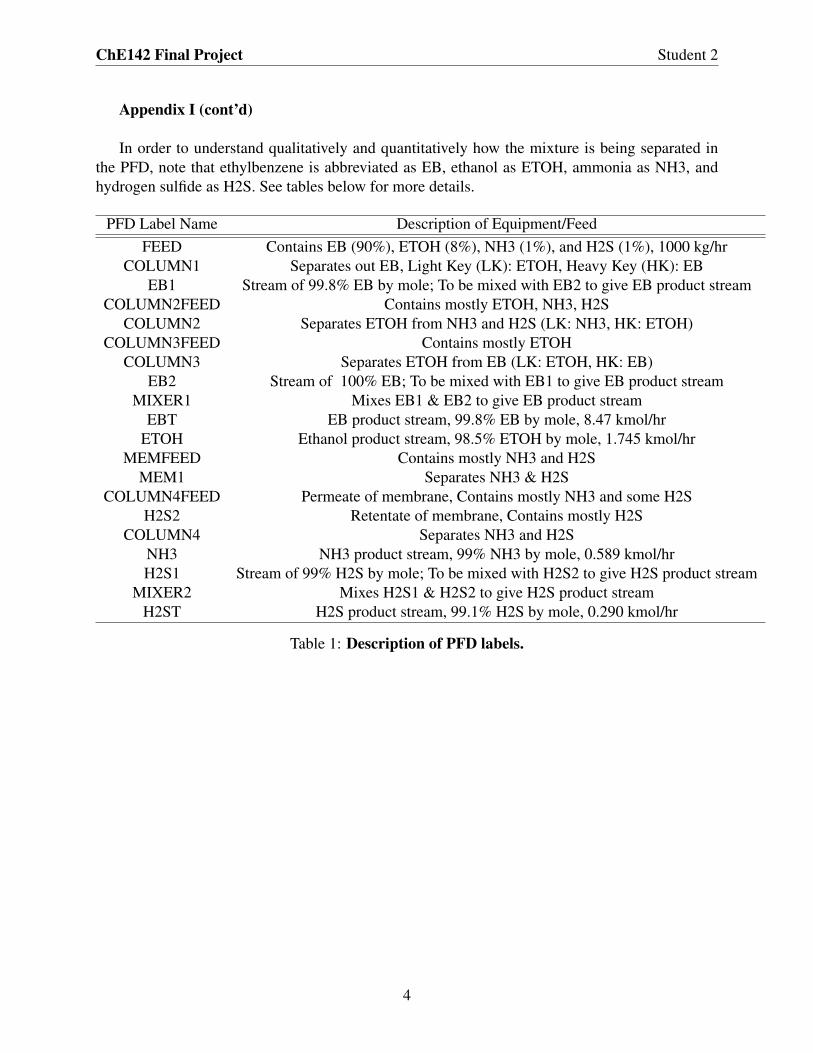
In order to understand qualitatively and quantitatively how the mixture is being separated inthe PFD, note that ethylbenzene is abbreviated as EB, ethanol as ETOH, ammonia as NH3, andhydrogen sulfide as H2S. See tables below for more details.
PFD Label Name Description of Equipment/FeedFEED Contains EB (90%), ETOH (8%), NH3 (1%), and H2S (1%), 1000 kg/hr
COLUMN1 Separates out EB, Light Key (LK): ETOH, Heavy Key (HK): EBEB1 Stream of 99.8% EB by mole; To be mixed with EB2 to give EB product stream
COLUMN2FEED Contains mostly ETOH, NH3, H2SCOLUMN2 Separates ETOH from NH3 and H2S (LK: NH3, HK: ETOH)
COLUMN3FEED Contains mostly ETOHCOLUMN3 Separates ETOH from EB (LK: ETOH, HK: EB)
EB2 Stream of 100% EB; To be mixed with EB1 to give EB product streamMIXER1 Mixes EB1 & EB2 to give EB product stream
EBT EB product stream, 99.8% EB by mole, 8.47 kmol/hrETOH Ethanol product stream, 98.5% ETOH by mole, 1.745 kmol/hr
MEMFEED Contains mostly NH3 and H2SMEM1 Separates NH3 & H2S
COLUMN4FEED Permeate of membrane, Contains mostly NH3 and some H2SH2S2 Retentate of membrane, Contains mostly H2S
COLUMN4 Separates NH3 and H2SNH3 NH3 product stream, 99% NH3 by mole, 0.589 kmol/hrH2S1 Stream of 99% H2S by mole; To be mixed with H2S2 to give H2S product stream
MIXER2 Mixes H2S1 & H2S2 to give H2S product streamH2ST H2S product stream, 99.1% H2S by mole, 0.290 kmol/hr
Table 1: Description of PFD labels.
4
ChE142 Final Project Student 2
Com
pone
nt/P
aram
eter
Stre
amFE
ED
CO
LU
MN
2FE
ED
EB
1M
EM
FEE
DC
OL
UM
N3F
EE
DE
TOH
EB
2C
OL
UM
N4F
EE
DH
2S2
H2S
1N
H3
EB
TH
2ST
Phas
eM
ixed
Liq
uid
Liq
uid
Liq
uid
Liq
uid
Liq
uid
Liq
uid
Vap
orM
ixed
Liq
uid
Liq
uid
Mix
edM
ixed
Tem
pera
ture
(F)
170.
335
.633
8.3
-26.
122
3.4
213.
635
0.5
-26.
1-2
6.1
-145
.0-9
7.5
338.
3-1
44.4
Pres
sure
(psi
a)29
.429
.034
.029
.034
.034
.039
.02.
029
.01.
51.
534
.01.
5E
thyl
benz
ene
0.76
40.
160
0.99
80
0.22
30.
014
1.00
00
00
00.
998
0A
mm
onia
0.05
30.
190
00.
665
0.00
10.
001
00.
880
0.00
40.
010
0.99
00
0.00
6H
ydro
gen
sulfi
de0.
026
0.09
50
0.33
40
00
0.12
00.
991
0.99
00.
010
00.
991
Eth
anol
0.15
70.
556
0.00
20.
001
0.77
60.
985
00
0.00
40
00.
002
0.00
3
Mol
arFl
owra
te(k
g mol
/hr)
11.0
943.
094
8.00
00.
879
2.21
51.
745
0.47
00.
664
0.21
50.
075
0.58
98.
470
0.29
0
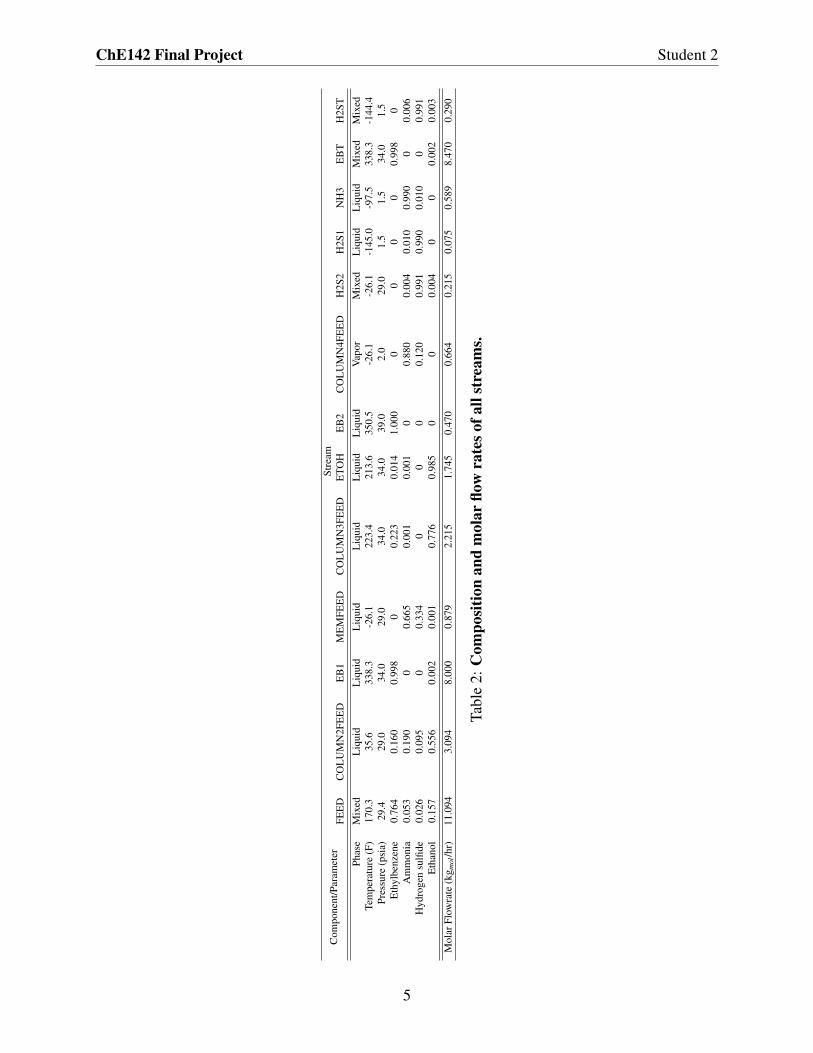
Tabl
e2:
Com
posi
tion
and
mol
arflo
wra
teso
fall
stre
ams.
5

ChE142 Final Project Student 2
Appendix II - Mass Recovered
To confirm that no more than 90% of the original feed’s mass was lost to waste or burned forheat, the mass recovered was determined by summing the mass flow rates of the product streamsand comparing it to the mass flow rate of the feed.
Product Stream Molar Flow Rate (kmol/hr)EB 8.47
ETOH 1.75NH3 0.59H2S 0.29Total 11.1
Table 3: Molar flow rates of outlet/product streams.
The inlet feed’s molar flow rate was 11.1 kmol/hr. The percent of mass recovered:
Mass Flow Rate InMass Flow Rate Out
=11.111.1
×100% = 100% (1)
This confirms that no mass was lost due to waste streams or burned for heat. This fulfills therequirement that no more than 90% of the mass should be wasted.
6

ChE142 Final Project Student 2
Appendix III - Calculation and Comparison to Minimum Work Required
The minimum work of separation is defined as (Separation Process Principles, by Seader et al.:
Wmin = Σoutnb−Σinnb (2)
whereb = h−T0s (3)
and T0 = ambient temperatureThere was one stream into the system (FEED) and four streams coming out of the system (EB,
ETOH, NH3, H2S). For each stream, nb was calculated:
nb = m× (h−T0s) (4)
where m = mass flow rate (kg/hr), h = specific enthalpy (BTU/kg), T0 = ambient temperature (F), s= specific entropy (BTU/kgF)
For FEED:
1000 kg/hr(150.03 BTU/kg− (300 F∗2.54 BTU/kgF)) =−610993 BTU/hr (5)
For EBT:
898.18 kg/hr(310.14 BTU/kg− (300 F∗2.71 BTU/kgF)) =−450387 BTU/hr (6)
For ETOH:
81.82 kg/hr(254.11 BTU/kg− (300 F∗2.74 BTU/kgF)) =−46450 BTU/hr (7)
For NH3:
10.13 kg/hr(−281.15 BTU/kg− (300 F∗2.81 BTU/kgF)) =−11392 BTU/hr (8)
For H2S:
9.88 kg/hr(30.53 BTU/kg− (300 F∗2.19 BTU/kgF)) =−6181 BTU/hr (9)
Calculating Wmin,
Wmin = (−450387+−46450+−11392+−6181)− (−610993) = 96693 BTU/hr (10)
The maximum W allowed is ten times Wmin which is 966934 BTU/hr.To determine the work used in this PFD, the heat duties of all of the reboilers and condensers
were considered: Heat duties of reboilers were contributed to the work used and those of thecondensers released work that could be used elsewhere.
7
ChE142 Final Project Student 2
Appendix III - Calculation and Comparison to Minimum Work Required (cont’d)
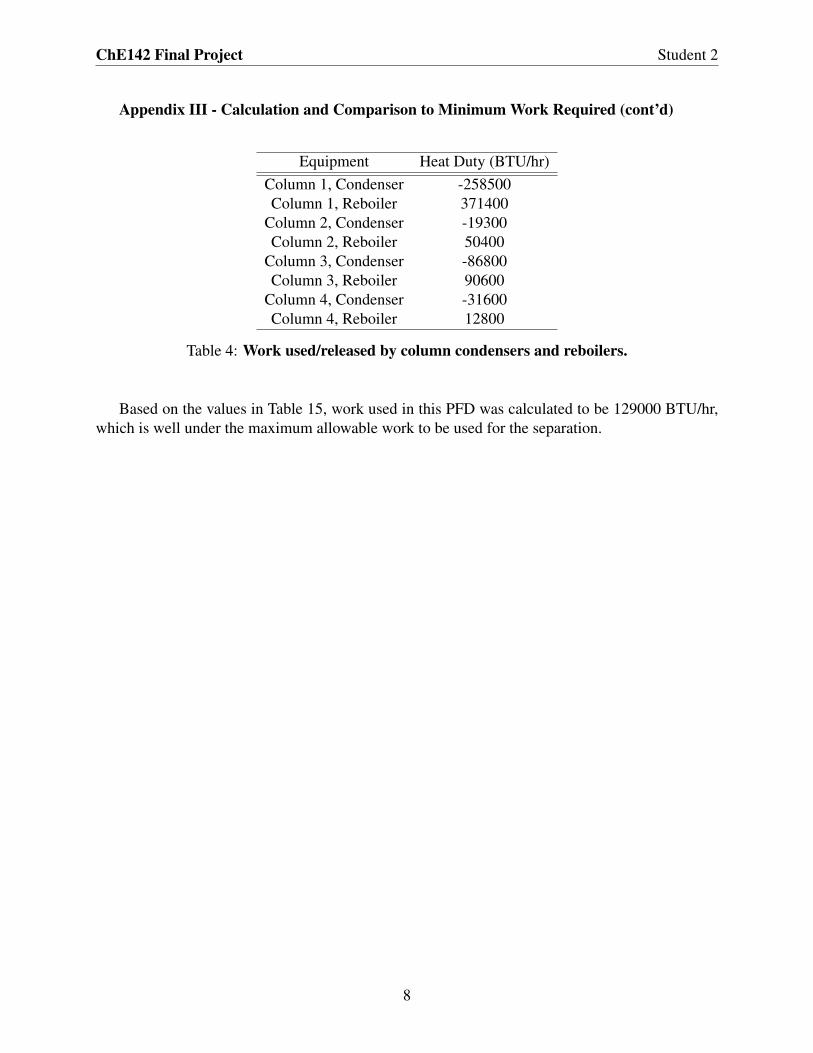
Equipment Heat Duty (BTU/hr)Column 1, Condenser -258500Column 1, Reboiler 371400
Column 2, Condenser -19300Column 2, Reboiler 50400
Column 3, Condenser -86800Column 3, Reboiler 90600
Column 4, Condenser -31600Column 4, Reboiler 12800
Table 4: Work used/released by column condensers and reboilers.
Based on the values in Table 15, work used in this PFD was calculated to be 129000 BTU/hr,which is well under the maximum allowable work to be used for the separation.
8

ChE142 Final Project Student 2
Appendix IV - Number of Trays of Column from Pro/II & Graphical Confirmation ofDistillation Column Sizing for Columns 1-4
Column Number of TraysColumn 1 12Column 2 8Column 3 15Column 4 6
Table 5: Number of trays in distillation columns from Pro/II.
For confirmation, see attached pages for these calculations done graphically via McCabe-ThieleMethod. The number of trays determined graphically were of the same magnitude as those foundvia Pro/II (above). The McCabe-Thiele Method is outlined below:
1. Generate binary vapor liquid equilibirum data and x = y line using Pro/II. Specify the lightkey as the ”first component”
2. Determine the concentration of the light key in the feed (z f ), the concentration of the lightkey in the distillate (xD), and the concentration of the light key in the bottoms (xB).
3. Determine q based on the conditions of the feed.
4. Determine q-line equation based on its equation:
y = (q
q−1)x− zF
q−1(11)
5. Because all feeds were assumed to be liquid, q = 1 and q-lines were vertical and passedthrough zF on the x-axis.
6. The minimum L/V lines were drawn - the rectifying section passed through the x=y line at x= 0.99 and where the q-line intersects the equilibirum curve, and the stripping section passedthrough where the q-line intersects the equilibirum curve and the x=y lines at x = 0.01.
7. The minimum number of trays was determined by drawing steps between the x=y line andthe equilibrium curve.
8. The slope of the L/V minimum line, rectifying section, was found and set to RminRmin+1 . Rmin
was calculated.
9. The following relationship from Turton et al. heuristics was used to determine R, R =1.5Rmin.
10. This value of R was used to determine the slope of the actual L/V line, rectifying section.
11. The actual L/V line was plotted and steps were drawn between this line and the equilibriumcurve to determine the actual number of trays.
9

Please note the following things about the graphs:
• One McCabe-Thiele plot was done for Columns 1, 2, 3 for initial and revised designs becausesimilar if not the same conditions (pressure of feed, and compositions of the feed, distillate,and bottoms) occurred
• A ratio of 1.5 for R/Rmin was used based on heuristics from Turton et al.. This differs fromthe R used in Pro/II calculations. This may contribute to discrepancies between the actualtrays numbers calculated by Pro/II and graphically.
• The blue line in each plot is the 45◦ line, which represents the reflux ratio when there isinfinite reflux.
• The green line in each plot represents the equilibrium data for the binary mixture.
• The composition of the light key z f used in the plot was adjusted when assuming a psuedo-binary mixture using the following normalization:
z f =Mole fraction of Light Key
Mole fraction of Light Key + Mole fraction of Heavy Key(12)
• The mole fractions of the light key in the distillate and bottoms (xD and xB respectively) wascalculated from Pro/II results and if they were greater than 0.99 or less than 0.01, respec-tively, vales were just taken to be 0.99 or 0.01, respectively because it is difficult to graphvalues greater than 0.99 or less than 0.01.
• It was assumed that all feeds were at its bubble point so all the feed was a liquid. This led qto equal 1 and the q-line to always be a vertical line that passed through z f , the compositionof the light key in the feed.
• The ”count” of the minimum number of trays is ”inside” the step on the graph and the”count” of the actual number of trays is ”outside” the step on the graph.
10
ChE142 Final Project Student 2
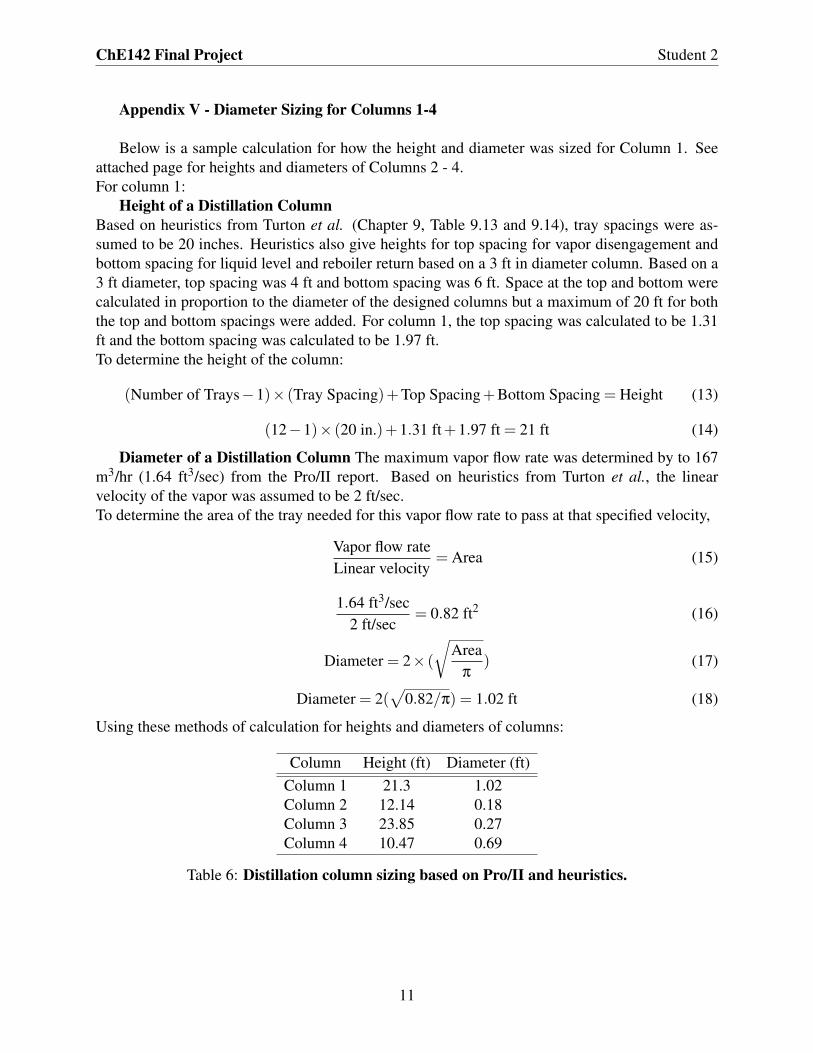
Appendix V - Diameter Sizing for Columns 1-4
Below is a sample calculation for how the height and diameter was sized for Column 1. Seeattached page for heights and diameters of Columns 2 - 4.For column 1:
Height of a Distillation ColumnBased on heuristics from Turton et al. (Chapter 9, Table 9.13 and 9.14), tray spacings were as-sumed to be 20 inches. Heuristics also give heights for top spacing for vapor disengagement andbottom spacing for liquid level and reboiler return based on a 3 ft in diameter column. Based on a3 ft diameter, top spacing was 4 ft and bottom spacing was 6 ft. Space at the top and bottom werecalculated in proportion to the diameter of the designed columns but a maximum of 20 ft for boththe top and bottom spacings were added. For column 1, the top spacing was calculated to be 1.31ft and the bottom spacing was calculated to be 1.97 ft.To determine the height of the column:
(Number of Trays−1)× (Tray Spacing)+Top Spacing+Bottom Spacing = Height (13)
(12−1)× (20 in.)+1.31 ft+1.97 ft = 21 ft (14)
Diameter of a Distillation Column The maximum vapor flow rate was determined by to 167m3/hr (1.64 ft3/sec) from the Pro/II report. Based on heuristics from Turton et al., the linearvelocity of the vapor was assumed to be 2 ft/sec.To determine the area of the tray needed for this vapor flow rate to pass at that specified velocity,
Vapor flow rateLinear velocity
= Area (15)
1.64 ft3/sec2 ft/sec
= 0.82 ft2 (16)
Diameter = 2× (
√Area
π) (17)
Diameter = 2(√
0.82/π) = 1.02 ft (18)
Using these methods of calculation for heights and diameters of columns:
Column Height (ft) Diameter (ft)Column 1 21.3 1.02Column 2 12.14 0.18Column 3 23.85 0.27Column 4 10.47 0.69
Table 6: Distillation column sizing based on Pro/II and heuristics.
11
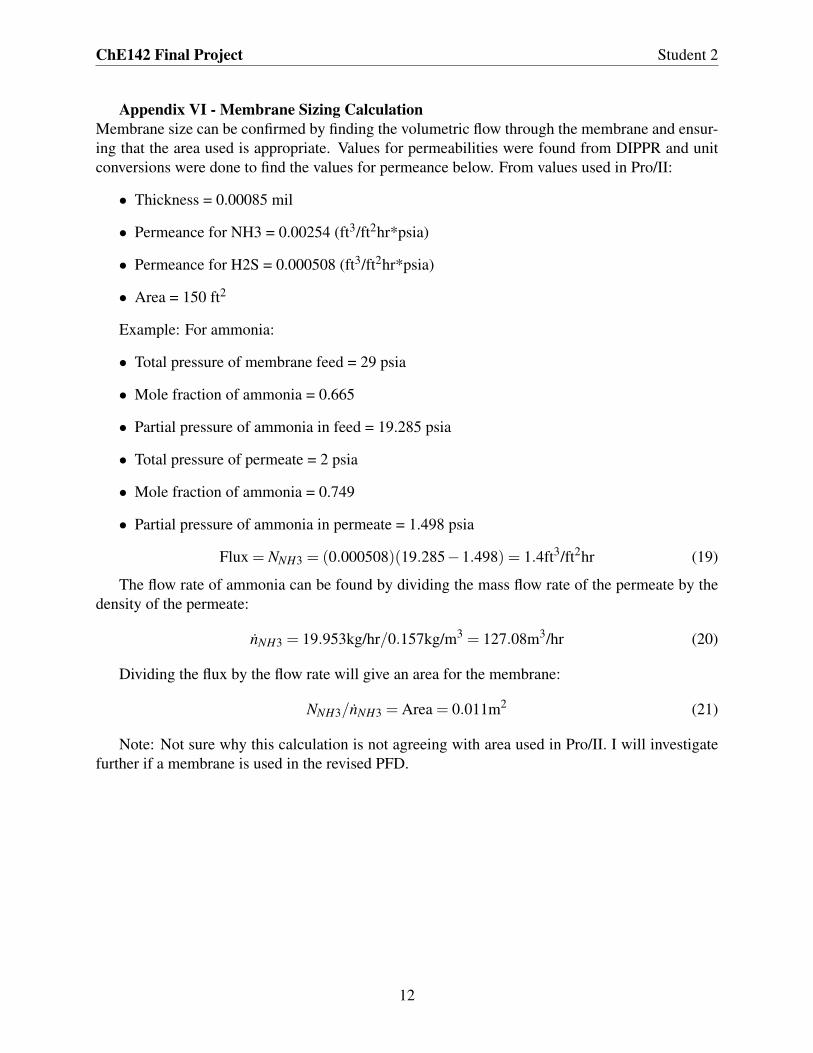
ChE142 Final Project Student 2
Appendix VI - Membrane Sizing CalculationMembrane size can be confirmed by finding the volumetric flow through the membrane and ensur-ing that the area used is appropriate. Values for permeabilities were found from DIPPR and unitconversions were done to find the values for permeance below. From values used in Pro/II:
• Thickness = 0.00085 mil
• Permeance for NH3 = 0.00254 (ft3/ft2hr*psia)
• Permeance for H2S = 0.000508 (ft3/ft2hr*psia)
• Area = 150 ft2
Example: For ammonia:
• Total pressure of membrane feed = 29 psia
• Mole fraction of ammonia = 0.665
• Partial pressure of ammonia in feed = 19.285 psia
• Total pressure of permeate = 2 psia
• Mole fraction of ammonia = 0.749
• Partial pressure of ammonia in permeate = 1.498 psia
Flux = NNH3 = (0.000508)(19.285−1.498) = 1.4ft3/ft2hr (19)
The flow rate of ammonia can be found by dividing the mass flow rate of the permeate by thedensity of the permeate:
nNH3 = 19.953kg/hr/0.157kg/m3 = 127.08m3/hr (20)
Dividing the flux by the flow rate will give an area for the membrane:
NNH3/nNH3 = Area = 0.011m2 (21)
Note: Not sure why this calculation is not agreeing with area used in Pro/II. I will investigatefurther if a membrane is used in the revised PFD.
12
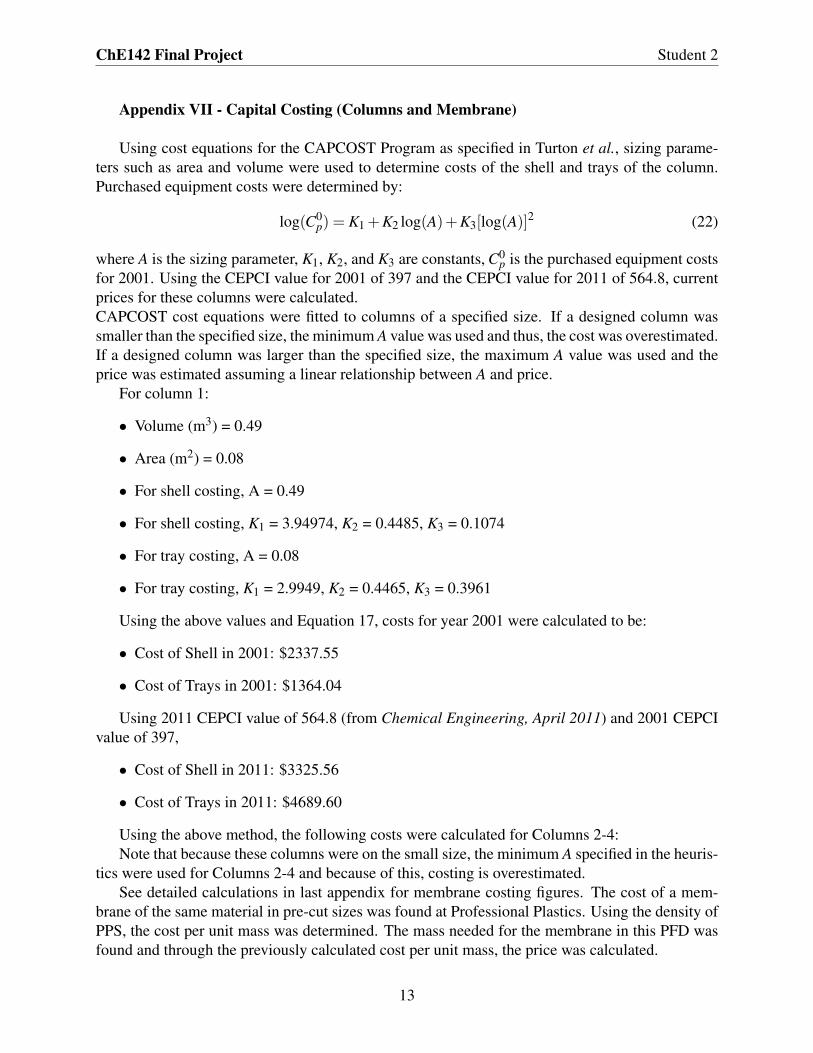
ChE142 Final Project Student 2
Appendix VII - Capital Costing (Columns and Membrane)
Using cost equations for the CAPCOST Program as specified in Turton et al., sizing parame-ters such as area and volume were used to determine costs of the shell and trays of the column.Purchased equipment costs were determined by:
log(C0p) = K1 +K2 log(A)+K3[log(A)]2 (22)
where A is the sizing parameter, K1, K2, and K3 are constants, C0p is the purchased equipment costs
for 2001. Using the CEPCI value for 2001 of 397 and the CEPCI value for 2011 of 564.8, currentprices for these columns were calculated.CAPCOST cost equations were fitted to columns of a specified size. If a designed column wassmaller than the specified size, the minimum A value was used and thus, the cost was overestimated.If a designed column was larger than the specified size, the maximum A value was used and theprice was estimated assuming a linear relationship between A and price.
For column 1:
• Volume (m3) = 0.49
• Area (m2) = 0.08
• For shell costing, A = 0.49
• For shell costing, K1 = 3.94974, K2 = 0.4485, K3 = 0.1074
• For tray costing, A = 0.08
• For tray costing, K1 = 2.9949, K2 = 0.4465, K3 = 0.3961
Using the above values and Equation 17, costs for year 2001 were calculated to be:
• Cost of Shell in 2001: $2337.55
• Cost of Trays in 2001: $1364.04
Using 2011 CEPCI value of 564.8 (from Chemical Engineering, April 2011) and 2001 CEPCIvalue of 397,
• Cost of Shell in 2011: $3325.56
• Cost of Trays in 2011: $4689.60
Using the above method, the following costs were calculated for Columns 2-4:Note that because these columns were on the small size, the minimum A specified in the heuris-
tics were used for Columns 2-4 and because of this, costing is overestimated.See detailed calculations in last appendix for membrane costing figures. The cost of a mem-
brane of the same material in pre-cut sizes was found at Professional Plastics. Using the density ofPPS, the cost per unit mass was determined. The mass needed for the membrane in this PFD wasfound and through the previously calculated cost per unit mass, the price was calculated.
13
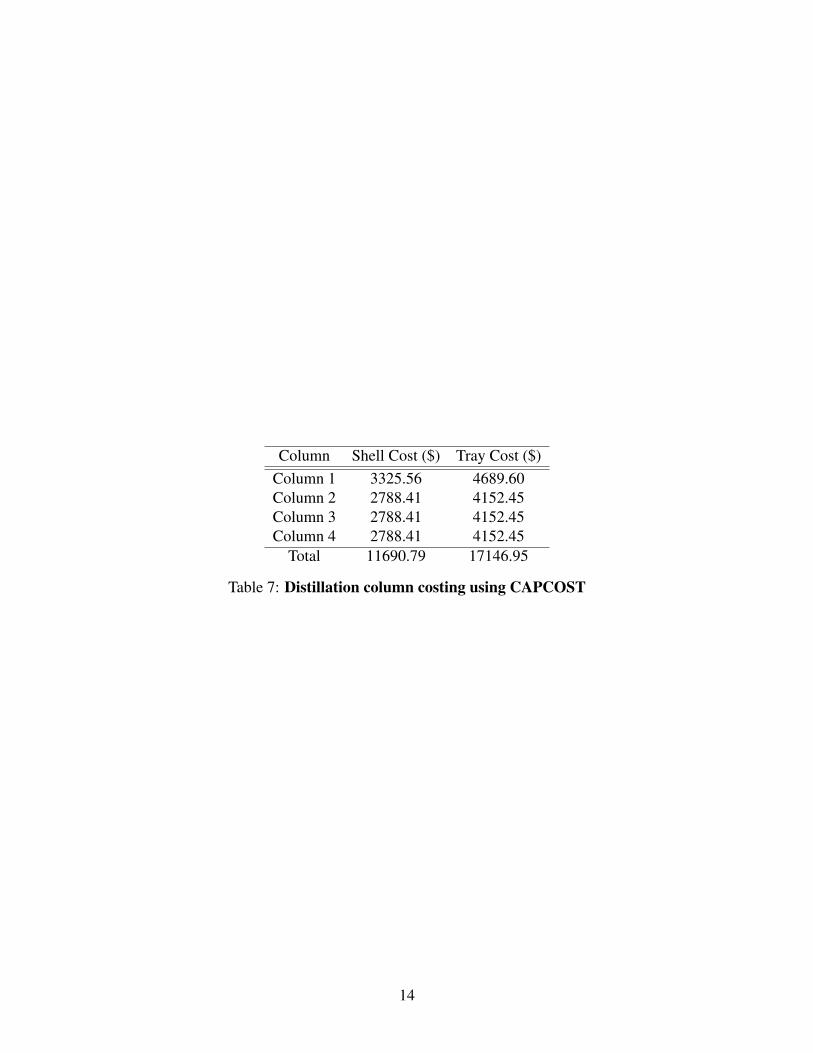
Column Shell Cost ($) Tray Cost ($)Column 1 3325.56 4689.60Column 2 2788.41 4152.45Column 3 2788.41 4152.45Column 4 2788.41 4152.45
Total 11690.79 17146.95
Table 7: Distillation column costing using CAPCOST
14
ChE142 Final Project Student 2
Appendix VIII - Heat Exchanger Sizing & Costing
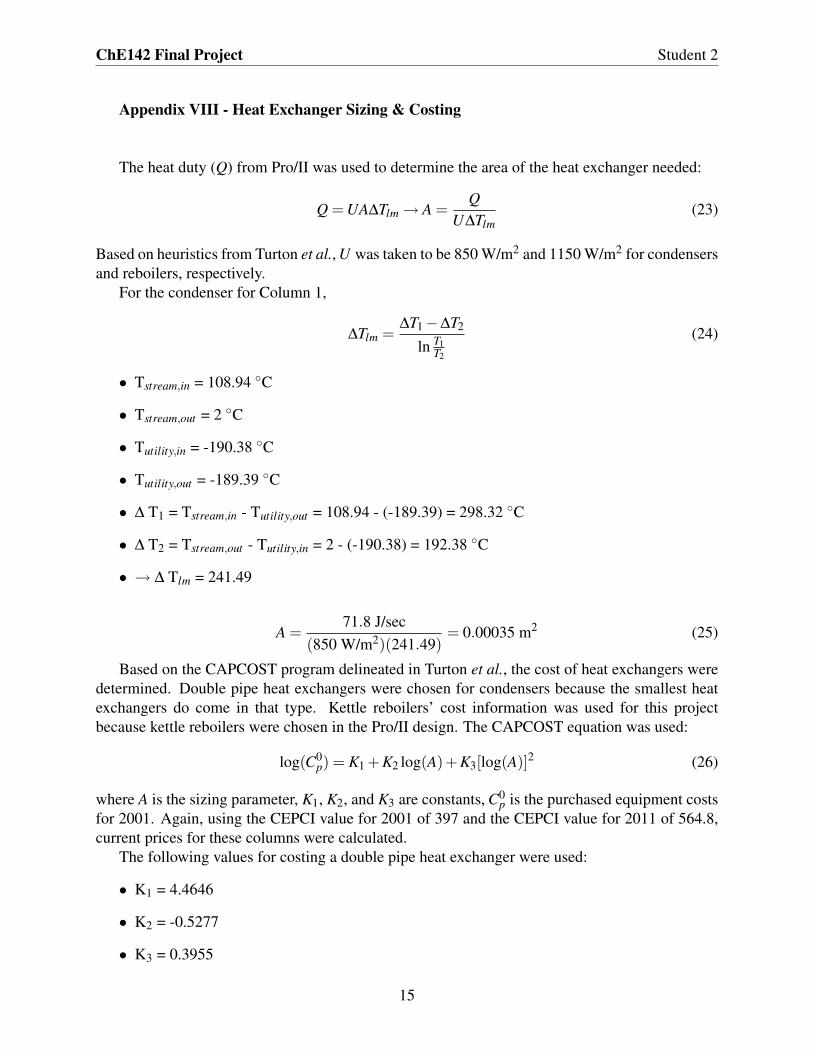
The heat duty (Q) from Pro/II was used to determine the area of the heat exchanger needed:
Q = UA∆Tlm→ A =Q
U∆Tlm(23)
Based on heuristics from Turton et al., U was taken to be 850 W/m2 and 1150 W/m2 for condensersand reboilers, respectively.
For the condenser for Column 1,
∆Tlm =∆T1−∆T2
ln T1T2
(24)
• Tstream,in = 108.94 ◦C
• Tstream,out = 2 ◦C
• Tutility,in = -190.38 ◦C
• Tutility,out = -189.39 ◦C
• ∆ T1 = Tstream,in - Tutility,out = 108.94 - (-189.39) = 298.32 ◦C
• ∆ T2 = Tstream,out - Tutility,in = 2 - (-190.38) = 192.38 ◦C
• → ∆ Tlm = 241.49
A =71.8 J/sec
(850 W/m2)(241.49)= 0.00035 m2 (25)
Based on the CAPCOST program delineated in Turton et al., the cost of heat exchangers weredetermined. Double pipe heat exchangers were chosen for condensers because the smallest heatexchangers do come in that type. Kettle reboilers’ cost information was used for this projectbecause kettle reboilers were chosen in the Pro/II design. The CAPCOST equation was used:
log(C0p) = K1 +K2 log(A)+K3[log(A)]2 (26)
where A is the sizing parameter, K1, K2, and K3 are constants, C0p is the purchased equipment costs
for 2001. Again, using the CEPCI value for 2001 of 397 and the CEPCI value for 2011 of 564.8,current prices for these columns were calculated.
The following values for costing a double pipe heat exchanger were used:
• K1 = 4.4646
• K2 = -0.5277
• K3 = 0.3955
15

The following values for costing a kettle reboiler were used:
• K1 = 3.3444
• K2 = 0.2745
• K3 = -0.0472
The following A values were calculated and based on the minimum and maximum values sug-gested by the CAPCOST program, prices were adjusted:
Column Condenser/Reboiler A (m2) calculated A (m2) used C0p in 2001 ($) C0
p in 2011 ($)Column 1 Condenser 0.00035 1 2,210 3,144Column 2 Condenser 0.000038 1 2,210 3,144Column 3 Condenser 0.00073 1 2,210 3,144Column 4 Condenser 0.00011 1 2,210 3,144Column 1 Reboiler 0.0048 10 3,730 5,306Column 2 Reboiler 0.000245 10 3,730 5,306Column 3 Reboiler 0.0018 10 3,730 5,306Column 4 Reboiler 0.000039 10 3,730 5,306
Table 8: Distillation column costing using CAPCOST
16

ChE142 Final Project Student 2
Appendix IX - Utilities Costing (Based on 10-Year Plant Life)
Utilities used for the condensers and reboilers associated with the distillation columns wereconsidered. Pure liquid nitrogen, cooling/pure water, and three different types of steams were usedbased on the desired temperature changes in the streams.
An example of how sizing and costing of heat exchangers and utilities is shown below usingthe condenser of Column 1. The vapor going into the condenser is at 382 K and the stream leavingthe condenser is at 275 K. The heat duty is known from Pro/II to be 273 kJ/hr. Because a utilityis needed at a temperature lower than 275 K, cooling water at 305 K, although cheaper was notsufficient. Thus, liquid nitrogen, at 77 K was chosen. The boiling point of nitrogen at this column’stop tray pressure is approximately 83 K (DIPPR) and it was assumed that nitrogen at 77 K is closeenough to this point that the heat of vaporization can be used to determine the mass flow rate ofthe utility needed. Due to this assumption, the temperature change of the nitrogen was taken to be82.62 K to 83.62 K.
Q = mHvap→ m =Q
Hvap(27)
m =272.7 kJ/hr
5346 kJ/kmol= 0.05 kmol/hr of pure liquid nitrogen needed (28)
Costing information for pure liquid nitrogen was given to be $0.10/L at 77 K. I am not sure ifa heat exchanger would be necessary to get the nitrogen up to its boiling point but the temperaturedifference is small between 77 K and 83 K so I will consider it negligible. Several unit conversionswere done to determine the volume of liquid nitrogen per hour is needed. Costing was done for aplant that operates 365 days/year. Most likely, this will not happen due to maintenance work andother unexpected events so again, this will be an overestimation of utility costs.
0.05 kmol/hr27.83 kmol/m3 = 0.0017 m3/hr (29)
0.0017 m3/hr×1000 L/m3 = 1.7 L/hr (30)
1.7 L/hr×$0.10/L = $0.17/hr (31)
$0.17/hr×24hr/day×365days/year = $1,522/year (32)
(Note: Numbers may be slightly off because of round-off error. Calculations were done using moresignificant figures and rounded off at the end)
For utilities used that were not near their boiling points such as for cooling water or whereit was irrelevant to use the heat of vaporization such as in the case of steam in the reboilers, thespecific heats of these utilities were used to determine mass flow rate needed for these utilities andsize of the heat exchangers:
Q = mcp∆T → m =Q
cp∆T(33)
Using similar methods as above (different unit conversions based on costing information units),the price for each utility was determined:
The cost for each utility used is given below:
17

Column Condenser/Reboiler Utility Used Mass Flow Rate (kmol/hr) Price ($/year)Column 1 Condenser Liquid nitrogen 0.048 1522Column 2 Condenser Liquid nitrogen 0.0036 114Column 3 Condenser Cooling water 0.013 0.04Column 4 Condenser Liquid nitrogen 0.0059 186Column 1 Reboiler 125# steam 0.23 363Column 2 Reboiler 20# steam 0.031 35Column 3 Reboiler 125# steam 0.056 71Column 4 Reboiler 20# steam 0.0076 8
Table 9: Utilities costing
Utility CostPure liquid nitrogen (77K) $0.10/LCooling pure water (90F) $0.08/1000 gallons600# steam (490F, HP) $10/metric ton125# steam (353F, MP) $8/metric ton20# steam (260F, LP) $7/metric ton
Table 10: Utilities costing information
18
ChE142 Final Project Student 2
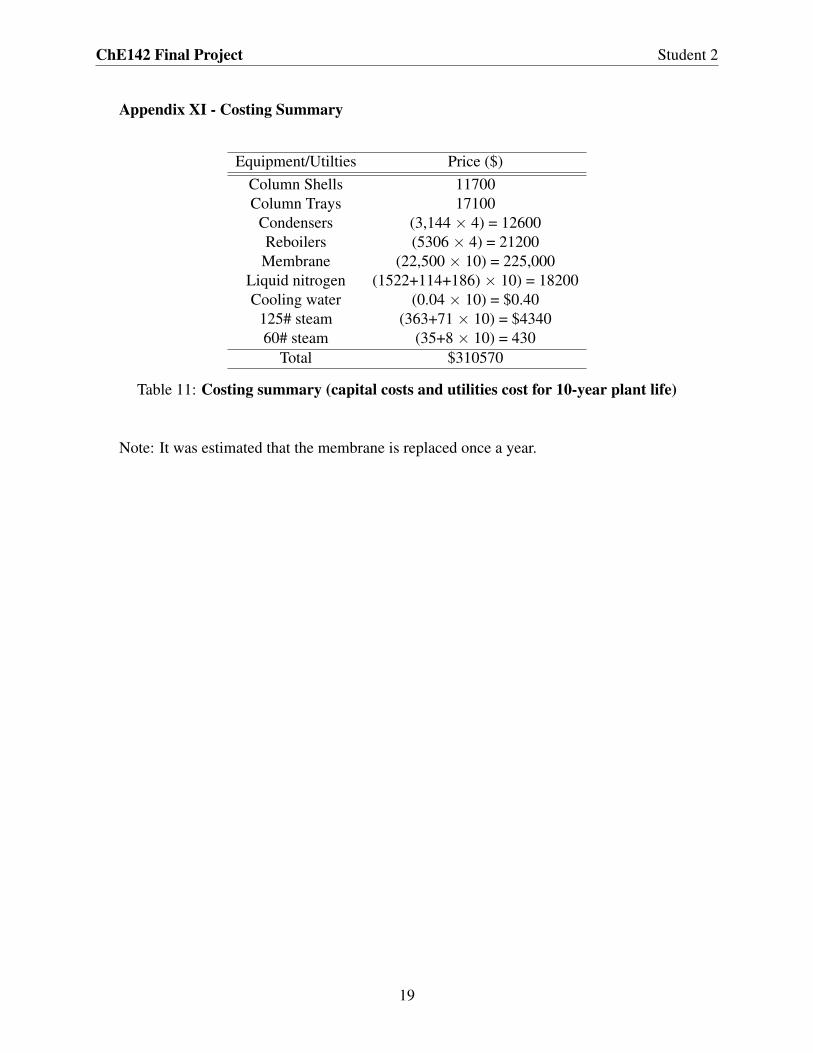
Appendix XI - Costing Summary
Equipment/Utilties Price ($)Column Shells 11700Column Trays 17100
Condensers (3,144 × 4) = 12600Reboilers (5306 × 4) = 21200Membrane (22,500 × 10) = 225,000
Liquid nitrogen (1522+114+186) × 10) = 18200Cooling water (0.04 × 10) = $0.40
125# steam (363+71 × 10) = $434060# steam (35+8 × 10) = 430
Total $310570
Table 11: Costing summary (capital costs and utilities cost for 10-year plant life)
Note: It was estimated that the membrane is replaced once a year.
19

ChE142 Final Project Student 2
Appendix XII - Detailed Tables of All CalculationsSee attached pages.
20
ChE142 Final Project Student 2
MEMO
To: Benjamin Davis, Project Manager, C Squared Consulting Associates, 41 Cooper Square, NY,NY 10003From: Student 2, Design Engineer, C Squared Consulting Associates, 41 Cooper Square, NY, NY10003Subject: Revised Proposal for Separation of a Four Component MixtureDate: Tuesday, January 16, 2012
This is a memo regarding a revised proposal for a separation plant to separate a 1000 kgmixture of ethylbenzene (90%), ethanol (8%), ammonia (1%) and hydrogen sulfide (1%). Likethe previous evaluation, thermodynamic data was based on the Peng-Robinson model (includingentropy and enthalpy values for minimum work calculations), and separation units were sized andcosted. Sizing was done using Pro/II and confirmed by graphical methods. Costing was based onAnalysis, Synthesis, and Design of Chemical Processes, by Turton et al., 2nd edition.
This revised design is comprised of only four distillation columns. Although this design costsmore, I am recommending it because it is possible for these columns to be built. They are notunreasonably skinny like the previous PFD. It separates the mixture to four streams with at least99% purity by mole while expending less than ten times the minimum work required to performsuch a separation. The sizes of these columns are much bigger than the initial proposal. Diametersrange from 8 to 33 ft and heights range from 27 to 53 ft. Although these columns can be built,this plant would be abnormally large. Based on Turton et al., the linear velocity was assumed tobe 2 ft/sec. Consequently, the cost of the column shells and trays are higher than the previousproposal, totaling about $1.7 million. Reboilers and condensers were sized to have areas rangingfrom 3×10⁻¹ to 1.8 ft2 and costing was based on prices for kettle reboilers and double pipe con-densers. Costing for these heat exchangers were overestimated because costing information wasonly valid for equipment larger than those specified in this PFD. Total costs for heat exchangerscame to $33,000. This is comparable to the heat exchangers costed for the previous PFD.
Taking into account the utilities that are needed for the condensers and reboilers, capital andannual costs for that time period total to about $31 million. This is much more expensive than theinitial proposal. Again, these sizes are large for separation units and because of this, I am request-ing more time for a final proposal of this separation plant design. During this time, I will discusswith my colleagues possible explanations as to why these designs are not like previous separationplants designed in terms of size. Also, I will calculate the linear velocity of the vapor more rigor-ously instead of using Turton et al.’s heuristics. Another reason why some of these columns havesuch large diameters is because the number of trays was optimized for each column but the refluxratio was not fully optimized for the desired specifications.
See appendices for a PFD of this design, mass balances, confirmation that at least 90% of massis recovered, confirmation of thermodynamic feasibility and Pro/II calculations, and more details.Let me know if you have any questions or suggestions, and I will keep you posted on future work.
21
ChE142 Final Project Student 2
Appendices
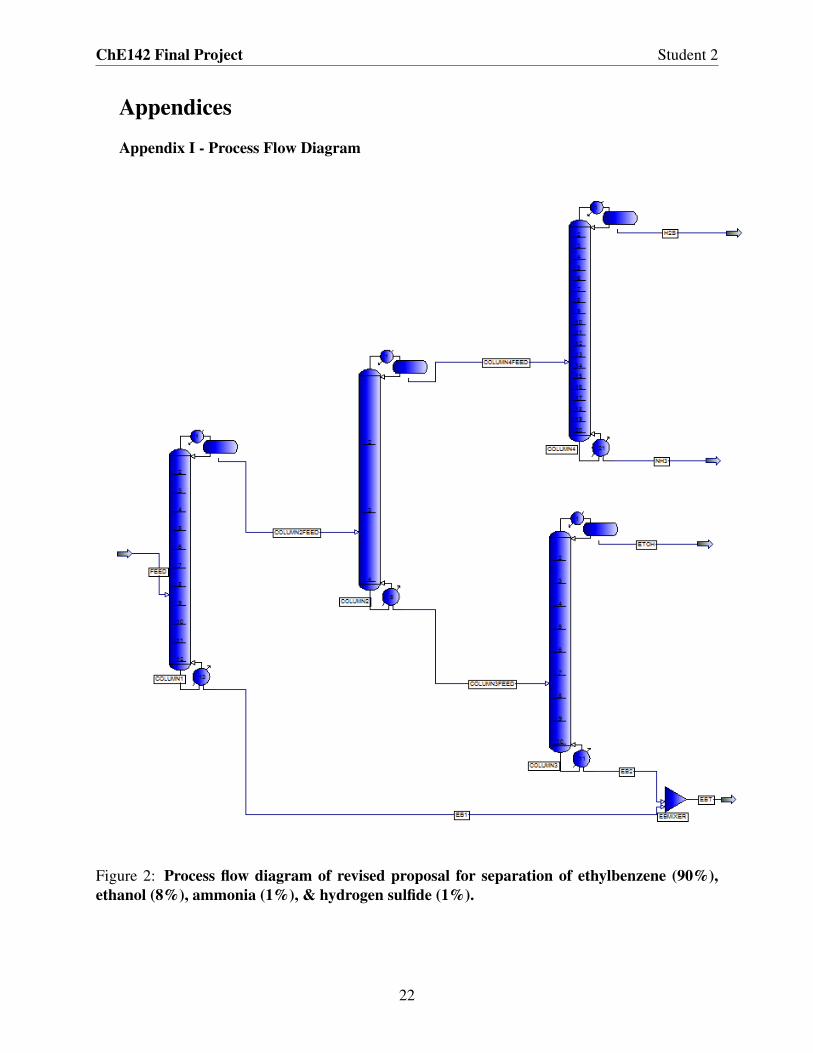
Appendix I - Process Flow Diagram
Figure 2: Process flow diagram of revised proposal for separation of ethylbenzene (90%),ethanol (8%), ammonia (1%), & hydrogen sulfide (1%).
22

ChE142 Final Project Student 2
Appendix I (cont’d)
In order to understand qualitatively and quantitatively how the mixture is being separated inthe PFD, note that ethylbenzene is abbreviated as EB, ethanol as ETOH, ammonia as NH3, andhydrogen sulfide as H2S. See tables below for more details.
PFD Label Name Description of Equipment/FeedFEED Contains EB (90%), ETOH (8%), NH3 (1%), and H2S (1%), 1000 kg/hr
COLUMN1 Separates out EB, Light Key (LK): ETOH, Heavy Key (HK): EBEB1 Stream of 99.9% EB by mole; To be mixed with EB2 to give EB product stream
COLUMN2FEED Contains more than half ETOHCOLUMN2 Separates ETOH from NH3 and H2S (LK: NH3, HK: ETOH)
COLUMN3FEED Contains mostly ETOHCOLUMN3 Separates ETOH from EB (LK: ETOH, HK: EB)
EB2 Stream of 99% EB; To be mixed with EB1 to give EB product streamEBMIXER Mixes EB1 & EB2 to give EB product stream
EBT EB product stream, 99.09% EB by mole, 8.47 kmol/hrETOH Ethanol product stream, 98.8% ETOH by mole, 1.746 kmol/hr
COLUMN4FEED Contains mostly NH3 (66%) and H2S(33%)COLUMN4 Separates NH3 and H2S
NH3 NH3 product stream, 99.7% NH3 by mole, 0.586 kmol/hrH2S Hydrogen sulfide product stream, 99.7% H2S by mole, 0.586 kmol/hr
Table 12: Description of PFD labels.
23

Com
pone
nt/P
aram
eter
Stre
amFE
ED
CO
LU
MN
2FE
ED
EB
1C
OL
UM
N4F
EE
DC
OL
UM
N3F
EE
DE
TOH
EB
2H
2SN
H3
EB
EN
ZE
NE
T
Phas
eM
ixed
Liq
uid
Liq
uid
Liq
uid
Liq
uid
Liq
uid
Liq
uid
Liq
uid
Liq
uid
Mix
edTe
mpe
ratu
re(F
)17
0.3
35.6
338.
9-2
6.1
222.
821
3.1
344.
9-5
1.3
4.9
338.
6Pr
essu
re(p
sia)
29.4
29.0
34.0
29.0
34.0
34.0
39.0
29.0
34.0
34E
thyl
benz
ene
0.76
40.
156
0.99
90
0.21
80.
011
0.98
60
00.
999
Am
mon
ia0.
053
0.19
00
0.66
60.
001
0.00
10
0.00
30.
997
0H
ydro
gen
sulfi
de0.
026
0.09
50
0.33
30
00
0.99
70.
002
0E
than
ol0.
157
0.55
90.
001
0.00
10.
781
0.96
80.
014
00.
001
0.00
1
Tabl
e13
:Com
posi
tion
and
mol
arflo
wra
teso
fall
stre
ams.
24

ChE142 Final Project Student 2
Appendix II - Mass Recovered
To confirm that no more than 90% of the original feed’s mass was lost to waste or burned forheat, the mass recovered was determined by summing the mass flow rates of the product streamsand comparing it to the mass flow rate of the feed.
Product Stream Molar Flow Rate (kmol/hr)EB 8.5
ETOH 1.7NH3 0.6H2S 0.3Total 11.1
Table 14: Molar flow rates of outlet/product streams.
The inlet feed’s molar flow rate was 11.1 kmol/hr. The percent of mass recovered:
Mass Flow Rate InMass Flow Rate Out
=11.111.1
×100% = 100% (34)
This confirms that no mass was lost due to waste streams or burned for heat. This fulfills therequirement that no more than 90% of the mass should be wasted.
25
ChE142 Final Project Student 2
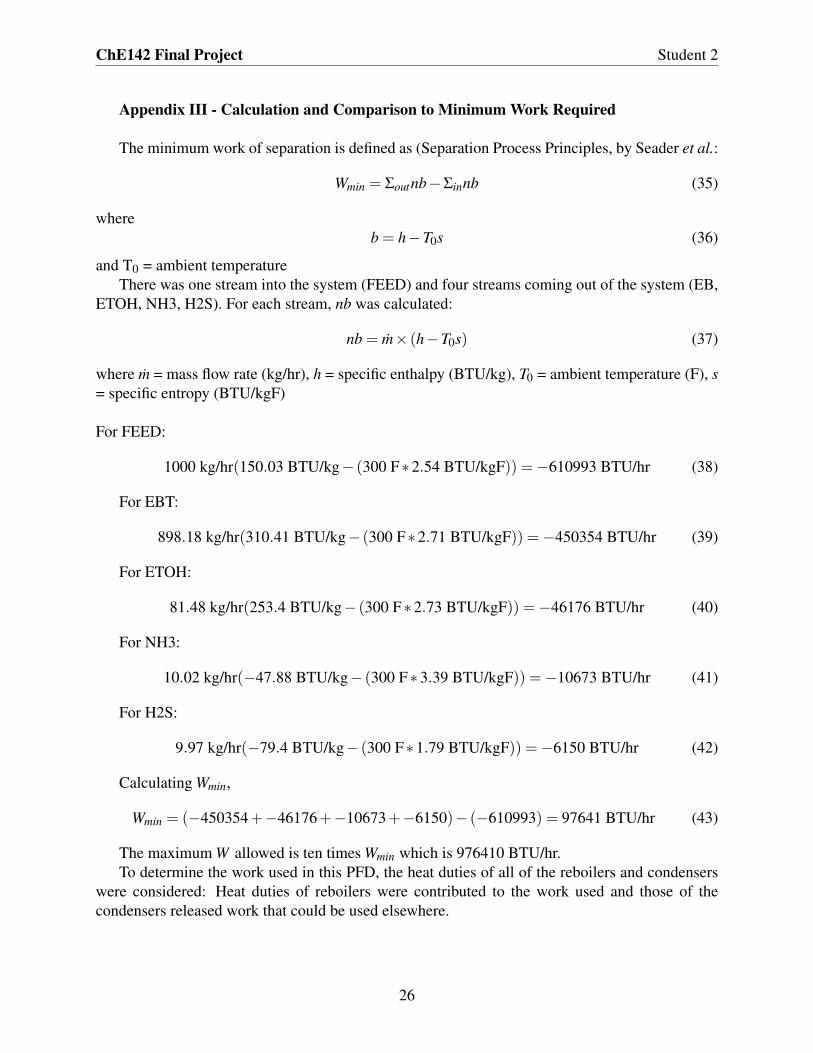
Appendix III - Calculation and Comparison to Minimum Work Required
The minimum work of separation is defined as (Separation Process Principles, by Seader et al.:
Wmin = Σoutnb−Σinnb (35)
whereb = h−T0s (36)
and T0 = ambient temperatureThere was one stream into the system (FEED) and four streams coming out of the system (EB,
ETOH, NH3, H2S). For each stream, nb was calculated:
nb = m× (h−T0s) (37)
where m = mass flow rate (kg/hr), h = specific enthalpy (BTU/kg), T0 = ambient temperature (F), s= specific entropy (BTU/kgF)
For FEED:
1000 kg/hr(150.03 BTU/kg− (300 F∗2.54 BTU/kgF)) =−610993 BTU/hr (38)
For EBT:
898.18 kg/hr(310.41 BTU/kg− (300 F∗2.71 BTU/kgF)) =−450354 BTU/hr (39)
For ETOH:
81.48 kg/hr(253.4 BTU/kg− (300 F∗2.73 BTU/kgF)) =−46176 BTU/hr (40)
For NH3:
10.02 kg/hr(−47.88 BTU/kg− (300 F∗3.39 BTU/kgF)) =−10673 BTU/hr (41)
For H2S:
9.97 kg/hr(−79.4 BTU/kg− (300 F∗1.79 BTU/kgF)) =−6150 BTU/hr (42)
Calculating Wmin,
Wmin = (−450354+−46176+−10673+−6150)− (−610993) = 97641 BTU/hr (43)
The maximum W allowed is ten times Wmin which is 976410 BTU/hr.To determine the work used in this PFD, the heat duties of all of the reboilers and condensers
were considered: Heat duties of reboilers were contributed to the work used and those of thecondensers released work that could be used elsewhere.
26

ChE142 Final Project Student 2
Appendix III - Calculation and Comparison to Minimum Work Required
Equipment Heat Duty (BTU/hr)Column 1, Condenser –258300Column 1, Reboiler 371800
Column 2, Condenser -105800Column 2, Reboiler 136800
Column 3, Condenser -86900Column 3, Reboiler 90300
Column 4, Condenser -19800Column 4, Reboiler 20100
Table 15: Work used/released by column condensers and reboilers.
Based on the values in Table 15, work used in this PFD was calculated to be 148200 BTU/hr,which is well under the maximum allowable work to be used for the separation.
27

ChE142 Final Project Student 2
Appendix IV - Number of Trays of Column from Pro/II & Graphical Confirmation ofDistillation Column Sizing for Columns 1-4
Column Number of TraysColumn 1 13Column 2 5Column 3 11Column 4 21
Table 16: Number of trays in distillation columns from Pro/II.
For confirmation, see appendices from initial proposal and attached page for these calculationsdone graphically via McCabe-Thiele Method. The number of trays determined graphically wereof the same magnitude as those found via Pro/II (above). The McCabe-Thiele Method is outlinedbelow:
1. Generate binary vapor liquid equilibirum data and x = y line using Pro/II. Specify the lightkey as the ”first component”
2. Determine the concentration of the light key in the feed (z f ), the concentration of the lightkey in the distillate (xD), and the concentration of the light key in the bottoms (xB).
3. Determine q based on the conditions of the feed.
4. Determine q-line equation based on its equation:
y = (q
q−1)x− zF
q−1(44)
5. Because all feeds were assumed to be liquid, q = 1 and q-lines were vertical and passedthrough zF on the x-axis.
6. The minimum L/V lines were drawn - the rectifying section passed through the x=y line at x= 0.99 and where the q-line intersects the equilibirum curve, and the stripping section passedthrough where the q-line intersects the equilibirum curve and the x=y lines at x = 0.01.
7. The minimum number of trays was determined by drawing steps between the x=y line andthe equilibrium curve.
8. The slope of the L/V minimum line, rectifying section, was found and set to RminRmin+1 . Rmin
was calculated.
9. The following relationship from Turton et al. heuristics was used to determine R, R =1.5Rmin.
10. This value of R was used to determine the slope of the actual L/V line, rectifying section.
28

11. The actual L/V line was plotted and steps were drawn between this line and the equilibriumcurve to determine the actual number of trays.
Please note the following things about the graphs:
• One McCabe-Thiele plot was done for Columns 1, 2, 3 for initial and revised designs becausesimilar if not the same conditions (pressure of feed, and compositions of the feed, distillate,and bottoms) occurred
• A ratio of 1.5 for R/Rmin was used based on heuristics from Turton et al.. This differs fromthe R used in Pro/II calculations. This may contribute to discrepancies between the actualtrays numbers calculated by Pro/II and graphically.
• The blue line in each plot is the 45◦ line, which represents the reflux ratio when there isinfinite reflux.
• The green line in each plot represents the equilibrium data for the binary mixture.
• The composition of the light key z f used in the plot was adjusted when assuming a psuedo-binary mixture using the following normalization:
z f =Mole fraction of Light Key
Mole fraction of Light Key + Mole fraction of Heavy Key(45)
• The mole fractions of the light key in the distillate and bottoms (xD and xB respectively) wascalculated from Pro/II results and if they were greater than 0.99 or less than 0.01, respec-tively, vales were just taken to be 0.99 or 0.01, respectively because it is difficult to graphvalues greater than 0.99 or less than 0.01.
• It was assumed that all feeds were at its bubble point so all the feed was a liquid. This led qto equal 1 and the q-line to always be a vertical line that passed through z f , the compositionof the light key in the feed.
• The ”count” of the minimum number of trays is ”inside” the step on the graph and the”count” of the actual number of trays is ”outside” the step on the graph.
29

ChE142 Final Project Student 2
Appendix V - Diameter Sizing for Columns 1-4
Below is a sample calculation for how the height and diameter was sized for Column 1. Seeattached page for heights and diameters of Columns 2 - 4.For column 1:Height of a Distillation ColumnBased on heuristics from Turton et al. (Chapter 9, Table 9.13 and 9.14), tray spacings were as-sumed to be 20 inches. Heuristics also give heights for top spacing for vapor disengagement andbottom spacing for liquid level and reboiler return based on a 3 ft in diameter column. Based on a3 ft diameter, top spacing was 4 ft and bottom spacing was 6 ft. Space at the top and bottom werecalculated in proportion to the diameter of the designed columns but a maximum of 20 ft for boththe top and bottom spacings were added. For column 1, the top spacing and the bottom spacingwere calculated to be greater than 20 ft. so 20 ft. was used as the combined height of the top andbottom spacings.To determine the height of the column:
(Number of Trays−1)× (Tray Spacing)+Top Spacing+Bottom Spacing = Height (46)
(13−1)× (20 in.)+10 ft+10 ft = 40 ft (47)
Diameter of a Distillation Column The maximum vapor flow rate was determined to be5973000 ft3/hr from the Pro/II report. Based on heuristics from Turton et al., the linear veloc-ity of the vapor was assumed to be 2 ft/sec.To determine the area of the tray needed for this vapor flow rate to pass at that specified velocity,
Vapor flow rateLinear velocity
= Area (48)
5973000 ft3/hr7200 ft/hr
= 830 ft2 (49)
Diameter = 2× (
√Area
π) (50)
Diameter = 2(√
830/π) = 32.5 ft (51)
Using these methods of calculation for heights and diameters of columns:
Column Height (ft) Diameter (ft)Column 1 40 32.5Column 2 26.7 18.3Column 3 36.7 14.6Column 4 53.3 8.2
Table 17: Distillation columns sizing based on Pro/II results and heuristics.
30

ChE142 Final Project Student 2
Appendix VI - Capital Costing (Columns and Membrane)
Using cost equations for the CAPCOST Program as specified in Turton et al., sizing parame-ters such as area and volume were used to determine costs of the shell and trays of the column.Purchased equipment costs were determined by:
log(C0p) = K1 +K2 log(A)+K3[log(A)]2 (52)
where A is the sizing parameter, K1, K2, and K3 are constants, C0p is the purchased equipment costs
for 2001. Using the CEPCI value for 2001 of 397 and the CEPCI value for 2011 of 564.8, currentprices for these columns were calculated.CAPCOST cost equations were fitted to columns of a specified size. If a designed column wassmaller than the specified size, the minimum A value was used and thus, the cost was overestimated.If a designed column was larger than the specified size, the maximum A value was used and theprice was estimated assuming a linear relationship between A and price.
For column 1:
• Volume (m3) = 940
• Area (m2) = 77
• For shell costing, A = 520
• For shell costing, K1 = 3.94974, K2 = 0.4485, K3 = 0.1074
• For tray costing, A = 12
• For tray costing, K1 = 2.9949, K2 = 0.4465, K3 = 0.3961
Using the above values and Equation 17, costs for year 2001 were calculated to be:
• Cost of Shell in 2001: $673,000
• Cost of Trays in 2001: $232,000
Using 2011 CEPCI value of 564.8 (from Chemical Engineering, April 2011) and 2001 CEPCIvalue of 397,
• Cost of Shell in 2011: $958,000
• Cost of Trays in 2011: $1,189,133
Using the above method, the following costs were calculated for Columns 2-4:Note that because these columns were on the large side, the maximum A specified in the heuris-
tics were used for Columns 2-4 and a linear relationship between price and sizing after the maxi-mum A value was assumed.
31
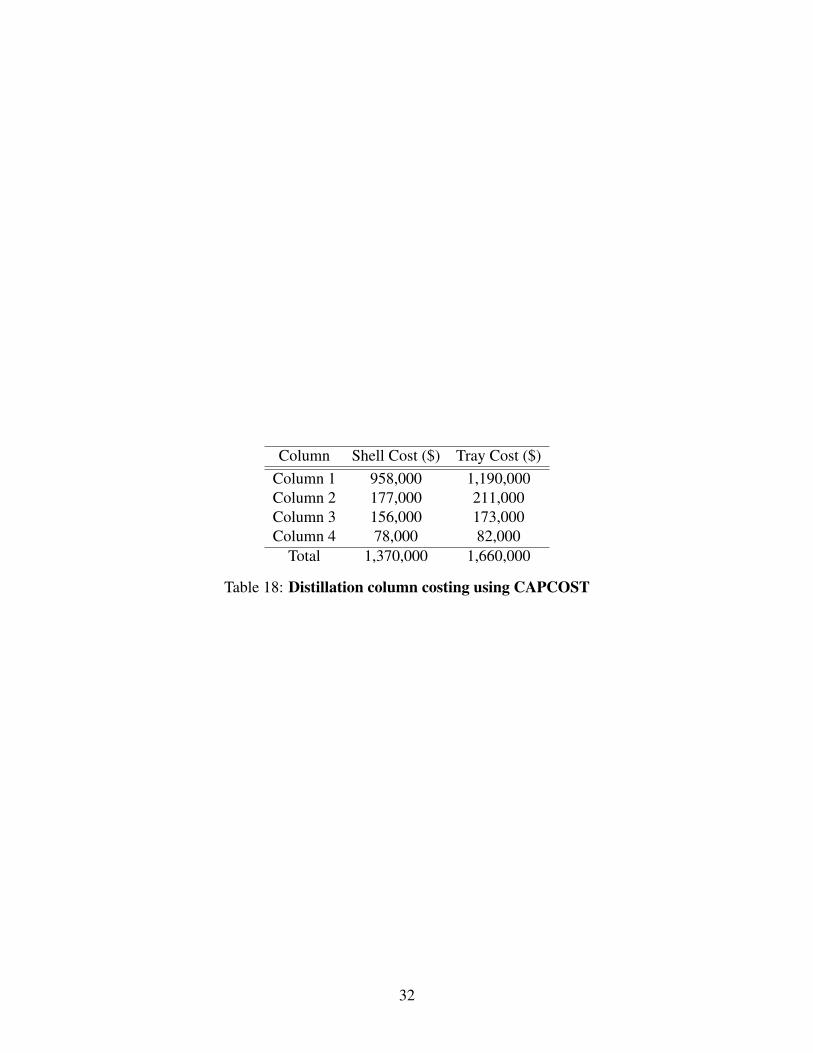
Column Shell Cost ($) Tray Cost ($)Column 1 958,000 1,190,000Column 2 177,000 211,000Column 3 156,000 173,000Column 4 78,000 82,000
Total 1,370,000 1,660,000
Table 18: Distillation column costing using CAPCOST
32

ChE142 Final Project Student 2
Appendix VIII - Heat Exchanger Sizing & Costing
The heat duty (Q) from Pro/II was used to determine the area of the heat exchanger needed:
Q = UA∆Tlm→ A =Q
U∆Tlm(53)
Based on heuristics from Turton et al., U was taken to be 850 W/m2 and 1150 W/m2 for condensersand reboilers, respectively.
For the condenser for Column 1,
∆Tlm =∆T1−∆T2
ln T1T2
(54)
• Tstream,in = 381.6K
• Tstream,out = 275.2K
• Tutility,in = 82.62K
• Tutility,out = 83.62K
• ∆ T1 = Tstream,in - Tutility,out = 381.6 - (83.62) = 97.98 K
• ∆ T2 = Tstream,out - Tutility,in = 275.2 - (82.62) = 192.6 K
• → ∆ Tlm = 241.46
A =75694 J/sec
(850 W/m2)(241.46)= 0.37 m2 (55)
Based on the CAPCOST program delineated in Turton et al., the cost of heat exchangers weredetermined. Double pipe heat exchangers were chosen for condensers because the smallest heatexchangers do come in that type. Kettle reboilers’ cost information was used for this projectbecause kettle reboilers were chosen in the Pro/II design. The CAPCOST equation was used:
log(C0p) = K1 +K2 log(A)+K3[log(A)]2 (56)
where A is the sizing parameter, K1, K2, and K3 are constants, C0p is the purchased equipment costs
for 2001. Again, using the CEPCI value for 2001 of 397 and the CEPCI value for 2011 of 564.8,current prices for these columns were calculated.
The following values for costing a double pipe heat exchanger were used:
• K1 = 4.4646
• K2 = -0.5277
• K3 = 0.3955
33

The following values for costing a kettle reboiler were used:
• K1 = 3.3444
• K2 = 0.2745
• K3 = -0.0472
The following A values were calculated and based on the minimum and maximum values sug-gested by the CAPCOST program, prices were adjusted:
Column Condenser/Reboiler A (m2) calculated A (m2) used C0p in 2001 ($) C0
p in 2011 ($)Column 1 Condenser 0.00037 1 2,210 3,144Column 2 Condenser 0.22 1 2,210 3,144Column 3 Condenser 0.77 1 2,210 3,144Column 4 Condenser 0.05 1 2,210 3,144Column 1 Reboiler 1.66 10 3,730 5,306Column 2 Reboiler 0.68 10 3,730 5,306Column 3 Reboiler 1.7 10 3,730 5,306Column 4 Reboiler 0.03 10 3,730 5,306
Table 19: Heat exchanger costing using CAPCOST
34
ChE142 Final Project Student 2
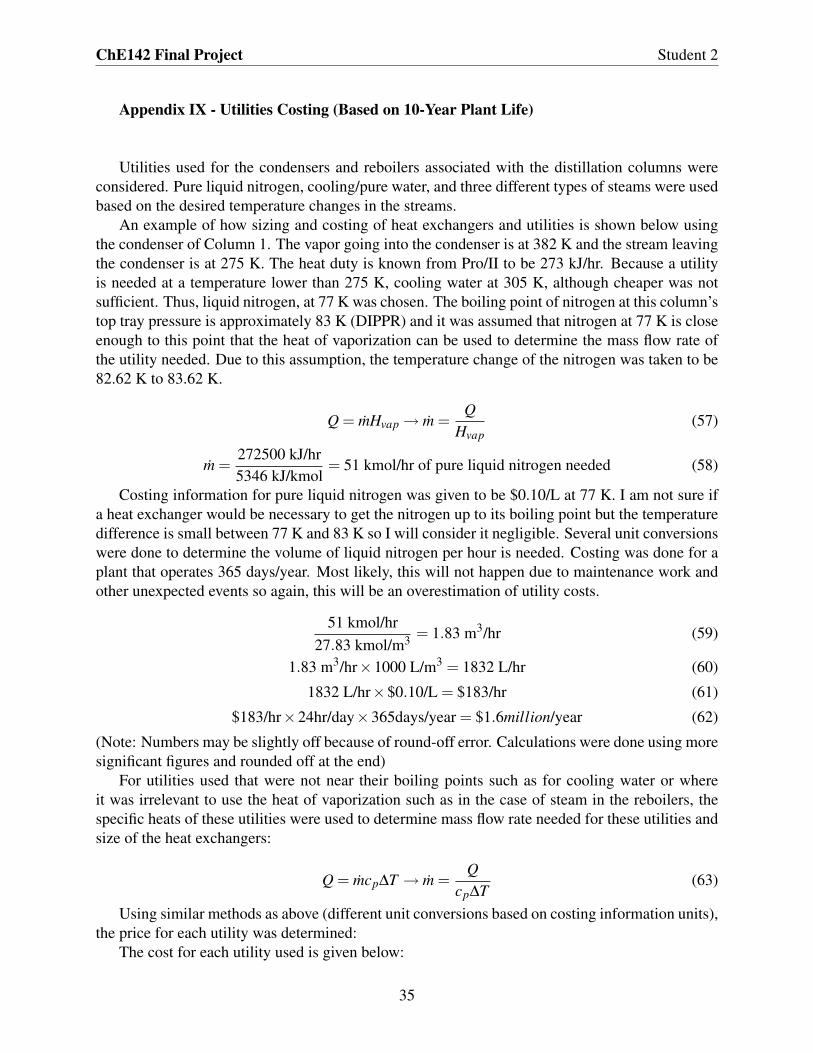
Appendix IX - Utilities Costing (Based on 10-Year Plant Life)
Utilities used for the condensers and reboilers associated with the distillation columns wereconsidered. Pure liquid nitrogen, cooling/pure water, and three different types of steams were usedbased on the desired temperature changes in the streams.
An example of how sizing and costing of heat exchangers and utilities is shown below usingthe condenser of Column 1. The vapor going into the condenser is at 382 K and the stream leavingthe condenser is at 275 K. The heat duty is known from Pro/II to be 273 kJ/hr. Because a utilityis needed at a temperature lower than 275 K, cooling water at 305 K, although cheaper was notsufficient. Thus, liquid nitrogen, at 77 K was chosen. The boiling point of nitrogen at this column’stop tray pressure is approximately 83 K (DIPPR) and it was assumed that nitrogen at 77 K is closeenough to this point that the heat of vaporization can be used to determine the mass flow rate ofthe utility needed. Due to this assumption, the temperature change of the nitrogen was taken to be82.62 K to 83.62 K.
Q = mHvap→ m =Q
Hvap(57)
m =272500 kJ/hr5346 kJ/kmol
= 51 kmol/hr of pure liquid nitrogen needed (58)
Costing information for pure liquid nitrogen was given to be $0.10/L at 77 K. I am not sure ifa heat exchanger would be necessary to get the nitrogen up to its boiling point but the temperaturedifference is small between 77 K and 83 K so I will consider it negligible. Several unit conversionswere done to determine the volume of liquid nitrogen per hour is needed. Costing was done for aplant that operates 365 days/year. Most likely, this will not happen due to maintenance work andother unexpected events so again, this will be an overestimation of utility costs.
51 kmol/hr27.83 kmol/m3 = 1.83 m3/hr (59)
1.83 m3/hr×1000 L/m3 = 1832 L/hr (60)
1832 L/hr×$0.10/L = $183/hr (61)
$183/hr×24hr/day×365days/year = $1.6million/year (62)
(Note: Numbers may be slightly off because of round-off error. Calculations were done using moresignificant figures and rounded off at the end)
For utilities used that were not near their boiling points such as for cooling water or whereit was irrelevant to use the heat of vaporization such as in the case of steam in the reboilers, thespecific heats of these utilities were used to determine mass flow rate needed for these utilities andsize of the heat exchangers:
Q = mcp∆T → m =Q
cp∆T(63)
Using similar methods as above (different unit conversions based on costing information units),the price for each utility was determined:
The cost for each utility used is given below:
35

Column Condenser/Reboiler Utility Used Mass Flow Rate (kmol/hr) Price ($/year)Column 1 Condenser Liquid nitrogen 51 1,600,000Column 2 Condenser Liquid nitrogen 21 660,000Column 3 Condenser Cooling water 14 47Column 4 Condenser Liquid nitrogen 4 120,000Column 1 Reboiler 125# steam 235 370,000Column 2 Reboiler 20# steam 82 90,000Column 3 Reboiler 125# steam 60 75,000Column 4 Reboiler 20# steam 13 15,000
Table 20: Utilities costing
Utility CostPure liquid nitrogen (77K) $0.10/LCooling pure water (90F) $0.08/1000 gallons600# steam (490F, HP) $10/metric ton125# steam (353F, MP) $8/metric ton20# steam (260F, LP) $7/metric ton
Table 21: Utilities costing information
36
ChE142 Final Project Student 2
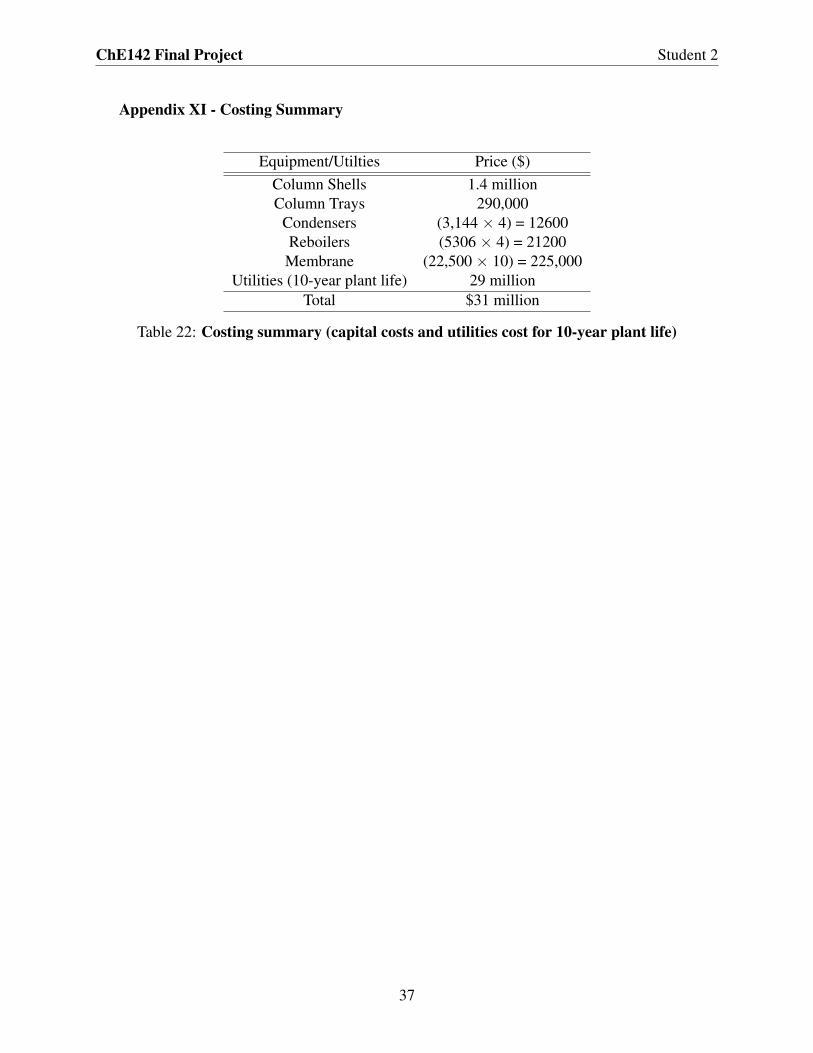
Appendix XI - Costing Summary
Equipment/Utilties Price ($)Column Shells 1.4 millionColumn Trays 290,000
Condensers (3,144 × 4) = 12600Reboilers (5306 × 4) = 21200Membrane (22,500 × 10) = 225,000
Utilities (10-year plant life) 29 millionTotal $31 million
Table 22: Costing summary (capital costs and utilities cost for 10-year plant life)
37

ChE142 Final Project Student 2
Appendix XII - Detailed Tables of All CalculationsSee attached pages.
38