fao's state of the world's forests report
DESCRIPTION
The year 2011 has been designated ‘The International Year of Forests’ by the United Nations General Assembly. This builds on momentum already generated in other international arenas, such as those related to climate change and biodiversity, to bring even greater attention to forests worldwide. Work is progressing rapidly on international forest issues and this edition of State of the World’s Forests focuses on a number of critical themes designed to stimulate greater analysis during the International Year of Forests.TRANSCRIPT
The ninth biennial issue of State of the World’s Forests, published at the outset of 2011, the International Year of Forests, considers the theme ‘Changing pathways, changing lives: forests as multiple pathways to sustainable development’. It takes a holistic view of the multiple ways in which forests support livelihoods. The chapters assembled for this year’s State of the World’s Forests highlight four key areas that warrant greater attention: regional trends on forest resources; the development of sustainable forest industries; climate change mitigation and adaptation; and the local value of forests. Considered together, these themes provide insights on the true contribution of forests to the creation of sustainable livelihoods and alleviation of poverty.
2011State of the World’s Forests
9 7 8 9 2 5 1 0 6 7 5 0 5I2000E/1/01.11
ISBN 978-92-5-106750-5 ISSN 1020-5705
State of the W
orld’s Forests 2011FA
O

Photo credits:
Cover top: National Geographic Society/Michael Nichols; cover bottom: National Geographic Society/
Tim Laman; page 1: National Geographic Society/Michael Nichols; page 29: National Geographic Society/
Norbert Rosing; page 57: FAO/Susan Braatz; page 77: FAO/Thomas Hofer; page 99: FAO
State of the World’s Forests
Food and Agriculture Organization of the United NationsRome, 2011

The designations employed and the presentation of material in this information
product do not imply the expression of any opinion whatsoever on the part of the
Food and Agriculture Organization of the United Nations (FAO) concerning the legal
or development status of any country, territory, city or area or of its authorities, or
concerning the delimitation of its frontiers or boundaries. The mention of specific
companies or products of manufacturers, whether or not these have been patented,
does not imply that these have been endorsed or recommended by FAO in
preference to others of a similar nature that are not mentioned.
The views expressed in this information product are those of the author(s) and do
not necessarily reflect the views of FAO.
ISBN 978-92-5-106750-5
All rights reserved. FAO encourages reproduction and dissemination of material in
this information product. Non-commercial uses will be authorized free of charge,
upon request. Reproduction for resale or other commercial purposes, including
educational purposes, may incur fees. Applications for permission to reproduce
or disseminate FAO copyright materials, and all other queries concerning rights
and licences, should be addressed by e-mail to [email protected] or to the Chief,
Publishing Policy and Support Branch, Office of Knowledge Exchange, Research
and Extension, FAO, Viale delle Terme di Caracalla, 00153 Rome, Italy.
© FAO 2011
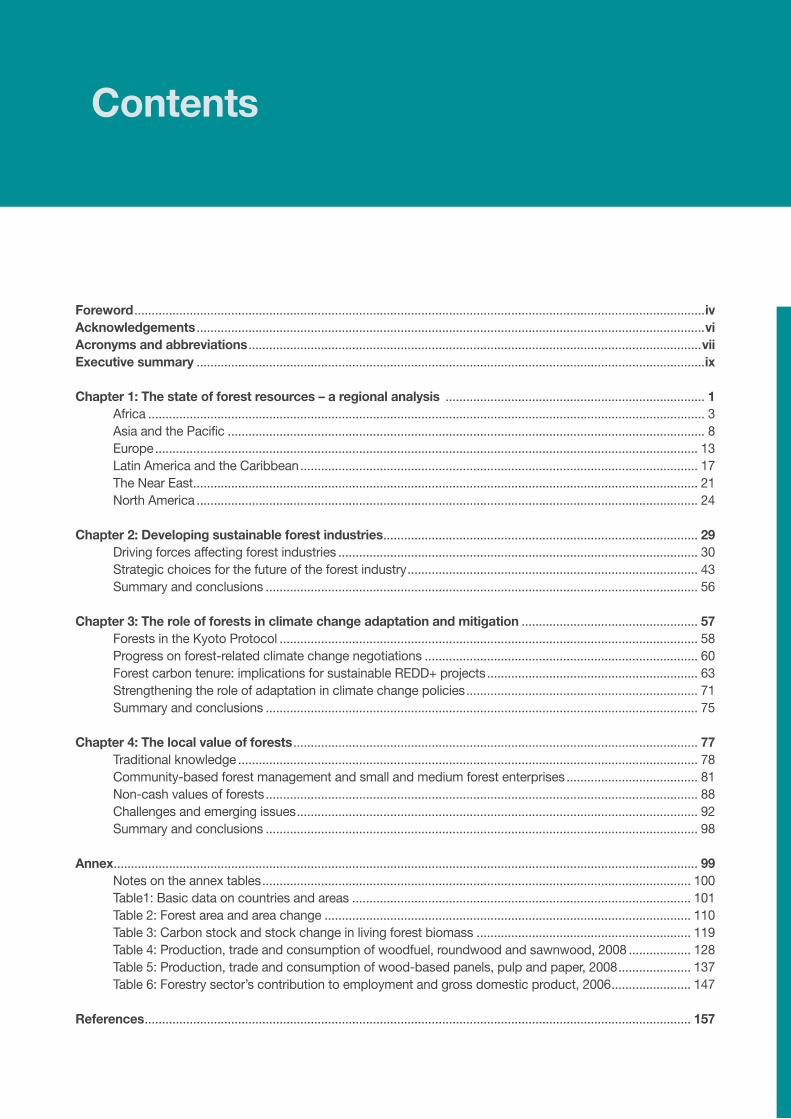
Contents
Foreword .....................................................................................................................................................................ivAcknowledgements ...................................................................................................................................................viAcronyms and abbreviations ...................................................................................................................................viiExecutive summary ...................................................................................................................................................ix
Chapter 1: The state of forest resources – a regional analysis ........................................................................... 1 Africa ................................................................................................................................................................. 3 Asia and the Pacific .......................................................................................................................................... 8 Europe ............................................................................................................................................................. 13 Latin America and the Caribbean ................................................................................................................... 17 The Near East .................................................................................................................................................. 21 North America ................................................................................................................................................. 24
Chapter 2: Developing sustainable forest industries ........................................................................................... 29 Driving forces affecting forest industries ........................................................................................................ 30 Strategic choices for the future of the forest industry .................................................................................... 43 Summary and conclusions ............................................................................................................................. 56
Chapter 3: The role of forests in climate change adaptation and mitigation ................................................... 57 Forests in the Kyoto Protocol ......................................................................................................................... 58 Progress on forest-related climate change negotiations ............................................................................... 60 Forest carbon tenure: implications for sustainable REDD+ projects ............................................................. 63 Strengthening the role of adaptation in climate change policies ................................................................... 71 Summary and conclusions ............................................................................................................................. 75
Chapter 4: The local value of forests ..................................................................................................................... 77 Traditional knowledge ..................................................................................................................................... 78 Community-based forest management and small and medium forest enterprises ...................................... 81 Non-cash values of forests ............................................................................................................................. 88 Challenges and emerging issues .................................................................................................................... 92 Summary and conclusions ............................................................................................................................. 98
Annex ......................................................................................................................................................................... 99 Notes on the annex tables ............................................................................................................................ 100 Table1: Basic data on countries and areas .................................................................................................. 101 Table 2: Forest area and area change .......................................................................................................... 110 Table 3: Carbon stock and stock change in living forest biomass .............................................................. 119 Table 4: Production, trade and consumption of woodfuel, roundwood and sawnwood, 2008 .................. 128 Table 5: Production, trade and consumption of wood-based panels, pulp and paper, 2008 ..................... 137 Table 6: Forestry sector’s contribution to employment and gross domestic product, 2006 ....................... 147
References .............................................................................................................................................................. 157

iv
Foreword
The year 2011 has been designated ‘The
International Year of Forests’ by the United
Nations General Assembly. This builds
on momentum already generated in other
international arenas, such as those related
to climate change and biodiversity, to
bring even greater attention to forests worldwide. Work
is progressing rapidly on international forest issues and
this edition of State of the World’s Forests focuses on a
number of critical themes designed to stimulate greater
analysis during the International Year of Forests.
State of the World’s Forests, which is published on a
biennial basis, presents up-to-date information on key
themes affecting the world’s forests. The 2009 issue
considered the theme of ‘Society, forests and forestry:
adapting for the future’ by presenting a ‘demand-side’
perspective on forest trends and topics. The 2011 issue
takes a more holistic approach to the multiple ways in
which forests support people’s livelihoods under the
theme ‘Changing pathways, changing lives: forests
as multiple pathways to sustainable development’. To
explore this theme, the report tackles three core subjects
– sustainable forest industries, climate change and local
livelihoods – and examines their potential to stimulate
development at all levels. In addition, we present new
regional level analyses drawn from the Global Forest
Resources Assessment 2010 (FRA 2010).
The book is divided into four chapters, each dedicated
to one of the core subjects mentioned above. Across
the chapters, a strong sense emerges of the wealth that
forests offer and that can be accessed by utilizing them
for industrial purposes; by managing and conserving
forests within the context of climate change; and by
tapping into local knowledge of the cash and non-
cash value of forests. There is no single way in which
these pathways are pursued – sometimes their goals
and approaches intersect, while at others they occur in
isolation. Yet, it is clear that in all cases, forests remain an
underappreciated and undervalued resource that could
stimulate greater income generation and development.
The first chapter explores some of the key regional trends
in the extent of change in forest area, the areas allocated
for productive and protective functions, levels of biomass,
and employment, among other topics. This provides an
indication of the regional approaches to forest resource
use and the measures that countries have taken to adapt
to changes in biological systems, policies and new
management techniques.
Adaptability is also a key theme in our second chapter
on developing sustainable forest industries. This
examines a traditional development pathway based on
industrial utilization of a natural resource. Over many
decades this has been the main way in which forests
have enabled countries and people to generate income.
This chapter reviews the extent to which the forest
industry has developed based on a number of key
global drivers, and how it can strategically modify its
approach to the use of forests. A key message of this
chapter is that the forest sector continues to make a real
contribution to employment and economic growth for
many countries.
Climate change occupies a prominent position in
international discussions, and forests have a particular
role to play in the global response. In recognition of
this, the report presents an update on the negotiations
underway in the climate change convention and
programmatic aspects related to forests and climate
change. In particular, chapter three focuses on
developments in reducing emissions from deforestation
and forest degradation, and in conserving and enhancing
carbon stocks (REDD+). The agreement reached on
REDD+ in the Cancún negotiations in December 2010
could lead to transformational changes in conservation
v
and management of tropical forests while safeguarding
the livelihoods of indigenous peoples and forest-
dependent people. Secure and equitable forest
carbon tenure has a major role to play in ensuring the
sustainability of these activities. The chapter provides
a snapshot of some emerging legal guidance on forest
carbon tenure and different approaches to determining
ownership of the resource. New localized project
activities on climate change need to be accompanied by
sound forest carbon tenure arrangements, which take into
consideration the needs of local communities and ensure
long-term sustainability and equitable benefit-sharing.
The theme of the International Year of Forests makes
people a central focus of activities during the Year and our
last chapter highlights the importance of forests to local
livelihoods, through a discussion of traditional knowledge,
community-based forest management, small and medium
forest enterprises and the non-cash value of forests. These
approaches have historically been an essential part of
local development, yet our knowledge of their value is
still relatively poor. Further analysis is needed during the
International Year of Forests, to emphasize the connection
between people and forests, and the benefits that can
accrue when forests are managed by local people in
sustainable and innovative ways.
The present edition of State of the World’s Forests
provides an introduction to the above ideas, which will
take greater shape during 2011 and beyond. Together
we must continue to pursue multiple pathways towards
sustainable development using forests at all levels. I invite
you to contribute to the discussion on these key themes
during the International Year of Forests.
Eduardo Rojas-Briales
Assistant Director-General
FAO Forestry Department

vi
The preparation of State of the World’s
Forests 2011 was coordinated by Lauren
Flejzor, with editorial assistance from
Sophie Higman at Green Ink. Special
thanks are given to the authors of and
data analysts for the chapters, who
took time out of their busy schedules to contribute
to this important work. They are: Remi D’Annunzio,
Monica Garzuglia, Örjan Jonsson, Arvydas Lebedys,
Mette Løyche Wilkie and Hivy Ortiz-Chour (Chapter 1);
Jukka Tissari and Adrian Whiteman (Chapter 2); Pierre
Bernier, Susan Braatz, Francesca Felicani-Robles and
Danilo Mollicone (Chapter 3); Michelle Gauthier, Sophie
Grouwels, Sam Johnston, Fred Kafeero, Sarah Laird,
Rebecca McLain, Rebecca Rutt, Gill Shepherd and
Rachel Wynberg (Chapter 4). Additional thanks to others
who offered reviews or contributed to other aspects
of the report: Jim Carle, Ramon Carrillo, Peter Csoka,
Marguerite France-Lanord, Fran Maplesden, R. Michael
Martin, Andrea Perlis, Maria Sanz-Sanchez, Tiina
Vähänen and members of the World Business Council
for Sustainable Development. Acknowledgements are
also given to the helpful technical assistance provided
by Giselle Brocard, Paola Giondini and Daniela Mercuri.
Paul Philpot (Green Ink) helped create a workable design
for this special edition of State of the World’s Forests.
Acknowledgements

vii
Acronyms and abbreviations
APF Adaptation Policy Framework (of UNDP)
AWG–KP Ad hoc Working Group on Further Commitments for Annex I Parties under the Kyoto Protocol
(of the UNFCCC)
AWG–LCA Ad hoc Working Group on Long-term Cooperative Action (of the UNFCCC)
CATIE Center for Investigation and Teaching of Tropical Agronomy
CBD Convention on Biological Diversity
CBFM community-based forest management
CDM Clean Development Mechanism
CEPF Confederation of European Forest Owners
CEPI Confederation of European Paper Industries
CIFOR Center for International Forestry Research
CITES Convention on International Trade in Endangered Species of Wild Fauna and Flora
CO2 carbon dioxide
COP Conference of the Parties
CSR Carbon Sequestration Rights
DFID UK Department for International Development
ETS Emissions Trading Scheme (of the EU)
EU European Union
EUA European Union Allowances (for CO2 emissions)
FAO Food and Agriculture Organization (of the United Nations)
FC Forest Connect
FCPF Forest Carbon Partnership Facility (of the World Bank)
FRA Global Forest Resources Assessment
FSC Forest Stewardship Council
FTE full-time equivalent
GACF Global Alliance for Community Forests
GDP gross domestic product
GFP Growing Forest Partnership
GHG greenhouse gas
GPS global positioning system
Gt Giga tonnes
HWP harvested wood product
IAITPTF International Alliance for Indigenous and Tribal Peoples of Tropical Forests
IFFA International Family Forest Alliance
IGC Intergovernmental Committee on Traditional Knowledge, Genetic Resources and Folklore
IIED International Institute for Environment and Development
IPCC Intergovernmental Panel on Climate Change
ITTO International Tropical Timber Organization
IUCN International Union for Conservation of Nature
viii
IUFRO International Union of Forest Research Organizations
KP Kyoto Protocol
LCA life cycle analysis
LFP Livelihoods and Forestry Programme (of DFID)
LULUCF land use, land-use change and forestry
MA&D Market Analysis and Development toolkit (of FAO)
MDF medium density fibreboard
MJ megajoule
MRV monitoring, reporting and verification
MT metric tonne
NAPA National Adaptation Programme of Action
NC National Communications (on climate change)
NFP Facility National Forest Programme Facility
NGO non-governmental organization
NWFP non-wood forest product
PEFC Programme for the Endorsement of Forest Certification
PROFOR Program on Forests (of the World Bank)
REDD reducing emissions from deforestation and forest degradation
REDD+ REDD plus the role of conservation, sustainable management of forests and enhancement of forest
stocks in developing countries
SBI Subsidiary Body for Implementation (of the UNFCCC)
SBSTA Subsidiary Body for Scientific and Technological Advice (of the UNFCCC)
SFM sustainable forest management
SFPA Smallholder Forest Producers Associations
SMFE small and medium forest enterprises
SOFO State of the World’s Forests
TK traditional knowledge
TRIPS Trade Related Aspects of Intellectual Property Rights
TroFCCA Tropical Forest and Climate Change Adaptation Project
UNCCD United Nations Convention to Combat Desertification
UNDP United Nations Development Programme
UNFCCC United Nations Framework Convention on Climate Change
VPA Voluntary Partnership Agreement
WIPO World Intellectual Property Organization
ix
Executive summary
This ninth biennial issue of State of the
World’s Forests is being launched at the
outset of 2011, the International Year
of Forests. This Year aims to promote
awareness and understanding of forests
and forestry issues. The chapters
assembled for this year’s State of the World’s Forests
draw attention to four key areas that warrant greater
attention during the International Year of Forests and
beyond:
• regional trends on forest resources;
• the development of sustainable forest industries;
• climate change adaptation and mitigation; and
• the local value of forests.
Each of these themes has implications for the various
upcoming assessments of progress towards sustainable
development, including the Rio+20 Summit in 2012 and
the Millennium Development Goals Review Conference in
2015.
Forests have unrecognized potential in furthering the
development agenda. To maximize the contribution of
forests to poverty eradication, this year’s State of the
World’s Forests identifies some of the areas that can
enhance or challenge the sustainability of people’s
livelihoods. Forest industries have the opportunity to
maximize energy efficiency, spur innovation, create a
reliable fibre supply and contribute to local economies.
Negotiators designing climate change policies and
actions recognize that, to be successful, efforts
related to reducing emissions from deforestation and
forest degradation and the role of conservation and
enhancement of forest carbon stocks (REDD+) in
developing countries must, at the same time, address
poverty alleviation. They also recognize that the long-term
implications of forest carbon tenure need to be examined
more critically to ensure equitable benefit sharing and
long-term management of local resources and rights.
The contribution of forests to local livelihoods also
needs further consideration and research, for example
on traditional forest-related knowledge, non-wood forest
product (NWFP) governance, the non-cash value of
forests, small and medium enterprises and community-
based forest management (CBFM). Taken together, these
themes can maximize the contribution of forests to the
creation of sustainable livelihoods and alleviation of
poverty.
This report is divided into four chapters, addressing the
four key areas highlighted above.
Chapter 1: The state of forest resources: a regional analysis The Global Forest Resources Assessment 2010 – Main
Report (FAO, 2010a), which was released in October
2010, noted that the overall rate of deforestation
remained alarmingly high, although the rate was
slowing. Major trends in the extent of forests, and
changes in the rates of forest loss, as well as the
current state of productive and protective forests,
show disparities between the six regions: Africa,
Asia and the Pacific, Europe, Latin America and the
Caribbean, the Near East and North America. The
highest forest area worldwide was found in Europe,
primarily because of the vast swaths of forest in the
Russian Federation, while Latin America and the
Caribbean had the highest net forest loss over the last
decade.
AfricaAlthough continued forest loss was reported in Africa,
the overall trend in net forest loss in the region slowed
between 1990 and 2010. The area of planted forests was
increasing in Africa, in particular in West and North Africa.
Some forest planting programmes were established to
combat desertification, while others were created in an
effort to secure industrial wood and energy sources.
x
There were notable increases in the area designated for
conservation of biodiversity, mostly as a result of changes
in the designation of some forests in Central and East
Africa. However, there were declines in productive forest
areas.
Woodfuel removals jumped as a result of the rising
population in the region. Nevertheless, Africa’s share of
global wood removals by value remained significantly
lower than its potential. Nearly half a million people were
employed in the primary production of forest goods,
although countries in the region provided few data on
employment, and particularly on informal sector activities
where much employment occurs.
Asia and the PacificThe extent of forests in Asia and the Pacific has
changed dramatically over the past two decades.
In the 1990s, the region experienced a net forest
loss of 0.7 million hectares per year, while in the last
decade the forest area increased by an average of
1.4 million hectares per year. The planted forest area
also substantially increased through afforestation
programmes, mainly as a result of programmes in
China, India and Viet Nam.
The area of primary forests decreased in all Asia and
the Pacific subregions in the last decade, despite
the fact that the area designated for conservation of
biodiversity increased in the same period. Mixed trends
were observed in the subregions in the extent to which
forests were set aside for soil and water protection.
With the exception of the South Asia and Oceania
subregions, the area of productive forests declined over
the last decade. Falling levels of wood removals were
also observed throughout the region, largely as a result of
the reduction in woodfuel removals. Employment in the
primary production of forest goods was very high in the
region when compared with the global total.
EuropeEurope contained the largest area of forests compared
with other regions, totalling 1 billion hectares. Europe’s
forest area continued to grow between 1990 and 2000,
although the overall rate of increase slowed during the
last decade. The Russian Federation, which contained
80 percent of Europe’s forest area, showed minimal
declines in forest area after 2000. The rate of expansion
of planted forest area also decreased in the last decade
when compared with global trends.
Europe had a relatively high percentage of forest
area classified as primary forest (26 percent) when
compared with the global primary forest area (36 percent).
Over the last 20 years, forest area designated for
conservation purposes doubled in the region. There
were also positive trends in the areas designated for the
protection of soil and water, mostly as a result of actions
taken by the Russian Federation.
A greater proportion of forest area was designated for
productive functions in Europe than in the rest of the
world. The area designated for productive functions
declined in the 1990s, although this trend reversed in
the last decade. Wood removals in Europe also showed
variable trends over the last 20 years and have declined
as a result of the 2008–2009 recession in Europe, which
lowered demand for wood. Finally, employment in the
primary production of forest goods declined, and this
trend is expected to continue in the near future.
Latin America and the CaribbeanNearly half of the Latin American and Caribbean
region was covered by forests in 2010. Forest area
declined in Central and South America over the last two
decades, with the leading cause of deforestation being
the conversion of forest land to agriculture. Although
the overall planted forest area was relatively small, it
expanded at a rate of 3.2 percent per year over the last
decade.
The region contained over half of the world’s primary
forests (57 percent), which was mostly located in
inaccessible areas. The area of forest set aside for
biodiversity conservation has increased by about
3 million hectares annually since 2000, with a vast
amount of this area located in South America.
About 14 percent of all forest area in the region was
designated primarily for production. Wood removals
continued to rise with more than half removed for
woodfuel. In common with other regions, it was difficult
to quantify the extent and type of NWFPs removed in
the Latin American and Caribbean region. Employment
trends in the primary production of forest goods showed
an upward swing of 30 percent in the first few years of
the last decade.
xi
The Near East The Near East region has a small forest area, with 26
countries in the region categorized as low forest cover
countries1. Although the region showed a net gain in
forest area over the last decade, an analysis further
back in time is constrained by changes in assessment
methodologies over time in some larger countries in the
region. Planted forest area increased by about 14 percent
in the region in the last 20 years, particularly as a result of
expansion of these areas in West Asia and North Africa.
During the last decade, the area of primary forests has
remained largely stable, with Sudan containing the largest
area of primary forest. There was an increase in area of
forest for biodiversity conservation, with an additional
85 000 ha designated for this purpose each year (on
average) in the last 10 years. The region also enlarged the
area devoted to soil and water conservation over the last
20 years.
The Near East saw a decline in the area designated
for productive functions in the 1990s, although the
trend reversed slightly in the last decade. The region
represented a very small portion of global wood
removals. It was difficult to determine a trend for the
annual value of wood products, as data were missing
from some countries’ submissions for the Global Forest
Resources Assessment 2010 (FRA 2010).
North AmericaNorth America showed a slight increase in forest area
between 1990 and 2010. The planted forest area also
increased, and the region showed a relatively stable,
positive trend in the level of biomass it contained. This
region accounted for about 25 percent of global primary
forests. The area of forest designated primarily for soil
and water conservation was less than in other regions,
as the management of these areas is largely embedded
in national and local laws and other forest management
guidance.
In contrast with other regions, a very small amount of
wood (about 10 percent) was removed for woodfuel, with
the remaining amount removed for industrial roundwood.
Employment trends in the United States of America and
Canada’s forest sectors showed a decline over the last
decade.
Chapter 2: Developing sustainable forest industries Over the last decade, there has been little analysis of
what constitutes a ‘sustainable forest industry’ and
the drivers that affect this sustainability. Of the factors
identified for this report, increasing population and
economic growth, expansion of markets, and social
trends related to social and environmental performance
were found to be the most important drivers for the
sustainability of the industry. However, some of the
same factors also have the potential to negatively
impact markets where the industry faces a greater level
of complexity and competition for resources.
Governments and industry have responded to the
opportunities and threats presented by these drivers
by making strategic choices to improve the industry’s
sustainability. Many of these strategies include similar
features such as: analyses of competitiveness, and
strengths and weaknesses in the sector; measures to
increase and cover costs for fibre supply; support for
research, development and innovation; and development
of new products (e.g. biofuels), which may signal a move
to a ‘greener’ economy.
As a response to the economic downturn that began in
2008 and negatively affected most developed countries,
industry has consolidated and restructured, reduced
overcapacity and reconciled production in areas where
countries were competitive. Typically, this has been
done by innovating or creating new partnerships.
Governments have also strengthened policies and
regulations to improve social and environmental
performance. FAO will continue to research these trends
and will produce a more thorough research product on
the theme of sustainable forest industries in 2011.
Chapter 3: Climate change mitigation and adaptation Over the last few years, forestry has become a critical
part of the international climate change agenda.
Governments have already agreed on the potential
importance of REDD+, and have provided large financial
resources to initiate pilot activities. Nevertheless, the
long-term sustainability of climate change and forestry
activities will depend on a number of factors, including
effective forest governance, secure forest carbon
tenure and equitable benefit sharing, and integration
of adaptation actions into climate change policies and
projects, among others. 1 Low forest cover countries are countries with less than 10 percent
forest cover.
xii
The UN Framework Convention on Climate Change
(UNFCCC) highlighted REDD+ and adopted a decision
on REDD+ in Cancún, Mexico in December 2010.
The decision outlines the scope of REDD+, which
includes reducing emissions from deforestation and
forest degradation, and the conservation, sustainable
management of forests and the enhancement of carbon
stocks, as well as the principles and safeguards for
REDD+. Further work on methodological issues, including
on monitoring, reporting and verification, will continue
throughout 2011 and perhaps beyond.
One of the most difficult aspects of ensuring the
sustainability of REDD activities is defining the ownership
of forest carbon rights. As this report shows, a number of
countries in the Asia and the Pacific region have created
legislation establishing property rights in carbon and
formalizing carbon rights. Some have taken this measure
a step further to establish carbon rights as a separate
interest in the land. The cases presented in this report
show the diversity of established guidelines and laws on
forest carbon rights at the country level, and provide clear
examples that have the potential to be replicated in other
countries.
While the issue of REDD in the climate change mitigation
debate is being addressed at the highest levels, the
subject of adaptation has not been as widely discussed
or integrated into policies and programmes. Adaptation is
complex and requires actions at multiple scales. Current
international agreements take adaptation into account
to a limited extent, but lack appropriate mechanisms to
incorporate adaptation and related forest activities in the
context of REDD+. More work is needed to consider the
role of forests in adaptation in climate change policies
and actions.
Chapter 4: The local value of forests Chapter 4 provides an introduction to the local value
of forests, in preparation for further discussions on
the theme ‘Forests for People’ during the International
Year of Forests in 2011. To expand upon this theme,
the topics of traditional knowledge, community-based
forest management (CBFM), small and medium forest
enterprises (SMFEs) and the non-cash value of forests
are explored.
Traditional knowledge (TK) contributes to local incomes,
typically through the use of commercialized products.
While there is some protection of traditional knowledge
in the international policy arena, further awareness
and integration of traditional knowledge into policies is
needed, particularly as REDD activities take shape.
Community-based forest management and SMFEs are
important for the production and marketing of wood and
NWFPs. The drivers of CBFM include decentralization,
enabling policy frameworks, national poverty reduction
agendas, rural development and emerging grassroots
and global networks. Under favourable conditions,
CBFM benefits can be seen over the long term and
can lead to greater participation, reduced poverty,
increased productivity and diversity of vegetation, and
the protection of forest species. As forests become more
productive, they can also lead to the development of
SMFEs, which are known to have clear benefits for local
livelihoods but require a sound enabling environment to
attract continued flows of investment.
Non-wood forest products remain critical to the success
of SMFEs. Legislation and regulation of NWFPs are
increasing to ensure the sustainable use of these
resources, through both international arrangements and
domestic policies and laws. Despite the known cash
values of NWFPs and their promotion through CBFM
and SMFEs, the ‘non-cash’ values of forests also need
to be further explored. Non-cash values often provide
important support for households in or near forests and
can sometimes make a larger contribution to households
than cash income. Particularly in remote, rural areas,
non-cash income is an essential part of sustainable
livelihoods, especially for women and the rural poor.

1

2 | Chapter 1
1The state of forest resources – a regional analysis
The Food and Agriculture Organization (FAO),
in cooperation with its member countries,
has assessed the world’s forests resources
at 5 to 10 year intervals since 1946. These
global assessments provide valuable
information to policy-makers at the national
and international levels, members of the public and other
groups and organizations interested in forestry.
The Global Forest Resources Assessment 2010 (FRA
2010) was the most comprehensive assessment to
date (FAO, 2010a). It examined the current status and
trends for more than 90 variables related to the extent,
condition, uses and values of all types of forests in 233
countries and areas for four points in time: 1990, 2000,
2005 and 2010. FRA 2010 told us that the world’s total
forest area was just over 4 billion hectares, corresponding
to 31 percent of the total land area or an average of 0.6
ha per capita. The five most forest-rich countries (the
Russian Federation, Brazil, Canada, the United States
of America and China) accounted for more than half
of the total forest area. Ten countries or areas had no
forest at all and an additional 54 had forest on less than
10 percent of their total land area.
North America Europe Africa Asia and the Pacific
Near EastLatin America and the Caribbean
Figure 1: State of the World’s Forests 2011 – subregional breakdown
North America Europe
South AsiaWest Africa
Southeast AsiaCentral Africa
Russian Federation
Central America
OceaniaEast Africa
East AsiaNorth Africa
Caribbean
Southern AfrciaWest Asia
South AmericaCentral Asia
North Africa

The state of forest resources – a regional analysis | 3
A key message from FRA 2010 was that, while the rate of
deforestation and loss of forest from natural causes was
still alarmingly high, it was slowing down. At the global
level, it decreased from an estimated 16 million hectares
per year in the 1990s to around 13 million hectares per
year in the last decade. At the same time, afforestation
and natural expansion of forests in some countries and
areas reduced the net loss of forest area significantly at
the global level. The net change in forest area in the period
2000–2010 was estimated at -5.2 million hectares per
year (an area about the size of Costa Rica), down from
-8.3 million hectares per year in the period 1990–2000.
However, most of the loss of forest continued to take place
in countries and areas in the tropical regions, while most of
the gain took place in the temperate and boreal zones, and
in some emerging economies.
Significant progress was made in developing forest
policies, laws and national forest programmes. Some
76 countries issued or updated their forest policy
statements since 2000, and 69 countries – primarily in
Europe and Africa – reported that their current forest
law has been enacted or amended since 2005. Close to
75 percent of the world’s forests were covered by a national
forest programme, i.e. a participatory process for the
development and implementation of forest-related policies
and international commitments at the national level.
More detailed results are presented in FRA 2010, according
to seven key aspects of sustainable forest management:
extent of forest resources; forest biological diversity; forest
health and vitality; productive functions of forest resources;
protective functions of forest resources; socio-economic
functions of forests; and the legal, policy and institutional
framework. For the purposes of this report, a few of the
key findings related to these thematic elements will be
discussed, providing an overview at the regional level.
Africa2
Extent of forest resourcesAccording to FRA 2010, the estimated forest area in
Africa3 was close to 675 million hectares (Table 1),
accounting for about 17 percent of global forest area
and 23 percent of the total land area in the region. At the
2 For the purposes of this review, countries and areas in Africa are grouped in the following subregions:- Central Africa: Burundi, Cameroon, Central African Republic, Chad, Democratic Republic of the Congo, Equatorial Guinea, Gabon, Republic of the Congo, Rwanda, Saint Helena, Ascension and Tristan da Cunha, Sao Tome and Principe - East Africa: Comoros, Djibouti, Eritrea, Ethiopia, Kenya, Madagascar, Mauritius, Mayotte, Réunion, Seychelles, Somalia, Uganda, United Republic of Tanzania - North Africa: Algeria, Egypt, Libyan Arab Jamahiriya, Mauritania, Morocco, Sudan, Tunisia, Western Sahara - Southern Africa: Angola, Botswana, Lesotho, Malawi, Mozambique, Namibia, South Africa, Swaziland, Zambia, Zimbabwe - West Africa: Benin, Burkina Faso, Cape Verde, Côte d’Ivoire, Gambia, Ghana, Guinea, Guinea-Bissau, Liberia, Mali, Niger, Nigeria, Senegal, Sierra Leone, Togo
3 The countries and areas forming part of the North Africa subregion (Algeria, Egypt, Libyan Arab Jamahiriya, Mauritania, Morocco, Sudan, Tunisia and Western Sahara) also appear in the Near East regional section. The inclusion of these countries and areas in both regions was intentional and necessary, as it reflects the categorization of countries within the FAO Regional Forestry Commissions.
Table 1: Forest area in Africa, 1990–2010a
Subregion Area (1 000 ha) Annual change (1 000 ha) Annual change rate (%)
1990 2000 2010 1990–2000 2000–2010 1990–2000 2000–2010
Central Africa 268 214 261 455 254 854 -676 -660 -0.25 -0.26
East Africa 88 865 81 027 73 197 -784 -783 -0.92 -1.01
North Africa 85 123 79 224 78 814 -590 -41 -0.72 -0.05
Southern Africa 215 447 204 879 194 320 -1 057 -1 056 -0.50 -0.53
West Africa 91 589 81 979 73 234 -961 -875 -1.10 -1.12
Total Africa 749 238 708 564 674 419 -4 067 -3 414 -0.56 -0.49
World 4 168 399 4 085 063 4 032 905 -8 334 -5 216 -0.20 -0.13
aAll tables and graphs showing trends are based on those countries which provided information for all points in time (1990, 2000, 2005 and 2010). More complete information on the status as of 2010 may be available for some variables. The annual change rate is the gain or loss in percent of the remaining forest area each year within the given period.
4 | Chapter 1
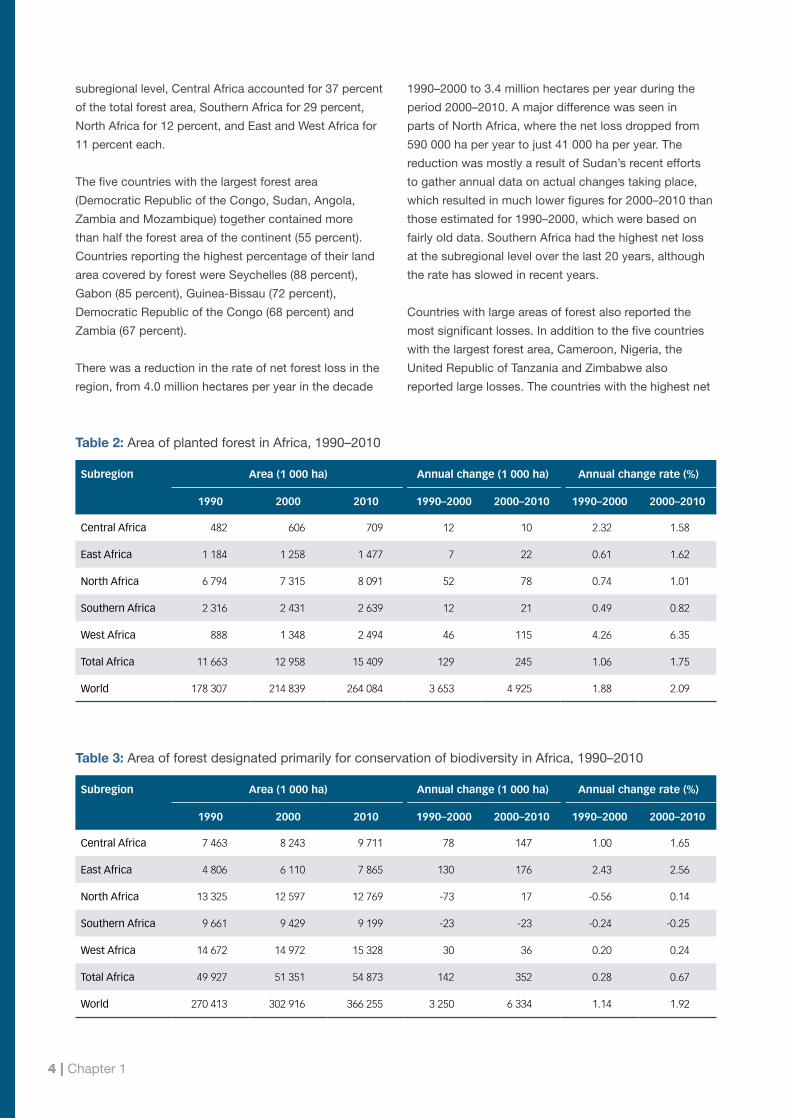
subregional level, Central Africa accounted for 37 percent
of the total forest area, Southern Africa for 29 percent,
North Africa for 12 percent, and East and West Africa for
11 percent each.
The five countries with the largest forest area
(Democratic Republic of the Congo, Sudan, Angola,
Zambia and Mozambique) together contained more
than half the forest area of the continent (55 percent).
Countries reporting the highest percentage of their land
area covered by forest were Seychelles (88 percent),
Gabon (85 percent), Guinea-Bissau (72 percent),
Democratic Republic of the Congo (68 percent) and
Zambia (67 percent).
There was a reduction in the rate of net forest loss in the
region, from 4.0 million hectares per year in the decade
1990–2000 to 3.4 million hectares per year during the
period 2000–2010. A major difference was seen in
parts of North Africa, where the net loss dropped from
590 000 ha per year to just 41 000 ha per year. The
reduction was mostly a result of Sudan’s recent efforts
to gather annual data on actual changes taking place,
which resulted in much lower figures for 2000–2010 than
those estimated for 1990–2000, which were based on
fairly old data. Southern Africa had the highest net loss
at the subregional level over the last 20 years, although
the rate has slowed in recent years.
Countries with large areas of forest also reported the
most significant losses. In addition to the five countries
with the largest forest area, Cameroon, Nigeria, the
United Republic of Tanzania and Zimbabwe also
reported large losses. The countries with the highest net
Table 2: Area of planted forest in Africa, 1990–2010
Subregion Area (1 000 ha) Annual change (1 000 ha) Annual change rate (%)
1990 2000 2010 1990–2000 2000–2010 1990–2000 2000–2010
Central Africa 482 606 709 12 10 2.32 1.58
East Africa 1 184 1 258 1 477 7 22 0.61 1.62
North Africa 6 794 7 315 8 091 52 78 0.74 1.01
Southern Africa 2 316 2 431 2 639 12 21 0.49 0.82
West Africa 888 1 348 2 494 46 115 4.26 6.35
Total Africa 11 663 12 958 15 409 129 245 1.06 1.75
World 178 307 214 839 264 084 3 653 4 925 1.88 2.09
Table 3: Area of forest designated primarily for conservation of biodiversity in Africa, 1990–2010
Subregion Area (1 000 ha) Annual change (1 000 ha) Annual change rate (%)
1990 2000 2010 1990–2000 2000–2010 1990–2000 2000–2010
Central Africa 7 463 8 243 9 711 78 147 1.00 1.65
East Africa 4 806 6 110 7 865 130 176 2.43 2.56
North Africa 13 325 12 597 12 769 -73 17 -0.56 0.14
Southern Africa 9 661 9 429 9 199 -23 -23 -0.24 -0.25
West Africa 14 672 14 972 15 328 30 36 0.20 0.24
Total Africa 49 927 51 351 54 873 142 352 0.28 0.67
World 270 413 302 916 366 255 3 250 6 334 1.14 1.92

The state of forest resources – a regional analysis | 5
Republic of the Congo, which together represented
26 percent of the total forest area in the region, did
not report on this category. There was evidence of
an overall decline in primary forest area in the region
(Figure 3), with primary forests declining by more
than half a million hectares per year over the period
2000–2010. The five countries that reported the largest
primary forest area were Gabon, Sudan, Republic of
the Congo, Madagascar and Central African Republic.
The countries reporting the largest proportion of their
forests as being primary (ranging from 65 to 24 percent)
were (in descending order): Gabon, Réunion, Sao
Tome and Principe, Republic of the Congo, Malawi and
Madagascar. Gabon registered the largest annual loss
of primary forest, an area of more than 330 000 ha per
year, largely due to a reclassification of primary forests
to ‘other naturally regenerated forests’ because of
selective logging and other human interventions within
the reporting period.
loss in percentage terms were Comoros, Togo, Nigeria,
Mauritania and Uganda. Ten countries reported a net
gain in forest area between 1990 and 2010 with Tunisia,
Côte d’Ivoire, Rwanda, Swaziland and Morocco topping
the list.
Africa also had extensive areas of land classified as
‘other wooded land’, with scattered tree growth too
sparse to be defined as forest. The total area was more
than 350 million hectares, corresponding to 31 percent
of the total area of other wooded land in the world,
which declined by close to 1.9 million hectares per year
(0.5 percent per annum) during the period 1990–2010.
The largest losses occurred in Mali, Sudan, the United
Republic of Tanzania, Nigeria and Madagascar.
Forest planting programmes were established in several
countries for both productive and protective purposes.
Africa’s total area of planted forests was about 15 million
hectares (or 2.3 percent of the total forest area), with the
biggest area located in North Africa (Table 2). Sudan had
by far the largest area with more than 6 million hectares
including governmental, private and community planting
schemes. South Africa had almost 2 million hectares
of planted forest area of which almost three-quarters
were privately owned (corporate growers and individual
commercial farmers).
Growing stock and carbon storage were assessed to
determine relevant trends related to climate change
– while sustainable management, planting and
rehabilitation of forests can conserve or increase forest
carbon stocks, deforestation, forest degradation and
poor management practices reduce them. The region
contributed 21 percent of the global total of carbon
in forest biomass, with Central Africa containing the
largest amount of carbon in forest biomass (Figure 2).
Côte d’Ivoire reported the highest level of carbon stock
per hectare in the region (177 tonnes per hectare)
followed by the Republic of the Congo. Except for
North Africa, all the subregions experienced a decline in
carbon stocks in forest biomass between 1990 and 2010
because of the loss of forest area.
Biological diversity and protective functionsAround 10 percent of the total forest area in the
region was reported to be primary forest (i.e.
composed of native species with no clearly visible
indications of human activity and no disruptions to
ecological processes). However, this figure may be an
underestimate because Cameroon and the Democratic
5
10
15
20
25
30
35
Gt
Central Africa
1990 2000 2010
East Africa North Africa Southern Africa
West Africa0
Figure 2: Carbon stock in forest biomass in Africa, 1990–2010 (Gt)
Figure 3: Area of primary forest in Africa, 1990–2010 (million ha)
5
10
15
20
25
30
35
Mill
ion
ha
Central Africa
1990 2000 2010
East Africa North Africa Southern Africa
West Africa0

6 | Chapter 1
About 14 percent of the total forest area in Africa was
designated for conservation of biological diversity (Table 3).
Most of the countries in the region showed an increase
in forest area designated for conservation or showed no
change since 1990. Just six countries showed a negative
trend (Mauritius, Mozambique, Republic of the Congo,
Senegal, Sudan and Togo). At the regional level, there was
a substantial increase during the last decade, particularly
as a result of increases in Central and East Africa. However,
Southern Africa showed a negative change because of the
decrease in forest area reported by Mozambique.
Only about 3 percent of the forest area was designated
primarily for protection of soil and water, compared
with 8 percent at the global level. Mozambique reported
the largest area (almost 9 million hectares) under this
designation, corresponding to 22 percent of its total
forest. In terms of percentage, Libyan Arab Jamahiriya
reported that all of its forests were designated primarily
for protection of soil and water, while Kenya listed
94 percent of its forest area under this category, which
corresponded to all its natural forest. Comoros reported
that two-thirds of its forest area was designated for soil
and water conservation while Algeria and Egypt both
recorded around 50 percent of their forest area under
this designation; in Algeria most of this was inaccessible
forest area, and in Egypt all of this was planted. Africa’s
total forest area designated for soil and water protection
showed a net loss of 0.9 million hectares in the last
decade, while globally this area increased by more than
27 million hectares over the same period (Table 4).
Productive and socio-economic functionsThe extent of forests designated for production of wood
and non-wood forest products (NWFPs) declined in Africa
over the last 20 years (Table 5). As conservation areas
Table 4: Area of forest designated primarily for protection of soil and water in Africa, 1990–2010
Subregion Area (1 000 ha) Annual change (1 000 ha) Annual change rate (%)
1990 2000 2010 1990–2000 2000–2010 1990–2000 2000–2010
Central Africa 342 752 662 41 -9 8.20 -1.27
East Africa 3 703 3 596 3 475 -11 -12 -0.29 -0.34
North Africa 4 068 3 855 3 851 -21 n.s. -0.54 -0.01
Southern Africa 10 300 9 715 9 136 -59 -58 -0.58 -0.61
West Africa 2 297 2 529 2 417 23 -11 0.97 -0.45
Total Africa 20 709 20 447 19 540 -26 -91 -0.13 -0.45
World 240 433 271 699 299 378 3 127 2 768 1.23 0.97
Table 5: Area of forest designated primarily for production in Africa, 1990–2010
Subregion Area (1 000 ha) Annual change (1 000 ha) Annual change rate (%)
1990 2000 2010 1990–2000 2000–2010 1990–2000 2000–2010
Central Africa 66 944 66 197 59 844 -75 -635 -0.11 -1.00
East Africa 34 330 31 127 27 957 -320 -317 -0.97 -1.07
North Africa 39 557 36 637 36 819 -292 18 -0.76 0.05
Southern Africa 36 950 34 834 33 199 -212 -163 -0.59 -0.48
West Africa 33 164 33 898 28 208 73 -569 0.22 -1.82
Total Africa 210 944 202 693 186 027 -825 -1 667 -0.40 -0.85
World 1 181 576 1 160 325 1 131 210 -2 125 -2 911 -0.18 -0.25
The state of forest resources – a regional analysis | 7
increased, this may have caused the area of productive
forests to decline. It may also be an indication that
concessions were cancelled or productive forests were
being cleared to convert the land to non-forest uses.
Central and West Africa’s areas of forest designated
primarily for productive functions fell considerably
between 2000 and 2010. In Central Africa, the decrease
was largely the result of a change in Gabon’s forest
legislation in 2001 and a reassignment of forest functions,
which reduced the country’s productive forest area
by nearly one-half. In the same subregion, Cameroon
showed the highest increase in forest area designated
for production over the last ten years, due to recent
designations of additional forest concessions, community
and communal forests and hunting reserves. In West
Africa, the biggest decreases took place in Liberia and
Nigeria. In Liberia, the reported decline was caused by
the cancellation of forest concessions after 2005.
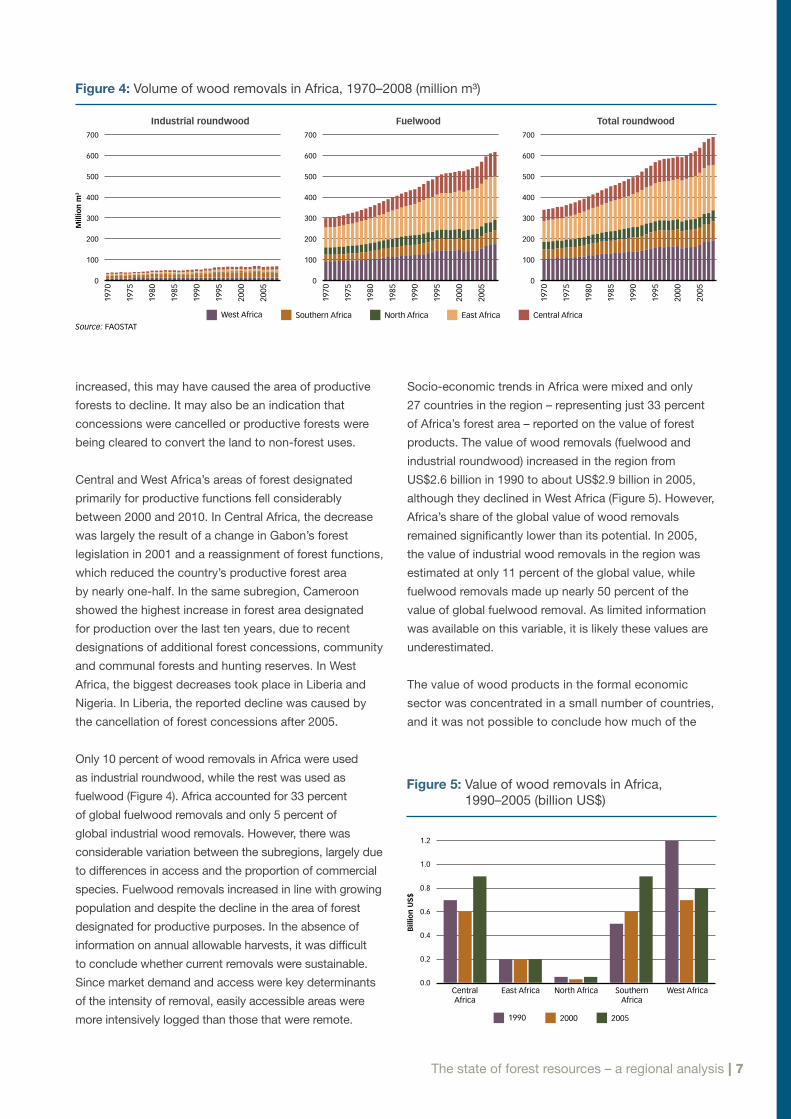
Only 10 percent of wood removals in Africa were used
as industrial roundwood, while the rest was used as
fuelwood (Figure 4). Africa accounted for 33 percent
of global fuelwood removals and only 5 percent of
global industrial wood removals. However, there was
considerable variation between the subregions, largely due
to differences in access and the proportion of commercial
species. Fuelwood removals increased in line with growing
population and despite the decline in the area of forest
designated for productive purposes. In the absence of
information on annual allowable harvests, it was difficult
to conclude whether current removals were sustainable.
Since market demand and access were key determinants
of the intensity of removal, easily accessible areas were
more intensively logged than those that were remote.
Socio-economic trends in Africa were mixed and only
27 countries in the region – representing just 33 percent
of Africa’s forest area – reported on the value of forest
products. The value of wood removals (fuelwood and
industrial roundwood) increased in the region from
US$2.6 billion in 1990 to about US$2.9 billion in 2005,
although they declined in West Africa (Figure 5). However,
Africa’s share of the global value of wood removals
remained significantly lower than its potential. In 2005,
the value of industrial wood removals in the region was
estimated at only 11 percent of the global value, while
fuelwood removals made up nearly 50 percent of the
value of global fuelwood removal. As limited information
was available on this variable, it is likely these values are
underestimated.
The value of wood products in the formal economic
sector was concentrated in a small number of countries,
and it was not possible to conclude how much of the
West Africa Southern Africa North Africa East Africa Central Africa
Figure 4: Volume of wood removals in Africa, 1970–2008 (million m³)
Source:FAOSTAT
100
200
300
400
500
600
700
Mill
ion
m3
0
100
200
300
400
500
600
700
0
100
200
300
400
500
600
700
0
1970
1970
1975
1975
1980
1980
1985
1985
1990
1990
1995
1995
2000
2000
2005
2005
1970
1975
1980
1985
1990
1995
2000
2005
Industrial roundwood Fuelwood Total roundwood
0.2
0.4
0.6
0.8
1.0
1.2
Bill
ion
US
$
Central Africa
1990 2000 2005
East Africa North Africa Southern Africa
West Africa0.0
Figure 5: Value of wood removals in Africa, 1990–2005 (billion US$)

8 | Chapter 1
value was generated from legally harvested timber,
NWFPs and subsistence removals, respectively,
because of weak monitoring and reporting capacity
in several key countries. Exudates, food and living
animals were the most important NWFPs extracted from
African forest areas. However, very little information was
reported on this variable.
More than half a million people were reportedly involved
in the primary production of goods in forests in Africa
(Table 6). A number of countries reported growth in
employment in the formal forest sector while others
reported a decline. For instance, forestry employment
in Algeria doubled from 2000 to 2005. Liberia noted a
decrease in employment, however, mainly due to the
2003 sanctions imposed by the UN Security Council,
which halted government revenues from logging thus
affecting employment levels.
The scarcity of information on production and
employment in the informal sector means that these
reports do not provide an accurate picture of the
importance of the sector for national economies.
A significant proportion of wood production (fuelwood,
in particular) and processing (e.g. pit-sawing,
charcoal production, and collection and trade of
NWFPs) took place in the informal sector and has
not been adequately evaluated. Improvements in
the understanding of the informal sector are needed
to suggest better policies and practices for greater
sustainability.
Asia and the Pacific4
Extent of forest resourcesForests cover slightly less than one-third of the total
land area of the Asia and the Pacific region. Based
on estimates for FRA 2010, the region’s forested area
was 740 million hectares in 2010, accounting for about
18 percent of the global forest area (Table 7). East Asia
contained the largest forest area (255 million hectares),
followed by Southeast Asia (214 million hectares),
4 For the purposes of this review, countries and areas in the Asia and the Pacific region are grouped into the following subregions:- East Asia: China, Democratic People’s Republic of Korea, Japan, Mongolia, Republic of Korea - South Asia: Bangladesh, Bhutan, India, Maldives, Nepal, Pakistan, Sri Lanka- Southeast Asia: Brunei, Cambodia, Indonesia, Lao People’s Democratic Republic, Malaysia, Myanmar, Philippines, Singapore, Thailand, Timor-Leste, Viet Nam - Oceania: American Samoa, Australia, Cook Islands, Federated States of Micronesia, Fiji, French Polynesia, Guam, Kiribati, Marshall Islands, Nauru, New Caledonia, New Zealand, Niue, Norfolk Island, Northern Mariana Islands, Palau, Papua New Guinea, Pitcairn, Samoa, Solomon Islands, Tokelau, Tonga, Tuvalu, Vanuatu, Wallis and Futuna Islands
Table 7: Forest area in Asia and the Pacific, 1990–2010
Subregion Area (1 000 ha) Annual change (1 000 ha) Annual change rate (%)
1990 2000 2010 1990–2000 2000–2010 1990–2000 2000–2010
East Asia 209 198 226 815 254 626 1 762 2 781 0.81 1.16
South Asia 78 163 78 098 80 309 -7 221 -0.01 0.28
Southeast Asia 247 260 223 045 214 064 -2 422 -898 -1.03 -0.41
Oceania 198 744 198 381 191 384 -36 -700 -0.02 -0.36
Total Asia–Pacific 733 364 726 339 740 383 -703 1 404 -0.10 0.19
World 4 168 399 4 085 063 4 032 905 -8 334 -5 216 -0.20 -0.13
Table 6: Employment in primary production of forest goods in Africa, 2005 (1 000 FTE)
Subregion Employment in primary production of goods, 2005
Central Africa 30
East Africa 12
North Africa 209
Southern Africa 139
West Africa 181
Total Africa 571
World 10 537

The state of forest resources – a regional analysis | 9
Oceania (191 million hectares) and South Asia (80 million
hectares). The five countries with the largest forested
area (China, Australia, Indonesia, India and Myanmar)
accounted for 74 percent of the forest in the region,
with China and Australia alone accounting for almost
half the forest area of the region. The Federated States
of Micronesia reported that 92 percent of its land area
was covered by forests while six countries reported that
forests covered no more than 10 percent of their total
land area. Two of these, Nauru and Tokelau, reported no
forest at all.
In the Asia and the Pacific region as a whole, forests
were lost at a rate of 0.7 million hectares per year in the
1990s but grew by 1.4 million hectares per year over
the period 2000–2010. This was primarily due to large-
scale afforestation efforts in China, where the forest area
increased by 2 million hectares per year in the 1990s
and by an average of 3 million hectares per year since
2000. Bhutan, India, the Philippines and Viet Nam also
registered forest area increases in the last decade.
Despite the net increase in forest area reported at the
regional level, deforestation continued at high rates
in many countries. Southeast Asia experienced the
largest decline in forest area in the region in the last ten
years, with an annual net loss of forests of more than
0.9 million hectares. However, when compared with
figures for 1990–2000 (-2.4 million hectares per year), this
represented a significant drop. Oceania also experienced
a negative trend, primarily because severe drought and
forest fires in Australia have exacerbated the loss of forest
since 2000 and caused it to register the largest annual
loss of any country in the region between 2000 and 2010.
Cambodia, Indonesia, Myanmar and Papua New Guinea
also reported large forest losses in the last decade.
Planted forests (i.e. forests established through
planting and/or deliberate seeding of native or
introduced tree species) made up 16 percent of the
forest area in the region. Planted forests experienced
a substantial increase within the last ten years in
the Asia and the Pacific region (Table 8). Most of the
region’s planted forests were established through
afforestation programmes. China contributed the
bulk of this growth through several large programmes
that aimed to expand its forest resources and protect
watersheds, control soil erosion and desertification,
and maintain biodiversity.
China, India and Viet Nam have established targets for
large-scale forest planting and also developed incentive
programmes for smallholders to plant more trees.
China plans a 50 million hectare increase in the area
of its planted forests by 2020, with the aim of covering
23 percent of the total land area with forests, a target
which may be reached by 2015 if current planting rates
continue. India set a target to cover 33 percent of its
land area with forests and tree cover by 2012. Based on
figures supplied in FRA 2010, some 25 percent of India’s
land area was covered by forests, other wooded land
or other land with tree cover in 2010. To this should be
added an unknown area of line plantings and other ‘trees
outside forests’. The Government of Viet Nam aimed to
restore forest cover to 43 percent by 2010 and, according
to the information provided for FRA 2010, this target was
achieved.
Growing stock and carbon storage were also important
parameters in determining the relevant trends in the
extent of forest resources. Total carbon stored in forest
biomass was 44 Giga tonnes (Gt) in the Asia and the
Pacific region as a whole. Carbon stocks in forest
Table 8: Area of planted forests in Asia and the Pacific, 1990–2010
Subregion Area (1 000 ha) Annual change (1 000 ha) Annual change rate (%)
1990 2000 2010 1990–2000 2000–2010 1990–2000 2000–2010
East Asia 55 049 67 494 90 232 1 244 2 274 2.06 2.95
South Asia 6 472 7 999 11 019 153 302 2.14 3.25
Southeast Asia 10 059 11 737 14 533 168 280 1.56 2.16
Oceania 2 583 3 323 4 101 74 78 2.55 2.12
Total Asia–Pacific 74 163 90 553 119 884 1 639 2 933 2.02 2.85
World 178 307 214 839 264 084 3 653 4 925 1.88 2.09
10 | Chapter 1
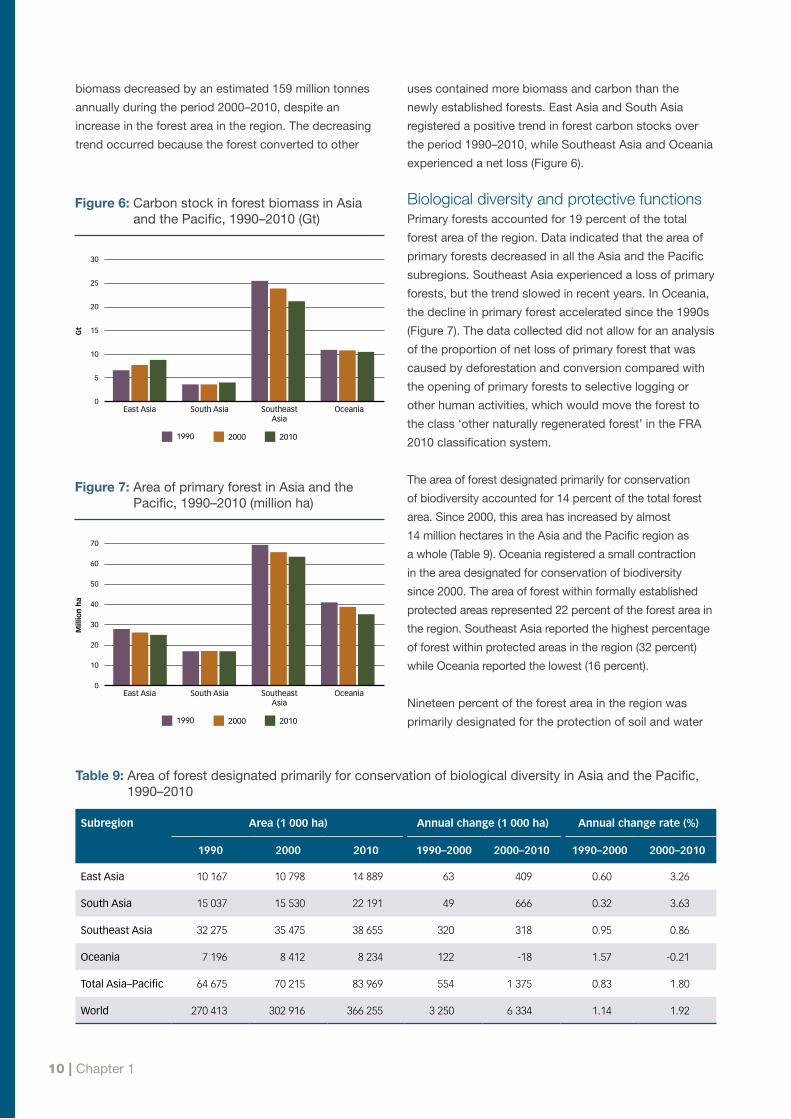
uses contained more biomass and carbon than the
newly established forests. East Asia and South Asia
registered a positive trend in forest carbon stocks over
the period 1990–2010, while Southeast Asia and Oceania
experienced a net loss (Figure 6).
Biological diversity and protective functionsPrimary forests accounted for 19 percent of the total
forest area of the region. Data indicated that the area of
primary forests decreased in all the Asia and the Pacific
subregions. Southeast Asia experienced a loss of primary
forests, but the trend slowed in recent years. In Oceania,
the decline in primary forest accelerated since the 1990s
(Figure 7). The data collected did not allow for an analysis
of the proportion of net loss of primary forest that was
caused by deforestation and conversion compared with
the opening of primary forests to selective logging or
other human activities, which would move the forest to
the class ‘other naturally regenerated forest’ in the FRA
2010 classification system.
The area of forest designated primarily for conservation
of biodiversity accounted for 14 percent of the total forest
area. Since 2000, this area has increased by almost
14 million hectares in the Asia and the Pacific region as
a whole (Table 9). Oceania registered a small contraction
in the area designated for conservation of biodiversity
since 2000. The area of forest within formally established
protected areas represented 22 percent of the forest area in
the region. Southeast Asia reported the highest percentage
of forest within protected areas in the region (32 percent)
while Oceania reported the lowest (16 percent).
Nineteen percent of the forest area in the region was
primarily designated for the protection of soil and water
Table 9: Area of forest designated primarily for conservation of biological diversity in Asia and the Pacific, 1990–2010
Subregion Area (1 000 ha) Annual change (1 000 ha) Annual change rate (%)
1990 2000 2010 1990–2000 2000–2010 1990–2000 2000–2010
East Asia 10 167 10 798 14 889 63 409 0.60 3.26
South Asia 15 037 15 530 22 191 49 666 0.32 3.63
Southeast Asia 32 275 35 475 38 655 320 318 0.95 0.86
Oceania 7 196 8 412 8 234 122 -18 1.57 -0.21
Total Asia–Pacific 64 675 70 215 83 969 554 1 375 0.83 1.80
World 270 413 302 916 366 255 3 250 6 334 1.14 1.92
10
20
30
40
50
60
70
Mill
ion
ha
East Asia
1990 2000 2010
South Asia Southeast Asia
Oceania0
Figure 7: Area of primary forest in Asia and the Pacific, 1990–2010 (million ha)
biomass decreased by an estimated 159 million tonnes
annually during the period 2000–2010, despite an
increase in the forest area in the region. The decreasing
trend occurred because the forest converted to other
Figure 6: Carbon stock in forest biomass in Asia and the Pacific, 1990–2010 (Gt)
5
10
15
20
25
30
Gt
East Asia
1990 2000 2010
South Asia Southeast Asia
Oceania0
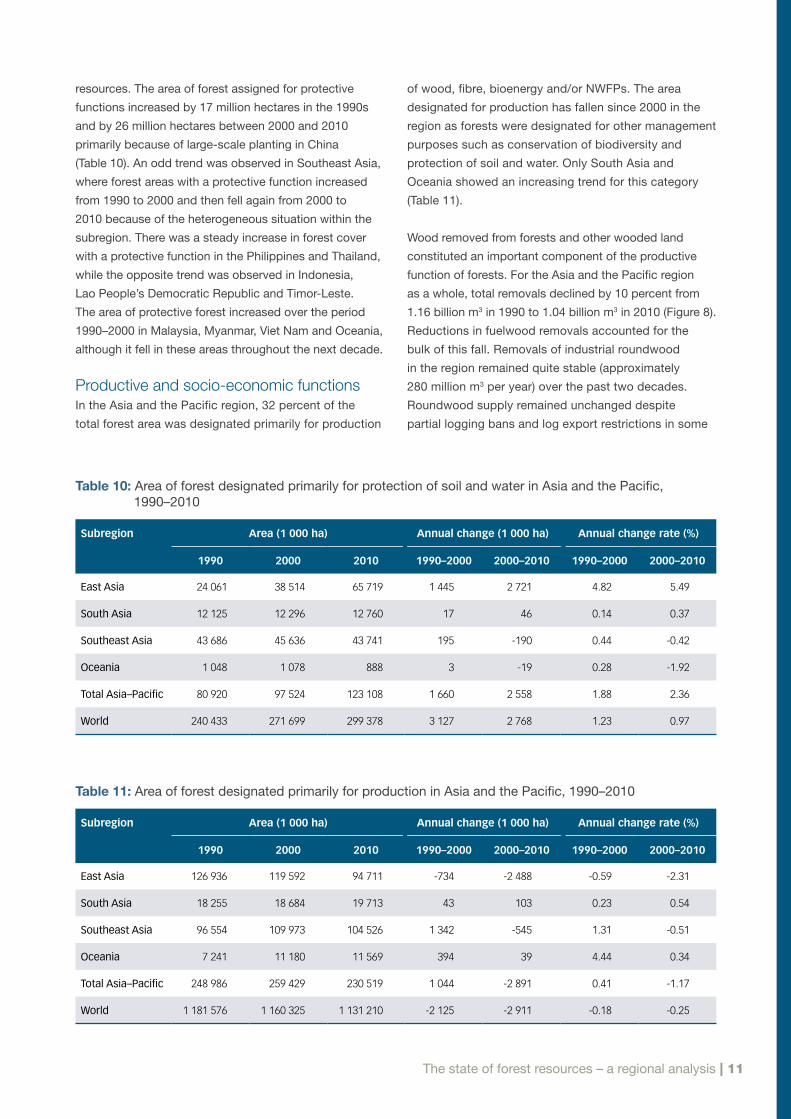
The state of forest resources – a regional analysis | 11
resources. The area of forest assigned for protective
functions increased by 17 million hectares in the 1990s
and by 26 million hectares between 2000 and 2010
primarily because of large-scale planting in China
(Table 10). An odd trend was observed in Southeast Asia,
where forest areas with a protective function increased
from 1990 to 2000 and then fell again from 2000 to
2010 because of the heterogeneous situation within the
subregion. There was a steady increase in forest cover
with a protective function in the Philippines and Thailand,
while the opposite trend was observed in Indonesia,
Lao People’s Democratic Republic and Timor-Leste.
The area of protective forest increased over the period
1990–2000 in Malaysia, Myanmar, Viet Nam and Oceania,
although it fell in these areas throughout the next decade.
Productive and socio-economic functions In the Asia and the Pacific region, 32 percent of the
total forest area was designated primarily for production
of wood, fibre, bioenergy and/or NWFPs. The area
designated for production has fallen since 2000 in the
region as forests were designated for other management
purposes such as conservation of biodiversity and
protection of soil and water. Only South Asia and
Oceania showed an increasing trend for this category
(Table 11).
Wood removed from forests and other wooded land
constituted an important component of the productive
function of forests. For the Asia and the Pacific region
as a whole, total removals declined by 10 percent from
1.16 billion m3 in 1990 to 1.04 billion m3 in 2010 (Figure 8).
Reductions in fuelwood removals accounted for the
bulk of this fall. Removals of industrial roundwood
in the region remained quite stable (approximately
280 million m3 per year) over the past two decades.
Roundwood supply remained unchanged despite
partial logging bans and log export restrictions in some
Table 10: Area of forest designated primarily for protection of soil and water in Asia and the Pacific, 1990–2010
Subregion Area (1 000 ha) Annual change (1 000 ha) Annual change rate (%)
1990 2000 2010 1990–2000 2000–2010 1990–2000 2000–2010
East Asia 24 061 38 514 65 719 1 445 2 721 4.82 5.49
South Asia 12 125 12 296 12 760 17 46 0.14 0.37
Southeast Asia 43 686 45 636 43 741 195 -190 0.44 -0.42
Oceania 1 048 1 078 888 3 -19 0.28 -1.92
Total Asia–Pacific 80 920 97 524 123 108 1 660 2 558 1.88 2.36
World 240 433 271 699 299 378 3 127 2 768 1.23 0.97
Table 11: Area of forest designated primarily for production in Asia and the Pacific, 1990–2010
Subregion Area (1 000 ha) Annual change (1 000 ha) Annual change rate (%)
1990 2000 2010 1990–2000 2000–2010 1990–2000 2000–2010
East Asia 126 936 119 592 94 711 -734 -2 488 -0.59 -2.31
South Asia 18 255 18 684 19 713 43 103 0.23 0.54
Southeast Asia 96 554 109 973 104 526 1 342 -545 1.31 -0.51
Oceania 7 241 11 180 11 569 394 39 4.44 0.34
Total Asia–Pacific 248 986 259 429 230 519 1 044 -2 891 0.41 -1.17
World 1 181 576 1 160 325 1 131 210 -2 125 -2 911 -0.18 -0.25
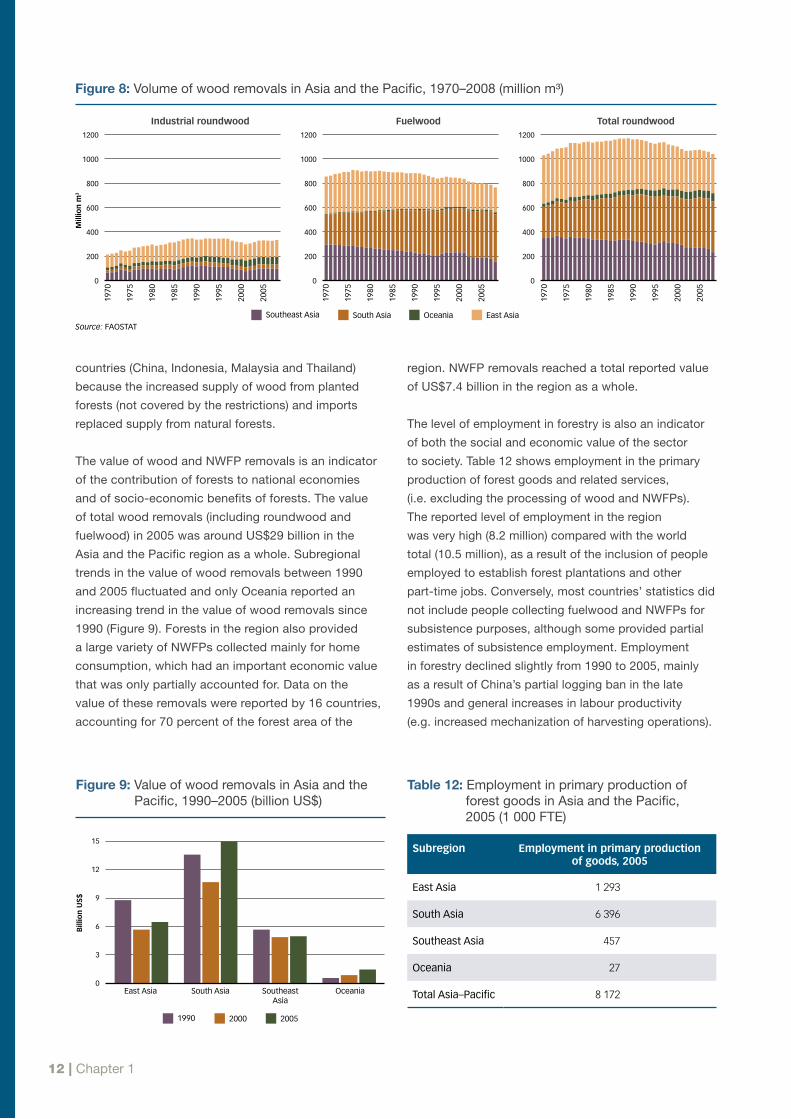
12 | Chapter 1
countries (China, Indonesia, Malaysia and Thailand)
because the increased supply of wood from planted
forests (not covered by the restrictions) and imports
replaced supply from natural forests.
The value of wood and NWFP removals is an indicator
of the contribution of forests to national economies
and of socio-economic benefits of forests. The value
of total wood removals (including roundwood and
fuelwood) in 2005 was around US$29 billion in the
Asia and the Pacific region as a whole. Subregional
trends in the value of wood removals between 1990
and 2005 fluctuated and only Oceania reported an
increasing trend in the value of wood removals since
1990 (Figure 9). Forests in the region also provided
a large variety of NWFPs collected mainly for home
consumption, which had an important economic value
that was only partially accounted for. Data on the
value of these removals were reported by 16 countries,
accounting for 70 percent of the forest area of the
region. NWFP removals reached a total reported value
of US$7.4 billion in the region as a whole.
The level of employment in forestry is also an indicator
of both the social and economic value of the sector
to society. Table 12 shows employment in the primary
production of forest goods and related services,
(i.e. excluding the processing of wood and NWFPs).
The reported level of employment in the region
was very high (8.2 million) compared with the world
total (10.5 million), as a result of the inclusion of people
employed to establish forest plantations and other
part-time jobs. Conversely, most countries’ statistics did
not include people collecting fuelwood and NWFPs for
subsistence purposes, although some provided partial
estimates of subsistence employment. Employment
in forestry declined slightly from 1990 to 2005, mainly
as a result of China’s partial logging ban in the late
1990s and general increases in labour productivity
(e.g. increased mechanization of harvesting operations).
Table 12: Employment in primary production of forest goods in Asia and the Pacific, 2005 (1 000 FTE)
Subregion Employment in primary production of goods, 2005
East Asia 1 293
South Asia 6 396
Southeast Asia 457
Oceania 27
Total Asia–Pacific 8 172
3
6
9
12
15
Bill
ion
US
$
East Asia
1990 2000 2005
South Asia Southeast Asia
Oceania0
Figure 9: Value of wood removals in Asia and the Pacific, 1990–2005 (billion US$)
Southeast Asia South Asia Oceania East Asia
Figure 8: Volume of wood removals in Asia and the Pacific, 1970–2008 (million m³)
Source:FAOSTAT
200
400
600
800
1000
1200
Mill
ion
m3
0
200
400
600
800
1000
1200
0
200
400
600
800
1000
1200
0
1970
1970
1975
1975
1980
1980
1985
1985
1990
1990
1995
1995
2000
2000
2005
2005
1970
1975
1980
1985
1990
1995
2000
2005
Industrial roundwood Fuelwood Total roundwood
The state of forest resources – a regional analysis | 13
Europe5
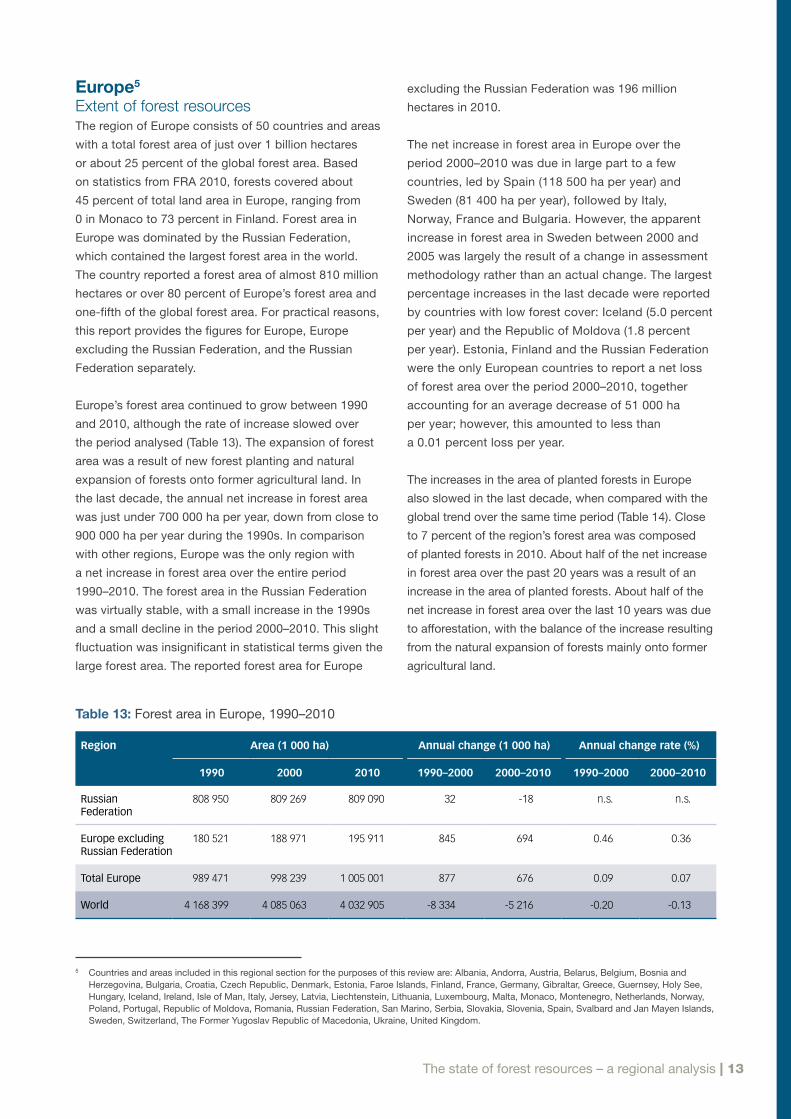
Extent of forest resources The region of Europe consists of 50 countries and areas
with a total forest area of just over 1 billion hectares
or about 25 percent of the global forest area. Based
on statistics from FRA 2010, forests covered about
45 percent of total land area in Europe, ranging from
0 in Monaco to 73 percent in Finland. Forest area in
Europe was dominated by the Russian Federation,
which contained the largest forest area in the world.
The country reported a forest area of almost 810 million
hectares or over 80 percent of Europe’s forest area and
one-fifth of the global forest area. For practical reasons,
this report provides the figures for Europe, Europe
excluding the Russian Federation, and the Russian
Federation separately.
Europe’s forest area continued to grow between 1990
and 2010, although the rate of increase slowed over
the period analysed (Table 13). The expansion of forest
area was a result of new forest planting and natural
expansion of forests onto former agricultural land. In
the last decade, the annual net increase in forest area
was just under 700 000 ha per year, down from close to
900 000 ha per year during the 1990s. In comparison
with other regions, Europe was the only region with
a net increase in forest area over the entire period
1990–2010. The forest area in the Russian Federation
was virtually stable, with a small increase in the 1990s
and a small decline in the period 2000–2010. This slight
fluctuation was insignificant in statistical terms given the
large forest area. The reported forest area for Europe
excluding the Russian Federation was 196 million
hectares in 2010.
The net increase in forest area in Europe over the
period 2000–2010 was due in large part to a few
countries, led by Spain (118 500 ha per year) and
Sweden (81 400 ha per year), followed by Italy,
Norway, France and Bulgaria. However, the apparent
increase in forest area in Sweden between 2000 and
2005 was largely the result of a change in assessment
methodology rather than an actual change. The largest
percentage increases in the last decade were reported
by countries with low forest cover: Iceland (5.0 percent
per year) and the Republic of Moldova (1.8 percent
per year). Estonia, Finland and the Russian Federation
were the only European countries to report a net loss
of forest area over the period 2000–2010, together
accounting for an average decrease of 51 000 ha
per year; however, this amounted to less than
a 0.01 percent loss per year.
The increases in the area of planted forests in Europe
also slowed in the last decade, when compared with the
global trend over the same time period (Table 14). Close
to 7 percent of the region’s forest area was composed
of planted forests in 2010. About half of the net increase
in forest area over the past 20 years was a result of an
increase in the area of planted forests. About half of the
net increase in forest area over the last 10 years was due
to afforestation, with the balance of the increase resulting
from the natural expansion of forests mainly onto former
agricultural land.
5 Countries and areas included in this regional section for the purposes of this review are: Albania, Andorra, Austria, Belarus, Belgium, Bosnia and Herzegovina, Bulgaria, Croatia, Czech Republic, Denmark, Estonia, Faroe Islands, Finland, France, Germany, Gibraltar, Greece, Guernsey, Holy See, Hungary, Iceland, Ireland, Isle of Man, Italy, Jersey, Latvia, Liechtenstein, Lithuania, Luxembourg, Malta, Monaco, Montenegro, Netherlands, Norway, Poland, Portugal, Republic of Moldova, Romania, Russian Federation, San Marino, Serbia, Slovakia, Slovenia, Spain, Svalbard and Jan Mayen Islands, Sweden, Switzerland, The Former Yugoslav Republic of Macedonia, Ukraine, United Kingdom.
Table 13: Forest area in Europe, 1990–2010
Region Area (1 000 ha) Annual change (1 000 ha) Annual change rate (%)
1990 2000 2010 1990–2000 2000–2010 1990–2000 2000–2010
Russian Federation
808 950 809 269 809 090 32 -18 n.s. n.s.
Europe excluding Russian Federation
180 521 188 971 195 911 845 694 0.46 0.36
Total Europe 989 471 998 239 1 005 001 877 676 0.09 0.07
World 4 168 399 4 085 063 4 032 905 -8 334 -5 216 -0.20 -0.13

14 | Chapter 1
In Europe, the total carbon stock in forest biomass
was estimated at 45 Gt or almost 16 percent of the
world total (Figure 10). Europe excluding the Russian
Federation accounted for almost 13 Gt and here the
annual increase was about 145 tonnes per year in
2000–2010 compared with 135 tonnes per year in the
1990s. In the Russian Federation the carbon in forest
biomass was relatively stable with a minor decrease in
the 1990s and a slight increase over the last decade.
Biological diversity and protective functions About 26 percent of Europe’s forest area was classified as
primary forest, compared with 36 percent of the world as
a whole. The large majority of this area was located in the
Russian Federation. Excluding the Russian Federation,
less than 3 percent of Europe’s forests were classified as
primary forest. The data indicated a slightly increasing
trend in primary forests in Europe excluding the Russian
Federation (Figure 11). The Russian Federation reported
a decrease of 1.6 million hectares per year in the 1990s,
which reversed to show a gain of 164 000 ha per year
in the period from 2000 to 2010. This change was
mainly the result of a modification in the classification
system introduced in 1995 rather than actual changes in
primary forest area. A number of countries reported an
increase in the area of primary forest, which can occur
when countries set aside natural forest areas in which
no intervention should take place. With time, these
areas evolve into forests in which there are no clearly
visible indications of human activity and the ecological
processes are not significantly disturbed, thus meeting
the definition of primary forest as used in the FRA
process. It should be noted that information was missing
from some forest rich countries such as Finland.
Throughout the 1990s and 2000s there was a positive
global trend in the extent to which forest ecosystems
were designated for the conservation of biological
diversity, with the total increase over 20 years approaching
100 million hectares, equivalent to a 35 percent rise in
conservation area. In Europe, the forest area designated
primarily for conservation of biological diversity doubled
over the same period (Table 15). Most of this increase
occurred in the 1990s, but the area continued to grow
5.2
5.3
5.4
5.5
Mill
ion
ha
1990 2000 20105.1
Figure 11: Area of primary forest in Europe excluding the Russian Federation, 1990–2010 (million ha)
Table 14: Area of planted forests in Europe, 1990–2010
Region Area (1 000 ha) Annual change (1 000 ha) Annual change rate (%)
1990 2000 2010 1990–2000 2000–2010 1990–2000 2000–2010
Russian Federation
12 651 15 360 16 991 271 163 1.96 1.01
Europe excluding Russian Federation
46 395 49 951 52 327 356 238 0.74 0.47
Total Europe 59 046 65 312 69 318 627 401 1.01 0.60
World 178 307 214 839 264 084 3 653 4 925 1.88 2.09
10
20
30
40
50
Gt
Russian Federation
1990 2000 2010
Europe excluding Russian Federation
Europe0
Figure 10: Carbon stock in forest biomass in Europe, 1990–2010 (Gt)

The state of forest resources – a regional analysis | 15
between 2000 and 2010 at just over 2 percent per year.
Some 10 percent of the forest area in Europe (excluding
the Russian Federation) was designated for biodiversity
conservation, compared with a global average of
12 percent. In the Russian Federation, the forest area
designated for conservation increased from 1.5 percent
in 1990 to 2.2 percent of total forest area in 2010,
largely due to national policies that strengthened nature
conservation.
In Europe, 4 percent of the total forest area was located
within formally established protected areas. Excluding the
Russian Federation, this figure rose to 12 percent. Over
the last decade, the annual increase in the area of forest
within a protected area system was almost 560 000 ha
per year, compared with about 910 000 ha per year in the
previous decade (1990–2000).
The forest area primarily designated for protection of soil
and water accounted for 9 percent of the total forest area
in the region. A large increase in this area was recorded
in the decade from 1990 to 2000 (Table 16). The Russian
Federation was mainly responsible for this significant
increase and, although a similar trend was observed in
Europe excluding the Russian Federation, it was less
pronounced.
The positive trends in forest area designated primarily
for protection of soil and water indicate that countries
in Europe have recognized the importance of protective
forest functions. Concern about maintaining the
protective functions of forests were the driving force
behind the forest laws in many countries, notably in
mountainous regions. Although considerable research
has been carried out on the benefits of forest protection,
they are difficult to quantify because they are rarely
valued in markets and tend to be highly site-specific.
Productive and socio-economic functions In Europe, 52 percent of the total forest area was
designated primarily for production (57 percent
excluding the Russian Federation), compared with a
global average of 30 percent. The area of Europe’s
forests designated primarily for production declined
significantly in the 1990s, but increased slightly over
the last decade (Table 17). Country data suggested an
Table 15: Area of forest designated primarily for conservation of biological diversity in Europe, 1990–2010
Region Area (1 000 ha) Annual change (1 000 ha) Annual change rate (%)
1990 2000 2010 1990–2000 2000–2010 1990–2000 2000–2010
Russian Federation
11 815 16 190 17 572 438 138 3.20 0.82
Europe excluding Russian Federation
6 840 13 203 19 407 636 620 6.80 3.93
Total Europe 18 655 29 393 36 979 1 074 759 4.65 2.32
World 270 413 302 916 366 255 3 250 6 334 1.14 1.92
Table 16: Area of forest designated primarily for protection of soil and water in Europe, 1990–2010
Region Area (1 000 ha) Annual change (1 000 ha) Annual change rate (%)
1990 2000 2010 1990–2000 2000–2010 1990–2000 2000–2010
Russian Federation
58 695 70 386 71 436 1 169 105 1.83 0.15
Europe excluding Russian Federation
18 237 20 403 21 559 217 116 1.13 0.55
Total Europe 76 932 90 788 92 995 1 386 221 1.67 0.24
World 240 433 271 699 299 378 3 127 2 768 1.23 0.97

16 | Chapter 1
increase in the total growing stock in many countries,
especially in areas of central Europe. The net result at
the regional level has been an increase in total growing
stock in cubic metres and in cubic metres per hectare
over the last 20 years.
Wood removals provide another indicator of the productive
functions of forest. During the early 1990s, total wood
removals in Europe declined because of the collapse of
the eastern European economies (Figure 12). Although
removals rebounded slightly in later years, they once
again dropped sharply in conjunction with the 2008–2009
recession in Europe as a result of declining demand for
wood. The value of wood removals in Europe excluding
the Russian Federation also dipped at the end of the
1990s, and rose again between 2000 and 2005 (Figure 13).
Excluding the Russian Federation, Europe accounted for
24 percent of the world’s industrial roundwood removals,
but only 5 percent of the world’s forest area. Including
the Russian Federation, Europe accounted for 32 percent
of global industrial roundwood removals. With Europe’s
forest area and growing stock expanding, it would seem
that a high level of wood removal for production is not
incompatible with sustainable forest management in
countries with relatively developed economies and stable
institutions. The volume of wood harvested in Europe’s
forests was increasing, yet remained considerably below
increment (UNECE/FAO, 2007).
A substantial quantity of NWFPs were harvested
for self-consumption in Europe, although they
rarely entered markets or were recorded in national
statistics. NWFPs have an important economic value.
Data on the quantity and value of NWFP removals
were reported by 29 countries despite the fact that
comprehensive data were limited in most countries.
Some countries submitted data on a limited number
of products. The reported total value of NWFP
removals reached US$8.4 billion in Europe, which is
still considered to be an incomplete estimate. Globally,
the reported value of NWFP removals amounted to
US$18.5 billion in 2005.
5
10
20
15
25
Bill
ion
US
$
1990 2000 20050
Figure 13: Value of wood removals in Europe excluding the Russian Federation (billion US$)
Figure 12: Wood removals in Europe, 1970–2009 (million m³)
100
200
300
400
500
600
700
800
Mill
ion
m3
0
Source:FAOSTAT
1970
1975
1980
1985
1990
1995
2000
2005
Fuelwood Industrial roundwood
Table 17: Area of forest designated primarily for production in Europe, 1990–2010
Region Area (1 000 ha) Annual change (1 000 ha) Annual change rate (%)
1990 2000 2010 1990–2000 2000–2010 1990–2000 2000–2010
Russian Federation
446 679 411 437 415 791 -3 524 435 -0.82 0.11
Europe excluding Russian Federation
111 363 111 229 108 829 -13 -240 -0.01 -0.22
Total Europe 558 042 522 666 524 620 -3 538 195 -0.65 0.04
World 1 181 576 1 160 325 1 131 210 -2 125 -2 911 -0.18 -0.25
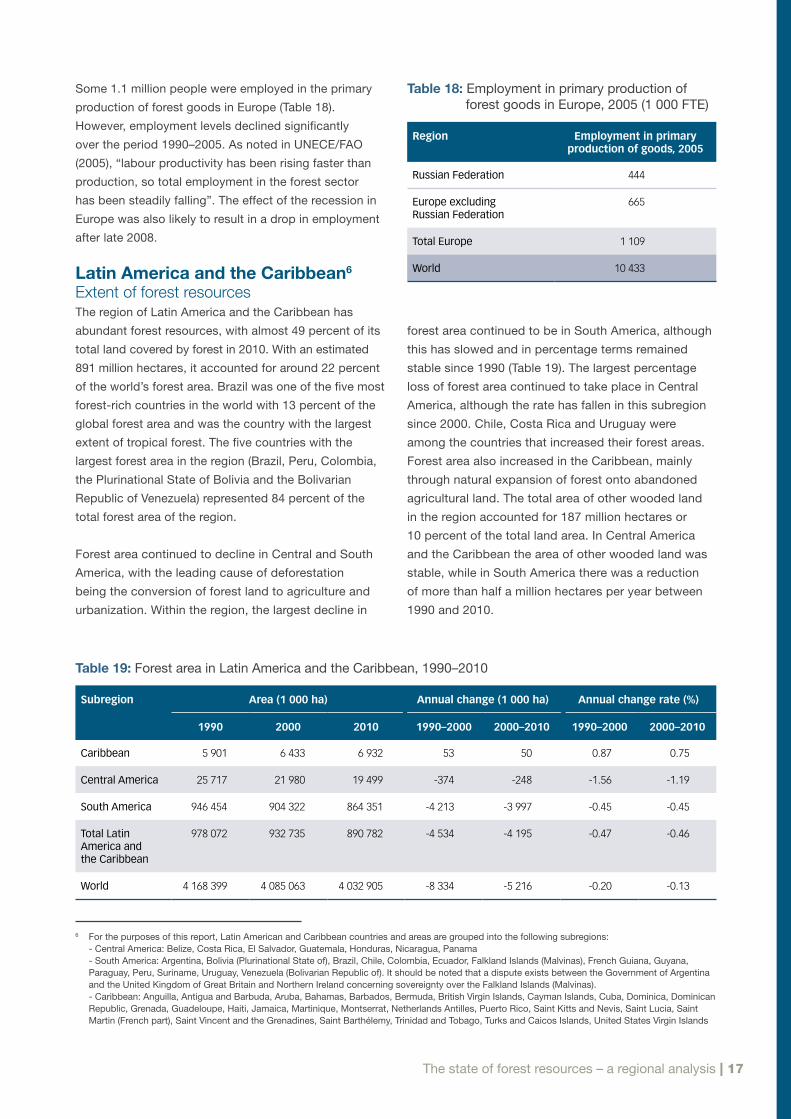
The state of forest resources – a regional analysis | 17
Some 1.1 million people were employed in the primary
production of forest goods in Europe (Table 18).
However, employment levels declined significantly
over the period 1990–2005. As noted in UNECE/FAO
(2005), “labour productivity has been rising faster than
production, so total employment in the forest sector
has been steadily falling”. The effect of the recession in
Europe was also likely to result in a drop in employment
after late 2008.
Latin America and the Caribbean6
Extent of forest resourcesThe region of Latin America and the Caribbean has
abundant forest resources, with almost 49 percent of its
total land covered by forest in 2010. With an estimated
891 million hectares, it accounted for around 22 percent
of the world’s forest area. Brazil was one of the five most
forest-rich countries in the world with 13 percent of the
global forest area and was the country with the largest
extent of tropical forest. The five countries with the
largest forest area in the region (Brazil, Peru, Colombia,
the Plurinational State of Bolivia and the Bolivarian
Republic of Venezuela) represented 84 percent of the
total forest area of the region.
Forest area continued to decline in Central and South
America, with the leading cause of deforestation
being the conversion of forest land to agriculture and
urbanization. Within the region, the largest decline in
forest area continued to be in South America, although
this has slowed and in percentage terms remained
stable since 1990 (Table 19). The largest percentage
loss of forest area continued to take place in Central
America, although the rate has fallen in this subregion
since 2000. Chile, Costa Rica and Uruguay were
among the countries that increased their forest areas.
Forest area also increased in the Caribbean, mainly
through natural expansion of forest onto abandoned
agricultural land. The total area of other wooded land
in the region accounted for 187 million hectares or
10 percent of the total land area. In Central America
and the Caribbean the area of other wooded land was
stable, while in South America there was a reduction
of more than half a million hectares per year between
1990 and 2010.
6 For the purposes of this report, Latin American and Caribbean countries and areas are grouped into the following subregions:- Central America: Belize, Costa Rica, El Salvador, Guatemala, Honduras, Nicaragua, Panama - South America: Argentina, Bolivia (Plurinational State of), Brazil, Chile, Colombia, Ecuador, Falkland Islands (Malvinas), French Guiana, Guyana, Paraguay, Peru, Suriname, Uruguay, Venezuela (Bolivarian Republic of). It should be noted that a dispute exists between the Government of Argentina and the United Kingdom of Great Britain and Northern Ireland concerning sovereignty over the Falkland Islands (Malvinas). - Caribbean: Anguilla, Antigua and Barbuda, Aruba, Bahamas, Barbados, Bermuda, British Virgin Islands, Cayman Islands, Cuba, Dominica, Dominican Republic, Grenada, Guadeloupe, Haiti, Jamaica, Martinique, Montserrat, Netherlands Antilles, Puerto Rico, Saint Kitts and Nevis, Saint Lucia, Saint Martin (French part), Saint Vincent and the Grenadines, Saint Barthélemy, Trinidad and Tobago, Turks and Caicos Islands, United States Virgin Islands
Table 18: Employment in primary production of forest goods in Europe, 2005 (1 000 FTE)
Region Employment in primary production of goods, 2005
Russian Federation 444
Europe excluding Russian Federation
665
Total Europe 1 109
World 10 433
Table 19: Forest area in Latin America and the Caribbean, 1990–2010
Subregion Area (1 000 ha) Annual change (1 000 ha) Annual change rate (%)
1990 2000 2010 1990–2000 2000–2010 1990–2000 2000–2010
Caribbean 5 901 6 433 6 932 53 50 0.87 0.75
Central America 25 717 21 980 19 499 -374 -248 -1.56 -1.19
South America 946 454 904 322 864 351 -4 213 -3 997 -0.45 -0.45
Total Latin America and the Caribbean
978 072 932 735 890 782 -4 534 -4 195 -0.47 -0.46
World 4 168 399 4 085 063 4 032 905 -8 334 -5 216 -0.20 -0.13

18 | Chapter 1
Globally, planted forests comprised about 7 percent of
total forest area. In Latin America and the Caribbean
they made up less than 2 percent of total forest area
and the region accounted for less than 6 percent of the
global area of planted forests. However, planted forests
have expanded at a rate of about 3.2 percent per year
in the region over the last decade (Table 20). Brazil,
Chile, Argentina, Uruguay and Peru showed the largest
increase in the area of planted forest between 2000 and
2010.
It was estimated that in Latin America and the Caribbean
the total carbon stored in forest biomass was 104 Gt
and it decreased by an estimated 424 million tonnes
annually during the period 1990–2010 (Figure 14). Central
and South America registered a net loss over the period
1990–2010, while the Caribbean showed an overall gain
in carbon in forest biomass.
Biological diversity and protective functions Primary forests in Latin America and the Caribbean
accounted for 75 percent of the total forest area and the
region held 57 percent of the world’s primary forests.
Most of the primary forest was located in inaccessible
or protected areas. Despite this, there was a significant
loss of primary forest outside protected areas,
particularly in South America. Caribbean countries
reported that the area of primary forest had been
stable since 1990. Central America increased its net
loss from 54 000 ha per year in the decade 1990–2000
to 74 000 ha annually from 2000 to 2010 (Figure 15).
The data collected did not allow for an analysis of
the proportion of this net loss that was caused by
deforestation and conversion to other uses, compared
with that resulting from the opening up of primary
forests to selective logging or other human activities,
which would mean that the forest was reclassified as
‘other naturally regenerated forest’ in the FRA 2010
classification system.
100
200
600
700
500
400
300
Mill
ion
ha
Caribbean Central America South America0
Figure 15: Area of primary forest in Latin America and the Caribbean, 1990–2010 (million ha)
1990 2000 2010
20
40
100
80
60
120
Gt
Caribbean Central America South America0
Figure 14: Carbon stock in forest biomass in Latin America and the Caribbean, 1990–2010 (Gt)
1990 2000 2010
Table 20: Area of planted forest in Latin America and the Caribbean, 1990–2010
Subregion Area (1 000 ha) Annual change (1 000 ha) Annual change rate (%)
1990 2000 2010 1990–2000 2000–2010 1990–2000 2000–2010
Caribbean 391 394 547 n.s. 15 0.09 3.34
Central America 445 428 584 -2 16 -0.37 3.14
South America 8 276 10 058 13 821 178 376 1.97 3.23
Total Latin America and the Caribbean
9 111 10 880 14 952 177 407 1.79 3.23
World 178 307 214 839 264 084 3 653 4 925 1.88 2.09

The state of forest resources – a regional analysis | 19
In Latin America and the Caribbean, 14 percent of the
forest area was designated primarily for the conservation
of biological diversity. This area has increased by more
than 3 million hectares annually (or 4.5 percent per
year) since 2000 (Table 21) with the vast majority of this
increase in South America. A total of 18 percent of the
total forest area in the region was located in formally
designated protected areas.
The forest area designated for protection of soil and
water resources represented 7 percent of the total forest
area in the region, compared with 8 percent globally.
This area increased slightly between 1990 and 2010
(Table 22), with virtually all of the increase being in the
Caribbean. The countries with the highest proportion of
their forest area designated for protective functions were
(in descending order): Cuba, Chile, Ecuador, Trinidad
and Tobago, and Honduras.
Productive and socio-economic functionsIn 2010, about 14 percent of all forest area in the region
was designated primarily for production, compared with
a global average of 30 percent. Latin America and the
Caribbean contained 10 percent of the total worldwide
forest area designated for productive purposes.
Guyana reported the largest proportion of forest area
designated primarily for production (97 percent),
followed by Uruguay (64 percent), Haiti (54 percent),
the Bolivarian Republic of Venezuela (49 percent) and
Chile (46 percent). While the forest area designated for
productive functions fell at the global level, it grew in
Latin America and the Caribbean, primarily in South
America (Table 23).
Wood removals in the region showed continued growth
over the past two decades. Fuelwood accounted for
slightly more than half (57 percent) of total wood removals
Table 21: Area of forest designated primarily for conservation of biodiversity in Latin America and the Caribbean, 1990–2010
Subregion Area (1 000 ha) Annual change (1 000 ha) Annual change rate (%)
1990 2000 2010 1990–2000 2000–2010 1990–2000 2000–2010
Caribbean 617 671 711 5 4 0.85 0.58
Central America 4 337 4 023 3 677 -31 -35 -0.75 -0.90
South America 40 683 52 548 84 222 1 187 3 167 2.59 4.83
Total Latin America and the Caribbean
45 637 57 243 88 610 1 161 3 137 2.29 4.47
World 270 413 302 916 366 255 3 250 6 334 1.14 1.92
Table 22: Area of forest designated primarily for protection of soil and water in Latin America and the Caribbean, 1990–2010
Subregion Area (1 000 ha) Annual change (1 000 ha) Annual change rate (%)
1990 2000 2010 1990–2000 2000–2010 1990–2000 2000–2010
Caribbean 869 1 106 1 428 24 32 2.44 2.58
Central America 124 114 90 -1 -2 -0.90 -2.33
South America 48 656 48 661 48 549 1 -11 n.s. -0.02
Total Latin America and the Caribbean
49 650 49 881 50 066 23 19 0.05 0.04
World 240 433 271 699 299 378 3 127 2 768 1.23 0.97

20 | Chapter 1
in the region. In Central America and the Caribbean, by
far the majority of wood removed from forest was for
fuelwood (90 percent), while in South America removals
were equally distributed between industrial roundwood
and fuelwood (Figure 16).
Very limited information was reported on NWFPs so
it was difficult to draw any conclusions about these
removals. The reports indicated that food products,
live animals and exudates were the principal NWFPs
extracted from the forests in Latin America and the
Caribbean. NWFP collection was mainly practised by
forest-dependent people and was generally not registered
in official trade statistics.
Wood removals in the region were estimated to be
worth about US$6.8 billion or 7 percent of the world
total in 2005. Regional trend analysis (based on
those countries that provided information for all the
reporting years) showed a drop in the value from
1990 to 2000, which rebounded between 2000 and
2005 (Figure 17). Information on the value of fuelwood
continued to be scarce. Most of the countries in Latin
America and the Caribbean noted that quantitative
data related to the extraction of fuelwood both for
domestic and industrial purposes was very limited or
non-existent.
More than 350 000 full-time jobs were reported in the
primary production of goods from forests (the figures
exclude employment in wood processing industries)
(Table 24). Global employment in forestry declined
over the period 1990–2005, but in Latin America
and the Caribbean there was an upward swing of
3.4 percent from 2000 to 2005. Suriname and Brazil
nearly doubled the number of full-time jobs related to
forestry over the last five years. Honduras, Nicaragua
and El Salvador also showed a rising trend. Most other
countries in the region did not present sufficient data
to report a trend.
South America Central America Caribbean
Figure 16: Volume of wood removals in Latin America and the Caribbean, 1970–2008 (million m³)
Source:FAOSTAT
100
200
300
400
500
Mill
ion
m3
0
100
200
300
400
500
0
100
200
300
400
500
0
1970
1970
1975
1975
1980
1980
1985
1985
1990
1990
1995
1995
2000
2000
2005
2005
1970
1975
1980
1985
1990
1995
2000
2005
Industrial roundwood Fuelwood Total roundwood
Table 23: Area of forest designated primarily for production in Latin America and the Caribbean, 1990–2010
Subregion Area (1 000 ha) Annual change (1 000 ha) Annual change rate (%)
1990 2000 2010 1990–2000 2000–2010 1990–2000 2000–2010
Caribbean 879 860 1 028 -2 17 -0.21 1.80
Central America 1 743 1 620 1 522 -12 -10 -0.73 -0.62
South America 70 857 75 866 80 827 501 496 0.69 0.64
Total Latin America and the Caribbean
73 478 78 346 83 378 487 503 0.64 0.62
World 1 181 576 1 160 325 1 131 210 -2 125 -2 911 -0.18 -0.25
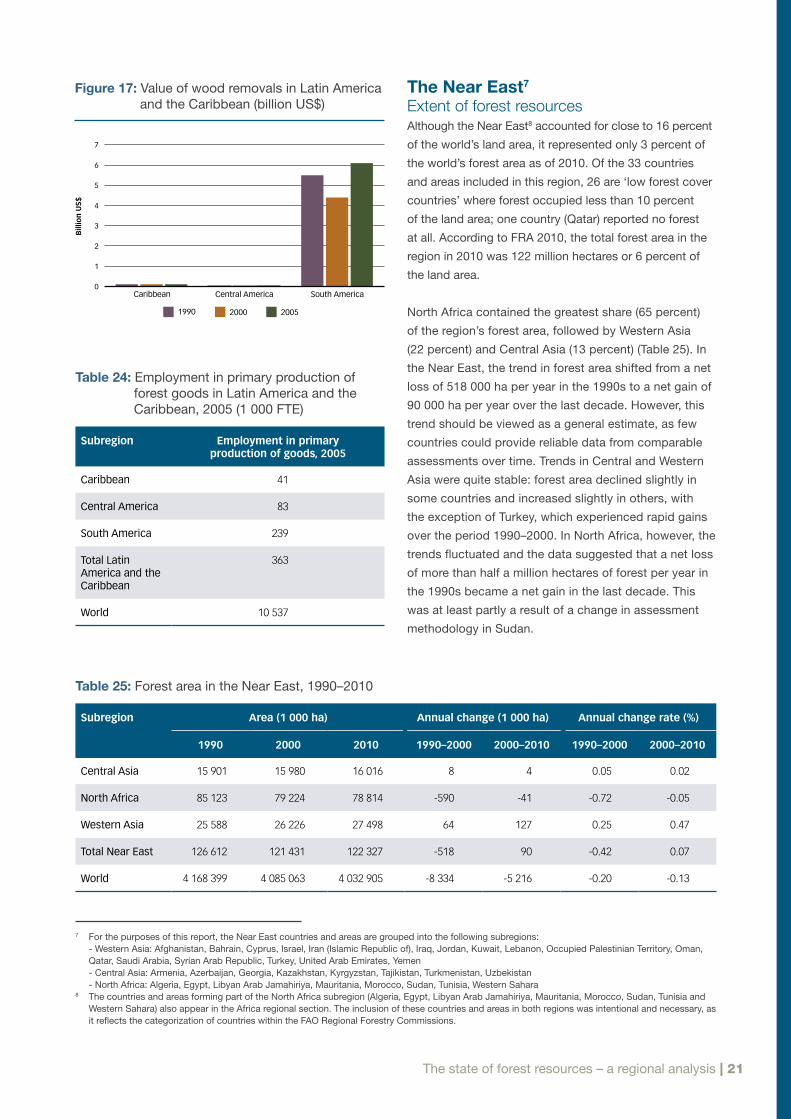
The state of forest resources – a regional analysis | 21
The Near East7
Extent of forest resourcesAlthough the Near East8 accounted for close to 16 percent
of the world’s land area, it represented only 3 percent of
the world’s forest area as of 2010. Of the 33 countries
and areas included in this region, 26 are ‘low forest cover
countries’ where forest occupied less than 10 percent
of the land area; one country (Qatar) reported no forest
at all. According to FRA 2010, the total forest area in the
region in 2010 was 122 million hectares or 6 percent of
the land area.
North Africa contained the greatest share (65 percent)
of the region’s forest area, followed by Western Asia
(22 percent) and Central Asia (13 percent) (Table 25). In
the Near East, the trend in forest area shifted from a net
loss of 518 000 ha per year in the 1990s to a net gain of
90 000 ha per year over the last decade. However, this
trend should be viewed as a general estimate, as few
countries could provide reliable data from comparable
assessments over time. Trends in Central and Western
Asia were quite stable: forest area declined slightly in
some countries and increased slightly in others, with
the exception of Turkey, which experienced rapid gains
over the period 1990–2000. In North Africa, however, the
trends fluctuated and the data suggested that a net loss
of more than half a million hectares of forest per year in
the 1990s became a net gain in the last decade. This
was at least partly a result of a change in assessment
methodology in Sudan.
Table 24: Employment in primary production of forest goods in Latin America and the Caribbean, 2005 (1 000 FTE)
Subregion Employment in primary production of goods, 2005
Caribbean 41
Central America 83
South America 239
Total Latin America and the Caribbean
363
World 10 537
1
2
6
5
7
4
3
Bill
ion
US
$
Caribbean Central America South America0
Figure 17: Value of wood removals in Latin America and the Caribbean (billion US$)
1990 2000 2005
7 For the purposes of this report, the Near East countries and areas are grouped into the following subregions: - Western Asia: Afghanistan, Bahrain, Cyprus, Israel, Iran (Islamic Republic of), Iraq, Jordan, Kuwait, Lebanon, Occupied Palestinian Territory, Oman, Qatar, Saudi Arabia, Syrian Arab Republic, Turkey, United Arab Emirates, Yemen - Central Asia: Armenia, Azerbaijan, Georgia, Kazakhstan, Kyrgyzstan, Tajikistan, Turkmenistan, Uzbekistan - North Africa: Algeria, Egypt, Libyan Arab Jamahiriya, Mauritania, Morocco, Sudan, Tunisia, Western Sahara
8 The countries and areas forming part of the North Africa subregion (Algeria, Egypt, Libyan Arab Jamahiriya, Mauritania, Morocco, Sudan, Tunisia and Western Sahara) also appear in the Africa regional section. The inclusion of these countries and areas in both regions was intentional and necessary, as it reflects the categorization of countries within the FAO Regional Forestry Commissions.
Table 25: Forest area in the Near East, 1990–2010
Subregion Area (1 000 ha) Annual change (1 000 ha) Annual change rate (%)
1990 2000 2010 1990–2000 2000–2010 1990–2000 2000–2010
Central Asia 15 901 15 980 16 016 8 4 0.05 0.02
North Africa 85 123 79 224 78 814 -590 -41 -0.72 -0.05
Western Asia 25 588 26 226 27 498 64 127 0.25 0.47
Total Near East 126 612 121 431 122 327 -518 90 -0.42 0.07
World 4 168 399 4 085 063 4 032 905 -8 334 -5 216 -0.20 -0.13
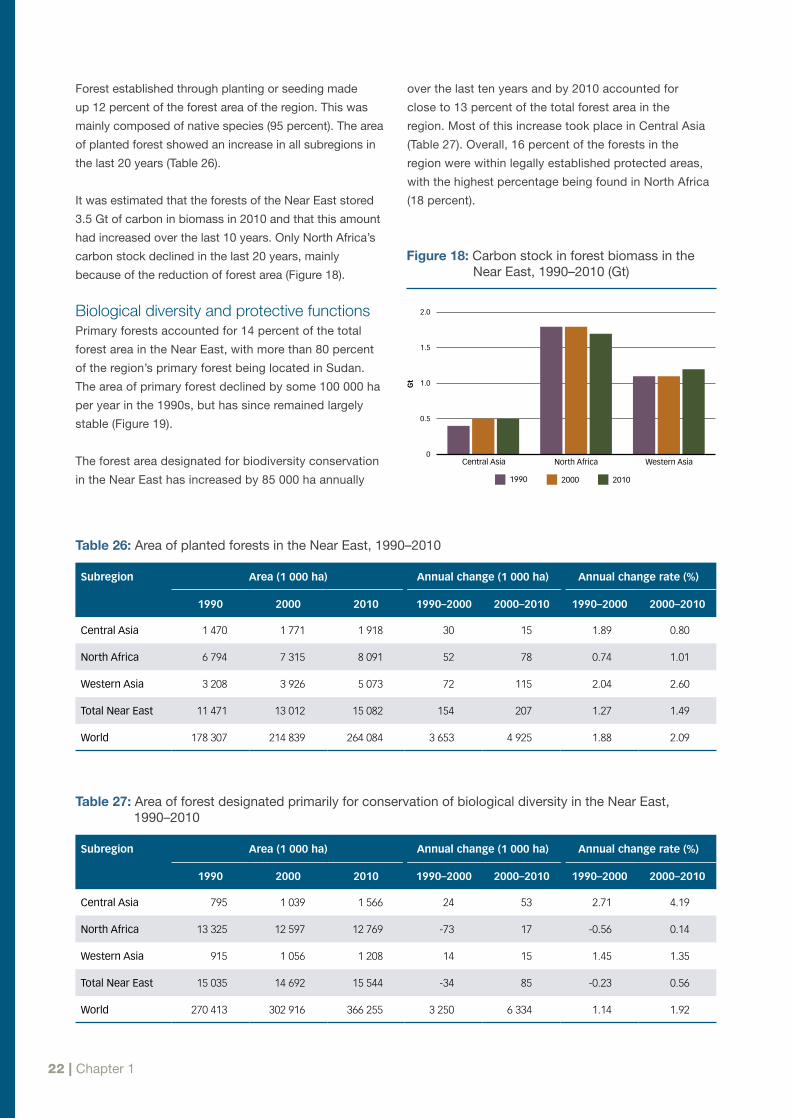
22 | Chapter 1
Forest established through planting or seeding made
up 12 percent of the forest area of the region. This was
mainly composed of native species (95 percent). The area
of planted forest showed an increase in all subregions in
the last 20 years (Table 26).
It was estimated that the forests of the Near East stored
3.5 Gt of carbon in biomass in 2010 and that this amount
had increased over the last 10 years. Only North Africa’s
carbon stock declined in the last 20 years, mainly
because of the reduction of forest area (Figure 18).
Biological diversity and protective functionsPrimary forests accounted for 14 percent of the total
forest area in the Near East, with more than 80 percent
of the region’s primary forest being located in Sudan.
The area of primary forest declined by some 100 000 ha
per year in the 1990s, but has since remained largely
stable (Figure 19).
The forest area designated for biodiversity conservation
in the Near East has increased by 85 000 ha annually
over the last ten years and by 2010 accounted for
close to 13 percent of the total forest area in the
region. Most of this increase took place in Central Asia
(Table 27). Overall, 16 percent of the forests in the
region were within legally established protected areas,
with the highest percentage being found in North Africa
(18 percent).
Table 27: Area of forest designated primarily for conservation of biological diversity in the Near East, 1990–2010
Subregion Area (1 000 ha) Annual change (1 000 ha) Annual change rate (%)
1990 2000 2010 1990–2000 2000–2010 1990–2000 2000–2010
Central Asia 795 1 039 1 566 24 53 2.71 4.19
North Africa 13 325 12 597 12 769 -73 17 -0.56 0.14
Western Asia 915 1 056 1 208 14 15 1.45 1.35
Total Near East 15 035 14 692 15 544 -34 85 -0.23 0.56
World 270 413 302 916 366 255 3 250 6 334 1.14 1.92
0.5
1.0
1.5
2.0
Gt
Central Asia North Africa Western Asia0
Figure 18: Carbon stock in forest biomass in the Near East, 1990–2010 (Gt)
1990 2000 2010
Table 26: Area of planted forests in the Near East, 1990–2010
Subregion Area (1 000 ha) Annual change (1 000 ha) Annual change rate (%)
1990 2000 2010 1990–2000 2000–2010 1990–2000 2000–2010
Central Asia 1 470 1 771 1 918 30 15 1.89 0.80
North Africa 6 794 7 315 8 091 52 78 0.74 1.01
Western Asia 3 208 3 926 5 073 72 115 2.04 2.60
Total Near East 11 471 13 012 15 082 154 207 1.27 1.49
World 178 307 214 839 264 084 3 653 4 925 1.88 2.09

The state of forest resources – a regional analysis | 23
Fourteen percent of the forest area in the region was
designated primarily for the protection of soil and water
resources. Collectively, the region increased these areas
by some 60 000 ha annually over the last 20 years
(Table 28). At the subregional level, the rate of increase
in forest area designated for protection in Central Asia
dropped over the last ten years in comparison with the
previous decade. Gains were made here in the second
half of the 1990s largely because Georgia changed the
designation of a part of its forest from social services
to soil protection and water regulation. Western Asia’s
area of protective forest by contrast expanded in the
last decade, mainly as a result of Turkey’s increasing
attention to soil erosion problems that caused the
country to dedicate a larger portion of its forests to the
conservation of soil and water.
Productive and socio-economic functions In the Near East region 38 percent of the forest area was
primarily designated for the production of wood and
NWFPs. After the overall area of productive forest dropped
in the 1990s, it remained stable from 2000 onwards. At the
subregional level, the trend in area designated primarily
for production was quite heterogeneous: Central Asia
registered a positive trend, which accelerated in the last
ten years; North Africa’s productive forest area fell over
the period 1990–2000 and rose slightly between 2000 and
2010; and in Western Asia, the area increased in the 1990s
and then decreased again in the last ten years (Table 29).
Table 28: Area of forest designated primarily for protection of soil and water in the Near East, 1990–2010
Subregion Area (1 000 ha) Annual change (1 000 ha) Annual change rate (%)
1990 2000 2010 1990–2000 2000–2010 1990–2000 2000–2010
Central Asia 10 361 10 974 10 983 61 1 0.58 0.01
North Africa 4 068 3 855 3 851 -21 n.s. -0.54 -0.01
Western Asia 1 861 2 086 2 685 22 60 1.15 2.56
Total Near East 16 290 16 914 17 520 62 61 0.38 0.35
World 240 433 271 699 299 378 3 127 2 768 1.23 0.97
2
4
6
8
10
12
14
16
Mill
ion
ha
Central Asia North Africa Western Asia0
Figure 19: Area of primary forest in the Near East, 1990–2010 (million ha)
1990 2000 2010
Table 29: Area of forest designated primarily for production in the Near East, 1990–2010
Subregion Area (1 000 ha) Annual change (1 000 ha) Annual change rate (%)
1990 2000 2010 1990–2000 2000–2010 1990–2000 2000–2010
Central Asia 27 28 90 n.s. 6 0.36 12.37
North Africa 39 557 36 637 36 819 -292 18 -0.76 0.05
Western Asia 9 539 9 657 9 439 12 -22 0.12 -0.23
Total Near East 49 123 46 323 46 348 -280 3 -0.59 0.01
World 1 181 576 1 160 325 1 131 210 -2 125 -2 911 -0.18 -0.25

24 | Chapter 1
9 For the purposes of this report, North America includes Canada, Mexico and the United States of America (excluding US territories in the Caribbean).
0.5
1.0
2.5
3.0
2.0
1.5
Bill
ion
US
$
Central Asia North Africa Western Asia0
Figure 21: Value of wood removals in the Near East, 1990–2005 (billion US$)
1990 2000 2005
Table 30: Employment in primary production of forest goods in the Near East, 2005 (1 000 FTE)
Subregion Employment in primary production of goods, 2005
Central Asia 38
North Africa 209
Western Asia 49
Total Near East 296
The region accounted for only 2 percent of global wood
removals, more than 70 percent of which was used
as fuelwood (Figure 20). Turkey was the only country
in the region where industrial roundwood removals
were significant (14 million cubic metres) and played
an important role as a source of raw material for wood
industries. Approximately 296 000 people were employed
in 2005 in the primary production of goods in the region
(Table 30). Of these, 209 000 were in North Africa.
Information on the value of NWFPs was provided by
only 13 countries in the region, with a total value of
US$126 million as of 2005. The reported annual value
of wood products in the Near East region was close to
US$2 billion in 2005. However, information was missing
from most of the countries in Central Asia, so the true
value is likely to be considerably higher. In Western Asia,
Jordan and Turkey recorded a sharp drop in the value of
wood products between 1990 and 2000, which was only
partly recovered during the period 2000–2005 (Figure 21).
North America9
Extent of forest resourcesIn 2010 forests covered 34 percent of North America’s
land area and accounted for 17 percent of the global
forest area. In the North American region, the forest area
in 2010 was estimated to be slightly larger than in 1990
(Table 31). While Canada reported no change in forest
area, Mexico registered a decreasing rate of loss over
the last 20 years, which was outweighed by a net gain in
forest area in the United States of America.
Globally, planted forest made up about 7 percent of
the world’s total forest area. In North America, a total
of 6 percent of the forest area (more than 37 million
hectares) was planted forest, accounting for 14 percent
of the world total (Table 32). In Canada, planted forests
represented 3 percent of the total forest area, in Mexico,
5 percent and in the United States of America, 8 percent.
The area of planted forest in the three countries
continued to increase.
Western Asia North Africa Central Asia
Figure 20: Volume of wood removals in the Near East, 1970–2008 (million m³)
Source:FAOSTAT
30
20
10
40
50
60
70
80
Mill
ion
m3
0
30
20
10
40
50
60
70
80
0
30
20
10
40
50
60
70
80
0
1970
1970
1975
1975
1980
1980
1985
1985
1990
1990
1995
1995
2000
2000
2005
2005
1970
1975
1980
1985
1990
1995
2000
2005
Industrial roundwood Fuelwood Total roundwood
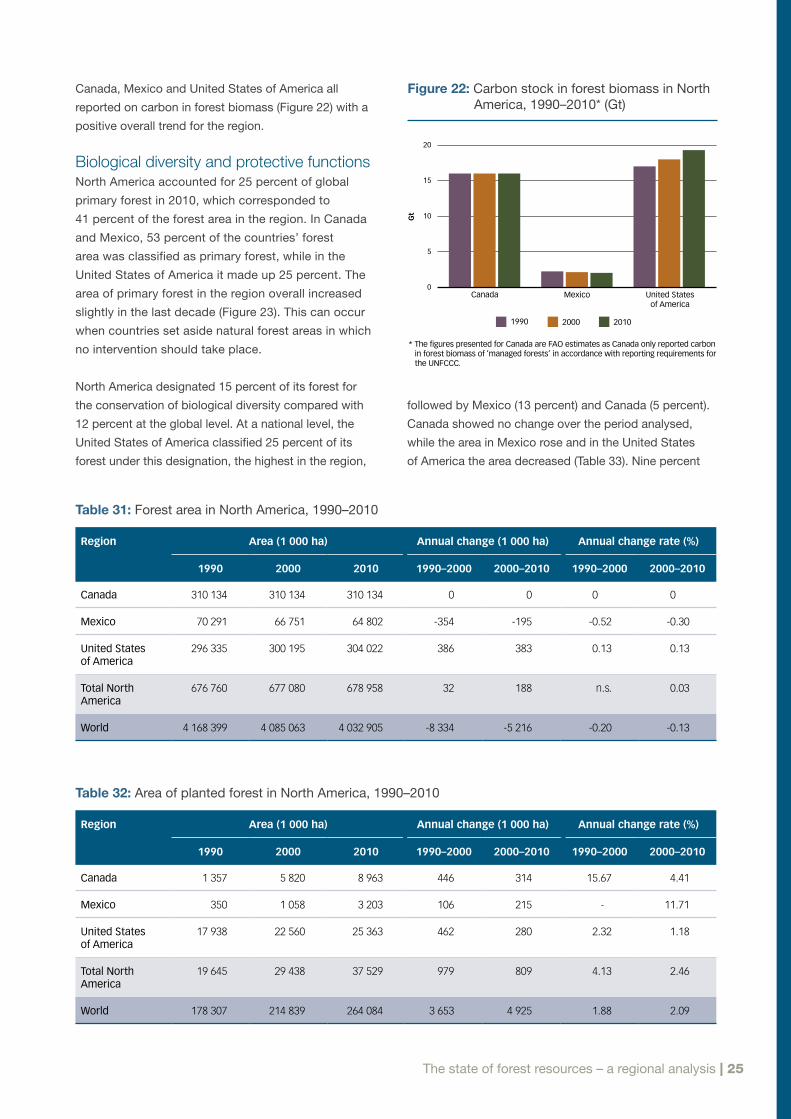
The state of forest resources – a regional analysis | 25
Canada, Mexico and United States of America all
reported on carbon in forest biomass (Figure 22) with a
positive overall trend for the region.
Biological diversity and protective functions North America accounted for 25 percent of global
primary forest in 2010, which corresponded to
41 percent of the forest area in the region. In Canada
and Mexico, 53 percent of the countries’ forest
area was classified as primary forest, while in the
United States of America it made up 25 percent. The
area of primary forest in the region overall increased
slightly in the last decade (Figure 23). This can occur
when countries set aside natural forest areas in which
no intervention should take place.
North America designated 15 percent of its forest for
the conservation of biological diversity compared with
12 percent at the global level. At a national level, the
United States of America classified 25 percent of its
forest under this designation, the highest in the region,
Table 31: Forest area in North America, 1990–2010
Region Area (1 000 ha) Annual change (1 000 ha) Annual change rate (%)
1990 2000 2010 1990–2000 2000–2010 1990–2000 2000–2010
Canada 310 134 310 134 310 134 0 0 0 0
Mexico 70 291 66 751 64 802 -354 -195 -0.52 -0.30
United States of America
296 335 300 195 304 022 386 383 0.13 0.13
Total North America
676 760 677 080 678 958 32 188 n.s. 0.03
World 4 168 399 4 085 063 4 032 905 -8 334 -5 216 -0.20 -0.13
Table 32: Area of planted forest in North America, 1990–2010
Region Area (1 000 ha) Annual change (1 000 ha) Annual change rate (%)
1990 2000 2010 1990–2000 2000–2010 1990–2000 2000–2010
Canada 1 357 5 820 8 963 446 314 15.67 4.41
Mexico 350 1 058 3 203 106 215 - 11.71
United States of America
17 938 22 560 25 363 462 280 2.32 1.18
Total North America
19 645 29 438 37 529 979 809 4.13 2.46
World 178 307 214 839 264 084 3 653 4 925 1.88 2.09
5
10
15
20
Gt
Canada Mexico United States of America
0
Figure 22: Carbon stock in forest biomass in North America, 1990–2010* (Gt)
1990 2000 2010
*The figures presented for Canada are FAO estimates as Canada only reported carbon in forest biomass of ‘managed forests’ in accordance with reporting requirements for the UNFCCC.
followed by Mexico (13 percent) and Canada (5 percent).
Canada showed no change over the period analysed,
while the area in Mexico rose and in the United States
of America the area decreased (Table 33). Nine percent

26 | Chapter 1
of the forest area in the region falls within a protected
area system, ranging from 8 percent of the forest area in
Canada to 13 percent of the forest area in Mexico.
In North America, the protection of soil and water are
embedded in forest legislation, policy and guidance on
sound forest management practices. The protection
of soil and water are primary considerations in the
development of forest plans and practices. While
legislation, regulations and policy exists to guide where
forest areas must be set aside, these areas are not legally
defined and captured on land use maps. As a result,
forest areas that are set aside for the purposes of soil
and water conservation are included in the multiple use
primary designated function.
Productive and socio-economic functions About 14 percent of the forest area in North America was
designated primarily for production in 2010, compared
with 30 percent at the global level (Table 34). The vast
majority of this area (93 percent) was located in the United
States of America, where 30 percent of the forest area was
designated primarily for productive purposes, compared
with only 5 percent of Mexico’s forest area and 1 percent
of Canada’s. An additional 68 percent of the forest area in
the region was designated for multiple use – in most cases
including the production of wood and NWFPs. There was
Table 34: Area of forest designated primarily for production in North America, 1990–2010
Region Area (1 000 ha) Annual change (1 000 ha) Annual change rate (%)
1990 2000 2010 1990–2000 2000–2010 1990–2000 2000–2010
Canada 3 928 3 928 3 928 0 0 0 0
Mexico 0 1 058 3 203 106 215 - 11.71
United States of America
76 632 82 520 90 007 589 749 0.74 0.87
Total North America
80 560 87 506 97 138 695 963 0.83 1.05
World 1 181 576 1 160 325 1 131 210 -2 125 -2 911 -0.18 -0.25
50
100
150
200
Mill
ion
ha
Canada Mexico United States of America
0
Figure 23: Area of primary forest in North America, 1990–2010 (million ha)
1990 2000 2010
Table 33: Area of forest designated primarily for conservation of biological diversity in North America, 1990–2010
Region Area (1 000 ha) Annual change (1 000 ha) Annual change rate (%)
1990 2000 2010 1990–2000 2000–2010 1990–2000 2000–2010
Canada 15 284 15 284 15 284 0 0 0 0
Mexico 4 547 4 457 8 488 -9 403 -0.20 6.65
United States of America
69 980 72 878 75 277 290 240 0.41 0.32
Total North America
89 811 92 619 99 049 281 643 0.31 0.67
World 270 413 302 916 366 255 3 250 6 334 1.14 1.92

The state of forest resources – a regional analysis | 27
Bill
ion
US
$
5
10
15
20
25
Canada Mexico United States of America
0
Figure 25: Value of wood products in North America (billion US$)
1990 2000 2005
a large variation in the proportion of forest for multiple use
within the region with values ranging from 46 percent in
the United States of America to 87 percent in Canada. A
combination of the two areas (production plus multiple
use) may thus provide a better picture of the area available
for wood supply in this region.
Only 10–15 percent of the wood removed in North
America was used as fuelwood. The remainder was
industrial roundwood consumed by wood processing and
pulp industries. The long-term trends (Figure 24) show
that in North America (the United States of America and
Canada in particular), wood removals fluctuated widely
over the past four decades. This suggests that forest
owners and managers were quick to adjust wood supply
depending on the level of demand for forest products
and prices. The recent economic and housing crises in
United States of America Mexico Canada
Figure 24: Volume of wood removals in North America, 1970–2009 (million m³)
Source:FAOSTAT
Mill
ion
m3
1970
1975
1980
1985
1990
1995
2000
2005
1970
1975
1980
1985
1990
1995
2000
2005
100
200
300
400
500
600
700
800
0
100
200
300
400
500
600
700
800
0
Industrial roundwood Fuelwood Total roundwood
100
200
300
400
500
600
700
800
0
1970
1975
1980
1985
1990
1995
2000
2005
Table 35: Employment in primary production of forest goods in the United States of America and Canada, 1990–2005 (1 000 FTE)
Employment in primary production of goods
1990 2000 2005
Canada 73 87 70
United States of America (paid employment only)
103 98 84
the United States of America led to a sharp decline in
industrial roundwood removals (about 30 percent). The
information available on NWFPs at the regional level was
insufficient to draw conclusions or to identify trends. The
principal reported products were Christmas trees, maple
products, resins, hides and skins, and fruit. The value
of wood products increased steadily between 1990 and
2005 (Figure 25), but has since fallen sharply.
Countries were requested to report on paid employment
in terms of full-time equivalents involved in primary
production of forest goods (Table 35). Mexico did not
provide data for this variable. The United States of America
showed a continuous decrease in employment from 1990
to 2005. Canada’s figures indicated that the employment
level rose by 18 percent between 1990 and 2000 and then
declined by 20 percent between 2000 and 2005.


2
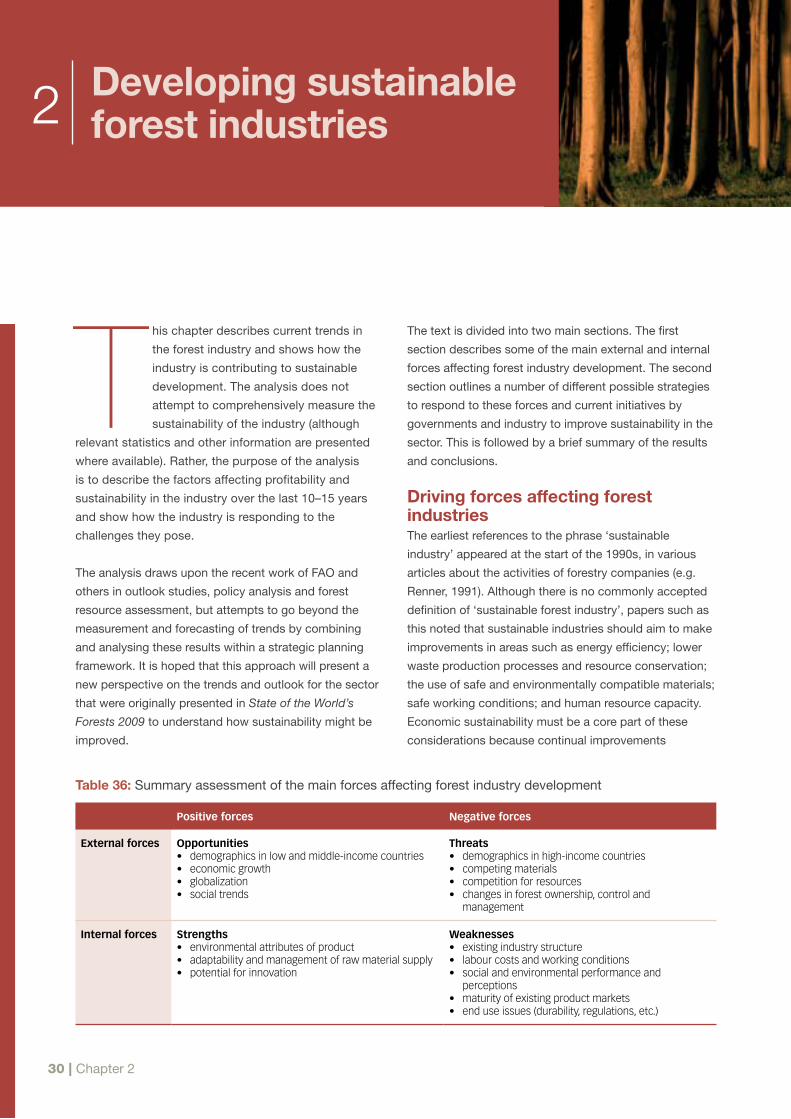
30 | Chapter 2
2 Developing sustainable forest industries
The text is divided into two main sections. The first
section describes some of the main external and internal
forces affecting forest industry development. The second
section outlines a number of different possible strategies
to respond to these forces and current initiatives by
governments and industry to improve sustainability in the
sector. This is followed by a brief summary of the results
and conclusions.
Driving forces affecting forest industriesThe earliest references to the phrase ‘sustainable
industry’ appeared at the start of the 1990s, in various
articles about the activities of forestry companies (e.g.
Renner, 1991). Although there is no commonly accepted
definition of ‘sustainable forest industry’, papers such as
this noted that sustainable industries should aim to make
improvements in areas such as energy efficiency; lower
waste production processes and resource conservation;
the use of safe and environmentally compatible materials;
safe working conditions; and human resource capacity.
Economic sustainability must be a core part of these
considerations because continual improvements
This chapter describes current trends in
the forest industry and shows how the
industry is contributing to sustainable
development. The analysis does not
attempt to comprehensively measure the
sustainability of the industry (although
relevant statistics and other information are presented
where available). Rather, the purpose of the analysis
is to describe the factors affecting profitability and
sustainability in the industry over the last 10–15 years
and show how the industry is responding to the
challenges they pose.
The analysis draws upon the recent work of FAO and
others in outlook studies, policy analysis and forest
resource assessment, but attempts to go beyond the
measurement and forecasting of trends by combining
and analysing these results within a strategic planning
framework. It is hoped that this approach will present a
new perspective on the trends and outlook for the sector
that were originally presented in State of the World’s
Forests 2009 to understand how sustainability might be
improved.
Table 36: Summary assessment of the main forces affecting forest industry development
Positive forces Negative forces
External forces Opportunities• demographics in low and middle-income countries• economic growth• globalization• social trends
Threats• demographics in high-income countries• competing materials• competition for resources• changes in forest ownership, control and
management
Internal forces Strengths• environmental attributes of product• adaptability and management of raw material supply• potential for innovation
Weaknesses• existing industry structure• labour costs and working conditions• social and environmental performance and
perceptions • maturity of existing product markets• end use issues (durability, regulations, etc.)

Developing sustainable forest industries | 31
in productivity and profitability are fundamental
requirements for the economic viability of the industry
in the long-run.
Table 36 outlines the external and internal forces affecting
the sector and categorizes them into potentially positive
and negative influences. This is a very generalized
assessment of the influences because they vary from
country to country and between sectors of the industry.
In addition, some forces (such as globalization) may
be viewed as a positive force in some places, but as
a threat in others. For the forest industry to continue
contributing to sustainable development, the industry will
need to consider the impact of the driving forces shown
in Table 36, develop appropriate responses to overcome
potentially negative impacts and take advantage of
positive driving forces.
External driving forcesThe main external forces affecting the forest industry
are trends in economies, society and the environment.
The two most fundamental forces are population
demographics and economic growth. These have a major
impact on forest product demand and may also influence
industry development on the supply side through related
changes such as increased globalization. Related to
this, social trends also change with rising incomes, as
people become less focused on meeting basic needs and
demand a broader range of goods and services.
The other major driving force is changes in competing
sectors as they also adapt and respond to the same
trends. The competitive environment for forest products
is constantly changing, often in unpredictable ways.
Furthermore, linkages between the forest industry and
the energy, chemicals and food sectors are becoming
more evident, while policies that drive renewable energy,
climate change mitigation and food security all influence
the forest industry, both directly and indirectly.
Demographics and economic growthAs noted in State of the World’s Forests 2009 (FAO,
2009a), global population and the size of the global
economy are expected to increase in the next few
decades at similar rates to those seen in the past.
Although global economic growth slowed in the
recession of 2008–2009, this was more significant in
developed countries. It is likely that most countries
will return to a more normal growth trajectory in the
coming years (see Box 1). Some of the main features
of the long-term demographic and economic trends
are outlined below.
The global population increased by 1.3 percent per
annum from 5.3 billion in 1990 to 6.9 billion in 2010
and is projected to increase by 0.9 percent per annum
to 8.2 billion in 2030. In the next two decades, the
largest increases in population will occur in Africa
(+235 million) and Asia and the Pacific (+255 million),
which will increase their share of the global population
(to 18 percent and 53 percent respectively). In contrast,
Europe’s population is expected to fall by 17 million over
the period due to falling numbers in some significant
countries.
Box 1: Uncertainties in the economic recovery
Following the decline in global economic growth to 1.7 percent
in 2008 and –2.1 percent in 2009, the World Bank has projected
economic growth of 3.3 percent in 2010 and 2011 and 3.5 percent
in 2012, bringing growth back in line with the long-term trend
expected in the future. However, two factors continue to cause
uncertainty about the strength of the recovery. The first is the
speed at which fiscal policies are tightened to control public debt
in the (mostly developed) countries that were most affected by
the recession of 2008–2009. The second is the risk of a default
or a requirement for major restructuring of government debt in
one or more of the weaker European countries. Should these
uncertainties persist, global economic growth could be somewhat
lower due to weaknesses in credit markets and lower government
spending (especially in Europe). As an alternative, lower forecast,
the World Bank projects growth of 3.1 percent (in 2010), 2.9 percent
(in 2011) and 3.2 percent in 2012.
Developing countries were less affected by the recession
of 2008–2009 and are expected to continue to grow rapidly as
a result of higher productivity growth and fewer difficulties in
their government finances and banking sectors. The World Bank
is projecting growth of over 6.0 percent over the three years
(2010–2012) or 5.9 percent under the alternative low growth
scenario, although it is noted that a sovereign debt crisis in
Europe could weaken international capital flows to some
developing regions where European banks are major operators
(e.g. parts of Eastern Europe, Western Asia, Latin America and
the Caribbean). Source:World Bank, 2010.

32 | Chapter 2
The age-structure of populations will continue to change
towards a higher proportion of older people in the total
population and, in some cases, a decline in the workforce.
This trend has already started to appear in some developed
countries and will increase over the next 20 years. For
example, in 2030, the size of the workforce in Japan, the
Republic of Korea and most European countries will be
less than it is today. Even in China, it is projected to peak in
2015 and then start to gradually fall. The main exceptions
to this trend are Africa, South and Southeast Asia and Latin
America, where the workforce is expected to continue to
grow rapidly.
Global gross domestic product (GDP) increased in real
terms by 2.5 percent per annum from about US$38 trillion in
1990 to US$63 trillion in 2010 (at 2010 prices and exchange
rates). It is projected to grow by 3.2 percent per annum to
US$117 trillion in 2030, with relatively higher growth rates
projected for less developed regions. The result of this will be
a continued shift in the regional shares of global GDP away
from developed regions such as Europe and North America
towards other regions such as Asia and the Pacific (Figure 26).
GlobalizationThe trends described above have contributed to increased
globalization in recent years. For example, in some
countries with large and rapidly growing populations,
low labour costs have combined with other factors
(such as investments in education, communications
and infrastructure) to stimulate rapid growth in domestic
markets and higher production for exports. Other
countries have become more closely linked into the global
economy for other reasons, such as domestic political
and market reforms, international trade liberalization, and
the expansion of regional trade agreements. The result of
these changes has been a rapid expansion in international
flows of capital, goods and services since 1990 (Figure 27),
which is expected to continue in the future.
In addition to these supply-side impacts, globalization has
also led to some homogenization of markets. For example,
with the expansion of multinational corporations, many
products and services are now delivered to consumers
in a similar way across the world and consumers are
now aware of trends, tastes and fashions in other parts
of the world. These developments present opportunities
to increase efficiency in the delivery of products and
services across a much larger global marketplace, but they
also enable firms to gain competitive advantage through
local market knowledge, product differentiation and the
development of local market niches.
Figure 26: Global economic growth is shifting to the east and the south
Sources:World Bank, 2010 and EIU, 2010.
GDP in 1990 (at 2010 prices)
Africa0.8 US$ trillion(2%)
Asia and the Pacific7.8 US$ trillion(21%)
Europe15.7 US$ trillion(41%)
Latin America and the Caribbean1.8 US$ trillion
(5%)
North America10.5 US$ trillion
(28%)
Western and Central Asia1.3 US$ trillion
(3%)
GDP in 2010 (at 2010 prices)
Africa1.7 US$ trillion(3%)
Asia and the Pacific17.6 US$ trillion(28%)
Europe19.3 US$ trillion(31%)
Latin America and the Caribbean3.6 US$ trillion
(6%)
North America17.4 US$ trillion
(28%)
Western and Central Asia2.9 US$ trillion
(5%)
GDP in 2030 (at 2010 prices)
Africa4.5 US$ trillion(4%)
Asia and the Pacific40.2 US$ trillion(34%)
Europe28.5 US$ trillion(24%)
Latin America and the Caribbean7.1 US$ trillion
(6%)
North America29.3 US$ trillion
(25%)
Western and Central Asia7.0 US$ trillion
(6%)

Developing sustainable forest industries | 33
Competing materialsThe major end uses of forest products include
media and communications materials, packaging,
personal care products, construction (including
home decoration) and furniture. In most of these
markets, forest products compete with other goods
and services and this competition has increased in
recent years.
Demand for media and communications materials
tends to increase when a significant proportion of the
population earns incomes above subsistence levels
(i.e. a middle-class develops). When this occurs, rising
incomes result in more expenditure on leisure activities
and the development of a service sector that relies very
heavily on communication with customers. In these
markets, speed, ease of use and cost are the major
factors that affect competition between alternative
forms of media. For many years, these markets relied
heavily on newsprint, printing and writing paper to
serve customers’ needs, but advances in electronic
media (i.e. increased availability and reduced costs)
have resulted in strong competition in recent years.
For example, paper books will continue to dominate
this market for quite some time, but a gradual change
is starting to occur as younger generations (who are
more familiar with new technologies) shift the balance
in demand towards electronic media, such as mobile
phones and electronic books. More recently, the
deregulation and, in particular, the expansion of internet
connections (especially high-speed connections) have
radically altered the way that companies and individuals
communicate.
Packaging and personal care products (tissue paper and
related products) account for the majority of other paper
and paperboard consumption. Demand for these products
increases rapidly once a certain level of economic
development is reached. The demand for packaging
materials is largely driven by growth in manufacturing,
with cost, recyclability, weight, durability and ease of use
being the main factors affecting their competitiveness.
Plastic and, to a lesser extent, glass (in liquid packaging)
and metal are the main materials competing with paper in
these markets. Thus, energy and raw material costs are
important factors affecting the cost competitiveness of the
different materials. In most cases, paper products have
maintained their share of this rapidly expanding market
and, in some, have even improved it. This has largely been
a result of investments in technology that have kept costs
down and improved durability. In addition, the industry
continues to innovate to produce packaging products that
meet a wider range of customer needs, including product
information or user instructions (Box 2).
In the markets for personal care products, paper
products meet specific niches that are not so vulnerable
to competition from other materials. Opportunities to
increase revenue come from improvements in product
quality and product innovations that meet new customer
needs. In addition, sales of these products are not as
strongly affected by business cycles and can remain
profitable even during recessions, ensuring that this
remains one of the most profitable sectors of the industry.
For solid wood products (i.e. sawnwood and wood-
based panels) construction is the major end use in most
countries and regions. The fundamental drivers of this
market are population growth and economic growth,
but expansion tends to slow (in relation to economic
growth) at higher levels of income. Similar to packaging,
construction meets basic functional needs, so cost,
durability and ease of use are key factors determining the
competitiveness of different materials.
The competitiveness of wood as a construction
material varies quite a lot between countries and
regions, partly for historical reasons. Countries with
significant forest resources and forest processing
industries tend to have a much longer history of
wood use in construction and more familiarity with
the potential of wood as a building material. In other
countries, wood use for construction lags far behind
its potential. For example, timber frame construction
accounts for over 90 percent of house construction in
Africa North AmericaAsia and the Pacific Europe
World
Western and Central AsiaLatin America and the Caribbean
Source:UN, 2010.
5
10
15
20
25
35
30
45
40
0
Figure 27: Increasing globalization of the world economy
1990
1992
1994
1996
1998
2000
2002
2004
2006
2008
Per
cen
t sh
are
of
mer
chan
dis
e ex
po
rts
in G
DP

34 | Chapter 2
North America, Australia and Nordic countries, but only
about 45 percent in Japan and less than 10 percent in
some West European countries (Palmer, 2000). Metal,
plastic and concrete are the main competing materials,
and energy and raw material costs become important
factors in determining the selection of construction
materials. On the whole, wood has remained
competitive in construction markets, with the notable
exception of external doors and windows, for which
plastic (PVC) alternatives have taken market share
because of their cost and durability advantages.
The other significant end use of solid wood products
is furniture manufacturing. Unlike construction and
packaging, furniture is mostly sold directly to the
public, so personal disposable income is a major driver
of demand. As with personal care products, rising
incomes present opportunities to increase revenues
and profitability through quality improvements,
innovations and marketing of higher value products
more generally.
Demand for wooden furniture is affected in part by
its cost competitiveness in comparison with furniture
manufactured from other materials (mostly plastic,
metal, glass and aluminium, but also bamboo, rattan
and other fibrous plants). Consumer tastes and product
quality also play important roles in determining the
demand for wooden furniture, particularly at higher
levels of income. Across a broader part of the market,
many furniture manufacturers also now produce
or sell matching home décor and accessories. By
doing this, manufacturers are no longer simply selling
furniture to meet functional needs, but are encouraging
redecoration or renovation of existing furniture. Often
these additional items also have higher profit margins
than the furniture itself, which increases the value-
added and profitability of the business as a whole.
Furniture manufacturers are adopting much more
sophisticated marketing techniques than producers of
other wood products to maintain competitiveness and
profitability.
In general, wooden furniture has maintained a share
of about 45 percent of the total furniture market and
consumption has risen in line with increasing incomes.
Globally, cost competitiveness has been maintained
by relocating production to countries with lower labour
costs while, at the same time, the industry has generally
maintained its reputation for quality.
Social trendsSocial trends are changes in public opinions, attitudes
and lifestyles that occur when incomes rise. For example,
as incomes increase, people move beyond trying to meet
basic needs and start to seek new products and services
that will improve their quality of life, according to their
tastes and preferences. Other wealth related factors
also affect consumption, such as increases in home
ownership (including second homes), trends towards
larger homes and greater leisure time, as well as changes
in the amount of time spent at home.
Box 2: Redeveloping paper markets through product differentiation and innovation
As noted by Wagberg (2007), many of the markets for paper
products have suffered in recent years from fragmentation
and increased competition from new media. For example,
in Norway, the market for media has multiplied by a factor
of 25 since 1980, but the different avenues for advertising
have increased from five main segments in 1980 to over
40 today. In response to these developments, paper
manufacturing and utilizing industries are using a number of
different strategies to maintain demand for their products.
Newspaper companies, for example, are switching from
a focus on paid newspapers to a range of products that
includes free smaller newspapers and internet services.
At a broader level, paper companies are differentiating
more between high-volume, low cost products (driven by
technology developments) and more complex, high-value
niche products (developed with greater understanding of
customer needs and habits).
The packaging sector is also developing new products
to remain competitive by meeting existing and future
customers’ needs better. Paper packaging products are
being designed with new functionality to improve logistics
and storage capabilities, with features such as automatic
tamper discovery, improved traceability, authentication
and encryption, and chemical and temperature monitoring.
Other advanced examples of ‘smart paper’ are also being
developed, including the incorporation of Radio Frequency
Identification technology into paper (to improve product
tracking and logistics) as well as the integration of other
electronic devices into paper to perform a variety of
different functions (e.g. display devices and batteries).Source:Wagberg, 2007; Moore, 2007.

Developing sustainable forest industries | 35
As incomes increase, consumers’ perceptions of
products also move beyond consideration of their
costs and functional attributes to include more
intangible factors (e.g. quality, status and fashion) that
meet different needs. People become more aware of
environmental and social issues, leading to demands for
more sustainable products and lifestyles. These trends
affect the demand for forest products and may affect the
industry in other ways, such as government attempts
to improve environmental and social standards through
incentives and regulation.
Some of these trends are also magnified by increased
education levels and much better communication
between consumers. For example, social networking
sites and other internet sites enable consumers to
become much more knowledgeable about companies
and their products through online product reviews and
discussion forums. These may also include information or
discussions about the sustainability of different products.
Competition for resourcesThe driving forces described above mostly affect the
demand for forest products. On the supply side, the
main driving force affecting the forest industry is the
increased competition for resources (land, labour and
capital) that occurs when populations and economies
expand. In particular, in the case of the forest industry,
competition for land or, more specifically, competition for
access to forest resources, is a major driving force that
affects development. Competing demands for land are
now sometimes referred to as the ‘5-Fs’ - food; (animal)
feed, forest (for conservation), fibre and fuel – and there is
growing interest in how these demands will be met in the
future (see, for example, OECD, 2009).
Although there is considerable scope to improve
productivity, demand for land for food production
continues to increase with population growth and this
seems likely to continue for many years. More recently,
with higher income levels in countries such as India and
China, diets have started to change to include more meat
and animal products. This has led to increased demand
for animal feed, which is likely to reinforce the overall
trend of increasing demand for agricultural land.
The rising demand for land to grow biofuel crops as a
result of bioenergy policies is another emerging trend.
Although the impacts of these policies remain uncertain
and some policies are currently being revised, it seems
likely that these developments will result in significant
new demands for land and wood fibre that could
stimulate forest conversion (Table 37).
These impacts are further complicated by the increased
globalization of agriculture, so that higher demand in
Table 37: Potential expansion of biofuel crops onto other land uses by 2030 (in million hectares)
Region Types of land likely to be used for expansion of biofuel crops
Mostly within agriculture Degraded land
Possible forest conversion Total
Sugar beet and cereals
Oil crops Jatropha, cassava, sorghum
Biomass energy crops
Sugar cane Oil crops
Net importers of biofuels
North America 11.5 6.3 10 27.9
Europe 8.9 15.2 15 39.2
Asia and the Pacific 1.0 5.2 12.7 1.8 3.5 24.3
Net exporters of biofuels
Latin America and Caribbean
4.3 8.0 12.3
Africa 1.4 1.3 2.8 5.5
World 21.5 26.8 14.2 25 7.4 14.2 109.1
Source:Cushion, Whiteman and Dieterle, 2010.

36 | Chapter 2
one part of the world leads to major (and unpredictable)
changes in the demand for land in other regions.
The potential impact of climate change also creates
uncertainty, especially for water availability, which could
affect demand for land or require changes in forest
management.
Changes in forest ownership, control and managementWithin the forestry sector, economic growth continues
to increase the demand for wood while the social trends
noted earlier are also leading to greater demands for
forest conservation and changes in the way that forests
are managed. These changes suggest that access to
wood supply could become more complicated, with
more fragmented forest ownership, more diverse forest
management objectives and more forest areas excluded
from wood production. Demand may have to be met by
improving the management of forest resources and by
relying more on other supply sources. For example, trees
outside forests are already a major supply source in some
densely populated Asian countries.
Internal forces In addition to the forces described above, there are a
number of other forces affecting industry development
that can be more easily controlled by the industry
or by others with an interest in the sector (e.g.
governments). These forces appear throughout the
production chain (i.e. from fibre supply to end product)
and many are related to the way in which the industry
operates. Other internal forces concern the industry’s
relationships with other stakeholders (including the
general public), and these are more complicated and
difficult to manage.
Industry structure and investmentIn response to forces such as globalization, raw material
supply and regional differences in economic growth, the
structure of the forest industry is changing, but some
features of the industry present challenges for future
development.
In most countries, the forest sector is quite small
especially in comparison with competing industries (e.g.
cement) and others based on natural resources. The
forest industry is also often fragmented and spread out
across a country, for example where firms are located
close to forests. The small size of the industry restricts
the development of suppliers, subcontractors, service
providers and other supporting infrastructure, and
fragmentation makes it difficult to achieve economies
of scale and other efficiency gains. Some countries
have achieved economies of scale through industry
consolidation (e.g. in pulp and paper and wood-based
panel production), but sawmilling and, in particular, forest
harvesting remain fragmented in many places.
The industry is also generally slow to adopt new
technology. This is partly related to its small size and
fragmentation: it is not viable for technology suppliers
to serve countries where the market is fragmented or
simply too small. Other factors play a part, too: market
imperfections, a lack of knowledge or skills to operate
and benefit from new technology, raw material supply
insecurity, and the informal nature of the industry in some
places all result in slower adoption. In some countries
the forest industry continues to compete without much
new technology by simply relying on good access to
raw materials and using existing assets that are mostly
depreciated.
In many countries it is also difficult for the forest industry
to raise capital. For example, in many tropical countries,
firms rely heavily on internal funds (e.g. retained profits)
and unconventional sources of finance due to their
small size and the difficulty for investors to assess risks
(Canby, 2006). In many temperate countries, forest
industry investments are relatively unattractive because
of the lack of scale and the perception that the industry
is a low-risk, low-return industry.10 Other financing
issues include the long-term nature of investments,
the highly cyclical markets for products such as pulp
and paper, and risks associated with fibre supply and
regulation. The result is that many technologies exist
that could improve profitability and sustainability, but
many firms do not have the incentives or funding to
invest in these technologies.
Labour costs and working conditionsIn almost all countries, there is a trend towards
mechanization, but much of the industry is still quite
labour intensive, especially in harvesting and small-scale
processing. In addition, the public have a very poor
10 One exception is the Russian Federation, where there is considerable potential for large-scale investment in the sector. Unfortunately, this has not yet materialized due to the perceptions of high investment risk in the country and the more attractive investment opportunities currently available in other natural resource industries.

Developing sustainable forest industries | 37
perception of employment in the forest industry, with
many believing that most jobs involve repetitive, low
skill tasks with little chance for innovation and career
progression. The one contrasting view is that some parts
of the industry (e.g. furniture and papermaking) offer
opportunities for creativity and innovation in design and
marketing (EC, 2002).
With rising labour costs, ageing populations and higher
expectations from employment, this situation makes
it increasingly difficult to hire and retain workers in
the industry (see Box 3). It also increases the need for
mechanization (putting further strains on the industry’s
ability to raise capital) and encourages relocation towards
countries where working conditions and labour costs are
lower (with further consequences for the sustainability
and public perceptions of the industry).
Social and environmental performanceThe increased interest in social and environmental
issues (noted previously) presents a unique challenge
to the forest industry, because of its reliance on forests
for much of its raw material supply. Forest harvesting is
very different from other industries, in that it occurs over
relatively large areas and has an impact on large numbers
of people. Not only is this impact relatively large, but it
involves a broad and complex set of environmental and
social issues that are often difficult to mitigate. It is also
complicated by the diversity of views held about these
issues and the failure (in many cases) to resolve the
different and often conflicting interests of stakeholders.
These factors have had a number of impacts on the
forest industry. First, they have placed new demands on
forest harvesting operations, requiring forest managers to
Box 3: Trends in employment
Figure A: Value added per employee in US$ (at 2010 prices and exchange rates)
Forestry Wood industry Paper industry
US
$ th
ou
san
ds
1990
1992
1994
1996
1998
2000
2002
2004
2006
10
20
30
40
50
60
0
US
$ th
ou
san
ds
20
40
60
80
100
120
0
Figure B: Value-added per employee in 2006, by subsector and region (at 2010 prices and exchange rates)
Forestry Wood industry Paper industry
Africa North AmericaAsia and the Pacific Europe
Western and Central AsiaLatin America and the Caribbean
Trends in employment indicate that mechanization in the sector
is increasing. For example, the value-added per employee in
forestry increased by almost 50 percent from 1990 to 2006 (see
Figure A) and much of this increase can be attributed to the
mechanization of harvesting in the sector. In the wood industry
(sawnwood and wood-based panels), labour productivity has also
increased by around one-third since 1990. The paper industry is
already capital intensive, which is reflected in the much higher
level of value-added per employee (roughly twice the level of the
other two parts of the forestry sector).
However, there are still significant differences in the levels
of mechanization between countries (see Figure B). As might
be expected, Europe and North America generally have the
highest levels of labour productivity in the sector (particularly
in processing). With ageing populations in both developed and
many developing countries it is likely that further investments in
mechanization will be required in the future.
For example, there are already automated plants in the furniture
and flooring industries, where industrial robots are used in the
same way as in the car industry. Many modern paper machines
can also be operated from outside the mill premises and some
machinery manufacturers provide this service, which increases
their earnings and reduces the labour requirement in the mill. Source:Lebedys, 2008.
38 | Chapter 2
consider more social and environmental aspects of their
activities. To some extent, this has increased production
costs and may have reduced supply where companies
have – either voluntarily or because of regulation – set
aside forest areas for conservation and restoration (see
Box 4). However, these measures are not always costly
and a good deal of ignorance remains about how some
improvements in harvesting can be profitable, as well as
supportive of other forest benefits. Thus, it is important
to improve communication about the forest industry’s
contributions to sustainable development, educate the
public about forest industry operations, and promote
the benefits of using wood as a renewable resource that
contributes to sustainable forest management.
A second impact is the generally poor perception of wood
products that has developed over many years in some
countries. In response to consumer demand, some parts of
the forest industry do meet high environmental and social
performance standards, but other parts of the industry have
seen less need to respond to these issues. As a result of
this uneven performance, the industry as a whole has not
yet managed to overcome these negative perceptions.
Since 2002 leading forest stakeholder organizations
from the NGO community, companies, resource owners
and managers, intergovernmental organizations,
universities and labour have used The Forests Dialogue
(http://environment.yale.edu/tfd/) platform and process
to address pressing forestry issues with the aim of
building consensus and agreement across social and
environmental fracture lines. Multi-stakeholder dialogues
have focused on certification, forest biodiversity, the
role of intensively managed forests, illegal logging and
corruption. Current dialogue streams are on forests and
climate (REDD+), investing in locally controlled forestry
and “free, prior and informed” consent of indigenous
peoples and local communities.
Maturity of existing product marketsIn addition to factors affecting the industry, forest
products themselves have a number of characteristics
that affect developments in the sector. One of these
characteristics is the concentration of demand in a
few end uses, some of which are mature markets. For
example, as noted previously, construction, printing and
publishing grow rapidly in the early stages of economic
development, but growth slows when countries reach
a high level of development and these markets mature.
Currently, the largest markets for these products (i.e. in
developed countries) are already mature and growing
relatively slowly. Although demand in developing
economies is growing rapidly, it is also likely to diminish
in these countries when their markets mature.
Related to this, it is quite difficult for the sector to
advance through product innovation in mature markets.
For example, there have been many innovations in
markets for solid wood products, but they have often
substituted one wood product for another rather than
Box 4: Case study – Sustainable Forest Mosaics Initiative
In late 2007, the Sustainable Production and Biodiversity
Conservation in Forest Mosaics Initiative (or Sustainable Forest
Mosaics Initiative) was launched by Kimberly-Clark, Conservation
International, and the Instituto BioAtlântica to work toward
the creation of sustainable landscape mosaics. Joined shortly
afterwards by The Nature Conservancy and forestry companies
Suzano Papel e Celulose, Veracel Celulose, Aracruz Celulose
and Votorantim Celulose e Papel (now jointly Fibria), initiative
partners recognized the potential to transform the pulp and
paper industry by promoting an industry-wide movement
towards practices that are both environmentally beneficial and
economically sound.
Objectives and results to dateThe Sustainable Forest Mosaics Initiative has set out an ambitious
set of objectives against which to measure progress and impact.
Among the results expected from a fully-implemented initiative at
the end of the five-year period are:
• 250 000 ha of natural ecosystems on forest company land
in Northeast Brazil under more effective and scientifically-
sound protection, and restoration to enhance the Central
Atlantic Forest Corridor (CAFC);
• 4 000 ha owned by companies in Northeast Brazil
formally protected as new private reserves, and more
than 13 000 ha of forest company private reserves using
management effectiveness tools in the CAFC;
• an additional 400 000 ha of natural ecosystems in the Atlantic
Forest owned by forestry companies or their suppliers under
protection or restoration;
• 200 000 ha of biodiversity priority areas in forestry landscapes
worldwide identified for conservation;
• 20 percent of new global forest plantations/managed forests
of participating companies set aside for conservation.
Developing sustainable forest industries | 39
The forest industry continues to invest significant
resources in product development, testing and awareness-
raising to address these issues, but perceptions and
practical barriers remain that limit the expansion of forest
products into new end uses. Product development is not
always sufficient to overcome such problems, as the costs
of addressing systemic and regulatory bottlenecks may
outweigh the benefits of product improvements.
Environmental attributes of forest productsIn contrast to the problems noted above, wood products
– as natural materials – have environmental attributes
that may be preferred over other competing materials.
Forest products are renewable materials that can be
relatively easily recycled. Furthermore, most solid wood
products are produced with relatively little use of energy
(see Box 5). This results in a low ‘carbon footprint’ from
their production and use, which is further enhanced by
the fact that carbon is stored in wood products. Pulp
and paper production is more energy intensive, but is
coming under increased pressure to reduce its energy
intensity and carbon emissions by adopting better
technology (see Box 6).
Improvements in communications with consumers,
architects and material specifiers have been achieved
in the area of timber certification, and tools such as
environmental scorecards in retail outlets have been
effective in attracting consumers’ attention. Lessons can
be learned from these efforts for communicating other
environmental benefits of wood products (such as their
lower energy intensity and emissions of greenhouse
gases during manufacturing), but improved information
(with rigorous scientific proof) will be required to convince
professional buyers.
Adaptability and management of the raw material supplyMost forest products are manufactured from a relatively
small number of inputs. By far the most important input
is the fibre itself, followed by energy and then a variety
of chemical inputs (glues, preservatives, fillers, etc.,
depending on the product). While this simplicity may
limit the scope for product innovation, it does benefit the
sector in other ways.
First, the overwhelming importance of fibre as a raw
material means that the sector has become adept at
using fibre from a wide variety of sources, such as
wood from trees outside forests, recycled paper, wood
residues, recovered wood products and non-wood fibres
expanding the total market for wood products. Some
notable examples of this include:
• the replacement of sawnwood and plywood used in
construction by other types of wood-based panels and
engineered wood products;
• the replacement of sawnwood produced from natural
and semi-natural forests in the north by finger-jointed
sawnwood manufactured from plantation wood grown
in the southern hemisphere;
• the increasing competition between laminate flooring
made from medium and high density fibreboard (MDF,
HDF) and traditional solid wood flooring;
• the competition between laminated veneer lumber (LVL)
and glue-laminated beams.
Where markets are mature, radical and disruptive
technologies and innovations are usually required to
boost growth in the sector above the more normal
(relatively slow) growth trends. Product innovations in
the forest industry in recent years have tended to be
more incremental with relatively modest impacts on
growth, although recent developments in bioenergy and
biomaterials may present some opportunities for a radical
reorientation of the sector.
The maturity of many forest product markets means that
it is difficult to increase product value, value-added and
profitability through product innovation, especially when
many wood products meet basic functional needs and
the products are relatively simple. This suggests that the
industry should try to look beyond traditional end uses
and explore the potential for expanding into new markets
that may present new opportunities for growth.
Other end use issuesForest products are natural materials that can vary in
quality and reliability, which means that they may have
less durability and higher lifetime ‘costs of ownership’
than competing non-wood alternatives. These factors
are particularly important in some end uses of solid
wood products (e.g. construction), where reliability and
durability are crucial factors in the purchasing decision.
Related to this, the complexity of building codes,
environmental regulations and other measures can make it
difficult for forest products to enter new market segments.
Not only are such codes complicated, but they often
vary from country to country, making it more difficult to
develop export markets. In addition, in some countries
forest products are excluded from some end uses simply
because they are not recognized at all in such regulations.

40 | Chapter 2
Box 5: Energy intensity in the forest industry
Energy intensity can be measured in a number of ways, such
as the amount of energy used to produce a given weight or
volume of a product, or the amount used to produce one dollar
of value-added.
Table A shows how much energy is used to produce one
cubic metre (m3) of sawnwood and wood-based panels and one
metric tonne (MT) of paper and paperboard. For sawnwood and
panels, energy use is about 2 400 megajoules (MJ) per m3, with
some considerable variation between the different regions. It is
also increasing in some major regions such as Europe and North
America. This can be explained by the shift in production towards
reconstituted panels, because the amount of energy used to
produce a given amount of particleboard and fibreboard is higher
Table A: Energy use by product volume or weight, 2002 to 2007
Region Sawnwood and wood-based panels Paper and paperboard
Data availability Energy use Data availability Energy use
2007 (%)
2002–2007 (%)
MJ/m3 in 2007
Annual change
2002–2007 (%)
2007 (%)
2002–2007 (%)
MJ/MT in 2007
Annual change
2002–2007 (%)
Africa 0 25 n.a. 4.1 0 79 n.a. 0
Asia and the Pacific
67 67 1 686 -6.7 87 97 14 299 -0.9
Europe 75 79 1 806 3.4 90 90 16 831 0.1
Latin America and Caribbean
1 6 3 120 -2.1 88 95 24 752 -1.4
North America 63 98 4 167 5.1 97 100 25 091 -1.1
Western and Central Asia
0 88 n.a. 5.8 37 45 18 832 12.3
World 61 74 2 443 1.4 90 95 19 304 -0.7
Note:Data availability is shown as the total production of countries with information about energy use divided by the total production (of all countries) in each region. Statistics for partial energy use (e.g. electricity only) are not included in the figures for 2007, but are included in the calculations of trends (annual change), so data availability is higher for the latter.
than that used to make sawnwood. Taking this into account, the
energy used to make each type of product has probably not
increased at all and may have decreased.
For paper and paperboard, energy use is about 19 300 MJ
per MT, with less variation between the regions. Much more
information is available about energy use in this industry, so
these figures are more representative of the sector as a whole.
The figures also show that energy intensity has declined slightly
in recent years at the global level and in most regions.
The energy intensity per unit of value-added is shown below.
The energy intensity of sawnwood and panel production is slightly
higher than in the economy as a whole. However, the service
sector (included in the latter) has a very low energy intensity and,
Box 6: Benchmarking CO2 emissions in the European pulp and paper industry
The European Commission and member states are currently in
the process of defining carbon dioxide (CO2) emission trading
benchmarks for industrial sectors in Europe, including the pulp
and paper sector. These benchmarks will provide the basis for
allocating emission rights among the pulp and paper mills in
Europe after 2012. Benchmarks will be based on performance
levels of the best 10 percent of mills, with different benchmarks
for different product groups. If a mill emits more than the
benchmark value they will have to buy additional credits from
the market or at government auctions. The Confederation of
European Paper Industries (CEPI) is involved as a key stakeholder
in the process.

Developing sustainable forest industries | 41
Table B: Energy use by US$ of value-added, 2002 to 2006
Region Energy intensity (MJ per US$ of value-added)
Sawnwood and panels Pulp and paper Whole economy
MJ per US$ in 2006
Annual change 2002–2006 (%)
MJ per US$ in 2006
Annual change 2002–2006 (%)
MJ per US$ in 2006
Africa n.a. 1.9 n.a. 4.7 14.6
Asia and the Pacific 17.8 -6.0 39.1 -2.5 14.2
Europe 8.8 3.2 36.3 6.1 8.6
Latin America and Caribbean 12.3 -5.5 52.9 5.8 11.8
North America 15.2 5.5 46.7 -0.7 8.4
Western and Central Asia n.a. 1.8 19.7 9.2 20.6
World 13.4 1.9 41.6 1.0 10.7
compared with many other manufacturing activities, sawnwood
and panel production has a relatively low energy intensity. In
contrast, pulp and paper production has a high energy intensity
and the sector is one of the five most energy intensive industries
when measured in this way.
Table B also shows that energy intensity is increasing slightly,
due to the increasing energy use in sawnwood and panel
production and declining value-added (per MT of production) in
the pulp and paper sector. In the case of pulp and paper, this
is partly a result of the business cycle (where value-added has
been declining in recent years). For example, a longer time series
on energy use and value-added is available for Europe and this
shows that, since 1990, energy intensity has increased by about
one percent per year rather than the 6.1 percent seen between
2002 and 2006.
The use of renewable energy is a further important factor
in the evaluation of energy intensity in the sector. Only partial
information exists, but statistics show, for example, that
renewable energy accounts for almost 40 percent of the energy
used in sawnwood and panel production in much of Europe. For
pulp and paper production, renewable energy accounts for about
30 percent of consumption in Europe and Japan, 45 percent in
North America and over 60 percent in South America. Most of
this energy is produced from waste wood, so the use of fossil
fuels in the sector is much lower than suggested by the tables.
Comparisons with other materials usually take into account
a wider range of energy inputs in the production and use of
products using life cycle analyses (LCA). Consequently, LCA
studies vary considerably in terms of their methodologies and
results (see, for example, Hammond and Jones, 2008 and Alcorn,
2003). In general, they show that, for a given weight, sawnwood
and panel products tend to have similar or slightly higher energy
intensities than bricks, cement, concrete and plaster, while the
energy intensities of metals are 3–5 times higher and plastics
up to 10 times higher than wood. However, comparisons in use
also have to take into account the different amounts of materials
needed for any specific purpose to lower energy use overall.Sources:data derived from EIA, 2010; EUROSTAT, 2010; FAO, 2010b; and IEA, 2010.
(see Box 7). Furthermore, to deal with the diffuse and
fragmented supply sources in many countries, some
companies have developed considerable expertise
in transport and logistics and have become excellent
managers of their fibre supply chains.
Second, waste products from one production process
can often be used in other processes or other parts of
the industry either as fibre inputs or for energy. Complex
wood fibre supply chains and linkages have already
developed in many countries with well developed forest
industries and these are gradually being expanded to
accommodate growing demands for bioenergy. The
industry is also continuing to examine ways in which
more wood fibre can be extracted from the forest
resource base through, for example, the use of forest
harvesting residues and the use of forest resources
previously considered to be uneconomic.

42 | Chapter 2
Recently, the World Business Council for Sustainable
Development’s Vision 2050 project – looking at the future
role of global business in achieving a sustainable, carbon
and natural resource constrained world – has articulated
a forest ‘pathway’ based on significantly improving the
bio-capacity of intensively managed forests to supply
expanding fibre needs for wood, paper and bio-energy
products, and the regeneration and conservation of
natural forest systems for their ecosystem services,
starting with carbon market incentives and payments.11
Potential for innovationDespite some of the challenges described earlier, the
forest industry has shown that it is capable of innovation.
This is demonstrated by the advances the industry
has made in harvesting and logistics, processing
technologies and the steady progress in extracting
more product from each unit of fibre input. There have
also been a number of successful product innovations
in engineered wood products and paper products.
The increased attention given to patents and licensing
Table 38: Possible strategic responses to driving forces affecting the forest industry
Strengths (S) Weaknesses (W)
Opportunities (O) S-O Strategies• green building and green packaging initiatives • bioenergy and biomaterials development
W-O Strategies• industry restructuring for investment and expansion• industry clusters and partnerships• measures to strengthen fibre supply
Threats (T) S-T Strategies• product and process innovation• diversification of fibre sources• life cycle analyses (LCA)• collaboration to secure fibre supplies
W-T Strategies• industry restructuring for cost savings • product focus and product differentiation• development of technical standards and information• mechanization of operations and human resource
development
Note:The strengths, weaknesses, opportunities and threats shown in Table 38 are those identified in Table 36 on page 30 (i.e. strengths – environmental attributes, adaptability and management of raw material supply, innovation; weaknesses – industry structure, labour costs and working conditions, social and environmental performance, maturity of existing product markets, end use issues; opportunities – demographics (low and middle-income countries), globalization and economic growth, social trends; threats – demographics (high-income countries), competing materials, competition for resources, changes in forest ownership). Each strategy identified in Table 38 responds to a different combination of strengths, weaknesses, opportunities and threats, as discussed in the text.
Box 7: Extending the resource through the use of recycled and recovered fibres
The fibre used to manufacture sawnwood, panels and paper
comes from a wide – and increasing – variety of sources. In
2005, the fibre required to produce these products was equal to
2.6 billion m3 of roundwood, yet industrial roundwood production
only amounted to 1.7 billion m3. The remaining fibre requirement
(equal to 900 million m3 or about 35 percent of the total) was met
through the use of recovered paper (550 million m3), non-wood
fibre sources, and unrecorded sources such as wood residues
from sawnwood and plywood manufacturing and recovered
(waste) wood products.
Figure A shows the trend in the use of these other fibre
sources from 1990 to 2005 and projections to 2030 from FAO’s
global outlook study (FAO, 2009a). It shows that the importance
of these other sources has increased from 21 percent of fibre
requirements in 1990 to 37 percent in 2010 and is projected to
increase to almost 45 percent in 2030. Recovered paper is the
most important of these other sources, but increased collection
of waste wood products (demolition waste, used furniture, etc.)
is also increasing rapidly.
As the problem of waste disposal increases in many countries,
the ability of the forest industry to recycle waste fibre into new
forest products will help the industry to meet its growing fibre
requirements as well as reduce the environmental impact of
growing consumer demands.Sources:data derived from FAO, 2009a and 2010b.
11 http://www.wbcsd.org/Plugins/DocSearch/details.asp?DocTypeId=25&ObjectId=MzczOTc
Figure A: Trends in use of recycled, recovered and non-wood fibre sources, 1990 to 2030
Africa Asia Europe Latin America and the Caribbean
North America WorldWestern and central Asia
1990
1995
2000
2005
2010
2015
2020
2025
2030
10
20
30
40
50
60
0
Sh
are
of
wo
od
an
d f
ibre
use
fro
m
no
n-f
ore
st s
ou
rces
(%
)

Developing sustainable forest industries | 43
to protect intellectual property and increase revenue
provides an indication of the importance of innovation in
the forest industry.
Strategic choices for the future of the forest industryThe driving forces described above will affect
developments in the forest industry for many years to
come. They will directly influence markets for both raw
materials and forest products, and are also likely to affect
government policies and regulation of the sector.
As part of their long-term planning, industries and
governments need strategies to respond to these
forces. Table 38 lists some of the different strategies
that the forest industry has already developed – often
in collaboration with governments, end users and other
stakeholders – to strengthen the long-term profitability
and sustainability of the forest industry in the future.
Some of these strategies focus on increasing the
profitability and competitive advantage of individual
firms (e.g. industry restructuring and mechanization), so
it is appropriate that they have mainly been implemented
by individual firms. However, where there are benefits
for the industry as a whole or benefits from a more
co-ordinated approach, strategies may be developed
and implemented at the sectoral level, usually with a
lead from industry or government.
Traditional government support for industrial development
declined in the 1980s and 1990s in many countries
with changes in the political landscape, privatization of
nationalized industries and an emphasis on deregulation
of economies. This free-market approach to economic
development prevailed for many years, but there has
recently been a reversal in some countries and some
parts of the economy. This reversal can be explained by
a number of factors, such as the impact of globalization
on industrial competitiveness and growing interest in the
development of a more sustainable ‘green economy’.
More recently, the recession of 2008–2009 has caused
a number of countries to re-examine their economic
policies and to support stronger, more sustainable
economic growth in the future.
In line with these trends, support for the development of
forest industries has increased over the last few years
in almost all developed countries. For example, the
European Union (EU) examined the competitiveness
of the European forestry sector in 2007 (IIASA, 2007)
as part of the EU Forest Action Plan and currently
provides support through initiatives such as the Forest
Technology Platform. A number of Canadian provinces
have recently examined the competitiveness of their
forest industries and, at the federal level, Canada has
recently launched a major initiative to support innovation
in the sector (the ‘Transformative Technologies
Program’). Other recent initiatives to examine industry
competitiveness and support industry development can
be found in Australia (DAFF, 2009) and New Zealand
(MAF, 2009). Many countries have also started to
provide considerable support for the development of
biofuels and bioenergy, which is partly directed towards
the forestry sector.
Most of these initiatives have some similar features,
including analyses of competitiveness, strengths and
weaknesses in the sector; measures to increase supply
and lower the costs of fibre; support for research,
development and innovation; and development of new
products (especially biofuels and new wood-based
products and materials). Although they differ in scale
and emphasis, they indicate that many governments
believe the forest industry has a viable future, especially
as part of the emerging ‘green economy’. Some of
these initiatives are relatively new (e.g. bioenergy
developments) or have suddenly grown in recent years
(e.g. wood promotion activities) and greater demands for
sustainability are part of the reason for this. A review of
some of these initiatives, below, shows how the industry
is responding to the driving forces described above.
Wood promotion initiativesThe promotion of forest products (e.g. through advertising
and communication) is a core function of the forest
industry; individual companies and industry associations
have been promoting their products for many years.
However, over the last decade these activities have
expanded considerably and have become much broader
than simply advertising and marketing of products.
Significant, well-organized and co-ordinated wood
promotion initiatives currently operate in Australia, New
Zealand, North America and most western European
countries. Industry associations in a number of emerging
economies (e.g. Brazil, Ghana and Malaysia) are
intensifying their wood promotion initiatives.
In most cases, these initiatives are industry-led and
have developed as specific projects initiated by forest
industry associations (or groups of associations).
Government agencies may be involved (especially where
state forests are used for wood production) or, in some
44 | Chapter 2
cases, provide funding or technical assistance. Most
initiatives focus on domestic markets, but a number
of regional or multi-country wood promotion initiatives
have also started (e.g. Pro:Holz in Austria has been very
active in collaborating to establish wood promotion
initiatives in other countries).
Public demands for sustainability have been a driving
force behind these new initiatives, so many of them have
gone far beyond the traditional promotional activities of
trade fairs, product literature and business directories. In
particular, they show how forest products can contribute
to more sustainable lifestyles and, based on this, try to
develop a stronger wood-using culture. Initiatives have
developed a wide range of information materials and
resources, including:
• case studies on the design and sustainability aspects
of wood product use;
• literature about the technical properties of wood
products;
• information about environmental aspects of wood
product manufacturing;
• tools and models to assess the environmental impacts
of wood use;
• discussion forums and mechanisms to provide
technical advice;
• seminars and training in wood use;
• competitions in design and sustainable use of wood;
• directories of suppliers and other service providers and
experts.
Most of these wood promotion initiatives have three
common features: linkages to green building initiatives;
development and provision of information about technical
standards; and examples of life cycle analysis of wood
products or wood product use.
Green building initiativesMost of the countries with well-developed wood
promotion initiatives also have green building initiatives.
Some of these are industry-led, but many are governed
by boards or committees that include other stakeholders
with an interest in sustainable construction. In a few
places (e.g. United States of America) there are a
number of green building initiatives that may compete or
collaborate with each other.
Green building initiatives exist to promote sustainable
construction rather than one material over another or the
construction industry more generally. They tend to focus
on the development and implementation of tools, models
and methodologies for assessing the sustainability of
buildings and often administer certification or rating
schemes for companies that want to demonstrate their
environmental performance. Green building initiatives
are largely voluntary, although some aspects of green
building (e.g. standards for energy efficiency) may be
included in building regulations.
To assess the sustainability of buildings, the efficiency
of resource use (e.g. energy, water and other natural
resources) is examined throughout a building’s life
cycle from location to design, construction, operation,
maintenance, renovation and demolition. It also takes into
account waste, pollution and environmental degradation
associated with a building project, as well as aspects
of building use such as indoor air quality and employee
health and safety.
Wood is just one of a range of materials used in
building construction, and the environmental impact
of manufacturing forest products compares favourably
with many other materials. Thus, the emphasis on
green building within wood promotion initiatives is a
useful strategy that builds upon the strength of the
environmental attributes of forest products. However,
many green building systems are still in the early stages
of development and a number of problems remain for
promoting wood within such systems.
For instance, most schemes do not adequately consider
LCA in material specification, which puts wood at a
disadvantage compared with other materials because
wood generally scores favourably (UN, forthcoming).
Furthermore, scoring systems often give a relatively low
weighting to material selection (where wood performs
well) compared with other factors such as energy
efficiency and sourcing of local materials. Some systems
such as the Leadership in Energy and Environmental
Design (LEED) in the United States of America and the
Green Building Council in Australia have chosen to
recognize only forest product certification by the Forest
Stewardship Council, effectively barring other certified
wood products from their systems (UN, forthcoming).
Green packagingAt present, wood promotion initiatives focus mostly on
green building, but interest in green packaging is also
increasing. This has been largely driven by retailers and
consumer goods companies, which are much closer to
consumers and more directly affected by the growing
public interest in environmental issues. As with the green

Developing sustainable forest industries | 45
building initiatives described previously, sustainable or
green packaging initiatives (Box 8) are likely to present
opportunities for the forest industry to contribute to more
sustainable lifestyles.
Technical standards and informationMany wood promotion initiatives include activities to
explain and provide information about technical aspects
of wood use (especially in construction) to businesses
and professionals, as well as to the general public. This
complements the promotion of wood in green building
and aims to overcome one of the weaknesses of wood
promotion, which is the lack of information about the
properties of wood products, or the perception that
they are less reliable than products made of other
materials.
In addition to raising awareness, wood promotion
activities in many countries also include active
participation in the development of technical standards
and codes. Although such standards are, quite rightly,
administered by public agencies, contributions and
expertise provided by the forest industry are often useful
for their development and revision, especially when
the industry develops new products. In some cases,
these consultations occur at an international level, as
in the case of the Canada–US–Japan Building Experts
Committee.
Life cycle analysisMost wood promotion initiatives also include case
studies, tools and models to calculate and demonstrate
the environmental impacts of substituting wood for other
materials. With the high public interest in climate change,
many of these focus on the effects of product substitution
on energy use and carbon emissions, but some go further
and examine a broader range of environmental impacts
such as those evaluated in green building initiatives
(as noted above). This strategy complements efforts to
promote wood in green building, by addressing the threat
of competing materials and quantifying the environmental
benefits of using forest products.
Collaborative business practicesThe development of more collaborative business
practices in many sectors and industries is an increasing
trend in recent years. For many years firms in many
industries have collaborated closely along the production
chain with suppliers and end users to improve product
quality and develop new markets, but new approaches
to collaboration aim to address some of the specific
weaknesses in the forest industry.
Collaboration to secure fibre suppliesGreater collaboration offers a response to the threats of
increased competition for fibre supplies, changes in forest
ownership, control and management, and the fragmented
Box 8: Sustainable packaging: an opportunity for the paper industry
The European Directive 94/62/EC on Packaging and Packaging
Waste, adopted in 1994, was one of the earliest attempts
to increase the sustainability of packaging. This focused on
minimizing the use of packaging and the hazardous materials
it contained, and on encouraging the reuse and recycling of
packaging materials. Most other countries outside the EU have
not so far followed a regulatory approach towards increased
sustainability in the packaging sector. However, sustainable
packaging initiatives have been developed by a number of industry
groups, non-governmental and government agencies, and large
individual companies.
The objectives of many of these initiatives are similar to the
EC Directive: to reduce the total amount of packaging used and
increase the reuse and/or recycling of packaging materials, increase
the content of recycled materials and reduce the use of hazardous
materials. Some go even further and examine other aspects, such
as greenhouse gas emissions from packaging production, the use
of resources (water, energy, land, etc.) in packaging production,
and transport distances along the supply chain.
Many of these initiatives are voluntary, but some are
backed by major companies which expect their suppliers to
improve performance in packaging sustainability (e.g. the Wal-
Mart Packaging Scorecard). These initiatives offer various tools
to help companies assess and minimize their environmental
impact, including scorecards for assessing overall impacts,
design guidelines, LCA tools and other design tools (Five Winds
International, 2008).
Although reducing packaging is a major objective of many
of these initiatives, they can also encourage changes in the
types of packaging materials used. For example, as a result of
the Wal-Mart Packaging Scorecard, paper cartons have replaced
metal cans for some products in ASDA supermarkets in the
United Kingdom. Further research and development in the paper
industry on issues such as tamper-proof mechanisms and
temperature monitoring (‘smart paper’) could enable more paper
products to replace less environmentally-friendly packaging
materials and contribute to these efforts.

46 | Chapter 2
nature of forest ownership in many countries. This takes
the form of both collaboration among forest owners, and
between owners and the industry to secure fibre supplies
and encourage wood production from forest areas that
would previously have been considered uneconomic or
unsuitable for harvesting. Such collaborative strategies
build on the strengths of the forest industry to organize
and manage fibre supplies and (in some cases) transfer
some of these skills to small private forest owners.
Collaboration between forest owners (in cooperatives
and associations) has occurred for many years in some
countries (e.g. in parts of Europe and North America), but
has expanded in recent years to become an important
force in wood supply. For example, private forest owners’
organizations in 23 European countries are members of the
Confederation of European Forest Owners (CEPF). A recent
survey of 11 of these countries indicated that members
of the national organizations accounted for 11 percent of
all private forest owners, 42 percent of the area of private
forests and 22 percent of total roundwood production
(CEPF, 2008). There is also evidence of the expansion of
forest owners’ organizations in other countries such as
Mexico and the United States of America.
The expansion of cooperatives and forest owners’
organizations has occurred for a number of reasons.
With the transfer of state forests to private owners
in Eastern Europe in the 1990s, a number of forest
owners’ organizations emerged to assist the new
private forest owners with forest management and
harvesting (e.g. in the three Baltic States, Czech
Republic, Hungary and Slovakia). In some places,
opportunities for forest certification have been a
motivation for better organization of forest owners (e.g.
see Ota (2007) for a description of recent activities
in Japan). Other examples of improved collaboration
include the use of internet tools to manage forests and
market forest products such as the ‘myForest’ service
in the United Kingdom (see Box 9).
Box 9: The use of internet technology to develop wood supply from small forest owners
For many years, roundwood supply from the private sector in
the United Kingdom has been well below its potential because of
the large number of small forest owners and the very variable (or
unknown) quality of wood resources in many of these forests.
Recent developments in renewable energy policy and incentives
have substantially increased the demand for wood with lower quality
requirements to meet the needs of the energy sector. In response
to this, a number of organizations have been examining ways of
increasing wood supply. One example is the ‘myForest’ service
developed by the Sylva Foundation.
The service provides a web-based map that allows wood users
to link up with local wood producers. Forest owners can identify
their forest on the map and store inventory information for each
forest compartment. This is complemented by a forest management
module that can be used to prepare forest management plans in the
format required by the Forestry Commission in grant and licence
applications.
The third module is a national map where forest owners and
other forestry businesses can advertise their products and services
and display where wood is available or required (see Figure A). Other
features include a forum for discussion about forestry issues and links
to other resources of interest to forest owners and managers.
During the 18 months it took to develop the service (which
was launched in April 2010), 100 businesses and 50 forest owners
registered to use the service. The Sylva Foundation is currently actively
promoting this free service to other potential users.Source:Sylva Foundation, 2010.
Figure A: Businesses registered with ‘myForest’, June 2010
Developing sustainable forest industries | 47
The development of outgrower schemes is another form
of collaboration to secure fibre supplies. In this format,
the forest industry supports tree planting by private forest
owners in order to increase wood supply and develop local
capacity for plantation establishment and management.
Outgrower schemes appeared in the 1990s and now
exist in at least 13 developing countries (Brazil, Colombia,
Ghana, India, Indonesia, Papua New Guinea, Philippines,
Solomon Islands, South Africa, Thailand, Vanuatu,
Viet Nam and Zimbabwe) as well as some developed
countries (e.g. Australia, New Zealand and Portugal).
Forestry outgrower schemes vary tremendously in
size and the scope of their activities, as well as the
distribution of costs and benefits between the forest
owners and industry. With the growing interest in such
schemes, organizations such as FAO and the Center for
International Forestry Research (CIFOR) have analysed
the strengths and weaknesses of different types of
partnerships and developed guidelines to enable them to
continue contributing to sustainable development of the
sector in the future (FAO, 2002).
Industry clusters and partnershipsIndustry clusters occur where firms and other related
institutions (e.g. research facilities) are closely located
or strongly linked together in other ways. Sometimes
these clusters develop spontaneously as a result of the
accumulation of technical expertise over a long time
(e.g. some of the furniture industry clusters in Italy) or
they may occur based on the location of resources (e.g.
forest industry clusters in areas with significant forest
resources). More recently, a number of countries have
stimulated the formation of industry clusters through
public policies and carefully located investments in
research and technology.
Industry clusters usually include core businesses within
the industry, plus a number of suppliers, end users,
related service industries and, sometimes, training,
research and development facilities. Clusters can
potentially increase the competitive advantage of firms
within the cluster by increasing productivity, stimulating
innovation and assisting the development of new
businesses in the industry (Porter, 1990).
Although some forest industry clusters have existed for
many years, interest in their development has increased
in the last couple of decades and significant forest
industry clusters now exist in parts of most developed
countries (Australia, Europe, Japan, New Zealand and
North America). For example, according to the Harvard
Business School Cluster Mapping Project (www.isc.
hbs.edu/cmp), one-third of forest industry employment
in 2007 occurred in just five states of the United
States of America (and over half in just ten states). The
development of forest industry clusters has also been
actively supported by governments and industry in
Europe, where around 200 clusters now exist, linking
together firms in the forest industry and other related
sectors such as construction, renewable energy and
green technology (European Cluster Observatory, 2010).
A few notable forest industry clusters exist in emerging
economies (e.g. pulp and paper clusters in Brazil, India
and Thailand; furniture clusters in Brazil, Malaysia and
Viet Nam). In addition to these, small-scale village
clusters have developed for activities such as handicrafts,
bamboo and rattan manufacturing and small-scale wood
processing in India, Lao People’s Democratic Republic,
Thailand and Viet Nam (Anbumozhi, 2007). Collection
and processing of NWFP is also well organized (with
arrangements similar to clustering) in a number of places
(e.g. the collection and processing of shea butter in
Ghana and Brazil nuts in Bolivia).
The strategy of forest industry cluster development often
aims to take advantage of the opportunities for market
growth presented by economic growth and globalization,
by addressing weaknesses in the industry such as the
maturity of some existing end use markets, fragmentation
of the industry (and low levels of technology adoption)
and increasing competition from newly industrializing
regions. Alternatively, new partnerships can occur to
build upon the strengths of different partners to meet an
emerging market demand.
For instance, forest product companies have entered the
markets for liquid biofuels and other biomaterials, through
the development of ‘biorefineries’. At present, these
developments are being driven by the growing demand
for biofuels, but many companies working in this field
eventually aim to expand and diversify production into a
much wider range of chemicals and materials based on
biomass. The largest and best known of these include the
joint ventures between Weyerhaeuser and Chevron, Stora
Enso and Neste Oil, and UPM, Andritz and Carbona, but
others are developing at the level of individual facilities.
Product and process innovationsInnovation is the process of developing new goods
or services, new markets, new supply sources, better

48 | Chapter 2
processes or better ways of organizing production to
increase productivity and generate profits and wealth
(Schumpeter, 1934). Innovation can occur gradually
(evolutionary innovations) or suddenly (revolutionary
innovations) and may disrupt existing industries and
markets by supplying new products and services in
ways that the market does not expect (typically by
lowering prices or meeting the needs of a different set
of consumers). Revolutionary innovations are often, but
not always, disruptive. In addition, contrary to common
perceptions, efforts by end users to modify products
or use them in new and more useful ways may be a
more important source of innovation than the actions of
manufacturers (von Hippel, 1988).
Despite the relatively low levels of technology adoption
in some parts of the forest industry (and slow rate of
technology adoption generally), the forest industry has
innovated in many areas throughout the supply chain
from harvesting to end user and continues to support
innovation through public and industry research and
development activities. Some examples of forest industry
innovations are outlined below.
Evolutionary innovationsEvolutionary innovations occur when gradual
improvements are made to existing processes and
products to increase productivity, lower costs or
expand quantity or quality of production to meet an
existing market need. In forest harvesting, there have
been numerous evolutionary innovations, such as the
development and implementation of log grading systems;
the gradual move from manual to mechanized harvesting;
and the use of low-impact harvesters that reduce soil
compaction, and enable year-round harvesting and
access to softer soils. These innovations are quite
common now in most countries with a modern forest
industry. More recently innovation to improve real-time
communication between harvesters, transport operators
and processing facilities (using global positioning system
(GPS) and optimization software) allows just-in-time
deliveries of roundwood and reduces the amount of
working capital tied up in raw material stocks.
Processing technologies have also improved in
numerous ways with developments such as scanning
and optimization of product recovery in sawnwood and
plywood production, improvements in stress grading,
kiln drying and treatments, development of adhesives
technologies, as well as higher levels of automation and
gradually faster operating speeds in processing facilities
to increase labour productivity. Process innovations in
the pulp and paper sector have focused in particular
on environmental performance in recent years, with
reductions in water, bleaching chemicals and energy
use (and greater use of bioenergy), plus changes to
processes (speed, fibre pre-treatment, etc.) and adoption
of abatement technologies to reduce emissions of water
and atmospheric pollutants.
Revolutionary innovations Revolutionary innovation occurs when there is a radical
improvement in processes or products to meet an existing
or new market need. Whereas evolutionary innovations
often occur as a result of learning from existing processes
and uses of existing products and services, revolutionary
innovations more often occur as a result of research
and development programmes. A number innovative
forest harvesting machines have been developed and
introduced in recent years to supply wood for the
expanding bioenergy market. These include combined
industrial roundwood and bioenergy wood harvesters and
forest processor–harvester machines for extracting forest
residues. The use of acoustic tools fitted to harvester
heads to improve and automate strength grading of
standing trees at the time of harvest is a revolutionary
innovation currently being tested (Mochan, Moore and
Connolly, 2009).
Revolutionary innovations are less common in forest
processing. One notable example, however, is the
development of the rubberwood processing industry in
Malaysia. Until the late 1970s, most rubberwood was used
as fuelwood for drying and smoking sheet-rubber, curing
tobacco, making bricks and producing charcoal. Malaysia
has since become the world leader in the processing and
utilization of rubberwood, with the value of its processing
currently estimated at a little under US$2 billion per year.
Revolutionary innovations in the forest industry are more
common in product markets and numerous examples
exist. New types of panel products (e.g. oriented strand
board and MDF) have substituted for more expensive
sawnwood and plywood. The development of engineered
wood products for structural applications (laminated
veneer lumber, building components and I-Joists)
followed panel innovations. A key feature of structural
innovations has been the combination of solid wood
pieces, reconstituted panels and non-wood materials in
novel and useful ways that either reduce costs or improve
the strength and durability of these composite products
compared to previously utilized materials.

Developing sustainable forest industries | 49
Low-end disruptive innovationsDisruptive innovations occur when an innovation leads
to new products, new markets or new market segments
that meet existing or new customer needs. Disruptive
innovations can be evolutionary or revolutionary and
occur infrequently in most manufacturing industries
(although they can be quite common in the service
and high-technology industries). Low-end disruptive
innovations tend to occur gradually over time, when new
products and processes capture first the bottom end of
a market, then move upwards to displace other existing
high-value products.
One example of this type of innovation in the forest
industry is the use of low-cost particleboard with a variety
of overlays and finishes for manufacturing some types
of furniture (e.g. kitchen and bedroom furniture). This
started with the emergence of cheap, ready-to-assemble
furniture in the 1970s and 1980s, which replaced
expensive solid wood furniture, the only alternative
available at the time. Gradually, with improvements in
quality, design and marketing, this type of furniture has
moved into higher-end markets so that it is now by far the
most common type of furniture available in these market
segments in many countries.
Other examples of low-end disruptive innovations are
the substitution of wood-based panels (e.g. oriented
strand board and MDF), glue-edged panels and finger-
jointed wood products for sawnwood and plywood in
some applications. These are following the same pattern
of development as that described above and are even
starting to compete in the high-end furniture markets
previously captured by particleboard, such as the use of
MDF as a higher-quality base material for the production
of kitchen cabinet doors.
New market disruptive innovationsThe other main type of disruptive innovation is new
market disruptive innovation. This occurs when an
innovation satisfies new consumer needs or presents a
radically different way of production or service delivery.
New market disruptive innovations are often revolutionary
and can appear quite quickly in an industry.
The rapid expansion in the use of wood pellets in the
energy sector provides an example of a new market
disruption. Renewable energy policies have created rapid
growth in demand for wood energy that will require large
amounts of fuelwood to be moved within and between
countries. Wood pellets are an entirely new way of
delivering fuelwood to end users that partly overcomes
one of the main costs of traditional fuelwood supply (the
cost of transportation), by reducing water content and
increasing the energy content (or energy density) of the
fuelwood. Other benefits of wood pellets include the
greater ease of handling (e.g. by using existing equipment
available at ports for grain handling), the more consistent
properties of wood pellets as a fuel (i.e. more predictable
energy content) and the greater ability with wood pellets
to automate and regulate the feeding of the fuel into
generating equipment such as boilers.
Measures to strengthen fibre supplyMeasures to strengthen fibre supply include a number
of policies and activities to promote good forest
management through supply-chain initiatives, trade
measures and procurement policies. The rationale for
these strategies is very clear: they aim to address the
weakness of poor social and environmental performance
in the harvesting sector in some parts of the industry so
that the opportunities for promoting forest products as
‘green’ products can be fully realized.
Activities to improve social and environmental
performance in harvesting start with basic requirements
such as the development and implementation of
harvesting codes, forest management plans and health
and safety legislation. These are then reinforced by
reliable and robust tracking systems (e.g. chain-of-
custody tracing systems) so that wood from well-
managed forests can be clearly identified throughout the
supply chain. Finally, some sort of certification, labelling
or verification scheme can be used to differentiate
forest products from well-managed forests from
other products to gain competitive advantage in the
marketplace.
Although many of the measures to strengthen fibre
supply have been led by governments and/or NGOs,
there is growing awareness and recognition within
the forest industry that these measures may deliver
benefits to individual firms as well as the industry as a
whole. However, some considerable challenges remain,
including:
• the lack of technical capacity in some countries to
develop and implement improved harvesting practices;
• the administrative burden and costs of compliance
for governments, producers and end users wishing to
demonstrate improved performance;
• the complexity caused by the lack of standardization
and varying procedures and requirements in different

50 | Chapter 2
countries and between different verification and
certification schemes;
• the difficulty of translating improved performance
into competitive advantage in countries and end uses
where environmental concerns are not a major concern
for consumers.
There are numerous examples of different measures
being developed and implemented to strengthen fibre
supply around the world. For a long time these focused
on supply-side measures, but a more recent development
has been the use of trade and procurement policies to
stimulate demand for wood products that meet high
social and environmental standards. A very brief summary
of some of these initiatives is given below.
Supply-side measuresSupply-side measures to strengthen social and
environmental performance in forest harvesting include
a wide range of activities to develop and implement
improved harvesting practices, such as codes and best
practice guidelines for harvesting, forest management
planning, and consultation with local communities;
research, development and training in reduced impact
logging; activities to support forest law enforcement;
industry-led voluntary initiatives to source legal raw
material; and the development of chain-of-custody and
similar tracking schemes.
The basic requirements for sustainable forest harvesting
(set out in codes, guidelines, etc.) have existed for many
years now in most developed countries. In developing
countries many international agencies (e.g. FAO and the
International Tropical Timber Organization (ITTO)) and
bilateral donors have provided technical support for the
development of such materials. Most countries with
significant forest industries should now have the codes and
guidelines necessary to implement sustainable harvesting.
However, what appears to be lacking is dissemination and
training in the application of these codes and guidelines,
as well as implementation and monitoring in the field. For
example, a recent study to examine the monitoring of
harvesting codes in the Asia and the Pacific region revealed
that many aspects were only partially implemented and
monitored and some aspects were not monitored at all
(Pescott and Wilkinson, 2009).
Initiatives to support forest law enforcementAs noted above, supply-side measures to improve
performance will have little impact if they are not
implemented and monitored or there is no mechanism
to differentiate between the social and environmental
performance of different producers and reward those
that meet higher standards. One such demand-side
mechanism is to verify that forest products come from
forests that are managed according to all local laws and
regulation (legal verification).
Initiatives to strengthen forest law enforcement
started about a decade ago with several international
conferences to discuss the problems of illegality in the
forestry sector and propose possible mechanisms to deal
with this issue. Since then a number of different strategies
have been adopted, including the following:
• Amendment of the Lacey Act (of 1900) in the United
States of America. The Lacey Act originally prohibited
the transportation of illegally captured or prohibited
animals across state lines. It has been amended
several times since 1900, with the latest amendment (in
2008) making it unlawful to import, export, transport,
sell, receive, acquire, or purchase in interstate or
foreign commerce any plant in violation of the laws
of the United States of America, a State, an Indian
tribe, or any foreign law that protects plants (and
their products, including timber, derived from illegally
harvested plants). The purpose of the amendment is to
prevent trade in roundwood and wood products from
illegally harvested trees. Different wood products are
gradually phased in to comply with the Act, and the
associated penalties are enforced more stringently to
tangibly influence trade practices.
• The European Union has used a number of different
approaches to combat illegal activities in the forestry
sector, including: procurement policies (see below); a
regulation entitled ‘Obligations of Operators who Place
Timber and Timber Products on the Market’ (which will
take some time to implement); and the development
of Voluntary Partnership Agreements (VPAs) between
the EU and other countries to support the EU’s Forest
Law Enforcement, Governance and Trade process.
The first VPAs with Cameroon, Ghana and Republic of
the Congo came into effect in 2009, so the first VPA
licensed timber could arrive in the EU in 2011. VPA
negotiations are proceeding with a number of other
countries.
• When implementing these initiatives, both the United
States of America and the EU encourage wood
industries and traders to apply ‘due care’ and ‘due
diligence’ in their procurement practices to avoid the
entry of illegal wood products into their supply chains.
• Several countries have issued government
procurement policies banning the use of forest

Developing sustainable forest industries | 51
products harvested illegally and/or encouraging the use
of forest products from sustainably managed sources
(see Table 39).
• In addition to the demand-side measures above,
international and bilateral agencies have continued to
support activities to strengthen forest law enforcement
in producer countries through technical assistance for
policy and legal reform, training in law enforcement,
development of chain-of-custody and other monitoring
systems and other capacity building activities.
Forest product certificationForest product certification was developed during
the 1990s as a mechanism to identify forest products
that come from sustainably managed forests. Four
main elements of the certification process are: the
development of agreed standards defining sustainable
forest management; auditing of forest operations and
issuance of certificates to companies that meet those
standards; auditing of the chain-of-custody to ensure that
a company’s products come from certified forests; and
the use of product labels so that certified products can
be identified in the marketplace. There are presently more
than 50 certification programmes in different countries
around the world, many of which fall under the two
largest umbrella organizations: the Forest Stewardship
Council (FSC) and the Programme for the Endorsement
of Forest Certification (PEFC). The area of certified forests
covered by the two main organizations has steadily
increased since the 1990s to reach about 350 million
hectares in 2010.
A number of barriers to more widespread adoption
of certification have been identified. Two of the most
important of these are the costs of certification (especially
for small forest owners) and the lack of a price premium
for certified forest products in the marketplace. Although
the latter has been noted in almost all developed country
markets for forest products, one benefit of certification
is that it facilitates entry to those markets, where prices
generally may be higher than in countries where there is
no demand for certified forest products.
Although forest certification has so far failed to stimulate
widespread changes in forest management and
harvesting practices in all parts of the world, it remains
an important tool for companies in the forest industry to
demonstrate their commitment to meeting high social
and environmental performance standards. Indeed,
many of the largest forest products companies are
certified and can use this to gain competitive advantage
by differentiating their products and communicating
their superior performance to consumers. One question
that remains unanswered is whether the net benefits
from certification are sufficient to counter the generally
negative perceptions of the industry that have developed
in some places over the last couple of decades.
Industry restructuringOne of the major weaknesses of the forest industry
in recent years has been the failure to translate the
improvements in material efficiency (output of products
per cubic metre of wood used) into higher value-added.
Table 39: Government procurement policies to stop the use of illegal forest products
Country Year of enactment Requirements for public procurement
Netherlands 1997 (revised in 2005) Legal and preferably sustainable timber
Germany 1998 (revised in 2007) Sustainable timber
Denmark 2003 Legal and preferably sustainable timber
UK 2004 Legal and preferably sustainable timber
New Zealand 2004 (mandatory in 2006) Legal and preferably sustainable timber
France 2005 Legal and/or sustainable timber
Mexico 2005 Preferably sustainable timber
Belgium 2006 Sustainable timber
Japan 2006 Legal timber (sustainability as factor for consideration)
Norway 2007 Tropical timber excluded
Source:Lopez-Casero, 2008. Note: some other countries are considering similar measures (e.g. Australia).

52 | Chapter 2
For example, Box 7 on page 42 shows that the use
of recovered and recycled fibre has almost doubled
since 1990, but the total value-added per cubic metre
of wood used has only increased by 2 percent over
the same period (Box 10). Furthermore, some parts of
the industry suffer from overcapacity and continue to
expand production despite level or declining product
demand. This is less of a problem for the sawnwood and
panel industry where innovation has, perhaps, enabled
companies to maintain or improve product prices, but it
is a major problem in the pulp and paper industry (Box 11
on page 54).
There are two main routes to consolidation in the
forest industry: first by closing old and inefficient
mills, and second through mergers and acquisitions.
Consolidation through mill closures and extended
downtime started before the current financial crisis,
but accelerated during 2008 and 2009. For example,
seven pulp and paper mills were closed in Finland in
Box 10: Trends in value-added per cubic metre of industrial roundwood production
Figure A: Value-added per cubic metre of industrial roundwood production (in US$ at 2010 prices and exchange rates)
Sources:based on FAO, 2010b and Lebedys, 2008.
Table A: Value-added by forestry operations, sawnwood and panels, and pulp and paper manufacturing
Global production and value added in 2006 (at 2006 prices and exchange rates)
Forestry Sawnwood and panels
Pulp and paper
Pulpwood Non-wood fibre
Recovered paper
Wood production/consumption (million m3)
1 519 998 644 n.a. n.a.
Gross value-added (US$ billion) 110 146 116 10 78
GVA per m3 used (US$) n.a. 146 180 n.a. n.a.
GVA per m3 harvested (US$) 72 89 71 n.a. 47
Value-added in the forestry sector comprises value-added from
forestry (mostly industrial roundwood production), value-added
in woodworking (production of sawnwood and wood-based
panels) and value-added in pulp and paper manufacturing.
Table A shows how value-added per cubic metre of industrial
roundwood production can be calculated.
In 2006, about 1.5 billion m3 of industrial roundwood was
produced, with a total value-added of US$100 billion (US$72 per
m3). About 1 billion m3 (60 percent) was used for sawnwood and
panel production, generating value-added of US$146 billion. This
is equal to US$146 per m3 of wood used or US$89 per m3 of wood
harvested (taking into account that only 60 percent is used for
sawnwood and panels). Pulp and paper production uses three main
fibre inputs (pulpwood, non-wood fibre and recovered paper) and,
based on their shares in production, value-added from pulpwood
use is US$180 per m3, or US$71 per m3 of wood harvested. In
addition, the use of recovered paper (which originally comes
from wood fibre) generates an additional US$47 per m3 of total
production. Thus, each cubic metre of wood harvested generates a
total of US$279 in value-added in the sector as a whole.
The figure below shows the global trend in value-added
per cubic metre of industrial roundwood production since
1990. The value-added in forestry and woodworking have both
increased slightly over the period (by about 8 percent in total),
but value-added in pulp and paper manufacturing has declined
by about 4 percent (resulting in a total increase of 2 percent).
Thus, although the sector has made considerable improvements
in increasing the volume of products manufactured from each
cubic metre of wood (see Box 7), it has been much less successful
in translating this into increases in value-added.Sources:based on FAO, 2010b and Lebedys, 2008.
Val
ue
add
ed b
y su
bse
cto
r (U
S$)
1990
1991
1998
1992
1999
1993
2000
1994
2001
1995
2002
1996
2003
1997
2005
2004
2006
50
100
150
200
250
300
350
0
Pulp and paper from recovered paper Sawnwood and panels
Forestry Pulp and paper from pulpwood
Developing sustainable forest industries | 53
2008, followed by three more in 2009. Employment was
cut by 9 000 jobs and industrial roundwood use fell
by 20 percent. When market pulp prices increased in
early 2010, two pulp mills were restarted, but the other
mills had either been refurbished and converted to
other uses or dismantled and the equipment shipped to
emerging economies.
Mergers and acquisitions usually remain at a low level
until growth prospects improve and the potential benefits
of such deals become more obvious. Following the
2008–2009 downturn it may take another two years
before large-scale restructuring through mergers and
acquisitions resumes in developed regions. However,
interest in mergers and acquisitions remains high in some
emerging economies. For example, Chinese companies
are active in Viet Nam and the Lao People’s Democratic
Republic and may be seeking stronger collaboration with
other countries in the region. Latin American firms are
also exploring opportunities for restructuring. Aracruz and
Votorantim have already merged their activities to form
Fibria and other high-profile mergers are expected. Stora
Enso and UPM (from Europe) also have some significant
investments in Latin America and plan additional
expansion in the next two to three years.
The desire to acquire or secure raw material supplies is
also driving interest in mergers and acquisitions. Chilean
giants Arauco and CPMP are looking for opportunities in
Brazil and Uruguay, in response to domestic roundwood
supply constraints. Stora Enso and Arauco also bought
ENCE’s forest plantations in Uruguay in 2009 (130 000 ha,
plus an additional 6 000 ha of leased forest plantations)
to add to the 250 000 ha of forests that they already own
in Uruguay. On a smaller scale, an interesting acquisition
was the purchase of most of Sabah Forest Industries in
Malaysia by Ballarpur Industries of India. Wood supply
is a major constraint for India’s forest industry and this
acquisition included a 289 000 ha concession (to the year
2094), which was an important motivation for the deal.
The country reports for FAO’s 51st Advisory Committee
on Paper and Wood Products (FAO, 2010c) provide
further evidence of how some of the ‘old’ producer
countries are starting to restructure their forest
industries. Two examples of the strategies for
restructuring, and the scale and impact of mill closures,
are given below.
• Canada has closed or halted production at its
predominantly old pulp and paper mills with the result
that 39 000 jobs were lost in 2009. Falls were reported
in shipments of newsprint (down 27 percent), graphic
paper (21 percent) and market pulp (10 percent).
Under its ‘BioPathways’ project, the forest industry is
examining the potential to develop new sawnwood and
building systems, new value-added wood products and
to transform pulp and paper mills into biorefineries that
can produce bioenergy, valuable chemicals and high-
performance fibres for advanced applications.
• In Germany, the paper industry is undergoing
restructuring in three ways. The first is a shift in
production away from graphic papers (which are
oversupplied) towards the more attractive packaging,
speciality papers and personal care (tissue)
segments. The second is a move towards increasing
competitiveness in the small and medium-sized
industries, which must either focus on market niches
or expand scale. The third is through the different
impacts of climate change policies and trading
systems (e.g. the EU Emissions Trading Scheme)
on companies that have or have not invested in low
carbon technologies such as biomass boilers. Carbon
costs for biomass-based plants will be lower than for
fossil fuel plants, especially those that use coal. In
terms of more general trends in Europe, CEPI reported
that newsprint output fell by 12 percent, woodfree
graphic papers by 15 percent, mechanical papers
by 19 percent and packaging grades by 6 percent
in 2009. Chemical pulp output also decreased by 11
percent.
In addition to the emphasis on cutting costs and
production during periods of consolidation, the forest
industry needs to change the predominant business
model towards one that will provide a more sustainable
future for the industry. In particular, the current focus
on low-cost, high volume commodity production has to
change and move towards multiple products with higher
value-added, greater flexibility and more resilience to
market fluctuations.
The current financial crisis is limiting investment in many
of the countries where forest industry consolidation is
needed most desperately. However, as the examples
above and in previous sections have shown, it appears
that both governments and industry are now interested
in a transformation to a more profitable and sustainable
forest industry, with innovation as a major driver of future
competitiveness. It is to be hoped that this interest will be
maintained when economies fully recover, and that the
industry will be able to implement such a transformation
as part of future consolidation.
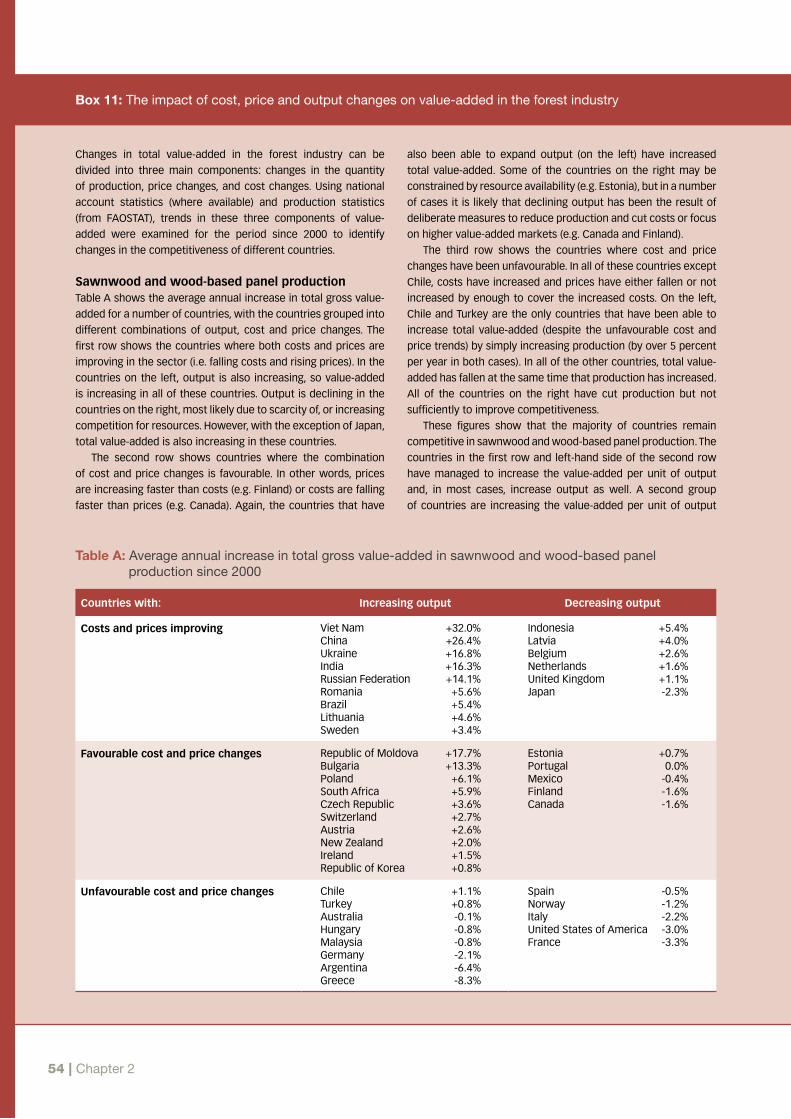
54 | Chapter 2
Box 11: The impact of cost, price and output changes on value-added in the forest industry
Changes in total value-added in the forest industry can be
divided into three main components: changes in the quantity
of production, price changes, and cost changes. Using national
account statistics (where available) and production statistics
(from FAOSTAT), trends in these three components of value-
added were examined for the period since 2000 to identify
changes in the competitiveness of different countries.
Sawnwood and wood-based panel productionTable A shows the average annual increase in total gross value-
added for a number of countries, with the countries grouped into
different combinations of output, cost and price changes. The
first row shows the countries where both costs and prices are
improving in the sector (i.e. falling costs and rising prices). In the
countries on the left, output is also increasing, so value-added
is increasing in all of these countries. Output is declining in the
countries on the right, most likely due to scarcity of, or increasing
competition for resources. However, with the exception of Japan,
total value-added is also increasing in these countries.
The second row shows countries where the combination
of cost and price changes is favourable. In other words, prices
are increasing faster than costs (e.g. Finland) or costs are falling
faster than prices (e.g. Canada). Again, the countries that have
also been able to expand output (on the left) have increased
total value-added. Some of the countries on the right may be
constrained by resource availability (e.g. Estonia), but in a number
of cases it is likely that declining output has been the result of
deliberate measures to reduce production and cut costs or focus
on higher value-added markets (e.g. Canada and Finland).
The third row shows the countries where cost and price
changes have been unfavourable. In all of these countries except
Chile, costs have increased and prices have either fallen or not
increased by enough to cover the increased costs. On the left,
Chile and Turkey are the only countries that have been able to
increase total value-added (despite the unfavourable cost and
price trends) by simply increasing production (by over 5 percent
per year in both cases). In all of the other countries, total value-
added has fallen at the same time that production has increased.
All of the countries on the right have cut production but not
sufficiently to improve competitiveness.
These figures show that the majority of countries remain
competitive in sawnwood and wood-based panel production. The
countries in the first row and left-hand side of the second row
have managed to increase the value-added per unit of output
and, in most cases, increase output as well. A second group
of countries are increasing the value-added per unit of output
Table A: Average annual increase in total gross value-added in sawnwood and wood-based panel production since 2000
Countries with: Increasing output Decreasing output
Costs and prices improving Viet Nam +32.0% China +26.4% Ukraine +16.8% India +16.3% Russian Federation +14.1% Romania +5.6% Brazil +5.4% Lithuania +4.6% Sweden +3.4%
Indonesia +5.4% Latvia +4.0% Belgium +2.6% Netherlands +1.6% United Kingdom +1.1% Japan -2.3%
Favourable cost and price changes Republic of Moldova +17.7% Bulgaria +13.3% Poland +6.1% South Africa +5.9% Czech Republic +3.6% Switzerland +2.7% Austria +2.6% New Zealand +2.0% Ireland +1.5% Republic of Korea +0.8%
Estonia +0.7% Portugal 0.0% Mexico -0.4% Finland -1.6% Canada -1.6%
Unfavourable cost and price changes Chile +1.1% Turkey +0.8% Australia -0.1% Hungary -0.8% Malaysia -0.8% Germany -2.1% Argentina -6.4% Greece -8.3%
Spain -0.5% Norway -1.2% Italy -2.2% United States of America -3.0% France -3.3%

Developing sustainable forest industries | 55
(i.e. ‘favourable costs and price changes’) by reducing production
(e.g. Canada and Finland) or are increasing total value-added by
producing more (e.g. Chile and Turkey). The countries facing the
most problems are those in the third row where the cost and
price trends are unfavourable and the industry has been unable
to cut or refocus production to increase value-added.
Pulp and paper productionTable B shows the same information for the pulp and paper
sector. This shows that both costs and prices are improving in four
countries and production is increasing in another four countries
where the combined cost and price trends are favourable.
Production is declining in Australia and Hungary, but the cost and
price trends are favourable and these countries have increased
total value-added. As in the sawnwood and wood-based panel
industry, Canada has also achieved improvements in value-added
per unit of output (through significant cost reductions), but total
output and total value-added have both fallen significantly.
In contrast to the sawnwood and wood-based panel industry, a
large number of countries appear in the third row, including many
of the largest pulp and paper producing countries. In almost all of
these countries, prices are falling and costs increasing, resulting
in declining value-added per unit of output. A few countries have
managed to increase total value-added in the industry by increasing
production, but many more have not increased total value-added.
Furthermore, the majority of countries that have started to cut
production have not yet managed to restructure their industries
into a position where value-added can be improved.
To some extent the figures below could reflect cyclical
changes in the industry, but this is unlikely to be a major factor
in these results. For example, over each of the three previous
decades, most of these countries managed to increase both total
value-added and value-added per unit of output. A particular
concern is that falling prices (due to reductions in demand) are
a major cause of the declining value-added, yet the majority of
countries are increasing production, putting further downward
pressure on prices. Existing overcapacity in developed countries
combined with rapid increases in capacity in some emerging
economies suggest that significant industry restructuring
and reorientation will be required to overcome the currently
unfavourable trends in costs and prices.Sources:based on FAO, 2010b and Lebedys, 2008.
Table B: Average annual increase in total gross value-added in pulp and paper production since 2000
Countries with: Increasing output Decreasing output
Costs and prices improving Viet Nam +26.5% China +18.4% Argentina +17.9% Bulgaria +15.2%
Indonesia +5.4% Latvia +4.0% Belgium +2.6% Netherlands +1.6% United Kingdom +1.1% Japan -2.3%
Favourable cost and price changes Indonesia +11.8% Romania +8.1% Poland +6.1% Turkey +5.5%
Hungary +2.1% Australia +1.4% Canada -2.6%
Unfavourable cost and price changes Estonia +7.1% Lithuania +6.0% Latvia +2.9% Mexico +2.7% Brazil +1.3% India +0.2% Ukraine +0.1% Germany 0.0% Czech Republic -0.5% Chile -0.7% Switzerland -0.8% Spain -0.9% South Africa -1.2% Austria -2.3% Italy -2.8% Belgium -3.4% Portugal -4.0% Malaysia -5.1% Sweden -6.6% Russian Federation -7.5% Finland -7.6% Ireland -7.6%
Netherlands -2.5% United States of America -2.7% Greece -2.8% Japan -3.2% France -5.5% United Kingdom -5.7% Norway -8.9%

56 | Chapter 2
Summary and conclusionsThe preceding analysis has described the ways in which
different driving forces are shaping developments in the
forest industry, with consequences for the sustainability
of the industry now and in the future. Many of the driving
forces have diverse and sometimes contradictory
impacts. For example, economic growth stimulates
demand for forest products, but also increases
competition for resources; and forest products have
positive environmental attributes but environmental
performance (or perceptions of performance) remains
weak in parts of the industry. However, some of the
most important forces are largely negative (e.g. industry
structure and the maturity of some product markets) and
can only be addressed by changes within the industry.
A number of aspects of forest industry sustainability were
noted in the introduction (including energy efficiency,
reduced waste production and resource conservation,
environmentally compatible materials and safe working
conditions) and current trends in these aspects are
largely positive. Energy efficiency is generally improving
in most regions and most parts of the industry. Resource
efficiency and recycling are also improving and the
industry is making progress in promoting wood products
as more environmentally-friendly than alternative
materials. However, these trends are only improving
when they are measured in physical terms (i.e. volumes
of production). When measured in terms of value-added,
the trends are much less positive and are, in some cases,
declining. This is due to the generally poor performance
of the industry in recent years to increase the value-added
per unit of output.
In some respects, the forest industry is facing challenges
that have already been seen in other manufacturing
sectors. In developed regions, the industry has
significant capital assets and large domestic markets,
but production costs are relatively high and markets
are growing quite slowly, or even declining. In contrast,
markets in emerging economies are growing rapidly and
production costs are generally lower, with the result that
much new investment is being directed towards these
countries (further increasing their competitiveness). The
result of this is overcapacity in many emerging economies
and a generally negative outlook for prices, profitability
and value-added both globally and especially in many
developed countries.
As other industries have discovered, the solution to this
challenge is consolidation and restructuring, to reduce
overcapacity and reorient production into areas where
each country is most competitive. The industry has been
aware of the need for this for some time but, with the
recent financial crisis, it seems at last to be moving in
this direction. Innovation and the development of new
partnerships with firms outside the industry appear to be
important features of current restructuring efforts. Product
innovation creates new markets that help to reduce
overcapacity in existing markets and help to reduce the
dependence of the industry on a few end uses. Some of
the emerging partnerships are also bringing a number of
benefits, such as improved access to finance, risk-sharing
and new marketing opportunities. The main strength that
the forest industry brings to these partnerships is its ability
to manage and develop the raw material supply.
Governments are trying to improve sustainability in
the forest industry in a number of ways. They continue
to encourage the industry to improve its social and
environmental performance, with a strong emphasis
on policies and regulations related to wood supply and
industrial emissions. Governments are also assisting the
industry to improve competitiveness by funding research
and development, facilitating the formation of industry
clusters and partnerships, and providing support for
wood promotion activities.
The overall outlook for the forest industry is one of
continued growth with some significant changes in the
future. The existing structure and location of the industry
are not in line with the main economic driving forces,
so new investment and production will continue to shift
towards emerging economies. In the countries that can
no longer compete with these emerging economies,
restructuring of the industry is likely to be a major
change. Although the outlook is uncertain, this is likely
to result in a greater focus on products that meet high
environmental performance standards and new products
such as bioenergy, biochemicals and biomaterials. It is
promising that a number of companies and countries are
already actively pursuing these opportunities.

3

58 | Chapter 3
Adaptation measures in the forestry sector are essential
both to climate change mitigation and for underpinning
sustainable development. Without adaptation measures,
the impacts of climate change are likely to affect forest
dependent people in poorer countries more severely than
the populations of developed countries. This chapter also
discusses ways in which adaptation measures can – and
should – be more closely integrated into climate change
policies and actions.
Never before have forests and the forestry sector been
so politically prominent. This is a unique moment in
time. The forestry sector and the billions of people who
depend on forests for their livelihoods have much to gain
by using existing political support and emerging financial
opportunities to take appropriate action.
Forests in the Kyoto ProtocolThe world’s forests store an enormous amount of carbon
– more than all the carbon present in the atmosphere.
The inclusion of forests, and of land use, land-use change
and forestry (LULUCF) in the Kyoto Protocol was the
subject of intense debate throughout negotiations on the
Protocol. Indeed, forests and LULUCF were not definitively
addressed until 2001 under the Marrakesh Accords.14 These
forest functions in the carbon balance are addressed by
three Kyoto Protocol activities: afforestation/reforestation;
deforestation; and forest management. Countries report on
the changes to carbon stocks in managed forests that result
from these three types of activities.
Forests play a crucial role in climate change
mitigation and adaptation. Under the
Kyoto Protocol,12 forests can contribute to
emissions reductions of Annex B countries
(which are generally developed countries)
to the Kyoto Protocol. Developing countries
may participate in afforestation and reforestation
activities under the Kyoto Protocol’s Clean Development
Mechanism (CDM)13 to offset global emissions. Further
mitigation options related to reducing emissions from
deforestation and forest degradation (REDD) and
enhancing forest stocks are proposed in a possible
future agreement under the UN Framework Convention
on Climate Change (UNFCCC). This chapter considers
forest-related issues as they relate to countries’ efforts
to meet their commitments under the Kyoto Protocol, as
well as further developments under the UNFCCC.
The use of forests for climate change mitigation also
poses a number of unique problems. For instance, the
ownership of forest carbon is recognized as an important
issue that countries need to address. Concerns have
emerged over the long-term financial benefits, and
ownership of these benefits by the communities involved
in forest mitigation activities. Unclear or inequitable
forest carbon ownership or land tenure can constrain the
implementation of climate change policies and actions.
The latest trends in forest carbon law and policy, and
mechanisms for defining carbon ownership and the
transfer of carbon rights are presented in this chapter.
3The role of forests in climate change adaptation and mitigation
12 According to the United Nations Framework Convention on Climate Change (UNFCCC), “the Kyoto Protocol is an international agreement linked to the UNFCCC. The major feature of the Kyoto Protocol is that it sets binding targets for 37 industrialized countries and the European Community for reducing greenhouse gas (GHG) emissions. These amount to an average of five per cent against 1990 levels over the five-year period 2008–2012”. (http://unfccc.int)
13 According to the UNFCCC, “the Clean Development Mechanism (CDM), defined in Article 12 of the Protocol, allows a country with an emission-reduction or emission-limitation commitment under the Kyoto Protocol (Annex B Party) to implement an emission-reduction project in developing countries. Such projects can earn saleable certified emission reduction (CER) credits, each equivalent to one tonne of CO2, which can be counted towards meeting Kyoto targets”. (http://unfccc.int)
14 The Marrakesh Accords, according to the UNFCCC, include rules for LULUCF activities consisting of three main elements: “A set of principles to govern LULUCF activities; definitions for Article 3.3 activities (forest sinks) and agreed activities under Article 3.4 (additional human-induced activities); and a four-tier capping system limiting the use of LULUCF activities to meet emission targets”. (http://unfccc.int)

The role of forests in climate change adaptation and mitigation | 59
In 2010, Annex B Parties of the Kyoto Protocol
submitted their annual data on greenhouse gas
emissions (GHG) for the year 2008 (Table 40). These
data provide a clear indication of the role of forests in
the carbon cycle and also of the new financial value
that forests have through carbon markets. The data
also indicate that forests in the Russian Federation
absorb almost half a billion tonnes of CO2 equivalent
per year, primarily through forest management
activities. Japan’s forests offset over 29 million tonnes
of CO2 equivalent. If all of this could be sold on the
market, assuming a price of US$20 per tonne of CO2
equivalent, it would be worth a total of US$600 million
per year.
The value of forests in developed countries (Annex
B Parties to the Kyoto Protocol) is an indication of
the potential magnitude of emissions offsets if all the
world’s forests were to be included in a new agreement
on climate change, a subject under discussion in
current UNFCCC negotiations. The new financial value
that forests in developed countries have gained within
the climate change market has still not been fully
accounted for, although this may change depending
on the way in which developing countries’ forests are
considered in climate change projects and processes.
At the global level, the Fourth Assessment Report
of the Intergovernmental Panel on Climate Change
(IPCC, 2007) indicated that global forest vegetation
contains 283 Gt of carbon in biomass, 38 Gt in dead
wood and 317 Gt in soils (in the top 30 cm) and litter.
The total carbon content of forests ecosystems has
been estimated at 638 Gt, which exceeds the amount
of carbon in the atmosphere. As noted in Chapter 1
on regional trends from the Global Forest Resources
Assessment 2010 (FRA 2010), forest biomass has
generally increased in all regions, with Europe including
the Russian Federation containing the largest amount
of biomass.
The role of forest products in carbon storage is
not addressed in the Kyoto Protocol. However, the
contribution of harvested wood products (HWP) to the
global carbon cycle and the possibility of including
this in Annex B countries’ GHG accounting is being
debated in the UNFCCC negotiations on the second
commitment period of the Kyoto Protocol. For
instance, Table 41 shows estimated emissions and
sequestration from the forestry value chain, based on
2006–2007 data.
Table 40. Data on afforestation and reforestation (A/R), deforestation (D) and forest management (FM) activities reported by Annex B Parties under the Kyoto Protocol for the year 2008 (in Gt CO2 equivalent)
A/R D FM CO2 balance
Australia -16 948 49 651 32 703
Austria -2 531 1 224 -1 307
Belgium -399 468 69
Bulgaria 1 353 275 1 628
Canada -738 14 643 -11 503 2 403
Czech Republic -272 160 -6 145 -6 257
Denmark -70 35 281 247
Estonia -534 6 600 6 066
Finland -1 077 2 886 -39 935 -38 126
France -13 591 11 926 -84 620 -86 285
Germany -2 615 16 393 -20 441 -6 663
Greece -351 4 -2 052 -2 399
Hungary -1 183 44 -3 885 -5 025
Iceland -102 -102
Ireland 2 763 11 2 774
Italy -1 736 386 -50 773 -52 122
Japan -391 2 431 -46 105 -44 065
Latvia -440 1 674 -23 595 -22 361
Liechtenstein -11 4 -8
Netherlands -547 780 233
New Zealand -17 396 2 910 -14 486
Norway -104 -93 -30 827 -31 023
Poland -3 916 263 -46 865 -50 519
Portugal -4 134 6 877 2 563 -180
Russia -4 093 26 607 -462 469 -439 455
Slovakia 2 426 -10 324 -7 897
Slovenia -2 456 2 385 -10 307 -7 851
Spain -10 276 188 -39 120 -52 279
Sweden -1 576 2 385 -18 606 -17 797
Switzerland -35 82 -855 -808
UK -2 696 452 -10 873 -13 116
Ukraine -1 759 150 -47 718 -49 327
Source:http://unfccc.int/national_reports/annex_i_ghg_inventories/national_inventories_submissions/items/5270.php Note:Belarus, Croatia, Lithuania, Luxemburg, Romania and Turkey did not report on the LULUCF sector.

60 | Chapter 3
As seen in Table 41, there is a potential to increase
carbon storage in wood products. Parties to the UNFCCC
are currently working on a methodology to account for
carbon stored over time in harvested wood products. The
role of HWPs in the carbon cycle is, however, minor when
compared with other forest activities considered under
the UNFCCC. The next section discusses these issues in
greater detail.
Progress on forest-related climate change negotiationsUNFCCC negotiations have focused intensely on forests
because an estimated 17.4 percent of global GHGs come
from the forest sector, in large part from deforestation
in developing countries15 (IPCC, 2007), and because of
the perception, made widespread by the Stern Review
(Stern, 2006) that curbing deforestation is a highly cost-
effective way of reducing GHG emissions. Efforts to
provide incentives to developing countries to better realize
the mitigation potential of forests have evolved from
discussions on avoiding emissions from deforestation
to REDD+ (Box 12). In December 2010, the Conference
of Parties to the UNFCCC agreed on a framework for an
instrument to incentivize REDD+ under a future agreement
to the Kyoto Protocol. This mechanism could play a crucial
role in combating climate change and enhancing broader
sustainable development. REDD+ has drawn the attention
of the highest levels of government from around the world.
While the political spotlight is on forests in developing
countries, the outcome of negotiations underway on
LULUCF will also have a bearing on the achievement of
emissions reduction commitments and forest management
in industrialized countries and countries in economic
transition (the so-called Annex B Parties to the Kyoto
Protocol).
Two ad hoc, time-bound bodies were established under
the UNFCCC to carry out negotiations on REDD+,
LULUCF, CDM and adaptation up to the UNFCCC 15th
COP in Copenhagen in December 2009. In 2010 the Ad
hoc Working Group on Long-term Cooperative Action
under the Convention (AWG-LCA) continued to address
the building blocks identified in the Bali Action Plan:
adaptation, mitigation, financing, technology transfer and
capacity building. The Ad hoc Working Group on Further
Commitments for Annex I Parties under the Kyoto Protocol
(AWG-KP) is addressing emissions reduction commitments
Table 41: Estimated emissions and sequestration in the global forest products industry value chain, 2006–2007
Process Emissions(million tonnes CO2 equivalent/ year)
Direct emissions from manufacturing (Scope 1)
297
Fuel combustion: pulp and paper 207
Fuel combustion: wood products 26
Fuel combustion: converting 39
Methane from manufacturing waste 26
Emissions associated with electricity purchases (Scope 2)
193
Pulp and paper 106
Wood products 49
Converting 39
Wood production 18
Upstream emissions associated with chemicals and fossil fuels
92
Non-fibre inputs: pulp and paper 35
Non-fibre inputs: wood products 22
Fossil fuels: pulp and paper 31
Fossil fuels: wood products 5
Transport 51
Cradle-to-gate 21
Gate-to-consumer 27
Consumer-to-grave 4
Product use -263
Emissions 0
Effect of additions to carbon stocks in paper products in use
-20
Effect of additions to carbon stocks in wood products in use
-243
End-of-life 77
Burning used products 3
Paper-derived methane 176
Effect of additions to carbon stocks in paper products in landfills
-67
Wood-derived methane 59
Effect of additions to carbon stocks in wood products in landfills
-94
Source:FAO, 2010dNotes:Total cradle-to-gate emissions = 622 million tonnes of CO2 equivalent per year (not considering sequestration)Total cradle-to-grave emissions = 890 million tonnes of CO2 equivalent per year (not considering sequestration)Value chain sequestration = net uptake of 424 million tonnes of CO2 equivalent per year, based on estimates of the accumulation of carbon stocks in product pools and an assumption that globally, regeneration and regrowth are keeping carbon stocks stable in the forests the industry relies onNet value chain emissions, cradle-to-grave = 467 million tonnes of CO2 equivalent per year
15 These emissions include those from deforestation, decay (decomposition) of aboveground biomass that remains after logging and deforestation, and CO2 from peat fires and decay of drained peat soils.
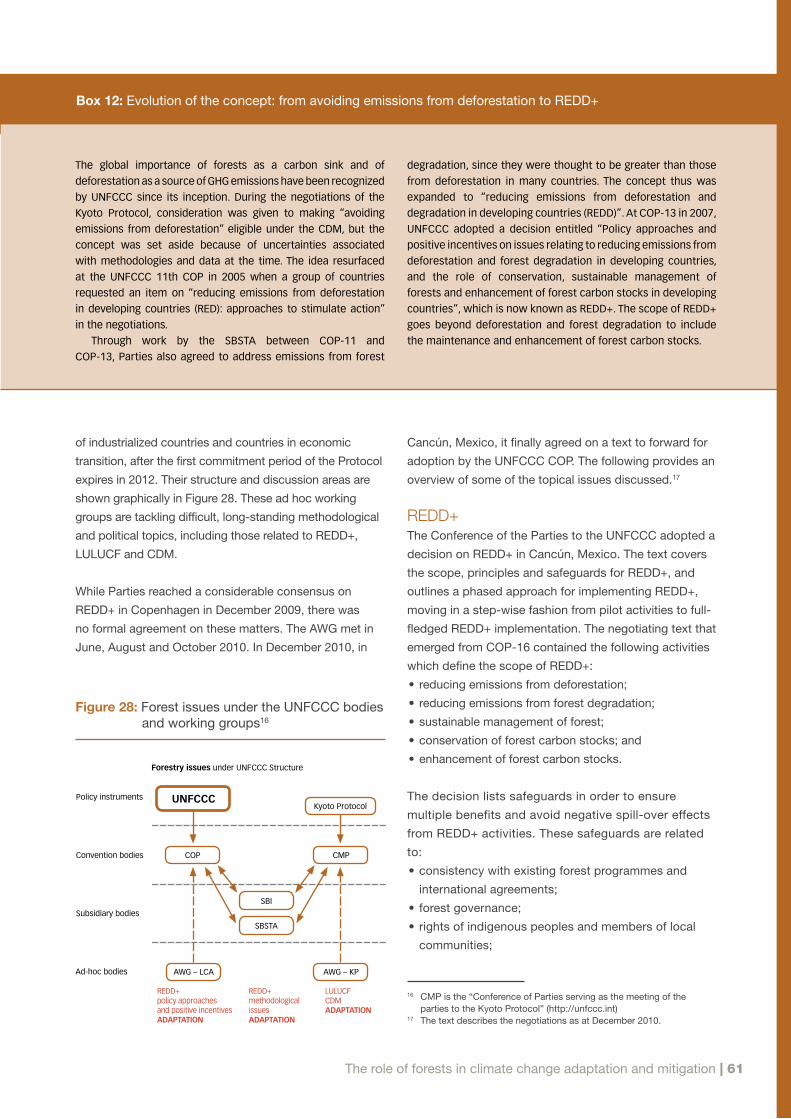
The role of forests in climate change adaptation and mitigation | 61
of industrialized countries and countries in economic
transition, after the first commitment period of the Protocol
expires in 2012. Their structure and discussion areas are
shown graphically in Figure 28. These ad hoc working
groups are tackling difficult, long-standing methodological
and political topics, including those related to REDD+,
LULUCF and CDM.
While Parties reached a considerable consensus on
REDD+ in Copenhagen in December 2009, there was
no formal agreement on these matters. The AWG met in
June, August and October 2010. In December 2010, in
Cancún, Mexico, it finally agreed on a text to forward for
adoption by the UNFCCC COP. The following provides an
overview of some of the topical issues discussed.17
REDD+The Conference of the Parties to the UNFCCC adopted a
decision on REDD+ in Cancún, Mexico. The text covers
the scope, principles and safeguards for REDD+, and
outlines a phased approach for implementing REDD+,
moving in a step-wise fashion from pilot activities to full-
fledged REDD+ implementation. The negotiating text that
emerged from COP-16 contained the following activities
which define the scope of REDD+:
• reducing emissions from deforestation;
• reducing emissions from forest degradation;
• sustainable management of forest;
• conservation of forest carbon stocks; and
• enhancement of forest carbon stocks.
The decision lists safeguards in order to ensure
multiple benefits and avoid negative spill-over effects
from REDD+ activities. These safeguards are related
to:
• consistency with existing forest programmes and
international agreements;
• forest governance;
• rights of indigenous peoples and members of local
communities;
Box 12: Evolution of the concept: from avoiding emissions from deforestation to REDD+
The global importance of forests as a carbon sink and of
deforestation as a source of GHG emissions have been recognized
by UNFCCC since its inception. During the negotiations of the
Kyoto Protocol, consideration was given to making “avoiding
emissions from deforestation” eligible under the CDM, but the
concept was set aside because of uncertainties associated
with methodologies and data at the time. The idea resurfaced
at the UNFCCC 11th COP in 2005 when a group of countries
requested an item on “reducing emissions from deforestation
in developing countries (RED): approaches to stimulate action”
in the negotiations.
Through work by the SBSTA between COP-11 and
COP-13, Parties also agreed to address emissions from forest
degradation, since they were thought to be greater than those
from deforestation in many countries. The concept thus was
expanded to “reducing emissions from deforestation and
degradation in developing countries (REDD)”. At COP-13 in 2007,
UNFCCC adopted a decision entitled “Policy approaches and
positive incentives on issues relating to reducing emissions from
deforestation and forest degradation in developing countries,
and the role of conservation, sustainable management of
forests and enhancement of forest carbon stocks in developing
countries”, which is now known as REDD+. The scope of REDD+
goes beyond deforestation and forest degradation to include
the maintenance and enhancement of forest carbon stocks.
Figure 28: Forest issues under the UNFCCC bodies and working groups16
Forestry issues under UNFCCC Structure
REDD+policy approaches and positive incentivesADAPTATION
REDD+methodological issuesADAPTATION
LULUCFCDMADAPTATION
Policy instruments
Subsidiary bodies
Ad-hoc bodies AWG – LCA AWG – KP
Convention bodies COP
UNFCCC
CMP
Kyoto Protocol
SBI
SBSTA
16 CMP is the “Conference of Parties serving as the meeting of the parties to the Kyoto Protocol” (http://unfccc.int)
17 The text describes the negotiations as at December 2010.

62 | Chapter 3
• participatory approaches;
• conservation of natural resources and biological
diversity;
• permanence of mitigation actions; and
• leakage.
The text recognizes the need for a developing country
to establish several important elements: a national forest
monitoring system, a national strategy or action plan and
a national forest reference (emission) level.
A key issue that remains to be resolved concerns the
financing modality for actions performed (market-based,
fund-based or a mixture of the two). This issue will be
further addressed by the UNFCCC.
SBSTA is addressing the methodological issues
related to approaches to the measurement, reporting
and setting of reference scenarios. Two decisions
were adopted (2/CP.13 and 4/CP.15; see box 13) to
provide guidance on those issues. The REDD+ decision
adopted in Cancún requests SBSTA to work on certain
technical and methodological aspects of REDD+,
including on methodologies for monitoring, reporting
and verification.
LULUCF and CDM under the Kyoto ProtocolNegotiations in the AWG-KP address the rules and
modalities to account for GHG emissions and removals
from LULUCF in Annex B Parties under a post-2012
mechanism. Current proposals to simplify the existing
accounting rules for the first commitment period of
the Kyoto Protocol are still under discussion. Progress
is being made on addressing forest management
accounting provisions, including a proposal to rationalize
and increase transparency in setting possible reference
levels for forest management. The treatment of HWPs
and natural disturbances, particularly extreme events,
are also under discussion within the context of forest
management, as is the voluntary versus mandatory
nature of Article 3.4 additional activities, and the possible
inclusion of more activities (e.g. wetland management).
AWG-KP is also considering broadening the scope
of LULUCF activities that are eligible under the CDM.
Currently, among LULUCF activities, only afforestation
and reforestation are eligible for CDM projects. Proposals
to expand the scope to include REDD, wetlands,
sustainable forest management and reforestation of
‘forests in exhaustion’ are being debated, but Parties
converge only on the need for further technical discussion
before decisions can be made.
Finance for REDD+Although the REDD+ decision adopted in Cancún
does not address the financing modality, REDD+ pilot
activities are being funded. REDD+ has attracted financial
commitments at the highest levels, with many presidents,
prime ministers and their representatives pledging to
take action on REDD+ implementation. Six countries
(Australia, France, Japan, Norway, the United Kingdom
and the United States of America) collectively agreed to
dedicate US$3.5 billion “as initial public finance towards
slowing, halting and eventually reversing deforestation in
Box 13: COP Decisions
COP-13 adopted a decision (Decision 2/CP.13) based on
work by SBSTA to provide some indicative methodological
guidance for the implementation of demonstration projects,
and encouraged Parties to mobilize resources and relevant
organizations to support developing countries on their
activities related to REDD.
COP-15 adopted a decision (Decision 4/CP.15) based on
SBSTA’s work on methodological guidance for REDD+. The COP
decision requested Parties to identify drivers of deforestation
and forest degradation; to identify activities that may result
in reduced emissions or increased removals; to use the most
adopted or encouraged IPCC Guidelines to estimate forest-related
GHG emissions and removals; and to establish national forest
monitoring systems based on a combination of remote sensing
and ground-based forest carbon inventory. Further work on
methodological issues related to monitoring, reporting and
verification (MRV) is required before a REDD+ instrument can
be operationalized. SBSTA is charged with continued work on
MRV for REDD+. The use of any adopted IPCC Guidance has been
recommended for relevant monitoring purposes.
Both decisions encouraged Parties and other stakeholders
to share information and lessons learnt by using a REDD Web
Platform on the UNFCCC web site (http://unfccc.int). COP-16 in
Cancún adopted a decision on REDD+ as part of the outcome of
the work of the AWG-LCA.

The role of forests in climate change adaptation and mitigation | 63
developing countries”. Heads of state delivered similar
messages at other recent meetings, including the Oslo
Climate and Forest Conference held in May 2010. At this
meeting, high-level government representatives agreed to
establish the REDD+ Partnership to take action to improve
the effectiveness, efficiency, transparency and coordination
of REDD+ initiatives and financial instruments, to facilitate
knowledge transfer, capacity enhancement, mitigation
actions, and technology development and transfer.
Together they pledged about US$4 billion to support these
related efforts. Ministers gathered in Nagoya in October
2010 for a special REDD+ Partnership meeting during
CBD COP10 welcomed the achievements of the REDD+
Partnership, including the provision of transparent and
comprehensive information on REDD+ finance, actions
and results through the voluntary REDD+ database. They
also recognized the need to take actions to narrow gaps,
avoid overlaps and maximize the effective delivery of
REDD+ actions and financing.
Important efforts to implement REDD+ activities are now
underway. A key factor in the sustainability of REDD+
projects and activities will be the approach taken to
ensure that the benefits from these projects are equitably
shared by the communities implementing them. This
hinges largely on the extent to which forest carbon rights
can be guaranteed. The following section provides a
snapshot of new and amended legislation related to
forest carbon tenure, and examines the difficulties and
emerging ideas around ownership of, and benefits from,
forest carbon.
Forest carbon tenure: implications for sustainable REDD+ projects In the light of the developments discussed in the
previous section, countries are adopting legal
instruments to regulate carbon forest rights in regulatory
as well as voluntary carbon markets. This could also
stimulate greater investment in REDD+ projects from
public and private project developers if a stronger, more
stable enabling environment guarantees minimum,
appropriate forms of legal protection to contracting
parties. As of 2010, over 37 developing countries
and economies in transition were participating in
programmes such as the United Nations Collaborative
Programme on REDD (UN-REDD) or REDD readiness
programmes under the World Bank’s Forest Carbon
Partnership Facility (FCPF) to improve their ability to
implement REDD activities. Figure 29 shows some of
the countries participating in the UN-REDD programme,
all of which have a high potential to offset carbon
emissions in forest areas.
Despite the promise of REDD+ to provide finance for
forests and contribute to climate change mitigation,
owning an intangible resource such as carbon poses
challenges for traditional property law systems.
Specifically, ownership of carbon property rights and
Source:UN-REDD Programme
Figure 29: UN-REDD programme and observer countries
UN-REDD Pilot Countries UN-REDD Partner Countries

64 | Chapter 3
the role of the government in relation to the recognition
of communities’ customary rights over public lands are
important aspects of sharing the benefits generated by
carbon sequestered by forests, but are often difficult to
assure.
In this context, how can carbon rights be established?
To answer this question, consideration must be
given to whether the property law system in question
considers land and trees, including ecosystem services,
as fundamentally belonging to the state or as wholly
belonging to private land owners. With regard to REDD+,
formal recognition of customary land tenure rights
becomes an issue, in particular if the legal frameworks
of most African, Latin American and Asian countries are
taken into consideration.
A brief review of existing legal frameworks related to
carbon shows how some countries are working to ensure
the benefits of carbon offsets are shared equitably.
A series of examples is also presented to illustrate
current trends and practices in common law and civil
law systems. These cases demonstrate that progress
in securing carbon rights has been slow to date and
many obstacles must be overcome before the benefits
of carbon offsets can be equitably shared in all countries
participating in REDD and REDD+ schemes.
Key legal issues related to forest carbon rights as a new property Usually, forest ownership is associated with land
ownership (Romano and Reeb, 2006). However, because
of its unique and immovable nature, land is frequently
subject to simultaneous uses. Therefore, identification
of land ownership is not always sufficient to ensure
ownership over the carbon stock in a forest (Christy,
Di Leva and Lindsay, 2007). When referring to forest carbon
rights, laws and contracts may distinguish between
sequestered carbon, carbon sinks, carbon stocks and
carbon credits. A comparative analysis of legal frameworks
related to forest carbon rights, summarized below,
shows the latest developments on this front. In particular,
the trend in some common law countries is to use the
category of usufruct rights18 to regulate carbon rights
on forests, distinguishing between forestry covenants,
easements,19 leases and profits à prendre or ‘right of
taking’ as proprietary interests in forest lands. As shown
in the regional examples from Asia and the Pacific below,
legislation has been enacted to transfer carbon rights to
the appropriate owners.
AustraliaAustralian states have introduced legislation recognizing
the right to own carbon sequestered from trees, known
as Carbon Sequestration Rights (CSRs).20 New South
Wales was the first Australian state to develop a legislative
scheme for proprietary validation of forestry carbon
sequestration rights (Hepburn, 2008). The Australian State
of New South Wales has addressed the security and
transferability of carbon rights by enacting legislation that
explicitly establishes property rights in carbon and grants
the holders of these rights a guarantee of access to the
land and the right to obtain injunctions to block land uses
that may affect sinks and forest carbon stores (e.g. New
South Wales, Conveyancing Act of 1919, section 87A &
88AB). The legislation provides a model that goes beyond
a simple statement of ownership to establish a more
sophisticated legal framework for carbon sequestration
(Rosenbaum, Schoene and Mekouar, 2004).
New ZealandIn New Zealand, the Forest (Permanent Forest Sink)
Regulations of 2007 enable the creation of ‘covenants’
for the total amount of carbon stored in a forest sink.
The Ministry of Agriculture and Forestry may enter
into a forest sink covenant with a landowner if certain
conditions are met. Additionally, the Forestry Rights
Registration Act of 1983 no. 42 (September 2006)
regulates forestry rights that may be created by the
proprietor of the land.
VanuatuVanuatu’s Forestry Rights Registration and Timber Harvest
Guarantee Act 2000 (s.6) guides rights over carbon
sequestered based on constitutional and legal provisions,
with different land property rights as well as usufruct rights
pertaining to the land above and below the ground. The
1980 Constitution of the Republic of Vanuatu confers
ownership and use of the land on “indigenous custom
owners and their descendants” (Art. 73 & 74). Customary
owners of the land are considered to be the owners of
carbon rights and are entitled to assign these rights to third
18 Usufruct rights “comprise the range of legal rights and agreements allowing the use of property that belongs to another”. Most national legislation distinguishes between four different types of usufruct rights: easement, lease, profits à prendre and covenants (www.lawcom.gov.uk).
19 An easement is ‘a right enjoyed by one landowner over the land of another’. (http://www.lawcom.gov.uk)20 Each State uses a different term to describe a CSR. In Victoria and South Australia the term used is ‘Forest Property Agreement’; in Queensland they
are identified as ’Natural Resource Products’; Western Australia utilizes the term ‘Carbon Right’; and Tasmania uses the term ‘Forestry Right’.

The role of forests in climate change adaptation and mitigation | 65
parties. The enforceable title would facilitate a transfer of
rights and risks related to carbon sequestration activities in
forests (Holt, O’Sullivan, and Weaver, 2007).
Ownership of property rights in carbon: a separate land interest?The need to secure carbon sequestration rights raises
the question of whether such rights constitute a new
property separate from the land or whether those rights
are associated with the land. This question raises two
major issues. The first concerns the legitimacy of claiming
ownership when carbon is sequestered by forests, and
compensation for the services provided by afforestation
or reforestation activities. The second relates to the
adoption of specific measures that define duties and
liabilities linked to transferable forest carbon rights.
On the one hand, in countries where the government
owns all carbon sequestration potential and there are
no transactions, the state will presumably bear the
risks and losses. On the other hand, if forest carbon
sequestration rights are freely traded on the market,
contracting parties may need to specify who is liable for
the contract obligations. As an additional concern, it has
been noted that separating land tenure rights from carbon
rights could be used as an excuse not to make reforms
to land tenure (Angelsen et al., 2009). While the cases
below explain ways to differentiate carbon rights from
land rights, the long-term implications of these laws and
policies need further consideration.
AustraliaThe legislative scheme in Australia is one of the first
specifically to formalize the separate proprietary
existence of carbon rights within the context of forestry
legislation. Once registered with the appropriate
authorities, the carbon right becomes a separate
interest in the land. The owner of the carbon right
acquires the legal and commercial benefits and risks
arising from carbon sequestration on the specified land
area. Nevertheless, questions remain concerning the
responsibilities and liabilities that may arise as a result
of the intangible nature of carbon property rights. For
example, if the owner of the land sells the subsidiary right
to carbon sequestered in trees on the land, how is the
landowner held responsible for ensuring that activities
carried out on the land will not cause a loss or reduction
of the carbon right?
The Australian Property Institute (New South Wales
and Queensland Divisions) is of the opinion that: “Even
if in some Australian States, there has been partial
crystallization of legal rights in carbon distinguishable
from the elemental land property right, these rights in
carbon remain part of the land based property right”
(Australian Property Institute, 2007). Victoria recognizes
carbon sequestration rights and enables separate
ownership of these rights (set out in the Forestry Rights
Act 1996 of Victoria and 2001 amendments). Greater legal
guidance may be needed if there are different owners of
land and carbon, given the different laws on land-based
property rights in different Australian states.
VanuatuVanuatu’s Forestry Rights Registration and Timber
Harvest Guarantee Act (2000) links a “forestry right”
in relation to land with a “carbon sequestration right
in respect of the land”. It specifies that a “carbon
sequestration right ... in relation to land, means a right
conferred by agreement or otherwise to the legal,
commercial or other benefit (whether present or future)
of carbon sequestration by any existing or future tree or
forest on the land”. These rights rest with the customary
owners of the land and with individuals who hold leases
over land. The Act provides for forestry rights to be
granted through their registration under the Land Leases
Act (Chapter 163). Once granted, the forestry right must
be registered with the Land Records Department. If the
rights are transferred by a lease, they revert to the original
land owners once the lease expires.
Who may own property rights in carbon: government or private parties?A legal framework, consisting of constitutional provisions,
laws, regulations, acts and contracts must clearly establish
the entities permitted to own forest carbon rights. Control
over the trade of carbon rights must be guaranteed in
both regulatory and voluntary carbon markets. In some
countries, only national or subnational governments may
own certain forms of property, particularly in relation to
state lands. Elsewhere, private property rights are more
widely legally protected.
Clarification of ownership is crucial for determining the
parties involved in contracting carbon rights derived
from forests and the beneficiaries of forest carbon
investments. This is especially true in many developing
countries where forest areas are managed under
customary forms of tenure, but exceed the area of
community and indigenous lands acknowledged by
statutory tenure law. In those cases, legal debate may
need to focus on defining the forms of carbon rights that

66 | Chapter 3
are recognized as communal property (Takacs, 2009).
A related aspect would be to assess the government’s
capacity to implement and enforce such rights.
Community forest management agreements (Guyana)
and contracts recognizing indigenous property rights as a
kind of usufruct right (Brazil) are clear examples of ways
in which community rights can be recognized in spite of
the state’s ownership over the land.
GuyanaIn Guyana, the Forest Bill of 2008 (enacted on 22
January 2009), states that: “All forest produce on,
or originating from, public land is the property of the
State until the rights to the forest produce have been
specifically disposed in accordance with this Act or
any other written law” (para. no. 73).21 However, under
paragraph 11, the Guyana Forestry Commission (GFC)
may, on application by any community group, enter
into a legally binding community forest management
agreement with the group concerned, which would
authorize that group to occupy a specified area of state
forest and manage it in accordance with the agreement.
This option is also extended to afforestation agreements
with individuals. Additionally, a forest concession
agreement may be granted to carry out forest
conservation operations in an area, even for commercial
uses. These operations include the preservation of
forests for the purpose of carbon sequestration,
although there are no provisions addressing carbon
sequestration rights. Some provisions may nevertheless
be interpreted extensively in order to include rights
derived from carbon sequestration activities under forest
conservation management agreements.
Brazil Brazil is implementing the National Plan on Climate
Change (launched on 1 December 2008), which aims
to reduce illegal deforestation, and established the
Amazon Fund to encourage reforestation, monitoring
and enforcement of forest laws. Brazil allows a wide
array of entities to own land, while indigenous property
rights are a type of usufruct right (or a legal right to
derive profit from property) recognized by the Brazilian
Constitution of 1988 (Arts. 231–232) (Box 14). While the
federal government maintains expropriation rights for all
subsurface oil or minerals, it is presumed (but not legally
explicit) that whoever owns the rights to use the land
above ground – including private parties and indigenous
groups – also has rights to the carbon.
Once a group is recognized through a formal process
regulated by the Fundação Nacional do Indio (FUNAI,
part of the Ministry of Justice), its members have
exclusive right to use all the goods on the land, even
though the land itself continues to belong to the state.
The Amazonas State Climate Change, Conservation
and Sustainable Development Policy (no. 3135 of
2007) states that the property rights over forest carbon
on state lands are held by the Fundação Amazonas
Sustentáve (FAS) – a new organization created by the
state for this purpose. Brazil does not have a national
Box 14: Brazil – an example of land rights in the Amazon
The current Brazilian Constitution was promulgated on
5 October 1988 and the latest Constitutional Amendment (64)
made on 4 February 2010. The Constitution sets out that:
Art. 231: Para. no. 1: Lands traditionally occupied by
indigenous peoples are those on which they live on a
permanent basis, those used for their productive activities,
those indispensable to the preservation of the environmental
resources necessary for their well-being and for their physical
and cultural reproduction, according to their uses, customs
and traditions.
Para. no. 2 - The lands traditionally occupied by indigenous
peoples are intended for their permanent possession and they
shall have the exclusive usufruct of the riches of the soil, the
rivers and the lakes existing therein.
Para. no. 4 - The lands referred to in this article are
inalienable and indisposable and the rights thereto are not
subject to limitation.
Art. 232: The indigenous peoples, their communities and
organizations have standing under the law to defend their
rights and interests, the Public Prosecution intervening in all
the procedural acts.
21 In Guyana, approximately 76 percent of the total land area is forested and the Guyana Forestry Commission (GFC) is responsible for the management of about 62 percent of the forest classified as State Forest Estate.
The role of forests in climate change adaptation and mitigation | 67
law that specifically addresses the legal ownership
of carbon rights. It is nevertheless expected that the
implementation of the Brazilian Climate Change Policy,
which promotes the development of an organized
carbon market and is overseen by the Brazilian
Securities and Exchange Commission, will encourage
further clarifications of the nature of carbon rights
(Chiagas, 2010).
Costa Rica The Forest Law 7575 of 1996 provides the legal basis
for environmental service payments, which are clearly
defined in the Forest Law as “those services provided
by forest and forest plantations to protect and improve
the environment”. Costa Rica’s legal system does
not address carbon property rights explicitly. Instead,
property rights in natural entities are inferred from
elements of the civil code. The owner of the land also
owns the trees or forest that grows on the land and
the carbon sequestered. The owner can negotiate the
right to sell or manage carbon and can in return reap
the resulting benefits. Article 22 of the Law allows
FONAFIFO (National Fund for Forestry Financing)
to issue forest landowner certificates for forest
conservation (CCBs) which represent payments for
ecosystem services (Costenbader, 2009).
Under FONAFIFO’s auspices, the government may sign
a contract with individual land property owners who
are responsible for managing carbon sequestration.
The property owner gives the government the right
to sell carbon. The government may then bundle
the sequestered carbon into attractive packages for
international investors. Property owners must show
proof of identity, ownership and tax payment with their
application, and provide a sustainable forest management
plan. FONAFIFO checks eligibility requirements through
databases in other government departments, thus
streamlining the process. Groups of property owners
can apply collectively and jointly manage their land
for maximum carbon sequestration. If any pre-existing
usufruct property right exists on a given parcel of land,
the land cannot be included in a new contract. By signing
these contracts, the government implicitly recognizes that
the carbon belongs to the private owner. The government
will own the right to sell the carbon and the right to define
the terms under which the property owner manages
carbon sequestration for the length of the contract. Private
landowners are also free to negotiate their own deals with
foreign investors, as the government does not maintain
exclusive rights to market carbon. Foreigners are able to
own land in Costa Rica and can market their own carbon.
Easements are also possible but only where clear land title
exists (Takacs, 2009).
Mexico Most of the forest land in Mexico is communal land
(or ‘ejido’ in Spanish). The ejido system is a process,
strengthened by the reform of the Mexican Constitution,
whereby the government promotes the use of land by
communities. The land is divided into communal land
and ‘parcelled land’ owned by the community members.
Therefore, in order to be effective, any forestry project has
to consider local communities’ needs. The national legal
framework does not contemplate forest carbon rights
specifically. Nevertheless, private contracts could be
considered as an alternative way to regulate the interests
of the parties. To stipulate a contract, the federal civil
code requires only an agreement between the contracting
parties and the definition of the object. Contracts could be
stipulated between local land owners and buyers of carbon
sequestration rights. To reduce transaction costs, potential
buyers of carbon rights would presumably be encouraged
to invest in projects covering an extended forest area,
implying cooperation agreements among local land owners.
In this case, a contract of sale could be used. The civil
code states that the object of the contract must “exist
in nature”, have a discernable form and have the ability
to be commercialized. Carbon dioxide exists in the
atmosphere and it can be quantified using an agreed
technology, while the intention of the parties to conclude
the agreement is expressed by the contract itself. Private
contracts have the advantage that any stakeholder can
take part in the agreement even if they cannot solve
the technical challenge of establishing the necessary
methodologies to adequately measure the stock of
carbon sequestered (CEMDA, 2010).
Formal recognition of customary law: communities’ rights and land Under international law, and specifically the Indigenous
and Tribal Peoples Convention of 1989, traditional land
ownership is considered as a human right, with an
autonomous existence rooted in indigenous peoples’
customary tenure systems and norms. States have
corresponding obligations to regularize and secure these
traditional ownership rights.
It is now widely recognized that clear tenure rights are
central to achieving social and economic development.
Clarification of tenure rights is also a crucial component of
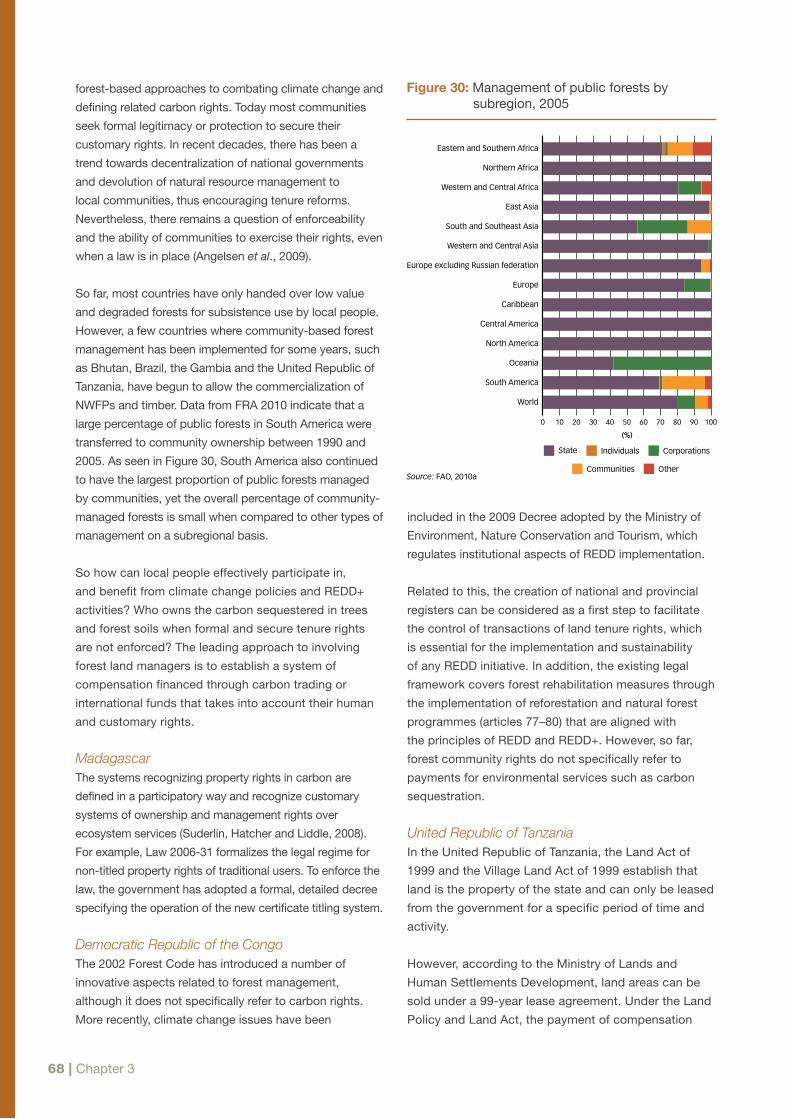
68 | Chapter 3
forest-based approaches to combating climate change and
defining related carbon rights. Today most communities
seek formal legitimacy or protection to secure their
customary rights. In recent decades, there has been a
trend towards decentralization of national governments
and devolution of natural resource management to
local communities, thus encouraging tenure reforms.
Nevertheless, there remains a question of enforceability
and the ability of communities to exercise their rights, even
when a law is in place (Angelsen et al., 2009).
So far, most countries have only handed over low value
and degraded forests for subsistence use by local people.
However, a few countries where community-based forest
management has been implemented for some years, such
as Bhutan, Brazil, the Gambia and the United Republic of
Tanzania, have begun to allow the commercialization of
NWFPs and timber. Data from FRA 2010 indicate that a
large percentage of public forests in South America were
transferred to community ownership between 1990 and
2005. As seen in Figure 30, South America also continued
to have the largest proportion of public forests managed
by communities, yet the overall percentage of community-
managed forests is small when compared to other types of
management on a subregional basis.
So how can local people effectively participate in,
and benefit from climate change policies and REDD+
activities? Who owns the carbon sequestered in trees
and forest soils when formal and secure tenure rights
are not enforced? The leading approach to involving
forest land managers is to establish a system of
compensation financed through carbon trading or
international funds that takes into account their human
and customary rights.
MadagascarThe systems recognizing property rights in carbon are
defined in a participatory way and recognize customary
systems of ownership and management rights over
ecosystem services (Suderlin, Hatcher and Liddle, 2008).
For example, Law 2006-31 formalizes the legal regime for
non-titled property rights of traditional users. To enforce the
law, the government has adopted a formal, detailed decree
specifying the operation of the new certificate titling system.
Democratic Republic of the CongoThe 2002 Forest Code has introduced a number of
innovative aspects related to forest management,
although it does not specifically refer to carbon rights.
More recently, climate change issues have been
included in the 2009 Decree adopted by the Ministry of
Environment, Nature Conservation and Tourism, which
regulates institutional aspects of REDD implementation.
Related to this, the creation of national and provincial
registers can be considered as a first step to facilitate
the control of transactions of land tenure rights, which
is essential for the implementation and sustainability
of any REDD initiative. In addition, the existing legal
framework covers forest rehabilitation measures through
the implementation of reforestation and natural forest
programmes (articles 77–80) that are aligned with
the principles of REDD and REDD+. However, so far,
forest community rights do not specifically refer to
payments for environmental services such as carbon
sequestration.
United Republic of TanzaniaIn the United Republic of Tanzania, the Land Act of
1999 and the Village Land Act of 1999 establish that
land is the property of the state and can only be leased
from the government for a specific period of time and
activity.
However, according to the Ministry of Lands and
Human Settlements Development, land areas can be
sold under a 99-year lease agreement. Under the Land
Policy and Land Act, the payment of compensation
Figure 30: Management of public forests by subregion, 2005
Source:FAO, 2010a
(%)
10 20 30 40 7050 8060 90 1000
Europe excluding Russian federation
Europe
Caribbean
Central America
Oceania
South America
World
North America
Eastern and Southern Africa
Northern Africa
Western and Central Africa
East Asia
South and Southeast Asia
Western and Central Asia
State Individuals Corporations
Communities Other

The role of forests in climate change adaptation and mitigation | 69
by the state to the landowner extinguishes customary
rights to the land, legally passing the right to lease
the land to the state and its derived rights to the new
land owner. The Land Act of 1999 states that “where
a granted right of occupancy exists in any transferred
land or a part thereof, a transferred land shall, unless
the instrument of transfer provides otherwise, operate
‘as a compulsory acquisition of that right of occupancy’
and compensation on it shall be payable”. Conditions
attached by the government include: development
conditions and rights, which include payment of
land rent, development of the area by reforestation,
protection of the boundary, and sustainable use of the
land according to cross-sectoral laws associated with
land management. All of these properties and crops are
detailed in the title deed transfer, including the amount
paid.
BrazilA legal analysis on tribal land ownership was requested
by Forest Trends (a Washington DC-based forest
conservation group) on behalf of the Surui tribe in
Rondônia. A new legal opinion emerging from this
analysis, which was released in December 2009,
states that the Surui tribe own the carbon-trading
rights associated with the forests in which the tribe
is located. This opinion demonstrates that there is an
opportunity for indigenous groups to participate in
emerging markets for carbon trading and could set a
precedent in other countries as well. It also highlights
that the Surui tribe needs to secure financial returns
for carbon sequestered as an environmental service,
and to provide transparent competitive prices for the
commercialization of carbon credits, which would be
in alignment with Brazil’s overall national sovereign
interest.
GuyanaGuyana’s legal framework for forests does not contain
specific provisions on forest carbon rights. However,
as forest areas are traditionally occupied and used by
Guyana’s indigenous people, customary tenure systems
are crucial in determining land ownership.22 Between
2004 and 2007, 17 communities received titles while six
communities secured extensions to their titled lands,
increasing the total number of communities with legally
recognized lands from 74 to 91 and the percentage of
Guyana’s territory owned by Amerindian communities
from approximately 7 percent to about 14 percent. Before
titles were to be granted communities were requested
to submit a description of the area and in-depth
consultations were held.
However, several communities still remain without legally
recognized lands, although many of them have requested
titles. To guarantee land ownership to local communities,
the Constitution of 1980 (as reformed in 1996) states that
land is for social use and must go to the cultivator of the
land (or ‘tiller’ as stated in the Constitution).
The historical stewardship role of indigenous peoples in
protecting Guyana’s forest on their traditional land has
recently been recognized and rewarded through support
for community conserved territories. Based on stable
and inclusive laws such as these, Guyana has been able
to attract finance from donors, most notably through its
Memorandum of Understanding with Norway (Box 15).
Indonesia The 1945 Constitution of the Republic of Indonesia
recognizes the rights of adat communities “as customary
communities”. Article 28I(c) states that the “cultural
identity and traditional rights of adat communities are
respected and protected by the State as human rights”.23
In particular, article 18B(2) of the Constitution sets out
that: “The State recognizes and respects customary
law communities along with their traditional rights”;
however, it limits these rights according to a broad notion
of “societal development”. These articles have been
interpreted as providing the state with a broad right of
control over all land in Indonesia, allowing the state to
subordinate adat rights to the national interest.
Legislation related to carbon rights has been enacted
that authorizes provincial and district governments to
issue permits for the utilization of environmental services,
called Izin Usaha Pemanfaatan Jasa Lingkungan
(IUPJL). The IUPJLs are granted for a term of 30 years
and entitle permit holders to store and absorb carbon
in both production and protection forests. Ministry of
Forestry Decision 36/2009 establishes procedures for
granting IUPJLs (Box 16). Although there is no clear
statement in the regulations to the effect that an IUPJL
for carbon storage entitles the holder to all carbon
22 Amerindians in Guyana number about 55 000 or 7 percent of the population. However, because 90 percent of the Guyanese population lives along the narrow coastal strip, Amerindians represent the majority population in the country’s interior.
23 Indonesian language refers to masyarakat adat, which is translated variously as ‘customary communities’, ‘traditional communities’, or ‘indigenous peoples’. It is estimated that as many as 300 distinct adat legal systems exist throughout Indonesia.

70 | Chapter 3
rights, it is generally accepted that the permit refers
to carbon ownership rights. While these regulations
add some clarity over carbon rights in protective and
productive forests, outside these areas the situation is
unclear (Dunlop, 2009). Nevertheless, communities were
able to successfully influence the outcome of these
developments, in large part as a result of their visibility
in the international REDD+ process and the UNFCCC
negotiations.
Options to integrate carbon rights in a national legal frameworkAs discussed in this section, one approach for allocating
forest carbon ownership is to assign these rights to the
owner of the forest. In cases where there are unclear
land tenure property rights, as is the case in many
developing countries in Africa, Latin America and Asia, the
implementation of REDD programmes may be seriously
limited (Rosenbaum, Schoene and Mekouar, 2004).
As noted in Angelsen et al. (2009), stable land
tenure arrangements will assist in advancing REDD+
implementation, but other key forest governance issues
(e.g. accountability, corruption and transparency) also
need to be addressed. Improved information and
public consultation are necessary, and funding is likely
to be conditional on good governance (an approach
already used by UN-REDD and FCPF, among others) to
encourage devolution of greater rights to communities
and land owners. International policies and guidelines
can also assist in informing these processes; for instance
the concept of ‘free prior informed consent’ should be
considered when dealing with specific groups such as
indigenous people.
Under an alternative approach, carbon stock is subject
to a separate, alienable property right, independent of
ownership of the forest, which would allow the owner to
sell that right without conveying forest ownership. This
may occur through the sale of a right to profit from the land
or ‘right of taking’, governed under land ownership laws
or general property rules, as in the case of CSRs created
by Australian states. Carbon credits separated from land
ownership would facilitate transactions on the market.
Property rights registered on the land title would grant right
holders with remedies against any inconsistent land uses.
Under a different scheme, CSRs may be considered
as a publicly-owned asset, regardless of forest and
land ownership (as in Brazil, Costa Rica, Guyana and
Indonesia). Even where forests are largely privately
owned, the state could manage carbon sequestration
capacity as a public asset or environmental service,
and distribute the benefits to the forest owners or users
(as, for example, in Mexico). National governments
may own the carbon under various different schemes,
but in all cases there are questions about the share
of benefits that need to be returned to forest owners
(Costenbader, 2009). National regulatory frameworks
as well as private contracts represent legal options
through which to negotiate payment for environmental
services transactions linked to carbon sequestration.
Box 15: Guyana – the Low Carbon Development Strategy
On 9 November 2009, President Jagdeo of Guyana and Norway’s
Minister of the Environment and International Development, Mr
Erik Solheim, signed a Memorandum of Understanding, agreeing
that Norway would provide Guyana with results-based payments
for forest climate services of up to US$250 million by 2015. The
Governments of Norway and Guyana believe that this can provide
the world with a working example of how REDD+ might operate for
a High-Forest Low Deforestation (HFLD) country. The Low Carbon
Development Strategy (LCDS) provides the broad framework
for Guyana’s response to climate change and hinges mainly on
Guyana’s use of its forests to mitigate global climate change. The
LCDS builds on the launch in December 2008 of Guyana’s Position
on Avoided Deforestation, which essentially serves as the model
for the Strategy’s development. The key focus areas of the LCDS
are investment in low-carbon economic infrastructure and in high
potential low carbon sectors; expansion of access to services; new
economic opportunities for indigenous and forest communities
and the transformation of the village economy; improved social
services and economic opportunities for the wider Guyanese
population; and investment in climate change adaptation
infrastructure. The third draft of the LCDS, TransformingGuyana’s
EconomywhileCombatingClimateChange, was launched in May
2010 and identifies eight priorities that will be the initial focus of
LCDS implementation 2010 and 2011. This version incorporates
further feedback from national stakeholders and input based
on the outcomes of UNFCCC COP-15 in Copenhagen and other
international processes. Source:Guyana’s Low Carbon Development Strategy website (http://www.lcds.gov.gy/)

The role of forests in climate change adaptation and mitigation | 71
However, in most developing countries, national legal
provisions could be strengthened and effectively enforced
to guarantee benefit sharing from the international to
national and subnational levels.
Governments will need to develop capacities and
mechanisms to attract private investors. In order
to ensure that benefits reach local land owners – in
particular those lacking access to justice – processes for
distributing benefits should be participatory. Provisions
should also guarantee that smallholders and indigenous
communities have access to public information explaining
how to reduce transaction costs (Costenbader, 2009).
As discussed in the analysis of the Mexican legislation,
private contracts can provide the mechanism for parties
to buy and sell CSRs. In general terms, regulatory
schemes for REDD should clearly determine who owns
the right to the carbon sequestered in forests. However,
carbon ownership may either be a separate proprietary
interest, or a proprietary interest linked to forest or land
ownership. There are limitations to both approaches and
further development of legal frameworks at the national
level is necessary to ensure sustainable implementation
of REDD+ schemes.
Strengthening the role of adaptation in climate change policies Managing forest carbon for climate change mitigation
should be seen as part of a larger agenda of adapting
forests, forestry and forest dependant communities to
climate change. Societies have always adapted to climate
variability, built dams or levees for irrigation or flood
control, or developed coping mechanisms for climate
extremes. However, these short-term, often mitigative
approaches cannot ensure environmental sustainability
in the long term. Ignoring adaptation in climate change
policies will therefore undermine mitigation efforts,
especially in sectors such as forestry that rely on services
from biological systems. This section examines the current
treatment of forests in the adaptation dialogue, policies
and actions, and identifies the challenges of integrating
adaptation further into the climate change agenda.
Links to the global talks on mitigationTo date, international instruments for addressing
climate change have had only a modest global impact
on adaptation capacity, in part because of their
understandably heavy focus on mitigation (Glück et al.,
2009). The Nairobi Work Programme (2005–2010) was
set up by UNFCCC to assist all Parties – and especially
developing countries – to improve capacities for
vulnerability and impact assessments, and adaptation
actions. However, substantial funding for adaptation
activities in general, and forest-related adaptation activities
in particular, is still not available. This may change with
the recent organization of the Adaptation Fund of the
UNFCCC. There is a general sense that separating
adaptation from mitigation will further weaken adaptation
capacity (Aldy and Stavins, 2008), and that priority should
be given to activities that can fulfil both objectives.
Although this is a logical goal, mitigation and adaptation
activities have different underpinnings and warrant distinct
support and funding processes. The design of mitigation
policies that explicitly recognize and support adaptation
would offer some middle ground.
An important first step in incorporating adaptation into
mitigation policies is to avoid policies that generate
maladaptation. For example, although conservation of
regulating services provided by forests (e.g. regulation of
floods, erosion and climate) is essential for adaptation,
enforced conservation measures could deprive local
populations in developing countries of their provisioning
services or ecosystem goods (e.g. food, fodder and
livelihoods). Adaptation needs are local and policies
Box 16: Indonesia’s national laws related to REDD
In 2008–2009, Indonesia established the world’s first national
laws relating to REDD. These laws are necessary to clarify the
legal and policy framework needed to attract REDD investment.
Currently three Ministry of Forestry (MoF) regulations and
decisions refer directly to REDD:
• MoF Regulation 68/2008 on REDD Demonstration
Activities;
• MoF Regulation 30/2009 on Procedures for REDD;
• MoF Decision 36/2009 on Procedures for the Granting of
Utilization of Carbon Sequestration or Sinks in Production
Forest and Protected Forest.

72 | Chapter 3
must be designed to ensure that communities are
supported in their capacity to manage local resources
for adaptation purposes (Phelps, Webb and Agrawal,
2010). The maintenance of forests is essential if they
are to be part of communities’ adaptation responses.
Policies that make non-forest land uses more financially
attractive than forest-based activities or environmental
services will increase deforestation pressure and reduce
forest-based adaptation capacity.
Adaptation in national programmesAn analysis of recent National Communications (NCs) and
National Adaptation Programmes of Action (NAPAs) by
the International Union of Forest Research Organizations
(IUFRO) Global Forest Expert Panel on Adaptation
of Forests to Climate Change (Roberts, Parrotta and
Wreford, 2009) reveals that forests are already seen as
an important component of the adaptation response
to climate change. Most developed and developing
countries advocate the use of sustainable forest
management (SFM) as an adaptation measure, and the
concept is often included in national laws. However,
forests generally play a minor role in adaptation policies
compared with other sectors such as agriculture. In
developing countries, notable exceptions are coastal
afforestation in Bangladesh, forest fire prevention
in Samoa and catchment reforestation in Haiti
(Locatelli et al., 2008).
There is also a general recognition that adaptation
of forests to climate change is necessary, with many
specific actions proposed in NCs and NAPAs. In
developed countries, these include measures to increase
landscape connectivity, to enhance ecosystem stability
and resilience, and to manage extreme disturbances
(Roberts, Parrotta and Wreford, 2009). Developing
countries, by contrast, generally have not included the
adaptation of forests to climate change in their NAPAs
(Locatelli et al., 2008).
In developing countries, forest-based policies
and activities related to SFM can provide a strong
foundation for adaptation while meeting REDD+
goals, but in practice their translation into national
policies remains weak. Locatelli et al. (2008) identify
three major challenges that need to be addressed in
order to move forward on this issue. The first is the
strengthening of national institutions that are responsible
for the implementation and monitoring of SFM. For
example, ITTO reported that, while improvements
in implementation of SFM were underway, less than
5 percent of the forest domain under management in its
member states clearly fulfilled the requirements of SFM
(ITTO, 2006).
The second challenge for mainstreaming forest-based
adaptation policies is the establishment of linkages
between adaptation processes and other political
processes relevant to forest management. The issues
involved in the relevant processes vary according to
national circumstances, but in developing countries may
include land tenure, property rights, access to natural
resources, and in some countries, the resettlement of
communities (Box 17). Proper resolution of such related
issues is a prerequisite for the effective implementation of
forest-based adaptation measures.
Box 17: Resettlement affects adaptive capacity
A study of the resettlement of Adigoshu, Globel, Idris and
Menakeya communities to the fringes of Kafta-Sheraro Forest
Reserve in Ethiopia investigated the ways in which the increased
population impacted the management objectives of the reserve.
Traditional uses by the local population involve 23 forest plant
species, 14 of which are harvested as livestock fodder and 10
for timber.
Key observations from the study were:
• The influx of the resettled population resulted in a rapid
increase in forest resource exploitation and destruction,
including increased poaching of large mammalian wildlife
species.
• Escalating demand for grazing land among other needs
brings with it higher risks of conflict, food shortages, habitat
destruction and susceptibility to climate change impacts.
• Overall, illegal occupation, overgrazing, poaching, bush
fires, and woodfuel and timber harvesting posed increasing
threats to forest conservation.
These findings highlight the risks inherent in unplanned internal
displacement of populations for climate change adaptation
measures, and call for an integrated people and environment
approach for future policy and planning to enable communities
to increase forest stocks while securing livelihoods.Source:adapted from Eniang, Mengistu and Yidego, 2008.

The role of forests in climate change adaptation and mitigation | 73
The final, related challenge for developed and
developing countries alike is the need for coordination
among institutions that are involved in the design and
implementation of adaptation or development policies.
Policies aimed at other land-based sectors such as
agriculture and transportation may impact forests by
making alternative uses of forest lands more financially
attractive. Proper communication and planning
among sectors is therefore necessary to enhance the
effectiveness of adaptation and mitigation efforts with
respect to their impact on both international objectives
and the local needs of the population.
Tools for policy developmentA number of approaches have been proposed for
developing adaptation plans and policies. However,
uncertainties in projections of future climate and the
complexity of interactions between forests and climate
preclude a deterministic approach to adaptation. In
order to be effective, policies should be flexible and
encourage experimentation. As an example, CIFOR
has proposed the Adaptive Collaborative Management
process for moving forward with adaptive management
decisions, while taking into account both the
uncertainties inherent in the adaptation process and the
societal dimension of decision-making (CIFOR, 2008a).
By definition, adaptive management involves trial and
error, and is designed to learn from the occasional
failures. As a corollary to this approach, policies that
punish failures could be counterproductive in the design
of adaptation measures.
In broader terms, conceptual frameworks are needed
for scoping out climate change-related issues and
determining adaptation objectives. The Adaptation
Policy Framework (APF) of the United Nations
Development Programme (UNDP) is an example of such
a conceptual framework through which users can clarify
their own priority issues and implement adaptation
strategies, policies and measures from the local to
the national levels. The APF is based on four broad
principles:
• Adaptation to short-term climate variability and extreme
events is used as a basis for reducing vulnerability to
longer-term climate change.
• Adaptation policy and measures are assessed in the
context of development.
• Adaptation occurs at different levels in society,
including the local level.
• Both the strategy and the process by which adaptation
is implemented are equally important.
The APF also links climate change adaptation to
sustainable development and global environmental issues,
and can be used to add adaptation to other types of
projects. It progresses along five steps from the scoping of
the project to monitoring and evaluation of actions.
One of the steps included in all adaptation frameworks is
the assessment of climate change vulnerability. Over the
past few years, the Tropical Forest and Climate Change
Adaptation Project (TroFCCA) of CIFOR and the Center
for Investigation and Teaching of Tropical Agronomy
(CATIE) has been developing and applying an assessment
methodology that could be used within a framework
such as the APF (see Box 18). The TroFCCA framework
is broad so that it can serve as a guide for discussion
during its application to specific cases. It has been
applied by TroFCCA to a number of communities and
projects in the tropics around the world.
In short, frameworks and methodologies exist for
systematically assessing and developing adaptation
policies and plans for action, for doing so at local to
national scales, and for linking such plans and policies
with other development policies and programmes. The
financial resources for adaptation are not unlimited,
and efficiency will build confidence among donor
and recipient communities alike, promoting further
investments and adaptation measures.
Monitoring will be critical at all scales in efforts to
address climate change adaptation. In forestry, remote
sensing is increasingly proposed as a means of filling
some of the monitoring gaps, and methods are being
actively refined, especially as they relate to changes
in forest cover properties (e.g. Hansen, Stehman and
Potapov, 2010). Field inventories will nevertheless
always be needed to assess carbon values and
establish land-use change.
The way forwardIt is impossible to prescribe a proper mechanism for
developing forest-based adaptation policies, given
the variability in local human circumstances and their
interactions with forests. However, past experience
highlights points around which consensus exists.
At the local level, policy-makers can benefit from
the contribution of local populations to the design of
adaptation measures through their intimate knowledge of
the biogeography of their landscapes, and of their local
social capacities. In developed and developing countries
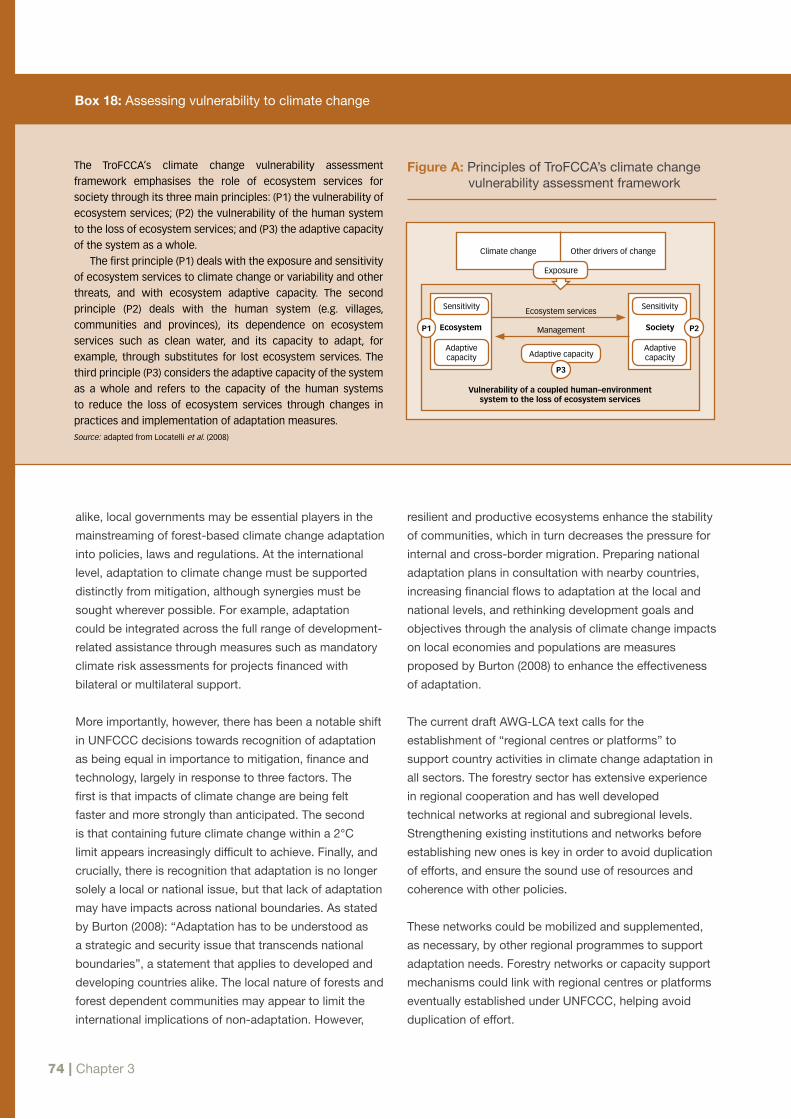
74 | Chapter 3
alike, local governments may be essential players in the
mainstreaming of forest-based climate change adaptation
into policies, laws and regulations. At the international
level, adaptation to climate change must be supported
distinctly from mitigation, although synergies must be
sought wherever possible. For example, adaptation
could be integrated across the full range of development-
related assistance through measures such as mandatory
climate risk assessments for projects financed with
bilateral or multilateral support.
More importantly, however, there has been a notable shift
in UNFCCC decisions towards recognition of adaptation
as being equal in importance to mitigation, finance and
technology, largely in response to three factors. The
first is that impacts of climate change are being felt
faster and more strongly than anticipated. The second
is that containing future climate change within a 2°C
limit appears increasingly difficult to achieve. Finally, and
crucially, there is recognition that adaptation is no longer
solely a local or national issue, but that lack of adaptation
may have impacts across national boundaries. As stated
by Burton (2008): “Adaptation has to be understood as
a strategic and security issue that transcends national
boundaries”, a statement that applies to developed and
developing countries alike. The local nature of forests and
forest dependent communities may appear to limit the
international implications of non-adaptation. However,
resilient and productive ecosystems enhance the stability
of communities, which in turn decreases the pressure for
internal and cross-border migration. Preparing national
adaptation plans in consultation with nearby countries,
increasing financial flows to adaptation at the local and
national levels, and rethinking development goals and
objectives through the analysis of climate change impacts
on local economies and populations are measures
proposed by Burton (2008) to enhance the effectiveness
of adaptation.
The current draft AWG-LCA text calls for the
establishment of “regional centres or platforms” to
support country activities in climate change adaptation in
all sectors. The forestry sector has extensive experience
in regional cooperation and has well developed
technical networks at regional and subregional levels.
Strengthening existing institutions and networks before
establishing new ones is key in order to avoid duplication
of efforts, and ensure the sound use of resources and
coherence with other policies.
These networks could be mobilized and supplemented,
as necessary, by other regional programmes to support
adaptation needs. Forestry networks or capacity support
mechanisms could link with regional centres or platforms
eventually established under UNFCCC, helping avoid
duplication of effort.
Box 18: Assessing vulnerability to climate change
Climate change Other drivers of change
Sensitivity Sensitivity
Adaptive capacity
Ecosystem services
ManagementEcosystem
Vulnerability of a coupled human–environment system to the loss of ecosystem services
Society
Adaptive capacity
Adaptive capacity
P2P1
P3
Exposure
The TroFCCA’s climate change vulnerability assessment
framework emphasises the role of ecosystem services for
society through its three main principles: (P1) the vulnerability of
ecosystem services; (P2) the vulnerability of the human system
to the loss of ecosystem services; and (P3) the adaptive capacity
of the system as a whole.
The first principle (P1) deals with the exposure and sensitivity
of ecosystem services to climate change or variability and other
threats, and with ecosystem adaptive capacity. The second
principle (P2) deals with the human system (e.g. villages,
communities and provinces), its dependence on ecosystem
services such as clean water, and its capacity to adapt, for
example, through substitutes for lost ecosystem services. The
third principle (P3) considers the adaptive capacity of the system
as a whole and refers to the capacity of the human systems
to reduce the loss of ecosystem services through changes in
practices and implementation of adaptation measures.Source:adapted from Locatelli et al. (2008)
Figure A: Principles of TroFCCA’s climate change vulnerability assessment framework
The role of forests in climate change adaptation and mitigation | 75
There are strong synergies in the forestry sector
between adaptation and mitigation. Support for
mitigation activities, could, under many circumstances,
simultaneously support adaptation efforts, and vice versa.
Countries’ climate change strategies should seek to
capture these synergies. With the world rapidly changing
around us, there is neither time nor resources to waste in
the race to adapt.
Summary and conclusionsThe political visibility of forests is at an all-time high.
The forestry sector can capitalize on this to help
attract political and financial support for activities in
climate change adaptation and mitigation. It is crucial
that climate change resources, including funds for
REDD+, LULUCF and adaptation are used to build
the foundation for SFM, which can contribute to
climate change adaptation and mitigation, as well
as the continued delivery of the full range of goods
and ecosystem services over the long term. It will be
essential to ensure that the flow of funds to developing
countries is commensurate with their absorptive
capacity, and building capacities and readiness
activities should be a part of these efforts.
Negotiations under the UNFCCC have helped raise the
profile of forests and forests’ contribution to offsetting
GHG emissions. Although forest management activities
have a high potential to help developed countries meet
their commitments under the Kyoto Protocol, there is a
potentially greater role for developing countries under
new activities such as REDD+. REDD+ is designed not
only to enable developing countries to contribute to a
reduction in emissions under future arrangements to the
UNFCCC, but also to strengthen SFM at local and national
levels. Consensus has formed around the concept of
REDD+ and pilot activities are now underway; however,
outstanding issues on adaptation, CDM, LULUCF, REDD+
methodologies and harvested wood products are still under
discussion in the negotiations.
REDD+ has attracted many interest groups, leading
to increasingly complex demands. Nevertheless, the
economic, social and environmental sustainability of REDD
and REDD+ hinges on a number of factors, including the
issuance of forest carbon rights and the sharing of benefits
from REDD-related activities. Different legal approaches
exist to guarantee forest carbon tenure, as shown in
the examples presented in this chapter. These include
transferring rights directly to the forest owner, selling
carbon rights but not forest rights, managing forest carbon
as a public asset and issuing private contracts.
All countries are faced with the challenges of addressing
vulnerabilities to and impacts of climate change on their
forests and tree resources and on forest-dependent
people. Adopting an adaptive management approach is
one way to facilitate countries’ efforts in climate change
adaptation. A great deal of adaptation and mitigation can
be achieved through full implementation of existing forest
policies, strategies and legislation, and the application
of best practices in forest management. This includes
incorporating climate change into existing national
forest programmes, which serve as the overarching
policy framework for SFM. This is likely to require some
adjustments at policy and field level, and additional
investments.
Climate change clearly poses a new set of challenges
for the forestry sector, but at the same time creates
opportunities. International efforts over the past two
decades to build a common understanding, a policy
framework and a range of tools for sustainable forest
management provide a sound basis for policy-makers
and forest managers to address climate change
effectively.


4

78 | Chapter 4
recommendations to protect and strengthen the local
values of forests highlighted in these three topics. Taken
together, the chapter sections provide a ‘thought starter’ to
explore the theme of local-level forest and forestry issues,
and highlight the importance of recognizing the complexity
of ‘local value’ in all approaches to development.
Traditional knowledge Traditional knowledge is a term that combines the
knowledge, innovations and practices of indigenous
peoples and local communities (Box 19). It provides
the basis for forest livelihoods, and contributes to
traditional cultural and economic practices, subsistence
use and local trade, forest management practices
and the development of commercial products.
Traditional forest-related knowledge falls under the
larger umbrella of traditional knowledge, and includes
knowledge associated with the use and management
of forest species, and the broader understanding and
management of forest ecosystems. This is a brief review
of some of the ways in which traditional knowledge is
used, first commercially and then as part of traditional
management practices, and its links to biological and
cultural diversity. The section concludes with an overview
of current policy processes that seek to protect and
respect the role of traditional knowledge.
The theme ‘Forests for People’ will guide
discussion and debate throughout the
International Year of Forests during 2011.
The theme aims to encompass the role of
people in the management, conservation
and sustainable development of the
world’s forests. A number of subjects relate to this
theme including: traditional forest-related knowledge;
community-based forest management (CBFM); and small
and medium forest enterprises (SMFEs). This chapter
explores these subjects in anticipation of debates during
the Ninth Session of the UN Forum on Forests and other
global activities that will be held in celebration of the
International Year of Forests.
The chapter discusses the local value of forests through
four interlinked sections. The first presents a brief review
of some of the ways in which traditional knowledge (TK)
contributes to local livelihoods and traditional forest-
related practices. The second provides an update on
CBFM and SMFEs, as well as the integral part played by
non-wood forest products (NWFPs) in both. In contrast to
the cash values of forests highlighted by the example of
SMFEs that market NWFPs, the third section takes as its
special focus “the non-cash values of forests”. The final
section provides an overview of future needs and policy
4 The local value of forests
Box 19: What is traditional knowledge?
“Traditional knowledge refers to the knowledge, innovation
and practices of indigenous and local communities around the
world. Developed from experience gained over the centuries
and adapted to local culture and environment, traditional
knowledge is transmitted orally from generation to generation.
It tends to be collectively owned and takes the form of stories,
songs, folklore, proverbs, cultural values, beliefs, rituals,
community laws, local language, and agricultural practices,
including the development of plant species and animal breeds.
Traditional knowledge is mainly of a practical nature, particularly
in such fields as agriculture, fisheries, health, horticulture, and
forestry.”
Source:The Convention on Biological Diversity Traditional Knowledge Information Portal (www.cbd.int/tk)

The local value of forests | 79
The use of traditional knowledgeHistorically, traditional knowledge has played a central
role in the development of commercial products,
including those from the pharmaceutical, seed, herbal
medicine, cosmetic and horticultural industries. In some
industries, the role of traditional knowledge in research
and development programmes has declined in recent
decades, but in others it remains strong; in all sectors,
products derived from traditional knowledge continue to
be marketed (Laird and Wynberg, 2008; Petersen and
Kuhn, 2007).
Despite the economic downturn, sales continue to grow
around the world of herbal medicines, nutraceutical,
functional food and beverage, personal care and
cosmetic products with a traditional knowledge
component (Gruenwald, 2008; Cavaliere et al., 2010).
Virtually all herbal products derive from traditional
knowledge, including perennial top sellers such as saw
palmetto, milk thistle, gingko, goji, ginseng, devil’s claw,
acai, elderberry and echinacea. In 2008 in the United
States of America alone, goji and echinacea generated
revenues of more than US$170 million and US$120
million, respectively (Moloughney, 2009). Many top-selling
products are derived from forests, and the collection and
trade of raw materials continues to significantly affect
forest economies.
Valuable forest tree species include yohimbe and pygeum
in Africa, muira puama and pau d’arco in South America.
The commercial use of these and other forest species
grew directly from traditional forest-related knowledge.
Indeed, ‘ethnic botanicals’ and ‘exotic ingredients’ with
traditional uses are increasingly in demand in Europe
and North America, driving companies to seek out herbal
remedies and flavours based on traditional knowledge
(Gruenwald, 2010). Long histories of traditional use also
benefit products and ingredients ‘new’ to the market,
which tend to receive more rapid regulatory approval
given their proven safety over generations of use
(Gruenwald, 2010).
Recent developments in science and technology provide
new opportunities to research and explore applications of
traditional knowledge within industries such as healthcare,
agriculture and biotechnology. Traditional knowledge
is increasingly consulted as part of efforts to address
broader challenges such as climate change adaptation,
water management, and sustainable agricultural and forest
management. For example, traditional knowledge of fire
management has been used to reduce greenhouse gas
emissions in Western Arnhem Land, Australia (Galloway
McLean, 2009). The IPCC identified traditional and local
knowledge as important missing elements in its previous
assessments, and these will form a focus of work for its
next scientific assessment reports.
Most importantly, traditional knowledge contributes to
the lives of its holders. For example, traditional medicine
provides primary healthcare for much of the world’s
population. It is estimated that in some countries in
Africa and Asia at least 80 percent of the population
depend upon traditional medicine for their primary
healthcare (World Health Organization, 2008). Traditional
forest management, including the manipulation of
forests to favour desirable species and maximize the
range of products and services provided, has sustained
communities in complex and often inhospitable
environments for thousands of years (e.g. Gómez-Pompa,
1991; Posey and Balée, 1989; Padoch and De Jong,
1992). These indigenous silvicultural systems are usually
low input yet effective, the product of hundreds of years
of trial and error, and they employ a range of techniques
in the same way that foresters use selective thinning,
weeding and enrichment planting (Peters, 2000).
Traditional forest management has shaped the structure
and composition of forests around the world, and in many
cases has enhanced biodiversity beyond “that of so-called
pristine conditions with no human presence” (Balée, 1994).
These systems can yield important lessons for forest
managers, loggers, migrant farmers, conservationists
and others seeking to understand complex, biologically
diverse ecosystems, and the relationships between people
and their environment. FAO’s National Forest Programme
Facility (NFP Facility) has been working to highlight the
importance of traditional knowledge and integrate it into
national forest programmes (Box 20).
Traditional management of forested environments affects
the composition of flora and fauna, and the biological
diversity of these areas. Awareness of the link between
cultural practices and biological diversity has grown over
the last few decades into a widespread acceptance of the
concept of ‘biocultural diversity’ (Box 21). This concept
was the result of numerous local-level studies, as well as
broader analyses that identified correlations worldwide
between linguistic, ethnic and biological diversity (Maffi,
2005).
Until recently cultural and biological diversity were
seen as separate disciplines and were the subjects of
80 | Chapter 4
different studies and expertise (Pretty et al., 2010). The
concept of ‘biocultural diversity’ has allowed a broader
movement to coalesce in order to understand the
dynamic relationships between nature and culture, and
to protect biocultural diversity in the face of globalization,
nationalism and unsustainable development (Christensen
Fund, 2010). Increasingly, the protection of cultures is
seen as an integral part of the conservation of biodiversity
(Maffi and Woodley, 2010; Pretty et al., 2010).
Policy measures to protect and respect traditional knowledge In the last few decades, there has been a broader
trend to recognize the land, resource, cultural and
other rights of indigenous peoples. As part of this
process, policy-makers’ attention has been drawn to
the value of traditional knowledge and the need to
receive consent for its use from knowledge holders. It
should be noted that the terms ‘traditional knowledge’
or ‘traditional forest-related knowledge’ have yet to be
fully integrated into global forest policies and sustainable
forest management practices, but has recently been
the subject of much discussion. However, a suite of
global instruments and institutions, negotiated texts and
processes have evolved to address these concerns,
primarily through the Convention on Biological Diversity
(CBD), the United Nations Permanent Forum on
Indigenous Issues and the World Intellectual Property
Organization (WIPO).
Article 8(j) of the CBD requires member parties to
“respect, preserve and maintain” the biodiversity-related
knowledge, innovations and practices of indigenous
peoples and local communities. It also establishes
that the “wider application” of this knowledge should
be promoted with the “approval and involvement
of the holders of such knowledge”. The CBD also
encourages the equitable sharing of benefits derived
from the use of knowledge, innovations and practices
related to the conservation or sustainable use of
biodiversity. Article 10(c) requires that customary uses
of biological resources in accordance with traditional
cultural practices should be protected and encouraged;
information concerning traditional knowledge and
technologies should be included among the information
to be exchanged, and where feasible, repatriated
(Article 17(2)), while technological cooperation between
Contracting Parties should also include cooperation on
indigenous and traditional technologies (Article 18(4))
(CBD, 1997).
These principles are taken further in the 2002 Bonn
Guidelines, which aim “to contribute to the development
by Parties of mechanisms and access and benefit-
sharing regimes that recognize the protection of
traditional knowledge, innovations and practices of
indigenous and local communities, in accordance with
domestic laws and relevant international instruments”
(Secretariat of the Convention on Biological Diversity,
2002, par. 11(j)). An Ad Hoc Open-ended Working Group
on Article 8(j) and Related Provisions provides advice
on the protection of traditional knowledge by legal
and other means, and is undertaking work to identify
priority elements of sui generis systems for traditional
Box 20: The National Forest Programme Facility
The NFP supports the development and implementation of
national forest programmes in its 70 partner countries in three
main strategic directions: i) integrating sustainable forest
management into broader intersectoral processes at the national
level; ii) building consensus at the national level on how to
address issues relevant to forests and trees, in the overall context
of sustainable development; and iii) integrating commitments
made at the international level (e.g. the CBD, UNFCCC and the
UN Convention to Combat Desertification (UNCCD)) into national
forest policy and planning. The NFP Facility focuses in particular
on knowledge sharing and capacity development in the forestry
sector to ensure the informed participation of a broad range
of stakeholders for continuous national forest planning and its
effective implementation and monitoring.
Since 2002, around 30 activities directly related to indigenous
knowledge were implemented by local NGOs selected by
the National Multi-Stakeholder Steering Committees of the
partner countries to document, disseminate, build capacity
and strengthen traditional knowledge on forest management.
In a number of partner countries, the NFP Facility, together
with FAO and other partners, has also provided support to
develop National Forest Financing Strategies (NFFS), and to
train community groups in developing and accessing markets.
Lessons learned from the activities supported by the
NFP Facility can be found on the NFP Facility website:
www.nfp-facility.org/60680/en/.

The local value of forests | 81
knowledge protection, fair benefit-sharing and prior
informed consent.
The 2007 United Nations Declaration on the Rights
of indigenous peoples provides a further important
instrument in support of indigenous peoples’ rights
over their biodiversity-related traditional knowledge,
stating that: “indigenous peoples have the right to
maintain, control, protect and develop their … traditional
knowledge and … the manifestations of their sciences,
technologies and cultures, including genetic resources,
seeds, medicines … [and] knowledge of the properties
of fauna and flora. … They also have right to maintain,
control, protect and develop their intellectual property
over such cultural heritage, traditional knowledge, and
traditional cultural expressions” (Article 31.1).
Traditional knowledge is increasingly also under
consideration in relation to the Agreement on Trade
Related Aspects of Intellectual Property Rights
(TRIPS) of the World Trade Organization. A proposed
amendment to TRIPS – adding a requirement for
disclosure of origin in patent applications and possibly
requiring benefit-sharing with communities to deter
biopiracy – would bring it in line with obligations on
traditional knowledge under the CBD. Intellectual
property rights issues in genetic resources also figure
prominently in the mandate of WIPO, which has set
up an Intergovernmental Committee on Traditional
Knowledge, Genetic Resources and Folklore (IGC).
The IGC gives countries guidance, based on research
and the work of fact-finding missions, on strategies
for the protection of traditional knowledge and genetic
resources (including those in forests).
Some of the measures being adopted to implement these
agreements and guidelines include the development of
biodiversity registers or databases that record biodiversity
use and knowledge in particular regions. These defensive
methods of traditional knowledge protection may be
complemented by the legal recognition of collective
ownership of resources and knowledge, co-ownership of
patents and products, and certificates of prior informed
consent, benefit-sharing and/or origin of the resource or
knowledge in patent applications.
In practice, however, many of these tools and approaches
are still in their early stages and present significant
challenges. Many companies have therefore adopted a
hands-off approach to the use of traditional knowledge,
while others have little awareness of the need to enter
into access and benefit-sharing arrangements when
using traditional knowledge. The diverse ways in which
companies use and interpret traditional knowledge adds
a further layer of complexity. In cases where traditional
knowledge is used, companies typically rely heavily on
intermediary institutions such as research institutions,
NGOs or governments to resolve difficult issues such as
who represents local groups, and how owners of traditional
knowledge are identified, particularly when knowledge
is shared by many communities. The intractable nature
of these and other issues means that projects involving
traditional knowledge are often inherently controversial.
Community-based forest management and small and medium forest enterprises Traditional knowledge can form the basis on which
communities manage forests. At least one-quarter of
the forested land in developing countries is under some
form of community control, and that proportion is likely
to increase (CIFOR, 2008b). Small and medium forest
enterprises (SMFEs) often build on community-based
forest management (CBFM) approaches and contribute
to sustainable livelihoods. Many SMFEs are based
upon materials provided by forests and trees, and such
Box 21: What is biocultural diversity?
Biocultural diversity is “the weave of humankind and nature,
cultural pluralism and ecological integrity. Biocultural diversity
arises from the continuing co-evolution and adaptation
between the natural landscape, ways of life and cultural
endeavours, producing a richness and variety that are
indivisible.” The Christensen Fund, Vision Statement, 2010 (www.
thechristensenfund.org)
“Biocultural diversity is the interlinked diversity of nature and
culture: the millions of species of plants and animals that have
evolved on earth, and the thousands of different cultures and
languages that humans have developed by interacting closely
with one another and with the natural environment.” Terralingua,
Biocultural Diversity Conservation, A Community of Practice
(www.terralingua.org)

82 | Chapter 4
enterprises play an important part in the harvesting,
processing, transport and marketing of wood and non-
wood products. As discussed below, the establishment of
CBFM often stimulates SMFEs.
Some key drivers for community-based forest managementMany forms of CBFM exist, responding to particular
political, social, economic and institutional contexts. In
some countries CBFM arrangements have grown out of
the need for governments to cut the costs of protecting
forest resources. International and local NGOs have
promoted CBFM widely in rural development projects.
The demand for more efficiency in service delivery and
more accountability in the way governments manage
natural resources, coupled with global trends towards
economic liberalization and decentralization, have led to
significant policy shifts in a number of countries. Several
countries have developed enabling policy frameworks,
which support community rights and participatory
initiatives, and have thereby given a greater incentive for
better management and protection of forest resources.
DecentralizationA number of governments have recently launched public
sector reform programmes that divest central government
departments, including forestry, of some authority.
Forestry administrations have been decentralized, in a
bid to increase efficiency and accountability in service
delivery. Some governments have abandoned the more
protectionist approach to forest management, and have
shifted responsibility for forest use and management to
lower-level local government, traditional institutions and
local communities.
However, decentralization often happens on a
piecemeal basis. Many times, central government
retains substantial control, and imposes conditions
for the local management of forest resources. There is
limited devolution of power, rights and finance to local
government and communities. Often the responsibility of
traditional cultural institutions is poorly outlined in guiding
instruments, creating a clash of mandates. All these
factors stifle the realization of the full potential of CBFM.
Enabling policy frameworksChanges in the political landscape at the country level
may lead to policy and institutional reforms in forest
governance systems to support decentralized forest
management. However, forest tenure – so important
for ensuring equity and rights for forest dependent
communities – has rarely so far been fully reformed.
More frequently, a partial modification is seen. For
instance in Nepal, the current basis of community forestry
was formalized under the Forest Act, 1993. Forests
remain formally government-owned but permanent
use rights are allocated to communities, subject to
agreements over management arrangements. Under
the community forestry programme approximately 30
percent of total national forest has been handed over
to forest user groups for management and utilization
(FAO, 2011). This has produced significant gains to the
local communities (Box 22).
In Liberia, the new forest law of 2006 and the law
on communities’ rights (currently undergoing the
approval process) grant grassroots communities
the possibility of owning forests and participating
in their management through Community Forestry
Box 22: Importance of an enabling policy framework in achieving the objectives of tenure reform
One of the by-products of forest tenure reform has been the
substantial increase in trees on private farm land in Nepal (in
addition to improvements in community forests). In 1987,
regulations that were intended to conserve trees on private land,
were approved and required farmers to obtain permits to harvest
and/or transport trees from their private land. These regulations
had the perverse effect of acting as a disincentive for private
tree planting or protection. In fact, the announcement of the
regulations before they came into effect encouraged much tree
cutting while it still remained acceptable. When these regulations
were removed to create a more enabling regulatory framework
for community forestry, farmers responded by allowing naturally
occurring tree seedlings to survive and by planting commercially
desirable seedlings. Many parts of the middle hill region in Nepal
are now covered by a mosaic of community forests and trees on
private land. The increase in commercial timber from communal
and private lands has spawned a network of private sawmills
processing the timber purchased from forest user groups and
private farmers.Adaptedfrom FAO, 2011

The local value of forests | 83
Development Committees (CFDC). The Committees
will be mandated to negotiate with logging companies.
Communities are entitled to 30 percent of the income
generated by the lease of forests under license, and
loggers will also have to pay US$1/m³ directly to the
relevant community (Bodian, 2009).
Forest tenure studies reviewed by FAO (2011), emphasize
that while security of tenure may be necessary to achieve
sustainable forest management and improved livelihoods,
it is not in itself sufficient. Other factors, including better
governance and appropriate regulatory frameworks, are
equally critical.
National poverty reduction agendasA number of developing countries have in place
national development plans and strategies with poverty
reduction as the overarching objective, as part of Poverty
Reduction Strategy Processes initiated by the World
Bank. Some countries – including Bhutan, the Gambia,
Turkey and Uganda among others – have identified
forestry as one of the key drivers of socio-economic
growth, and have integrated forest management into
the national poverty reduction strategies. Key national
forest policy and planning instruments in these countries
recognize a diversity of stakeholders in the forest
sector, and have moved towards a more people-centred
approach and adopted CBFM as one of the major options
for stimulating development in rural areas.
Emerging grassroots and global networks In recent years, there has been an increased level of
organization of local forest dependent communities
into groups, associations, alliances and federations. In
many countries, community forest user groups have
progressively transformed into associations and forest
user cooperatives. These associations have further
created alliances at regional level and international
federations. Their goal has been to address the
powerlessness and low bargaining power which makes it
difficult to use forests productively.
With facilitation of national, regional and international
NGOs, and initiatives such as the Growing Forest
Partnership (GFP), these associations have created
stronger regional chapters and are active internationally.
For example, the International Alliance for Indigenous and
Tribal Peoples of Tropical Forests (IAITPTF) and the Global
Alliance for Community Forests (GACF), in partnership
with the International Family Forest Alliance (IFFA) have
consistently demanded better community forest rights in
international fora. They are also mobilizing local people’s
efforts to engage in commercial enterprise development
and marketing, an area that will take CBFM to another
level.
Impact of community-based forest management on local communitiesA number of benefits from CBFM can be seen over the
long term. These include improved forest conservation
and management benefits, growth of community
institutions and social capital, and contributions to
poverty reduction.
Conservation benefits may take a long while to be
realized. In the case of Nepal, CBFM took a long time to
transform the rehabilitated landscapes (FAO, 2011). In the
Gambia, decentralization has led to the re-establishment
of customary forest resource management laws, which
have enabled the protection of forest species. In the
Bonga forest in Ethiopia, illegal timber-harvesting,
firewood marketing and charcoal production have been
contained over the years through regulated access and
forest development work by the communities (Farm
Africa, 2002). Studies in the United Republic of Tanzania
(e.g. Kajembe, Nduwamungu and Luoga, 2005) show a
remarkable increase in the density of saplings and trees
following the launch of community-based management
regimes. In India, studies also indicate an increase in
productivity and diversity of vegetation following the
introduction of CBFM (Prasad, 1999).
For CBFM to play a significant role in poverty reduction,
several factors need to be favourable, including the
policy context, the nature and diversity of forestry
products accessible to them, community management
capacity and the availability of infrastructure to support
production, processing and marketing. In countries where
CBFM has been developing for a long time – for instance
the Gambia, India, Nepal and the United Republic of
Tanzania – tangible benefits are being realized. Over
time, as forests become more productive, SMFEs begin
to emerge in the form of small saw mills, carpentry and
joinery workshops, craft making, honey processing
and herbal medicine processing. This has created
employment for women and young men and allowed
poor households to generate additional cash income.
Small and medium forest enterprise developmentSmall and medium forest enterprises consist of
individual, household, and community entrepreneurs as

84 | Chapter 4
well as associations of actors along the supply chain.
For these enterprises, forests and trees are important
sources of cash income and employment.
There are numerous examples of successful SMFEs
producing timber and processed timber products. In the
Petén, Guatemala, a multidonor funded project assisted
the local community enterprise FORESCOM (Empresa
Comunitaria de Servicios del Bosque) to generate a
48 percent increase in revenue after one year. The
purpose of the project, which was overseen by the ITTO,
was to promote the commercialization of lesser-known
species in national and international markets and to
achieve certification of these products. FORESCOM’s
revenue increased largely because of improved
outreach and marketing internationally, and resulted in
its products entering Hong Kong SAR, the Netherlands
and the United States of America. The 11 communities
working with FORESCOM were able to improve their
social and economic conditions while contributing to the
conservation of tropical forests in the area.
SMFEs are also important suppliers of many NWFPs such
as rattan and bamboo, medicinal plants, forest insects,
fruits, nuts and game meat. These products are sold in
raw, semi-processed and processed forms. The provision
of environmental services, such as recreation, is another
area in which SMFEs are gradually becoming more
involved. In fact, SMFEs often make up 80–90 percent of
enterprise numbers and more than 50 percent of forest-
related jobs (MacQueen, 2008).
Sustainable SMFEs can bring positive economic, social
and environmental impacts, and make a significant
contribution to economic development. A number of local
case studies in Latin America, Asia and Africa (see Box 23)
show the major contribution of cooperatives and SMFEs
to economic development.
Small-scale enterprises have certain micro-economic
characteristics that are known to generate a ‘multiplier
effect’ of increased economic benefits in rural economies,
resulting in higher incomes, higher consumption
and improved terms of trade (Elson, 2010). The UK
Department for International Development-funded
Livelihoods and Forestry Programme (LFP) in Nepal
(Livelihoods and Forestry Programme, 2009) suggested
this effect24 in the country was approximately 10:1, while
analyses in other locations estimate this multiplier effect
to be as high as 20:1 (GEF, 2009). It is estimated, albeit
roughly, that forest communities produce US$75 billion to
100 billion per year in goods and services (Elson, 2010).
Rural economic growth involving local people brings
about many consequent social improvements. Additional
income is commonly invested in education and health
24 One dollar introduced into a system (e.g. a rural village) should generate much more than a dollar in economic benefits, in terms of cash and jobs created. The dollar changes hands a few times before it is eventually spent outside the community. In the case of the LFP project in Nepal, if one accounts for the money spent by the donor (an upfront cash injection into the community), and the rise in average and median incomes, the multiplier effect is at least a factor of ten. The nature of the stimulus is more important than the amount. For instance, natural resource extraction generates very few multiplier effects at source but agricultural extension or community-based forestry tends to raise skill levels, and creates more value addition, higher retention of surplus and greater multiplier effects (Elson, 2010).
Box 23: Importance of apiculture in Cameroon
Apiculture products include honey (Apis mellifera), wax and
propolis, all of which are NWFPs. Apiculture products have
many medicinal and cosmetic uses and are traded at the local,
national and international levels, making them an important
contribution for livelihoods in both rural and urban areas in
Cameroon.
Despite incomplete data about the sector, it is estimated that
3.3 million litres of honey are produced in Cameroon annually,
valued at around 2 000 million FCFA (about US$3.7 million).
Approximately 10 percent is consumed by the beekeepers.
With an estimated value of 530 million Central African CFA
Francs (FCFA), about 235 tonnes of wax are produced annually,
primarily for regional export. Other apiculture products add
about 1.5 million FCFA to total revenues from the sector
annually. It is estimated that there were at least 20 000
beekeepers in Cameroon in 2009. More than 8 600 beekeepers
were known to be members of 639 groups (Common Initiative
Groups, cooperatives or NGOs) in 2008. In the northwest of the
country, a major apiculture dependent region, beekeeping is
an important secondary source of income, contributing from
10 percent to 70 percent of total annual income (average of
30 percent), with over 80 percent of beekeepers deriving
30–60 percent of their annual cash income from apiculture.Source:CIFOR, 2010

The local value of forests | 85
services. Many rural people who develop enterprises
may also eventually use surplus income to transition
from agriculturalists to food purchasers, allowing more
time to participate in local social and political activities.
Communities that grow economically tend to be more
active in political decision-making (Elson, 2010).
Widespread evidence demonstrates that private
property holders, including those with communally-held
property rights, can and do protect public goods if the
appropriate incentive structure is in place (Elson, 2010).
Rural communities are estimated to own, or administrate
under license, no less than one quarter of forests in
developing countries, and annually invest US$2.6 billion
globally in conservation, an amount that surpasses
public sector funding and all forms of international
conservation expenditure combined (Scherr, White and
Kaimowitz, 2003).
Creating an enabling environment for and encouraging investments in SMFEsEnabling, maintaining and improving forest-based
economic initiatives at the local-level requires
a combination of several elements. An enabling
environment consists of supportive policies, access
to finance, tailored services and markets, and secure
forest access and tenure – all crucial for the initial steps
in local forest enterprise development (Box 24). Actions
to add further value will in many cases increase income,
while capacity development improves the sustainability
of the enterprises (Box 25).
Similar to the preconditions for community-based forest
management, SMFEs require stable policy frameworks,
coordination in decision-making among stakeholders,
and access to land and tenure rights. However, SMFEs
also require continued access to finance and markets,
up-to-date technology and means by which to improve
the quality of their products in order to be successful.
Moreover, as SMFEs increasingly depend on the
production of NWFPs as the source of their products,
improved NWFP management, appropriate policies
and adequate legislation are required to ensure these
enterprises continue to have a sound resource base.
Non-wood forest product law and policy25
As noted earlier, non-wood forest products play a critical
role in community forestry and SMFEs. Non-wood
forest products are used as medicines, foods, spices
and for a multitude of other purposes. They provide
critical subsistence and trade goods for forest and other
communities, and in many areas are the main source
of cash to pay school fees, buy medicines, purchase
equipment and supplies, and to buy food that cannot
25 This section is drawn from Laird, McLain and Wynberg, 2010.
Box 24: Key factors for an enabling environment and sustainability for SMFEs
Key factors for an enabling environmentNational and local institutions that recognize the value of
forest products including NWFPs for resource dependent
people, as well as the importance of local people’s roles in
sustainable resource management;
National and local policies, rules and regulations that
level the playing field for the development of enterprises of
all sizes (such as tax incentives), and that provide additional
support mechanisms such as tailored services provision
and basic commercial infrastructure (roads, market
infrastructure, etc.);
Access to affordable (micro) finance and promising markets
through accurate information and innovative communication
technologies;
Access/tenure rights should be clearly spelled out and
allow for the sustainable extraction of forest products for
commercial purposes.
Key factors for sustainabilityCapacity development at the local level, with the facilitation of
private and/or public service providers, in key areas including:
formation of producer associations, business planning,
marketing, basic finance principles, value adding, natural
resource management planning and sustainable harvesting
techniques, domestication, etc.
Added value to the products, whether through:
• linking producers, their cooperatives, and associations along
the supply chain to strengthen market access and market
information;
• investment into research and development by private and
public sectors, to expand product uses in both raw and
processed forms;
• exploration of new opportunities in labelling (fair trade,
organic, etc.), certification and other niche markets.

86 | Chapter 4
be grown. However, throughout the world NWFPs
have been both overlooked and poorly regulated by
governments. Inappropriate policies have not only led to
overexploitation of species in the wild, but have reduced
benefits for producers and generated new forms of
inequity.
In part, problems with NWFP law and policy result
from a narrowing of the meaning of ‘forest products’
over the past century to the point where it primarily
only includes timber and wood fibres harvested on an
industrial scale for use in the manufacture of lumber,
paper, cardboard and particle board. This has occurred
even in regions where NWFPs are far more valuable
than so-called ‘forest products’. The resulting legal and
policy frameworks ignore the majority of NWFPs present
in forests.
Existing NWFP legislation and policies are usually a
complex and confusing mix of measures developed
over time, with poor coherence or coordination. They
rarely resemble an overall policy framework. Many policy
instruments have been enacted as ad hoc responses to
a crisis (e.g. perceived overexploitation of a species) or
an overly optimistic view of potential tax revenue should
informal activities be made more formal. Rarely has
regulatory activity followed from a careful and systematic
assessment of the range of opportunities and threats
associated with species, ecosystems and livelihoods, and
a strategic approach to regulating the NWFP sector as a
whole is uncommon.
This situation remains unchanged in many countries
today, but in some a shift began to occur in the late
1980s as scientists, natural resource managers and
policy-makers increasingly recognized the non-wood
values of forests, including the socio-economic and
cultural importance of NWFPs. This shift resulted from
a range of factors, including a change in the focus
of some conservation agencies away from a purely
protectionist approach to one that also incorporates
sustainable use, and views equity and social justice as
integral to conservation. Originally articulated by the
Brundtland Commission in 1987, this view culminated
in the various agreements that emerged from the
1992 United Nations Conference on Environment and
Development in Rio de Janeiro, including the legally
binding CBD. Conservation and development groups
experimented with NWFP-based projects as a means
of supporting ecologically benign and socially just
income-generating activities. The commercial use
of a handful of NWFPs was promoted as a way of
Box 25: Case Study on NWFPs and SMFEs – Strengthening policies and institutions in Burkina Faso
Between 1995 and 2005, various government and NGO projects
in Burkina Faso targeted NWFP development. Some impact
was achieved, but the sum of these initiatives was insufficient
to highlight the real potential of the NWFP sector as vital to
food security and rural incomes. The lack of recognition was
probably the result of poor analysis of demand, and limited
data on the economic value of NWFPs and SMFEs. There was
also poor coordination between organizations. Moreover, the
1997 Code Forestier contained no specific clauses relating to
NWFP development although it upheld the rights of indigenous
communities to manage and use their traditional resources,
including NWFPs.
After a workshop in 2004 hosted by the NGO TREE AID,
Burkina Faso’s Ministry of Environment (MECV) accepted
an invitation by FAO and TREE AID to work in partnership
to pilot the FAO Market Analysis and Development (MA&D)
approach through a project entitled ‘Promoting micro and small
community-based enterprises of non-wood forest products
(2005–2006)’. As a result, in 2007 the government asked FAO to
support the elaboration of a national strategy on the promotion
and valorization of NWFPs.
Using local solutions, policies were amended to suit conditions
in the area, build capacity and develop other support mechanisms.
In this case study, the most significant demonstration of national
importance for this sector was the creation by the government,
in 2008, of the Agence de Promotion des Produits Forestiers
Non Ligneux (APFNL). The APFNL is now a national institution
under the Ministry of Environment, concerned with the support,
coordination and monitoring of operations and marketing of
NWFPs. It pilots, implements and monitors policies and strategies
to promote NWFPs in collaboration with all other actors in the
field, and links the actors in the NWFP distribution chain. APFNL
has attracted the interest of various international donors and
NWFP development has become a priority for government to
diversify rural livelihoods and generate economic growth. The
recently approved ‘Projet d’Amélioration de la Gestion et de
l’Exploitation Durable des PFNL’ (funded by the Government
of Luxemburg through FAO and implemented by the APFNL)
includes support for techniques to improve production and add
value, and for the establishment of NWFP-specific producer
organizations.

The local value of forests | 87
helping people live well with minimal damage to the
environment.
As a result of these trends, small-scale producers and
NWFPs have emerged from ‘invisibility’ in recent decades.
Unfortunately, with a few exceptions, the NWFP policies
that resulted were often opportunistic and inadequate
resources were allocated for oversight and implementation.
Many were tagged onto timber-centric forest laws.
Regulations rarely followed from careful analysis of the
complex factors involved in NWFP management, use and
trade, or from consultations with producers, who are often
on the political and economic margins. In many cases
policy interventions also criminalized NWFP extraction,
further marginalizing harvesters, and customary law and
local institutions better suited to regulating many species
were often undermined by efforts to establish statutory
control over NWFPs.
A number of laws and policies directly address NWFPs,
often to conserve or sustainably manage resources, and
in some cases to improve rural livelihoods or promote
broader economic growth in a region (Box 26). These
measures tend to focus on species in commercial trade,
or form part of national efforts to protect endangered or
indigenous species or regulate international trade under
the Convention on International Trade in Endangered
Species of Wild Fauna and Flora (CITES). The majority of
measures directly addressing NWFPs are found in natural
resource law, in particular forest laws. However, a range
of other measures explicitly regulate aspects of NWFP
trade and use, including those governing quality control,
safety and efficacy standards, transportation, taxation
and trade.
Policies and laws that indirectly impact non-wood forest productsIn addition to laws that explicitly address NWFPs, there
are a myriad of measures that do not mention the term
and yet affect their use, management and trade as much
as, or more than, those that do. The high impact of these
measures is largely because forest management and
livelihoods involve a complex and interconnected suite
of activities, and regulating one aspect has immediate
knock-on effects on others. Laws and policies with an
indirect impact on NWFPs include agricultural policies,
Box 26: The inclusion of NWFPs in the forestry laws of the 1990s
In most countries, forestry laws historically focused almost
exclusively on timber resources and paid limited or no attention
to NWFPs. Moreover, the subsistence and commercial value of
NWFPs was disregarded when timber management plans were
designed and logging operations undertaken. In recent decades,
however, NWFPs have been incorporated into forest laws as a
response to changing international policy trends. In many cases,
this resulted from the direct pressure of international agencies,
such as large conservation organizations and finance institutions
to diversify forest management and make it more sustainable.
As a result, in the 1980s and 1990s, many countries integrated
a wider range of objectives into forest policies, including forest
health and biodiversity conservation, ecosystem functions and
long-term sustainability, as well as broader economic values
such as tourism, recreation and NWFPs.
However, initial efforts to address NWFPs in these new forest
laws were poorly formulated and rarely implemented. The scope
and definition of the products covered remained unclear, and few
specific actions were stipulated. When actions were prescribed,
they usually focused on permits, quotas (often set arbitrarily),
management plans and royalties or taxes – an approach lifted
directly from the timber sector, and one that proved entirely
inappropriate for the diverse, complex and often less lucrative
NWFP sector.
More usefully, some forest laws of this time included NWFPs
in timber norms, requiring their consideration in management
plans and logging operations in order to minimize negative
impacts on locally valuable products. In some countries, the
logging of high-value NWFP species for timber has proved their
greatest threat. In Brazil in recent years, national and state
governments have passed laws prohibiting the logging of high-
value NWFP species, and in Bolivia, prohibitions on felling Brazil
nut trees were established in 2004 as part of a decree addressing
property conflicts, but the track record for implementing such
policies is often poor.
In the past 10–15 years, a number of countries have begun
to fine-tune well-intentioned forest policies passed in the
1990s to reflect the socio-economic, ecological and cultural
realities of NWFP use. This has resulted in a number of specific
improvements to the ways in which these products are
regulated, including re-thinking the use of costly and complex
inventories and management plans for NWFPs, and revising
quota and permitting systems. There is still a long way to go,
and NWFPs continue to have low priority in most forestry
departments and curricula, but the trend in several countries
is towards greater understanding and better-elaborated
regulatory frameworks for these products. Source:Laird, McLain and Wynberg, 2010
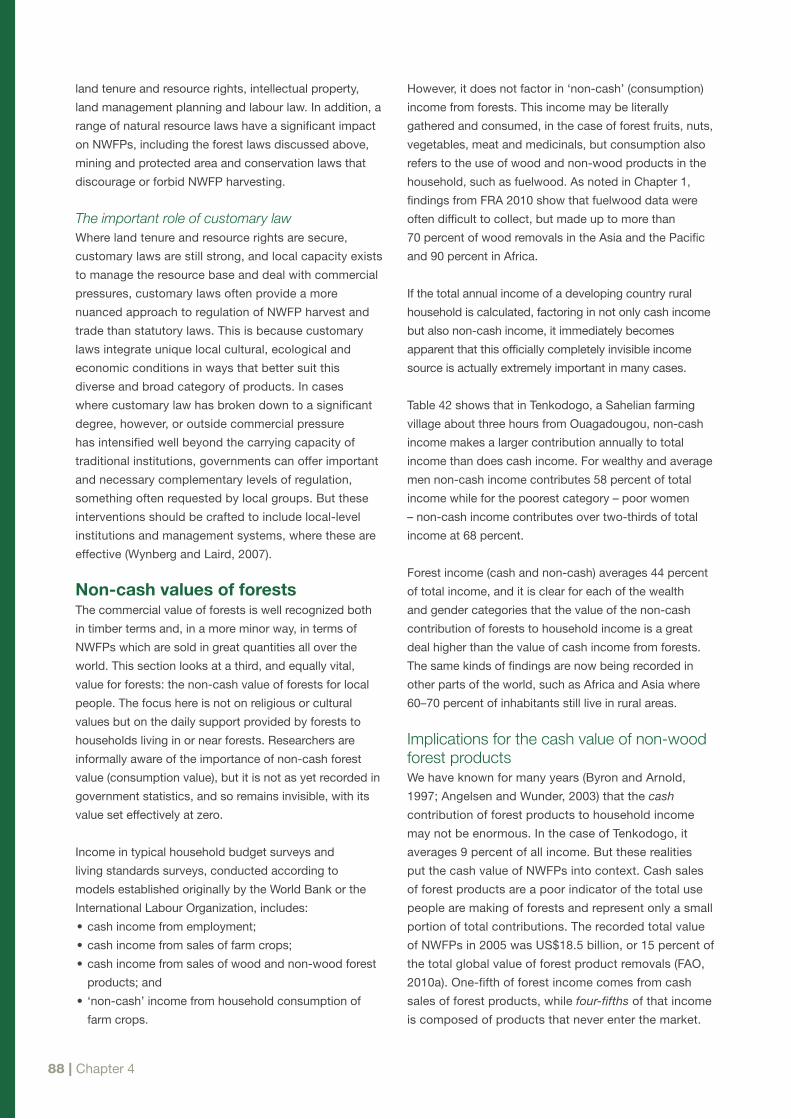
88 | Chapter 4
land tenure and resource rights, intellectual property,
land management planning and labour law. In addition, a
range of natural resource laws have a significant impact
on NWFPs, including the forest laws discussed above,
mining and protected area and conservation laws that
discourage or forbid NWFP harvesting.
The important role of customary lawWhere land tenure and resource rights are secure,
customary laws are still strong, and local capacity exists
to manage the resource base and deal with commercial
pressures, customary laws often provide a more
nuanced approach to regulation of NWFP harvest and
trade than statutory laws. This is because customary
laws integrate unique local cultural, ecological and
economic conditions in ways that better suit this
diverse and broad category of products. In cases
where customary law has broken down to a significant
degree, however, or outside commercial pressure
has intensified well beyond the carrying capacity of
traditional institutions, governments can offer important
and necessary complementary levels of regulation,
something often requested by local groups. But these
interventions should be crafted to include local-level
institutions and management systems, where these are
effective (Wynberg and Laird, 2007).
Non-cash values of forests The commercial value of forests is well recognized both
in timber terms and, in a more minor way, in terms of
NWFPs which are sold in great quantities all over the
world. This section looks at a third, and equally vital,
value for forests: the non-cash value of forests for local
people. The focus here is not on religious or cultural
values but on the daily support provided by forests to
households living in or near forests. Researchers are
informally aware of the importance of non-cash forest
value (consumption value), but it is not as yet recorded in
government statistics, and so remains invisible, with its
value set effectively at zero.
Income in typical household budget surveys and
living standards surveys, conducted according to
models established originally by the World Bank or the
International Labour Organization, includes:
• cash income from employment;
• cash income from sales of farm crops;
• cash income from sales of wood and non-wood forest
products; and
• ‘non-cash’ income from household consumption of
farm crops.
However, it does not factor in ‘non-cash’ (consumption)
income from forests. This income may be literally
gathered and consumed, in the case of forest fruits, nuts,
vegetables, meat and medicinals, but consumption also
refers to the use of wood and non-wood products in the
household, such as fuelwood. As noted in Chapter 1,
findings from FRA 2010 show that fuelwood data were
often difficult to collect, but made up to more than
70 percent of wood removals in the Asia and the Pacific
and 90 percent in Africa.
If the total annual income of a developing country rural
household is calculated, factoring in not only cash income
but also non-cash income, it immediately becomes
apparent that this officially completely invisible income
source is actually extremely important in many cases.
Table 42 shows that in Tenkodogo, a Sahelian farming
village about three hours from Ouagadougou, non-cash
income makes a larger contribution annually to total
income than does cash income. For wealthy and average
men non-cash income contributes 58 percent of total
income while for the poorest category – poor women
– non-cash income contributes over two-thirds of total
income at 68 percent.
Forest income (cash and non-cash) averages 44 percent
of total income, and it is clear for each of the wealth
and gender categories that the value of the non-cash
contribution of forests to household income is a great
deal higher than the value of cash income from forests.
The same kinds of findings are now being recorded in
other parts of the world, such as Africa and Asia where
60–70 percent of inhabitants still live in rural areas.
Implications for the cash value of non-wood forest productsWe have known for many years (Byron and Arnold,
1997; Angelsen and Wunder, 2003) that the cash
contribution of forest products to household income
may not be enormous. In the case of Tenkodogo, it
averages 9 percent of all income. But these realities
put the cash value of NWFPs into context. Cash sales
of forest products are a poor indicator of the total use
people are making of forests and represent only a small
portion of total contributions. The recorded total value
of NWFPs in 2005 was US$18.5 billion, or 15 percent of
the total global value of forest product removals (FAO,
2010a). One-fifth of forest income comes from cash
sales of forest products, while four-fifths of that income
is composed of products that never enter the market.

The local value of forests | 89
Not only do sales of forest products represent only
a small fraction of total income from forests, they
also represent a much narrower range of products
than that used for consumption, as shown by the
contrasting charts (Figures 31 and 32) from the
Comoros.
This is particularly evident if a comparison is made of
the numbers of products which enter the market, and
those which are gathered for consumption, as shown
above. These facts are extremely relevant to the
debates that have taken place in recent years about
the capacity of forests to reduce poverty (e.g. Arnold,
2001; Cavendish, 2003). As many have suggested,
straightforward poverty reduction based on the kinds
of cash incomes that can be generated from sales of
NWFPs can be limited, even though small sums may
be crucial for certain purposes.
On the other hand these smallish sums are not
negligible, as the section in this chapter on SMFEs
shows, in the context of the income-earning
opportunities available. In Table 42, forest cash
income may represent only 9 percent of total income,
but it does contribute 35 percent of all non-cash
income. It is therefore critical to improve assessments
of the true value of both NWFPs to cash and non-
cash income, as both make important contributions to
poverty alleviation particularly in rural environments.
Dimensions of forest dependenceAll household income in rural areas comes partly from
what can be grown on farms and partly from non-farm
income, which will consist of a mix of cash income
earned as wages and income drawn from off-farm natural
resources such as forests, rivers and the sea. The more
remote the location, the smaller the cash income
from wages, and the greater the dependence on farm
Figure 31: Sources of cash income for men and women in the village of Nindri, Anjouan
5 10 15 20 25 30 35
(%)
Women Men
0
Tree-crops e.g. cloves
Taro + cassava
Bananas
Market gardens
Bread fruit
Mango trees
Petty trade
Animals
Maize
Wages
Source:Shepherd, 2010
Table 42: Forest use in the village of Tenkodogo, Burkina Faso (percent)
Category of forest user Cash income Non-cash income Total Forest income as a percentage of
all income
Wealthy and average men 42 58 100
Of which forest 7 31 38
Wealthy and average women 36 64 100
Of which forest 10 34 44
Poor and very poor men 38 62 100
Of which forest 9 36 45
Poor and very poor women 32 68 100
Of which forest 12 38 50
Average contribution of cash and non-cash income to total income
37 63 100
Average contribution of forest income to total income
9 35 44
Source:IUCN, 2009a
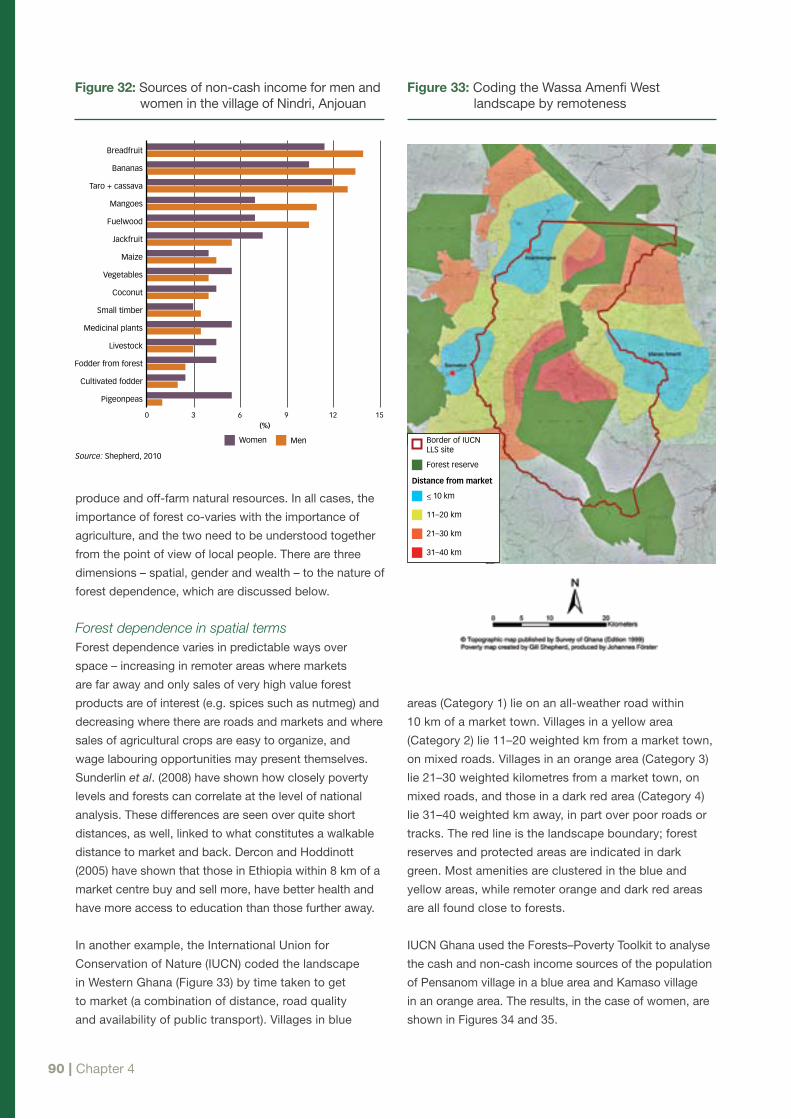
90 | Chapter 4
produce and off-farm natural resources. In all cases, the
importance of forest co-varies with the importance of
agriculture, and the two need to be understood together
from the point of view of local people. There are three
dimensions – spatial, gender and wealth – to the nature of
forest dependence, which are discussed below.
Forest dependence in spatial terms Forest dependence varies in predictable ways over
space – increasing in remoter areas where markets
are far away and only sales of very high value forest
products are of interest (e.g. spices such as nutmeg) and
decreasing where there are roads and markets and where
sales of agricultural crops are easy to organize, and
wage labouring opportunities may present themselves.
Sunderlin et al. (2008) have shown how closely poverty
levels and forests can correlate at the level of national
analysis. These differences are seen over quite short
distances, as well, linked to what constitutes a walkable
distance to market and back. Dercon and Hoddinott
(2005) have shown that those in Ethiopia within 8 km of a
market centre buy and sell more, have better health and
have more access to education than those further away.
In another example, the International Union for
Conservation of Nature (IUCN) coded the landscape
in Western Ghana (Figure 33) by time taken to get
to market (a combination of distance, road quality
and availability of public transport). Villages in blue
areas (Category 1) lie on an all-weather road within
10 km of a market town. Villages in a yellow area
(Category 2) lie 11–20 weighted km from a market town,
on mixed roads. Villages in an orange area (Category 3)
lie 21–30 weighted kilometres from a market town, on
mixed roads, and those in a dark red area (Category 4)
lie 31–40 weighted km away, in part over poor roads or
tracks. The red line is the landscape boundary; forest
reserves and protected areas are indicated in dark
green. Most amenities are clustered in the blue and
yellow areas, while remoter orange and dark red areas
are all found close to forests.
IUCN Ghana used the Forests–Poverty Toolkit to analyse
the cash and non-cash income sources of the population
of Pensanom village in a blue area and Kamaso village
in an orange area. The results, in the case of women, are
shown in Figures 34 and 35.
Figure 32: Sources of non-cash income for men and women in the village of Nindri, Anjouan
3 6 9 12 15(%)
Women Men
0
Breadfruit
Mangoes
Taro + cassava
Fuelwood
Maize
Jackfruit
Coconut
Vegetables
Small timber
Livestock
Medicinal plants
Fodder from forest
Cultivated fodder
Pigeonpeas
Bananas
Source:Shepherd, 2010
Figure 33: Coding the Wassa Amenfi West landscape by remoteness
Forest reserve
Distance from market
11–20 km
<_ 10 km
21–30 km
31–40 km
Border of IUCN LLS site
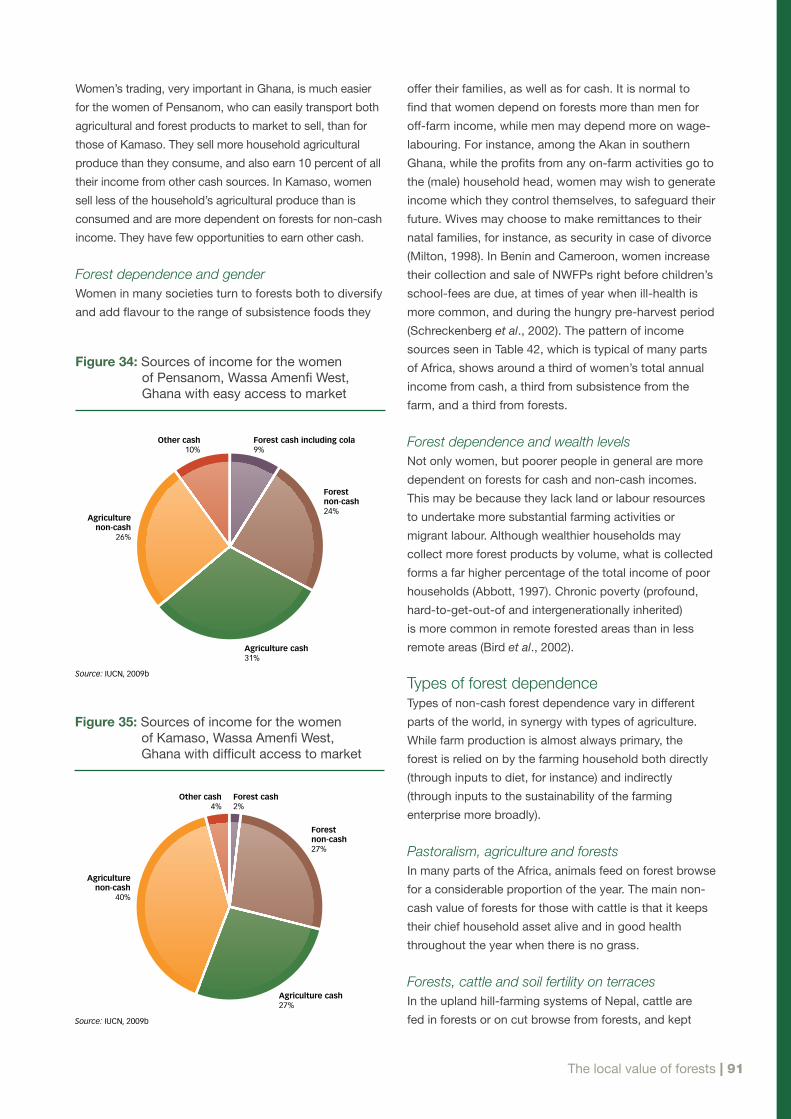
The local value of forests | 91
Women’s trading, very important in Ghana, is much easier
for the women of Pensanom, who can easily transport both
agricultural and forest products to market to sell, than for
those of Kamaso. They sell more household agricultural
produce than they consume, and also earn 10 percent of all
their income from other cash sources. In Kamaso, women
sell less of the household’s agricultural produce than is
consumed and are more dependent on forests for non-cash
income. They have few opportunities to earn other cash.
Forest dependence and gender Women in many societies turn to forests both to diversify
and add flavour to the range of subsistence foods they
offer their families, as well as for cash. It is normal to
find that women depend on forests more than men for
off-farm income, while men may depend more on wage-
labouring. For instance, among the Akan in southern
Ghana, while the profits from any on-farm activities go to
the (male) household head, women may wish to generate
income which they control themselves, to safeguard their
future. Wives may choose to make remittances to their
natal families, for instance, as security in case of divorce
(Milton, 1998). In Benin and Cameroon, women increase
their collection and sale of NWFPs right before children’s
school-fees are due, at times of year when ill-health is
more common, and during the hungry pre-harvest period
(Schreckenberg et al., 2002). The pattern of income
sources seen in Table 42, which is typical of many parts
of Africa, shows around a third of women’s total annual
income from cash, a third from subsistence from the
farm, and a third from forests.
Forest dependence and wealth levelsNot only women, but poorer people in general are more
dependent on forests for cash and non-cash incomes.
This may be because they lack land or labour resources
to undertake more substantial farming activities or
migrant labour. Although wealthier households may
collect more forest products by volume, what is collected
forms a far higher percentage of the total income of poor
households (Abbott, 1997). Chronic poverty (profound,
hard-to-get-out-of and intergenerationally inherited)
is more common in remote forested areas than in less
remote areas (Bird et al., 2002).
Types of forest dependenceTypes of non-cash forest dependence vary in different
parts of the world, in synergy with types of agriculture.
While farm production is almost always primary, the
forest is relied on by the farming household both directly
(through inputs to diet, for instance) and indirectly
(through inputs to the sustainability of the farming
enterprise more broadly).
Pastoralism, agriculture and forestsIn many parts of the Africa, animals feed on forest browse
for a considerable proportion of the year. The main non-
cash value of forests for those with cattle is that it keeps
their chief household asset alive and in good health
throughout the year when there is no grass.
Forests, cattle and soil fertility on terracesIn the upland hill-farming systems of Nepal, cattle are
fed in forests or on cut browse from forests, and kept
Figure 34: Sources of income for the women of Pensanom, Wassa Amenfi West, Ghana with easy access to market
Forest cash including cola9%
Forest non-cash24%
Agriculture cash31%
Agriculture non-cash
26%
Other cash10%
Source:IUCN, 2009b
Figure 35: Sources of income for the women of Kamaso, Wassa Amenfi West, Ghana with difficult access to market
Source:IUCN, 2009b
Forest non-cash27%
Agriculture cash27%
Agriculture non-cash
40%
Other cash4%
Forest cash2%
92 | Chapter 4
on terraces, so that their manure can supply crops with
nutrients. The farming system demonstrates how close
the symbiosis with forests can be.
Forests, water and irrigated terracesForests in upper watersheds protect and support the
streams, which are an essential part of irrigated rice
terrace agriculture in much of South and Southeast Asia
and in Madagascar.
Rotational fallowingIn almost every part of the world, before the advent
of purchased fertilizer, farmers made use of forest soil
fertility in shifting cultivation systems. Poor soils, where
accumulating weeds and soil toxicity begin to make
farming all but impossible after two or three years, drove
farmers to move on around their cycle of plots. In many
systems, from West Africa to Indonesia, farmers enrich
the plots they temporarily abandon with desirable tree
species, so that when they return in a few years’ time,
they will have a more valuable forest than the one they
left behind. The farmed parklands of the Sudanic zone
in Africa, and the slow transition into the multistorey
agroforests found in Indonesia, Viet Nam and elsewhere,
are both examples of this.
Forests and proteinIn the rainforests of the Congo Basin, it is all but
impossible to raise domestic livestock. Farming consists
of the growing of carbohydrates and root vegetables,
but protein, green leaves, vitamins and minerals must all
come from the forest.
Challenges and emerging issues Forestry and forests have gained new attention in
international debates because of their potential role in
mitigating climate change. These discussions make it
urgent for governments to put in place pro-poor reforms
in the forest sector to protect and enhance the livelihood
benefits that forests provide to the poor. If this is to be
realized, local communities will need more secure rights if
they are to be involved in managing and protecting large
areas of forests globally.
The sustainability of CBFM is closely linked to enabling
arrangements that facilitate the generation and equitable
sharing of benefits from forests. Without legal recognition
of rights over forest products, however, local people have
neither the interest nor the courage to protect and develop
forests (Gobeze et al., 2009). SMFEs will also require
continued investment and capacity building in order to
contribute to local livelihoods. Other aspects of local
livelihoods, such as trees in areas outside forests, also
need to be further integrated into policies and actions.
Long-term access rights to forest resources and equitable benefit sharingThe Global Forest Resources Assessment 2010 – Main
Report indicates that 80 percent of the world’s forests
are publicly owned (FAO, 2010a) but ownership and
management of forests by communities is on the rise.
However, in many countries, regulatory frameworks are
not clearly defined or do not provide adequate security of
tenure for forest dependent communities.
The benefits accruing to communities are more minor
in countries where CBFM is a relatively young concept.
Here tenure issues have perhaps not yet been addressed,
the low-value forests passed on to communities have
not had time to show the benefits of protection, and
infrastructure to valorize community forestry products
is not yet in place. In the early stages, the time costs of
managing forests (and the transaction costs of engaging
with public forest institutions), are generally under-
estimated. In these situations, it is easy for middle men
and local elites to become the main beneficiaries.
The essence of cost and benefit sharing is to achieve
SFM and to reduce poverty levels. Local communities
expect incremental benefits from timber, woodfuel
and NWFPs as an incentive and motivation to pursue
sustainable forest management objectives in partnership
with government. Lack of transparency about the
amount of income generated and how it is to be used
can be a potential source of conflict and a threat to the
very existence of CBFM arrangements. Additionally, the
procedure of designating forests for community use or
for co-management with government forest agencies, the
registration of forest management groups, the development
of forest management plans and approval processes,
all considerably limit the capacity of communities to get
involved in forest management without external support.
The formats for community forest management plans
in many countries are still based on conventional large-
scale timber and production-oriented forest management.
They are applied to small-scale operations without
fundamental adaptation, so that high transaction costs
and time delays ensue. The focus on benefits for forest
dependent communities is rapidly lost in this situation
(FAO, 2004). Nevertheless, countries are taking positive
steps to improve collaborative forest management.
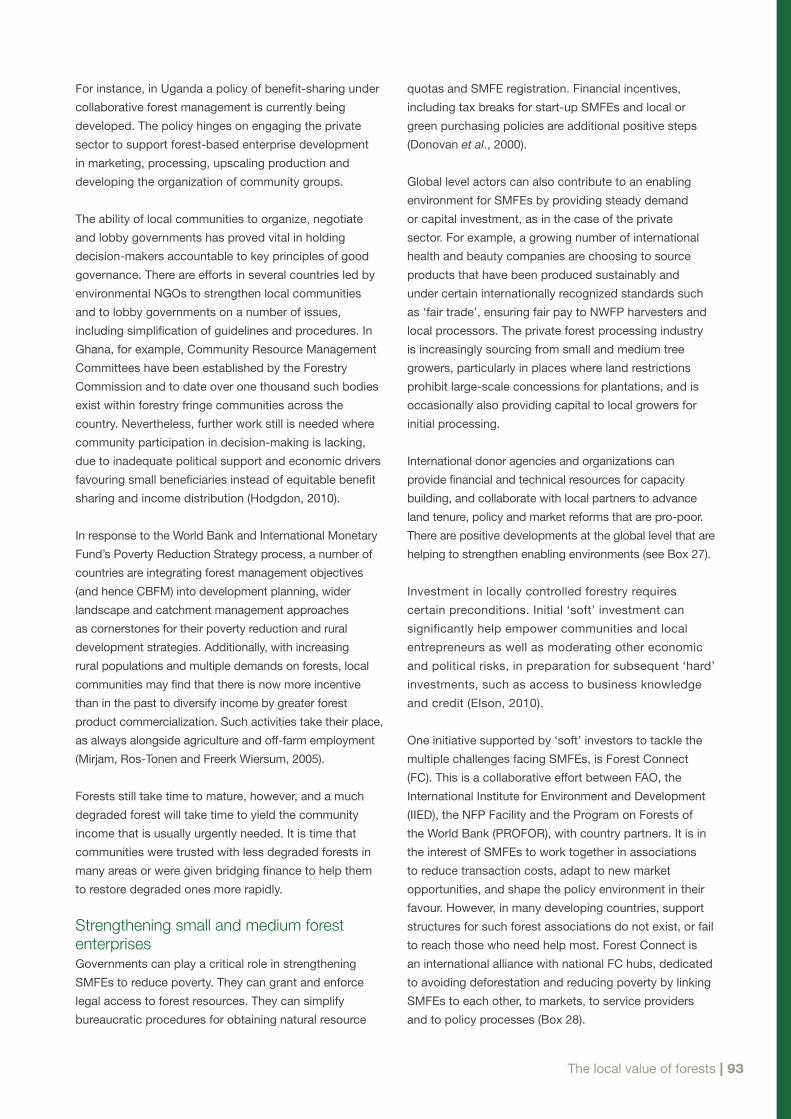
The local value of forests | 93
For instance, in Uganda a policy of benefit-sharing under
collaborative forest management is currently being
developed. The policy hinges on engaging the private
sector to support forest-based enterprise development
in marketing, processing, upscaling production and
developing the organization of community groups.
The ability of local communities to organize, negotiate
and lobby governments has proved vital in holding
decision-makers accountable to key principles of good
governance. There are efforts in several countries led by
environmental NGOs to strengthen local communities
and to lobby governments on a number of issues,
including simplification of guidelines and procedures. In
Ghana, for example, Community Resource Management
Committees have been established by the Forestry
Commission and to date over one thousand such bodies
exist within forestry fringe communities across the
country. Nevertheless, further work still is needed where
community participation in decision-making is lacking,
due to inadequate political support and economic drivers
favouring small beneficiaries instead of equitable benefit
sharing and income distribution (Hodgdon, 2010).
In response to the World Bank and International Monetary
Fund’s Poverty Reduction Strategy process, a number of
countries are integrating forest management objectives
(and hence CBFM) into development planning, wider
landscape and catchment management approaches
as cornerstones for their poverty reduction and rural
development strategies. Additionally, with increasing
rural populations and multiple demands on forests, local
communities may find that there is now more incentive
than in the past to diversify income by greater forest
product commercialization. Such activities take their place,
as always alongside agriculture and off-farm employment
(Mirjam, Ros-Tonen and Freerk Wiersum, 2005).
Forests still take time to mature, however, and a much
degraded forest will take time to yield the community
income that is usually urgently needed. It is time that
communities were trusted with less degraded forests in
many areas or were given bridging finance to help them
to restore degraded ones more rapidly.
Strengthening small and medium forest enterprises Governments can play a critical role in strengthening
SMFEs to reduce poverty. They can grant and enforce
legal access to forest resources. They can simplify
bureaucratic procedures for obtaining natural resource
quotas and SMFE registration. Financial incentives,
including tax breaks for start-up SMFEs and local or
green purchasing policies are additional positive steps
(Donovan et al., 2000).
Global level actors can also contribute to an enabling
environment for SMFEs by providing steady demand
or capital investment, as in the case of the private
sector. For example, a growing number of international
health and beauty companies are choosing to source
products that have been produced sustainably and
under certain internationally recognized standards such
as ‘fair trade’, ensuring fair pay to NWFP harvesters and
local processors. The private forest processing industry
is increasingly sourcing from small and medium tree
growers, particularly in places where land restrictions
prohibit large-scale concessions for plantations, and is
occasionally also providing capital to local growers for
initial processing.
International donor agencies and organizations can
provide financial and technical resources for capacity
building, and collaborate with local partners to advance
land tenure, policy and market reforms that are pro-poor.
There are positive developments at the global level that are
helping to strengthen enabling environments (see Box 27).
Investment in locally controlled forestry requires
certain preconditions. Initial ‘soft’ investment can
significantly help empower communities and local
entrepreneurs as well as moderating other economic
and political risks, in preparation for subsequent ‘hard’
investments, such as access to business knowledge
and credit (Elson, 2010).
One initiative supported by ‘soft’ investors to tackle the
multiple challenges facing SMFEs, is Forest Connect
(FC). This is a collaborative effort between FAO, the
International Institute for Environment and Development
(IIED), the NFP Facility and the Program on Forests of
the World Bank (PROFOR), with country partners. It is in
the interest of SMFEs to work together in associations
to reduce transaction costs, adapt to new market
opportunities, and shape the policy environment in their
favour. However, in many developing countries, support
structures for such forest associations do not exist, or fail
to reach those who need help most. Forest Connect is
an international alliance with national FC hubs, dedicated
to avoiding deforestation and reducing poverty by linking
SMFEs to each other, to markets, to service providers
and to policy processes (Box 28).
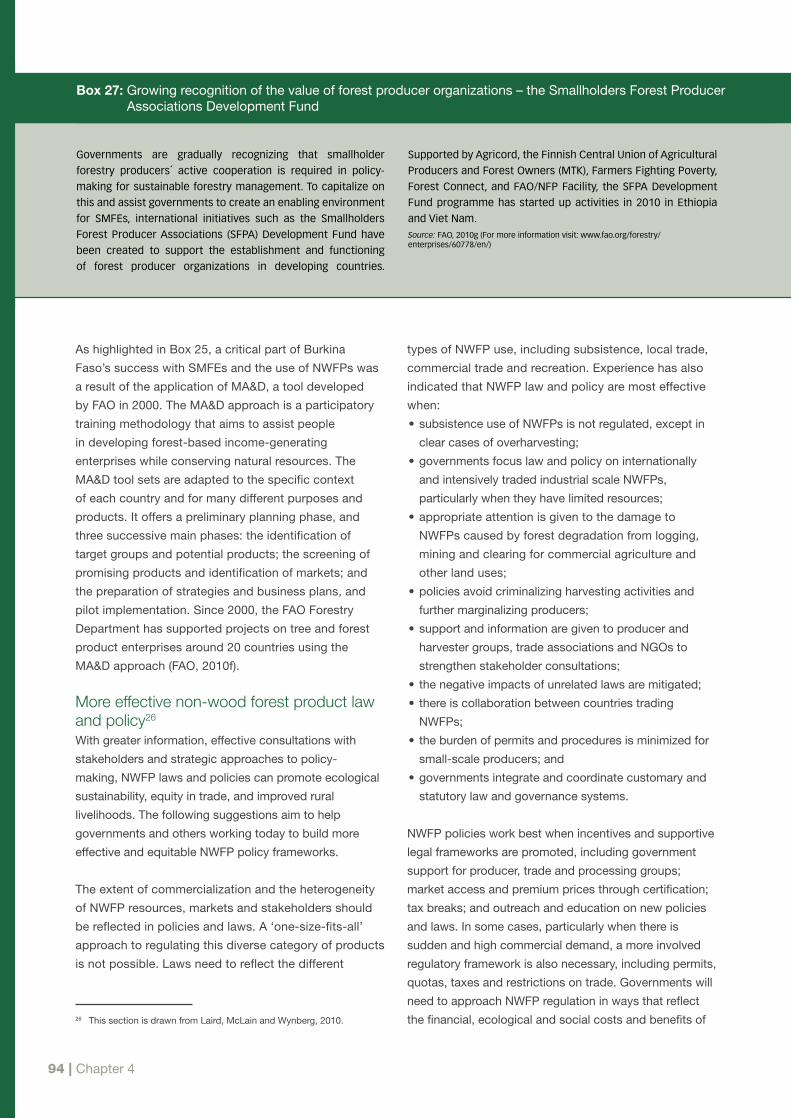
94 | Chapter 4
As highlighted in Box 25, a critical part of Burkina
Faso’s success with SMFEs and the use of NWFPs was
a result of the application of MA&D, a tool developed
by FAO in 2000. The MA&D approach is a participatory
training methodology that aims to assist people
in developing forest-based income-generating
enterprises while conserving natural resources. The
MA&D tool sets are adapted to the specific context
of each country and for many different purposes and
products. It offers a preliminary planning phase, and
three successive main phases: the identification of
target groups and potential products; the screening of
promising products and identification of markets; and
the preparation of strategies and business plans, and
pilot implementation. Since 2000, the FAO Forestry
Department has supported projects on tree and forest
product enterprises around 20 countries using the
MA&D approach (FAO, 2010f).
More effective non-wood forest product law and policy26
With greater information, effective consultations with
stakeholders and strategic approaches to policy-
making, NWFP laws and policies can promote ecological
sustainability, equity in trade, and improved rural
livelihoods. The following suggestions aim to help
governments and others working today to build more
effective and equitable NWFP policy frameworks.
The extent of commercialization and the heterogeneity
of NWFP resources, markets and stakeholders should
be reflected in policies and laws. A ‘one-size-fits-all’
approach to regulating this diverse category of products
is not possible. Laws need to reflect the different
types of NWFP use, including subsistence, local trade,
commercial trade and recreation. Experience has also
indicated that NWFP law and policy are most effective
when:
• subsistence use of NWFPs is not regulated, except in
clear cases of overharvesting;
• governments focus law and policy on internationally
and intensively traded industrial scale NWFPs,
particularly when they have limited resources;
• appropriate attention is given to the damage to
NWFPs caused by forest degradation from logging,
mining and clearing for commercial agriculture and
other land uses;
• policies avoid criminalizing harvesting activities and
further marginalizing producers;
• support and information are given to producer and
harvester groups, trade associations and NGOs to
strengthen stakeholder consultations;
• the negative impacts of unrelated laws are mitigated;
• there is collaboration between countries trading
NWFPs;
• the burden of permits and procedures is minimized for
small-scale producers; and
• governments integrate and coordinate customary and
statutory law and governance systems.
NWFP policies work best when incentives and supportive
legal frameworks are promoted, including government
support for producer, trade and processing groups;
market access and premium prices through certification;
tax breaks; and outreach and education on new policies
and laws. In some cases, particularly when there is
sudden and high commercial demand, a more involved
regulatory framework is also necessary, including permits,
quotas, taxes and restrictions on trade. Governments will
need to approach NWFP regulation in ways that reflect
the financial, ecological and social costs and benefits of 26 This section is drawn from Laird, McLain and Wynberg, 2010.
Box 27: Growing recognition of the value of forest producer organizations – the Smallholders Forest Producer Associations Development Fund
Governments are gradually recognizing that smallholder
forestry producers´ active cooperation is required in policy-
making for sustainable forestry management. To capitalize on
this and assist governments to create an enabling environment
for SMFEs, international initiatives such as the Smallholders
Forest Producer Associations (SFPA) Development Fund have
been created to support the establishment and functioning
of forest producer organizations in developing countries.
Supported by Agricord, the Finnish Central Union of Agricultural
Producers and Forest Owners (MTK), Farmers Fighting Poverty,
Forest Connect, and FAO/NFP Facility, the SFPA Development
Fund programme has started up activities in 2010 in Ethiopia
and Viet Nam.Source:FAO, 2010g (For more information visit: www.fao.org/forestry/enterprises/60778/en/)

The local value of forests | 95
such actions, government implementation capacity and
the likelihood of compliance.
Traditional knowledge, indigenous peoples and REDDPerhaps the most dynamic and important new
development regarding forests, traditional knowledge
and indigenous peoples within the United Nations, is
the work within the climate change regime. In particular,
indigenous peoples will have a crucial role to play in
REDD and REDD+, particularly given recent decisions on
REDD+ in Cancún, Mexico. Forest loss and degradation
contribute 17 percent of global GHG emissions, and
indigenous peoples live in all the forests being targeted
by REDD activities.
Recent debates about livelihood resilience are only just
beginning to factor in the enormous contribution made
by forests to those livelihoods, especially in remoter
areas. Yet some believe the protective effects of forests
for livelihood resilience could be threatened by aspects
of REDD almost before they are recognized. Although
similar threats to livelihoods exist in many aspects of
natural resource management (Honadle, 1999), there is a
series of specific linked concerns about REDD.
There have been concerns that REDD could disadvantage
people living in and around forests (on the basis, for
instance, of experience with palm oil). If REDD is intended to
contribute to poverty reduction or at least not to negatively
impact upon use rights, then tenure clarification will be
essential in many cases. At the same time, many forest
authorities now see an opportunity to generate income
from REDD, and this might provide a strong disincentive to
decentralize control of forests to communities.
Communities could bear the costs of REDD in terms of
forest use forgone. If, as we have seen, up to four-fifths
of that use is invisible to governments, then there could
be an underestimation of what forest dependent people
might lose through REDD. Furthermore, there is a serious
risk that informal forest use rights possessed by many
forest peoples could be lost as forests become more
valuable (Angelsen et al., 2009).
The potential contribution that a multifunctional, multiple-
value forest resource might make to climate change
cannot be realized unless REDD arrangements are better
aligned with broader forest governance reform. REDD and
carbon capture could reduce multiple functions to a single
function – to the great disadvantage of local users. At the
root of potential emissions reductions, and the finance
mechanisms and monitoring protocols intended to deliver
them, lie fundamental decisions about pro-poor forest
governance which are only starting to be addressed.
Especially since the Conference of the Parties to the
UNFCCC in Bali in 2007, indigenous peoples have
participated actively in policy development processes
and have influenced their outcomes. As a result of these
efforts, references to the role of indigenous peoples and
traditional knowledge can be found in UNFCCC draft
texts and, notably, in the December 2010 UNFCCC
decision on REDD+, which requests developing countries
Box 28: Forest Connect – a practical networking tool
Forest Connect (FC) currently connects and strengthens small
forest enterprises in Burkina Faso, China, Ethiopia, Guatemala,
Guyana, Lao People’s Democratic Republic, Liberia, Mali,
Mozambique and Nepal. In-country FC activities start with
an evaluation of the SMFE context, which informs follow-
up activities leading to face-to-face networking across the
value chain and up to the policy level. SMFEs are provided
with information and opportunities to connect to other local
producers, value chain actors and service providers (e.g.
business and financial services). Each FC national hub develops
and manages its own website based on its own defined
priorities, to link all these stakeholders.
In the Lao People’s Democratic Republic, FC works in
association with FAO, the World Wide Fund For Nature (WWF),
and the Netherlands Development (Organization) SNV, and is
implemented by a Lao private human resource development
organization. It has focused on small rattan and bamboo
enterprises, and promoted collaboration among NGOs and the
Lao Government. The marketing capacity of these SMFEs has
been increased by making them more aware of international
market requirements, and through development of bamboo
and rattan production groups. National institutions have learned
the importance of helping the SMFEs to gain better access to
national, regional and international markets, and this in turn has
stimulated both the Lao Government and the SMFEs to give more
attention to the sustainable management of rattan and bamboo.Source:Forest Connect, 2010. (For more information on Forest Connect Lao People’s Democratic Republic, visit http://edclaos.com/lfc/)
96 | Chapter 4
to ensure the full participation of indigenous people and
local communities in REDD+ national strategies and
action plans. These references provide a basis on which
to build and ensure that indigenous peoples and local
communities have an adequate role in the UNFCCC
regime, their interests and rights are protected (see
UNFCCC, 2010), and they can benefit from REDD+
activities. The cases mentioned in Chapter 3 provide
clear examples of how this involvement has started to
positively change laws and policies. More work on REDD+
is being undertaken to ensure these activities benefit local
and indigenous communities.
Urban forests and local economy for jobs and income More than half of the world’s population now lives in
urban areas. The proximity of urban and peri-urban
forests, and other tree-based systems to these centres
of population, makes them highly valuable in sustaining
employment and income generation. However, urban
areas are largely overlooked when examining local
forests and forestry issues. Different considerations
must be taken into account when assessing the
productivity of urban forests, in comparison with the
rural context. Three areas are particularly important in
this consideration.
First, in ‘core’ built-up areas with high grey
infrastructure (roads and buildings), urban trees
and forests form line plantations and gardens, the
maintenance of which provides sustainable jobs, and
residues that supply raw material for local electricity
generation, heating and cooking (Lohrberg, 2007).
Second, the urbanizing areas around cities face major
land-use changes and ingenious mosaics of trees and
forest resources are needed that combine recreational,
health, environmental and productive functions.
Today’s practices aim to increase the cost-efficiency
of green infrastructure, and move towards more eco-
friendly grey infrastructure, while providing employment
in the construction and management of roads, parks,
industrial areas and neighbourhoods that bring
together small and medium enterprises and community
involvement (Lohrberg, 2007). Third, a sustainable
city must fit within its overall ecosystem, respecting
urban watershed management and the landscape.
Balanced productivity of forests and agroforestry
systems around cities provides urban areas with
traditional forest products, as well as water supplies
and agroforestry products (Spathelf and Nutto, 2004).
However, despite their value for and connectedness
to CBFM and SMFEs, these three areas are rarely
considered in studies of the local ‘value’ of forests and
forestry. Urban and peri-urban forests need special
attention if they are to be measured and integrated into
local (‘urban’) and regional (‘peri-urban linking urban to
rural’) planning efforts.
Urban and peri-urban forestry has been defined as the
art, science and technology of managing trees and forest
resources in and around urban community ecosystems for
the physiological, sociological, economic and aesthetic
benefits that they provide (Grey and Deneke, 1986).
Urban forestry has received limited attention in many poor
countries as it is often perceived to be associated with
beautification and recreation. Although these functions
are important for all societies, they are not a top priority
for cities where the restoration of the forest base and the
search for productive occupations for vulnerable and poor
populations are the primary concerns.
Extensive research and experience demonstrate
that towns that have taken steps to invest in a green
vision have subsequently enjoyed many benefits. For
instance, where an efficient green infrastructure is in
place, the impacts of extreme weather events (e.g.
winds, floods, landslides and sand encroachment)
are mitigated. Moreover, a well managed watershed
produces and supplies good quality water and reduces
the need for costly engineering works. The high
and recurrent cost of rebuilding roads, housing and
commercial infrastructure is greatly reduced, creating
savings, which generate green jobs and income
through multiuse management and the maintenance of
woodlands and trees. Finally, farming and landscape
systems that incorporate agroforestry and high-yielding
plantations can supply nearby markets at competitive
prices (FAO, 2009b).
Research in peri-urban areas of developing countries
reveals that poor urban migrant households maintain
close links with their previous rural (agricultural and
forestry) areas. This connection can contribute to their
subsistence and alleviate food insecurity (Iaquinta
and Drescher, 2000). In the urbanized society of the
Bolivian Amazon, extraction and processing of NWFPs
provide livelihood options for peri-urban dwellers. Some
households, especially those of poorly educated migrants
from the forest hinterland, rely on NWFP-related activities
for their economic survival in town (Stoian, 2005). The role
of NWFPs in supporting livelihoods in different regions of
developing countries, which has informally taken place

The local value of forests | 97
for decades, was confirmed by Shackleton, Shanley
and Ndoye (2007). In particular, their research illustrated
the key role of NWFPs in providing an opportunity for
hundreds of thousands of unemployed peri-urban and
urban men and women to strengthen their livelihoods in
several African countries.
In urban areas the principal sources of timber are
plantations, street trees, shelterbelts or windbreaks
and greenbelts, parks and gardens. In many cities
timber harvesting is combined with intensive outdoor
recreational activities. Systematic planting of street trees
for timber production is widely practised in China, India
and Malaysia (Carreiro, Song and Wu, 2008). Some cities
in industrialized countries offset the costs of tree care
through harvesting.
Urban trees also have the ability to maintain property
values (e.g. Tyrväinen et al., 2005), create attractive
settings for businesses and attract consumers to
established shopping districts in more urban areas.
Studies have found that urban trees improve the economic
stability of retail environments by attracting consumers,
setting a positive mood, and sending messages of quality
(Wolf, 2004). This has been well documented through
action research in Europe, including that carried out by
the European Forum on Urban Forestry led by the Danish
Centre for Forest, Landscape and Planning of Copenhagen
University (DCFLP/KVL) and IUFRO. Production, planting,
and tending trees and landscapes represent a significant
economic multiplier in developed countries. Landscape
services, including equipment and nursery production and
retail sales in the United States of America alone in 2004
were estimated to be valued at US$147.8 billion in output,
generating more than 1.9 million private sector jobs (Hall,
Hodges and Haydu, 2005).
The necessary work to restore urban ecosystems,
and plant and care for community trees and forests,
supported by national and local governments and
international donor agencies, could employ millions of
people at a global scale with significant multiplier effects
in local economies and around the world. Nevertheless,
urban forests are still frequently an afterthought in
the process of implementing comprehensive plan
goals at the local and national scales. Often, there is a
fundamental disconnect between the community’s vision
of environmental quality and the ecosystem services
that are the cornerstone for achieving environmental
quality and sustainable development (Schwab, 2009).
Reliable data and inclusive dialogue across disciplines,
sectors and institutions are necessary components of any
successful planning process. Both are currently lacking
in nearly all regions and nations (see Box 30). Indeed
key stakeholders such as foresters, urban agriculture
specialists, local authorities, emergency agencies and
food security programmers do not meet to build green
sustainable cities with and for citizens. However, many
centres of excellence (for instance in Asia, the Chinese
Academy of Forests (CAF), the Forest Resources Institute
of Malaysia (FRIM), and Aravali Foundations in India) are
compiling good data and instituting progressive practices
to engage affected landowners and interest groups,
and to develop a sustainable green vision for their
communities within good governance conditions and
long-term planning exercises.
Urban agriculture has already been recognized by citizens
and their local authorities as a strategic way to combine
a mosaic of green areas in and around cities, contributing
to the stabilization of migrant societies from rural areas,
establishing a natural ecosystem in the city and providing
a highly competitive market in the vicinity of consumers.
Box 29: Valuation of ecological services – the example of Oakville’s urban forest
Every year, trees within the town of Oakville (Ontario, Canada)
provide ecological services to a value of US$2.1 million. In
addition, trees save local industry US$1.1 million annually by
avoiding expenditure on mechani cal methods to remove the
172 tonnes (190 tons) of pollutants emitted at source. Trees
save Oakville residents US$812 000 annually in reduced energy
bills. This proves the concept that the urban forest functions
as a ‘biogenetic utility,’ saving energy and preventing the
accumulation of greenhouse gases.
Oakville’s Urban Forest Effect (UFORE) project helped
established a baseline ‘performance measure’ for its Corporate
Strategic Plan. In combination with the Urban Forest Strategic
Management Plan 2008–2027, a solid policy foundation was built
in the town’s official plan to help meet its Corporate Vision: “To
be the most liveable town in Canada.” This demonstrates the
influential role that the urban forest plays, and the potential
partnerships that can be attained among planning, engineering
and urban forest management professionals (McNeill, 2009).

98 | Chapter 4
The existing stakeholder platforms around this discipline
offer a sound basis through which to incorporate trees,
agroforestry and forests in integrated land use, enabling
urban and peri-urban forestry make a direct economic
contribution in terms of jobs and income generation, as
well as institutional savings.
Results of more comprehensive research on urban and
peri-urban forests and other tree-based systems drive
us toward new models of urban management and an
urbanization dynamic where social inclusion, participatory
processes of cultural integration, food security and well-
being are adopted as core objectives.
Summary and conclusionsThis chapter has shown how local forest resources are
important in sustaining local livelihoods, but are often
underestimated in value and underprotected in laws and
policies. Local forest resources make key contributions
to sustaining traditional knowledge practices, developing
CBFM and SMFEs, supplying NWFPs and making
‘non-cash’ contributions to subsistence livelihoods. The
examples in this chapter were a first attempt to shed light
on these themes, all of which require further research and
discussion in 2011 and beyond.
Community-based forest management builds on political
goodwill and strong community institutions. It relies on
long-term forest rights and tenure. When fostered in
sound and appropriate enabling environments, CBFM
can also help stimulate the creation of SMFEs.
It is increasingly understood in some countries and
internationally that investment in SMFEs can greatly
improve rural livelihood opportunities as well as
strengthen natural resource management. SMFEs can be
engines of development through employment, income
and through these, the multiplier effect that occurs in
rural economies. Yet in some countries, development of
SMFEs is still lacking because of an underappreciation
of their value to national economies. Governments and
international organizations could create a more positive
environment for SMFEs by clarifying natural resource
access and tenure rules; by simplifying business
registration and export procedures; and by streamlining
tax and financial incentive schemes. Availability of
information and support for producer networks are also
important components.
Non-wood forest products have also been shown to be
a large contributor to cash and non-cash contributions
of livelihoods, including via SMFEs. They are often the
core product of many community-based SMFEs and help
provide sustainable incomes. However, the non-cash
contribution of NWFPs to household income is often much
greater than cash income from the forest. In addition to
conducting further research on the non-cash contribution
of forests, further development of effective NWFP law and
policy is required to ensure NWFPs are not overexploited
and are well integrated into policy frameworks.
Finally, new challenges from climate change require
urgent action to explore and protect the local value of
forests for livelihoods even more. This is particularly
true in the case of emerging activities undertaken as
part of REDD+, given recent decisions taken in Cancún
in December 2010. If REDD activities are aligned with
broad forest governance reform and governments
encourage participation of indigenous peoples and local
communities in national REDD+ strategy and action plan
formation, there is hope that REDD+ activities could
ensure benefits for the people that depend on forests for
their livelihoods. Without such attention given to local-
level issues, there is a risk of eroding traditional ways of
life and threatening some of the most biologically diverse
and environmentally important forests in the world.
Box 30: Assessing trees outside forests
The evolution of green areas in cities and regional planning
processes for these areas is well known in developed
countries. However, although methodologies for assessment
exist, they are not commonly used in most parts of the world,
are rarely compatible among users, and are not integrated,
either at national or international level. As part of the
FRA 2010 process, a thematic study is being prepared on trees
outside forests, which includes an analysis of methodologies
and data availability. The study will provide guidance to countries
when assessing urbanization, land use and land use change in
and around cities in relation to forest policy and national forestry
action plans (FAO, 2010e).

Annex

100 | Annex
5 Annex
Notes on the annex tables
In all tables, the regional breakdown reflects geographical rather than economic or political groupings.
– = not available 0 = either a true zero or an insignificant value (less than half a unit)
In Table 1, “land area” refers to the total area of a country, excluding areas under inland water bodies. The world total corresponds to the sum of the reporting units; about 35 million hectares of land in Antarctica, some Arctic and Antarctic islands and some other minor islands are not included. Per capita gross domestic product (GDP) is expressed at purchasing power parity (PPP).
In Table 3, “carbon stock in living forest biomass” refers to carbon stock in above-ground and below-ground biomass.
In Table 6, employment is reported for the formal forestry sector only.
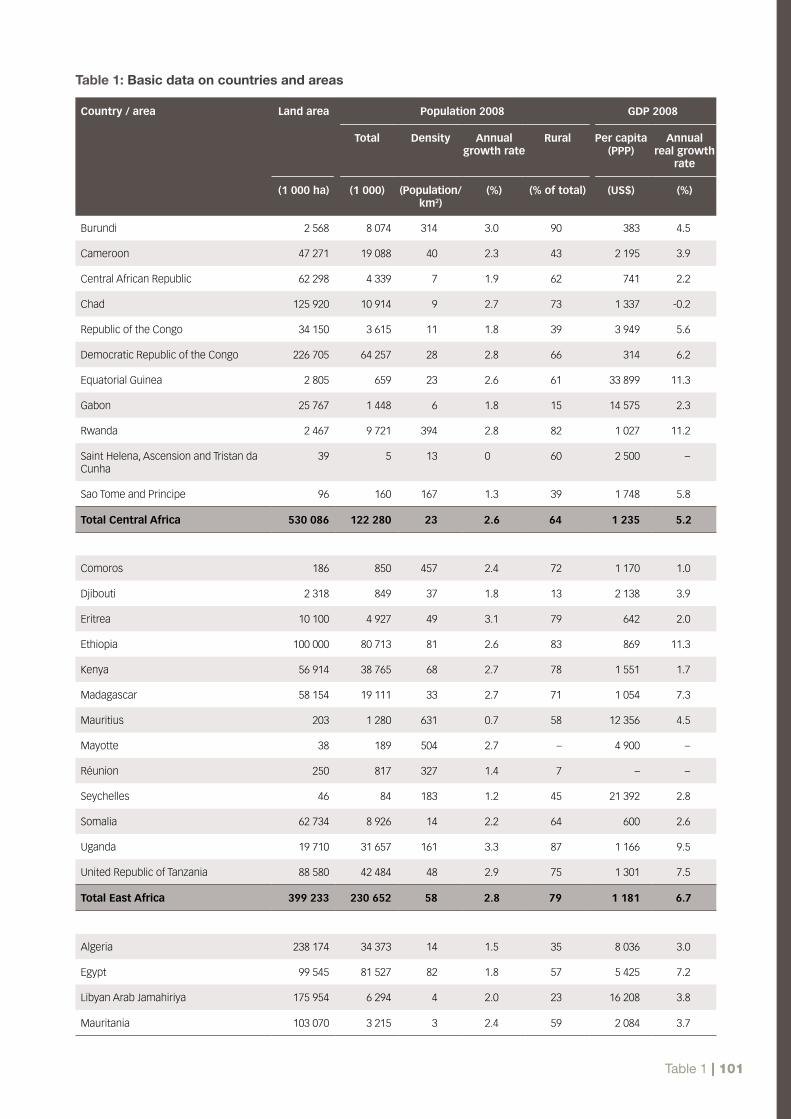
Table 1 | 101
Table 1: Basic data on countries and areas
Country / area Land area Population 2008 GDP 2008
Total Density Annual growth rate
Rural Per capita (PPP)
Annual real growth
rate
(1 000 ha) (1 000) (Population/km2)
(%) (% of total) (US$) (%)
Burundi 2 568 8 074 314 3.0 90 383 4.5
Cameroon 47 271 19 088 40 2.3 43 2 195 3.9
Central African Republic 62 298 4 339 7 1.9 62 741 2.2
Chad 125 920 10 914 9 2.7 73 1 337 -0.2
Republic of the Congo 34 150 3 615 11 1.8 39 3 949 5.6
Democratic Republic of the Congo 226 705 64 257 28 2.8 66 314 6.2
Equatorial Guinea 2 805 659 23 2.6 61 33 899 11.3
Gabon 25 767 1 448 6 1.8 15 14 575 2.3
Rwanda 2 467 9 721 394 2.8 82 1 027 11.2
Saint Helena, Ascension and Tristan da Cunha
39 5 13 0 60 2 500 –
Sao Tome and Principe 96 160 167 1.3 39 1 748 5.8
Total Central Africa 530 086 122 280 23 2.6 64 1 235 5.2
Comoros 186 850 457 2.4 72 1 170 1.0
Djibouti 2 318 849 37 1.8 13 2 138 3.9
Eritrea 10 100 4 927 49 3.1 79 642 2.0
Ethiopia 100 000 80 713 81 2.6 83 869 11.3
Kenya 56 914 38 765 68 2.7 78 1 551 1.7
Madagascar 58 154 19 111 33 2.7 71 1 054 7.3
Mauritius 203 1 280 631 0.7 58 12 356 4.5
Mayotte 38 189 504 2.7 – 4 900 –
Réunion 250 817 327 1.4 7 – –
Seychelles 46 84 183 1.2 45 21 392 2.8
Somalia 62 734 8 926 14 2.2 64 600 2.6
Uganda 19 710 31 657 161 3.3 87 1 166 9.5
United Republic of Tanzania 88 580 42 484 48 2.9 75 1 301 7.5
Total East Africa 399 233 230 652 58 2.8 79 1 181 6.7
Algeria 238 174 34 373 14 1.5 35 8 036 3.0
Egypt 99 545 81 527 82 1.8 57 5 425 7.2
Libyan Arab Jamahiriya 175 954 6 294 4 2.0 23 16 208 3.8
Mauritania 103 070 3 215 3 2.4 59 2 084 3.7

102 | Annex
Country / area Land area Population 2008 GDP 2008
Total Density Annual growth rate
Rural Per capita (PPP)
Annual real growth
rate
(1 000 ha) (1 000) (Population/km2)
(%) (% of total) (US$) (%)
Morocco 44 630 31 606 71 1.2 44 4 263 5.6
Sudan 237 600 41 348 17 2.3 57 2 155 8.3
Tunisia 15 536 10 169 65 1.0 34 7 956 4.5
Western Sahara 26 600 497 2 3.5 19 2 500 –
Total Northern Africa 941 109 209 029 22 1.7 49 5 421 5.5
Angola 124 670 18 021 14 2.7 43 5 820 13.2
Botswana 56 673 1 921 3 1.5 40 13 574 2.9
Lesotho 3 036 2 049 67 0.8 75 1 564 3.9
Malawi 9 408 14 846 158 2.8 81 805 9.7
Mozambique 78 638 22 383 28 2.4 63 838 6.8
Namibia 82 329 2 130 3 2.0 63 6 398 2.9
South Africa 121 447 49 668 41 1.0 39 10 116 3.1
Swaziland 1 720 1 168 68 1.5 75 4 927 2.4
Zambia 74 339 12 620 17 2.5 65 1 357 6.0
Zimbabwe 38 685 12 463 32 0.1 63 337 -14.5
Total Southern Africa 590 945 137 269 23 1.7 54 5 158 4.3
Benin 11 062 8 662 78 3.2 59 1 473 5.1
Burkina Faso 27 360 15 234 56 3.5 81 1 160 4.5
Cape Verde 403 499 124 1.4 40 3 202 2.8
Côte d’Ivoire 31 800 20 591 65 2.3 51 1 652 2.2
Gambia 1 000 1 660 166 2.7 44 1 363 5.9
Ghana 22 754 23 351 103 2.1 50 1 463 7.3
Guinea 24 572 9 833 40 2.3 66 1 056 4.7
Guinea-Bissau 2 812 1 575 56 2.2 70 537 3.3
Liberia 9 632 3 793 39 4.6 40 388 7.1
Mali 122 019 12 706 10 2.4 68 1 129 5.0
Niger 126 670 14 704 12 4.0 84 683 9.5
Nigeria 91 077 151 212 166 2.4 52 2 099 6.0
Senegal 19 253 12 211 63 2.7 58 1 793 3.3
Sierra Leone 7 162 5 560 78 2.6 62 782 5.5

Table 1 | 103
Country / area Land area Population 2008 GDP 2008
Total Density Annual growth rate
Rural Per capita (PPP)
Annual real growth
rate
(1 000 ha) (1 000) (Population/km2)
(%) (% of total) (US$) (%)
Togo 5 439 6 459 119 2.5 58 830 1.1
Total West Africa 503 015 288 050 57 2.6 56 1 696 5.4
Total Africa 2 964 388 987 280 33 2.3 61 2 789 5.2
Armenia 2 820 3 077 109 0.2 36 6 075 6.8
Azerbaijan 8 263 8 731 106 1.1 48 8 771 10.8
Georgia 6 949 4 307 62 -1.2 47 4 966 2.0
Kazakhstan 269 970 15 521 6 0.7 42 11 323 3.2
Kyrgyzstan 19 180 5 414 28 1.3 64 2 193 7.6
Tajikistan 13 996 6 836 49 1.6 74 1 907 7.9
Turkmenistan 46 993 5 044 11 1.3 51 6 625 9.8
Uzbekistan 42 540 27 191 64 1.1 63 2 658 9.0
Total Central Asia 410 711 76 121 19 0.9 55 5 557 6.6
China 932 749 1 344 919 144 0.6 57 5 971 9.0
Democratic People’s Republic of Korea 12 041 23 819 198 0.4 37 1 800 3.7
Japan 36 450 127 293 349 -0.1 34 34 129 -0.7
Mongolia 155 356 2 641 2 1.1 43 3 557 8.9
Republic of Korea 9 692 48 152 497 0.4 19 27 658 2.2
Total East Asia 1 146 288 1 546 824 135 0.5 53 8 895 2.3
Bangladesh 13 017 160 000 1 229 1.4 73 1 335 6.2
Bhutan 3 839 687 18 1.6 66 4 759 13.8
India 297 319 1 181 412 397 1.4 71 2 946 6.1
Maldives 30 305 1 017 1.3 62 5 597 5.2
Nepal 14 335 28 810 201 1.8 83 1 104 5.3
Pakistan 77 088 176 952 230 2.2 64 2 538 2.0
Sri Lanka 6 271 20 061 320 0.9 85 4 564 6.0
Total South Asia 411 899 1 568 227 381 1.5 70 2 724 5.7
Brunei Darussalam 527 392 74 1.8 25 50 665 -1.9
Cambodia 17 652 14 562 82 1.7 79 1 951 6.7
Indonesia 181 157 227 345 125 1.2 49 3 994 6.1
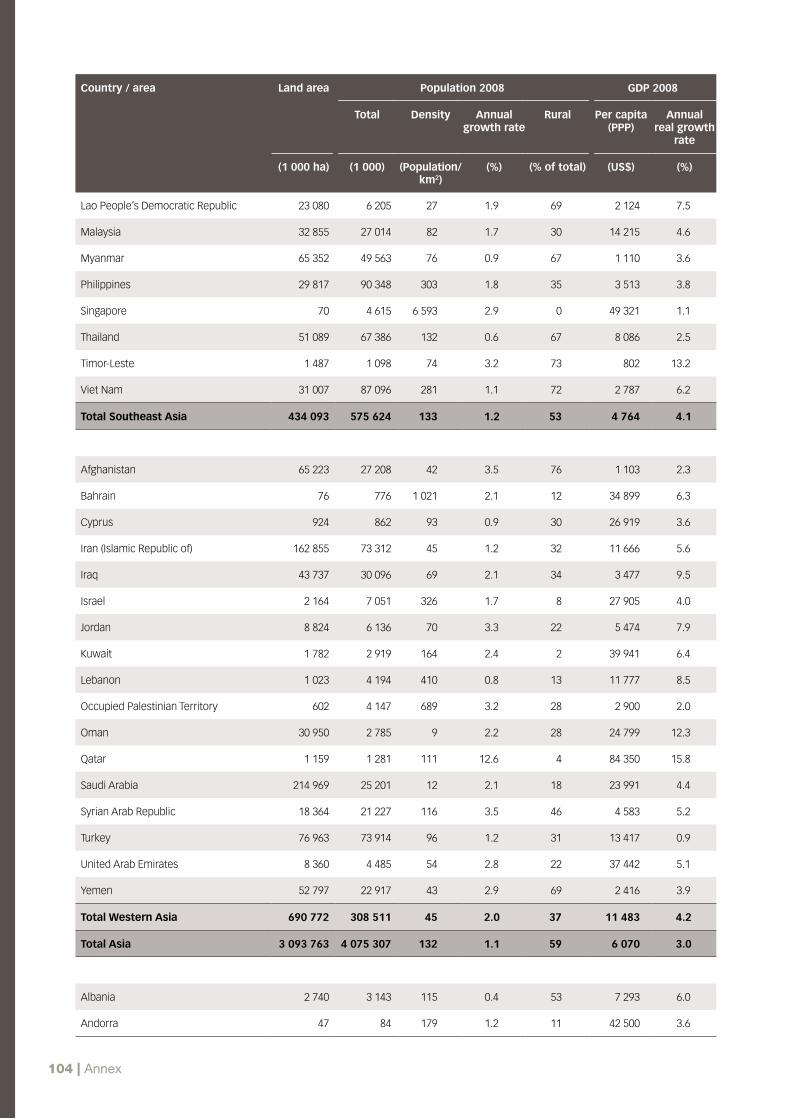
104 | Annex
Country / area Land area Population 2008 GDP 2008
Total Density Annual growth rate
Rural Per capita (PPP)
Annual real growth
rate
(1 000 ha) (1 000) (Population/km2)
(%) (% of total) (US$) (%)
Lao People’s Democratic Republic 23 080 6 205 27 1.9 69 2 124 7.5
Malaysia 32 855 27 014 82 1.7 30 14 215 4.6
Myanmar 65 352 49 563 76 0.9 67 1 110 3.6
Philippines 29 817 90 348 303 1.8 35 3 513 3.8
Singapore 70 4 615 6 593 2.9 0 49 321 1.1
Thailand 51 089 67 386 132 0.6 67 8 086 2.5
Timor-Leste 1 487 1 098 74 3.2 73 802 13.2
Viet Nam 31 007 87 096 281 1.1 72 2 787 6.2
Total Southeast Asia 434 093 575 624 133 1.2 53 4 764 4.1
Afghanistan 65 223 27 208 42 3.5 76 1 103 2.3
Bahrain 76 776 1 021 2.1 12 34 899 6.3
Cyprus 924 862 93 0.9 30 26 919 3.6
Iran (Islamic Republic of) 162 855 73 312 45 1.2 32 11 666 5.6
Iraq 43 737 30 096 69 2.1 34 3 477 9.5
Israel 2 164 7 051 326 1.7 8 27 905 4.0
Jordan 8 824 6 136 70 3.3 22 5 474 7.9
Kuwait 1 782 2 919 164 2.4 2 39 941 6.4
Lebanon 1 023 4 194 410 0.8 13 11 777 8.5
Occupied Palestinian Territory 602 4 147 689 3.2 28 2 900 2.0
Oman 30 950 2 785 9 2.2 28 24 799 12.3
Qatar 1 159 1 281 111 12.6 4 84 350 15.8
Saudi Arabia 214 969 25 201 12 2.1 18 23 991 4.4
Syrian Arab Republic 18 364 21 227 116 3.5 46 4 583 5.2
Turkey 76 963 73 914 96 1.2 31 13 417 0.9
United Arab Emirates 8 360 4 485 54 2.8 22 37 442 5.1
Yemen 52 797 22 917 43 2.9 69 2 416 3.9
Total Western Asia 690 772 308 511 45 2.0 37 11 483 4.2
Total Asia 3 093 763 4 075 307 132 1.1 59 6 070 3.0
Albania 2 740 3 143 115 0.4 53 7 293 6.0
Andorra 47 84 179 1.2 11 42 500 3.6
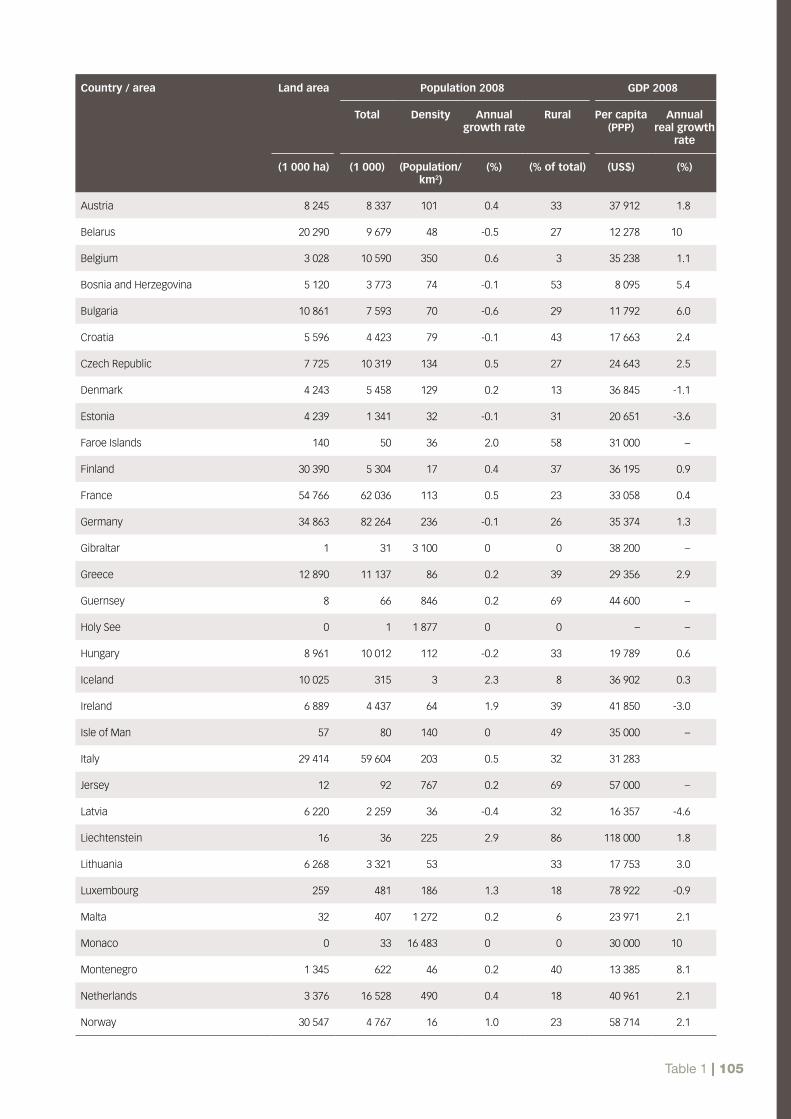
Table 1 | 105
Country / area Land area Population 2008 GDP 2008
Total Density Annual growth rate
Rural Per capita (PPP)
Annual real growth
rate
(1 000 ha) (1 000) (Population/km2)
(%) (% of total) (US$) (%)
Austria 8 245 8 337 101 0.4 33 37 912 1.8
Belarus 20 290 9 679 48 -0.5 27 12 278 10
Belgium 3 028 10 590 350 0.6 3 35 238 1.1
Bosnia and Herzegovina 5 120 3 773 74 -0.1 53 8 095 5.4
Bulgaria 10 861 7 593 70 -0.6 29 11 792 6.0
Croatia 5 596 4 423 79 -0.1 43 17 663 2.4
Czech Republic 7 725 10 319 134 0.5 27 24 643 2.5
Denmark 4 243 5 458 129 0.2 13 36 845 -1.1
Estonia 4 239 1 341 32 -0.1 31 20 651 -3.6
Faroe Islands 140 50 36 2.0 58 31 000 –
Finland 30 390 5 304 17 0.4 37 36 195 0.9
France 54 766 62 036 113 0.5 23 33 058 0.4
Germany 34 863 82 264 236 -0.1 26 35 374 1.3
Gibraltar 1 31 3 100 0 0 38 200 –
Greece 12 890 11 137 86 0.2 39 29 356 2.9
Guernsey 8 66 846 0.2 69 44 600 –
Holy See 0 1 1 877 0 0 – –
Hungary 8 961 10 012 112 -0.2 33 19 789 0.6
Iceland 10 025 315 3 2.3 8 36 902 0.3
Ireland 6 889 4 437 64 1.9 39 41 850 -3.0
Isle of Man 57 80 140 0 49 35 000 –
Italy 29 414 59 604 203 0.5 32 31 283
Jersey 12 92 767 0.2 69 57 000 –
Latvia 6 220 2 259 36 -0.4 32 16 357 -4.6
Liechtenstein 16 36 225 2.9 86 118 000 1.8
Lithuania 6 268 3 321 53 33 17 753 3.0
Luxembourg 259 481 186 1.3 18 78 922 -0.9
Malta 32 407 1 272 0.2 6 23 971 2.1
Monaco 0 33 16 483 0 0 30 000 10
Montenegro 1 345 622 46 0.2 40 13 385 8.1
Netherlands 3 376 16 528 490 0.4 18 40 961 2.1
Norway 30 547 4 767 16 1.0 23 58 714 2.1

106 | Annex
Country / area Land area Population 2008 GDP 2008
Total Density Annual growth rate
Rural Per capita (PPP)
Annual real growth
rate
(1 000 ha) (1 000) (Population/km2)
(%) (% of total) (US$) (%)
Poland 30 422 38 104 125 -0.1 39 17 275 4.9
Portugal 9 147 10 677 117 0.3 41 23 254 0
Republic of Moldova 3 289 3 633 110 -0.9 58 2 979 7.2
Romania 22 990 21 361 93 -0.4 46 13 449 9.4
Russian Federation 1 637 687 141 394 9 -0.4 27 15 923 5.6
San Marino 6 31 517 0 7 41 900 1.9
Serbia 8 836 9 839 111 0.1 48 10 554 1.2
Slovakia 4 810 5 400 112 0.1 44 22 138 6.2
Slovenia 2 014 2 015 100 0.2 52 27 866 3.5
Spain 49 911 44 486 89 1.0 23 31 674 1.2
Svalbard and Jan Mayen Islands 6 100 2 0 0 – – –
Sweden 41 034 9 205 22 0.5 16 36 961 -0.2
Switzerland 4 000 7 541 189 0.4 27 42 415 1.8
The former Yugoslav Republic of Macedonia
2 523 2 041 81 0 33 9 337 5.0
Ukraine 57 933 45 992 79 -0.6 32 7 277 2.1
United Kingdom 24 193 61 461 254 0.5 10 35 468 0.7
Total Europe 2 213 507 731 805 33 0.1 28 25 585 1.1
Anguilla 9 15 167 7.1 0 8 800 15.3
Antigua and Barbuda 44 87 198 1.2 69 20 970 2.5
Aruba 18 105 583 1.0 53 21 800 -1.6
Bahamas 1 001 338 34 1.2 16 30 700 1.0
Barbados 43 255 593 0 60 18 977 0.2
Bermuda 5 65 1 300 0 0 69 900 4.4
British Virgin Islands 15 23 153 0 61 38 500 2.5
Cayman Islands 24 56 233 1.8 0 43 800 3.2
Cuba 10 644 11 205 105 0 24 9 500 4.3
Dominica 75 67 89 0 25 8 706 4.3
Dominican Republic 4 832 9 953 206 1.4 31 8 125 5.3
Grenada 34 104 306 1.0 69 8 882 2.1
Guadeloupe 169 464 275 0.4 2 – –

Table 1 | 107
Country / area Land area Population 2008 GDP 2008
Total Density Annual growth rate
Rural Per capita (PPP)
Annual real growth
rate
(1 000 ha) (1 000) (Population/km2)
(%) (% of total) (US$) (%)
Haiti 2 756 9 876 358 1.6 53 1 124 1.3
Jamaica 1 083 2 708 250 0.4 47 7 716 -1.3
Martinique 106 403 380 0.2 2 – –
Montserrat 10 6 60 0 83 3 400 11.8
Netherlands Antilles 80 195 244 1.6 7 16 000 2.2
Puerto Rico 887 3 965 447 0.4 2 17 800 0.2
Saint Barthélemy 2 7 333 – – – –
Saint Kitts and Nevis 26 51 196 2.0 69 16 467 8.2
Saint Lucia 61 170 279 0.6 72 9 836 0.5
Saint Martin (French part) 5 30 600 – – – –
Saint Vincent and the Grenadines 39 109 279 0 53 8 998 -1.1
Trinidad and Tobago 513 1 333 260 0.4 87 25 173 3.5
Turks and Caicos Islands 95 33 35 3.1 9 11 500 12.9
United States Virgin Islands 35 110 314 0 6 14 500 –
Total Caribbean 22 611 41 733 185 0.8 34 8 648 3.4
Belize 2 281 301 13 2.0 48 6 743 3.8
Costa Rica 5 106 4 519 89 1.3 37 11 232 2.6
El Salvador 2 072 6 134 296 0.4 39 6 799 2.5
Guatemala 10 716 13 686 128 2.5 52 4 760 4.0
Honduras 11 189 7 319 65 2.0 52 3 932 4.0
Nicaragua 12 034 5 667 47 1.3 43 2 689 3.5
Panama 7 434 3 399 46 1.7 27 12 498 9.2
Total Central America 50 832 41 025 81 1.7 45 6 000 4.3
Canada 909 351 33 259 4 1.0 20 39 078 0.4
Greenland 41 045 57 0 0 16 20 000 0.3
Mexico 194 395 108 555 56 1.0 23 14 570 1.8
Saint Pierre and Miquelon 23 6 26 0 17 7 000 –
United States of America 914 742 311 666 34 1.0 18 46 350 0.4
Total North America 2 059 556 453 543 22 1.0 19 38 206 0.5
Total North and Central America 2 132 999 536 301 25 1.0 23 33 443 0.5
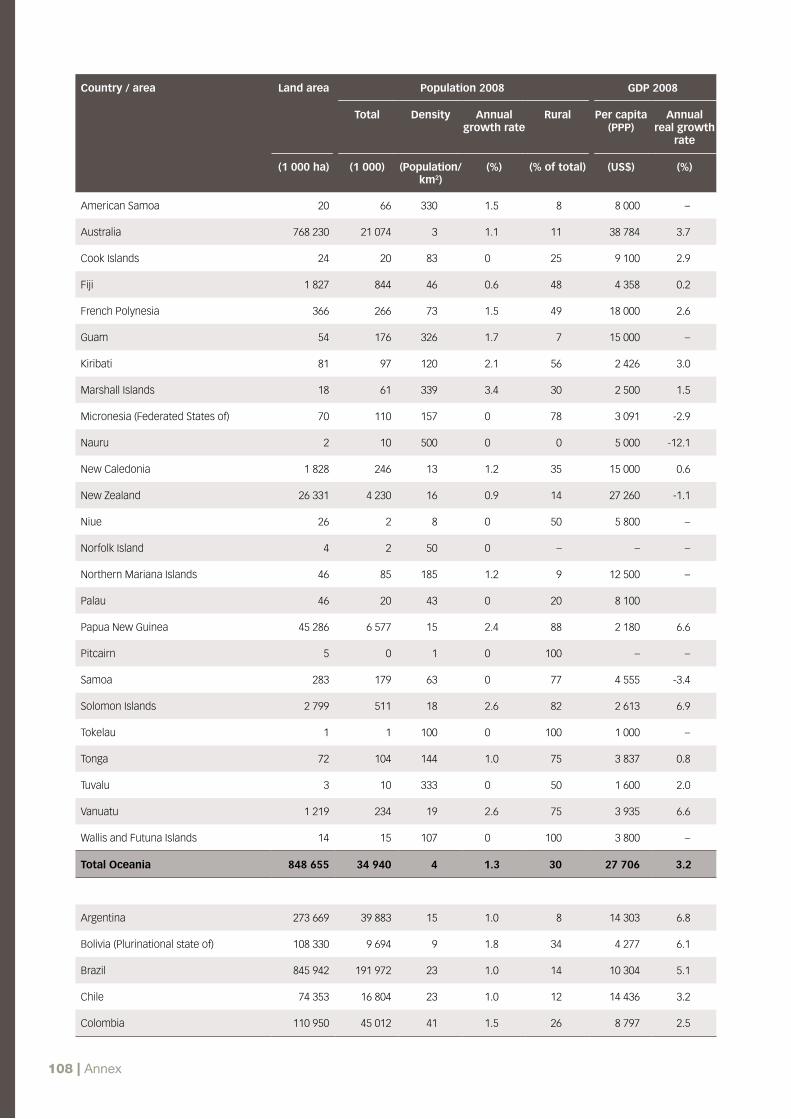
108 | Annex
Country / area Land area Population 2008 GDP 2008
Total Density Annual growth rate
Rural Per capita (PPP)
Annual real growth
rate
(1 000 ha) (1 000) (Population/km2)
(%) (% of total) (US$) (%)
American Samoa 20 66 330 1.5 8 8 000 –
Australia 768 230 21 074 3 1.1 11 38 784 3.7
Cook Islands 24 20 83 0 25 9 100 2.9
Fiji 1 827 844 46 0.6 48 4 358 0.2
French Polynesia 366 266 73 1.5 49 18 000 2.6
Guam 54 176 326 1.7 7 15 000 –
Kiribati 81 97 120 2.1 56 2 426 3.0
Marshall Islands 18 61 339 3.4 30 2 500 1.5
Micronesia (Federated States of) 70 110 157 0 78 3 091 -2.9
Nauru 2 10 500 0 0 5 000 -12.1
New Caledonia 1 828 246 13 1.2 35 15 000 0.6
New Zealand 26 331 4 230 16 0.9 14 27 260 -1.1
Niue 26 2 8 0 50 5 800 –
Norfolk Island 4 2 50 0 – – –
Northern Mariana Islands 46 85 185 1.2 9 12 500 –
Palau 46 20 43 0 20 8 100
Papua New Guinea 45 286 6 577 15 2.4 88 2 180 6.6
Pitcairn 5 0 1 0 100 – –
Samoa 283 179 63 0 77 4 555 -3.4
Solomon Islands 2 799 511 18 2.6 82 2 613 6.9
Tokelau 1 1 100 0 100 1 000 –
Tonga 72 104 144 1.0 75 3 837 0.8
Tuvalu 3 10 333 0 50 1 600 2.0
Vanuatu 1 219 234 19 2.6 75 3 935 6.6
Wallis and Futuna Islands 14 15 107 0 100 3 800 –
Total Oceania 848 655 34 940 4 1.3 30 27 706 3.2
Argentina 273 669 39 883 15 1.0 8 14 303 6.8
Bolivia (Plurinational state of) 108 330 9 694 9 1.8 34 4 277 6.1
Brazil 845 942 191 972 23 1.0 14 10 304 5.1
Chile 74 353 16 804 23 1.0 12 14 436 3.2
Colombia 110 950 45 012 41 1.5 26 8 797 2.5

Table 1 | 109
† A dispute exists between the governments of Argentina and the United Kingdom of Great Britain and Northern Ireland concerning sovereignty over the Falkland Islands (Malvinas).
Source: FAOSTAT (ResourceSTAT and PopSTAT), World Bank (World Development Indicators), IMF (World Economic Outlook database), UNSD (National Accounts Main Aggregates Database) and CIA (World Factbook), last accessed 16 September 2010.
Country / area Land area Population 2008 GDP 2008
Total Density Annual growth rate
Rural Per capita (PPP)
Annual real growth
rate
(1 000 ha) (1 000) (Population/km2)
(%) (% of total) (US$) (%)
Ecuador 24 836 13 481 54 1.0 34 8 014 6.5
Falkland Islands (Malvinas)† 1 217 3 0 0 0 35 400 –
French Guiana 8 220 220 3 2.8 24 – –
Guyana 19 685 763 4 -0.1 72 3 064 3.0
Paraguay 39 730 6 238 16 1.8 40 4 704 5.8
Peru 128 000 28 837 23 1.2 29 8 509 9.8
Suriname 15 600 515 3 1.0 25 7 401 5.1
Uruguay 17 502 3 349 19 0.3 8 12 744 8.9
Venezuela (Bolivarian Republic of) 88 205 28 121 32 1.7 7 12 818 4.8
Total South America 1 756 239 384 892 22 1.2 17 10 446 5.4
TOTAL WORLD 13 009 550 6 750 525 52 1.2 50 10 384 1.7

110 | Annex
Table 2: Forest area and area change
Country / area Extent of forest 2010 Annual change rate
Forest area % of land area
Area per 1 000
people
1990–2000 2000–2010
(1 000 ha) (%) (ha) (1 000 ha) (%) (1 000 ha) (%)
Burundi 172 7 21 -9 -3.7 -3 -1.4
Cameroon 19 916 42 1 043 -220 -0.9 -220 -1.0
Central African Republic 22 605 36 5 210 -30 -0.1 -30 -0.1
Chad 11 525 9 1 056 -79 -0.6 -79 -0.7
Republic of the Congo 22 411 66 6 199 -17 -0.1 -15 -0.1
Democratic Republic of the Congo 154 135 68 2 399 -311 -0.2 -311 -0.2
Equatorial Guinea 1 626 58 2 467 -12 -0.6 -12 -0.7
Gabon 22 000 85 15 193 0 0 0 0
Rwanda 435 18 45 3 0.8 9 2.4
Saint Helena, Ascension and Tristan da Cunha
2 6 400 0 0 0 0
Sao Tome and Principe 27 28 169 0 0 0 0
Total Central Africa 254 854 48 2 084 -676 -0.3 -660 -0.3
Comoros 3 2 4 0 -4.0 -1 -9.3
Djibouti 6 0 7 0 0 0 0
Eritrea 1 532 15 311 -5 -0.3 -4 -0.3
Ethiopia 12 296 11 152 -141 -1.0 -141 -1.1
Kenya 3 467 6 89 -13 -0.3 -12 -0.3
Madagascar 12 553 22 657 -57 -0.4 -57 -0.4
Mauritius 35 17 27 0 0 0 -1.0
Mayotte 14 37 73 0 -1.2 0 -1.3
Réunion 88 35 108 0 0 0 0.1
Seychelles 41 88 485 0 0 0 0
Somalia 6 747 11 756 -77 -1.0 -77 -1.1
Uganda 2 988 15 94 -88 -2.0 -88 -2.6
United Republic of Tanzania 33 428 38 787 -403 -1.0 -403 -1.1
Total East Africa 73 197 18 317 -784 -0.9 -783 -1.0
Algeria 1 492 1 43 -9 -0.5 -9 -0.6
Egypt 70 0 1 2 3.0 1 1.7

Table 2 | 111
Country / area Extent of forest 2010 Annual change rate
Forest area % of land area
Area per 1 000
people
1990–2000 2000–2010
(1 000 ha) (%) (ha) (1 000 ha) (%) (1 000 ha) (%)
Libyan Arab Jamahiriya 217 0 34 0 0 0 0
Mauritania 242 0 75 -10 -2.7 -8 -2.7
Morocco 5 131 11 162 -3 -0.1 11 0.2
Sudan 69 949 29 1 692 -589 -0.8 -54 -0.1
Tunisia 1 006 6 99 19 2.7 17 1.9
Western Sahara 707 3 1 423 0 0 0 0
Total Northern Africa 78 814 8 377 -590 -0.7 -41 -0.1
Angola 58 480 47 3 245 -125 -0.2 -125 -0.2
Botswana 11 351 20 5 909 -118 -0.9 -118 -1.0
Lesotho 44 1 21 0 0.5 0 0.5
Malawi 3 237 34 218 -33 -0.9 -33 -1.0
Mozambique 39 022 50 1 743 -219 -0.5 -217 -0.5
Namibia 7 290 9 3 423 -73 -0.9 -74 -1.0
South Africa 9 241 8 186 0 0 0 0
Swaziland 563 33 482 5 0.9 5 0.8
Zambia 49 468 67 3 920 -167 -0.3 -167 -0.3
Zimbabwe 15 624 40 1 254 -327 -1.6 -327 -1.9
Total Southern Africa 194 320 33 1 416 -1 057 -0.5 -1 056 -0.5
Benin 4 561 41 527 -70 -1.3 -50 -1.0
Burkina Faso 5 649 21 371 -60 -0.9 -60 -1.0
Cape Verde 85 21 171 2 3.6 0 0.4
Côte d’Ivoire 10 403 33 505 11 0.1 8 0.1
Gambia 480 48 289 2 0.4 2 0.4
Ghana 4 940 22 212 -135 -2.0 -115 -2.1
Guinea 6 544 27 666 -36 -0.5 -36 -0.5
Guinea-Bissau 2 022 72 1 284 -10 -0.4 -10 -0.5
Liberia 4 329 45 1 141 -30 -0.6 -30 -0.7
Mali 12 490 10 983 -79 -0.6 -79 -0.6
Niger 1 204 1 82 -62 -3.7 -12 -1.0
Nigeria 9 041 10 60 -410 -2.7 -410 -3.7

112 | Annex
Country / area Extent of forest 2010 Annual change rate
Forest area % of land area
Area per 1 000
people
1990–2000 2000–2010
(1 000 ha) (%) (ha) (1 000 ha) (%) (1 000 ha) (%)
Senegal 8 473 44 694 -45 -0.5 -43 -0.5
Sierra Leone 2 726 38 490 -20 -0.6 -20 -0.7
Togo 287 5 44 -20 -3.4 -20 -5.1
Total West Africa 73 234 15 254 -961 -1.1 -875 -1.1
Total Africa 674 419 23 683 -4 067 -0.6 -3 414 -0.5
Armenia 262 9 85 -4 -1.3 -4 -1.5
Azerbaijan 936 11 107 0 0 0 0
Georgia 2 742 39 637 -1 0 -3 -0.1
Kazakhstan 3 309 1 213 -6 -0.2 -6 -0.2
Kyrgyzstan 954 5 176 2 0.3 10 1.1
Tajikistan 410 3 60 0 0 0 0
Turkmenistan 4 127 9 818 0 0 0 0
Uzbekistan 3 276 8 120 17 0.5 6 0.2
Total Central Asia 16 016 4 210 8 0 4 0
China 206 861 22 154 1 986 1.2 2 986 1.6
Democratic People’s Republic of Korea 5 666 47 238 -127 -1.7 -127 -2.0
Japan 24 979 69 196 -7 0 10 0
Mongolia 10 898 7 4 126 -82 -0.7 -82 -0.7
Republic of Korea 6 222 63 129 -8 -0.1 -7 -0.1
Total East Asia 254 626 22 165 1 762 0.8 2 781 1.2
Bangladesh 1 442 11 9 -3 -0.2 -3 -0.2
Bhutan 3 249 69 4 729 11 0.3 11 0.3
India 68 434 23 58 145 0.2 304 0.5
Maldives 1 3 3 0 0 0 0
Nepal 3 636 25 126 -92 -2.1 -26 -0.7
Pakistan 1 687 2 10 -41 -1.8 -43 -2.2
Sri Lanka 1 860 29 93 -27 -1.2 -22 -1.1
Total South Asia 80 309 19 51 -7 0 221 0.3
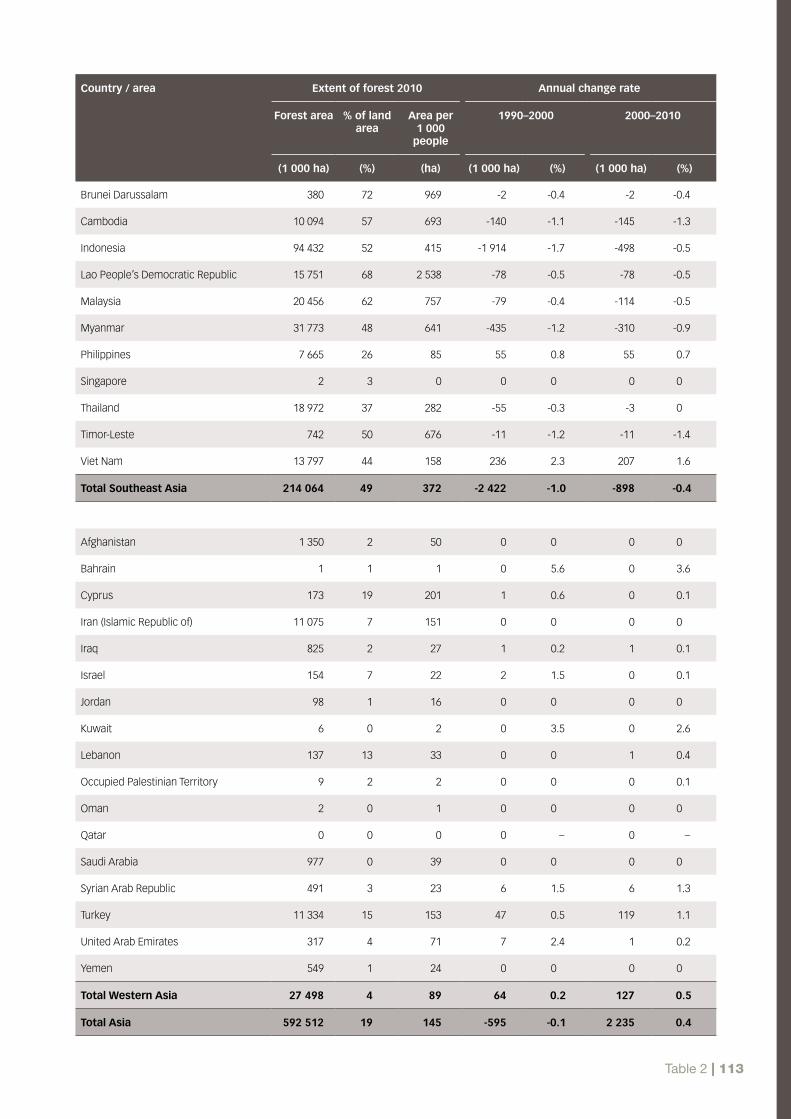
Table 2 | 113
Country / area Extent of forest 2010 Annual change rate
Forest area % of land area
Area per 1 000
people
1990–2000 2000–2010
(1 000 ha) (%) (ha) (1 000 ha) (%) (1 000 ha) (%)
Brunei Darussalam 380 72 969 -2 -0.4 -2 -0.4
Cambodia 10 094 57 693 -140 -1.1 -145 -1.3
Indonesia 94 432 52 415 -1 914 -1.7 -498 -0.5
Lao People’s Democratic Republic 15 751 68 2 538 -78 -0.5 -78 -0.5
Malaysia 20 456 62 757 -79 -0.4 -114 -0.5
Myanmar 31 773 48 641 -435 -1.2 -310 -0.9
Philippines 7 665 26 85 55 0.8 55 0.7
Singapore 2 3 0 0 0 0 0
Thailand 18 972 37 282 -55 -0.3 -3 0
Timor-Leste 742 50 676 -11 -1.2 -11 -1.4
Viet Nam 13 797 44 158 236 2.3 207 1.6
Total Southeast Asia 214 064 49 372 -2 422 -1.0 -898 -0.4
Afghanistan 1 350 2 50 0 0 0 0
Bahrain 1 1 1 0 5.6 0 3.6
Cyprus 173 19 201 1 0.6 0 0.1
Iran (Islamic Republic of) 11 075 7 151 0 0 0 0
Iraq 825 2 27 1 0.2 1 0.1
Israel 154 7 22 2 1.5 0 0.1
Jordan 98 1 16 0 0 0 0
Kuwait 6 0 2 0 3.5 0 2.6
Lebanon 137 13 33 0 0 1 0.4
Occupied Palestinian Territory 9 2 2 0 0 0 0.1
Oman 2 0 1 0 0 0 0
Qatar 0 0 0 0 – 0 –
Saudi Arabia 977 0 39 0 0 0 0
Syrian Arab Republic 491 3 23 6 1.5 6 1.3
Turkey 11 334 15 153 47 0.5 119 1.1
United Arab Emirates 317 4 71 7 2.4 1 0.2
Yemen 549 1 24 0 0 0 0
Total Western Asia 27 498 4 89 64 0.2 127 0.5
Total Asia 592 512 19 145 -595 -0.1 2 235 0.4

114 | Annex
Country / area Extent of forest 2010 Annual change rate
Forest area % of land area
Area per 1 000
people
1990–2000 2000–2010
(1 000 ha) (%) (ha) (1 000 ha) (%) (1 000 ha) (%)
Albania 776 28 247 -2 -0.3 1 0.1
Andorra 16 36 190 0 0 0 0
Austria 3 887 47 466 6 0.2 5 0.1
Belarus 8 630 42 892 49 0.6 36 0.4
Belgium 678 22 64 -1 -0.2 1 0.2
Bosnia and Herzegovina 2 185 43 579 -3 -0.1 0 0
Bulgaria 3 927 36 517 5 0.1 55 1.5
Croatia 1 920 34 434 4 0.2 4 0.2
Czech Republic 2 657 34 257 1 0 2 0.1
Denmark 544 13 100 4 0.9 6 1.1
Estonia 2 217 52 1 653 15 0.7 -3 -0.1
Faroe Islands 0 0 2 0 0 0 0
Finland 22 157 73 4 177 57 0.3 -30 -0.1
France 15 954 29 257 82 0.5 60 0.4
Germany 11 076 32 135 34 0.3 0 0
Gibraltar 0 0 0 0 – 0 –
Greece 3 903 30 350 30 0.9 30 0.8
Guernsey 0 3 3 0 0 0 0
Holy See 0 0 0 0 – 0 –
Hungary 2 029 23 203 11 0.6 12 0.6
Iceland 30 0 95 1 7.8 1 5.0
Ireland 739 11 167 17 3.2 10 1.5
Isle of Man 3 6 43 0 0 0 0
Italy 9 149 31 153 78 1.0 78 0.9
Jersey 1 5 7 0 0 0 0
Latvia 3 354 54 1 485 7 0.2 11 0.3
Liechtenstein 7 43 192 0 0.6 0 0
Lithuania 2 160 34 650 8 0.4 14 0.7
Luxembourg 87 33 180 0 0.1 0 0
Malta 0 1 1 0 0 0 0
Monaco 0 0 0 0 – 0 –
Montenegro 543 40 873 0 0 0 0

Table 2 | 115
Country / area Extent of forest 2010 Annual change rate
Forest area % of land area
Area per 1 000
people
1990–2000 2000–2010
(1 000 ha) (%) (ha) (1 000 ha) (%) (1 000 ha) (%)
Netherlands 365 11 22 2 0.4 1 0.1
Norway 10 065 33 2 111 17 0.2 76 0.8
Poland 9 337 30 245 18 0.2 28 0.3
Portugal 3 456 38 324 9 0.3 4 0.1
Republic of Moldova 386 12 106 1 0.2 6 1.8
Romania 6 573 29 308 -1 0 21 0.3
Russian Federation 809 090 49 5 722 32 0 -18 0
San Marino 0 0 0 0 – 0 –
Serbia 2 713 31 276 15 0.6 25 1.0
Slovakia 1 933 40 358 0 0 1 0.1
Slovenia 1 253 62 622 5 0.4 2 0.2
Spain 18 173 36 409 317 2.1 119 0.7
Svalbard and Jan Mayen Islands 0 0 0 0 – 0 –
Sweden 28 203 69 3 064 11 0 81 0.3
Switzerland 1 240 31 164 4 0.4 5 0.4
The former Yugoslav Republic of Macedonia
998 39 489 5 0.5 4 0.4
Ukraine 9 705 17 211 24 0.3 20 0.2
United Kingdom 2 881 12 47 18 0.7 9 0.3
Total Europe 1 005 001 45 1 373 877 0.1 676 0.1
Anguilla 6 60 367 0 0 0 0
Antigua and Barbuda 10 22 113 0 -0.3 0 -0.2
Aruba 0 2 4 0 0 0 0
Bahamas 515 51 1 524 0 0 0 0
Barbados 8 19 33 0 0 0 0
Bermuda 1 20 15 0 0 0 0
British Virgin Islands 4 24 158 0 -0.1 0 -0.1
Cayman Islands 13 50 227 0 0 0 0
Cuba 2 870 26 256 38 1.7 44 1.7
Dominica 45 60 667 0 -0.5 0 -0.6

116 | Annex
Country / area Extent of forest 2010 Annual change rate
Forest area % of land area
Area per 1 000
people
1990–2000 2000–2010
(1 000 ha) (%) (ha) (1 000 ha) (%) (1 000 ha) (%)
Dominican Republic 1 972 41 198 0 0 0 0
Grenada 17 50 163 0 0 0 0
Guadeloupe 64 39 137 0 -0.3 0 -0.3
Haiti 101 4 10 -1 -0.6 -1 -0.8
Jamaica 337 31 124 0 -0.1 0 -0.1
Martinique 49 46 120 0 0 0 0
Montserrat 3 24 417 0 -3.3 0 0
Netherlands Antilles 1 1 6 0 0 0 0
Puerto Rico 552 62 139 18 4.9 9 1.8
Saint Barthélemy 0 0 0 0* – 0 –
Saint Kitts and Nevis 11 42 216 0 0 0 0
Saint Lucia 47 77 276 0 0.6 0 0.1
Saint Martin (French part) 1 19 33 0 0 0 0
Saint Vincent and the Grenadines 27 68 245 0 0.3 0 0.3
Trinidad and Tobago 226 44 170 -1 -0.3 -1 -0.3
Turks and Caicos Islands 34 80 1 042 0 0 0 0
United States Virgin Islands 20 58 184 0 -0.7 0 -0.8
Total Caribbean 6 933 30 166 53 0.9 50 0.7
Belize 1 393 61 4 628 -10 -0.6 -10 -0.7
Costa Rica 2 605 51 576 -19 -0.8 23 0.9
El Salvador 287 14 47 -5 -1.3 -5 -1.4
Guatemala 3 657 34 267 -54 -1.2 -55 -1.4
Honduras 5 192 46 709 -174 -2.4 -120 -2.1
Nicaragua 3 114 26 549 -70 -1.7 -70 -2.0
Panama 3 251 44 956 -42 -1.2 -12 -0.4
Total Central America 19 499 38 475 -374 -1.6 -248 -1.2
Canada 310 134 34 9 325 0 0 0 0
Greenland 0 0 4 0 0 0 0
Mexico 64 802 33 597 -354 -0.5 -195 -0.3
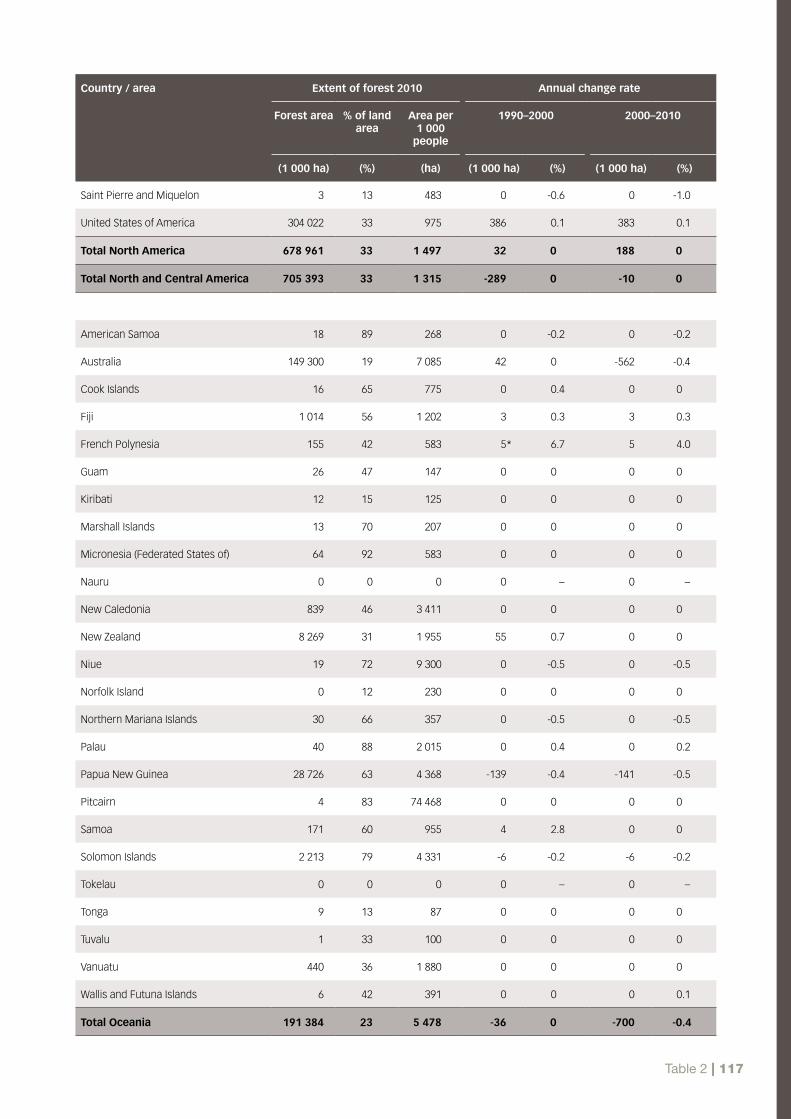
Table 2 | 117
Country / area Extent of forest 2010 Annual change rate
Forest area % of land area
Area per 1 000
people
1990–2000 2000–2010
(1 000 ha) (%) (ha) (1 000 ha) (%) (1 000 ha) (%)
Saint Pierre and Miquelon 3 13 483 0 -0.6 0 -1.0
United States of America 304 022 33 975 386 0.1 383 0.1
Total North America 678 961 33 1 497 32 0 188 0
Total North and Central America 705 393 33 1 315 -289 0 -10 0
American Samoa 18 89 268 0 -0.2 0 -0.2
Australia 149 300 19 7 085 42 0 -562 -0.4
Cook Islands 16 65 775 0 0.4 0 0
Fiji 1 014 56 1 202 3 0.3 3 0.3
French Polynesia 155 42 583 5* 6.7 5 4.0
Guam 26 47 147 0 0 0 0
Kiribati 12 15 125 0 0 0 0
Marshall Islands 13 70 207 0 0 0 0
Micronesia (Federated States of) 64 92 583 0 0 0 0
Nauru 0 0 0 0 – 0 –
New Caledonia 839 46 3 411 0 0 0 0
New Zealand 8 269 31 1 955 55 0.7 0 0
Niue 19 72 9 300 0 -0.5 0 -0.5
Norfolk Island 0 12 230 0 0 0 0
Northern Mariana Islands 30 66 357 0 -0.5 0 -0.5
Palau 40 88 2 015 0 0.4 0 0.2
Papua New Guinea 28 726 63 4 368 -139 -0.4 -141 -0.5
Pitcairn 4 83 74 468 0 0 0 0
Samoa 171 60 955 4 2.8 0 0
Solomon Islands 2 213 79 4 331 -6 -0.2 -6 -0.2
Tokelau 0 0 0 0 – 0 –
Tonga 9 13 87 0 0 0 0
Tuvalu 1 33 100 0 0 0 0
Vanuatu 440 36 1 880 0 0 0 0
Wallis and Futuna Islands 6 42 391 0 0 0 0.1
Total Oceania 191 384 23 5 478 -36 0 -700 -0.4

118 | Annex
Country / area Extent of forest 2010 Annual change rate
Forest area % of land area
Area per 1 000
people
1990–2000 2000–2010
(1 000 ha) (%) (ha) (1 000 ha) (%) (1 000 ha) (%)
Argentina 29 400 11 737 -293 -0.9 -246 -0.8
Bolivia (Plurinational state of) 57 196 53 5 900 -270 -0.4 -290 -0.5
Brazil 519 522 62 2 706 -2 890 -0.5 -2 642 -0.5
Chile 16 231 22 966 57 0.4 40 0.2
Colombia 60 499 55 1 344 -101 -0.2 -101 -0.2
Ecuador 9 865 36 732 -198 -1.5 -198 -1.8
Falkland Islands (Malvinas)† 0 0 0 0 – 0 –
French Guiana 8 082 98 36 736 -7 -0.1 -4 0
Guyana 15 205 77 19 928 0 0 0 0
Paraguay 17 582 44 2 819 -179 -0.9 -179 -1.0
Peru 67 992 53 2 358 -94 -0.1 -122 -0.2
Suriname 14 758 95 28 656 0 0 -2 0
Uruguay 1 744 10 521 49 4.4 33 2.1
Venezuela (Bolivarian Republic of) 46 275 52 1 646 -288 -0.6 -288 -0.6
Total South America 864 351 49 2 246 -4 213 -0.5 -3 997 -0.5
TOTAL WORLD 4 033 060 31 597 -8 323 -0.2 -5 211 -0.1
† A dispute exists between the governments of Argentina and the United Kingdom of Great Britain and Northern Ireland concerning sovereignty over the Falkland Islands (Malvinas).
*FAO estimates based on information provided by these two countries for 2000 and 2005.
Source: FAO, 2010a.
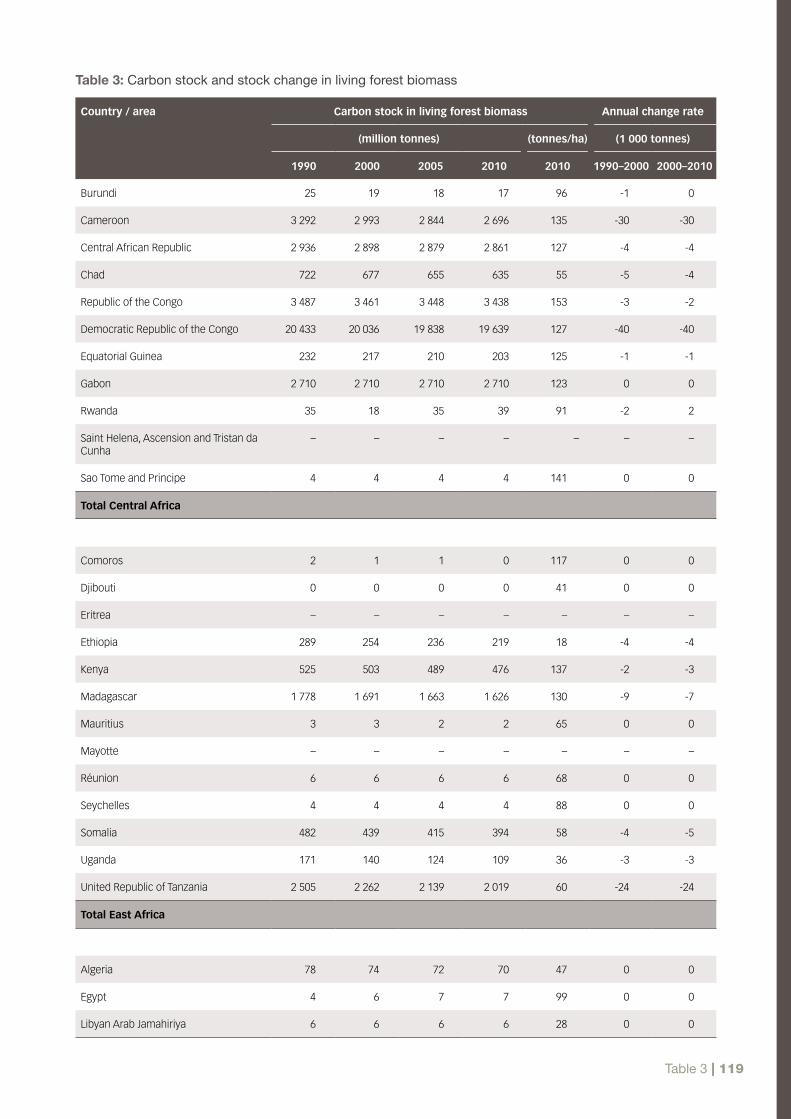
Table 3 | 119
Table 3: Carbon stock and stock change in living forest biomass
Country / area Carbon stock in living forest biomass Annual change rate
(million tonnes) (tonnes/ha) (1 000 tonnes)
1990 2000 2005 2010 2010 1990–2000 2000–2010
Burundi 25 19 18 17 96 -1 0
Cameroon 3 292 2 993 2 844 2 696 135 -30 -30
Central African Republic 2 936 2 898 2 879 2 861 127 -4 -4
Chad 722 677 655 635 55 -5 -4
Republic of the Congo 3 487 3 461 3 448 3 438 153 -3 -2
Democratic Republic of the Congo 20 433 20 036 19 838 19 639 127 -40 -40
Equatorial Guinea 232 217 210 203 125 -1 -1
Gabon 2 710 2 710 2 710 2 710 123 0 0
Rwanda 35 18 35 39 91 -2 2
Saint Helena, Ascension and Tristan da Cunha
– – – – – – –
Sao Tome and Principe 4 4 4 4 141 0 0
Total Central Africa
Comoros 2 1 1 0 117 0 0
Djibouti 0 0 0 0 41 0 0
Eritrea – – – – – – –
Ethiopia 289 254 236 219 18 -4 -4
Kenya 525 503 489 476 137 -2 -3
Madagascar 1 778 1 691 1 663 1 626 130 -9 -7
Mauritius 3 3 2 2 65 0 0
Mayotte – – – – – – –
Réunion 6 6 6 6 68 0 0
Seychelles 4 4 4 4 88 0 0
Somalia 482 439 415 394 58 -4 -5
Uganda 171 140 124 109 36 -3 -3
United Republic of Tanzania 2 505 2 262 2 139 2 019 60 -24 -24
Total East Africa
Algeria 78 74 72 70 47 0 0
Egypt 4 6 7 7 99 0 0
Libyan Arab Jamahiriya 6 6 6 6 28 0 0

120 | Annex
Country / area Carbon stock in living forest biomass Annual change rate
(million tonnes) (tonnes/ha) (1 000 tonnes)
1990 2000 2005 2010 2010 1990–2000 2000–2010
Mauritania 13 10 8 7 30 0 0
Morocco 190 212 224 223 43 2 1
Sudan 1 521 1 403 1 398 1 393 20 -12 -1
Tunisia 6 8 8 9 9 0 0
Western Sahara 33 33 33 33 46 0 0
Total Northern Africa
Angola 4 573 4 479 4 432 4 385 75 -9 -9
Botswana 680 663 655 646 57 -2 -2
Lesotho 2 2 2 2 53 0 0
Malawi 173 159 151 144 44 -1 -2
Mozambique 1 878 1 782 1 733 1 692 43 -10 -9
Namibia 253 232 221 210 29 -2 -2
South Africa 807 807 807 807 87 0 0
Swaziland 23 22 22 22 39 0 0
Zambia 2 579 2 497 2 457 2 416 49 -8 -8
Zimbabwe 697 594 543 492 31 -10 -10
Total Southern Africa
Benin 332 291 277 263 58 -4 -3
Burkina Faso 355 323 308 292 52 -3 -3
Cape Verde 3 5 5 5 58 0 0
Côte d’Ivoire 1 811 1 832 1 847 1 842 177 2 1
Gambia 29 30 31 32 66 0 0
Ghana 564 465 423 381 77 -10 -8
Guinea 687 653 636 619 95 -3 -3
Guinea-Bissau 106 101 98 96 47 -1 -1
Liberia 666 625 605 585 135 -4 -4
Mali 317 300 291 282 23 -2 -2
Niger 60 41 38 37 31 -2 0
Nigeria 2 016 1 550 1 317 1 085 120 -47 -47
Senegal 377 357 348 340 40 -2 -2

Table 3 | 121
Country / area Carbon stock in living forest biomass Annual change rate
(million tonnes) (tonnes/ha) (1 000 tonnes)
1990 2000 2005 2010 2010 1990–2000 2000–2010
Sierra Leone 247 232 224 216 79 -2 -2
Togo – – – – – – –
Total West Africa
Total Africa
Armenia 17 15 14 13 48 0 0
Azerbaijan 54 54 54 54 58 0 0
Georgia 192 203 207 212 77 1 1
Kazakhstan 137 137 137 137 41 0 0
Kyrgyzstan 27 34 37 56 59 1 2
Tajikistan 3 3 3 3 7 0 0
Turkmenistan 11 11 12 12 3 0 0
Uzbekistan 8 14 18 19 6 1 1
Total Central Asia
China 4 414 5 295 5 802 6 203 30 88 91
Democratic People’s Republic of Korea 239 207 190 171 30 -3 -4
Japan 1 159 1 381 1 526 – – 22 –
Mongolia 671 626 605 583 53 -5 -4
Republic of Korea 109 181 224 268 43 7 9
Total East Asia
Bangladesh 84 82 82 80 55 0 0
Bhutan 296 313 324 336 103 2 2
India 2 223 2 377 2 615 2 800 41 15 42
Maldives – – – – – – –
Nepal 602 520 485 485 133 -8 -4
Pakistan 330 271 243 213 126 -6 -6
Sri Lanka 90 74 66 61 33 -2 -1
Total South Asia
Brunei Darussalam 81 76 74 72 188 0 0
Cambodia 609 537 495 464 46 -7 -7

122 | Annex
Country / area Carbon stock in living forest biomass Annual change rate
(million tonnes) (tonnes/ha) (1 000 tonnes)
1990 2000 2005 2010 2010 1990–2000 2000–2010
Indonesia 16 335 15 182 14 299 13 017 138 -115 -217
Lao People’s Democratic Republic 1 186 1 133 1 106 1 074 68 -5 -6
Malaysia 2 822 3 558 3 362 3 212 157 74 -35
Myanmar 2 040 1 814 1 734 1 654 52 -23 -16
Philippines 641 655 660 663 87 1 1
Singapore – – – – – – –
Thailand 908 881 877 880 46 -3 0
Timor-Leste – – – – – – –
Viet Nam 778 927 960 992 72 15 7
Total Southeast Asia
Afghanistan 38 38 38 38 28 0 0
Bahrain – – – – – – –
Cyprus 3 3 3 3 18 0 0
Iran (Islamic Republic of) 249 249 254 258 23 0 1
Iraq – – – – – – –
Israel 5 5 5 5 31 0 0
Jordan 2 2 2 2 24 0 0
Kuwait – – – – – – –
Lebanon – – 2 2 13 – –
Occupied Palestinian Territory – – – – – – –
Oman – – – – – – –
Qatar 0 0 0 0 – 0 0
Saudi Arabia 6 6 6 6 6 0 0
Syrian Arab Republic – – – – – – –
Turkey 686 743 782 822 73 6 8
United Arab Emirates 12 15 16 16 50 0 0
Yemen 5 5 5 5 9 0 0
Total Western Asia
Total Asia
Albania 49 49 48 49 63 0 0
Andorra – – – – – – –

Table 3 | 123
Country / area Carbon stock in living forest biomass Annual change rate
(million tonnes) (tonnes/ha) (1 000 tonnes)
1990 2000 2005 2010 2010 1990–2000 2000–2010
Austria 339 375 399 393 101 4 2
Belarus 386 482 540 611 71 10 13
Belgium 50 61 63 64 95 1 0
Bosnia and Herzegovina 96 118 118 118 54 2 0
Bulgaria 127 161 182 202 51 3 4
Croatia 190 221 237 253 132 3 3
Czech Republic 287 322 339 356 134 4 3
Denmark 22 26 36 37 68 0 1
Estonia – 168 167 165 74 – 0
Faroe Islands – – – – – – –
Finland 721 802 832 832 38 8 3
France 965 1 049 1 165 1 208 76 8 16
Germany 981 1 193 1 283 1 405 127 21 21
Gibraltar 0 0 0 0 – 0 0
Greece 67 73 76 79 20 1 1
Guernsey – – – – – – –
Holy See 0 0 0 0 – 0 0
Hungary 117 130 136 142 70 1 1
Iceland 0 0 0 0 9 0 0
Ireland 16 18 20 23 31 0 0
Isle of Man – – – – – – –
Italy 375 467 512 558 61 9 9
Jersey – – – – – – –
Latvia 193 234 244 272 81 4 4
Liechtenstein 0 1 1 1 74 0 0
Lithuania 134 146 151 153 71 1 1
Luxembourg 7 9 9 9 108 0 0
Malta 0 0 0 0 173 0 0
Monaco 0 0 0 0 – 0 0
Montenegro 33 33 33 33 61 0 0
Netherlands 21 24 26 28 76 0 0
Norway 280 323 360 395 39 4 7
Poland 691 807 887 968 104 12 16
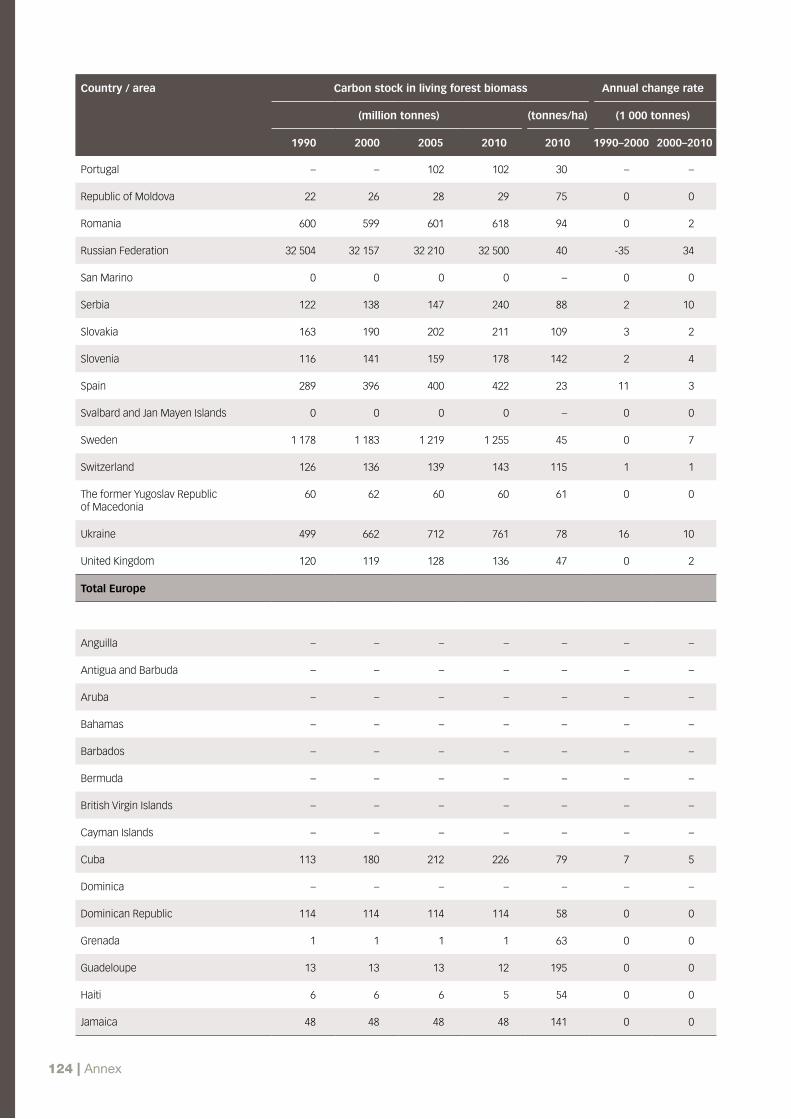
124 | Annex
Country / area Carbon stock in living forest biomass Annual change rate
(million tonnes) (tonnes/ha) (1 000 tonnes)
1990 2000 2005 2010 2010 1990–2000 2000–2010
Portugal – – 102 102 30 – –
Republic of Moldova 22 26 28 29 75 0 0
Romania 600 599 601 618 94 0 2
Russian Federation 32 504 32 157 32 210 32 500 40 -35 34
San Marino 0 0 0 0 – 0 0
Serbia 122 138 147 240 88 2 10
Slovakia 163 190 202 211 109 3 2
Slovenia 116 141 159 178 142 2 4
Spain 289 396 400 422 23 11 3
Svalbard and Jan Mayen Islands 0 0 0 0 – 0 0
Sweden 1 178 1 183 1 219 1 255 45 0 7
Switzerland 126 136 139 143 115 1 1
The former Yugoslav Republic of Macedonia
60 62 60 60 61 0 0
Ukraine 499 662 712 761 78 16 10
United Kingdom 120 119 128 136 47 0 2
Total Europe
Anguilla – – – – – – –
Antigua and Barbuda – – – – – – –
Aruba – – – – – – –
Bahamas – – – – – – –
Barbados – – – – – – –
Bermuda – – – – – – –
British Virgin Islands – – – – – – –
Cayman Islands – – – – – – –
Cuba 113 180 212 226 79 7 5
Dominica – – – – – – –
Dominican Republic 114 114 114 114 58 0 0
Grenada 1 1 1 1 63 0 0
Guadeloupe 13 13 13 12 195 0 0
Haiti 6 6 6 5 54 0 0
Jamaica 48 48 48 48 141 0 0

Table 3 | 125
Country / area Carbon stock in living forest biomass Annual change rate
(million tonnes) (tonnes/ha) (1 000 tonnes)
1990 2000 2005 2010 2010 1990–2000 2000–2010
Martinique – 8 8 8 173 – 0
Montserrat – – – – – – –
Netherlands Antilles – – – – – – –
Puerto Rico 14 23 26 28 51 1 0
Saint Barthélemy 0 0 0 0 – 0 0
Saint Kitts and Nevis – – – – – – –
Saint Lucia – – – – – – –
Saint Martin (French part) – – – – – – –
Saint Vincent and the Grenadines – – – – – – –
Trinidad and Tobago 21 20 20 19 85 0 0
Turks and Caicos Islands – – – – – – –
United States Virgin Islands 1 1 1 1 27 0 0
Total Caribbean
Belize 195 184 178 171 123 -1 -1
Costa Rica 233 217 227 238 91 -2 2
El Salvador – – – – – – –
Guatemala 365 324 303 281 77 -4 -4
Honduras 517 407 368 330 64 -11 -8
Nicaragua 506 428 389 349 112 -8 -8
Panama 429 381 374 367 113 -5 -1
Total Central America
Canada 14 284 14 317 14 021 13 908 45 3 -41
Greenland – – – – – – –
Mexico 2 186 2 111 2 076 2 043 32 -8 -7
Saint Pierre and Miquelon – – – – – – –
United States of America 16 951 17 998 18 631 19 308 64 105 131
Total North America
Total North and Central America
American Samoa 2 2 2 2 110 0 0
Australia 6 724 6 702 6 641 – – -2 –
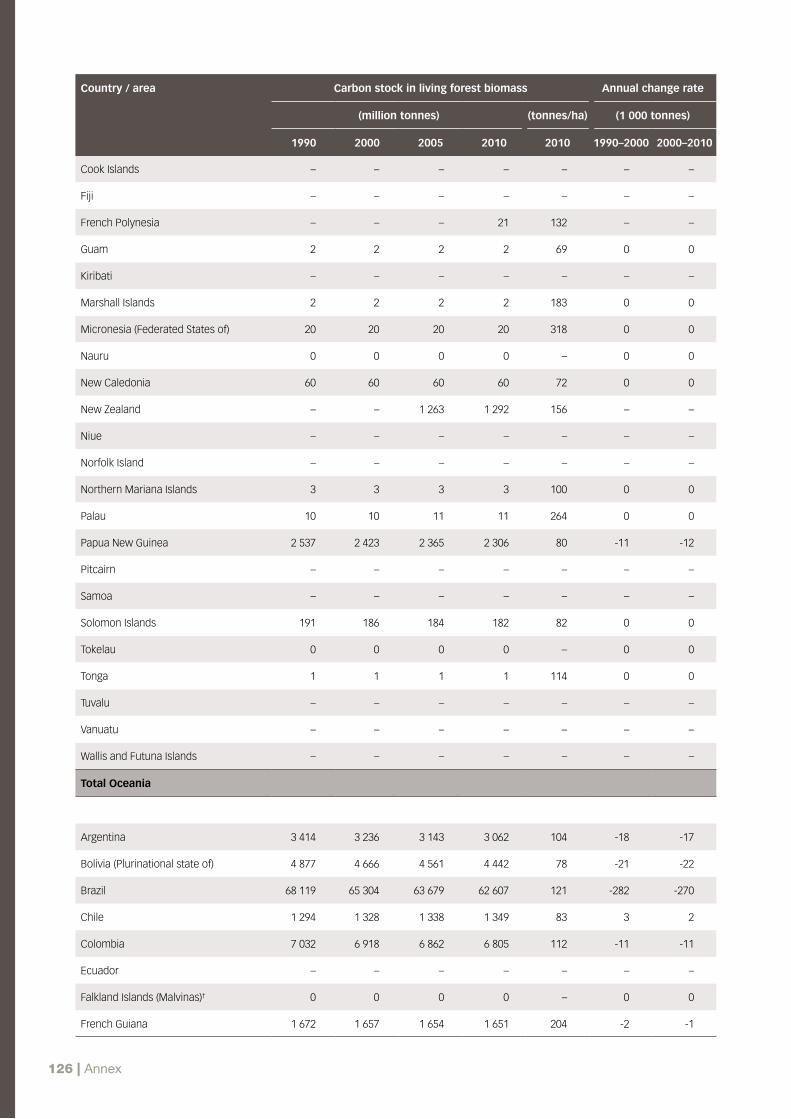
126 | Annex
Country / area Carbon stock in living forest biomass Annual change rate
(million tonnes) (tonnes/ha) (1 000 tonnes)
1990 2000 2005 2010 2010 1990–2000 2000–2010
Cook Islands – – – – – – –
Fiji – – – – – – –
French Polynesia – – – 21 132 – –
Guam 2 2 2 2 69 0 0
Kiribati – – – – – – –
Marshall Islands 2 2 2 2 183 0 0
Micronesia (Federated States of) 20 20 20 20 318 0 0
Nauru 0 0 0 0 – 0 0
New Caledonia 60 60 60 60 72 0 0
New Zealand – – 1 263 1 292 156 – –
Niue – – – – – – –
Norfolk Island – – – – – – –
Northern Mariana Islands 3 3 3 3 100 0 0
Palau 10 10 11 11 264 0 0
Papua New Guinea 2 537 2 423 2 365 2 306 80 -11 -12
Pitcairn – – – – – – –
Samoa – – – – – – –
Solomon Islands 191 186 184 182 82 0 0
Tokelau 0 0 0 0 – 0 0
Tonga 1 1 1 1 114 0 0
Tuvalu – – – – – – –
Vanuatu – – – – – – –
Wallis and Futuna Islands – – – – – – –
Total Oceania
Argentina 3 414 3 236 3 143 3 062 104 -18 -17
Bolivia (Plurinational state of) 4 877 4 666 4 561 4 442 78 -21 -22
Brazil 68 119 65 304 63 679 62 607 121 -282 -270
Chile 1 294 1 328 1 338 1 349 83 3 2
Colombia 7 032 6 918 6 862 6 805 112 -11 -11
Ecuador – – – – – – –
Falkland Islands (Malvinas)† 0 0 0 0 – 0 0
French Guiana 1 672 1 657 1 654 1 651 204 -2 -1

Table 3 | 127
Country / area Carbon stock in living forest biomass Annual change rate
(million tonnes) (tonnes/ha) (1 000 tonnes)
1990 2000 2005 2010 2010 1990–2000 2000–2010
Guyana 1 629 1 629 1 629 1 629 107 0 0
Paraguay – – – – – – –
Peru 8 831 8 713 8 654 8 560 126 -12 -15
Suriname 3 168 3 168 3 168 3 165 214 0 0
Uruguay – – – – – – –
Venezuela (Bolivarian Republic of) – – – – – – –
Total South America
TOTAL WORLD
† A dispute exists between the governments of Argentina and the United Kingdom of Great Britain and Northern Ireland concerning sovereignty over the Falkland Islands (Malvinas).
Source: FAO, 2010a.

128 | Annex
Table 4: Production, trade and consumption of woodfuel, roundwood and sawnwood, 2008
Country / area Woodfuel (1 000 m3)
Industrial roundwood (1 000 m3)
Sawnwood (1 000 m3)
Production Imports Exports Consumption Production Imports Exports Consumption Production Imports Exports Consumption
Burundi 8 965 0 0 8 965 333 0 3 330 83 0 0 83
Cameroon 9 733 0 0 9 733 2 616 0 157 2 459 773 0 258 515
Central African Republic
6 017 0 0 6 017 841 0 57 784 95 0 11 84
Chad 6 830 0 0 6 830 761 1 0 762 2 0 0 2
Republic of the Congo
1 295 0 0 1 295 2 431 1 251 2 180 268 0 40 228
Democratic Republic of the Congo
74 315 0 0 74 315 4 452 5 156 4 301 15 17 29 3
Equatorial Guinea
189 0 0 189 419 0 82 337 4 0 1 3
Gabon 534 0 0 534 3 400 0 2 178 1 222 230 0 62 169
Rwanda 9 591 0 0 9 591 495 6 0 501 79 9 0 87
Saint Helena, Ascension and Tristan da Cunha
0 0 0 0 0 0 0 0 0 0 0 0
Sao Tome and Principe
0 0 0 0 9 0 0 9 5 0 1 5
Total Central Africa
117 469 0 0 117 469 15 757 14 2 884 12 886 1 555 26 402 1 179
Comoros 0 0 0 0 9 0 0 9 0 1 0 1
Djibouti 0 0 0 0 0 3 0 3 0 1 0 1
Eritrea 2 565 0 0 2 565 2 1 0 3 0 1 0 1
Ethiopia 98 489 0 0 98 490 2 928 3 0 2 931 18 14 12 20
Kenya 21 141 0 0 21 141 1 246 11 2 1 256 142 14 0 155
Madagascar 11 910 0 0 11 910 277 16 16 277 92 1 35 58
Mauritius 7 0 0 7 9 3 0 11 3 25 0 28
Mayotte – – – – – – – – – – – –
Réunion 31 0 0 31 5 1 2 3 2 85 0 87
Seychelles 0 0 0 0 0 0 0 0 0 0 0 0
Somalia 11 807 0 0 11 807 110 1 0 111 14 11 0 25
Uganda 38 468 0 0 38 468 3 489 1 19 3 471 117 4 1 121
United Republic of Tanzania
22 352 0 0 22 352 2 314 0 6 2 308 24 4 22 6
Total East Africa
206 769 0 0 206 769 10 389 41 46 10 384 412 162 71 503

Table 4 | 129
Country / area Woodfuel (1 000 m3)
Industrial roundwood (1 000 m3)
Sawnwood (1 000 m3)
Production Imports Exports Consumption Production Imports Exports Consumption Production Imports Exports Consumption
Algeria 7 968 0 0 7 968 103 35 1 136 13 802 0 815
Egypt 17 283 0 0 17 283 268 116 0 384 2 1 911 0 1 913
Libyan Arab Jamahiriya
926 0 0 926 116 8 0 124 31 202 0 232
Mauritania 1 747 0 0 1 747 3 0 0 3 14 2 0 16
Morocco 339 0 0 339 577 407 3 981 83 723 92 714
Sudan 18 326 0 0 18 326 2 173 1 2 2 172 51 91 0 142
Tunisia 2 170 0 0 2 170 218 18 1 235 20 278 0 298
Western Sahara – – – – – – – – – – – –
Total Northern Africa
48 759 0 0 48 760 3 458 585 7 4 035 214 4 010 93 4 131
Angola 3 828 4 0 3 832 1 096 2 6 1 092 5 3 0 8
Botswana 674 0 0 674 105 0 0 105 0 15 0 15
Lesotho 2 076 0 0 2 076 0 0 0 0 0 0 0 0
Malawi 5 293 0 2 5 291 520 0 9 511 45 0 45 0
Mozambique 16 724 1 0 16 724 1 304 10 14 1 300 57 13 47 23
Namibia – – – – – – – – – – – –
South Africa 19 560 0 0 19 561 19 867 60 273 19 654 2 056 488 55 2 488
Swaziland 1 028 0 0 1 028 330 0 0 330 102 0 0 102
Zambia 8 840 0 0 8 840 1 325 4 5 1 324 157 5 25 137
Zimbabwe 8 543 0 0 8 543 771 2 3 770 565 1 54 512
Total Southern Africa
66 567 5 2 66 570 25 318 79 311 25 086 2 986 526 227 3 285
Benin 6 184 0 0 6 184 427 0 51 377 84 0 4 80
Burkina Faso 12 418 0 0 12 418 1 171 2 3 1 170 5 4 0 9
Cape Verde 2 0 0 2 0 4 0 3 0 17 0 17
Côte d’Ivoire 8 835 0 2 8 833 1 469 11 59 1 422 456 0 279 177
Gambia 675 0 0 675 113 0 0 113 1 1 0 2
Ghana 35 363 0 0 35 363 1 392 3 1 1 393 513 0 192 322
Guinea 11 846 0 0 11 846 651 0 18 633 30 0 25 6
Guinea-Bissau 422 0 0 422 170 0 2 168 16 1 0 16
Liberia 6 503 0 0 6 503 420 0 1 419 80 0 0 80
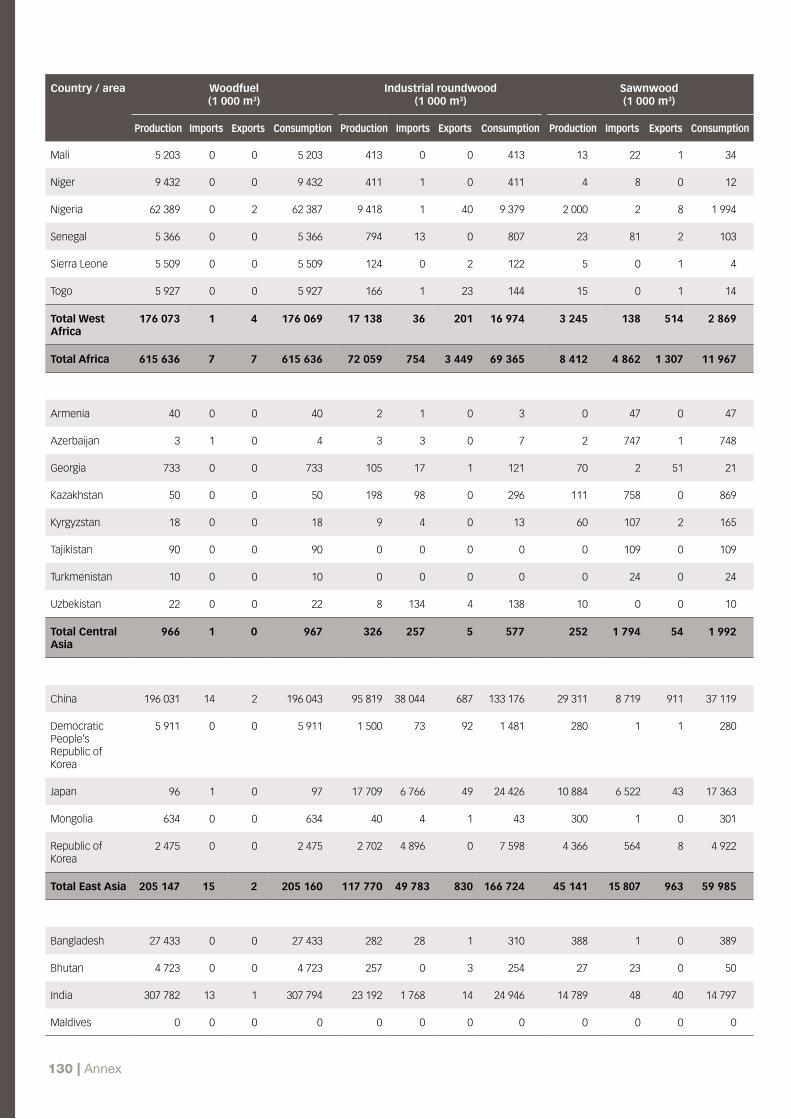
130 | Annex
Country / area Woodfuel (1 000 m3)
Industrial roundwood (1 000 m3)
Sawnwood (1 000 m3)
Production Imports Exports Consumption Production Imports Exports Consumption Production Imports Exports Consumption
Mali 5 203 0 0 5 203 413 0 0 413 13 22 1 34
Niger 9 432 0 0 9 432 411 1 0 411 4 8 0 12
Nigeria 62 389 0 2 62 387 9 418 1 40 9 379 2 000 2 8 1 994
Senegal 5 366 0 0 5 366 794 13 0 807 23 81 2 103
Sierra Leone 5 509 0 0 5 509 124 0 2 122 5 0 1 4
Togo 5 927 0 0 5 927 166 1 23 144 15 0 1 14
Total West Africa
176 073 1 4 176 069 17 138 36 201 16 974 3 245 138 514 2 869
Total Africa 615 636 7 7 615 636 72 059 754 3 449 69 365 8 412 4 862 1 307 11 967
Armenia 40 0 0 40 2 1 0 3 0 47 0 47
Azerbaijan 3 1 0 4 3 3 0 7 2 747 1 748
Georgia 733 0 0 733 105 17 1 121 70 2 51 21
Kazakhstan 50 0 0 50 198 98 0 296 111 758 0 869
Kyrgyzstan 18 0 0 18 9 4 0 13 60 107 2 165
Tajikistan 90 0 0 90 0 0 0 0 0 109 0 109
Turkmenistan 10 0 0 10 0 0 0 0 0 24 0 24
Uzbekistan 22 0 0 22 8 134 4 138 10 0 0 10
Total Central Asia
966 1 0 967 326 257 5 577 252 1 794 54 1 992
China 196 031 14 2 196 043 95 819 38 044 687 133 176 29 311 8 719 911 37 119
Democratic People’s Republic of Korea
5 911 0 0 5 911 1 500 73 92 1 481 280 1 1 280
Japan 96 1 0 97 17 709 6 766 49 24 426 10 884 6 522 43 17 363
Mongolia 634 0 0 634 40 4 1 43 300 1 0 301
Republic of Korea
2 475 0 0 2 475 2 702 4 896 0 7 598 4 366 564 8 4 922
Total East Asia 205 147 15 2 205 160 117 770 49 783 830 166 724 45 141 15 807 963 59 985
Bangladesh 27 433 0 0 27 433 282 28 1 310 388 1 0 389
Bhutan 4 723 0 0 4 723 257 0 3 254 27 23 0 50
India 307 782 13 1 307 794 23 192 1 768 14 24 946 14 789 48 40 14 797
Maldives 0 0 0 0 0 0 0 0 0 0 0 0

Table 4 | 131
Country / area Woodfuel (1 000 m3)
Industrial roundwood (1 000 m3)
Sawnwood (1 000 m3)
Production Imports Exports Consumption Production Imports Exports Consumption Production Imports Exports Consumption
Nepal 12 586 0 0 12 586 1 260 0 2 1 258 630 2 0 631
Pakistan 29 660 0 0 29 660 2 990 283 0 3 273 1 381 129 0 1 510
Sri Lanka 5 357 0 0 5 357 694 0 3 691 61 23 2 82
Total South Asia
387 540 14 1 387 553 28 675 2 080 23 30 732 17 276 226 43 17 459
Brunei Darussalam
12 0 0 12 112 0 0 112 51 1 0 52
Cambodia 8 735 0 0 8 735 118 1 0 119 10 0 6 5
Indonesia 65 034 0 1 65 033 35 551 120 685 34 986 4 330 318 73 4 575
Lao People’s Democratic Republic
5 945 0 0 5 944 194 0 44 150 130 0 84 46
Malaysia 2 908 0 11 2 897 22 744 217 4 811 18 150 4 486 203 2 514 2 174
Myanmar 16 789 0 0 16 789 4 262 0 1 476 2 786 1 610 0 315 1 295
Philippines 12 581 0 0 12 581 3 025 78 7 3 095 358 134 215 278
Singapore 0 1 0 1 0 21 2 19 25 224 195 54
Thailand 19 503 0 0 19 503 8 700 159 0 8 859 2 868 387 384 2 871
Timor-Leste 0 0 0 0 0 0 1 0 0 0 0 0
Viet Nam 22 000 0 0 22 000 5 850 203 8 6 045 5 000 563 129 5 433
Total Southeast Asia
153 506 2 12 153 496 80 555 800 7 034 74 321 18 868 1 830 3 914 16 784
Afghanistan 1 564 0 0 1 564 1 760 0 2 1 758 400 130 1 529
Bahrain 6 0 0 6 0 2 1 2 0 15 0 15
Cyprus 7 0 0 7 13 0 0 13 10 116 1 125
Iran (Islamic Republic of)
67 1 0 68 819 107 0 926 50 909 14 945
Iraq 60 0 0 60 59 2 0 61 12 52 0 64
Israel 2 0 0 2 25 140 0 164 0 454 0 454
Jordan 286 0 0 285 4 5 2 7 0 279 4 275
Kuwait 0 0 0 0 0 1 0 1 0 123 0 123
Lebanon 80 0 0 80 7 38 1 45 9 289 39 259
Occupied Palestinian Territory
– – – – – – – – – – – –

132 | Annex
Country / area Woodfuel (1 000 m3)
Industrial roundwood (1 000 m3)
Sawnwood (1 000 m3)
Production Imports Exports Consumption Production Imports Exports Consumption Production Imports Exports Consumption
Oman 0 0 0 0 0 57 0 57 0 90 0 90
Qatar 5 1 0 5 0 3 2 0 0 63 0 63
Saudi Arabia 0 4 0 4 0 25 0 25 0 1 426 0 1 426
Syrian Arab Republic
26 0 9 18 40 15 3 52 9 280 4 285
Turkey 4 958 110 0 5 068 14 462 1 239 5 15 696 6 175 667 28 6 814
United Arab Emirates
0 1 0 0 0 648 19 630 0 610 109 501
Yemen 410 0 0 410 0 10 0 10 0 160 0 160
Total Western Asia
7 469 118 10 7 577 17 189 2 292 35 19 447 6 665 5 663 200 12 128
Total Asia 754 627 150 25 754 753 244 515 55 212 7 926 291 801 88 202 25 319 5 174 108 347
Albania 350 0 56 294 80 1 0 80 8 24 21 10
Andorra 0 2 0 2 0 0 0 0 0 10 0 10
Austria 5 024 267 39 5 252 16 772 7 550 974 23 348 10 835 1 638 7 196 5 277
Belarus 1 345 1 75 1 271 7 411 76 1 443 6 044 2 458 116 1 197 1 377
Belgium 700 42 7 735 4 000 3 251 1 026 6 225 1 400 2 612 1 948 2 064
Bosnia and Herzegovina
1 440 0 434 1 006 2 571 154 122 2 603 998 39 910 127
Bulgaria 2 692 5 74 2 623 3 379 723 339 3 764 816 122 151 787
Croatia 763 3 241 525 3 706 17 487 3 236 721 424 536 609
Czech Republic 1 880 29 100 1 809 14 307 751 1 906 13 152 4 636 554 1 960 3 230
Denmark 1 106 276 30 1 352 1 680 336 1 142 874 300 4 622 444 4 477
Estonia 1 152 6 87 1 071 3 708 562 1 469 2 802 1 120 540 566 1 094
Faroe Islands 0 0 0 0 0 1 0 1 0 4 0 4
Finland 4 705 242 7 4 940 45 965 13 371 710 58 626 9 881 468 5 992 4 357
France 29 176 35 452 28 759 28 366 2 346 3 505 27 207 9 690 3 992 1 077 12 606
Germany 8 561 473 144 8 890 46 806 5 758 7 040 45 524 23 060 6 303 12 928 16 435
Gibraltar 0 0 0 0 0 0 0 0 0 1 0 1
Greece 795 320 5 1 110 948 588 7 1 529 108 928 14 1 023
Guernsey – – – – – – – – – – – –
Holy See – – – – – – – – – – – –
Hungary 2 561 84 166 2 479 2 822 207 661 2 367 207 374 151 430
Iceland 0 0 0 0 0 1 0 1 0 86 1 85

Table 4 | 133
Country / area Woodfuel (1 000 m3)
Industrial roundwood (1 000 m3)
Sawnwood (1 000 m3)
Production Imports Exports Consumption Production Imports Exports Consumption Production Imports Exports Consumption
Ireland 52 5 5 53 2 180 326 258 2 248 697 412 389 720
Isle of Man – – – – – – – – – – – –
Italy 5 673 782 1 6 455 2 994 3 478 33 6 438 1 384 6 733 243 7 874
Jersey – – – – – – – – – – – –
Latvia 598 2 471 129 8 207 566 3 193 5 581 2 545 232 1 544 1 232
Liechtenstein 13 0 0 13 12 0 8 4 10 0 0 10
Lithuania 1 382 80 63 1 399 4 213 155 1 171 3 197 1 109 300 429 980
Luxembourg 21 5 0 26 332 462 545 249 202 219 89 332
Malta 0 0 0 0 0 0 0 0 0 21 0 21
Monaco – – – – – – – – – – – –
Montenegro 265 0 30 235 192 1 44 149 62 2 49 15
Netherlands 290 9 41 258 827 353 489 691 243 3 101 423 2 921
Norway 2 253 138 2 2 389 8 071 1 808 897 8 981 2 228 936 416 2 747
Poland 3 804 3 67 3 740 30 470 1 868 369 31 969 3 786 918 481 4 222
Portugal 600 0 2 598 10 266 521 1 345 9 442 1 010 203 294 919
Republic of Moldova
309 2 0 311 43 39 3 79 34 143 4 174
Romania 4 150 3 47 4 106 9 517 212 210 9 519 3 794 49 1 910 1 933
Russian Federation
44 700 0 275 44 425 136 700 286 36 784 100 202 21 618 23 15 258 6 383
San Marino – – – – – – – – – – – –
Serbia 1 571 1 3 1 569 1 615 95 45 1 665 672 496 155 1 013
Slovakia 555 58 97 515 8 714 750 2 192 7 272 2 842 143 442 2 543
Slovenia 928 123 318 733 2 062 163 477 1 747 500 795 1 240 55
Spain 2 600 18 153 2 465 14 427 2 860 1 014 16 273 3 142 2 446 240 5 347
Svalbard and Jan Mayen Islands
– – – – – – – – – – – –
Sweden 5 900 142 104 5 938 64 900 6 781 2 349 69 332 17 601 381 12 006 5 976
Switzerland 1 195 8 24 1 179 3 755 341 1 155 2 941 1 540 450 446 1 544
The former Yugoslav Republic of Macedonia
516 0 3 513 193 1 3 191 14 181 17 178
Ukraine 9 520 0 814 8 706 7 364 133 2 582 4 916 2 467 12 1 475 1 004
United Kingdom 558 16 106 468 7 867 491 727 7 631 2 815 5 886 222 8 479
Total Europe 149 702 3 183 4 543 148 341 507 442 57 383 76 723 488 103 136 552 46 939 72 866 110 625

134 | Annex
Country / area Woodfuel (1 000 m3)
Industrial roundwood (1 000 m3)
Sawnwood (1 000 m3)
Production Imports Exports Consumption Production Imports Exports Consumption Production Imports Exports Consumption
Anguilla – – – – – – – – – – – –
Antigua and Barbuda
0 0 0 0 0 0 0 0 0 11 0 11
Aruba 2 0 0 2 0 1 0 1 0 16 0 16
Bahamas 33 0 0 33 17 80 0 97 1 2 2 2
Barbados 5 0 0 5 6 2 0 8 0 11 0 11
Bermuda – – – – – – – – – – – –
British Virgin Islands
1 0 0 1 0 0 0 0 0 4 0 4
Cayman Islands 0 0 0 0 0 2 0 2 0 14 0 14
Cuba 1 273 0 0 1 273 761 0 0 761 182 0 0 182
Dominica 8 0 0 8 0 1 0 1 0 4 0 4
Dominican Republic
895 0 0 895 10 30 0 39 39 289 0 328
Grenada 0 0 0 0 0 0 0 0 0 10 0 10
Guadeloupe 32 0 0 32 0 5 0 5 1 46 0 47
Haiti 2 024 0 0 2 024 239 1 0 240 14 24 0 38
Jamaica 552 0 0 552 277 3 0 280 66 102 0 168
Martinique 24 0 0 24 2 3 0 5 1 29 0 30
Montserrat 0 0 0 0 0 0 0 0 0 4 0 4
Netherlands Antilles
3 0 0 3 0 23 0 23 0 8 0 8
Puerto Rico – – – – – – – – – – – –
Saint Barthélemy
– – – – – – – – – – – –
Saint Kitts and Nevis
0 0 0 0 0 1 0 1 0 5 0 5
Saint Lucia 10 0 0 10 0 7 0 7 0 10 0 10
Saint Martin (French part)
– – – – – – – – – – – –
Saint Vincent and the Grenadines
8 0 0 8 0 6 0 6 0 6 0 6
Trinidad and Tobago
33 0 0 33 47 5 1 52 30 26 0 56
Turks and Caicos Islands
1 0 0 1 0 0 0 0 0 4 0 4
United States Virgin Islands
0 0 0 0 0 0 0 0 0 0 0 0
Total Caribbean 4 904 1 0 4 905 1 359 170 1 1 529 334 624 2 956

Table 4 | 135
Country / area Woodfuel (1 000 m3)
Industrial roundwood (1 000 m3)
Sawnwood (1 000 m3)
Production Imports Exports Consumption Production Imports Exports Consumption Production Imports Exports Consumption
Belize 674 0 0 674 41 4 2 42 35 7 1 40
Costa Rica 3 398 0 0 3 398 1 198 21 144 1 074 1 227 39 7 1 259
El Salvador 4 217 0 0 4 217 682 0 28 654 16 31 0 47
Guatemala 17 319 0 0 17 319 454 6 16 445 366 25 40 350
Honduras 8 617 0 1 8 616 662 5 68 600 349 47 125 271
Nicaragua 6 033 1 0 6 033 93 3 0 95 54 1 3 52
Panama 1 158 0 0 1 158 151 6 80 77 9 7 16 0
Total Central America
41 415 1 1 41 414 3 281 45 338 2 988 2 057 157 194 2 020
Canada 2 715 131 113 2 733 132 232 4 608 2 839 134 001 41 548 1 754 24 219 19 083
Greenland 0 0 0 0 0 1 0 1 0 7 0 7
Mexico 38 676 2 7 38 671 6 425 174 9 6 590 2 814 3 468 64 6 218
Saint Pierre and Miquelon
0 0 0 0 0 0 0 0 0 2 0 2
United States of America
43 614 122 220 43 515 336 895 1 430 10 200 328 125 72 869 22 136 3 703 91 303
Total North America
85 005 255 340 84 920 475 552 6 213 13 048 468 717 117 231 27 367 27 986 116 612
Total North and Central America
131 324 256 341 131 239 480 192 6 428 13 387 473 233 119 622 28 148 28 182 119 588
American Samoa
0 0 0 0 0 0 0 0 0 1 0 1
Australia 7 774 0 0 7 774 27 083 2 1 065 26 020 5 064 575 377 5 262
Cook Islands 0 0 0 0 5 0 1 4 0 4 0 4
Fiji 107 0 0 107 472 0 11 461 90 2 12 80
French Polynesia
4 0 0 4 0 3 0 3 0 22 0 22
Guam – – – – – – – – – – – –
Kiribati 3 0 0 3 0 0 0 0 0 2 0 2
Marshall Islands 0 0 0 0 0 0 0 0 0 6 0 6
Micronesia (Federated States of)
2 0 0 3 0 0 0 0 0 7 0 7
Nauru 0 0 0 0 0 0 0 0 0 0 0 0
New Caledonia 0 0 0 0 5 3 1 7 3 13 1 15
New Zealand – – – – 20 214 6 6 684 13 536 4 341 42 1 794 2 589
Niue 0 0 0 0 0 0 0 0 0 0 0 0

136 | Annex
Country / area Woodfuel (1 000 m3)
Industrial roundwood (1 000 m3)
Sawnwood (1 000 m3)
Production Imports Exports Consumption Production Imports Exports Consumption Production Imports Exports Consumption
Norfolk Island 0 0 0 0 0 0 0 0 0 1 0 1
Northern Mariana Islands
0 0 0 0 0 0 0 0 0 0 0 0
Palau 0 0 0 0 0 1 0 1 0 3 0 3
Papua New Guinea
7 748 0 0 7 748 3 040 0 2 519 521 61 1 40 22
Pitcairn 0 0 0 0 0 0 0 0 0 0 0 0
Samoa 70 0 0 70 6 1 1 6 1 12 0 13
Solomon Islands 126 0 0 126 1 523 0 1 008 515 27 0 25 3
Tokelau 0 0 0 0 0 0 0 0 0 0 0 0
Tonga 2 2 0 4 2 1 1 2 2 11 0 13
Tuvalu 0 0 0 0 0 0 0 0 0 1 0 1
Vanuatu 45 0 1 44 28 0 0 28 28 6 0 34
Wallis and Futuna Islands
0 0 0 0 0 0 0 1 0 1 0 1
Total Oceania 15 881 2 1 15 882 52 378 17 11 290 41 104 9 617 711 2 250 8 079
Argentina 4 652 0 0 4 652 8 884 2 35 8 851 955 163 302 816
Bolivia (Plurinational state of)
2 309 0 0 2 309 910 7 3 914 461 0 90 372
Brazil 140 916 0 0 140 916 115 390 34 121 115 303 24 987 103 2 102 22 988
Chile 14 955 0 0 14 955 39 878 0 44 39 834 7 306 20 3 335 3 991
Colombia 10 547 0 0 10 547 1 611 0 10 1 601 641 5 10 636
Ecuador 4 076 0 0 4 076 1 940 0 47 1 894 417 0 23 394
Falkland Islands (Malvinas)†
0 0 0 0 0 0 0 0 0 0 0 0
French Guiana 116 0 0 116 80 1 2 79 15 1 4 12
Guyana 854 0 0 854 525 0 171 354 74 0 49 26
Paraguay 6 358 0 0 6 358 4 044 0 15 4 029 550 10 109 451
Peru 10 209 0 0 10 209 2 340 10 9 2 341 1 140 29 124 1 045
Suriname 46 0 0 46 191 0 1 190 60 0 0 60
Uruguay 2 210 0 0 2 210 7 244 6 3 818 3 432 284 27 109 202
Venezuela (Bolivarian Republic of)
3 968 0 0 3 968 2 348 0 0 2 348 950 29 6 972
Total South America
201 216 0 0 201 216 185 385 61 4 275 181 171 37 840 386 6 262 31 964
TOTAL WORLD 1 868 386 3 598 4 917 1 867 067 1 541 971 119 856 117 050 1 544 777 400 246 106 365 116 040 390 570
† A dispute exists between the governments of Argentina and the United Kingdom of Great Britain and Northern Ireland concerning sovereignty over the Falkland Islands (Malvinas).
Source: FAOSTAT (ForesSTAT), last accessed 16 September 2010.

Table 5 | 137
Table 5: Production, trade and consumption of wood-based panels, pulp and paper, 2008
Country / area Wood-based panels (1 000 m3)
Pulp for paper (1 000 tonnes)
Paper and paperboard (1 000 tonnes)
Production Imports Exports Consumption Production Imports Exports Consumption Production Imports Exports Consumption
Burundi 0 1 0 1 0 0 0 0 0 2 0 2
Cameroon 117 0 30 88 0 2 0 2 0 52 0 52
Central African Republic
2 0 0 2 0 0 0 0 0 1 1 0
Chad 0 1 0 1 0 0 0 0 0 0 0 0
Republic of the Congo
20 1 7 14 0 0 0 0 0 9 0 9
Democratic Republic of the Congo
3 3 1 5 0 0 0 0 3 15 1 17
Equatorial Guinea
15 2 7 10 0 0 0 0 0 0 0 0
Gabon 267 1 80 188 0 0 0 0 0 6 0 5
Rwanda 0 3 0 3 0 0 0 0 0 4 0 4
Saint Helena, Ascension and Tristan da Cunha
0 0 0 0 0 0 0 0 0 0 0 0
Sao Tome and Principe
0 0 0 0 0 0 0 0 0 8 0 7
Total Central Africa
424 13 125 312 0 3 0 3 3 97 3 98
Comoros 0 0 0 0 0 0 0 0 0 0 0 0
Djibouti 0 4 0 4 0 4 0 4 0 13 0 13
Eritrea 0 1 0 1 0 0 0 0 0 1 0 1
Ethiopia 83 23 0 105 9 7 0 16 16 63 0 79
Kenya 83 17 16 84 113 3 0 116 279 177 24 432
Madagascar 1 3 0 5 3 0 0 3 10 29 1 38
Mauritius 0 25 1 24 0 1 0 1 0 43 2 41
Mayotte – – – – – – – – – – – –
Réunion 0 24 0 23 0 0 0 0 0 15 0 15
Seychelles 0 1 0 1 0 0 0 0 0 0 0 0
Somalia 0 3 0 3 0 0 0 0 0 0 0 0
Uganda 24 6 1 29 0 0 0 0 3 67 1 69
United Republic of Tanzania
5 23 1 27 56 0 0 56 25 61 27 59
Total East Africa
195 130 18 307 181 15 0 196 333 470 55 748
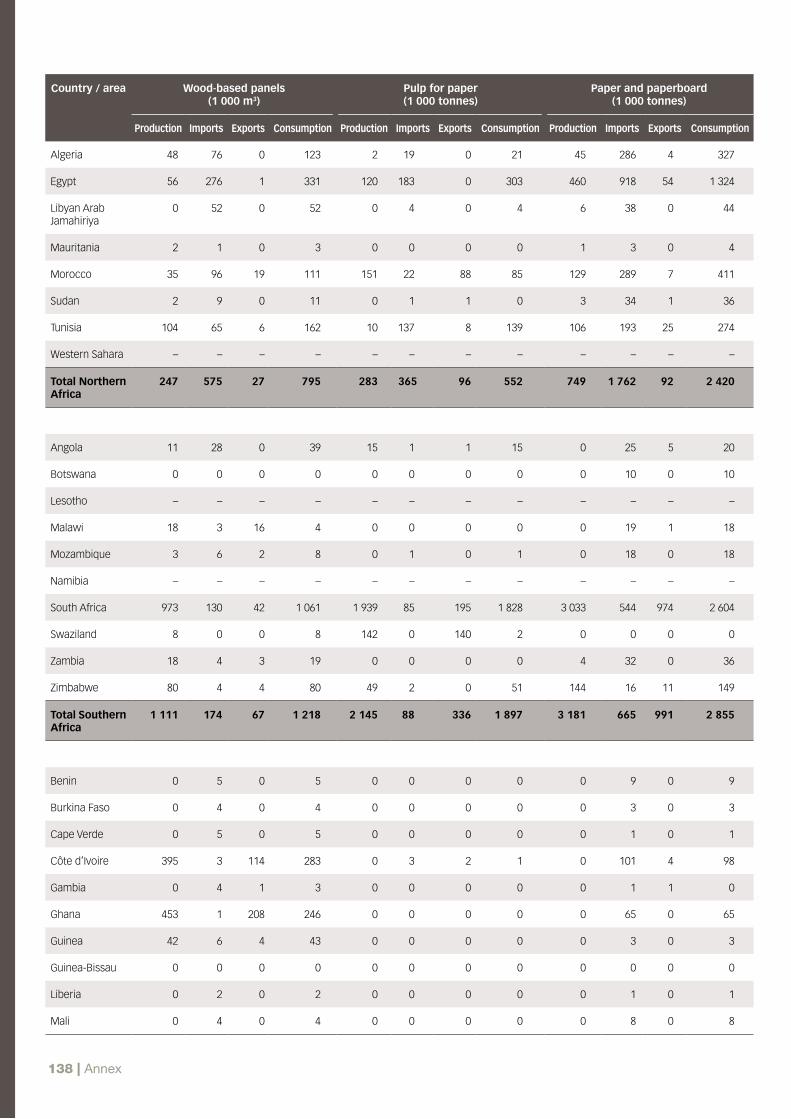
138 | Annex
Country / area Wood-based panels (1 000 m3)
Pulp for paper (1 000 tonnes)
Paper and paperboard (1 000 tonnes)
Production Imports Exports Consumption Production Imports Exports Consumption Production Imports Exports Consumption
Algeria 48 76 0 123 2 19 0 21 45 286 4 327
Egypt 56 276 1 331 120 183 0 303 460 918 54 1 324
Libyan Arab Jamahiriya
0 52 0 52 0 4 0 4 6 38 0 44
Mauritania 2 1 0 3 0 0 0 0 1 3 0 4
Morocco 35 96 19 111 151 22 88 85 129 289 7 411
Sudan 2 9 0 11 0 1 1 0 3 34 1 36
Tunisia 104 65 6 162 10 137 8 139 106 193 25 274
Western Sahara – – – – – – – – – – – –
Total Northern Africa
247 575 27 795 283 365 96 552 749 1 762 92 2 420
Angola 11 28 0 39 15 1 1 15 0 25 5 20
Botswana 0 0 0 0 0 0 0 0 0 10 0 10
Lesotho – – – – – – – – – – – –
Malawi 18 3 16 4 0 0 0 0 0 19 1 18
Mozambique 3 6 2 8 0 1 0 1 0 18 0 18
Namibia – – – – – – – – – – – –
South Africa 973 130 42 1 061 1 939 85 195 1 828 3 033 544 974 2 604
Swaziland 8 0 0 8 142 0 140 2 0 0 0 0
Zambia 18 4 3 19 0 0 0 0 4 32 0 36
Zimbabwe 80 4 4 80 49 2 0 51 144 16 11 149
Total Southern Africa
1 111 174 67 1 218 2 145 88 336 1 897 3 181 665 991 2 855
Benin 0 5 0 5 0 0 0 0 0 9 0 9
Burkina Faso 0 4 0 4 0 0 0 0 0 3 0 3
Cape Verde 0 5 0 5 0 0 0 0 0 1 0 1
Côte d’Ivoire 395 3 114 283 0 3 2 1 0 101 4 98
Gambia 0 4 1 3 0 0 0 0 0 1 1 0
Ghana 453 1 208 246 0 0 0 0 0 65 0 65
Guinea 42 6 4 43 0 0 0 0 0 3 0 3
Guinea-Bissau 0 0 0 0 0 0 0 0 0 0 0 0
Liberia 0 2 0 2 0 0 0 0 0 1 0 1
Mali 0 4 0 4 0 0 0 0 0 8 0 8

Table 5 | 139
Country / area Wood-based panels (1 000 m3)
Pulp for paper (1 000 tonnes)
Paper and paperboard (1 000 tonnes)
Production Imports Exports Consumption Production Imports Exports Consumption Production Imports Exports Consumption
Niger 0 6 0 6 0 2 0 2 0 3 0 2
Nigeria 95 68 3 161 23 35 1 57 19 357 1 375
Senegal 0 10 0 10 0 1 0 1 0 47 3 44
Sierra Leone 0 5 0 4 0 2 1 1 0 2 1 1
Togo 1 4 4 0 0 0 0 0 0 9 1 8
Total West Africa
986 126 336 775 23 43 3 63 19 610 12 617
Total Africa 2 962 1 019 574 3 407 2 632 515 437 2 710 4 285 3 604 1 153 6 737
Armenia 6 189 0 196 0 0 0 0 6 4 0 10
Azerbaijan 0 266 0 266 0 0 0 0 3 56 0 60
Georgia 5 92 3 94 0 0 0 0 2 28 0 29
Kazakhstan 4 647 0 651 0 3 0 3 238 180 10 408
Kyrgyzstan 0 34 0 34 0 0 0 0 0 17 0 17
Tajikistan 0 0 0 0 0 0 0 0 0 1 0 1
Turkmenistan 0 3 1 2 0 0 0 0 0 1 0 1
Uzbekistan 3 457 3 458 9 2 3 9 2 37 6 33
Total Central Asia
19 1 689 8 1 700 9 6 3 13 251 324 16 560
China 79 947 3 359 10 977 72 329 20 506 9 761 99 30 168 83 685 5 388 4 850 84 223
Democratic People’s Republic of Korea
0 8 0 8 106 38 0 144 80 14 2 92
Japan 4 609 4 656 42 9 223 10 706 1 916 176 12 447 28 360 1 544 1 624 28 280
Mongolia 2 8 0 10 0 0 0 0 0 14 0 14
Republic of Korea
3 689 1 825 37 5 478 536 2 482 0 3 018 10 642 804 2 675 8 771
Total East Asia 88 247 9 856 11 056 87 046 31 854 14 197 275 45 776 122 767 7 765 9 152 121 380
Bangladesh 9 19 3 25 65 52 0 117 58 140 0 198
Bhutan 43 0 15 28 0 1 0 0 10 1 1 10
India 2 592 126 65 2 653 4 048 432 21 4 459 7 600 1 734 373 8 961
Maldives 0 4 0 4 0 0 0 0 0 1 0 1
Nepal 30 2 2 30 15 0 1 14 13 19 2 30

140 | Annex
Country / area Wood-based panels (1 000 m3)
Pulp for paper (1 000 tonnes)
Paper and paperboard (1 000 tonnes)
Production Imports Exports Consumption Production Imports Exports Consumption Production Imports Exports Consumption
Pakistan 547 288 0 835 411 92 0 503 1 079 443 2 1 520
Sri Lanka 161 53 150 64 21 1 0 22 25 308 2 331
Total South Asia
3 383 492 235 3 640 4 560 578 22 5 115 8 785 2 647 380 11 051
Brunei Darussalam
0 2 0 2 0 0 0 0 0 6 1 5
Cambodia 7 4 2 9 0 0 0 0 0 44 0 44
Indonesia 4 332 656 3 329 1 659 5 282 813 2 622 3 473 7 777 401 3 574 4 603
Lao People’s Democratic Republic
24 4 10 19 0 4 0 4 0 8 0 8
Malaysia 13 054 785 6 266 7 573 124 220 10 334 1 105 2 016 308 2 812
Myanmar 148 4 79 73 40 1 0 41 45 34 0 79
Philippines 341 208 76 474 212 77 23 267 1 097 421 132 1 386
Singapore 355 314 147 522 0 12 1 11 87 699 163 623
Thailand 3 788 186 2 556 1 417 935 398 125 1 208 4 108 756 1 026 3 838
Timor-Leste 0 0 0 0 0 0 0 0 0 0 0 0
Viet Nam 564 488 33 1 018 626 132 0 758 1 324 648 24 1 948
Total Southeast Asia
22 613 2 651 12 498 12 766 7 218 1 657 2 780 6 095 15 543 5 032 5 228 15 347
Afghanistan 1 20 1 21 0 0 0 0 0 4 0 4
Bahrain 0 30 0 30 0 4 0 4 15 38 0 53
Cyprus 2 148 0 150 0 1 0 1 0 75 0 75
Iran (Islamic Republic of)
797 574 7 1 364 495 75 0 570 370 571 4 936
Iraq 5 36 0 41 11 1 0 12 33 12 0 45
Israel 181 289 13 456 15 139 17 137 396 518 20 894
Jordan 0 143 7 136 8 92 2 99 54 190 45 199
Kuwait 0 76 0 75 0 12 1 12 56 160 11 206
Lebanon 46 294 2 338 0 42 0 42 103 204 13 294
Occupied Palestinian Territory
– – – – – – – – – – – –
Oman 0 107 0 106 0 1 0 1 0 78 4 74
Qatar 0 129 0 129 0 3 0 3 0 47 14 33

Table 5 | 141
Country / area Wood-based panels (1 000 m3)
Pulp for paper (1 000 tonnes)
Paper and paperboard (1 000 tonnes)
Production Imports Exports Consumption Production Imports Exports Consumption Production Imports Exports Consumption
Saudi Arabia 0 1 274 20 1 254 0 68 0 68 279 1 704 47 1 935
Syrian Arab Republic
27 103 0 129 0 41 0 41 75 233 3 304
Turkey 5 614 933 781 5 766 118 591 1 709 4 442 2 212 288 6 366
United Arab Emirates
0 788 209 579 0 47 1 46 81 657 69 668
Yemen 0 167 0 167 0 0 0 0 1 84 0 85
Total Western Asia
6 674 5 109 1 041 10 741 647 1 118 21 1 743 5 905 6 787 521 12 172
Total Asia 120 935 19 796 24 838 115 893 44 289 17 556 3 102 58 743 153 251 22 555 15 296 160 510
Albania 11 112 0 123 0 4 0 4 0 18 1 17
Andorra 0 2 0 2 0 0 0 0 0 2 0 2
Austria 3 713 725 3 079 1 359 1 715 674 272 2 117 5 153 1 284 4 278 2 158
Belarus 895 190 359 726 66 26 0 92 285 141 86 340
Belgium 2 295 1 740 2 404 1 631 920 737 1 337 320 2 006 4 134 3 390 2 750
Bosnia and Herzegovina
29 229 15 243 33 0 0 33 160 12 0 172
Bulgaria 845 807 447 1 205 137 11 68 81 326 278 104 500
Croatia 181 344 145 380 96 0 45 51 535 266 124 677
Czech Republic 1 681 688 1 164 1 205 702 178 351 529 932 1 389 813 1 508
Denmark 446 2 421 231 2 636 5 75 18 62 418 1 205 253 1 370
Estonia 422 176 285 313 200 0 125 75 68 149 97 120
Faroe Islands 0 1 0 1 0 0 0 0 0 2 0 1
Finland 1 715 411 1 287 839 12 087 396 2 226 10 257 13 549 497 11 852 2 195
France 6 168 2 271 3 065 5 373 2 220 1 972 624 3 568 9 420 6 144 4 932 10 632
Germany 14 674 5 284 8 783 11 175 2 909 4 887 1 002 6 794 22 842 11 139 13 254 20 727
Gibraltar 0 0 0 0 0 0 0 0 0 0 0 0
Greece 918 367 71 1 214 0 80 1 79 409 701 119 991
Guernsey – – – – – – – – – – – –
Holy See – – – – – – – – – – – –
Hungary 779 345 396 728 20 107 1 126 424 853 262 1 015
Iceland 0 17 0 17 0 0 0 0 0 33 0 32
Ireland 778 263 614 427 0 2 0 2 45 529 77 497

142 | Annex
Country / area Wood-based panels (1 000 m3)
Pulp for paper (1 000 tonnes)
Paper and paperboard (1 000 tonnes)
Production Imports Exports Consumption Production Imports Exports Consumption Production Imports Exports Consumption
Isle of Man – – – – – – – – – – – –
Italy 5 136 2 570 997 6 709 664 3 210 45 3 828 9 467 5 048 3 389 11 125
Jersey – – – – – – – – – – – –
Latvia 664 121 599 186 0 0 0 0 52 141 39 153
Liechtenstein 2 0 0 2 1 0 0 1 0 0 0 0
Lithuania 617 487 208 896 0 21 0 21 123 184 95 212
Luxembourg 409 32 275 166 0 0 0 0 31 168 40 159
Malta 0 33 0 32 0 0 0 0 0 32 2 30
Monaco – – – – – – – – – – – –
Montenegro 0 11 11 0 0 0 0 0 0 7 0 6
Netherlands 33 1 894 411 1 516 142 1 333 600 875 2 977 3 413 2 374 4 016
Norway 498 342 217 623 2 099 44 490 1 653 1 900 484 1 643 741
Poland 8 124 1 887 2 275 7 735 1 151 648 33 1 766 3 044 2 843 1 496 4 391
Portugal 1 347 597 984 960 2 022 139 945 1 216 1 669 778 1 284 1 163
Republic of Moldova
0 0 0 0 0 0 0 0 98 55 6 147
Romania 1 917 1 794 862 2 849 42 27 4 65 422 356 102 676
Russian Federation
10 665 1 594 2 220 10 039 7 003 80 1 875 5 208 7 700 1 478 2 634 6 544
San Marino – – – – – – – – – – – –
Serbia 179 397 56 520 20 15 1 34 268 456 84 640
Slovakia 952 680 652 980 693 157 130 720 921 444 598 767
Slovenia 517 259 535 241 73 230 67 236 672 274 605 341
Spain 3 853 1 333 2 234 2 952 2 878 981 894 2 965 6 605 3 997 2 860 7 741
Svalbard and Jan Mayen Islands
– – – – – – – – – – – –
Sweden 875 1 099 331 1 644 12 060 450 3 412 9 098 12 557 985 10 580 2 962
Switzerland 977 588 761 804 142 520 22 640 1 698 973 823 1 848
The former Yugoslav Republic of Macedonia
0 112 5 107 0 1 0 1 23 99 10 112
Ukraine 2 029 676 491 2 214 0 113 0 113 937 839 198 1 578
United Kingdom 3 140 3 390 520 6 010 277 1 216 9 1 483 4 983 7 297 898 11 382
Total Europe 77 484 36 291 36 992 76 783 50 377 18 336 14 598 54 114 112 719 59 126 69 405 102 440
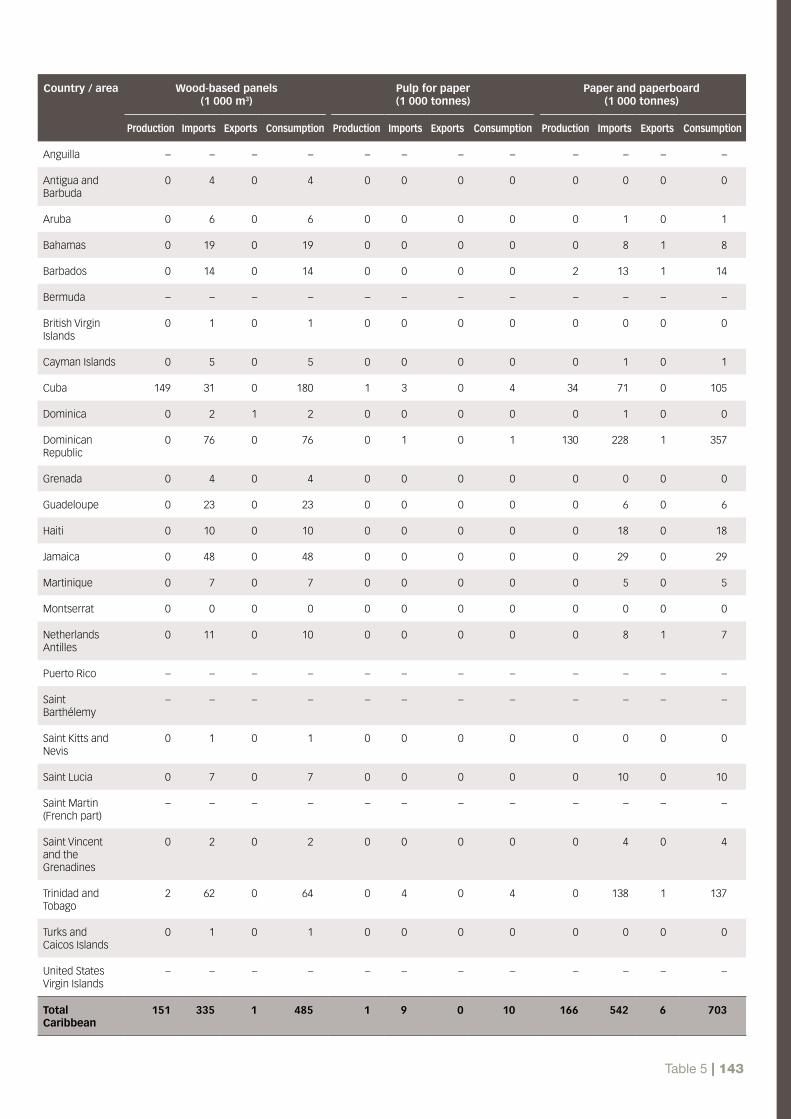
Table 5 | 143
Country / area Wood-based panels (1 000 m3)
Pulp for paper (1 000 tonnes)
Paper and paperboard (1 000 tonnes)
Production Imports Exports Consumption Production Imports Exports Consumption Production Imports Exports Consumption
Anguilla – – – – – – – – – – – –
Antigua and Barbuda
0 4 0 4 0 0 0 0 0 0 0 0
Aruba 0 6 0 6 0 0 0 0 0 1 0 1
Bahamas 0 19 0 19 0 0 0 0 0 8 1 8
Barbados 0 14 0 14 0 0 0 0 2 13 1 14
Bermuda – – – – – – – – – – – –
British Virgin Islands
0 1 0 1 0 0 0 0 0 0 0 0
Cayman Islands 0 5 0 5 0 0 0 0 0 1 0 1
Cuba 149 31 0 180 1 3 0 4 34 71 0 105
Dominica 0 2 1 2 0 0 0 0 0 1 0 0
Dominican Republic
0 76 0 76 0 1 0 1 130 228 1 357
Grenada 0 4 0 4 0 0 0 0 0 0 0 0
Guadeloupe 0 23 0 23 0 0 0 0 0 6 0 6
Haiti 0 10 0 10 0 0 0 0 0 18 0 18
Jamaica 0 48 0 48 0 0 0 0 0 29 0 29
Martinique 0 7 0 7 0 0 0 0 0 5 0 5
Montserrat 0 0 0 0 0 0 0 0 0 0 0 0
Netherlands Antilles
0 11 0 10 0 0 0 0 0 8 1 7
Puerto Rico – – – – – – – – – – – –
Saint Barthélemy
– – – – – – – – – – – –
Saint Kitts and Nevis
0 1 0 1 0 0 0 0 0 0 0 0
Saint Lucia 0 7 0 7 0 0 0 0 0 10 0 10
Saint Martin (French part)
– – – – – – – – – – – –
Saint Vincent and the Grenadines
0 2 0 2 0 0 0 0 0 4 0 4
Trinidad and Tobago
2 62 0 64 0 4 0 4 0 138 1 137
Turks and Caicos Islands
0 1 0 1 0 0 0 0 0 0 0 0
United States Virgin Islands
– – – – – – – – – – – –
Total Caribbean
151 335 1 485 1 9 0 10 166 542 6 703

144 | Annex
Country / area Wood-based panels (1 000 m3)
Pulp for paper (1 000 tonnes)
Paper and paperboard (1 000 tonnes)
Production Imports Exports Consumption Production Imports Exports Consumption Production Imports Exports Consumption
Belize 0 8 1 7 0 2 0 2 0 6 0 6
Costa Rica 69 43 21 91 10 36 0 46 20 566 28 558
El Salvador 0 18 0 17 0 3 1 2 56 182 11 227
Guatemala 57 32 10 79 0 4 1 3 31 350 17 364
Honduras 10 30 4 35 7 0 0 7 95 140 2 233
Nicaragua 8 8 0 16 0 0 0 0 0 42 3 39
Panama 9 22 0 31 0 2 0 2 0 110 28 83
Total Central America
153 160 36 277 17 47 1 62 202 1 396 90 1 508
Canada 12 220 3 689 6 153 9 756 20 405 337 9 343 11 399 15 789 2 914 12 289 6 414
Greenland 0 5 0 5 0 0 0 0 0 1 0 1
Mexico 398 1 079 52 1 425 345 1 264 20 1 589 5 141 3 956 445 8 652
Saint Pierre and Miquelon
0 1 0 0 0 0 0 0 0 0 0 0
United States of America
35 576 9 195 2 498 42 274 52 244 5 601 6 828 51 017 80 178 13 411 11 707 81 882
Total North America
48 194 13 969 8 703 53 461 72 994 7 202 16 191 64 005 101 108 20 282 24 442 96 949
Total North and Central America
48 499 14 464 8 741 54 222 73 012 7 258 16 193 64 077 101 476 22 220 24 537 99 160
American Samoa
0 0 0 0 0 0 0 0 0 0 0 0
Australia 1 662 545 427 1 780 1 195 348 10 1 533 2 541 1 490 684 3 347
Cook Islands 0 2 0 2 0 0 0 0 0 0 0 0
Fiji 20 5 2 24 0 1 0 1 0 21 1 20
French Polynesia
0 6 0 6 0 0 0 0 0 8 0 8
Guam – – – – – – – – – – – –
Kiribati 0 0 0 0 0 0 0 0 0 0 0 0
Marshall Islands 0 3 0 3 0 0 0 0 0 0 0 0
Micronesia (Federated States of)
0 1 0 1 0 0 0 0 0 0 0 0
Nauru 0 0 0 0 0 0 0 0 0 0 0 0
New Caledonia 0 6 2 4 0 2 0 2 0 12 7 5

Table 5 | 145
Country / area Wood-based panels (1 000 m3)
Pulp for paper (1 000 tonnes)
Paper and paperboard (1 000 tonnes)
Production Imports Exports Consumption Production Imports Exports Consumption Production Imports Exports Consumption
New Zealand 1 939 73 900 1 112 1 546 32 791 787 871 472 600 743
Niue 0 0 0 0 0 0 0 0 0 0 0 0
Norfolk Island 0 0 0 0 0 0 0 0 0 0 0 0
Northern Mariana Islands
0 0 0 0 0 0 0 0 0 0 0 0
Palau 0 1 0 1 0 0 0 0 0 0 0 0
Papua New Guinea
94 2 10 86 0 0 0 0 0 17 0 17
Pitcairn 0 0 0 0 0 0 0 0 0 0 0 0
Samoa 0 2 0 2 0 0 0 0 0 1 0 1
Solomon Islands 0 1 0 1 0 0 0 0 0 0 0 0
Tokelau 0 0 0 0 0 0 0 0 0 0 0 0
Tonga 0 1 0 1 0 0 0 0 0 0 0 0
Tuvalu 0 0 0 0 0 0 0 0 0 0 0 0
Vanuatu 0 1 0 1 0 1 0 1 0 0 0 0
Wallis and Futuna Islands
0 0 0 0 0 0 0 0 0 0 0 0
Total Oceania 3 715 649 1 342 3 022 2 741 384 801 2 324 3 412 2 023 1 292 4 143
Argentina 1 444 190 428 1 206 999 193 178 1 014 1 755 1 641 152 3 244
Bolivia (Plurinational state of)
41 11 17 34 0 0 0 0 0 87 0 87
Brazil 8 611 163 2 757 6 017 12 697 330 7 057 5 971 8 977 1 268 2 592 7 654
Chile 2 657 179 2 193 643 4 981 13 4 061 933 1 391 523 586 1 328
Colombia 290 174 27 437 360 183 1 542 1 025 525 200 1 351
Ecuador 997 41 206 832 2 24 0 26 100 212 47 265
Falkland Islands (Malvinas)†
0 0 0 0 0 0 0 0 0 0 0 0
French Guiana 0 3 0 3 0 0 0 0 0 0 0 0
Guyana 39 4 25 18 0 0 0 0 0 6 0 5
Paraguay 161 9 18 152 0 0 0 0 13 97 5 105
Peru 96 143 25 215 17 100 0 117 132 447 15 564
Suriname 1 10 2 9 0 0 0 0 0 8 0 8
Uruguay 176 55 137 94 967 9 603 373 90 83 37 136

146 | Annex
Country / area Wood-based panels (1 000 m3)
Pulp for paper (1 000 tonnes)
Paper and paperboard (1 000 tonnes)
Production Imports Exports Consumption Production Imports Exports Consumption Production Imports Exports Consumption
Venezuela (Bolivarian Republic of)
680 56 22 714 73 186 2 257 610 371 1 980
Total South America
15 193 1 038 5 856 10 375 20 096 1 038 11 902 9 233 14 093 5 268 3 635 15 726
TOTAL WORLD 268 788 73 257 78 342 263 702 193 146 45 087 47 032 191 201 389 237 114 797 115 319 388 715
† A dispute exists between the governments of Argentina and the United Kingdom of Great Britain and Northern Ireland concerning sovereignty over the Falkland Islands (Malvinas).
Source: FAOSTAT (ForesSTAT), last accessed 16 September 2010.

Table 6 | 147
Table 6: Forestry sector’s contribution to employment and gross domestic product, 2006
Country / area Employment Gross value added
Roundwood production
Wood processing
Pulp and paper
Total for the forestry sector
Roundwood production
Wood processing
Pulp and paper
Total for the forestry sector
(1 000 FTE) (1 000 FTE) (1 000 FTE) (1 000 FTE) (% of total labour force)
(US$ million)
(US$ million)
(US$ million)
(US$ million)
(% contribution
to GDP)
Burundi 0 2 0 2 0 10 5 0 15 1.8
Cameroon 12 8 1 20 0.3 236 74 13 324 1.9
Central African Republic
2 2 0 4 0.2 133 10 1 144 11.1
Chad 1 0 – 1 0 122 0 – 122 1.9
Republic of the Congo
4 3 0 7 0.5 45 27 – 72 1.1
Democratic Republic of the Congo
6 0 – 6 0 185 2 – 186 2.3
Equatorial Guinea
1 0 – 1 0.5 86 2 – 87 0.9
Gabon 8 4 0 12 1.9 171 118 0 290 3.0
Rwanda 1 1 – 1 0 30 1 – 31 1.3
Saint Helena, Ascension and Tristan da Cunha
– – – – – – – – – –
Sao Tome and Principe
– – – – – – – – – –
Total Central Africa
35 19 1 55 0.1 1 017 239 15 1 271 2.0
Comoros – – – – – 18 – – 18 4.4
Djibouti – – – – – 0 – – 0 0.1
Eritrea 0 0 0 0 0 0 0 0 1 0.1
Ethiopia 1 2 2 5 0 630 4 9 643 5.2
Kenya 1 10 8 19 0.1 242 20 106 368 1.7
Madagascar 2 41 1 44 0.4 148 8 0 157 3.1
Mauritius 1 1 1 2 0.4 7 4 12 23 0.4
Mayotte – – – – – – – – – –
Réunion 0 0 0 0 0.1 2 8 8 18 0.1
Seychelles – – – – – 0 – – 0 0.1
Somalia 0 1 – 1 0 15 1 – 15 0.6
Uganda 2 1 1 4 0 354 16 9 379 4.0
United Republic of Tanzania
3 6 6 15 0.1 205 1 22 228 1.9
Total East Africa
11 61 19 90 0.1 1 623 62 166 1 851 2.1

148 | Annex
Country / area Employment Gross value added
Roundwood production
Wood processing
Pulp and paper
Total for the forestry sector
Roundwood production
Wood processing
Pulp and paper
Total for the forestry sector
(1 000 FTE) (1 000 FTE) (1 000 FTE) (1 000 FTE) (% of total labour force)
(US$ million)
(US$ million)
(US$ million)
(US$ million)
(% contribution
to GDP)
Algeria 0 11 2 13 0.1 37 118 66 220 0.2
Egypt 1 3 18 21 0.1 131 7 157 296 0.3
Libyan Arab Jamahiriya
0 1 0 2 0.1 57 4 2 62 0.1
Mauritania 0 0 0 0 0 1 0 – 1 0.1
Morocco 13 8 5 26 0.2 343 80 126 549 0.9
Sudan 1 2 1 4 0 57 15 36 107 0.3
Tunisia 4 9 4 16 0.4 106 147 149 402 1.4
Western Sahara – – – – – – – – – –
Total Northern Africa
19 34 30 83 0.1 731 372 535 1 638 0.4
Angola 2 1 0 3 0 260 2 1 262 0.6
Botswana 0 0 0 1 0.1 25 1 5 30 0.4
Lesotho 1 0 – 1 0.1 67 – – 67 5.0
Malawi 1 1 0 2 0 40 2 8 50 2.6
Mozambique 12 3 0 15 0.1 221 2 2 224 3.1
Namibia 0 0 0 0 0.1 – 6 0 6 0.1
South Africa 45 37 34 116 0.5 920 948 1 677 3 545 1.6
Swaziland 1 2 3 6 1.5 11 10 60 80 5.2
Zambia 1 1 2 5 0.1 547 61 21 629 5.9
Zimbabwe 1 6 7 13 0.2 49 14 12 74 5.3
Total Southern Africa
63 51 47 161 0.3 2 139 1 044 1 785 4 969 1.6
Benin 1 0 – 1 0 103 5 0 108 2.6
Burkina Faso 2 2 0 4 0.1 88 0 – 88 1.5
Cape Verde 0 1 – 1 0.5 20 0 – 20 2.0
Côte d’Ivoire 19 8 1 28 0.4 672 96 33 801 5.0
Gambia 0 1 – 1 0.1 1 0 – 1 0.2
Ghana 12 30 1 43 0.4 542 202 10 754 7.2
Guinea 9 1 – 10 0.2 39 6 – 45 1.7
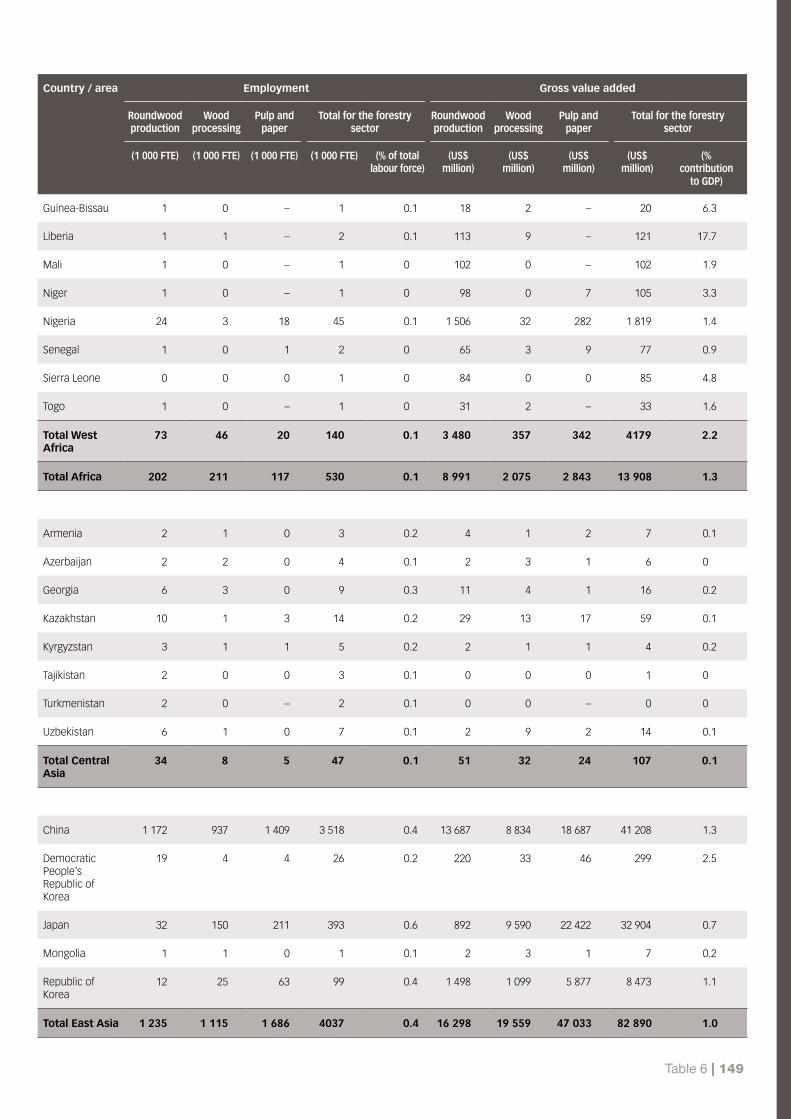
Table 6 | 149
Country / area Employment Gross value added
Roundwood production
Wood processing
Pulp and paper
Total for the forestry sector
Roundwood production
Wood processing
Pulp and paper
Total for the forestry sector
(1 000 FTE) (1 000 FTE) (1 000 FTE) (1 000 FTE) (% of total labour force)
(US$ million)
(US$ million)
(US$ million)
(US$ million)
(% contribution
to GDP)
Guinea-Bissau 1 0 – 1 0.1 18 2 – 20 6.3
Liberia 1 1 – 2 0.1 113 9 – 121 17.7
Mali 1 0 – 1 0 102 0 – 102 1.9
Niger 1 0 – 1 0 98 0 7 105 3.3
Nigeria 24 3 18 45 0.1 1 506 32 282 1 819 1.4
Senegal 1 0 1 2 0 65 3 9 77 0.9
Sierra Leone 0 0 0 1 0 84 0 0 85 4.8
Togo 1 0 – 1 0 31 2 – 33 1.6
Total West Africa
73 46 20 140 0.1 3 480 357 342 4179 2.2
Total Africa 202 211 117 530 0.1 8 991 2 075 2 843 13 908 1.3
Armenia 2 1 0 3 0.2 4 1 2 7 0.1
Azerbaijan 2 2 0 4 0.1 2 3 1 6 0
Georgia 6 3 0 9 0.3 11 4 1 16 0.2
Kazakhstan 10 1 3 14 0.2 29 13 17 59 0.1
Kyrgyzstan 3 1 1 5 0.2 2 1 1 4 0.2
Tajikistan 2 0 0 3 0.1 0 0 0 1 0
Turkmenistan 2 0 – 2 0.1 0 0 – 0 0
Uzbekistan 6 1 0 7 0.1 2 9 2 14 0.1
Total Central Asia
34 8 5 47 0.1 51 32 24 107 0.1
China 1 172 937 1 409 3 518 0.4 13 687 8 834 18 687 41 208 1.3
Democratic People’s Republic of Korea
19 4 4 26 0.2 220 33 46 299 2.5
Japan 32 150 211 393 0.6 892 9 590 22 422 32 904 0.7
Mongolia 1 1 0 1 0.1 2 3 1 7 0.2
Republic of Korea
12 25 63 99 0.4 1 498 1 099 5 877 8 473 1.1
Total East Asia 1 235 1 115 1 686 4037 0.4 16 298 19 559 47 033 82 890 1.0

150 | Annex
Country / area Employment Gross value added
Roundwood production
Wood processing
Pulp and paper
Total for the forestry sector
Roundwood production
Wood processing
Pulp and paper
Total for the forestry sector
(1 000 FTE) (1 000 FTE) (1 000 FTE) (1 000 FTE) (% of total labour force)
(US$ million)
(US$ million)
(US$ million)
(US$ million)
(% contribution
to GDP)
Bangladesh 1 11 24 36 0 997 76 45 1 118 1.7
Bhutan 1 2 – 3 0.2 49 12 – 61 6.9
India 246 55 180 481 0.1 5 927 132 1 092 7 151 0.9
Maldives – 0 – 0 0 – – – – –
Nepal 12 4 3 19 0.1 318 5 8 330 4.3
Pakistan 30 5 22 58 0.1 288 9 213 510 0.4
Sri Lanka 17 4 3 23 0.3 199 17 31 247 1.0
Total South Asia
308 80 231 619 0.1 7 777 251 1 388 9 416 0.9
Brunei Darussalam
1 0 – 2 0.9 3 6 – 9 0.1
Cambodia 0 1 0 1 0 139 5 29 173 2.8
Indonesia 69 148 104 321 0.3 3 283 3 896 2 386 9 564 2.5
Lao People’s Democratic Republic
1 2 0 3 0.1 103 1 0 104 3.0
Malaysia 88 126 35 248 2.3 2 423 1 514 661 4 598 3.0
Myanmar 24 21 3 48 0.2 35 1 1 38 0.3
Philippines 8 20 21 49 0.1 94 157 308 560 0.5
Singapore 0 2 4 6 0.3 – 38 181 218 0.2
Thailand 8 62 67 137 0.4 149 333 1 211 1 693 0.8
Timor-Leste – – – – – 1 – – 1 0.4
Viet Nam 22 120 70 212 0.5 674 370 328 1 372 2.4
Total Southeast Asia
221 502 304 1027 0.4 6 904 6 322 5 105 18 331 1.7
Afghanistan – – – – – 4 2 – 5 0.1
Bahrain – 0 0 0 0.1 – 1 6 6 0
Cyprus 1 2 1 3 0.8 3 91 30 123 0.8
Iran (Islamic Republic of)
7 8 22 36 0.1 270 86 355 711 0.3
Iraq – 0 6 6 0.1 – 12 26 39 0.1
Israel 1 5 8 14 0.5 – 121 312 433 0.3

Table 6 | 151
Country / area Employment Gross value added
Roundwood production
Wood processing
Pulp and paper
Total for the forestry sector
Roundwood production
Wood processing
Pulp and paper
Total for the forestry sector
(1 000 FTE) (1 000 FTE) (1 000 FTE) (1 000 FTE) (% of total labour force)
(US$ million)
(US$ million)
(US$ million)
(US$ million)
(% contribution
to GDP)
Jordan 0 4 4 8 0.3 – 16 70 86 0.7
Kuwait – 1 1 2 0.2 – 26 56 82 0.1
Lebanon – 3 6 10 0.7 1 63 189 253 1.1
Occupied Palestinian Territory
– 1 0 2 0.7 – 12 9 21 0.6
Oman – 1 1 2 0.2 – 20 15 35 0.1
Qatar – 5 0 5 1.5 – 73 16 89 0.2
Saudi Arabia 1 21 13 35 0.4 – – 279 279 0.1
Syrian Arab Republic
1 16 2 19 0.3 4 87 31 122 0.4
Turkey 33 89 45 167 0.5 1 342 609 834 2 786 0.7
United Arab Emirates
– 1 4 5 0.4 – – 81 81 0
Yemen – 3 2 5 0.1 – 31 22 54 0.3
Total Western Asia
44 160 115 318 0.3 1 624 1 250 2 331 5 205 0.3
Total Asia 1 843 1 866 2 341 6 049 0.3 32 655 27 414 55 881 115 950 0.9
Albania 2 1 0 2 0.1 6 4 3 13 0.2
Andorra – 0 0 0 1.0 – – – – –
Austria 7 36 17 61 1.5 1 494 2 661 2 013 6 168 2.1
Belarus 33 46 23 103 1.9 180 399 97 677 2.1
Belgium 2 14 14 31 0.7 191 1 114 1 424 2 729 0.8
Bosnia and Herzegovina
7 5 2 14 0.7 129 85 17 232 2.5
Bulgaria 15 23 11 49 1.2 59 97 77 232 0.9
Croatia 9 12 5 26 1.2 115 186 161 462 1.3
Czech Republic 35 83 20 138 2.5 832 1 225 596 2 654 2.1
Denmark 4 15 7 25 0.9 201 1 002 602 1 805 0.8
Estonia 7 19 2 28 3.6 148 345 43 536 3.7
Faroe Islands – – – – – – – – – –
Finland 23 32 35 90 3.6 3 329 1 918 5 082 10 329 5.7
France 31 87 74 191 0.7 5 107 4 147 5 653 14 907 0.7
Germany 44 165 134 342 0.8 2 259 9 315 12 324 23 898 0.9
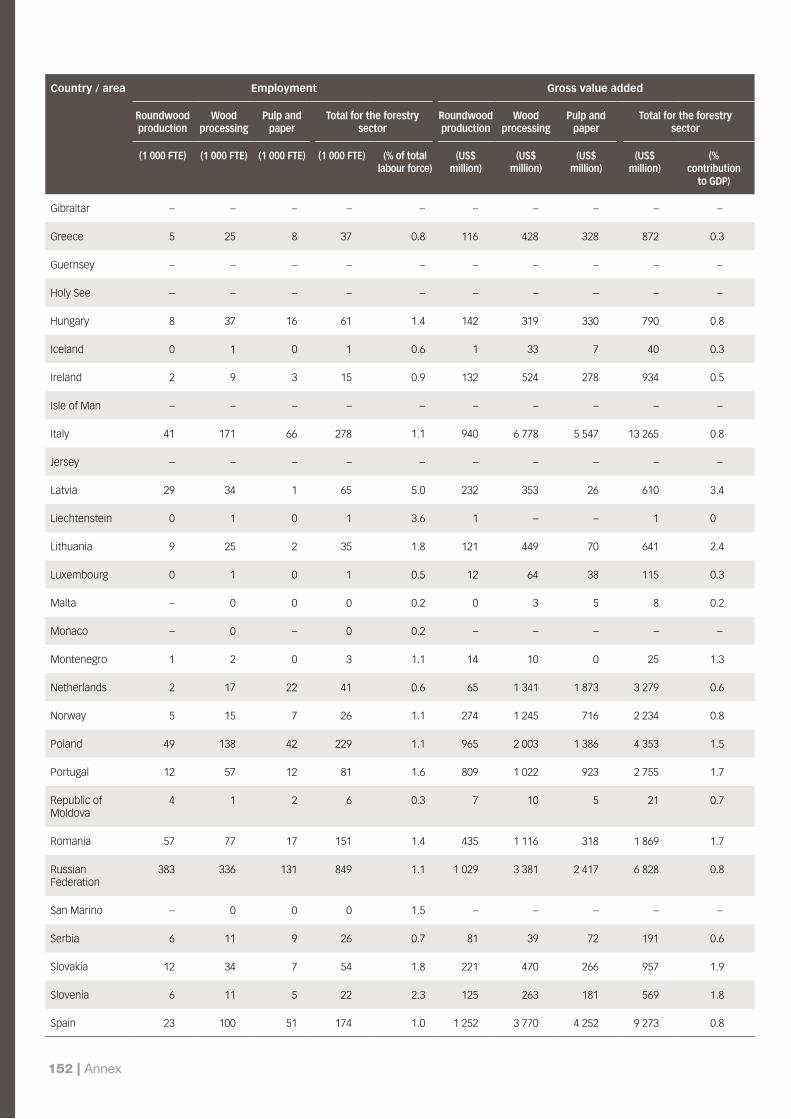
152 | Annex
Country / area Employment Gross value added
Roundwood production
Wood processing
Pulp and paper
Total for the forestry sector
Roundwood production
Wood processing
Pulp and paper
Total for the forestry sector
(1 000 FTE) (1 000 FTE) (1 000 FTE) (1 000 FTE) (% of total labour force)
(US$ million)
(US$ million)
(US$ million)
(US$ million)
(% contribution
to GDP)
Gibraltar – – – – – – – – – –
Greece 5 25 8 37 0.8 116 428 328 872 0.3
Guernsey – – – – – – – – – –
Holy See – – – – – – – – – –
Hungary 8 37 16 61 1.4 142 319 330 790 0.8
Iceland 0 1 0 1 0.6 1 33 7 40 0.3
Ireland 2 9 3 15 0.9 132 524 278 934 0.5
Isle of Man – – – – – – – – – –
Italy 41 171 66 278 1.1 940 6 778 5 547 13 265 0.8
Jersey – – – – – – – – – –
Latvia 29 34 1 65 5.0 232 353 26 610 3.4
Liechtenstein 0 1 0 1 3.6 1 – – 1 0
Lithuania 9 25 2 35 1.8 121 449 70 641 2.4
Luxembourg 0 1 0 1 0.5 12 64 38 115 0.3
Malta – 0 0 0 0.2 0 3 5 8 0.2
Monaco – 0 – 0 0.2 – – – – –
Montenegro 1 2 0 3 1.1 14 10 0 25 1.3
Netherlands 2 17 22 41 0.6 65 1 341 1 873 3 279 0.6
Norway 5 15 7 26 1.1 274 1 245 716 2 234 0.8
Poland 49 138 42 229 1.1 965 2 003 1 386 4 353 1.5
Portugal 12 57 12 81 1.6 809 1 022 923 2 755 1.7
Republic of Moldova
4 1 2 6 0.3 7 10 5 21 0.7
Romania 57 77 17 151 1.4 435 1 116 318 1 869 1.7
Russian Federation
383 336 131 849 1.1 1 029 3 381 2 417 6 828 0.8
San Marino – 0 0 0 1.5 – – – – –
Serbia 6 11 9 26 0.7 81 39 72 191 0.6
Slovakia 12 34 7 54 1.8 221 470 266 957 1.9
Slovenia 6 11 5 22 2.3 125 263 181 569 1.8
Spain 23 100 51 174 1.0 1 252 3 770 4 252 9 273 0.8

Table 6 | 153
Country / area Employment Gross value added
Roundwood production
Wood processing
Pulp and paper
Total for the forestry sector
Roundwood production
Wood processing
Pulp and paper
Total for the forestry sector
(1 000 FTE) (1 000 FTE) (1 000 FTE) (1 000 FTE) (% of total labour force)
(US$ million)
(US$ million)
(US$ million)
(US$ million)
(% contribution
to GDP)
Svalbard and Jan Mayen Islands
– – – – – – – – – –
Sweden 22 38 36 95 2.0 3 108 2 706 6 939 12 753 3.8
Switzerland 5 35 12 52 1.3 311 2 537 1 316 4 164 1.1
The former Yugoslav Republic of Macedonia
4 3 1 8 0.8 18 3 3 24 0.4
Ukraine 152 60 23 235 0.9 427 350 326 1 103 1.2
United Kingdom 11 86 69 166 0.6 246 4 839 4 633 9 719 0.4
Total Europe 1 067 1 861 886 3 815 1.1 25 134 56 554 60 348 142 036 1.0
Anguilla – – – – – 0 – – 0 0
Antigua and Barbuda
– – – – – – – – – –
Aruba – 0 – 0 0.1 – – – – –
Bahamas 0 0 0 0 0.1 0 0 3 3 0
Barbados 0 0 1 2 1.2 0 8 40 49 1.8
Bermuda – 0 0 0 0.1 0 – – 0 0
British Virgin Islands
– – – – – 0 – – 0 0
Cayman Islands – – – – – – – – – –
Cuba 10 24 1 36 0.6 17 94 2 113 0.2
Dominica – – – – – 1 – – 1 0.5
Dominican Republic
0 0 1 1 0 7 – 9 17 0.1
Grenada 0 0 0 0 0.1 1 – – 1 0.2
Guadeloupe – – – – – 0 0 – 0 0
Haiti 1 0 0 1 0 5 0 – 6 0.1
Jamaica 1 1 1 3 0.2 6 2 52 60 0.6
Martinique 0 – – 0 0 0 0 – 0 0
Montserrat – – – – – – – – – –
Netherlands Antilles
– – 0 0 0.2 – – – – –
Puerto Rico – 1 2 3 0.2 – 50 62 112 0.1
Saint Barthélemy
– – – – – – – – – –

154 | Annex
Country / area Employment Gross value added
Roundwood production
Wood processing
Pulp and paper
Total for the forestry sector
Roundwood production
Wood processing
Pulp and paper
Total for the forestry sector
(1 000 FTE) (1 000 FTE) (1 000 FTE) (1 000 FTE) (% of total labour force)
(US$ million)
(US$ million)
(US$ million)
(US$ million)
(% contribution
to GDP)
Saint Kitts and Nevis
– – – – – 0 – – 0 0
Saint Lucia – – – – – 0 – 4 4 0.5
Saint Martin (French part)
– – – – – – – – – –
Saint Vincent and the Grenadines
– – 0 0 0.2 2 – – 2 0.5
Trinidad and Tobago
1 2 2 5 0.8 16 10 42 68 0.4
Turks and Caicos Islands
– – – – – – – – – –
United States Virgin Islands
– 0 0 0 0.1 – – – – –
Total Caribbean
14 29 9 52 0.3 57 165 215 436 0.2
Belize 1 2 0 3 2.6 7 11 1 19 1.7
Costa Rica 1 7 5 13 0.7 12 42 118 171 0.8
El Salvador 4 5 4 13 0.4 121 2 70 193 1.1
Guatemala 7 1 2 10 0.2 483 51 52 587 2.0
Honduras 3 15 2 20 0.7 73 49 27 149 1.8
Nicaragua 3 1 – 4 0.2 40 45 7 92 1.9
Panama 1 1 2 3 0.2 26 6 36 67 0.4
Total Central America
20 32 13 65 0.4 762 206 311 1 279 1.3
Canada 63 128 84 275 1.6 7 229 13 488 11 284 32 000 2.7
Greenland – – – – – – – – – –
Mexico 84 85 125 293 0.6 1 720 1 855 3 477 7 052 0.9
Saint Pierre and Miquelon
0 – – 0 0 – – – – –
United States of America
85 565 459 1 109 0.7 18 528 37 400 52 500 108 428 0.8
Total North America
232 778 667 1 677 0.8 27 477 52 743 67 261 147 480 1.0
Total North and Central America
266 839 690 1 794 0.7 28 296 53 114 67 786 149 196 1.0
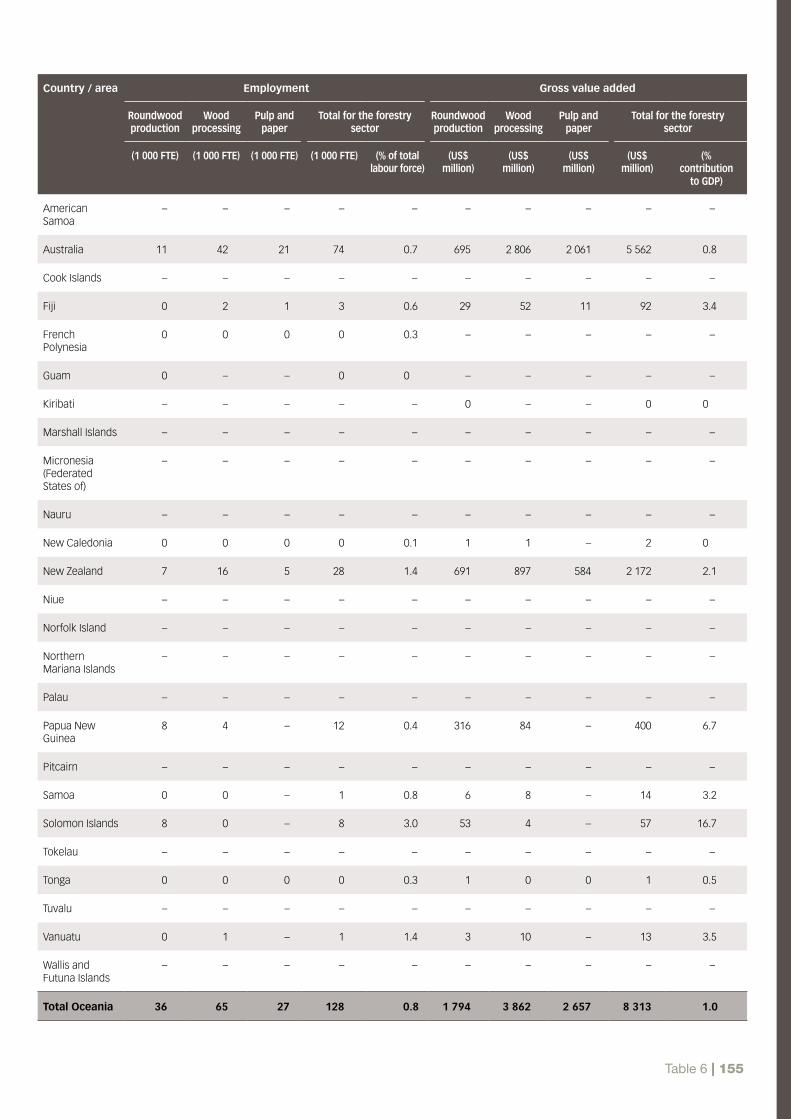
Table 6 | 155
Country / area Employment Gross value added
Roundwood production
Wood processing
Pulp and paper
Total for the forestry sector
Roundwood production
Wood processing
Pulp and paper
Total for the forestry sector
(1 000 FTE) (1 000 FTE) (1 000 FTE) (1 000 FTE) (% of total labour force)
(US$ million)
(US$ million)
(US$ million)
(US$ million)
(% contribution
to GDP)
American Samoa
– – – – – – – – – –
Australia 11 42 21 74 0.7 695 2 806 2 061 5 562 0.8
Cook Islands – – – – – – – – – –
Fiji 0 2 1 3 0.6 29 52 11 92 3.4
French Polynesia
0 0 0 0 0.3 – – – – –
Guam 0 – – 0 0 – – – – –
Kiribati – – – – – 0 – – 0 0
Marshall Islands – – – – – – – – – –
Micronesia (Federated States of)
– – – – – – – – – –
Nauru – – – – – – – – – –
New Caledonia 0 0 0 0 0.1 1 1 – 2 0
New Zealand 7 16 5 28 1.4 691 897 584 2 172 2.1
Niue – – – – – – – – – –
Norfolk Island – – – – – – – – – –
Northern Mariana Islands
– – – – – – – – – –
Palau – – – – – – – – – –
Papua New Guinea
8 4 – 12 0.4 316 84 – 400 6.7
Pitcairn – – – – – – – – – –
Samoa 0 0 – 1 0.8 6 8 – 14 3.2
Solomon Islands 8 0 – 8 3.0 53 4 – 57 16.7
Tokelau – – – – – – – – – –
Tonga 0 0 0 0 0.3 1 0 0 1 0.5
Tuvalu – – – – – – – – – –
Vanuatu 0 1 – 1 1.4 3 10 – 13 3.5
Wallis and Futuna Islands
– – – – – – – – – –
Total Oceania 36 65 27 128 0.8 1 794 3 862 2 657 8 313 1.0

156 | Annex
Country / area Employment Gross value added
Roundwood production
Wood processing
Pulp and paper
Total for the forestry sector
Roundwood production
Wood processing
Pulp and paper
Total for the forestry sector
(1 000 FTE) (1 000 FTE) (1 000 FTE) (1 000 FTE) (% of total labour force)
(US$ million)
(US$ million)
(US$ million)
(US$ million)
(% contribution
to GDP)
Argentina 54 32 30 116 0.7 311 156 1 098 1 564 0.8
Bolivia (Plurinational state of)
4 3 2 9 0.2 92 111 38 241 2.7
Brazil 306 503 201 1 010 1.2 18 198 3 953 6 055 28 206 2.8
Chile 44 27 15 86 1.2 448 1 008 2 153 3 609 2.6
Colombia 3 4 18 25 0.1 140 166 503 810 0.7
Ecuador 13 4 7 24 0.4 277 427 190 893 2.3
Falkland Islands (Malvinas)†
– – – – – – – – – –
French Guiana 0 0 – 0 0.3 2 2 – 4 0.1
Guyana 3 5 – 8 1.9 18 13 – 31 4.1
Paraguay 3 2 1 5 0.2 163 81 56 301 3.6
Peru 19 6 6 31 0.3 278 204 458 940 1.1
Suriname 1 3 0 4 2.2 6 9 – 15 0.9
Uruguay 4 3 2 8 0.8 163 35 40 239 1.2
Venezuela (Bolivarian Republic of)
8 25 33 66 0.5 540 629 484 1 653 1.0
Total South America
463 616 314 1 393 0.8 20 638 6 793 11 074 38 506 2.1
TOTAL WORLD 3 876 5 459 4 374 13 709 0.4 117 508 149 811 200 589 467 908 1.0
† A dispute exists between the governments of Argentina and the United Kingdom of Great Britain and Northern Ireland concerning sovereignty over the Falkland Islands (Malvinas).
Source: FAO, 2008.
References | 157
6 References
Abbott, P. 1997. The supply and demand dynamics
of miombo: a household perspective. Aberdeen, UK,
Aberdeen University (PhD dissertation).
Alcorn, A. 2003. Embodied energy and CO2 coefficients
for NZ building materials. Centre for Building Performance
Research Report. Wellington, New Zealand, Victoria
University of Wellington (also available at www.victoria.
ac.nz/cbpr/documents/pdfs/ee-co2_report_2003.pdf).
Aldy, J.E. & Stavins, R.N. 2008. Designing the post-
Kyoto climate regime: lessons from the Harvard project
on international climate agreements. An interim progress
report for the 14th Conference of the Parties, Framework
Convention on Climate Change, Poznan, Poland,
December 2008. Cambridge, USA, Harvard Project on
International Climate Agreements (also available at http://
belfercenter.ksg.harvard.edu/files/Interim%20Report%20
081203%20Akiko%20v6.pdf).
Anbumozhi, V. 2007. Eco-industrial clusters in urban-
rural fringe areas: a strategic approach for integrated
environmental and economic planning. Kobe, Japan,
Institute for Global Environmental Strategies – Kansai
Research Centre (also available at http://enviroscope.
iges.or.jp/modules/envirolib/upload/973/attach/973_eco-
industrial-clusters.pdf).
Angelsen, A. & Wunder, S. 2003. Exploring the
forest—poverty link: key concepts, issues and research
implications. Center for International Forestry Research
(CIFOR) Occasional Paper 40. Bogor, Indonesia, CIFOR
(also available at www.cifor.cgiar.org/publications/pdf_
files/OccPapers/OP-40.pdf).
Angelsen, A., Brockhaus, M., Kanninen, M., Sills, E.
Sunderlin, W. & Wertz-Kanounnikoff, S., eds. 2009.
Realising REDD+: national strategy and policy options.
Bogor, Indonesia, Center for International Forestry
Research (CIFOR) (also available at www.cifor.cgiar.org/
publications/pdf_files/Books/BAngelsen0902.pdf).
Arnold, J.E.M. 2001. Forests and people: 25 years of
community forestry. Rome, Italy, FAO.
Australian Property Institute. 2007. Policy paper:
conceiving property rights in carbon. NSW & Queensland
Divisions – Australian Property Institute, 26 July 2007.
Balée, W. 1994. Footprints of the forest: Ka’apor
ethnobotany – the historical ecology of plant utilization
by an Amazonian people. New York, USA, Columbia
University Press.
Bird, K., Hulme, D., Moore, K. & Shepherd, A.
2002. Chronic poverty and remote rural areas.
Chronic Poverty Research Centre Working Paper
No. 13. Manchester, UK, University of Manchester
(also available at www.chronicpoverty.org/uploads/
publication_files/WP13_Bird_et_al.pdf).
Bodian, M.L. 2009. Comparative study of forest
resources management, decentralization processes in the
ECOWAS space. Accra, Ghana, FAO.
Burton, I.E. 2008. Beyond borders: the need
for strategic global adaptation. IIED Sustainable
Development Opinion December 2008. London, UK,
International Institute for Environment and Development
(also available at www.iied.org/pubs/pdfs/17046IIED.pdf).
Byron, R.N. & Arnold, J.E.M. 1997. What futures for the
people of the tropical forests? Center for International
Forestry Research (CIFOR) Working Paper 19. Bogor,
Indonesia, CIFOR (also available at www.cifor.cgiar.org/
ntfpcd/pdf/OWP5.pdf).

158 | References
Canby, C. 2006. Investing in natural tropical forest
industries. ITTO Tropical Forest Update, 16(2): 4–8.
Yokohama, Japan, International Tropical Timber
Organization (also available at www.itto.int/en/tfu/
id=15910000).
Carreiro, M. M., Song, Y.C. and Wu, J. 2008. Ecology,
planning and management of urban forests. International
perspectives. New York, USA, Spring Editions.
Cavaliere, C., Rea, P., Lynch, M.E. & Blumenthal, M.
2010. Herbal supplement sales rise in all channels in
2009. Herbalgram, 86: 62–65. Austin, USA, American
Botanical Council (also available at http://cms.
herbalgram.org/herbalgram/issue86/article3530.
html?Issue=86).
Cavendish, W. 2003. How do forests support, insure
and improve the livelihoods of the rural poor? A research
note. Background paper written for CIFOR’s Poverty-
Environment Network (PEN). Bogor, Indonesia, Center for
International Forestry Research (available at http://www.
cifor.cgiar.org/pen/_ref/home/index.htm).
CBD. 1997. Traditional knowledge and biological
diversity: note by the Executive Secretary. Workshop on
traditional knowledge and biological diversity, Madrid,
Spain, 24–28 November 1997. UNEP/CBD/TKBD/1/2.
CEMDA. 2010. Tesis privada sobre contratos privados
para la compraventa de CO2. Condesa, Mexico, Centro
Mexicano de Derecho Ambiental.
CEPF. 2008. European forest owner organisations –
forest owner cooperation: main figures, aims and goals.
Brussels, Belgium, Confederation of European Forest
Owners (also available at www.unece.org/timber/docs/
tc-sessions/tc-66/pd-docs/CEPF_report.pdf).
Chiagas, T. 2010. Forest carbon rights in Brazil: case
study. REDDnet. UK, Overseas Development Institute
(also available at http://redd-net.org/resource-library/
redd-net-case-studies-carbon-rights).
Christensen Fund. 2010. Vision statement. San
Francisco, USA (available at www.christensenfund.org).
Christy, L.C., Di Leva, C.E. & Lindsay, J.M. 2007.
Forest law and sustainable development. Addressing
contemporary challenges through legal reform.
Washington, DC, USA, World Bank.
CIFOR. 2008a. Adaptive collaborative management
can help us cope with climate change. CIFOR Infobrief
No.13. Bogor, Indonesia, Center for International
Forestry Research (also available at www.cifor.cgiar.org/
publications/pdf_files/Infobrief/013-infobrief.pdf).
CIFOR. 2008b. CIFOR’s strategy, 2008–2018 – making
a difference for forests and people. Bogor, Indonesia,
Center for International Forestry Research (also available
at www.cifor.cgiar.org/publications/pdf_files/Books/
CIFORStrategy0801.pdf).
CIFOR. 2010. Apiculture products in Cameroon – fact sheet.
Bogor, Indonesia, Center for International Forestry Research.
Costenbader, J. 2009. Legal frameworks for REDD.
Design and implementation at the national level. IUCN
Environmental Policy and Law Paper No. 77. Gland,
Switzerland, International Union for Conservation of
Nature (also available at http://data.iucn.org/dbtw-wpd/
edocs/EPLP-077.pdf).
Cushion, E., Whiteman, A. & Dieterle, G. 2010.
Bioenergy development: issues and impacts for poverty
and natural resource management. Washington, DC,
USA, World Bank (also available at www.globalbioenergy.
org/uploads/media/1001_WB_-_Bioenergy_development_
SIT.pdf).
DAFF. 2009. Forest industries development fund.
Canberra, Australia, Australian Government, Department
of Agriculture, Forestry and Fisheries (also available at
www.daff.gov.au/fidf).
Dercon, S. & Hoddinott, J. 2005. Livelihoods, growth,
and links to market towns in 15 Ethiopian villages. Food
Consumption and Nutrition Division Discussion Paper
194. Washington, DC, USA, International Food Policy
Research Institute (also available at www.ifpri.org/sites/
default/files/publications/fcnbr194.pdf).
Donovan, J., Stoian, D., Grouwels, S., Macqueen, D.,
van Leeuwen, A., Boetekees, G. & Nicholson, K. 2000.
Towards an enabling environment for small and medium
forest enterprise development. Policy Brief. Rome, Italy,
FAO (also available at www.fao.org/forestry/15444-1-0.
pdf).
Dunlop, J. 2009. REDD, tenure and local communities:
a study from Aceh, Indonesia. Rome, Italy, International
Development Law Organization.

References | 159
EC. 2002. Perception of the wood-based industries –
qualitative study of the image of wood-based industries
amongst the public in the Member States of the European
Union. Brussels, Belgium, European Commission
Directorate–General for Enterprise (also available at
http://ec.europa.eu/enterprise/sectors/wood-paper-
printing/files/perceptionstudy_en.pdf).
EIA. 2010. Online energy statistics. Washington, DC,
USA, U.S. Energy Information Administration (available at
www.eia.doe.gov).
EIU. 2010. Economist Intelligence Unit country data
(economic projections) (available at www.eiu.com).
Elson, D. 2010. Investing in locally controlled forestry:
reviewing the issues from a financial investment
perspective. Background paper for The Forests
Dialogue’s initiative on investing in locally controlled
forestry conference, London, UK, 24–25 May 2010.
Eniang, E.A., Mengistu, G.F. & Yidego, T. 2008.
Climate change, resettled communities, forest
resources conservation and livelihood options
around Kafta-Sheraro Forest Reserve, Tigray Region,
Ethiopia. In Swedish University of Agricultural
Sciences/FAO/International Union of Forest Research
Organizations. Book of abstracts and preliminary
programme: international conference on adaptation of
forests and forest management to changing climate
with emphasis on forest health: a review of science,
policies, and practices, p. 68. SLU/FAO/IUFRO.
328pp. (available at www.fao.org/docrep/010/k2985e/
k2985e00.htm).
European Cluster Observatory. 2010. European cluster
organization directory – Q1 2010. Stockholm, Sweden,
European Cluster Observatory (available at www.
clusterobservatory.eu).
EUROSTAT. 2010. Online statistical databases of the
European Commission’s Directorate General for Statistics
(EUROSTAT) (available at http://ec.europa.eu/eurostat).
FAO. 2002. Conference proceedings: towards equitable
partnerships between corporate and smallholder partners.
Bogor, Indonesia, 21–23 May 2002 (also available at
www.fao.org/docrep/005/y4803e/y4803e00.htm).
FAO. 2004. Simpler forest management plans for
participatory forestry. FONP Working Paper 4. Rome,
Italy (also available at www.fao.org/docrep/008/j4817e/
j4817e00.htm).
FAO. 2008. Contribution of the forestry sector to national
economies, 1990–2006. Forest Finance Working Paper
FSFM/ACC/08. Rome, Italy.
FAO. 2009a. State of the world’s forests 2009. Rome,
Italy (also available at www.fao.org/docrep/011/i0350e/
i0350e00.HTM).
FAO. 2009b. Stratégie de développement et plan d’action
pour la promotion de la foresterie urbaine et périurbaine
de la ville de Bangui. Urban and Peri-urban Forestry
Working Paper 3, edited by Fabio Salbitano. Rome, Italy.
FAO. 2010a. Global forest resources assessment, 2010 –
Main report. FAO Forestry Paper 163. Rome, Italy. (Also
available at www.fao.org/forestry/fra/fra2010/en/).
FAO. 2010b. FAOSTAT – FAO’s online statistical
database. Rome, Italy (available at http://faostat.fao.org).
FAO. 2010c. Report of the 51st Advisory Committee on
Paper and Wood Products. Rome, Italy.
FAO. 2010d. Impact of the global forest industry on
atmospheric greenhouse gases. FAO Forestry Paper 159.
Rome, Italy.
FAO. 2010e. Thematic study on trees outside forest for
the Forest Resource Assessment 2010. Summary of the
inception workshop, Rome, Italy, 9–10 June 2010.
FAO. 2010f. Market analysis & development. FAO website
(available at www.fao.org/forestry/enterprises/25492/en/).
FAO. 2010g. Smallholder forest producer associations in
developing countries (SFPA development fund). Rome,
Italy. FAO website (available at www.fao.org/forestry/
enterprises/60778/en/).
FAO. 2011. Reforming forest tenure: issues, principles
and process. FAO Forestry Paper. Rome, Italy (in press).
Farm Africa. 2002. Articulating rights and responsibilities
in co-management of forests: the case of Chilimo and
Bonga state forests. Addis Ababa, Ethiopia, Farm Africa/
SPOS Sahel.

160 | References
Five Winds International. 2008. Inventory of sustainable
packaging initiatives and proposed approach to develop
sustainable packaging guidelines. Canadian Council of
Ministers of the Environment (also available at www.
ccme.ca/assets/pdf/pn_1405_sp_inventory_e.pdf).
Forest Connect. 2010. Reducing poverty by connecting
small forest enterprises (available at http://forestconnect.
ning.com).
Galloway McLean, K. 2009. Advance guard: climate
change impacts, adaptation, mitigation and indigenous
peoples – a compendium of case studies. Darwin,
Australia, United Nations University – Traditional
Knowledge Initiative.
GEF. 2009. Timberland investment & emerging markets:
a fresh review & outlook: September 2009. Washington,
DC, USA, Global Environment Fund.
Glück, P., Rayner, J., Berghäll, O., Braatz, S., Robledo
C. & Wreford, A. 2009. Governance and policies for
adaptation. In R. Seppälä, A. Buck and P. Katila, eds.
Adaptation of forests and people to climate change – a
global assessment report. pp. 187–210. IUFRO World
Series Volume 22. Helsinki, Finland, International Union of
Forest Research Organizations. 224 pp. (also available at
www.iufro.org/download/file/4485/4496/Full_Report.pdf).
Gobeze, T., Bekele, M., Lemenih M. & Kassa H. 2009.
Participatory forestry management and its impacts on
livelihoods and forest status: the case of Bonga forest in
Ethiopia. International Forestry Review, 11(3): 346–358.
Gómez-Pompa, A. 1991. Learning from traditional
ecological knowledge: insights from Mayan silviculture.
In A. Gómez-Pompa, T.C. Whitmore & M. Hadley, eds.
Rain forest regeneration and management. pp. 335–342.
Paris, France, UNESCO and The Parthenon Publishing
Group Limited.
Grey, G.W. & Deneke, F.J. 1986. Urban forestry. New
York, USA, Wiley.
Gruenwald, J. 2008. The global herbs and botanicals
market. Nutraceuticals World July/August 2008 (also
available at www.nutraceuticalsworld.com/contents/
view/13953).
Gruenwald, J. 2010. Eurotrends: ethnic botanicals – a
growing trend. Nutraceuticals World January/February
2010 (also available at www.nutraceuticalsworld.com/
contents/view/17426).
Hall, C.R., Hodges, A.W. & Haydu, J.J. 2005. Economic
impacts of the green industry in the United States.
Knoxville, USA, University of Tennessee Press.
Hammond, G. & Jones, C. 2008. Inventory of carbon
and energy (ICE): version 1.6a. Sustainable Energy
Research Team, University of Bath, UK.
Hansen, M.C., Stehman, S.V. & Potapov, P.V. 2010.
Quantification of global gross forest cover loss. Proc. Nat.
Acad. Sci. Early Edition, doi/10.1073/pnas.0912668107.
Hepburn, S. 2008. Carbon rights as new property: the
benefits of statutory verification. Sydney Law Review.
Hodgdon, B.D. 2010. Community forestry in Laos.
Journal of Sustainable Forestry, 29 (1): 50–78.
Holt, L., O’Sullivan, and Weaver, S.A. 2007. Land
and forestry law in Vanuatu: carbon rights and existing
law. Vanuatu Carbon Credits Project. Wellington, New
Zealand, School of Geography, Environment and Earth
Sciences, Victoria University of Wellington.
Honadle, G. 1999. How context matters: linking
environmental policy to people and place. Connecticut,
USA, Kumarian Press.
IEA. 2010. Online energy statistics. Paris, France,
International Energy Agency (available at www.iea.org).
IIASA. 2007. Study of the effects of globalization on the
economic viability of EU forestry. Laxenburg, Austria,
International Institute for Applied Systems Analysis (also
available at http://ec.europa.eu/agriculture/analysis/
external/viability_forestry/full_text.pdf).
IPCC. 2007. Fourth assessment report, climate change
2007. Synthesis report: summary for policymakers.
Geneva, Switzerland, IPCC. (also available at www.ipcc.
ch/pdf/assessment-report/ar4/syr/ar4_syr_spm.pdf).
ITTO. 2006. Status of tropical forest management
2005. ITTO Technical Series No. 24. Yokohama, Japan,
International Tropical Timber Organization.

References | 161
IUCN. 2009a. Applying the forests-poverty toolkit in the
village of Tenkodogo, Sablogo Forest. International Union
for Conservation of Nature. Ouagadougou, Burkina Faso.
IUCN. 2009b. The forests–poverty toolkit. Available for
download at the following link: www.iucn.org/about/work/
programmes/forest/fp_our_work/fp_our_work_initiatives/
fp_our_work_ll/fp_livelihoods_landscapes_our_work/fp_
livelihoods_landscapes_our_work_added/fp_livelihoods_
landscapes_our_work_toolkits.cfm
Kajembe, G.C., Nduwamungu, N. & Luoga, E.J. 2005.
The impact of community-based forest management and
joint forest management on the forest resource base and
local people’s livelihoods: case studies from Tanzania.
Commons Southern Africa Occasional Paper 8. Harare,
Zimbabwe, Centre for Applied Social Studies, University
of Zimbabwe/Cape Town, South Africa, Programme for
Land and Agrarian Studies, University of Western Cape.
Laird, S.A. & Wynberg, R. 2008. Access and benefit-
sharing in practice: trends in partnerships across sectors.
CBD Technical Series No. 38. Montreal, Canada,
Secretariat of the Convention on Biological Diversity
(CBD) (also available at www.cbd.int/doc/publications/
cbd-ts-38-en.pdf).
Laird, S.A., McLain, R.J. & Wynberg, R.P. 2010. Wild
product governance: finding policies that work for non-
timber forest products. London, UK, Earthscan.
laquinta, D.L. & Drescher, A.W. 2000. Defining peri-
urban: understanding rural-urban linkages and their
connection to institutional contexts. Paper presented at
the Tenth World Congress, IRSA, Rio de Janeiro, Brazil,
1 August 2000.
Lebedys, A. 2008. Contribution of the forestry sector to
national economies 1990–2006. Forest Finance Working
Paper: FSFM/ACC/08. Rome, Italy, FAO (also available at
www.fao.org/docrep/011/k4588e/k4588e00.htm).
Livelihoods and Forestry Programme. 2009. Community
forestry for poverty alleviation: how UK aid has increased
household incomes in Nepal’s middle hills. UK Department
for International Development–Nepal. Kathmandu, Nepal:
Livelihoods and Forestry Programme (LFP).
Locatelli, B., Kanninen, M., Brockhaus, M., Colfer,
C.J.P., Murdiyarso, D. & Santoso, H. 2008. Facing
an uncertain future: how forests and people can adapt
to climate change. Forest Perspectives no. 5. Bogor,
Indonesia, Center for International Forestry Research
(also available at www.cifor.cgiar.org/publications/pdf_
files/media/CIFOR_adaptation.pdf).
Lohrberg, F. 2007. Landscape laboratory and biomass
production - a “Platform Urban Forestry Ruhrgebiet”
demonstration project. Presentation to the 10th European
Forum on Urban Forestry “New Forests after Old
Industries”. Gelsenkirchen, Germany, 16–19 May 2007.
Lopez-Casero, F. 2008. Public procurement policies
for legal and sustainable timber: trends and essential
elements. Presentation to the forum on China and global
forest products trade, Beijing, China, 18–19 June 2008.
MacQueen, D. 2008. Supporting small forest enterprises
– a cross-sectoral review of best practice. London, UK,
International Institute for Environment and Development
(IIED).
MAF. 2009. A forestry sector study. Wellington, New
Zealand, New Zealand Government, Ministry of
Agriculture and Forestry (also available at www.maf.govt.
nz/forestry/publications/forestry-sector-study-2009).
Maffi, L. 2005. Linguistic, cultural, and biological
diversity. Annual Review of Anthropology, 34: 599–617.
Maffi, L. & Woodley, E. 2010. Biocultural diversity
conservation: a global sourcebook. London, UK,
Earthscan.
McNeil, J. 2009. Oakville’s urban forest: our solution to
our pollution – next steps. Voluntary paper presented to
the World Forestry Congress, Buenos Aires, Argentina,
18–23 October 2009.
Milton, R.K. 1998. Forest dependence and Participatory
Forest Management: a qualitative analysis of resource
use in Southern Ghana. Norwich, UK, University of East
Anglia. (PhD dissertation).
Mirjam A., Ros-Tonen, F. & Freerk Wiersum, K. 2005.
Forests, trees and livelihoods. 15(x): 139.
Mochan, S., Moore J. & Connolly, T. 2009. Using
acoustic tools in forestry and the wood supply chain.
Technical Note FCTN018. Edinburgh, UK, Forestry
Commission (also available at www.forestry.gov.uk/pdf/
FCTN018.pdf/$FILE/FCTN018.pdf).
162 | References
Moloughney, S. 2009. What’s next in herbs and
botanicals? Nutraceuticals World November 2009.
Moore, G. 2007. Future of smart paper. Article on Pira’s
Profit through Innovation website (available at http://
profitthroughinnovation.com/pulp-and-paper/future-of-
smart-paper.html).
OECD. 2009. What future for the agriculture and food
sector in an increasingly globalised world?. Workshop
summary presented to the Organisation for Economic
Co-operation and Development (OECD) Committee for
Agriculture, Paris, France, 1 April 2009.
Ota, I. 2007. A forest owners’ cooperative in Japan:
obtaining benefits of certification for small-scale forests.
Unasylva, 228(58): 64–66.
Padoch, C. & De Jong, W. 1992. Diversity, variation,
and change in Ribereno agriculture. In K.H. Redford & C.
Padoch, eds. Conservation of neotropical forests: working
from traditional resource use. pp. 158–174. New York,
USA, Columbia University Press.
Palmer, S. 2000. Sustainable homes: timber frame
housing. Teddington, UK, Sustainable Homes (available
at: www.sustainablehomes.co.uk/upload/publication/
Timber%20Frame%20Housing.pdf).
Pescott, M. & Wilkinson, G. 2009. Codes of practice
for forest harvesting – monitoring and evaluation. Forest
News, 23(4): 6–7.
Peters, C.M. 2000. Precolumbian silviculture and
indigenous management of neotropical forests. In D.L.
Lentz, ed. Imperfect Balance: Landscape Transformations
in the Precolumbian Americas. pp.203–223. New York,
USA, Columbia University Press.
Petersen, F. & Kuhn, T. 2007. Novartis and biodiversity:
perspectives on access and benefit-sharing. Business
2010. Montreal, Canada, Secretariat of the Convention on
Biological Diversity (CBD).
Phelps, J., Webb, E.L. & Agrawal, A. 2010. Does REDD+
threaten to recentralize forest governance? Science, 328:
312–313.
Porter, M.E. 1990. The competitive advantage of nations.
New York, USA, New York Basic Books.
Posey, D.A. & Balée, W. (eds). 1989. Resource
management in Amazonian indigenous folk strategies
(advances in economic botany volume 7). New York, USA,
New York Botanical Garden Press.
Prasad, R. 1999. Joint forest management in India
and the impact of state control over non-wood forest
products. International Journal of Forestry and Forest
Industry, 50 (198): 58–62.
Pretty, J., Adams, W., Berkes, F., Ferreira de Athayde,
S., Dudley, N., Hunn, E., Maffi, L., Milton, K., Rapport,
D., Robbins, P., Sterling, E., Stolton, S., Tsing, A.,
Vintinnerk, E. & Pilgrim, S. 2010. The intersections
of biological diversity and cultural diversity: towards
integration. Conservation and Society, 7(2): 100–112 (also
available at www.conservationandsociety.org).
Renner, M. 1991. Jobs in a sustainable economy.
Washington, DC, USA, Worldwatch Institute.
Roberts, G., Parrotta, J. & Wreford, A. 2009. Current
adaptation measures and policies. In R. Seppälä, A.
Buck and P. Katila, eds. Adaptation of forests and people
to climate change – a global assessment report. IUFRO
World Series Volume 22. pp. 123–134. Helsinki, Finland,
International Union of Forest Research Organizations.
224 pp. (also available at www.iufro.org/download/
file/4485/4496/Full_Report.pdf).
Romano, F. & Reeb, D. 2006. Understanding forest
tenure: what rights and for whom? Rome, Italy, FAO (also
available at ftp://ftp.fao.org/docrep/fao/009/ah250e/
ah250e00.pdf).
Rosenbaum, L., Schoene, D. & Mekouar, A. 2004.
Climate change and the forest sector. Possible national
and subnational legislation. FAO Forestry Paper 144.
Rome, Italy, FAO (also available at www.fao.org/
docrep/007/y5647e/y5647e00.htm).
Scherr, S.J., White, A. & Kaimowitz, D. 2003. A new
agenda for forest conservation and poverty reduction:
making markets work for low-income producers.
Washington, DC, USA, Forest Trends.
Schreckenberg, K., Degrande, A., Mbosso, C., Eoli
Baboule, Z., Boyd, C., Enyong, L., Kanmegne, J. &
Ngong, C. 2002. The social and economic importance
of Dacryoides edulis in S. Cameroon. Journal of Forests,
Trees and Livelihoods, 12(2):15–40.

References | 163
Schumpeter, J. 1934. The theory of economic
development. Boston, USA, Harvard University Press.
Schwab, J. (ed.) 2009. Planning the urban forest, ecology,
economy, and community development. APA Planning
Advisory Service, 2009. ISBN 978-1-932364-57-6.
Secretariat of the Convention on Biological Diversity.
2002. Bonn guidelines on access to genetic resources
and fair and equitable sharing of the benefits arising out
of their utilization. Montreal, Canada, Secretariat of the
Convention on Biological Diversity.
Shackleton, S., Shanley, P. & Ndoye, O. 2007. Invisible
but viable: recognising local markets for non timber forest
products. International Forestry Review, 9 (3): 697–712.
Shepherd, G. 2010. The ecosystem approach in Anjouan,
Comoro Islands: managing the integration of diverse
landscape choices. Paper written for Darwin Initiative and
Bristol Zoo Gardens.
Spathelf P & Nutto L. 2004. Urban forestry in Curitiba:
a model for Latin-American cities? In: Konijnendijk,
C.C., Schipperijn, J. & Hoyer, K.K., eds. Forestry serving
urbanised societies. Selected papers from conference held
in Copenhagen, Denmark, 27–30 August 2002. IUFRO
World Series Volume 14. IUFRO, Vienna, pp. 357–365.
Stern, N. 2006. The economics of climate change. The
Stern review. Cambridge, UK, Cambridge University
Press.
Stoian, D. 2005 Making the best of two worlds: rural
and peri-urban livelihoods options sustained by non
timber forest products from the Bolivian Amazon. World
Development, 33: 1473–1490.
Sunderlin, W.D., Hatcher. J. & Liddle. M. 2008. From
exclusion to Ownership? Challenges and opportunities
in advancing forest tenure reform. Washington DC, USA,
Rights and Resources.
Sunderlin, W.D., Dewi, S., Puntodewo, A., Müller,
D., Angelsen, A. & Epprecht, M. 2008. Why forests
are important for global poverty alleviation: a spatial
explanation. Ecology and Society, 13(2): 24 (also available
at www.ecologyandsociety.org/vol13/iss2/art24/).
Sylva Foundation. 2010. myForest website (available at
http://sylva.org.uk/myforest/index.php).
Takacs, D. 2009. Forest carbon: law + property rights.
Arlington, USA, Conservation International (also available
at www.conservation.org/Documents/CI_Climate_Forest-
Carbon_Law-Property-Rights_Takacs_Nov09.pdf).
Tyrväinen, L., Pauleit, S., Seeland, K. & de Vries S.
2005. Benefits and uses of urban forests and trees.
In: Konijnendijk, C.C., Nilsson, K., Randrup, T.B. &
Schipperijn, J., eds. Urban forests and trees. pp. 81–114.
Berlin, Germany, Springer.
UN. 2010. COMTRADE – the United Nations Commodity
Trade Statistics Database (available at http://comtrade.
un.org).
UN. forthcoming. UNECE-FAO forest products annual
market review 2009–2010. United Nations Economic
Commission for Europe: Timber Section, Geneva,
Switzerland. Rome, Italy, FAO (also available at http://
timber.unece.org/index.php?id=303).
UNECE/FAO. 2005. European forest sector outlook study
1960-2000-2020: main report. Rome, Italy, FAO (also
available at www.fao.org/docrep/008/ae428e/ae428e00.htm).
UNECE/FAO. 2007. State of Europe’s forests 2007:
the MCPFE report on sustainable forest management
in Europe. Jointly prepared by the MCPFE Liaison
Unit. Warsaw: UNECE and FAO (also available at www.
foresteurope.org/filestore/foresteurope/Publications/pdf/
state_of_europes_forests_2007.pdf).
UNFCCC. 2010. Text to facilitate negotiations among
Parties. Issued as an official document (FCCC/
AWGLCA/2010/8) for consideration at the eleventh session
of the AWG-LCA, 9 July 2010 (also available at http://
unfccc.int/resource/docs/2010/awglca11/eng/08.pdf)
von Hippel, E. 1988. The sources of innovation. Oxford,
UK, Oxford University Press.
Wagberg, P. 2007. Innovation and research for success in
the new media landscape. Paper presented to the Forest-
Based Sector Technology Platform conference, Hannover,
Germany, 15–16 May 2007.
Wolf, K.L. 2004. Human services provided by urban
forests economic valuation opportunities. Seattle,
USA, Center for Urban Horticulture at the University of
Washington.

164 | References
World Bank. 2010. Global economic prospects – summer
2010: fiscal headwinds and recovery. Washington, DC,
USA, World Bank.
World Health Organization. 2008. Traditional medicine
fact sheet 134. World Health Organization. Geneva,
Switzerland (also available at www.who.int/mediacentre/
factsheets/fs134).
Wynberg, R.P. & Laird, S.A. 2007. Less is often more:
governance of a non-timber forest product, maula
(Sclerocarya birrea subsp. caffra) in Southern Africa.
International Forestry Review, 9(1): 475–490.
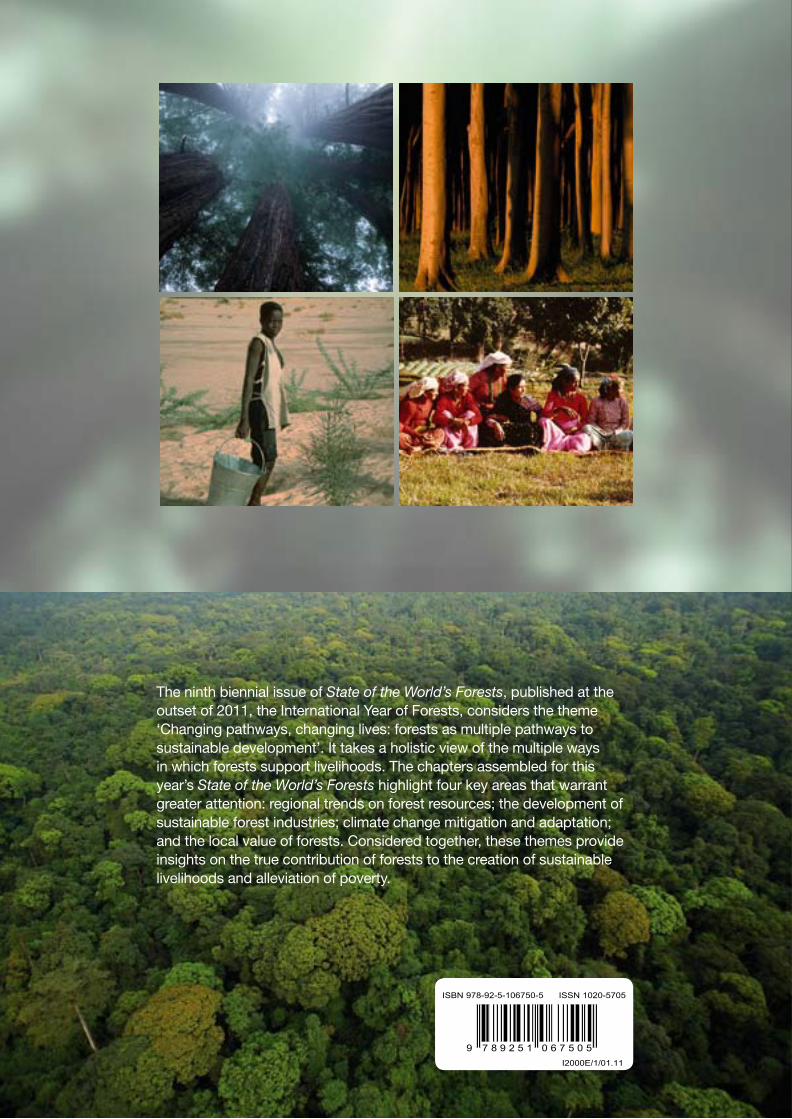
The ninth biennial issue of State of the World’s Forests, published at the outset of 2011, the International Year of Forests, considers the theme ‘Changing pathways, changing lives: forests as multiple pathways to sustainable development’. It takes a holistic view of the multiple ways in which forests support livelihoods. The chapters assembled for this year’s State of the World’s Forests highlight four key areas that warrant greater attention: regional trends on forest resources; the development of sustainable forest industries; climate change mitigation and adaptation; and the local value of forests. Considered together, these themes provide insights on the true contribution of forests to the creation of sustainable livelihoods and alleviation of poverty.
2011State of the World’s Forests
9 7 8 9 2 5 1 0 6 7 5 0 5I2000E/1/01.11
ISBN 978-92-5-106750-5 ISSN 1020-5705
State of the W
orld’s Forests 2011FA
O