feasibility studies on pyro-sfr closed fuel cycle and
TRANSCRIPT
Research ArticleFeasibility Studies on Pyro-SFR Closed Fuel Cycle andDirect Disposal of Spent Nuclear Fuel in Line with the LatestNational Policy and Strategy of Korea
MuhammadMinhaj Khan, Jae Min Lee, Jae Hak Cheong, and Joo HoWhang
Kyung Hee University, 1732 Deogyeong-daero, Giheung-gu, Yongin-si, Gyeonggi-do 17104, Republic of Korea
Correspondence should be addressed to Jae Hak Cheong; [email protected]
Received 20 June 2017; Revised 22 August 2017; Accepted 17 September 2017; Published 31 October 2017
Academic Editor: Arkady Serikov
Copyright © 2017 Muhammad Minhaj Khan et al. This is an open access article distributed under the Creative CommonsAttribution License, which permits unrestricted use, distribution, and reproduction in any medium, provided the original work isproperly cited.
With a view to providing supportive information for the decision-making on the direction of the future nuclear energy systems inKorea (i.e., direct disposal or recycling of spent nuclear fuel) to be made around 2020, quantitative studies on the spent nuclear fuel(SNF) including transuranic elements (TRUs) and a series of economic analyses were conducted. At first, the total isotopic inventoryof TRUs in the SNF to be generated from all thirty-six units of nuclear power plants in operation or under planning is estimatedbased on the Korean government’s official plan for nuclear power development. Secondly, the optimized deployment strategies areproposed considering the minimum number of sodium cooled-fast reactors (SFRs) needed to transmute all TRUs. Finally, directdisposal andPyro-SFR closed nuclear energy systemswere compared using equilibriumeconomicmodel and considering reductionof TRUs and electricity generation as benefits. Probabilistic economic analysis shows that the assumed total generation cost for directdisposal andPyro-SFR closed nuclear energy systems resideswithin the range of 13.60∼33.94mills/kWhand 11.40∼25.91mills/kWh,respectively. Dominant cost elements and the range of SFR overnight cost which guarantees the economic feasibility of the Pyro-SFR closed nuclear energy system over the direct disposal option were also identified through sensitivity analysis and break-evencost estimation.
1. Introduction
AsofMarch 2016, the amount of spent nuclear fuel (SNF) pro-duced from twenty units of pressurized light water reactors(PWRs) and four units of pressurized heavy water reactors(PHWRs) was reported to be about 14,608 metric tons ofuranium (MTU) from the whole twenty-four units of Koreannuclear power plants (NPPs) (i.e., PWRs and PHWRs) [1].The generation of SNF will continually increase since Koreais officially planning to deploy an additional eight units ofAdvanced Power Reactor 1400 (APR-1400) and four units ofAdvanced Power Reactor Plus (APR+) type PWRs by 2029 asscheduled in the 7th Basic Plan on Electricity Demand andSupply promulgated in July 2015 [2].
Due to the limited capacities of the SNF storage facilitiesat existing NPPs sites, the Korean government establishedthe Basic Plan on High-level RadioactiveWaste Management
in July 2016, which specifies the plan for operation of acentralized SNF interim storage facility and a high-levelradioactive waste (HLW) disposal facility by 2035 and 2053,respectively [3].
In parallel, the Korean government also plans todecide whether or not to commercialize the Pyro-SFR(pyroprocessing-sodium cooled-fast reactor) fuel cycle tech-nology which has been developed since 1997, by around 2020,based upon the result of ongoing feasibility studies as clearlyaddressed in the Strategy for Technical Development andDemonstration of Future Nuclear Energy System publishedin July 2016 [4]. Accordingly, the national direction of theback-end fuel cycle is to be decided in the next few years.
Feasibilities of direct disposal and Pyro-SFR fuel cycleoptions based upon the national policy and strategies mayprovide an important input for the Korean government indeliberating optimized fuel cycle directions. A number of
HindawiScience and Technology of Nuclear InstallationsVolume 2017, Article ID 1953256, 17 pageshttps://doi.org/10.1155/2017/1953256
2 Science and Technology of Nuclear Installations
11.64%
x
88.36%
82.7%
14.4y 17.3%
x
x
x
x
NuclideCapture
Note. The symbol “x” represents the point at which the transmutation of a radionuclidethrough a specific reaction is not expected or its contribution is negligible.
2385
−decay
decay
+decay
(n, )
241!G 242m!G 243!G
n, 2n n, 2n
2420O2410O2400O2390O2380O
237.J
2365235
5
242#G 244#G
87.7y
0.446y
18.1y
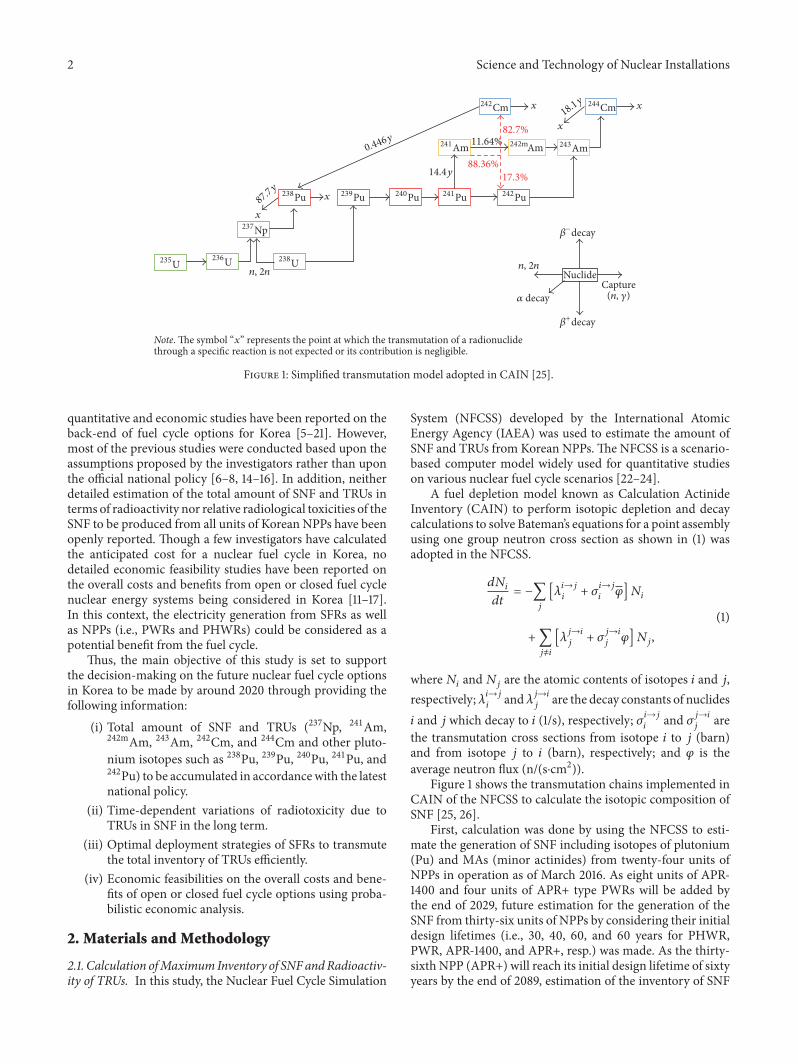
Figure 1: Simplified transmutation model adopted in CAIN [25].
quantitative and economic studies have been reported on theback-end of fuel cycle options for Korea [5–21]. However,most of the previous studies were conducted based upon theassumptions proposed by the investigators rather than uponthe official national policy [6–8, 14–16]. In addition, neitherdetailed estimation of the total amount of SNF and TRUs interms of radioactivity nor relative radiological toxicities of theSNF to be produced from all units of Korean NPPs have beenopenly reported. Though a few investigators have calculatedthe anticipated cost for a nuclear fuel cycle in Korea, nodetailed economic feasibility studies have been reported onthe overall costs and benefits from open or closed fuel cyclenuclear energy systems being considered in Korea [11–17].In this context, the electricity generation from SFRs as wellas NPPs (i.e., PWRs and PHWRs) could be considered as apotential benefit from the fuel cycle.
Thus, the main objective of this study is set to supportthe decision-making on the future nuclear fuel cycle optionsin Korea to be made by around 2020 through providing thefollowing information:
(i) Total amount of SNF and TRUs (237Np, 241Am,242mAm, 243Am, 242Cm, and 244Cm and other pluto-nium isotopes such as 238Pu, 239Pu, 240Pu, 241Pu, and242Pu) to be accumulated in accordancewith the latestnational policy.
(ii) Time-dependent variations of radiotoxicity due toTRUs in SNF in the long term.
(iii) Optimal deployment strategies of SFRs to transmutethe total inventory of TRUs efficiently.
(iv) Economic feasibilities on the overall costs and bene-fits of open or closed fuel cycle options using proba-bilistic economic analysis.
2. Materials and Methodology
2.1. Calculation ofMaximum Inventory of SNFandRadioactiv-ity of TRUs. In this study, the Nuclear Fuel Cycle Simulation
System (NFCSS) developed by the International AtomicEnergy Agency (IAEA) was used to estimate the amount ofSNF and TRUs from Korean NPPs. The NFCSS is a scenario-based computer model widely used for quantitative studieson various nuclear fuel cycle scenarios [22–24].
A fuel depletion model known as Calculation ActinideInventory (CAIN) to perform isotopic depletion and decaycalculations to solve Bateman’s equations for a point assemblyusing one group neutron cross section as shown in (1) wasadopted in the NFCSS.
𝑑𝑁𝑖𝑑𝑡 = −∑
𝑗
[𝜆𝑖→𝑗𝑖 + 𝜎𝑖→𝑗𝑖 𝜑]𝑁𝑖
+∑𝑗 ̸=𝑖
[𝜆𝑗→𝑖𝑗 + 𝜎𝑗→𝑖𝑗 𝜑]𝑁𝑗,(1)
where𝑁𝑖 and𝑁𝑗 are the atomic contents of isotopes 𝑖 and 𝑗,respectively;𝜆𝑖→𝑗𝑖 and𝜆𝑗→𝑖𝑗 are the decay constants of nuclides𝑖 and 𝑗 which decay to 𝑖 (1/s), respectively; 𝜎𝑖→𝑗𝑖 and 𝜎𝑗→𝑖𝑗 arethe transmutation cross sections from isotope 𝑖 to 𝑗 (barn)and from isotope 𝑗 to 𝑖 (barn), respectively; and 𝜑 is theaverage neutron flux (n/(s⋅cm2)).
Figure 1 shows the transmutation chains implemented inCAIN of the NFCSS to calculate the isotopic composition ofSNF [25, 26].
First, calculation was done by using the NFCSS to esti-mate the generation of SNF including isotopes of plutonium(Pu) and MAs (minor actinides) from twenty-four units ofNPPs in operation as of March 2016. As eight units of APR-1400 and four units of APR+ type PWRs will be added bythe end of 2029, future estimation for the generation of theSNF from thirty-six units of NPPs by considering their initialdesign lifetimes (i.e., 30, 40, 60, and 60 years for PHWR,PWR, APR-1400, and APR+, resp.) was made. As the thirty-sixth NPP (APR+) will reach its initial design lifetime of sixtyyears by the end of 2089, estimation of the inventory of SNF

Science and Technology of Nuclear Installations 3
and TRUs has been made by the year of 2089 as a referenceyear [2].
In order to predict the maximum inventory of SNFand TRUs to be produced from all Korean NPPs, twentyyears of continued operations of NPPs after terminationof their initial design lifetimes were additionally assumed[8]. However, Kori Unit 1 whose initial design lifetime hasbeen already extended for ten years (i.e., from 2007-06-19 to2017-06-18) was shut down permanently on June 19, 2017, inaccordance with the government policy [2]. In addition, thesecond term of continued operation of 10 years for WolsongUnit 1 is assumed, of which its first continued operation until2022-11-20 was approved in 2015. As the thirty-sixth NPP(APR+) will reach its extended design lifetime by the end of2109, the potentialmaximum inventory of SNF andTRUswasestimated by the year of 2109 as another reference year.
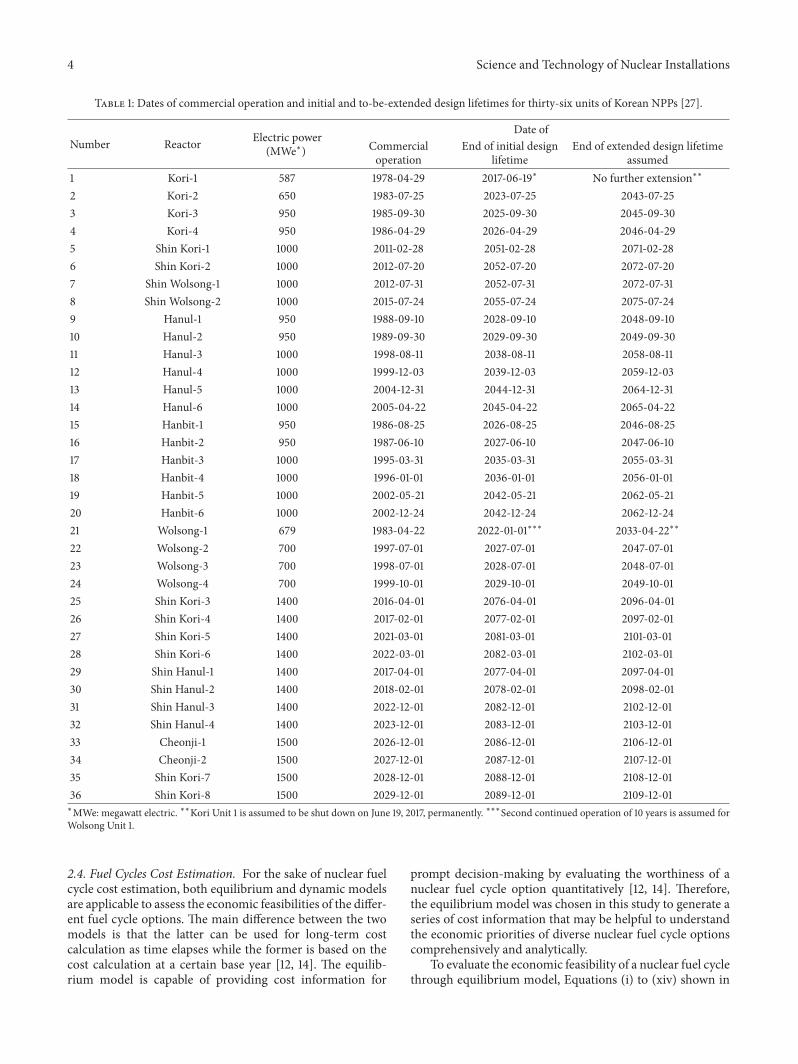
Table 1 shows the full list of all units of Korean NPPs(PWRs, PHWRs) which have been already deployed or willbe deployed by 2029, along with the time of commercialoperation and termination of initial and extended designlifetime [27].
The time-dependent material flow of SNF for each NPPthroughout its lifetime is calculated by MS Excel� spread-sheet based upon the basic information on the Korean NPPsas shown in Table 1 and the calculation results of the NFCSSsuch as the amount of SNF including isotopic composition ofTRUs to be generated from each Korean NPP per cycle.
2.2. Calculation of Nominal Radiotoxicities. In order to quan-tify the radiological hazard from each nuclide of TRUsand/or overall hazard from multiple nuclides, a few nominalexpressions of radiotoxicity or radiotoxicity index for SNFwere reported [28]. In this study, the time-variant nominalradiotoxicity index (in Sv or Sv/g) of SNF was proposed as
Radiotoxicity Index = ∑𝑖
𝐴 𝑖 ⋅ 𝑒−𝜆𝑖𝑡 ⋅ EDCing,𝑖
or ∑𝑖
𝐶𝑖 ⋅ 𝑒−𝜆𝑖𝑡 ⋅ EDCing,𝑖
(2)
𝐴 𝑖 = 𝜆𝑖 ⋅ 𝑁𝑖 = ln 2𝑇1/2,𝑖 ⋅ 𝑚𝑖 ⋅
𝑁𝐴𝑀𝑖 , (3)
where𝐴 𝑖 is the radioactivity of a TRU nuclide 𝑖 (Bq),𝐶𝑖 is theradioactivity concentration of nuclide 𝑖 (Bq/g), EDCing,𝑖 is theeffective dose coefficient to an adult age group for ingestion(Sv/Bq), 𝜆𝑖 is the decay constant of nuclide 𝑖 (1/y), 𝑡 is theelapsed time from discharge of the SNF from reactor core (y),𝑁𝑖 is the number of nuclides 𝑖,𝑚𝑖 is the mass of nuclide 𝑖 (g),𝑁𝐴 is Avogadro’s number (6.02×10²³ /mol),𝑀𝑖 is the atomicmass of TRU nuclide 𝑖 (g/mol), and 𝑇1/2,𝑖 is the half-life ofTRU nuclide 𝑖 (y).
Only ingestion rather than inhalation pathway is consid-ered in (2), since SNF is to be disposed of in deep geologicalmedia under direct disposal scenario and the volatilities ofthe actinides are low enough [29].The values for𝐴 𝑖 and𝐶𝑖 in(2) can be obtained from the nuclide-specific total inventoryof TRUs in Bq and total mass of SNF calculated by use of theNFCSS in terms of grams.The values of EDCing,𝑖 can be found
in a volume of the official publications of the InternationalCommission on Radiological Protection (ICRP) [30].
The radiotoxicity of SNF is known to be controlled byfission products for the first 300 years after being dischargedfrom the reactor core, but long-lived actinides contributemost to the radiotoxicity after 300 years [29]. Therefore, thisstudy mainly focuses on the ingestion radiotoxicity indicesfor long-lived actinides rather than those for fission products.
2.3. Establishment of Strategic Scenarios for Transmutation ofTRUs by SFRs. In order to compare the Pyro-SFR fuel cycleswith direct disposal options and further to find optimizedoptions for deployment of SFRs to transmute TRUs producedfrom all units of PWRs and PHWRs, a set of comparativescenarios are proposed as shown in Table 2.
While scenarios 1 and 2 are for the direct disposal ofSNF, the remaining six scenarios are proposed to compare theeffectiveness of the possible options for recycling of SNF inconnection with SFRs. It was also assumed that the metallicSNF discharged from SFRs will be recycled in the Pyro-SFRfuel cycle based upon past reference studies [12, 13, 31].
Korea Atomic Energy Research Institute (KAERI) hasbeen developing pyroprocessing technology in connectionwith SFR with a view to reducing the volume and the radio-toxicity of HLW (i.e., SNF) and thus to reducing the land areaneeded for direct disposal of SNF in deep geological forma-tions [4].
It is also noted that the time needed for cooling theSNF (i.e., at least five years for the SNF from PWR andPHWR) prior to pyroprocessing has been fully covered in thisstudy, since enough amount of sufficiently cooled-down SNFproduced from twenty-five units of NPPs since 1978 is alreadyavailable for pyroprocessing in Korea [31]. Furthermore, theKorean government plans to commercialize a pyroprocessingfacility along with SFR fuel fabrication plant by 2025 andthen to deploy the first unit of SFR after three years laterby 2028, while just about 8 months is reported to be neededfor SFR fuel fabrication [6, 32]. Accordingly, it can be saidthat the SFR fuel fabrication time has been already taken intoconsideration in this study.
The values of characteristic parameters of representativeSFRs listed in Table 3 for transmutation of TRUs in effectiveways were obtained from a few design studies on SFRs, whichwere used for calculations in this study [33, 34]. The char-acteristic data for SFR-1 and SFR-2 are generally taken from[33] and [34], respectively; however, the thermal efficiencyof SFR-2 is assumed to be the same as SFR-1 since the spe-cific thermal efficiency of SFR-2 is not available in the liter-ature review.
For the effective transmutation of TRUs, SFRs with CR= 0.46 and 0.6 have been assumed to be coupled with pyro-processing in order to transmute all transuranic inventorygeneration from NPPs. The impact of CR on the SFR wasdetermined by the consumption of TRUs as it is reported thatthe SFR with higher CR burns less TRUs, while the SFR withlower CR transmutes more. Thus, the minimum number ofSFRs to be deployed for transmutation of all the inventoryof TRUs can be eventually decided by the value of CR of aspecific SFR design [13, 33–35].
4 Science and Technology of Nuclear Installations
Table 1: Dates of commercial operation and initial and to-be-extended design lifetimes for thirty-six units of Korean NPPs [27].
Number Reactor Electric power(MWe∗)
Date ofCommercialoperation
End of initial designlifetime
End of extended design lifetimeassumed
1 Kori-1 587 1978-04-29 2017-06-19∗ No further extension∗∗
2 Kori-2 650 1983-07-25 2023-07-25 2043-07-253 Kori-3 950 1985-09-30 2025-09-30 2045-09-304 Kori-4 950 1986-04-29 2026-04-29 2046-04-295 Shin Kori-1 1000 2011-02-28 2051-02-28 2071-02-286 Shin Kori-2 1000 2012-07-20 2052-07-20 2072-07-207 Shin Wolsong-1 1000 2012-07-31 2052-07-31 2072-07-318 Shin Wolsong-2 1000 2015-07-24 2055-07-24 2075-07-249 Hanul-1 950 1988-09-10 2028-09-10 2048-09-1010 Hanul-2 950 1989-09-30 2029-09-30 2049-09-3011 Hanul-3 1000 1998-08-11 2038-08-11 2058-08-1112 Hanul-4 1000 1999-12-03 2039-12-03 2059-12-0313 Hanul-5 1000 2004-12-31 2044-12-31 2064-12-3114 Hanul-6 1000 2005-04-22 2045-04-22 2065-04-2215 Hanbit-1 950 1986-08-25 2026-08-25 2046-08-2516 Hanbit-2 950 1987-06-10 2027-06-10 2047-06-1017 Hanbit-3 1000 1995-03-31 2035-03-31 2055-03-3118 Hanbit-4 1000 1996-01-01 2036-01-01 2056-01-0119 Hanbit-5 1000 2002-05-21 2042-05-21 2062-05-2120 Hanbit-6 1000 2002-12-24 2042-12-24 2062-12-2421 Wolsong-1 679 1983-04-22 2022-01-01∗∗∗ 2033-04-22∗∗
22 Wolsong-2 700 1997-07-01 2027-07-01 2047-07-0123 Wolsong-3 700 1998-07-01 2028-07-01 2048-07-0124 Wolsong-4 700 1999-10-01 2029-10-01 2049-10-0125 Shin Kori-3 1400 2016-04-01 2076-04-01 2096-04-0126 Shin Kori-4 1400 2017-02-01 2077-02-01 2097-02-0127 Shin Kori-5 1400 2021-03-01 2081-03-01 2101-03-0128 Shin Kori-6 1400 2022-03-01 2082-03-01 2102-03-0129 Shin Hanul-1 1400 2017-04-01 2077-04-01 2097-04-0130 Shin Hanul-2 1400 2018-02-01 2078-02-01 2098-02-0131 Shin Hanul-3 1400 2022-12-01 2082-12-01 2102-12-0132 Shin Hanul-4 1400 2023-12-01 2083-12-01 2103-12-0133 Cheonji-1 1500 2026-12-01 2086-12-01 2106-12-0134 Cheonji-2 1500 2027-12-01 2087-12-01 2107-12-0135 Shin Kori-7 1500 2028-12-01 2088-12-01 2108-12-0136 Shin Kori-8 1500 2029-12-01 2089-12-01 2109-12-01∗MWe: megawatt electric. ∗∗Kori Unit 1 is assumed to be shut down on June 19, 2017, permanently. ∗∗∗Second continued operation of 10 years is assumed forWolsong Unit 1.
2.4. Fuel Cycles Cost Estimation. For the sake of nuclear fuelcycle cost estimation, both equilibrium and dynamic modelsare applicable to assess the economic feasibilities of the differ-ent fuel cycle options. The main difference between the twomodels is that the latter can be used for long-term costcalculation as time elapses while the former is based on thecost calculation at a certain base year [12, 14]. The equilib-rium model is capable of providing cost information for
prompt decision-making by evaluating the worthiness of anuclear fuel cycle option quantitatively [12, 14]. Therefore,the equilibrium model was chosen in this study to generate aseries of cost information that may be helpful to understandthe economic priorities of diverse nuclear fuel cycle optionscomprehensively and analytically.
To evaluate the economic feasibility of a nuclear fuel cyclethrough equilibrium model, Equations (i) to (xiv) shown in

Science and Technology of Nuclear Installations 5
Table 2: Assumed strategic scenarios for transmutation of TRUs in SNF.
Case Scenario Direct disposal/recycle Design lifetime SFR’s CRNPPs (PWRs and PHWRs) SFR
I SC-1 Direct disposal Design lifetime N/A N/ASC-2 Direct disposal +20 y N/A N/A
II SC-3 Recycle Design lifetime Design lifetime 0.46SC-4 Recycle Design lifetime Design lifetime 0.6
III SC-5 Recycle +20 y Design lifetime 0.46SC-6 Recycle +20 y Design lifetime 0.6
IV SC-7 Recycle +20 y +20 y 0.46SC-8 Recycle +20 y +20 y 0.6
SC: scenario; CR: conversion ratio; N/A: not applicable.
Table 3: Characteristics of the reference SFRs.
Reactor design SFR-1 SFR-2 UnitElectric power 600 MWeThermal efficiency 39.38 %Thermal power 1523.4 MWthCapacity factor 85 %Cycle length 332 EFPDDesign lifetime (normal) 60 YearsDesign lifetime (extended) 80 YearsConversion ratio 0.46 0.6 —Number of batches 6 4 —Discharge burnup 217 116.3 GWD/MTHMTRU consumption rate 530 307.1 kg/cycleFuel type TRU-W-10Zr metal TRU-U-10Zr metal Wt.%Annual electricity generation 4778.62 4770.41 GWhMWth: megawatt thermal; EFPD: effective full-power day; GWD: gigawatt days; MTHM: metric ton heavy metal; Kg: kilogram; Wt.%: weight percent; GWh:gigawatt hour.
Table 12 were proposed to calculate the fuel cycle costs withan assumption of zero discount rate [12]. All the unit cost dataare discounted to the base year of 2016 with an inflation rateof 2.08%. In order to calculate the fuel cycle cost (FCC) foreach fuel cycle, the individual process cost (i.e., the unit costmultiplied by thematerial quantity at each step of a fuel cycle)should be calculated. In case of PWR, Equations (i) to (iii)and (vi) can be used to calculate the individual process cost.The total process cost of nuclear fuel cycle can be defined asa summation of all the individual process costs involved inthe respective fuel cycle and calculated as such. In case ofPWR, PHWR, andPyro-SFR fuel cycles, the total process costof nuclear fuel cycle can be calculated by use of Equations(viii) to (x), respectively. The FCC can be defined as the totalprocess cost for a fuel cycle normalized to the electricitygeneration per unit mass and calculated by dividing the totalprocess cost for each fuel cycle with electricity generation perunit mass. Equations (xi) to (xiv) are used to calculate theFCCs of PWR,PHWR, andPyro-SFR fuel cycles, respectively.Calculation method and equations are referred from paststudies on the equilibrium mass flow and cost model innuclear fuel cycle [12, 36, 37].
In this study, however, Equations (xi) and (xii) weremodified in terms of general design parameters of PWRs andPHWRs,while Equations (xiii) and (xiv)weremodified basedon the specific design parameters of Korean SFRs [33, 34].Equations (ii) to (vi) were modified by including the costfor disposal of process waste being generated from processesof each fuel cycle [37]. Annual fuel requirement (𝐴FR) inMTHM and annual electricity generation (𝐴EG) in GWhfrom NPPs (i.e., PWRs and PHWRs) and SFRs are estimatedby
𝐴FR = 𝑃 × FCL𝜀 × BU𝐴EG = 𝐴FR × ( BU
1,000) × 𝜀 × (24 h1 d ) ,
(4)
where 𝑃 is the electric power of a reactor (MWe), FCL is thelength of a cycle (EFPD), 𝜀 is the thermal efficiency, and BUis the discharge burnup (MWD/MTHM). It is noted that theannual electricity generation for SFR-1 and SFR-2 in Table 3can be also calculated by using (4).
6 Science and Technology of Nuclear Installations
Collection of unit costs data and normalization
to 2016 USD
Calculation of individual process cost by use ofEquations (i) to (vii)
(Table 12)
Calculated individualprocess cost data with
reactor cost datamin, max, mean)
(Table 8)
Statistical data analyzation using
Simulation of process costs data with Crystal
Carlo method(using 50,000 samples)
Simulated Monte Carlo descriptive statistics
(Table 9)
Probabilistic fuel cycle costs
(Figure 6)
Calculation of direct disposal and Pyro-SFR scenario costs
(Table 10)
Estimation of closednuclear energy system
costs (Table 11)
Calculation of fuelcycle cost (FCC) by
use of Equations
Total generation cost of direct disposal and
closed nuclear energy systems (Figure 7)
Break-even analysis forclosed nuclear energy
systems cost(Figure 8)
Simulation of directdisposal and closed
nuclear energy system
using Monte Carlo method(using 50,000 samples)
Simulation of FCC
using Monte Carlo method (using 50,000
samples)
Section 3.4.1
Section 3.4.3 Section 3.4.4
Section 3.4.4Section 3.4.5
Sensitivity analysis forclosed nuclear energy
systems cost(Figure 9)
Section 3.4.6
Section 3.4.1
Section 3.4.2
with Crystal BalF
costs with Crystal BalF
BalF using Monte
ExceF4-
(viii) to (xiv)
Figure 2: Overall procedure to estimate cost for economic analysis adopted in this study.
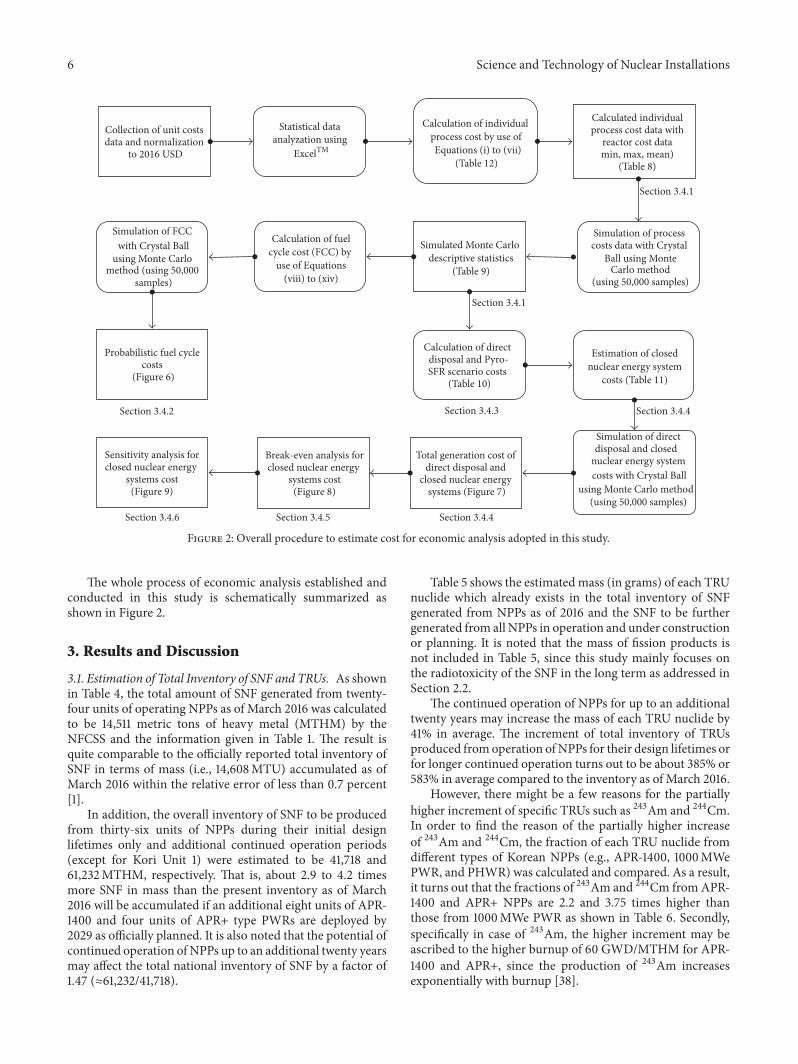
The whole process of economic analysis established andconducted in this study is schematically summarized asshown in Figure 2.
3. Results and Discussion
3.1. Estimation of Total Inventory of SNF and TRUs. As shownin Table 4, the total amount of SNF generated from twenty-four units of operating NPPs as of March 2016 was calculatedto be 14,511 metric tons of heavy metal (MTHM) by theNFCSS and the information given in Table 1. The result isquite comparable to the officially reported total inventory ofSNF in terms of mass (i.e., 14,608MTU) accumulated as ofMarch 2016 within the relative error of less than 0.7 percent[1].
In addition, the overall inventory of SNF to be producedfrom thirty-six units of NPPs during their initial designlifetimes only and additional continued operation periods(except for Kori Unit 1) were estimated to be 41,718 and61,232MTHM, respectively. That is, about 2.9 to 4.2 timesmore SNF in mass than the present inventory as of March2016 will be accumulated if an additional eight units of APR-1400 and four units of APR+ type PWRs are deployed by2029 as officially planned. It is also noted that the potential ofcontinued operation of NPPs up to an additional twenty yearsmay affect the total national inventory of SNF by a factor of1.47 (≈61,232/41,718).
Table 5 shows the estimated mass (in grams) of each TRUnuclide which already exists in the total inventory of SNFgenerated from NPPs as of 2016 and the SNF to be furthergenerated from all NPPs in operation and under constructionor planning. It is noted that the mass of fission products isnot included in Table 5, since this study mainly focuses onthe radiotoxicity of the SNF in the long term as addressed inSection 2.2.
The continued operation of NPPs for up to an additionaltwenty years may increase the mass of each TRU nuclide by41% in average. The increment of total inventory of TRUsproduced fromoperation ofNPPs for their design lifetimes orfor longer continued operation turns out to be about 385% or583% in average compared to the inventory as of March 2016.
However, there might be a few reasons for the partiallyhigher increment of specific TRUs such as 243Am and 244Cm.In order to find the reason of the partially higher increaseof 243Am and 244Cm, the fraction of each TRU nuclide fromdifferent types of Korean NPPs (e.g., APR-1400, 1000MWePWR, and PHWR) was calculated and compared. As a result,it turns out that the fractions of 243Am and 244Cm fromAPR-1400 and APR+ NPPs are 2.2 and 3.75 times higher thanthose from 1000MWe PWR as shown in Table 6. Secondly,specifically in case of 243Am, the higher increment may beascribed to the higher burnup of 60 GWD/MTHM for APR-1400 and APR+, since the production of 243Am increasesexponentially with burnup [38].

Science and Technology of Nuclear Installations 7
Table 4: Total amount of SNF to be generated from operation of all units of PWRs and PHWRs planned to be deployed by 2029 per reactorsite.
Site
Amount of SNF (MTHM)
As of March 2016With operation forinitial design lifetime
(2089)∗
With continuedoperation for an
additional 20 years(2109)∗
This study [1] (MTU)Kori (PWRs) 2,201 2,294 11,905 16,282Hanul (PWRs) 2,049 2,043 9,716 13,697Hanbit (PWRs) 2,391 2,403 4,502 6,753Shin-Wolsong (PWRs) 65 54 1,203 1,804Wolsong (PHWRs) 7,805 7,815 11,514 18,858Cheonji (PWRs) — — 2,878 3,837Total 14,511 14,608 41,718 61,232∗Results for the year of 2089 represent the scenario where continued operation of 36 units of NPPs is not assumed, and those for the year of 2109 are for thescenario where continued operation of all NPPs except for Kori Unit 1 is taken into account. In addition, the contribution of fission products in the spentnuclear fuel is not included in this table.
Table 5: Total mass of TRUs to be produced and accumulated from operation of all units of NPPs (PWRs, PHWRs) planned to be deployedby 2029∗.
Nuclide Half-life (y) Total mass of TRUs (g) as of Percentage of added mass for the period (%)2016 2089 2109 2016 to 2089 2016 to 2109 2089 to 2109
241Am 4.32𝐸 + 02 3.79𝐸 + 05 1.70𝐸 + 06 2.39𝐸 + 06 349% 534% 41%242mAm 1.41𝐸 + 02 8.54𝐸 + 03 4.02𝐸 + 04 5.65𝐸 + 04 371% 565% 41%243Am 7.37𝐸 + 03 1.31𝐸 + 06 1.26𝐸 + 07 1.72𝐸 + 07 862% 1220% 37%242Cm 1.63𝐸 + 02 1.48𝐸 + 05 8.86𝐸 + 05 1.23𝐸 + 06 500% 737% 39%244Cm 1.81𝐸 + 01 4.92𝐸 + 05 7.90𝐸 + 06 1.07𝐸 + 07 1506% 2080% 36%237Np 2.14𝐸 + 06 5.73𝐸 + 06 2.43𝐸 + 07 3.43𝐸 + 07 324% 502% 42%238Pu 8.77𝐸 + 01 2.19𝐸 + 06 1.24𝐸 + 07 1.73𝐸 + 07 466% 692% 40%239Pu 2.41𝐸 + 04 5.52𝐸 + 07 1.84𝐸 + 08 2.65𝐸 + 08 233% 383% 45%240Pu 6.56𝐸 + 03 2.61𝐸 + 07 9.59𝐸 + 07 1.37𝐸 + 08 267% 428% 44%241Pu 1.43𝐸 + 01 1.22𝐸 + 07 5.47𝐸 + 07 7.70𝐸 + 07 348% 534% 42%242Pu 3.73𝐸 + 05 5.53𝐸 + 06 3.62𝐸 + 07 5.01𝐸 + 07 553% 809% 39%Total 1.09𝐸 + 08 4.30𝐸 + 08 6.16𝐸 + 08 385% 583% 41%∗Results for the year of 2089 represent the scenario where continued operation of 36 units of NPPs is not assumed, and those for the year of 2109 are for thescenario where continued operation of all NPPs except for Kori Unit 1 is taken into account.
Table 6: Fractions of 243Am and 244Cm generated from differenttypes of Korean NPPs.
Reactor Radionuclide243Am 244Cm
PHWR 4.066𝐸 − 04 3.742𝐸 − 051000MWe PWR 1.977𝐸 − 02 8.169𝐸 − 03APR-1400 4.371𝐸 − 02 3.068𝐸 − 02APR+ 4.371𝐸 − 02 3.068𝐸 − 02
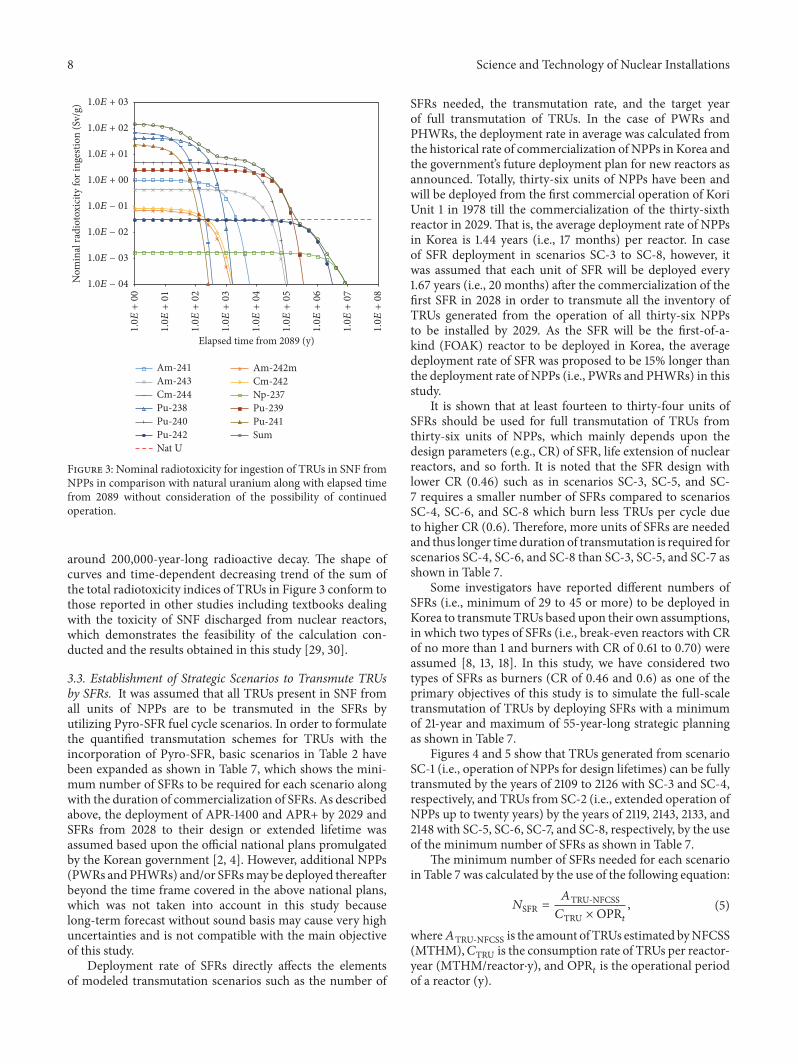
3.2. Estimation of Nominal Radiological Risks. Figure 3 showsthe time-dependent nominal radiotoxicity index (in Sv/g) forthe total inventory of TRUs in SNF to be generated from allthirty-six units of NPPs without continued operation, whichwas calculated by (2) and (3) using the values of parameters
in Table 5. Figure 3 also shows the general trend of time-dependent decreasing of radiotoxicity index and dominantTRU nuclides along with elapsed time from the year of 2089,in which the last NPP’s initial lifetime will be ended. Duringthe first sixteen years, the total radiotoxicity index is con-trolled by 244Cm, and then it is controlled by 238Pu until 250years from its initial decay. Subsequently, the most import-ant TRU nuclides are 240Pu until 8,200 years and 239Pu until260,000 years, and then 242Pu and 237Np dominate the radio-toxicity index subsequently for relative comparison.
The relative ingestion radiotoxicity index of naturaluranium is also plotted. The ingestion radiotoxicity indexof the natural uranium was calculated from the specificactivity (25,280 Bq/g) and ingestion dose coefficient for adult(31.7mSv/g) of natural uranium [39]. It can be said that theradiotoxicity index of TRUs in total inventory of SNF willdecrease down to the level of the natural uranium only after
8 Science and Technology of Nuclear Installations
Am-241Am-243
Pu-238Pu-240Pu-242Nat U
Am-242m
Cm-244Cm-242Np-237Pu-239Pu-241Sum
1.0E − 04
1.0E − 03
1.0E − 02
1.0E − 01
1.0E + 00
1.0E + 01
1.0E + 02
1.0E + 03
Nom
inal
radi
otox
icity
for i
nges
tion
(Sv/
g)
1.0E
+01
1.0E
+02
1.0E
+03
1.0E
+04
1.0E
+05
1.0E
+06
1.0E
+07
1.0E
+08
1.0E
+00
Elapsed time from 2089 (y)
Figure 3: Nominal radiotoxicity for ingestion of TRUs in SNF fromNPPs in comparison with natural uranium along with elapsed timefrom 2089 without consideration of the possibility of continuedoperation.
around 200,000-year-long radioactive decay. The shape ofcurves and time-dependent decreasing trend of the sum ofthe total radiotoxicity indices of TRUs in Figure 3 conform tothose reported in other studies including textbooks dealingwith the toxicity of SNF discharged from nuclear reactors,which demonstrates the feasibility of the calculation con-ducted and the results obtained in this study [29, 30].
3.3. Establishment of Strategic Scenarios to Transmute TRUsby SFRs. It was assumed that all TRUs present in SNF fromall units of NPPs are to be transmuted in the SFRs byutilizing Pyro-SFR fuel cycle scenarios. In order to formulatethe quantified transmutation schemes for TRUs with theincorporation of Pyro-SFR, basic scenarios in Table 2 havebeen expanded as shown in Table 7, which shows the mini-mum number of SFRs to be required for each scenario alongwith the duration of commercialization of SFRs. As describedabove, the deployment of APR-1400 and APR+ by 2029 andSFRs from 2028 to their design or extended lifetime wasassumed based upon the official national plans promulgatedby the Korean government [2, 4]. However, additional NPPs(PWRs andPHWRs) and/or SFRsmay be deployed thereafterbeyond the time frame covered in the above national plans,which was not taken into account in this study becauselong-term forecast without sound basis may cause very highuncertainties and is not compatible with the main objectiveof this study.
Deployment rate of SFRs directly affects the elementsof modeled transmutation scenarios such as the number of
SFRs needed, the transmutation rate, and the target yearof full transmutation of TRUs. In the case of PWRs andPHWRs, the deployment rate in average was calculated fromthe historical rate of commercialization of NPPs in Korea andthe government’s future deployment plan for new reactors asannounced. Totally, thirty-six units of NPPs have been andwill be deployed from the first commercial operation of KoriUnit 1 in 1978 till the commercialization of the thirty-sixthreactor in 2029. That is, the average deployment rate of NPPsin Korea is 1.44 years (i.e., 17 months) per reactor. In caseof SFR deployment in scenarios SC-3 to SC-8, however, itwas assumed that each unit of SFR will be deployed every1.67 years (i.e., 20 months) after the commercialization of thefirst SFR in 2028 in order to transmute all the inventory ofTRUs generated from the operation of all thirty-six NPPsto be installed by 2029. As the SFR will be the first-of-a-kind (FOAK) reactor to be deployed in Korea, the averagedeployment rate of SFR was proposed to be 15% longer thanthe deployment rate of NPPs (i.e., PWRs and PHWRs) in thisstudy.
It is shown that at least fourteen to thirty-four units ofSFRs should be used for full transmutation of TRUs fromthirty-six units of NPPs, which mainly depends upon thedesign parameters (e.g., CR) of SFR, life extension of nuclearreactors, and so forth. It is noted that the SFR design withlower CR (0.46) such as in scenarios SC-3, SC-5, and SC-7 requires a smaller number of SFRs compared to scenariosSC-4, SC-6, and SC-8 which burn less TRUs per cycle dueto higher CR (0.6). Therefore, more units of SFRs are neededand thus longer timeduration of transmutation is required forscenarios SC-4, SC-6, and SC-8 than SC-3, SC-5, and SC-7 asshown in Table 7.
Some investigators have reported different numbers ofSFRs (i.e., minimum of 29 to 45 or more) to be deployed inKorea to transmute TRUs based upon their own assumptions,in which two types of SFRs (i.e., break-even reactors with CRof no more than 1 and burners with CR of 0.61 to 0.70) wereassumed [8, 13, 18]. In this study, we have considered twotypes of SFRs as burners (CR of 0.46 and 0.6) as one of theprimary objectives of this study is to simulate the full-scaletransmutation of TRUs by deploying SFRs with a minimumof 21-year and maximum of 55-year-long strategic planningas shown in Table 7.
Figures 4 and 5 show that TRUs generated from scenarioSC-1 (i.e., operation of NPPs for design lifetimes) can be fullytransmuted by the years of 2109 to 2126 with SC-3 and SC-4,respectively, and TRUs from SC-2 (i.e., extended operation ofNPPs up to twenty years) by the years of 2119, 2143, 2133, and2148 with SC-5, SC-6, SC-7, and SC-8, respectively, by the useof the minimum number of SFRs as shown in Table 7.
The minimum number of SFRs needed for each scenarioin Table 7 was calculated by the use of the following equation:
𝑁SFR = 𝐴TRU-NFCSS𝐶TRU ×OPR𝑡 , (5)
where𝐴TRU-NFCSS is the amount of TRUs estimated byNFCSS(MTHM),𝐶TRU is the consumption rate of TRUs per reactor-year (MTHM/reactor⋅y), and OPR𝑡 is the operational periodof a reactor (y).

Science and Technology of Nuclear Installations 9
Table 7: Strategic scenarios for transmutation of TRUs.
Case I Scenario SC-1 Scenario SC-2Number of PWRs 32 32Number of PHWRs 4 4Deployment period of PWRs and PHWRs 1978–2029 (51 years) 1978–2029 (51 years)MAs/Pu generated (MT) 47.38/383.08 66.14/549.43Case II Scenario SC-3 Scenario SC-4MAs/TRUs generated in SC-1 47.38/430.47 47.38/430.47Minimum number of SFRs needed 14 24Deployment period of SFRs 2028–2049 (21 years) 2028–2066 (38 years)Case III Scenario SC-5 Scenario SC-6MAs/TRUs generated in SC-2 66.14/615.57 66.14/615.57Minimum number of SFRs needed 20 34Deployment period of SFRs 2028–2059 (31 years) 2028–2083 (55 years)Case IV Scenario SC-7 Scenario SC-8MAs/TRUs generated in SC-2 66.14/615.57 66.14/615.57Minimum number of SFRs needed 15 25Deployment period of SFRs 2028–2051 (23 years) 2028–2068 (40 years)MT: metric ton; MAs: minor actinides; Pu: plutonium.
Final mass of TRUs without continued operationof PWRs and PHWRs (SC-1)
2016
2026
2036
2046
2056
2066
2076
2086
2096
2106
2116
2126
2136
2146
2156
Year
SC-3SC-4
0
50
100
150
200
250
300
350
400
450
500
550
600
650
Inve
ntor
y of
TRU
s (M
T)
Figure 4: Prospective reduction ofmass of TRUs inventory depend-ing upon two different scenarios in which PWRs and PHWRs areoperated for design lifetimes.
As noticed, the scope of this study is to simulate thedeployment of NPPs (i.e., PWRs and PHWRs) by the year of2029 and SFRs from the year of 2028 until their operationalor extended lifetime. Further deployment of NPPs and SFRsis not taken into account based on the 7th Basic Plan onElectricity Demand and Supply which includes the latestnational policy and strategies to construct an additional eightunits of APR-1400 and four units of APR+ by 2029 only.Thereis no specific plan to deployNPPs after 2100 [2]. Since the firstfeed of nuclear fuel for SFRs will bemanufactured fromTRUsin the SNF produced from NPPs (i.e., PWRs and PHWRs),deployment of additional SFRs would not be assumed when
Final mass of TRUs with continued operation of PWRs
SC-5SC-6
SC-7SC-8
0
50
100
150
200
250
300
350
400
450
500
550
600
650
Inve
ntor
y of
TRU
s (M
T)
2026
2036
2046
2056
2066
2076
2086
2096
2106
2116
2126
2136
2146
2156
2016
Year
and PHWRs (SC-2)
Figure 5: Prospective reduction ofmass of TRUs inventory depend-ing upon four different scenarios in which life extension of PWRs,PHWRs, and SFRs is allowed.
the NPPs (i.e., origin of the nuclear fuel for SFR) are not to bepresent in the future [13, 31]. Moreover, the basic methodol-ogy proposed in this study would be applicable if the govern-ment plans to deploy new nuclear reactors in the future.
3.4. Estimation of Cost for Direct Disposal and Pyro-SFRFuel Cycle Options
3.4.1. Derivation of Process Costs Based upon Unit Costs fromExisting Studies. In order to perform front- and back-endfuel cycle cost calculations, a variety of economic studieson nuclear fuel cycles were firstly reviewed and analyzed.
10 Science and Technology of Nuclear Installations
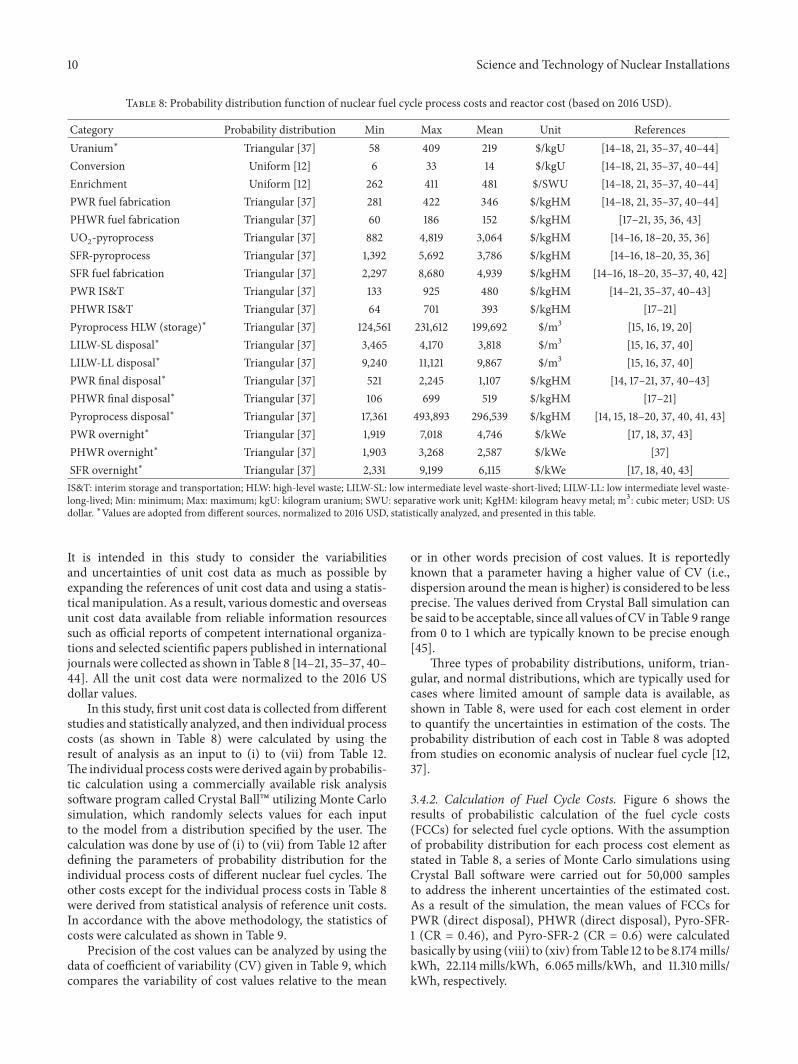
Table 8: Probability distribution function of nuclear fuel cycle process costs and reactor cost (based on 2016 USD).
Category Probability distribution Min Max Mean Unit ReferencesUranium∗ Triangular [37] 58 409 219 $/kgU [14–18, 21, 35–37, 40–44]Conversion Uniform [12] 6 33 14 $/kgU [14–18, 21, 35–37, 40–44]Enrichment Uniform [12] 262 411 481 $/SWU [14–18, 21, 35–37, 40–44]PWR fuel fabrication Triangular [37] 281 422 346 $/kgHM [14–18, 21, 35–37, 40–44]PHWR fuel fabrication Triangular [37] 60 186 152 $/kgHM [17–21, 35, 36, 43]UO2-pyroprocess Triangular [37] 882 4,819 3,064 $/kgHM [14–16, 18–20, 35, 36]SFR-pyroprocess Triangular [37] 1,392 5,692 3,786 $/kgHM [14–16, 18–20, 35, 36]SFR fuel fabrication Triangular [37] 2,297 8,680 4,939 $/kgHM [14–16, 18–20, 35–37, 40, 42]PWR IS&T Triangular [37] 133 925 480 $/kgHM [14–21, 35–37, 40–43]PHWR IS&T Triangular [37] 64 701 393 $/kgHM [17–21]Pyroprocess HLW (storage)∗ Triangular [37] 124,561 231,612 199,692 $/m3 [15, 16, 19, 20]LILW-SL disposal∗ Triangular [37] 3,465 4,170 3,818 $/m3 [15, 16, 37, 40]LILW-LL disposal∗ Triangular [37] 9,240 11,121 9,867 $/m3 [15, 16, 37, 40]PWR final disposal∗ Triangular [37] 521 2,245 1,107 $/kgHM [14, 17–21, 37, 40–43]PHWR final disposal∗ Triangular [37] 106 699 519 $/kgHM [17–21]Pyroprocess disposal∗ Triangular [37] 17,361 493,893 296,539 $/kgHM [14, 15, 18–20, 37, 40, 41, 43]PWR overnight∗ Triangular [37] 1,919 7,018 4,746 $/kWe [17, 18, 37, 43]PHWR overnight∗ Triangular [37] 1,903 3,268 2,587 $/kWe [37]SFR overnight∗ Triangular [37] 2,331 9,199 6,115 $/kWe [17, 18, 40, 43]IS&T: interim storage and transportation; HLW: high-level waste; LILW-SL: low intermediate level waste-short-lived; LILW-LL: low intermediate level waste-long-lived; Min: minimum; Max: maximum; kgU: kilogram uranium; SWU: separative work unit; KgHM: kilogram heavy metal; m3: cubic meter; USD: USdollar. ∗Values are adopted from different sources, normalized to 2016 USD, statistically analyzed, and presented in this table.
It is intended in this study to consider the variabilitiesand uncertainties of unit cost data as much as possible byexpanding the references of unit cost data and using a statis-tical manipulation. As a result, various domestic and overseasunit cost data available from reliable information resourcessuch as official reports of competent international organiza-tions and selected scientific papers published in internationaljournals were collected as shown in Table 8 [14–21, 35–37, 40–44]. All the unit cost data were normalized to the 2016 USdollar values.
In this study, first unit cost data is collected from differentstudies and statistically analyzed, and then individual processcosts (as shown in Table 8) were calculated by using theresult of analysis as an input to (i) to (vii) from Table 12.The individual process costs were derived again by probabilis-tic calculation using a commercially available risk analysissoftware program called Crystal Ball� utilizing Monte Carlosimulation, which randomly selects values for each inputto the model from a distribution specified by the user. Thecalculation was done by use of (i) to (vii) from Table 12 afterdefining the parameters of probability distribution for theindividual process costs of different nuclear fuel cycles. Theother costs except for the individual process costs in Table 8were derived from statistical analysis of reference unit costs.In accordance with the above methodology, the statistics ofcosts were calculated as shown in Table 9.
Precision of the cost values can be analyzed by using thedata of coefficient of variability (CV) given in Table 9, whichcompares the variability of cost values relative to the mean
or in other words precision of cost values. It is reportedlyknown that a parameter having a higher value of CV (i.e.,dispersion around themean is higher) is considered to be lessprecise. The values derived from Crystal Ball simulation canbe said to be acceptable, since all values of CV in Table 9 rangefrom 0 to 1 which are typically known to be precise enough[45].
Three types of probability distributions, uniform, trian-gular, and normal distributions, which are typically used forcases where limited amount of sample data is available, asshown in Table 8, were used for each cost element in orderto quantify the uncertainties in estimation of the costs. Theprobability distribution of each cost in Table 8 was adoptedfrom studies on economic analysis of nuclear fuel cycle [12,37].
3.4.2. Calculation of Fuel Cycle Costs. Figure 6 shows theresults of probabilistic calculation of the fuel cycle costs(FCCs) for selected fuel cycle options. With the assumptionof probability distribution for each process cost element asstated in Table 8, a series of Monte Carlo simulations usingCrystal Ball software were carried out for 50,000 samplesto address the inherent uncertainties of the estimated cost.As a result of the simulation, the mean values of FCCs forPWR (direct disposal), PHWR (direct disposal), Pyro-SFR-1 (CR = 0.46), and Pyro-SFR-2 (CR = 0.6) were calculatedbasically by using (viii) to (xiv) fromTable 12 to be 8.174mills/kWh, 22.114mills/kWh, 6.065mills/kWh, and 11.310mills/kWh, respectively.

Science and Technology of Nuclear Installations 11
Table 9: Descriptive statistics of process cost and reactor cost using 50,000 random samples with Monte Carlo method.
Category Minimum Maximum Mean Median SD CVUranium 58.16 407.27 228.89 226.88 71.46 0.31Conversion 6.20 33.59 19.92 19.97 7.91 0.40Enrichment 406.21 576.50 487.52 486.34 31.08 0.06PWR fuel fabrication 284.63 425.83 352.40 351.10 29.04 0.08PHWR fuel fabrication 63.77 188.97 134.76 137.84 26.48 0.20UO2-pyroprocess 990.05 5,147.95 3,063.97 3,062.27 809.89 0.26SFR-pyroprocess 1,514.36 5,963.69 3,765.25 3,774.47 879.01 0.23SFR fuel fabrication 2,322.11 8,682.88 5,311.27 5,225.73 1,315.30 0.25PWR IS&T 135.35 923.51 513.05 505.19 161.88 0.32PHWR IS&T 65.51 699.21 385.24 386.78 130.25 0.34Pyroprocess HLW (storage) 124,855.22 231,538.87 185,416.02 188,057.06 22,407.71 0.12LILW-SL disposal 3,467.53 4,166.87 3,817.85 3,817.21 144.40 0.04LILW-LL disposal 9,246.08 11,119.19 10,074.75 10,033.59 391.76 0.04PWR final disposal 523.49 2,244.14 1,292.74 1,254.76 359.15 0.28PHWR final disposal 296.62 698.04 503.64 507.00 83.10 0.16Pyroprocess disposal 17,870.38 492,381.02 269,486.28 274,929.70 97,445.86 0.36PWR overnight 1,907.61 7,027.80 4,758.43 4,869.87 1,067.17 0.22PHWR overnight 105.46 1,896.52 1,197.88 1,258.74 393.91 0.33SFR overnight 2,321.49 9,196.44 6,107.57 6,254.42 1,438.34 0.24SD: standard deviation; CV: coefficient of variability. ∗All units are the same as in Table 8 for each item.
2.70 8.70 14.70 20.70 26.70Fuel cycle cost (mills/kWh)
PWRPHWR
Statistics PWR PHWR Pyro-SFR 1 (0.46) Pyro-SFR 2 (0.6)Minimum 5.577 11.118 3.206 5.979Maximum 11.467 32.287 9.297 17.338Mean 8.174 22.114 6.065 11.310Median 8.280 22.086 6.079 11.337SD 1.067 2.973 0.875 1.631CV 0.129 0.135 0.144 0.144
SD: standard deviation; CV: coefficient of variability.
Pyro-SFR 1 (0.46)Pyro-SFR 2 (0.6)
0.00
0.04
0.08
0.12
0.16
0.20
Prob
abili
ty d
istrib
utio
n
Figure 6: Probabilistic distribution of fuel cycle cost (FCC).
As shown in the statistics of Figure 6, the FCC for Pyro-SFR-1 (CR = 0.46) is found to be the most economical fuelcycle option followed by PWR (direct disposal), Pyro-SFR-2(CR = 0.6), and PHWR (direct disposal). Difference betweenthe FCCs of Pyro-SFR-1 and Pyro-SFR-2 mainly comes fromthe difference of the values of CR and burnups of SFRsbetween the two fuel cycles as shown in Table 3. As higherburnup generates more energy per unit mass of fuel; themassof fuel required for SFR-2 is more than (almost double) thatfor SFR-1. Accordingly, the FCC in $/kWh for Pyro-SFR-1turns out to be almost half that for Pyro-SFR-2 due to lowerCR and higher burnup [13, 35, 46]. As can be seen from Fig-ure 6, the FCC distribution of PHWR is wider than other fuel
cycles and the distribution of Pyro-SFR-1 is narrower thanothers. It is noted that the peakedness and flatness of a distri-bution for PWR and Pyro-SFR-1 fuel cycles which resulted inFigure 6 are comparable with previous studies reported [14].
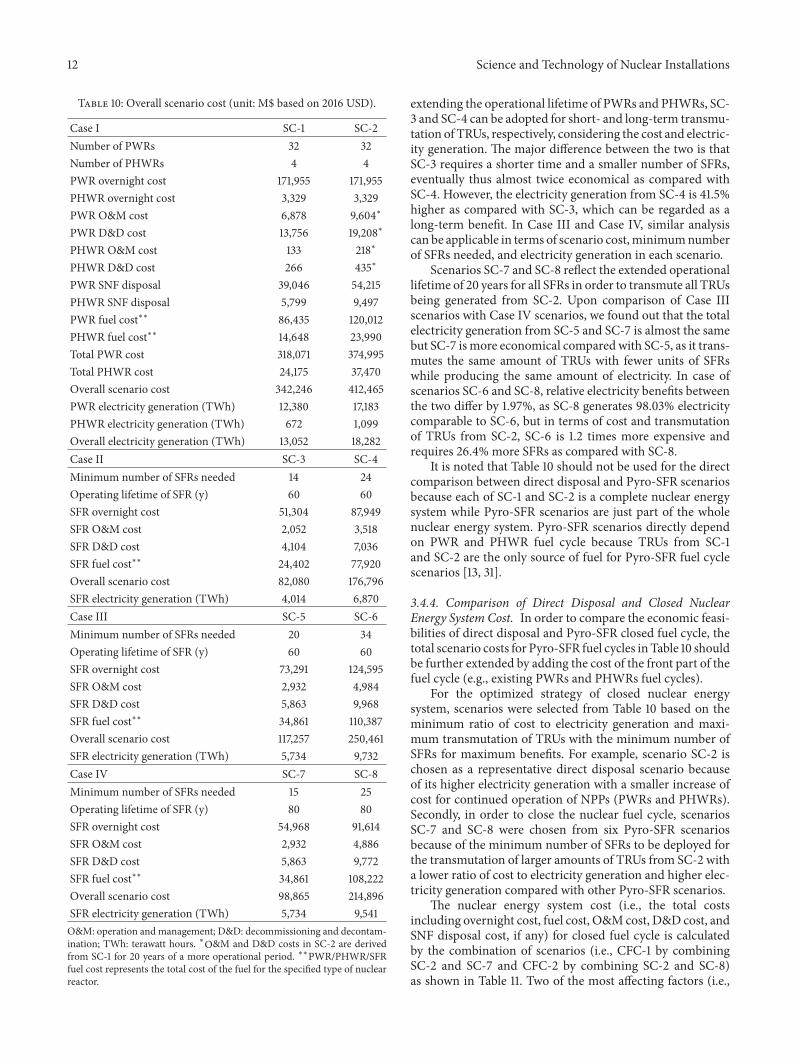
3.4.3. Calculation of Scenario Cost. Thenext step in economicanalysis is to estimate the scenario-based cost. As discussedin Tables 2 and 7, four cases each consisting of two scenariosare analyzed and presented in Table 10, where the overallscenario cost including overnight cost, fuel cost, operationand management (O&M) cost, and decommissioning anddecontamination (D&D) cost for each scenario was calcu-lated by considering the mean value from Table 9. Table 10shows the breakdown of all the cost elements for two directdisposal and six Pyro-SFR based fuel cycle scenarios. It isnoted that the O&M cost and D&D cost are assumed to becalculated as 4% and 8% of overnight cost of reactors in eachscenario in accordance with OECD/NEA studies [37]. In caseof scenarios SC-1 and SC-2, the most affecting cost elementsare PWRovernight cost followed by PWR fuel, PWRSNFdis-posal, PWRD&D, PHWR fuel cost, and others.The potentialof continued operation of NPPs (PWRs and PHWRs) in sce-nario SC-2 up to an additional twenty years increases the totalcost by 20.51%. However, the benefit of additional electricitygeneration to be obtained from continued operation of NPPs(PWRs and PHWRs) increases by 40%.
As far as Pyro-SFR scenarios are concerned, overnightcost followed by the fuel cost of SFRs in each scenariocontributes most in the overall Pyro-SFR energy systems.From scenarios SC-3 to SC-8, it is noted that each scenariohas advantages and disadvantages in terms of cost, electricitygeneration, and the minimum number of SFRs needed. Forexample, if it is decided to transmute all TRUs without
12 Science and Technology of Nuclear Installations
Table 10: Overall scenario cost (unit: M$ based on 2016 USD).
Case I SC-1 SC-2Number of PWRs 32 32Number of PHWRs 4 4PWR overnight cost 171,955 171,955PHWR overnight cost 3,329 3,329PWR O&M cost 6,878 9,604∗
PWR D&D cost 13,756 19,208∗
PHWR O&M cost 133 218∗
PHWR D&D cost 266 435∗
PWR SNF disposal 39,046 54,215PHWR SNF disposal 5,799 9,497PWR fuel cost∗∗ 86,435 120,012PHWR fuel cost∗∗ 14,648 23,990Total PWR cost 318,071 374,995Total PHWR cost 24,175 37,470Overall scenario cost 342,246 412,465PWR electricity generation (TWh) 12,380 17,183PHWR electricity generation (TWh) 672 1,099Overall electricity generation (TWh) 13,052 18,282Case II SC-3 SC-4Minimum number of SFRs needed 14 24Operating lifetime of SFR (y) 60 60SFR overnight cost 51,304 87,949SFR O&M cost 2,052 3,518SFR D&D cost 4,104 7,036SFR fuel cost∗∗ 24,402 77,920Overall scenario cost 82,080 176,796SFR electricity generation (TWh) 4,014 6,870Case III SC-5 SC-6Minimum number of SFRs needed 20 34Operating lifetime of SFR (y) 60 60SFR overnight cost 73,291 124,595SFR O&M cost 2,932 4,984SFR D&D cost 5,863 9,968SFR fuel cost∗∗ 34,861 110,387Overall scenario cost 117,257 250,461SFR electricity generation (TWh) 5,734 9,732Case IV SC-7 SC-8Minimum number of SFRs needed 15 25Operating lifetime of SFR (y) 80 80SFR overnight cost 54,968 91,614SFR O&M cost 2,932 4,886SFR D&D cost 5,863 9,772SFR fuel cost∗∗ 34,861 108,222Overall scenario cost 98,865 214,896SFR electricity generation (TWh) 5,734 9,541O&M: operation and management; D&D: decommissioning and decontam-ination; TWh: terawatt hours. ∗O&M and D&D costs in SC-2 are derivedfrom SC-1 for 20 years of a more operational period. ∗∗PWR/PHWR/SFRfuel cost represents the total cost of the fuel for the specified type of nuclearreactor.
extending the operational lifetime of PWRs and PHWRs, SC-3 and SC-4 can be adopted for short- and long-term transmu-tation of TRUs, respectively, considering the cost and electric-ity generation. The major difference between the two is thatSC-3 requires a shorter time and a smaller number of SFRs,eventually thus almost twice economical as compared withSC-4. However, the electricity generation from SC-4 is 41.5%higher as compared with SC-3, which can be regarded as along-term benefit. In Case III and Case IV, similar analysiscan be applicable in terms of scenario cost,minimumnumberof SFRs needed, and electricity generation in each scenario.
Scenarios SC-7 and SC-8 reflect the extended operationallifetime of 20 years for all SFRs in order to transmute all TRUsbeing generated from SC-2. Upon comparison of Case IIIscenarios with Case IV scenarios, we found out that the totalelectricity generation from SC-5 and SC-7 is almost the samebut SC-7 is more economical compared with SC-5, as it trans-mutes the same amount of TRUs with fewer units of SFRswhile producing the same amount of electricity. In case ofscenarios SC-6 and SC-8, relative electricity benefits betweenthe two differ by 1.97%, as SC-8 generates 98.03% electricitycomparable to SC-6, but in terms of cost and transmutationof TRUs from SC-2, SC-6 is 1.2 times more expensive andrequires 26.4% more SFRs as compared with SC-8.
It is noted that Table 10 should not be used for the directcomparison between direct disposal and Pyro-SFR scenariosbecause each of SC-1 and SC-2 is a complete nuclear energysystem while Pyro-SFR scenarios are just part of the wholenuclear energy system. Pyro-SFR scenarios directly dependon PWR and PHWR fuel cycle because TRUs from SC-1and SC-2 are the only source of fuel for Pyro-SFR fuel cyclescenarios [13, 31].
3.4.4. Comparison of Direct Disposal and Closed NuclearEnergy System Cost. In order to compare the economic feasi-bilities of direct disposal and Pyro-SFR closed fuel cycle, thetotal scenario costs for Pyro-SFR fuel cycles in Table 10 shouldbe further extended by adding the cost of the front part of thefuel cycle (e.g., existing PWRs and PHWRs fuel cycles).
For the optimized strategy of closed nuclear energysystem, scenarios were selected from Table 10 based on theminimum ratio of cost to electricity generation and maxi-mum transmutation of TRUs with the minimum number ofSFRs for maximum benefits. For example, scenario SC-2 ischosen as a representative direct disposal scenario becauseof its higher electricity generation with a smaller increase ofcost for continued operation of NPPs (PWRs and PHWRs).Secondly, in order to close the nuclear fuel cycle, scenariosSC-7 and SC-8 were chosen from six Pyro-SFR scenariosbecause of the minimum number of SFRs to be deployed forthe transmutation of larger amounts of TRUs from SC-2 witha lower ratio of cost to electricity generation and higher elec-tricity generation compared with other Pyro-SFR scenarios.
The nuclear energy system cost (i.e., the total costsincluding overnight cost, fuel cost, O&Mcost, D&D cost, andSNF disposal cost, if any) for closed fuel cycle is calculatedby the combination of scenarios (i.e., CFC-1 by combiningSC-2 and SC-7 and CFC-2 by combining SC-2 and SC-8)as shown in Table 11. Two of the most affecting factors (i.e.,
Science and Technology of Nuclear Installations 13
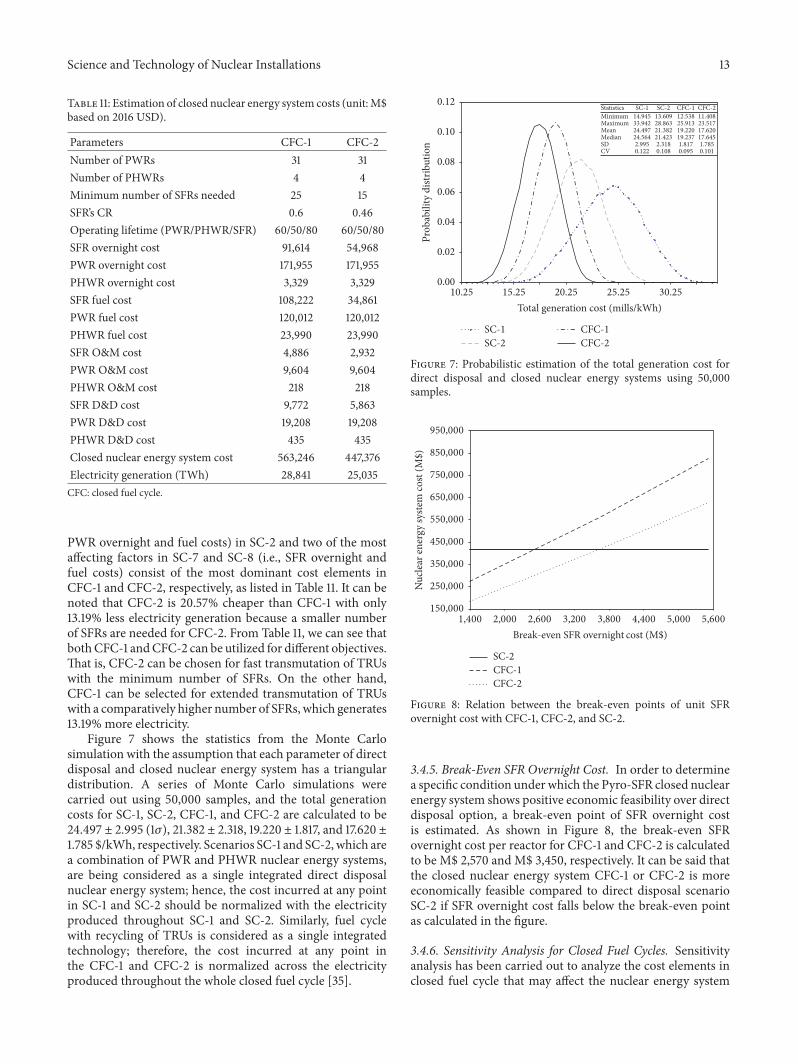
Table 11: Estimation of closed nuclear energy system costs (unit:M$based on 2016 USD).
Parameters CFC-1 CFC-2Number of PWRs 31 31Number of PHWRs 4 4Minimum number of SFRs needed 25 15SFR’s CR 0.6 0.46Operating lifetime (PWR/PHWR/SFR) 60/50/80 60/50/80SFR overnight cost 91,614 54,968PWR overnight cost 171,955 171,955PHWR overnight cost 3,329 3,329SFR fuel cost 108,222 34,861PWR fuel cost 120,012 120,012PHWR fuel cost 23,990 23,990SFR O&M cost 4,886 2,932PWR O&M cost 9,604 9,604PHWR O&M cost 218 218SFR D&D cost 9,772 5,863PWR D&D cost 19,208 19,208PHWR D&D cost 435 435Closed nuclear energy system cost 563,246 447,376Electricity generation (TWh) 28,841 25,035CFC: closed fuel cycle.
PWR overnight and fuel costs) in SC-2 and two of the mostaffecting factors in SC-7 and SC-8 (i.e., SFR overnight andfuel costs) consist of the most dominant cost elements inCFC-1 and CFC-2, respectively, as listed in Table 11. It can benoted that CFC-2 is 20.57% cheaper than CFC-1 with only13.19% less electricity generation because a smaller numberof SFRs are needed for CFC-2. From Table 11, we can see thatbothCFC-1 andCFC-2 can be utilized for different objectives.That is, CFC-2 can be chosen for fast transmutation of TRUswith the minimum number of SFRs. On the other hand,CFC-1 can be selected for extended transmutation of TRUswith a comparatively higher number of SFRs, which generates13.19% more electricity.
Figure 7 shows the statistics from the Monte Carlosimulation with the assumption that each parameter of directdisposal and closed nuclear energy system has a triangulardistribution. A series of Monte Carlo simulations werecarried out using 50,000 samples, and the total generationcosts for SC-1, SC-2, CFC-1, and CFC-2 are calculated to be24.497 ± 2.995 (1𝜎), 21.382 ± 2.318, 19.220 ± 1.817, and 17.620 ±1.785 $/kWh, respectively. Scenarios SC-1 and SC-2, which area combination of PWR and PHWR nuclear energy systems,are being considered as a single integrated direct disposalnuclear energy system; hence, the cost incurred at any pointin SC-1 and SC-2 should be normalized with the electricityproduced throughout SC-1 and SC-2. Similarly, fuel cyclewith recycling of TRUs is considered as a single integratedtechnology; therefore, the cost incurred at any point inthe CFC-1 and CFC-2 is normalized across the electricityproduced throughout the whole closed fuel cycle [35].
SC-1SC-2
CFC-1CFC-2
Statistics SC-1 SC-2 CFC-1 CFC-2Minimum 14.945 13.609 12.538 11.408Maximum 33.942 28.863 25.913 23.517Mean 24.497 21.382 19.220 17.620Median 24.564 21.423 19.237 17.645SD 2.995 2.318 1.817 1.785CV 0.122 0.108 0.095 0.101
Total generation cost (mills/kWh)30.2525.2520.2515.2510.25
0.00
0.02
0.04
0.06
0.08
0.10
0.12
Prob
abili
ty d
istrib
utio
n
Figure 7: Probabilistic estimation of the total generation cost fordirect disposal and closed nuclear energy systems using 50,000samples.
SC-2CFC-1CFC-2
150,000
250,000
350,000
450,000
550,000
650,000
750,000
850,000
950,000N
ucle
ar en
ergy
syste
mco
st(M
$)
2,000 2,600 3,200 3,800 4,400 5,000 5,6001,400Break-even SFR overnight cost (M$)
Figure 8: Relation between the break-even points of unit SFRovernight cost with CFC-1, CFC-2, and SC-2.
3.4.5. Break-Even SFR Overnight Cost. In order to determinea specific condition under which the Pyro-SFR closed nuclearenergy system shows positive economic feasibility over directdisposal option, a break-even point of SFR overnight costis estimated. As shown in Figure 8, the break-even SFRovernight cost per reactor for CFC-1 and CFC-2 is calculatedto be M$ 2,570 and M$ 3,450, respectively. It can be said thatthe closed nuclear energy system CFC-1 or CFC-2 is moreeconomically feasible compared to direct disposal scenarioSC-2 if SFR overnight cost falls below the break-even pointas calculated in the figure.
3.4.6. Sensitivity Analysis for Closed Fuel Cycles. Sensitivityanalysis has been carried out to analyze the cost elements inclosed fuel cycle that may affect the nuclear energy system

14 Science and Technology of Nuclear Installations
Table12:M
odified
seto
fequ
ations
toestim
atethe
costof
nucle
arfuelcycle
basedon
equilib
rium
mod
el.
Category
Equatio
ns
Individu
alprocessc
ost
Costfor
conversio
n($/kgU
)(𝐶 (C
ON))
𝐶 (CON)=(𝑈 C(
CON)⋅𝐴(C
ON))
(i)Costfor
enric
hment($/SW
U)(𝐶 (E
NR))
𝐶 (ENR)=(𝑈 C(
SWU)⋅𝐴(N))+(𝑈 D(LI-SL)⋅𝐴
D(LI-SL))
(ii)
Costfor
PWRfuelfabrication($/kgH
M)(𝐶 (P
WRF
AB))
𝐶 (PWRF
AB)=(𝑈 C(
PWRF
AB)⋅𝐴(FAB))+(𝑈 D(LI-SL)⋅𝐴
D(LI-SL))
(iii)
Costfor
PHWRfuelfabrication($/kgH
M)(𝐶 (P
HWRF
AB))
𝐶 (PHWRF
AB)=(𝑈 C(
PHWRF
AB)⋅𝐴(FAB))+(𝑈 D(LI-SL)⋅𝐴
D(LI-SL))
(iv)
Costfor
pyroprocessin
g($/kgH
M)(𝐶 (P
YRO))
𝐶 (PYR
O)=(𝑈 C(
PYRO)⋅𝐴(REC))+(𝑈 D(LI-LL)⋅𝐴
D(LI-LL))+(𝑈 D(H
LW)⋅𝐴
D(H
LW))
(v)
Costfor
SFRfuelfabrication($/kgH
M)(𝐶 (S
FRFA
B))
𝐶 (SFR
FAB)= (𝑈 C(
SFRF
AB)⋅𝐴(FAB))+(𝐶 D(LI-LL)⋅𝐴
D(LI-LL))
(vi)
Costfor
storage
andtransport($/kgHM)(𝐶 (S
TR))
𝐶 (STR)= (𝑈 C(
S)⋅𝐴(S))+(𝑈 C(TR)⋅𝐴(TR))
(vii)
Totalprocesscost
Totalcostfor
PWRprocess($/kgHM)(𝐶 (P
WR)P)
𝐶 (PWR)P=𝐶(C
ON)+𝐶(ENR)+𝐶(PWRF
AB)+𝐶(STR)+𝐶
D(SNF)∗
(viii)
Totalcostfor
PHWRprocess($/kgHM)(𝐶 (P
HWR)P)
𝐶 (PHWR)P=𝐶(C
ON)+𝐶(PHWRF
AB)+𝐶(STR)+𝐶
D(SNF)∗
(ix)
Totalcostfor
Pyro-SFR
process($/kgHM)(𝐶 (P
yro-SF
R)P)
𝐶 (Pyro-SF
R)P=𝐶(PYR
O)+𝐶(SFR
FAB)+𝐶(STR)
(x)
Fuelcycle
cost
PWRfuelcycle
cost($/kWh),(𝐶 F(
PWR))
𝐶 F(PW
R)=
𝐶 (PWR)P
(0.32 (M
We/M
Wt ))⋅(45(M
Wd/k
gHM))⋅(24
,000(kW
h/MWd ))
(xi)
PHWRfuelcycle
cost($/kWh)
(𝐶 F(PHWR))
𝐶 F(PH
WR)=
𝐶 (PHWR)P
(0.32 (M
We/M
Wt ))⋅(7.5(
MWd/k
gHM))⋅(24
,000(kW
h/MWd ))
(xii)
Pyro-SFR
fuelcycle
cost($/kWh),C
R=0.46
(𝐶 F(PYR
O-SFR),CR=0.46)𝐶 F(
PYRO
-SFR),CR=0.46=
𝐶 (Pyro-SF
R)P
(0.394(M
We/M
Wt ))⋅(217(M
Wd/k
gHM))⋅(24
,000(kW
h/MWd ))
(xiii)
Pyro-SFR
fuelcycle
cost($/kWh),C
R=0.6(𝐶 F(PYR
O-SFR),CR=0.6)𝐶 F(
PYRO
-SFR),CR=0.6=
𝐶 (Pyro-SF
R)P
(0.394(M
We/M
Wt ))⋅(116.3(M
Wd/k
gHM))⋅(24
,000(kW
h/MWd ))
(xiv)
∗𝐶D(SNF):costo
fdisp
osingof
spentn
uclear
fuelfro
mNPP
s(PW
RsandPH
WRs)=(𝐴
D(SNF)⋅𝑈D(SNF));𝑈C(
CON):un
itcostof
conversio
n;𝑈C(
SWU):un
itcostof
enric
hment;𝑈C(
PWRF
AB):u
nitcosto
fPWRfuel
fabrication;𝑈C(
PHWRF
AB):u
nitcosto
fPHWRfuelfabrication;𝑈C(
PYRO):un
itcostof
pyroprocessin
g;𝑈C(
SFRF
AB):u
nitcostfor
SFRfuelfabrication;𝑈C(
S):u
nitcosto
fstorage;𝑈
C(TR):un
itcostof
transportatio
n;𝑈D(LI-SL):un
itcostof
disposingof
lowinterm
ediate-sho
rt-livedwaste;𝑈
D(LI-LL):un
itcostof
disposingof
lowinterm
ediate-lo
ng-livedwaste;𝑈
D(H
LW):un
itcostof
disposingof
high
-levelw
aste;𝑈
D(SNF):unitcost
ofdisposingof
spentn
uclear
fuel;𝐴(C
ON):am
ount
ofuranium
tobe
converted;𝐴(N):am
ount
fore
nrichm
ent;𝐴(FAB):amou
ntof
fuelto
befabricated;𝐴(REC):am
ount
offuelto
berecycle
d;𝐴(S):am
ount
offuel
tobe
stored;𝐴(TR):amou
ntof
fuelto
betransported;𝐴
D(LI-SL):am
ount
ofdisposingof
lowinterm
ediate-sho
rt-livedwaste;𝐴
D(LI-LL):am
ount
ofdisposingof
lowinterm
ediate-lo
ng-livedwaste;𝐴
D(H
LW):am
ount
ofdisposingof
high
-levelw
aste;𝐴
D(SNF):amou
ntof
disposingof
spentn
uclear
fuel;𝐶(PWR)P:totalcosto
fPWRfuelcycle
;𝐶(PHWR)P:totalcosto
fPHWRfuelcycle
;𝐶(Pyro-SF
R)P:totalcosto
fPyro-SFRfuelcycle
;𝐶F(PW
R):fuelcyclecostof
PWRfuelcycle
;𝐶F(PH
WR):fuelcyclecostof
PHWRfuelcycle
;𝐶F(Py
ro-SFR)CR=0.46:fuelcyclecostof
Pyro-SFR
CR=0.46fuelcycle
;𝐶F(Py
ro-SFR)CR=0.6:fuelcyclecostof
Pyro-SFR
CR=0.6fuel
cycle
.

Science and Technology of Nuclear Installations 15
0.720
0.402
0.400
0.321
0.080
0.071
0.026
0.025
0.016
0.003
0.002
0.002
PWR overnight
SFR overnight
SFR fuel
PWR fuel
PHWR fuel
PWR D&D
PWR O&M
SFR D&D
SFR O&M
PHWR overnight
PHWR O&M
PHWR D&D
0.200 0.400 0.600 0.800 1.0000.000Correlation coefficient(a)
0.846
0.364
0.266
0.152
0.099
0.088
0.047
0.019
0.016
0.012
0.004
PWR overnight
PWR fuel
SFR overnight
SFR fuel
PHWR fuel
PWR D&D
PWR O&M
PHWR overnight
SFR D&D
SFR O&M
PHWR D&D
PHWR O&M
0.200 0.400 0.600 0.800 1.0000.000Correlation coefficient(b)
Figure 9: Sensitivity of cost elements in closed fuel cycle nuclear energy systems: (a) CFC-1 and (b) CFC-2.
cost by using Crystal Ball software. Crystal Ball computesthe sensitivity by computing rank correlation coefficients.Correlation coefficients measure the strength of the linearrelationship among the parameters in CFC-1 and CFC-2. Aparameter having a higher correlation coefficient value affectsmore the total cost of closed nuclear energy system.
Figure 9 shows that the fivemost affecting factors in CFC-1 and CFC-2 are the PWR overnight cost, SFR overnightcost, SFR fuel cost, PWR fuel cost, and PHWR fuel cost.As mentioned, it is noted that, even though sensitivity fordirect disposal energy system is not conducted, the relativesensitivity of cost elements in SC-1 and SC-2 can be calculatedby taking into account the cost parameters related to PWRand PHWRs only from Figure 9.
4. Conclusion
The total inventory of SNF to be produced from all thirty-six units of NPPs that are in operation or will be deployed by2029 is estimated to be 41,718MTU, in accordance with thenational policy of the Korean government in 2016. It is alsofound that the continued operation of NPPs may increase thenational inventory of SNF by 47% (i.e., up to 61,232MTHM).In this study, it is reconfirmed that the nominal radiotoxicityindex of the long-lived TRUs in the SNF will decrease downto the level of natural uranium at least after 200,000 years ofradioactive decay as reportedly known.
Based on a series of reasonable assumptions derived frompast experience of nuclear power development in Korea andthe government’s future plan, the minimum number of SFRsrequired to transmute all TRUs is calculated to be 14 to 34,and the full transmutation of TRUs is expected to be com-pleted in 2109 to 2153. The key technical elements deter-mining the optimized strategy for SFR deployment are the
design features of SFR (e.g., conversion ratio, burnup), thedeployment rate of SFRs, and the target year for completionof transmutation of TRUs.
A systematic stepwise procedure to conduct the proba-bilistic economic analysis of nuclear energy system is pro-posed in this study (see Figure 2). From balanced comparisonof the whole cost and all benefits from direct disposal andPyro-SFR recycling options, the total generation costs fordirect disposal and Pyro-SFR nuclear energy systems areestimated to be 13.60∼33.94mills/kWh and 11.40∼25.91mills/kWh, respectively. It is concluded that the relative feasibilityof each scenario can be assessed based upon the three factors:lower ratio of cost to electricity generation, transmutationof more TRUs with minimum units of SFRs, and highergeneration of electricity in order to formulate the optimumclosed nuclear energy system.
As a result of the sensitivity analysis, the most affectingparameters to the nuclear energy system costs of the closedfuel cycle are as follows in order of contribution: PWRovernight cost, PWR fuel cost, SFR overnight cost, and SFRfuel cost. Since the overnight cost and the fuel cost for PWRare almost invariable in the commercialized nuclear energysystem in Korea, however, the overnight cost of the SFR stillunder development will be the most uncertain cost elementto the economics of the closed nuclear energy system. It isalso pointed out that the economic feasibility of the closednuclear energy system is higher than the direct disposaloption as long as the SFR overnight cost per reactor can bekept belowM$ 2,570 orM$ 3,450 (i.e., the break-even reactorcost) depending upon the design features of the SFR such asconversion ratio.
It is expected that the results of this study on thequantitative and economic feasibilities of direct disposal andPyro-SFR fuel cycle options can be used as a comprehensive
16 Science and Technology of Nuclear Installations
reference for the systematic decision-making on the directionof the future nuclear energy system in Korea, which isplanned to be made around 2020.
Conflicts of Interest
All authors declare no conflicts of interest regarding thepublication of this paper.
Acknowledgments
This work was supported by “Human Resources Program inEnergy Technology” of the Korea Institute of Energy Tech-nology Evaluation and Planning (KETEP), granted financialresource from the Ministry of Trade, Industry & Energy,Republic of Korea (no. 20164030200990).
References
[1] Korea Institute of Nuclear Safety (KINS), Review Report on theQuarterly Reports form Nuclear Business Operators RegardingRadiation Safety for the First Quarter of 2016, KINS, 2016.
[2] Ministry of Trade and Industry and Energy (MOTIE), “The 7thBasic Plan on Electricity Demand and Supply,” Notice No. 2015-403, MOTIE, 2015.
[3] Ministry of Trade and Industry and Energy (MOTIE), “BasicPlan for High Level Radioactive Waste Management,” MOTIE,2016.
[4] Ministry of Science and ICT and Future Planning (MSIP),Strategy for Technical Development and Demonstration of FutureNuclear Energy System, MSIP, 2016.
[5] The government of the Republic of Korea and C. Pinel, “KoreanFifth National Report under the Joint Convention on the Safetyof Spent Fuel Management and on the Safety of RadioactiveWaste Management,” 2014.
[6] J. Kang, “Alternatives for additional spent fuel storage in SouthKorea,” Science & Global Security, vol. 10, no. 3, 2002.
[7] J. Park, “Status of the korean high-level radioactive waste man-agement program,” in in proceedings of ANS Conference Inter-national High-level Radioactive Waste Management (IHLRWM2017), Charlotte, NC, USA, April 9-13, 2017.
[8] Y. I. Kim, S. G. Hong, and D. Hahn, “SFR deployment strategyfor the re-use of spent fuel in Korea,” Nuclear Engineering andTechnology, vol. 40, no. 6, pp. 517–526, 2008.
[9] J. Kang, “The ROK’s nuclear energy development and spentfuel management plans,” NAPSNet Special Reports, June 17,2014, https://nautilus.org/napsnet/napsnet-special-reports/the-roks-nuclear-energy-development-and-spent-fuel-management-plans/.
[10] C. Braun and R. Forrest, “Considerations regarding ROK spentnuclear fuel management options,” Nuclear Engineering andTechnology, vol. 45, no. 4, pp. 427–438, 2013.
[11] B. H. Park, F. Gao, E.-H. Kwon, and W. I. Ko, “Comparativestudy of different nuclear fuel cycle options: Quantitativeanalysis onmaterial flow,” Energy Policy, vol. 39, no. 11, pp. 6916–6924, 2011.
[12] S. K. Kim,W. I. Ko, S. R. Youn, andR. X.Gao, “Nuclear fuel cyclecost estimation and sensitivity analysis of unit costs on the basisof an equilibrium model,” Nuclear Engineering and Technology,vol. 47, no. 3, pp. 306–314, 2015.
[13] F. Gao and W. I. Ko, “Dynamic analysis of a pyroprocessingcoupled SFR fuel recycling,” Science and Technology of NuclearInstallations, vol. 2012, Article ID 390758, pp. 1–10, 2012.
[14] W. I. Ko and F. Gao, “Economic analysis of different nuclear fuelcycle options,” Science and Technology of Nuclear Installations,vol. 2012, Article ID 293467, pp. 1–10, 2012.
[15] S. K. Kim, W. I. Ko, and Y. H. Lee, “Economic viability ofmetallic sodium-cooled fast reactor fuel in Korea,” Science andTechnology of Nuclear Installations, vol. 2013, Article ID 412349,pp. 1–10, 2013.
[16] S. K. Kim, W. I. Ko, and Y. H. Lee, “Economic assessment ofalternative Pyro-SFR nuclear fuel cycle in Korea,” Progress inNuclear Energy, vol. 66, pp. 124–132, 2013.
[17] R. Gao, S. Choi, W. Il Ko, and S. Kim, “Economic potential offuel recycling options: A lifecycle cost analysis of future nuclearsystem transition in China,” Energy Policy, vol. 101, pp. 526–536,2017.
[18] S. Choi, H. J. Lee, and W. I. Ko, “Dynamic analysis of once-through and closed fuel cycle economics using Monte Carlosimulation,” Nuclear Engineering and Design, vol. 277, pp. 234–247, 2014.
[19] Ministry of Knowledge Economy (MKE), Cost estimation ofinterim storage for spent fuels, Ministry of Knowledge Economyof Republic of Korea, Seoul, Korea, 2012.
[20] Ministry ofKnowledgeEconomy (MKE),Ministry of KnowledgeEconomy Cost Estimation of Final Disposal for Spent Fuels,Ministry of Knowledge Economy of Republic of Korea, Seoul,Korea, 2012.
[21] C. S. Rim, “Korean nuclear fuel program,” Journal of NuclearScience and Technology, vol. 35, no. 7, pp. 467–472, 1998.
[22] F. Fiori and Z. Zhou, “Sustainability of the Chinese nuclearexpansion: The role of ADS to close the nuclear fuel cycle,”Progress in Nuclear Energy, vol. 83, pp. 123–134, 2015.
[23] P. Villalibre, E. Haas, H. Khartabil, S. Kim, A. Korinny, V.Usanov et al., “Technical Progress in INPRO activities onModelling and Innovation,” in INPRO Group Department ofNuclear Energy, International Atomic Energy Agency (IAEA),Vienna, Austria.
[24] F. Fiori and Z. Zhou, “Sustainability of the Chinese nuclearexpansion:Natural uranium resources availability, Pu cycle, fuelutilization efficiency and spent fuel management,” Annals ofNuclear Energy, vol. 83, pp. 246–257, 2015.
[25] IAEA, “Nuclear Fuel Cycle Simulation System (VISTA),” inIAEA TECDOC-1535, Vienna, Austria, February 2007.
[26] IAEA, Nuclear Fuel Cycle Simulation System (NFCSS) usermanual, IAEA, Vienna, Austria, December 2011.
[27] Nuclear Power in South Korea, “World Nuclear Association,”last updated February 2017, http://www.world-nuclear.org/information-library/country-profiles/countries-o-s/south-korea.aspx.
[28] Y. Arafat et al., “Radiotoxicity characterization of hlw fromreprocessing of Uranium-based and Thorium- based fuel,” inWM2011 Conference, Phoenix, Arizona, February 27 - March 3,2011.
[29] TheKoreanAcademy of Science andTechnology, “Managementof high level nuclear wastes,” Research Reports Series No. 54,2009.
[30] International Commission on Radiological Protection, “Com-pendium of dose coefficients based on ICRP publication 60,ICRP publication no. 119,” Annals of ICRP, vol. 41, no. S1, 2012.
Science and Technology of Nuclear Installations 17
[31] C. Jeong andH. Choi, “Dynamicmodeling and analysis of alter-native fuel cycle scenarios in Korea,” Nuclear Engineering andTechnology, vol. 39, no. 1, pp. 85–94, 2007.
[32] Y. K. Lee and M. H. Kim, “Recycling option search for a 600-MWe sodium-cooled transmutation fast reactor,”Nuclear Engi-neering and Technology, vol. 47, no. 1, pp. 47–58, 2015.
[33] S. G. Hong, S. J. Kim, Y. I. Kim, and D. Hahn, “600 MWeSodium cooled fast reactor core designs for efficient TRU trans-mutation,” in in Proceedings of the The Korean Nuclear SocietySpring Meeting, pp. 26-27, Republic of Korea, May 2006.
[34] Korea Atomic Energy Research Institute (KAERI), “Develop-ment of Sodium Cooled Fast Reactor Core Concept for Max-imizing TRU Burning Rate,” KAERI/CN-2209/2015, Daejeon,Korea, 2015.
[35] G. De Roo and J. E. Parsons, “Amethodology for calculating thelevelized cost of electricity in nuclear power systems with fuelrecycling,” Energy Economics, vol. 33, no. 5, pp. 826–839, 2011.
[36] M. Bunn, B. van der, J. P. Zwaan, and S. Fetter, “The economicsof reprocessing vs. direct disposal of spent nuclear fuel,” Tech.Rep. DE-FG-26-99FT4028, 2003.
[37] OECD/NEA, “Advance nuclear fuel cycle and radioactive wastemanagement,” Tech. Rep. 5990.OECD, Nuclear Energy Agency(NEA), Paris, France, 2006.
[38] Los Alamos National Laboratory (LANL), “Production andMeasurement of Minor Actinides in the Commercial FuelCycle,” Tech. Rep., 1997, LA-13248-MS/UC-700/1997.
[39] WISE Uranium Project, “Uranium toxicity,” 2017, http://www.wise-uranium.org/utox.html.
[40] OECD/NEA, The economics of the back end of the nuclear fuelcycle, OECD, Nuclear Energy Agency (NEA), Vienna, Austria,2013.
[41] Smith School of Enterprise and the Environment (SSEE), A lowcarbon nuclear future: Economic assessment of nuclear materialsand spent nuclear fuel management in the UK, Oxford, UnitedKingdom, March 2011.
[42] D. Shropshire, K. A.Williams,W. B. Boore et al., “Advanced fuelcycle cost basis,” Tech. Rep. INL/EXT-07-12107, Idaho NationalLaboratory (INL), 2007.
[43] D. Shropshire, E. A. Hoffman, J. D. Smith et al., “Advanced FuelCycle Economic Analysis of Symbiotic Light-Water Reactor andFast Burner Reactor Systems,” Idaho National Laboratory (INL),no. INL/EXT-09-15254, 2009.
[44] G. Francesco and B. Dixon, “Nuclear energy system cost mod-eling actinide and fission product partitioning and transmuta-tion,” in Proceedings of the 12th Information Exchange MeetingonActinide and Fission Product Partitioning and Transmutation,Idaho National Laboratory (INL), September 2012.
[45] G. E. Evans and B. Jones, “The application of Monte Carlosimulation in finance, economics and operations management,”in Proceedings of the 2009 WRI World Congress on ComputerScience and Information Engineering, CSIE 2009, pp. 379–383,usa, April 2009.
[46] E. Parent,Nuclear fuel cycles formid-century deployment,Massa-chusetts Institute of Technology, September 2003.

TribologyAdvances in
Hindawi Publishing Corporationhttp://www.hindawi.com Volume 2014
FuelsJournal of
Hindawi Publishing Corporationhttp://www.hindawi.com Volume 2014
Journal ofPetroleum Engineering
Hindawi Publishing Corporationhttp://www.hindawi.com Volume 2014
Industrial EngineeringJournal of
Hindawi Publishing Corporationhttp://www.hindawi.com Volume 2014
Power ElectronicsHindawi Publishing Corporationhttp://www.hindawi.com Volume 2014
Advances in
CombustionJournal of
Hindawi Publishing Corporationhttp://www.hindawi.com Volume 2014
Journal of
Hindawi Publishing Corporationhttp://www.hindawi.com Volume 2014
Renewable Energy
Submit your manuscripts athttps://www.hindawi.com
Hindawi Publishing Corporationhttp://www.hindawi.com Volume 2014
StructuresJournal of
International Journal of
RotatingMachinery
Hindawi Publishing Corporationhttp://www.hindawi.com Volume 2014
EnergyJournal of
Hindawi Publishing Corporationhttp://www.hindawi.com Volume 2014
Hindawi Publishing Corporation http://www.hindawi.com
Journal of
Volume 201Hindawi Publishing Corporation http://www.hindawi.com Volume 201
International Journal ofInternational Journal of
Hindawi Publishing Corporationhttp://www.hindawi.com Volume 2014
Nuclear InstallationsScience and Technology of
Hindawi Publishing Corporationhttp://www.hindawi.com Volume 2014
Solar EnergyJournal of
Hindawi Publishing Corporationhttp://www.hindawi.com Volume 2014
Wind EnergyJournal of
Hindawi Publishing Corporationhttp://www.hindawi.com Volume 2014
Nuclear EnergyInternational Journal of
Hindawi Publishing Corporationhttp://www.hindawi.com Volume 2014
High Energy PhysicsAdvances in
The Scientific World JournalHindawi Publishing Corporation http://www.hindawi.com Volume 2014