feasibility study for a lake superior science center in ... superior science center feasibility...
TRANSCRIPT

FEASIBILITY STUDY FOR A LAKE SUPERIOR SCIENCE CENTER IN ASHLAND WI
PHASE II December 2019
This report concludes a Lake Superior Science Center in Ashland, Wisconsin is financially feasible either as a for‐profit or not‐for‐profit project. A for‐profit development would require higher‐than‐market rents and therefore significant financial benefit for the users of the
facility to justify such rents. A non‐profit development can be constructed with local market rents, but significant public benefits would need to be generated to attract non‐profit investment. The next step is to better understand the amenities the site and facility
might offer and the market demand for such amenities.
Prepared By: 422 Third Street West, Suite 101 Ashland, WI 54806 (715)682-8344
GWB Professional Services 5813 Piping Rock Rd. Madison, WI 53711 (608)444-0836 [email protected]
Prepared For:

Acknowledgements Ashland Area Development Corporation Executive Director: Betsey Harries
Committee Chair:
Vice Chair: Secretary/Treasurer:
Pat Kinney Betsey Harries Pete Mann
Committee Members:
Mike Bailey Cliff Grand Susan Hedman Mike Hoff Richard Ketring Dale Kupczyk
The Committee wishes to acknowledge the following individuals: Congressman David Obey for his leadership in securing funding for the USGS Research Vessel Kiyi and docking facilities located in Ashland, Wisconsin. The RV Kiyi is the flagship fishery research vessel on the Great Lakes. Congressman Obey’s vision included a Research Center to support research on the world’s greatest lake. Owen Gorman for his contributions over the past 20 years in support of this vision. Mr. Gorman’s role was that of a resource; to provide rationale, vision, correction, and encouragement.

Donors and Grantors
This report is funded in part by the Wisconsin Department of Administration; the Wisconsin Coastal Management Program; the National Oceanic and Atmospheric
Administration, Office for Coastal Management under the Coastal Zone Management Act: Grant # NA15NOS4190094; Wisconsin Economic Development Corporation; the Business Leaders Fund of the Duluth Superior Area Community Foundation; and the
generous contributions of the following organizations and individuals:
Apostle Islands Sport Fishermen’s Association City of Ashland, Wisconsin
Mike Bailey Bayfield Chamber of Commerce
Enbridge Energy Fiorio Wealth Advisors
Betsey Harries Susan Hedman Richard Ketring
Pat Kinney Jeffrey and Debra Lewis
Charles Madenjian Pete Mann
North Wisconsin Rod & Gun Club Technology Council Innovation Network – Lake Superior Chapter
James & Courtney Tucker Xcel Energy

Contents Executive Summary ................................................................................................................... 1
Project Overview ........................................................................................................................ 2
Vision ......................................................................................................................................... 2
Background ................................................................................................................................ 2
Site Information .......................................................................................................................... 6
Potential Organizational Models for Lake Superior Science Center...........................................10
Characteristics of Public Owners ...........................................................................................11
Characteristics of Private Owners ..........................................................................................13
Financial Characteristics of For-Profit vs Non-Profit Ownership .............................................13
Conditions that Apply to Either For-Profit or Non-Profit Owners .............................................14
Base Site Information: ........................................................................................................14
Site Development Assumptions .........................................................................................15
Proforma Cash Flow Analysis of a For-Profit Owner ..............................................................16
Site Development Costs .....................................................................................................16
Sources and Uses of Funds ...............................................................................................18
Project Cash Flow ..............................................................................................................20
Project Value .....................................................................................................................23
Proforma Cash Flow Analysis of Non-Profit Tax-Exempt Ownership .....................................24
Site Development Costs .....................................................................................................24
Sources and Uses of Funds ...............................................................................................26
Project Cash Flow ..............................................................................................................26
Project Value .....................................................................................................................30
Summary of Differences – Private vs Non-Profit Ownership ..................................................31
Economic Impact Analysis ........................................................................................................32
Lake Superior Science Center Economic Impact Analysis .....................................................35
Alternative Uses ....................................................................................................................38
Housing Economic Impact Analysis ...................................................................................38
Commercial Economic Impact Analysis .............................................................................41
Comparison of Alternative Uses ............................................................................................42
General Market Characteristics .............................................................................................43
Potential Funding Options .........................................................................................................46

Conclusion/Next Steps ..............................................................................................................50
Additional Information ............................................................................................................50
Appendix ...................................................................................................................................53
A. Amortization Tables ...................................................................................................... A-1
B. Highlights from the International Joint Commission’s Visit to Northland College ........... B-1
C. Phase I Feasibility Study ................................................................................................. C-1

Executive Summary This report is the second phase of a multi-phase feasibility study for a proposed Lake Superior Center for Fisheries, Aquatic Science and Education (Lake Superior Science Center) in Ashland, Wisconsin. The first phase of the feasibility study was prepared by Cedar Corp. and covered site characteristics and a conceptual framework for the building – approximate size, functions and cost estimate (see Appendix C). This second phase report builds on the work from Phase I by examining for-profit vs not-for-profit development models, analyzing how project financing differs based upon the model used and how that impacts the rent required to finance the development, what the regional economic benefits from the project might be compared to alternative uses of the site for housing or commercial development and what types of grant programs might be available to help fund development of the Lake Superior Science Center. Whether owned or leased, we use “rent” to indicate the cost of occupying a facility. The proforma analysis suggests that a Lake Superior Science Center project developed by a for-profit developer would require rent of approximately $24 per square foot. Local commercial rents appear to be in the range of $10 - $16 per square foot (https://www.loopnet.com/for-sale/ashland-wi). This means for the project to be feasible, it needs to generate sufficient benefits to the tenants such that they are willing to pay above market rents to realize the benefits of the location and its amenities. Private investors would need to invest about $1.8 million of their own funds in order to secure financing for the project. A not-for-profit developer would require rent in the range of $12 - $15 per square foot – squarely within the range of market rents. The project is feasible with a non-profit developer as long as there are enough mission-specific benefits to justify the investment required. A non-profit developer would need to invest about $3.4 million in order to finance the project at these rents. One reason the amount required to be invested by a non-profit developer is nearly twice that of a for-profit developer is that lower rent means less cash flow which impacts the value of the project. Lenders loan money based on the value of the project upon completion. Lower value means less money loaned and more money that needs to be invested by the developing entity. Economic benefits of the Lake Superior Science Center to the region were compared to two alternative uses for the site – housing and commercial development. The total economic impact of a Lake Superior Science Center in Ashland, Wisconsin is estimated at $27 million, compared to $17.5 million for a housing development and $14 million for commercial development. The next phase of the project should be to understand the specific amenities the site and facility can offer relative to the needs of the market and to identify the specific tenants for the facility that can benefit from the location, facility and amenities offered.
Lake Superior Science Center Feasibility Study Phase II Page 1Lake Superior Science Center Feasibility Study Phase II December 2019 Page 1
Project Overview The purpose of this feasibility study is to assess the ability to establish, construct, and maintain the Lake Superior Center for Fisheries, Aquatic Science and Education (Lake Superior Science Center) in Ashland, Wisconsin.
Vision The Lake Superior Center for Fisheries, Aquatic Science and Education is a proposed facility in Ashland, Wisconsin on the shore of Lake Superior where scientists would engage in research to monitor, restore, and protect resources in the Lake Superior basin. The Lake Superior Science Center would support public education and outreach related to resources in the basin.
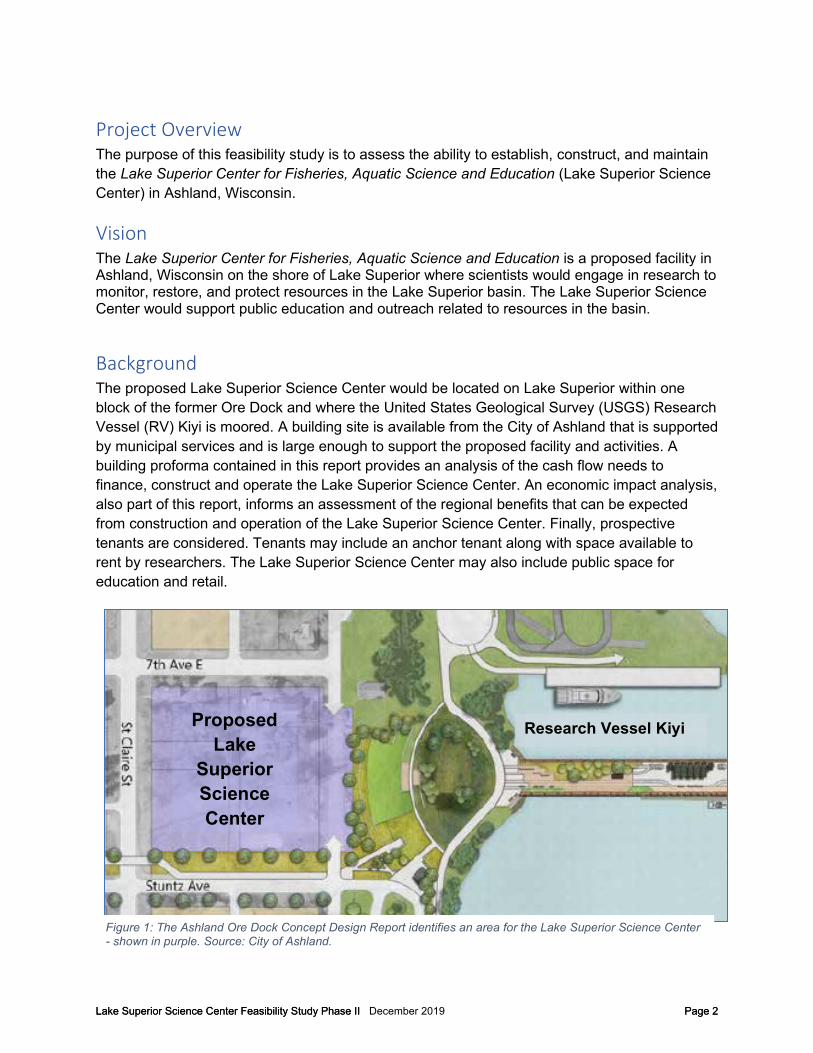
Background The proposed Lake Superior Science Center would be located on Lake Superior within one block of the former Ore Dock and where the United States Geological Survey (USGS) Research Vessel (RV) Kiyi is moored. A building site is available from the City of Ashland that is supported by municipal services and is large enough to support the proposed facility and activities. A building proforma contained in this report provides an analysis of the cash flow needs to finance, construct and operate the Lake Superior Science Center. An economic impact analysis, also part of this report, informs an assessment of the regional benefits that can be expected from construction and operation of the Lake Superior Science Center. Finally, prospective tenants are considered. Tenants may include an anchor tenant along with space available to rent by researchers. The Lake Superior Science Center may also include public space for education and retail.
Proposed Lake
Superior Science Center
Research Vessel Kiyi
Figure 1: The Ashland Ore Dock Concept Design Report identifies an area for the Lake Superior Science Center - shown in purple. Source: City of Ashland.
Lake Superior Science Center Feasibility Study Phase II Page 2Lake Superior Science Center Feasibility Study Phase II December 2019 Page 2

A Lake Superior Science Center in Ashland, WI would provide access to Lake Superior approximately 18 miles from the Apostle Islands. The Apostle Islands region is one of the most important commercial and sport fishing regions on the Great Lakes. The presence of the RV Kiyi in Ashland, the largest USGS research vessel on the Great Lakes, holds the potential to support additional research on Lake Superior. Docking facilities can accommodate multiple large research vessels. Further, the presence of Fish and Wildlife Service and National Park Service provide additional opportunities for research related to Lake Superior and its watershed.
The City of Ashland Waterfront Development Plan was prepared in 2019. The City is working to redevelop City-owned property in the vicinity of the proposed Lake Superior Science Center. The development of the Lake Superior Science Center and the redevelopment of the waterfront may create opportunities to integrate the Lake Superior Science Center into the waterfront in ways that are beneficial to both the Lake Superior Science Center and the City.
The feasibility of the Lake Superior Science Center will depend on the cost to construct and operate the facility, how it is constructed and financed and the ability of the tenants to pay for the space they occupy. The proforma provided in the feasibility study provides an estimate of the rent that would be required which will be useful to potential tenants. The proforma assumes the Lake Superior Science Center would not be owned, operated or fully funded by the City of Ashland.
Tenants A research institution would be a desirable anchor tenant. In broad terms, in this study an academic research institution is an entity capable of obtaining funding for research projects related to science on Lake Superior and its watershed. For example, the academic research institution may have researchers who have funding and then utilize the Lake Superior Science Center when conducting research on Lake Superior. USGS may consider involvement with a Lake Superior Science Center provided the Lake Superior Science Center includes a research institution.
Phase I of this feasibility study identified two of the most feasible paths for tenants in the Lake Superior Science Center.
• A research institution would be either the sole tenant or an anchor tenant. If the researchinstitution has an interest in including USGS in the Lake Superior Science Center, the
From the Ashland Ore Dock Concept Design Report: COLLABORATIVE RESEARCH CENTER “A collaboration between key partners such as Northland College and the USGS results in the new research and innovation hub. The potential research center’s close proximity to the lake and ore dock allow for easy access to the water and are part of the driver for new investments and economic development within the region. Special event parking can be coordinated so that the facility’s lot is available for festivals and public parking along the top of the bluff near Water Street is reserved for daily users of the ore dock. A community space may be incorporated into the building and interpretive displays developed in collaboration with the historical society tell both the history of the site and the innovative work and research occurring at the Center and on the KIYI.”
Lake Superior Science Center Feasibility Study Phase II Page 3Lake Superior Science Center Feasibility Study Phase II December 2019 Page 3
research institution and USGS would determine if that is feasible. The Lake Superior Science Center may also include public space to support education along with retail space.
• An institution such as four-year college or non-profit would fund the development of theLake Superior Science Center and oversee the Lake Superior Science Center. Tosupport research, the Lake Superior Science Center would have space and equipmentto support the research conducted through grants. The Lake Superior Science Centermay also include public space to support general education along with retail space.
In both paths, the Lake Superior Science Center should include the necessary space and equipment to attract a critical mass of researchers capable of obtaining grants to support their research.
The Phase I study examined the current facility for USGS, FWS, and NPS in Ashland and found that they have adequate space at this time. However, the study did find that the current facility has some limitations and there is very little, if any, capacity to support growth of the agencies in the future. If a Lake Superior Science Center is developed, it may provide an opportunity to support growth by USGS, FWS, and NPS that exceeds the capacity of their current facility.
It should also be noted that the public space and educational component of the Lake Superior Science Center would not seek to duplicate the efforts of the Northern Great Lakes Visitor Center (NGLVC) just outside Ashland. Instead, it would look for ways to collaborate with and complement the NGLVC.
Need for the Lake Superior Science Center A Lake Superior Science Center located on Lake Superior in Ashland, WI may provide opportunities for research and education both now and for decades into the future. Lake Superior will continue to change in part due to threats such as invasive species, increasing lake temperatures and contamination from micro-plastics and other pollution. The research may contribute to management decisions to “support healthy and stable fish communities” (http://www.glfc.org/pubs/SpecialPubs/ Sp03_1.pdf page ii). A healthy lake is critical to supporting commercial fisheries and sport fishing. This was demonstrated in 2017 when nearby Bayfield, Wisconsin was selected to host the 13th International Coregonid Symposium. The Symposium focused on management concerns and research interests related to Coregonids (lake whitefish, cisco, deep-water chubs).
The Lake Superior Science Center would build on the presence of USGS, FWS, and NPS and their legacy to conserve the natural resources of the Lake Superior basin while also supporting economic goals of the region. The USGS presence includes the Lake Superior Biological Station (LSBS) and the Research Vessel Kiyi. In 1955, the United States and Canada established the Great Lakes Fishery Commission. In 1957, the LSBS was established in Ashland, Wisconsin to provide science-based monitoring and research on the fish communities of Lake Superior in support of the Great Lakes Fishery Commission. The LSBS is a component of the Great Lakes Science Center (GLSC) located in Ann Arbor, Michigan. The GLSC focuses
Lake Superior Science Center Feasibility Study Phase II Page 4Lake Superior Science Center Feasibility Study Phase II December 2019 Page 4

its research on the aquatic resources of the Great Lakes and manages stations on each of the Great Lakes, of which the Lake Superior station in Ashland, Wisconsin is the largest. The Lake Superior Science Center would be a place to support partnerships of local, state, federal, native nation and international agencies.
In 2019 a delegation from the International Joint Commission (IJC) held a listening session at Northland College in Ashland, Wisconsin. The IJC was created by the United States and Canada because they recognize that each country is affected by the actions of each country in the lake and river systems along the border. A white paper regarding the listening session is available at the link below and in Appendix B.
https://documentcloud.adobe.com/link/track?uri=urn%3Aaaid%3Ascds%3AUS%3A550bcc7a-4c2f-4189-ba07-870ae1740f80
Freshwater science is a rapidly growing field, as evidenced by UW-Madison’s Freshwater and Marine Sciences (FMS) Program, UW-Milwaukee’s School of Freshwater Science, and Northland College’s Mary Grigg’s Burke Center for Freshwater Innovation. The Lake Superior Science Center may have the opportunity to establish relationships with other organizations such as these that have an interest in research and education related to Lake Superior and its basin.
The Lake Superior Science Center ideally would have the capacity to: 1) support research related to fisheries and aquatic science now and into the future;2) add to and complement the base, scientific, and educational capacities developed in the
future (e.g., molecular/genomic) --both onsite and virtual;3) collaborate and coordinate with other researchers, institutions and industries that rely
upon the health of the Lake Superior Basin;4) disseminate research locally, nationally and internationally;5) develop and demonstrate methods for enhancing public and private benefits from a
healthy ecosystem; and6) enhance support for integrated research on Lake Superior.
Lake Superior Science Center Feasibility Study Phase II Page 5Lake Superior Science Center Feasibility Study Phase II December 2019 Page 5

Site Information Location
Figure 2: Location of site relative to Lake Superior.
The site is located on the southwestern shore of Lake Superior, one of the earth’s largest freshwater lakes. The most productive fishery on the lake is around the Apostle Islands, 18 miles from Ashland.
4.6 million people with an average household income of $81,740 live within a 4-hour drive of the site. Of this population, 1 million are under the age of 18. There are approximately 2,100 schools within this range.
158 miles
268 miles
Figure 3: 1-hour drive time rings from the proposed site in Ashland, WI. Source: GWB Professional Services, U.S. Census Bureau.
Lake Superior Science Center Feasibility Study Phase II Page 6Lake Superior Science Center Feasibility Study Phase II December 2019 Page 6

Characteristics The site is currently comprised of 5 parcels and an undeveloped right-of-way. Altogether the site is approximately 90,000 square feet in size or slightly over 2 acres. The land is valued by the City Assessor at $45,357 per acre. The City of Ashland acquired this property as part of the Ore Dock Redevelopment. There are currently two single-family homes on the site which the City intends to demolish.
Figure 4: Aerial image of site proposed for Lake Superior Science Center. Source: Google Maps, GWB Professional Services.
Lake Superior Science Center Feasibility Study Phase II Page 7Lake Superior Science Center Feasibility Study Phase II December 2019 Page 7

The streets surrounding the site are essentially constructed to rural standards with no curb, gutter or sidewalk. Additionally, the east side of the site is expected to serve as the primary entrance to Ore Dock Park and to have a pedestrian promenade to the lake as described in the Waterfront Development Plan1. Development of the site will require street improvements, sidewalks and a contribution toward the pedestrian promenade.
The building proposed for the site was conceptualized in the Phase I Feasibility Study prepared by Cedar Corp. The gross area of the proposed building is 25,727 square feet on a single floor. Cedar prepared a conceptual site plan for the proposed building. The site plan shows 64
1 City of Ashland, WI, “Ashland, Inspired – A Waterfront Development Plan”; Draft November 22, 2019, Graef Planning & Urban Design and Hey & Associates.
Figure 5: The site proposed for the Lake Superior Science Center is 2 acres owned by the City of Ashland and is part of the Ashland Ore Dock Redevelopment Area. Source; Ashland County GIS Property Information, GWB Professional Services.
Lake Superior Science Center Feasibility Study Phase II Page 8Lake Superior Science Center Feasibility Study Phase II December 2019 Page 8

parking stalls; however, Ashland’s zoning ordinance requires a maximum of 1 parking stall for every 300 square feet of gross floor area of office space and 1 stall per 250 square feet of gross floor area of conference space2. Applying the office space standard, we find that the conceptual site plan is short of the maximum parking area by at least 22 stalls. This would likely be allowed by the City, particularly if a waiver to allow on-street parking was secured for overflow parking or facilities to promote biking/walking/transit/carpooling were installed to reduce the number of autos on site. Environmental Issues A Phase II environmental assessment was conducted on the entire Ore Dock redevelopment area which included the subject site. Contamination was found on the subject site above threshold levels for arsenic, barium, lead and mercury. It is highly likely that environmental remediation would need to be part of the development of this site. Depending upon an approved plan, such remediation may be accomplished by a number of methods ranging from on-site grading and capping of the contaminated soil to excavation and hauling of the contaminated soil to a landfill approved to receive contaminated soil.
2 City of Ashland Unified Development Ordinance, adopted January 10, 2012, revised August 28, 2012; Table 6-3A: Maximum Allowed Off-Street Parking Spaces.
Lake Superior Science Center Feasibility Study Phase II Page 9Lake Superior Science Center Feasibility Study Phase II December 2019 Page 9

Potential Organizational Models for Lake Superior Science Center One concern that has come up in discussions about a Lake Superior Science Center in Ashland is whether development of the Lake Superior Science Center would require public ownership - local government ownership in particular. Ashland area local governments are currently fiscally stressed and if a Lake Superior Science Center would require local government ownership, it would likely not be feasible. This analysis excludes consideration of public ownership.
In general, there are many types of organizations that might construct and operate a facility such as this. In terms of ownership, the types of organizations fall on a spectrum from Public to Private: Public – Government
Public – Special Purpose
Non-Profit Organizations
For-Profit Companies
Federal, State, City/Village, County, Town;
Universities; Redevelopment Authority; Housing & Economic Development Authority; quasi-public organizations authorized by government to carry out specific public functions or services.
Corporate entity with tax-exempt status formed for a public service or benefit such as a private college, foundation, or research institution.
Private, for-profit corporation/governance determined by its owners..
Highest Degree to which public interest drives the organization Lowest
Nearly all organizational types can own property and they are all allowed to enter into partnerships if the characteristic of the partnership does not violate rules for the organizational type. Therefore, the number of configurations of ownership models is nearly unlimited.
The appropriate model for a project depends upon many factors, most of which cannot be pre-determined. In general, those entities who hold the resources (land, buildings, access to capital, knowledge, motivation) will dictate their ownership interest in a project and if there are multiple resource holders participating in a project, the project would be structured such that each resource holder’s interest is served from the structure. One type of organizational model or combination of models is neither good nor bad, right nor wrong – it all comes down to the type of partnerships that best serve the interests of those entities investing in the project.
Lake Superior Science Center Feasibility Study Phase II Page 10Lake Superior Science Center Feasibility Study Phase II December 2019 Page 10
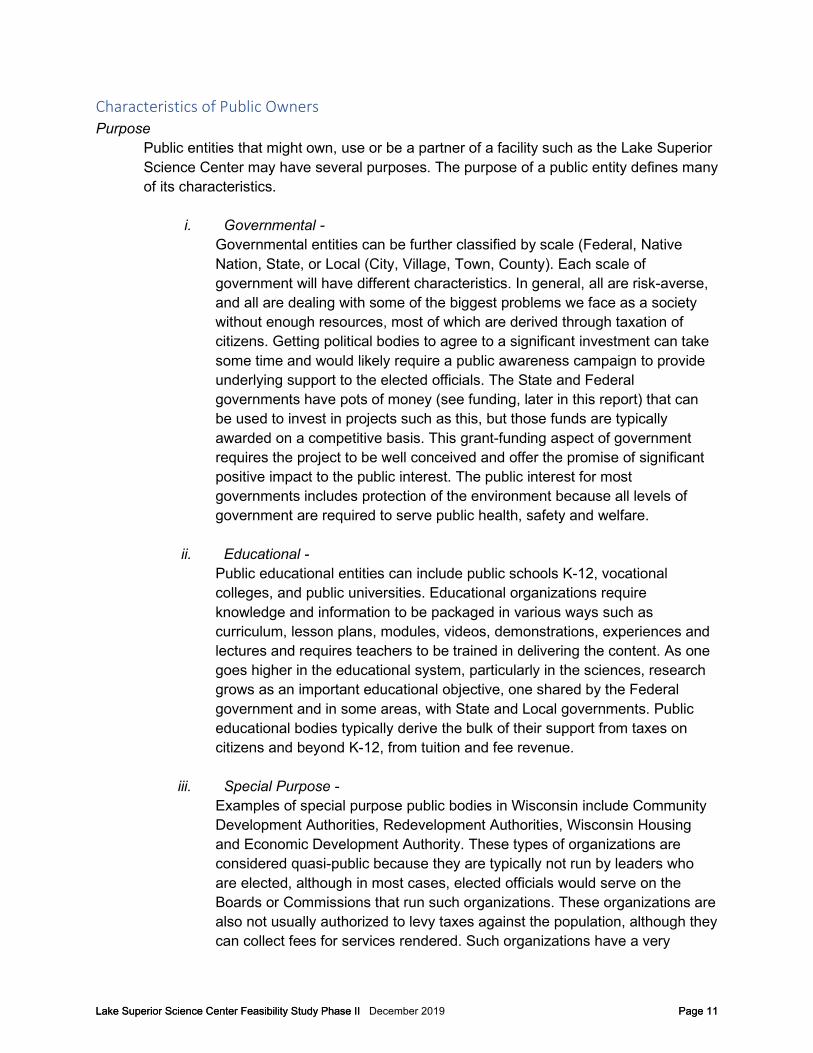
Characteristics of Public Owners Purpose
Public entities that might own, use or be a partner of a facility such as the Lake Superior Science Center may have several purposes. The purpose of a public entity defines many of its characteristics.
i. Governmental - Governmental entities can be further classified by scale (Federal, Native Nation, State, or Local (City, Village, Town, County). Each scale of government will have different characteristics. In general, all are risk-averse, and all are dealing with some of the biggest problems we face as a society without enough resources, most of which are derived through taxation of citizens. Getting political bodies to agree to a significant investment can take some time and would likely require a public awareness campaign to provide underlying support to the elected officials. The State and Federal governments have pots of money (see funding, later in this report) that can be used to invest in projects such as this, but those funds are typically awarded on a competitive basis. This grant-funding aspect of government requires the project to be well conceived and offer the promise of significant positive impact to the public interest. The public interest for most governments includes protection of the environment because all levels of government are required to serve public health, safety and welfare.
ii. Educational - Public educational entities can include public schools K-12, vocational colleges, and public universities. Educational organizations require knowledge and information to be packaged in various ways such as curriculum, lesson plans, modules, videos, demonstrations, experiences and lectures and requires teachers to be trained in delivering the content. As one goes higher in the educational system, particularly in the sciences, research grows as an important educational objective, one shared by the Federal government and in some areas, with State and Local governments. Public educational bodies typically derive the bulk of their support from taxes on citizens and beyond K-12, from tuition and fee revenue.
iii. Special Purpose - Examples of special purpose public bodies in Wisconsin include Community Development Authorities, Redevelopment Authorities, Wisconsin Housing and Economic Development Authority. These types of organizations are considered quasi-public because they are typically not run by leaders who are elected, although in most cases, elected officials would serve on the Boards or Commissions that run such organizations. These organizations are also not usually authorized to levy taxes against the population, although they can collect fees for services rendered. Such organizations have a very
Lake Superior Science Center Feasibility Study Phase II Page 11Lake Superior Science Center Feasibility Study Phase II December 2019 Page 11

specific and limited scope of responsibilities, but their authority to operate within that scope tends to be broad. For example, many of these types of organizations are granted the authority to condemn property, issue tax-exempt bonds, enter property to conduct investigations, and other powers that can make this type of organization a critical partner in a project that can serve the objective for which the organization was established.
The City of Ashland has a Housing Authority, but not a Redevelopment Authority. In Wisconsin, a municipality that has a Housing Authority may not establish a Community Development Authority, but it may establish a Redevelopment Authority, which are authorized for every municipality in the State. A Community Development Authority (CDA) combines the powers of a Housing Authority and a Redevelopment Authority (RDA), so forming a CDA would require dissolution of the Housing Authority and re-organizing it as a CDA with powers to address both housing and redevelopment. Such organizations are usually allowed to receive any grant that a local unit of government is eligible to receive.
Given the prospective site for the Lake Superior Science Center is an area of the City of Ashland which is in the process of redevelopment, there may be value to the City and this project in establishing a redevelopment authority. Many cities decide to use their own powers to carry out redevelopment projects, but the primary decisionmakers are elected officials who may or may not have expertise in understanding the complex issues associated with redevelopment. One of the advantages of having an RDA is that the 7-member Board of Commissioners can, and is encouraged by state statutes, to be comprised of members with expertise in fields such as law, development, finance, construction, engineering, and planning. The law also limits the number of elected city officials to no more than two of the seven members. This is to help ensure that decisions are made on technical merit more than political consideration. The City Council still maintains control of an RDA as they are required to approve the RDA’s budget each year, make a finding of blight that triggers the authority of a RDA to act within a given area and approve plans and actions of a RDA.
Examples of public purpose in real estate development include: • health, safety and welfare – protection from harm;• blight prevention and elimination;• public convenience – transportation, public mobility, land uses;• quality of life – parks, open space, civic improvements;• education;• economic development – tax base and jobs;• historic preservation;• environmental protection;• social equity.
Lake Superior Science Center Feasibility Study Phase II Page 12Lake Superior Science Center Feasibility Study Phase II December 2019 Page 12

Characteristics of Private Owners Private entities are defined not only in relation to their purpose, but also in the context of the tax impacts of the organization’s structure. Some private organizations that serve a public interest and restrict themselves from earning a profit (non-profit organizations) may receive an exemption from paying income taxes and some may qualify for an exemption from property taxes. Private organizations that serve the interests of its owners (for-profit organizations) generate profits that can either be reinvested in the organization, distributed to owners and investors or donated to achieve other purposes
We assume this facility will not be owned by a public entity. The analysis in the next section delves into the difference between a facility owned by a for-profit private entity and a not-for-profit private entity.
Financial Characteristics of For-Profit vs Non-Profit Ownership In this Phase II report, detailed proformas were prepared to compare the financial characteristics of a Lake Superior Science Center developed and owned by a for-profit private party with one owned and developed by a non-profit tax-exempt entity.
The major differences between a for-profit developer developing a project and a non-profit developer is in the expectation of being compensated for developing the project and the expectation that investors in the project would see a return on investment that is comparable to what investors might achieve from other similar investments. A non-profit tax-exempt project would also be exempt from paying property taxes, although a payment-in-lieu of taxes (PILOT) may be required in some locations. We assume a PILOT fee for a non-profit owner equal to the real estate taxes paid by the for-profit owner.
It is important at this point to clearly understand the difference between a project developer and project investors. A developer is a professional who typically has education and training in real estate, construction, finance or a similar field and the skills needed to understand and coordinate the various factors necessary for a successful development. The developer is first and foremost a seeker of opportunities for projects. They are also experts at managing and packaging the variety of services that need to be efficiently coordinated and perfectly timed to work together to deliver a project on time and in budget.
Investors on the other hand have access to funds that are seeking competitive rates of return. Developers have relationships with investors, either individuals, groups of individuals or institutions. Investors rely on developers to identify, develop and deliver projects that would generate enough cash flow to yield a competitive return on the funds invested (equity). Sometimes, but not usually, a developer will be their own investor. The standard for a competitive return is what a real estate investment instrument might yield. Generally, the investors return is tied to the perceived risk of the project. If there are factors to indicate the cash flow from the project may not be reliable, then the perceived risk would be higher, and a higher rate of return will be expected. Other factors may come into play such as tax breaks for investing in certain disadvantaged areas, such as Opportunity Zones or certain types of
Lake Superior Science Center Feasibility Study Phase II Page 13Lake Superior Science Center Feasibility Study Phase II December 2019 Page 13

projects, such as affordable housing in which case lower returns may be acceptable because they are offset by tax benefits.
A non-profit owner is typically in the business of realizing socio-economic benefits from a project rather than financial returns. They would still want to achieve break-even cash flow but would typically not need to generate the level of cash flow needed to provide a return on investment. For public or non-profit projects, investment in the project may come from public funds, grants or contributions that have limited or no expectation of being returned.
Financing is important for both for-profit and non-profit projects. Typically, banks are willing to lend up to 70% - 75% of the value of the project. Their funds are returned with interest through regular debt service payments. For private projects, investors are expected to come up with the remaining funds which becomes equity in the project. The value of a project is often less than the cost to construct. The value of a project such as this is determined by its cash flow and a factor that reflects market demand for the type of real estate being developed – the capitalization or “cap” rate.
Conditions that Apply to Either For-Profit or Non-Profit Owners The characteristics of the site are assumed to remain constant for either a for-profit or a non-profit owner. A spreadsheet designed to model the cash flow of mixed-use projects was used to analyze the cash flow of the proposed Lake Superior Science Center. The proposed project does not include a residential component, so those lines in the model will have blank entries. The following charts present base assumptions about the site that apply to both ownership scenarios presented in this section.
Base Site Information:
Lake Superior Science Center Feasibility Study Phase II Page 14Lake Superior Science Center Feasibility Study Phase II December 2019 Page 14

Site Development Assumptions Site development assumptions are derived from the Phase I Feasibility Study prepared by Cedar Corp and found in Appendix C of this report. Parking is a site development assumption that requires some explanation. The City of Ashland’s parking ordinance establishes parking maximums, rather than the historically standard parking minimums. Both maximums and minimums are based upon the same data for parking demand. The switch from parking minimums to maximums requires corresponding strategies to reduce parking demand so that maximum parking demand may be met by the same number that used to represent minimum parking need. This can be accomplished by more users of a site arriving by foot, bicycle, transit or shared vehicle. The City of Ashland is in the process of implementing strategies to reduce parking demand. Although the Phase I study did not include bicycle parking in the conceptual site design, it should be an important element of the final site design. As it stands, the conceptual site design from the Phase I study is approximately 22 stalls less than the maximum under the City’s new ordinance. This does not present a problem as long as the site design includes significant bicycle parking, the site is connected to a city-wide network of pedestrian and bicycle facilities, provisions are made for drop-off of users by both transit and shared vehicles and information is generated that encourages users to use these methods to avoid parking on the site, if possible.
Note: “Efficiency” is the difference between the total space in a building and the space that is occupied. Generally, most commercial buildings contain space that cannot be occupied, such as lobbies, hallways, utility rooms, and restrooms. When leasing commercial space, these common areas are typically not included in the per square foot rent or occupancy cost. The information presented in the tables above is the base information about the site and the building that will be common to the two scenarios analyzed in the following sections.
Lake Superior Science Center Feasibility Study Phase II Page 15Lake Superior Science Center Feasibility Study Phase II December 2019 Page 15

Proforma Cash Flow Analysis of a For-Profit Owner The following analysis derives the rent and investment a for-profit owner would need in order to operate the proposed facility. It is based upon the cost to construct and operate the facility, the cash flow that comes from the regular payments made to occupy the space (rent), the investors target rate of return, and the strength of the local market.
Site Development Costs Site preparation costs include the cost of the site based upon the City Assessor’s valuation, an allowance for demolition of the structures, and an allowance for environmental remediation. Given the relatively flat topography of the site, no extraordinary site grading is anticipated in this modeling, beyond what is normal for excavation related to the building and landscaping (hard costs).
Hard construction costs include the construction of the building, allowances for furniture, fixtures & equipment, landscaping, stormwater retention, street improvements and utilities and a 10% contingency. Building cost was taken from the Phase I Feasibility Study prepared by Cedar Corp. The remaining costs are allowances based upon percent of construction cost averages from other similar projects.
Soft costs are the costs that must be incurred in order to make the construction possible and include architecture, engineering, legal and landscape architecture fees, financing fees, building permits, impact and other development fees, a tenant improvement allowance and insurance premiums.
Development fees are typically 3% to 5% of the project hard costs. We used 3% in our analysis.
In summary, total site development costs are comprised of the following components:
Site Preparation $290,000 Hard Costs (construction) $6,288,345 Soft Costs $689,219 Development Fees $188,650 Total Costs $7,456,214
Lake Superior Science Center Feasibility Study Phase II Page 16Lake Superior Science Center Feasibility Study Phase II December 2019 Page 16

Lake Superior Science Center Feasibility Study Phase II Page 17Lake Superior Science Center Feasibility Study Phase II December 2019 Page 17

It is not unusual for a developer to defer all or a portion of their fee if the project is expected to be sold upon development or in a relatively short time or until the project has stabilized and extraordinary obligations met such as might be described in a development agreement. We have assumed none of the developer fee would be deferred. Deferred development fees are considered part of the developer’s equity in the project. Construction management and contractor fees are assumed to be included in the construction costs. Sometimes the developer will control other businesses that may be involved in developing a project and which may be entitled to fees from the project. We would like to understand these relationships so we can understand the magnitude of all fees being derived from the project by the developer and if there are opportunities to defer some of those fees until the project has established itself financially. This is a way of sharing the risks of the project and providing an incentive for positive outcomes, if the developer is willing to structure the project in this way. Sources and Uses of Funds The capital stack of a project describes the sources of funds that will come together to fund the project. For most private development projects, this consists of debt and equity. Debt is financing that is provided by a lender as a loan with an interest rate and a term within which the loan must be repaid. Loans are secured by the assets of the project and the good faith of its owners. Lenders will generally lend 70%+/- of the expected appraised value of the project. Debt service is the regular payments made toward paying off a loan and includes both principal and interest. Our model assumes an interest rate of 5.5% The value of a project can be estimated by using the cash flow of the project (net operating income) and dividing it by a capitalization rate (or “cap” rate). The capitalization rate is a measure of the relative market risk of a project and relates to the return an investor might seek at a level of risk. Projects with relatively low market risk, such as those in growing areas with housing shortages might see cap rates of 4% to 6%. Projects with relatively high market risk might have cap rates over 10%. Our model uses a cap rate of 8% to represent moderate risk. Dividing the project’s net operating income by an 8% cap rate yields an estimated market value of $4.3 million. We assume a lender would be willing to loan 70% of the estimated market value3 or approximately $3,000,000 +/-. Notice that our project costs are significantly greater than the
3 A lender will likely commission an appraisal report of the proposed project prior to approving a loan to estimate the market value of the project. Our analysis is not a substitute for an appraisal but serves to provide a rough estimate of what an appraisal’s income approach would yield.
Lake Superior Science Center Feasibility Study Phase II Page 18Lake Superior Science Center Feasibility Study Phase II December 2019 Page 18

value of the project. Although the loan amount is 70% of the estimated value of the project, the loan is only 40.9% of the total needed to cover project costs. Equity is the investment made by the owners, or investors of the project. It is the money that is most at risk. This higher risk is the reason investors demand a higher rate for use of their money than do lenders. When determining an appropriate rate of return on equity, the appropriate rate is that rate which will attract capital to the project. Capital is generally attracted to the investment that will generate the highest return for the least amount of risk. The higher the risk, the higher the return. One way of benchmarking return on equity is to look at publicly traded real estate funds. Such funds have returns that range from 3% to 13% depending upon the time period considered. It is reasonable to assume that any investor in this project would expect to earn a rate of return of at least 9%. The amount of equity a project can attract is calculated by dividing the net operating income by the expected return on equity. We use the first year of stabilized operation for the calculation and consider a ten-year average return. In this case, the project can support equity investment of approximately $1,800,000 or 24.6% of the total funds required. We now have 65% of the capital stack needed to fund the project. Part of the cost of constructing this project includes an allowance for site acquisition ($40,000), demolition ($50,000), environmental remediation ($200,000) and improvements to public streets and sidewalks adjacent to the site ($757,576). These are costs that have been or will be incurred by the City of Ashland. Ordinarily these costs would be the responsibility of the project. However, the project would provide public benefits and the project would be subject to property taxes, therefore the City of Ashland could consider using tax incremental financing (TIF) to fund the public improvements and it is assumed as part of this analysis. The City also has a successful track record securing grant funds for environmental remediation. The City is already committed to demolishing structures on the site and remediating environmental contamination. This analysis assumes the City of Ashland would use TIF to fund public improvements for a privately-owned Lake Superior Science Center, but that TIF funds would not be used to directly fund construction of the Center. A project with an assessed value of $4.3 million would generate enough tax increment to fund the estimated cost of public improvements as well as the cost allowances for demolition and soil remediation. This participation by the City of Ashland will cover another 14% of our capital stack, which is now up to 80%. Since this project is redeveloping a brownfield site for a project generating public benefits, it stands a good chance of attracting grant funding as described in the Phase I Feasibility Study. The
Lake Superior Science Center Feasibility Study Phase II Page 19Lake Superior Science Center Feasibility Study Phase II December 2019 Page 19
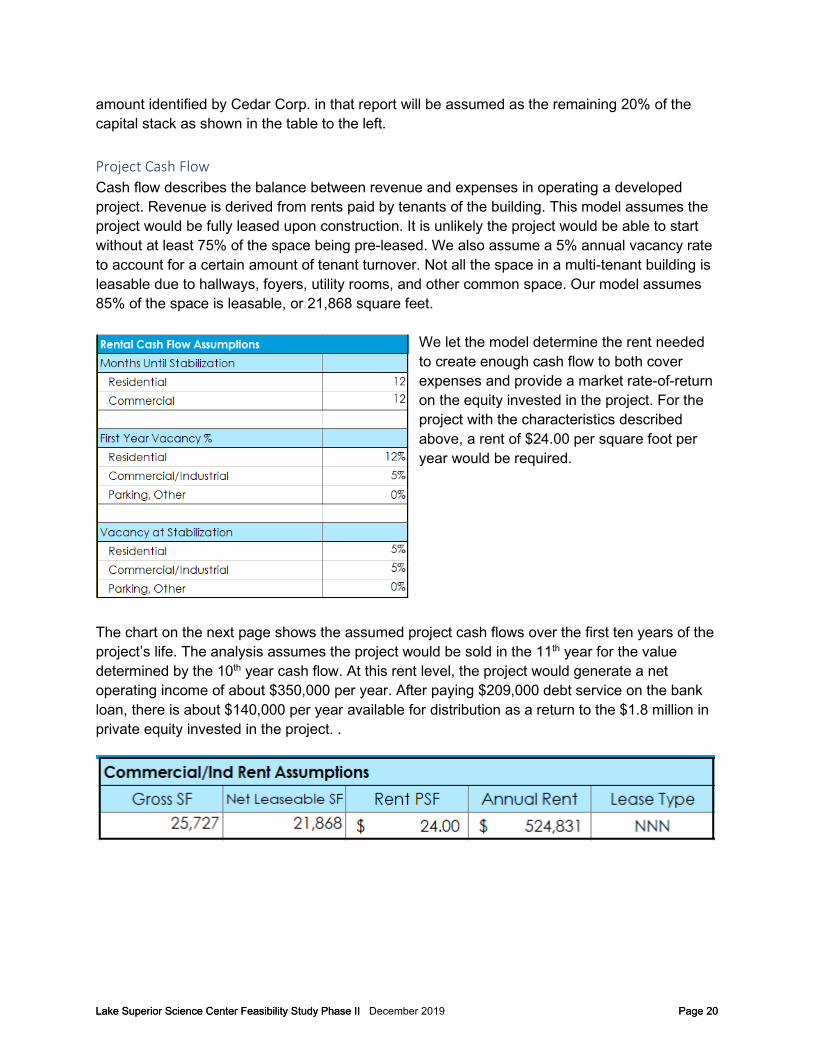
amount identified by Cedar Corp. in that report will be assumed as the remaining 20% of the capital stack as shown in the table to the left. Project Cash Flow Cash flow describes the balance between revenue and expenses in operating a developed project. Revenue is derived from rents paid by tenants of the building. This model assumes the project would be fully leased upon construction. It is unlikely the project would be able to start without at least 75% of the space being pre-leased. We also assume a 5% annual vacancy rate to account for a certain amount of tenant turnover. Not all the space in a multi-tenant building is leasable due to hallways, foyers, utility rooms, and other common space. Our model assumes 85% of the space is leasable, or 21,868 square feet.
We let the model determine the rent needed to create enough cash flow to both cover expenses and provide a market rate-of-return on the equity invested in the project. For the project with the characteristics described above, a rent of $24.00 per square foot per year would be required.
The chart on the next page shows the assumed project cash flows over the first ten years of the project’s life. The analysis assumes the project would be sold in the 11th year for the value determined by the 10th year cash flow. At this rent level, the project would generate a net operating income of about $350,000 per year. After paying $209,000 debt service on the bank loan, there is about $140,000 per year available for distribution as a return to the $1.8 million in private equity invested in the project. .
Lake Superior Science Center Feasibility Study Phase II Page 20Lake Superior Science Center Feasibility Study Phase II December 2019 Page 20

Lake Superior Science Center Feasibility Study Phase II Page 21Lake Superior Science Center Feasibility Study Phase II December 2019 Page 21

Lake Superior Science Center Feasibility Study Phase II Page 22Lake Superior Science Center Feasibility Study Phase II December 2019 Page 22
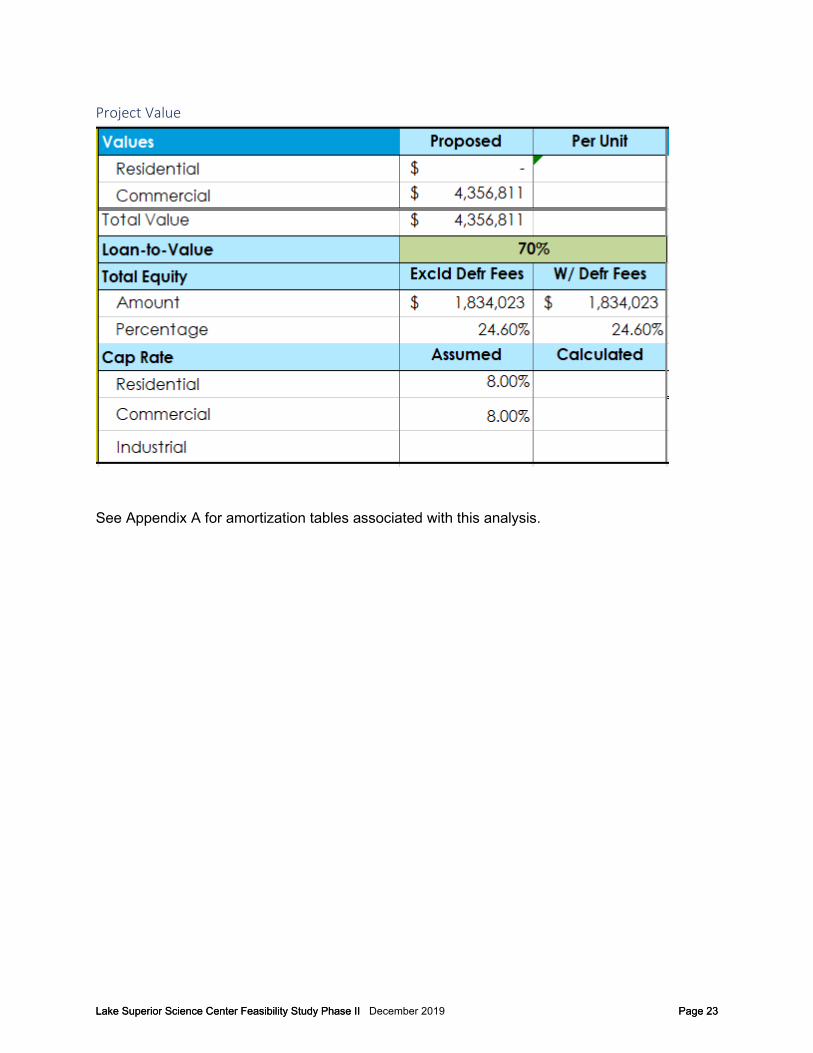
Project Value
See Appendix A for amortization tables associated with this analysis.
Lake Superior Science Center Feasibility Study Phase II Page 23Lake Superior Science Center Feasibility Study Phase II December 2019 Page 23

Proforma Cash Flow Analysis of Non-Profit Tax-Exempt Ownership The following analysis derives the rent and investment a non-profit owner would need in order to operate the proposed facility. It is based upon the cost to construct and operate the facility, the cash flow that comes from the regular payments made to occupy the space (rent), the investors target rate of return, and the strength of the local market.
Site Development Costs
The primary difference between the site development costs of a private owner and a non-profit owner is the cost of property taxes over the construction period, estimated at $3,500. We assume a non-profit developer would make a payment in lieu of taxes that is equivalent to what a private owner would pay in property taxes.
Lake Superior Science Center Feasibility Study Phase II Page 24Lake Superior Science Center Feasibility Study Phase II December 2019 Page 24

The development fee is payment for development of the project and is assumed for both a non-profit and for-profit owner. We assume the developer would not be entitled to other fees by controlling other related entities.
Lake Superior Science Center Feasibility Study Phase II Page 25Lake Superior Science Center Feasibility Study Phase II December 2019 Page 25

Sources and Uses of Funds A non-profit owner would qualify for a lower loan amount due to the lower assessed value of a property that generates less cash flow. The ability of the City of Ashland to support the public infrastructure costs is significantly reduced. Although a non-profit owner would be exempt from property taxes, we assume a payment in lieu of taxes (PILOT). Even though the PILOT would be based on value of the project and the property tax rate, the same as for a private owner, the
amount generated would be significantly less because the value of the project will be lower. We further assume the City of Ashland would allocate the PILOT to pay for costs of acquiring and preparing the site for development. However, this stream of revenue is only enough to provide about $650,000 in assistance to the project. The difference between the City of Ashland’s support and the lower loan amount must be made up with higher equity, about double that required for a for-profit owner.
Project Cash Flow A non-profit owner does not need to generate profit for its investors, and it has lower debt service cost due to a lower loan amount; therefore, it can charge lower rent to operate closer to the break-even point. It is still desirable to generate some surplus that can be reinvested into the mission of the organization; however, part of that mission may include supporting the tenants by keeping rent as low as possible while still being financially sustainable. A non-profit owner, operating the assumed facility can charge rent of $15 per square foot and still generate surplus of about $100,000 per year, which could be available for reinvestment in the facility or programming.
Lake Superior Science Center Feasibility Study Phase II Page 26Lake Superior Science Center Feasibility Study Phase II December 2019 Page 26

Lake Superior Science Center Feasibility Study Phase II Page 27Lake Superior Science Center Feasibility Study Phase II December 2019 Page 27

Lake Superior Science Center Feasibility Study Phase II Page 28Lake Superior Science Center Feasibility Study Phase II December 2019 Page 28

Lake Superior Science Center Feasibility Study Phase II Page 29Lake Superior Science Center Feasibility Study Phase II December 2019 Page 29

Project Value
The assumed assessed value of the project is expected to be about $1.8 million less for a non-profit owner due to the lower cash flow resulting from charging significantly less rent.
Lake Superior Science Center Feasibility Study Phase II Page 30Lake Superior Science Center Feasibility Study Phase II December 2019 Page 30
Summary of Differences – Private vs Non-Profit Ownership The same project described above was run under assumptions of non-profit tax-exempt ownership. This change has the following effects on the project:
• The minimum return on equity required by private equity is no longer a restriction; • Equity is now a fundraising target. Project investors are contributing funds with no
expectation of return other than possible tax advantages. $3.4 million is the fundraising target, compared to an equity contribution of $1.8 million for a private developer.
• The rent required to achieve break-even under these conditions is less than $12.00 per square foot, compared to $24 under private ownership.
• The reduced rent impacts cash flow which reduces the market value of the project to $2.5 million and reduces the amount of bank financing available to $1.8 million. A project like this may be able to attract higher levels of bank participation if Community Reinvestment Act (CRA) credits could be secured which would offset the amount of fundraising required.
• The project makes a PILOT contribution instead of paying property taxes, but on a lower value, so the City of Ashland has less funding for the public improvements – about half the amount needed. The additional cost of public improvements is assumed by the project. The City of Ashland may still participate if it has another source to pay for the public improvements.
In summary, a for-profit owner would need to secure tenants willing to pay $24 per square foot - above local commercial rents, but the community would have a facility of higher value and one which would require lower equity contributions. A non-profit owner could charge market-rate rent, lowering the threshold for securing tenants, but the facility would have lower value and require higher equity contributions which are assumed to come from fundraising and grant-writing.
Lake Superior Science Center Feasibility Study Phase II Page 31Lake Superior Science Center Feasibility Study Phase II December 2019 Page 31
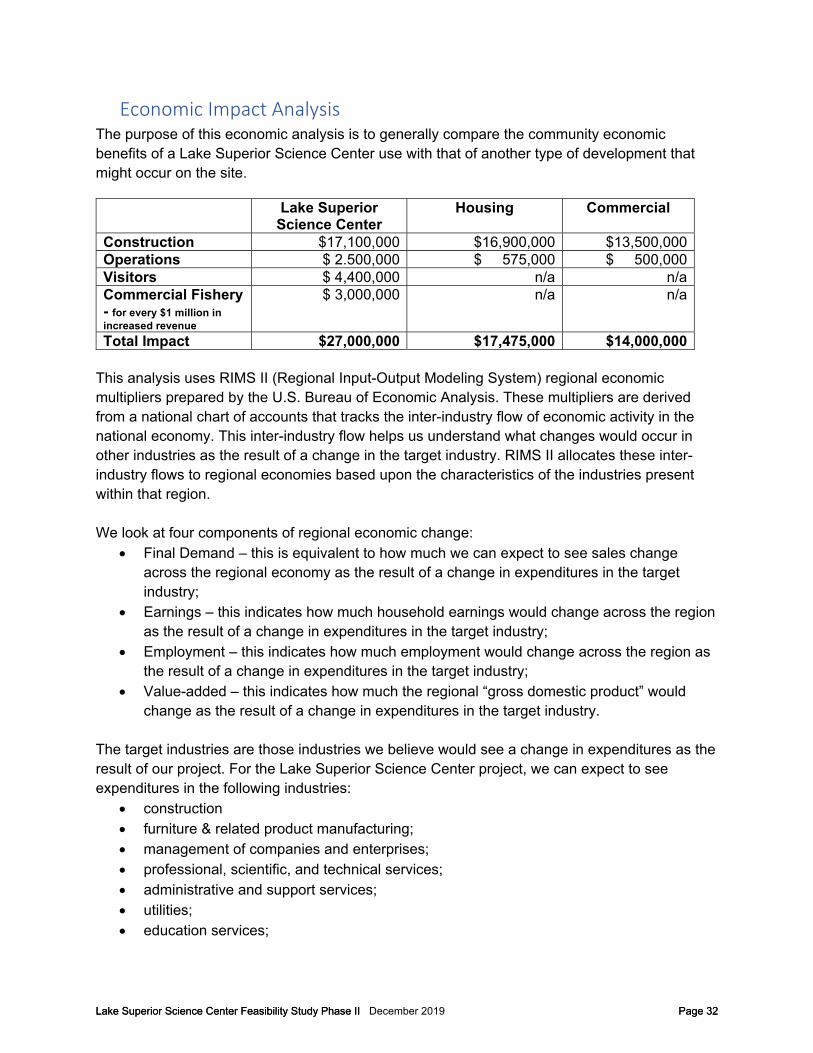
Economic Impact Analysis The purpose of this economic analysis is to generally compare the community economic benefits of a Lake Superior Science Center use with that of another type of development that might occur on the site.
This analysis uses RIMS II (Regional Input-Output Modeling System) regional economic multipliers prepared by the U.S. Bureau of Economic Analysis. These multipliers are derived from a national chart of accounts that tracks the inter-industry flow of economic activity in the national economy. This inter-industry flow helps us understand what changes would occur in other industries as the result of a change in the target industry. RIMS II allocates these inter-industry flows to regional economies based upon the characteristics of the industries present within that region.
We look at four components of regional economic change: Final Demand – this is equivalent to how much we can expect to see sales change
across the regional economy as the result of a change in expenditures in the targetindustry;
Earnings – this indicates how much household earnings would change across the regionas the result of a change in expenditures in the target industry;
Employment – this indicates how much employment would change across the region asthe result of a change in expenditures in the target industry;
Value-added – this indicates how much the regional “gross domestic product” wouldchange as the result of a change in expenditures in the target industry.
The target industries are those industries we believe would see a change in expenditures as the result of our project. For the Lake Superior Science Center project, we can expect to see expenditures in the following industries:
construction furniture & related product manufacturing; management of companies and enterprises; professional, scientific, and technical services; administrative and support services; utilities; education services;
Lake Superior Science Center
Housing Commercial
Construction $17,100,000 $16,900,000 $13,500,000Operations $ 2.500,000 $ 575,000 $ 500,000 Visitors $ 4,400,000 n/a n/a Commercial Fishery - for every $1 million inincreased revenue
$ 3,000,000 n/a n/a
Total Impact $27,000,000 $17,475,000 $14,000,000
Lake Superior Science Center Feasibility Study Phase II Page 32Lake Superior Science Center Feasibility Study Phase II December 2019 Page 32

• accommodation;• food services and drinking places;• forestry, fishing and related activities.
The expenditures have different characteristics and timing implications, so we categorize the expenditures in the following way:
• construction phase – includes construction and furniture & fixtures;• Operations Phase – includes salaries for management, professional staff, administrative
support, utilities, interest expense, and educational services;• visitors – one of the stated goals for the Lake Superior Science Center is to educate the
public about the Lake Superior ecosystem. This may happen in several ways, but it islikely this would result in an increase in visitors to the region.
• fisheries impact – one reason for considering the Lake Superior Science Center projectis to have a positive impact on the Lake Superior fishery. This would likely be a longer-term impact. We analyze the impacts that would result from a $1 million change inrevenue to the regional fishing industry.
Due to the lack of detail about the Lake Superior Science Center, the following assumptions have been made to aid in the comparative analysis:
• The region used to estimate economic impact includes Ashland, Bayfield and Douglascounties;
• All expenditures are used to purchase material and services from the region;• Construction of the Lake Superior Science Center would result in $6.3 million in
construction expenditures;• The Lake Superior Science Center would expend $220,000 on furniture & fixtures in
addition to the hard construction expenditure;• The Lake Superior Science Center would expend $3.4 million over 20 years on interest
expense from a regional lending institution. This is divided by the 20-year term offinancing to derive an average annual expenditure of $170,000;
• The Lake Superior Science Center would employ 5 full-time persons expending $600,000per year on salaries and benefits as follows:• 1 Director with a salary/benefits of $150,000;• 3 Professional, Scientific and Technical staff @$120,000;• 1.3 Administrative/support staff @ $90,000 ($70,000/full-time position);
• The Lake Superior Science Center would expend $200,000 per year on educationalmaterial and services;
• The Lake Superior Science Center would expend $40,000 per year on utilities;• The Lake Superior Science Center may have an impact on the fishery. We assumed a $1
million increase in revenue from the fishery for the region due to the work from the LakeSuperior Science Center;
• A Lake Superior Science Center would result in increased visitors to the community, butno need for additional permanent housing, other than hotels, motels, private rentals andother temporary housing that may be needed for visitors to the project;
Lake Superior Science Center Feasibility Study Phase II Page 33Lake Superior Science Center Feasibility Study Phase II December 2019 Page 33

• The Lake Superior Science Center would attract an additional 25,000 visitors to the region per year;
• Visitors would be split between overnight visits and day visits with 70%-day visits (17,500) and 30% overnight visits (7,500). Overnight visitors are assumed to stay one night;
• The average day visitor is assumed to spend $35 on food and beverage services. • The average overnight visitor is assumed to spend $100 on lodging and $50 on food and
beverage services; • Housing as an alternate use of the site would be constructed at a density of 15 units per
acre. This is somewhere between the density of single-family homes (3 – 4 units/acre) and multi-family apartment buildings (20 – 40 units/acre);
• Average unit size is 1,200 s.f. – 15 units/acre would result in a building size per acre of 15,000 s.f.;
• Housing construction costs are $150/s.f.; • Commercial as an alternate use would be constructed at a density of 20,000 s.f./acre,
assuming primarily single-story construction for a floor-area ratio of around 0.5; • Commercial construction costs would run $125/s.f.
Lake Superior Science Center Feasibility Study Phase II Page 34Lake Superior Science Center Feasibility Study Phase II December 2019 Page 34

Lake Superior Science Center Economic Impact Analysis The Lake Superior Science Center is expected to have an economic impact of approximately $24 million plus whatever impact the Lake Superior Science Center might have on the commercial fishery, estimated at $3 million for every $1 million change in revenue from the fishery. Sports fishing is also important to the local economy although not included in this analysis. A healthy Lake Superior fishery would be important to sustaining sport fishing in the region. The annual impact from the operation of and visitors to the Lake Superior Science Center is estimated at $7 million and 32 jobs. The following is a rough estimate of the economic impact of the assumed Lake Superior Science Center in Ashland. Construction Phase, Lake Superior Science Center – 1 year:
Category of Impact Construction Furniture & Fixtures Total Impact Expenditure $6,300,000 $220,000 $6,520,000 Regional Sales Multiplier
1.4755 1.5586
Change in Regional Sales Impact
$9,295,650 $342,892 $9,638,542
Regional Household Earnings Multiplier
0.3919 0.3566
Change in Regional Household Earnings Impact
$2,468,970 $78,452 $2,547,422
Regional Employment Multiplier
7.7037 8.3061
Change in Regional Employment Impact
49 2 51
Regional Value-Added Multiplier
0.7657 0.6137
Change in Regional Value-added Impact
$4,823,910 $135,014 $4,958,921
Total Regional Impact
$16,588,530 $556,358 $17,144,888
Lake Superior Science Center Feasibility Study Phase II Page 35Lake Superior Science Center Feasibility Study Phase II December 2019 Page 35

Operations – per year Category of
Impact Manage
ment Services
Prof., Scientific & Technical
Services
Administrative & Support Services
Utilities Educational Services
Interest Expense
Total Impact
Expenditure $150,000 $360,000 $90,000 $40,000 $200,000 $170,000 $1,010,000 Regional Sales Multiplier
1.1937 1.3316 1.3816 1.3529 1.3187 1.2752
Change in Regional Sales Impact
$179,055 $479,376 $124,344 $54,116 $263,740 $216,784 $1,317,415
Regional Household Earnings Multiplier
0.1333 0.4346 0.4493 0.2026 0.3933 0.2880
Change in Regional Household Earnings Impact
$19,995 $156,456 $40,437 $8,104 $78,660 $48,960 $352,612
Regional Employment Multiplier
2.1161 8.1871 14.3284 2.9159 11.5784 5.4779
Change in Regional Employment Impact
0.32 3 1.29 0.12 2.32 0.93 7.98
Regional Value-Added Multiplier
0.7451 0.8588 0.8696 0.7723 0.8764 0.8417
Change in Regional Value-added Impact
$111,765 $309,168 $78,264 $30,892 $175,280 $143,089 $848,458
Total Regional Impact
$310,815 $945,000 $243,045 $93,112 $517,680 $408,833 $2,518,485
Lake Superior Science Center Feasibility Study Phase II Page 36Lake Superior Science Center Feasibility Study Phase II December 2019 Page 36

Visitors – per year Category of Impact Accommodation Food & Drinking
Services Total Impact
Expenditure $750,000 $987,500 $1,737,500Regional Sales Multiplier
1.3712 1.4090
Change in Regional Sales Impact
$1,028,400 $1,391,388 $2,419,788
Regional Household Earnings Multiplier
0.3919 0.3566
Change in Regional Household Earnings Impact
$246,000 $375,744 $621,744
Regional Employment Multiplier
7.7037 8.3061
Change in Regional Employment Impact
9 16 25
Regional Value-Added Multiplier
0.7657 0.6137
Change in Regional Value-added Impact
$607,500 $747,735 $1,355,235
Total Regional Impact
$1,881,900 2,514,866 $4,396,766
Commercial Fishery – per $1 million change in revenue
Category of Impact Forestry, fishing & related activities
Revenue $1,000,000Regional Sales Multiplier
1.5633
Change in Regional Sales Impact
$1,563,300
Regional Household Earnings Multiplier
0.5541
Change in Regional Household Earnings Impact
$554,100
Regional Employment Multiplier
15.1271
Change in Regional Employment Impact
15
Regional Value-Added Multiplier
0.9718
Change in Regional Value-added Impact
$971,800
Total Regional Impact
$3,089,200
Lake Superior Science Center Feasibility Study Phase II Page 37Lake Superior Science Center Feasibility Study Phase II December 2019 Page 37
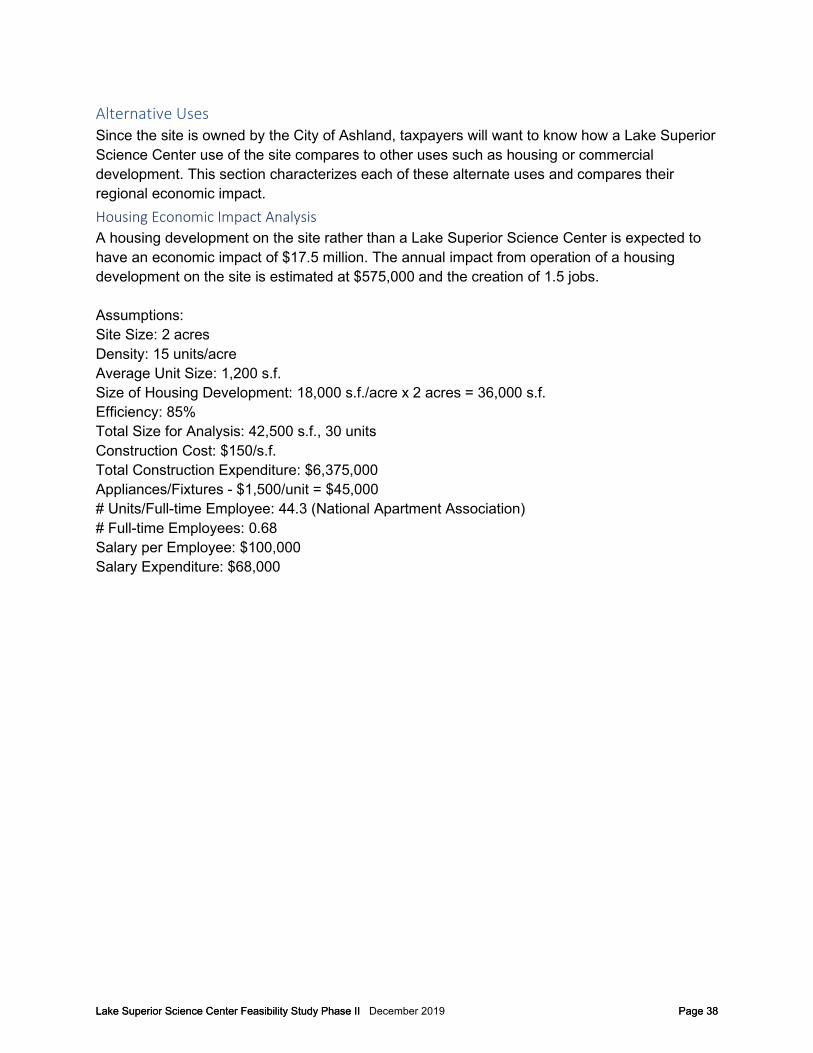
Alternative Uses Since the site is owned by the City of Ashland, taxpayers will want to know how a Lake Superior Science Center use of the site compares to other uses such as housing or commercial development. This section characterizes each of these alternate uses and compares their regional economic impact. Housing Economic Impact Analysis A housing development on the site rather than a Lake Superior Science Center is expected to have an economic impact of $17.5 million. The annual impact from operation of a housing development on the site is estimated at $575,000 and the creation of 1.5 jobs.
Assumptions: Site Size: 2 acres Density: 15 units/acre Average Unit Size: 1,200 s.f. Size of Housing Development: 18,000 s.f./acre x 2 acres = 36,000 s.f. Efficiency: 85% Total Size for Analysis: 42,500 s.f., 30 units Construction Cost: $150/s.f. Total Construction Expenditure: $6,375,000 Appliances/Fixtures - $1,500/unit = $45,000 # Units/Full-time Employee: 44.3 (National Apartment Association) # Full-time Employees: 0.68 Salary per Employee: $100,000 Salary Expenditure: $68,000
Lake Superior Science Center Feasibility Study Phase II Page 38Lake Superior Science Center Feasibility Study Phase II December 2019 Page 38

Construction Phase, Housing Development – 1 year:
Category of Impact Construction Appliances & Fixtures
Total Impact
Expenditure $6,375,000 $45,000 $6,420,000 Regional Sales Multiplier
1.4755 1.5586
Change in Regional Sales Impact
$9,406,311 $59,504 $9,465,816
Regional Household Earnings Multiplier
0.3919 0.3566
Change in Regional Household Earnings Impact
$2,498,363 $11,169 $2,509,532
Regional Employment Multiplier
7.7037 8.3061
Change in Regional Employment Impact
49 0.2 49.2
Regional Value-Added Multiplier
0.7657 0.6137
Change in Regional Value-added Impact
$4,881,338 $35,330 $4,916,667
Total Regional Impact
$16,786,013 $106,002 $16,892,015
Lake Superior Science Center Feasibility Study Phase II Page 39Lake Superior Science Center Feasibility Study Phase II December 2019 Page 39

Operations – Housing Development, per year
Category of Impact
Management Services
Utilities Interest Expense
Total Impact
Expenditure $68,000 $25,000 $140,000 $233,000 Regional Sales Multiplier
1.4464 1.3529 1.2752
Change in Regional Sales Impact
$98,655 $33,823 $178,528 $310,706
Regional Household Earnings Multiplier
0.3911 0.2026 0.2880
Change in Regional Household Earnings Impact
$26,595 $5,065 $40,320 $71,980
Regional Employment Multiplier
9.6771
2.9159 5.4779
Change in Regional Employment Impact
0.66 0.07 0.77 1.50
Regional Value-Added Multiplier
0.831
0.7723 0.8417
Change in Regional Value-added Impact
$56,508 $19,308 $117,838 $193,654
Total Regional Impact
$181,458 $58,195 $336,686 $576,339
Lake Superior Science Center Feasibility Study Phase II Page 40Lake Superior Science Center Feasibility Study Phase II December 2019 Page 40

Commercial Economic Impact Analysis A commercial development on the site rather than a Lake Superior Science Center is expected to have an economic impact of $14 million. The annual impact from operation of a commercial development on the site is estimated at $500,000 and the creation of 1.0 jobs. Assumptions: Site Size: 2 acres Density: 20,000 s.f./acre Size of Commercial Development: 20,000 s.f./acre x 2 acres = 40,000 s.f. Construction Cost: $125/s.f. Total Construction Expenditure: $5,000,000 Furniture/Fixtures – 3% of Construction Expenditure - $150,000 Leasing Commissions – 6% or annual rent, 20% turnover per year on lease rates of $15/s.f. = $6,000/year # Full-time Employees: 0 Salary per Employee: $100,000 Salary Expenditure: $0 Utility Expenditure: $1.75/s.f. - 2012 Commercial Building Energy Consumption Survey - $70,000 Construction Phase, Commercial Development – 1 year:
Category of Impact Construction Furniture & Fixtures Total Impact Expenditure $5,000,000 $150,000 $5,150,000 Regional Sales Multiplier
1.4755 1.5586
Change in Regional Sales Impact
$7,377,500 $233,790 $7,611,290
Regional Household Earnings Multiplier
0.3919 0.3566
Change in Regional Household Earnings Impact
$1,959,500 $53,490 $2,012,990
Regional Employment Multiplier
7.7037 8.3061
Change in Regional Employment Impact
39 1.2 40.2
Regional Value-Added Multiplier
0.7657 0.6137
Change in Regional Value-added Impact
$3,828,500 $92,055 $3,920,555
Total Regional Impact
$13,165,500 $379,335 $13,544,835
Lake Superior Science Center Feasibility Study Phase II Page 41Lake Superior Science Center Feasibility Study Phase II December 2019 Page 41

Operations – Commercial Development, per year Category of
Impact Utilities Interest
Expense Leasing
Commission Total
Impact Expenditure $70,000 $130,000 $6,000 $206,000 Regional Sales Multiplier
1.3529 1.2752 1.4464
Change in Regional Sales Impact
$94,703 $165,776 $8,678 $269,157
Regional Household Earnings Multiplier
0.2026 0.2880 0.3911
Change in Regional Household Earnings Impact
$14,182 $37,440 $2,347 $53,969
Regional Employment Multiplier
2.9159 5.4779 9.6771
Change in Regional Employment Impact
0.2 0.71 0.06 0.97
Regional Value-Added Multiplier
0.7723 0.8417 0.831
Change in Regional Value-added Impact
$54,061 $109,421 $4,986 $168,468
Total Regional Impact
$162,946 $312,637 $16,011 $491,594
Comparison of Alternative Uses A summary comparing the analysis of alternative uses is presented in the table below:
Lake Superior Science Center
Housing Commercial
Construction $17,100,000 $16,900,000 $13,500,000 Operations $ 2.500,000 $ 575,000 $ 500,000 Visitors $ 4,400,000 n/a n/a Commercial Fishery - for every $1 million inincreased revenue
$ 3,000,000 n/a n/a
Total Impact $27,000,000 $17,475,000 $14,000,000
Lake Superior Science Center Feasibility Study Phase II Page 42Lake Superior Science Center Feasibility Study Phase II December 2019 Page 42

General Market Characteristics In addition to the economic impact analysis, this report also includes data on the economic characteristics of the population within a 4-hour drive of Ashland, broken down into 1-hour drive-time rings.
Map showing 1-hour drive-time rings from the site in Ashland WI. This area includes the northern half of Wisconsin – including Wausau and Eau Claire, but not Green Bay, Milwaukee or Madison, northeast Minnesota – including the Twin Cities, Duluth and St. Cloud and most of the Upper Peninsula of Michigan.
Lake Superior Science Center Feasibility Study Phase II Page 43Lake Superior Science Center Feasibility Study Phase II December 2019 Page 43

Lake Superior Science Center Feasibility Study Phase II Page 44Lake Superior Science Center Feasibility Study Phase II December 2019 Page 44

Lake Superior Science Center Feasibility Study Phase II Page 45Lake Superior Science Center Feasibility Study Phase II December 2019 Page 45

Potential Funding Options There are funding programs that could support a Lake Superior Science Center in one way or another. Some of the programs relate to helping communities with economic development initiatives, others with helping to clean-up contaminated sites and still others with research and education initiatives. Very few programs, if any, will provide funding solely on the merits of a project – the specific funding request must strongly match the objectives of the specific program from which funding is sought. Some of the programs are described below for illustration. It is important to understand that priorities for funding, regardless of the specific program, often change in response to public policy, funding availability and need. These programs are also very competitive. It is critical that project concepts, goals, objectives and commitments be well defined and communicated as part of any request for funding. In addition to the formal programs described below, local, state and federal governments allocate funding through a political process. Legislative bodies at all levels may allocate funds to worthy projects that promise to have an impact on an area and accomplish important public policy objectives. A comprehensive approach to funding should start with conversations with both administrators of the programs described below, as well as local, state and federal representatives. It is never a good idea to prepare a grant application without discussing the project with the funding source ahead of time. It is critical to match a funding program with specific project needs. It is also important to consider a phased approach to the project, as described at the end of section 1. Local commitments for funding are also critical. No funder wants to be the only entity investing in a project. Like a private development project with commercial funding, grant programs would want to know that others are investing in the project and that there is a shared risk. Any grant writing efforts to state, federal or foundation sources must be supported with local funding commitments from the community standing to benefit from the project. There are databases of funding programs available that should be searched for funding opportunities. Searching these databases is one of the first steps in preparing a funding strategy, once the project is clearly defined and local commitments understood:
• Grants.gov – a database of all federal grants; • Wisconsin Funding Sources – Wisconsin used to have a comprehensive database of
grants, similar to grants.gov, but it appears it is no longer maintained. The Wisconsin DNR maintains Wisconsin government funding resources at https://dnr.wi.gov/aid/.
• Marquette University maintains a subscription-based database of Foundations in Wisconsin - http://www.wifoundations.org/. Much of this information is available for free at the U.W.-Madison Memorial Library Grants Information Center.
Lake Superior Science Center Feasibility Study Phase II Page 46Lake Superior Science Center Feasibility Study Phase II December 2019 Page 46

Program Website Description Community Development Block Grant Program
https://doa.wi.gov/Pages/LocalGovtsGrants/ CommunityDevelopmentPrograms.aspx
Planning Program Public Facilities Economic Development The Community Development Block Grant (CDBG) program is a federal formula-allocated grant program. The Wisconsin Department of Administration (DOA) - Division of Energy, Housing and Community Resources (DEHCR) administers the State Community Development Block Grant Program and provides funding to units of general local government (UGLGs) that do not receive an annual allocation directly from HUD. The primary purpose of the CDBG program is the development of viable communities through the provision of decent affordable housing, a suitable living environment, and the expansion of economic opportunities, principally for the benefit of persons of low and moderate income.
USDA-Rural Development
https://www.usda.gov/topics/rural
The U.S. Department of Agriculture Rural Development has a number of grant and loan programs for infrastructure, economic development, energy and affordable housing.
Wisconsin DNR Stewardship Grants
dnr.wi.gov/topic/Stewardship/Grants/
The Stewardship Program is a set of grants intended to acquire land and to build facilities for nature-based recreation, environmental protection, wildlife conservation, habitat restoration and water quality protection. Brownfield cleanups may fit into one of the Stewardship grant categories listed below. Brownfield projects receive greater weight than other Stewardship grant applications.
Wisconsin Coastal Management Grants
https://doa.wi.gov/Pages/LocalGovtsGrants/ CoastalGrants.aspx
Approximately $1.5 million of WCMP Grants will be available for: Coastal wetland protection and habitat restoration Nonpoint source pollution control Coastal resource and community planning Great Lakes education Public access and historic preservation projects
Wisconsin Dept. of Transportation, Transportation Economic Assistance Program
https://wisconsindot.gov/Pages/doing-bus/local-gov/astnce-pgms/aid/default.aspx
The TEA program provides funding of up to $1 million to governing bodies for the completion of road, rail, harbor or airport improvements that support the increase or creation of jobs.
Lake Superior Science Center Feasibility Study Phase II Page 47Lake Superior Science Center Feasibility Study Phase II December 2019 Page 47

Wisconsin DNR Recreational Boating Facilities Grants
https://dnr.wi.gov/AID/RBF.html
These grants may be used by counties, towns, cities, villages, tribes, sanitary districts, public inland lake protection and rehabilitation districts and qualified lake associations for recreational boating facility project. Past projects have included ramps and service docks to gain access to the water, purchase of aquatic weed harvesting equipment, navigation aids and dredging waterway channels.
Wisconsin Economic Development Corp., Capacity Building Grants
https://wedc.org/programs-and-resources/capacity-building-grants/
The program provides funds to assist organizations and local and regional economic development groups to further the goals of WEDC in its efforts to foster an advanced economic development network within the state of Wisconsin.
Wisconsin Economic Development Corp., Community Development Investment Grant
https://wedc.org/programs-and-resources/community-development-investment-grant/
The program will support urban, small city and rural community redevelopment efforts by providing financial incentives for shovel-ready projects with emphasis on, but not limited to, downtown community-driven efforts. Funded activities should lead to measurable benefits in job opportunities, property values and/or leveraged investment by local and private partners.
U.S. Economic Development Administration, Planning Program; Local Technical Assistance Program
https://www.eda.gov/funding-opportunities/
Through its Planning and Local Technical Assistance programs, EDA assists eligible recipients in developing economic development plans and studies designed to build capacity and guide the economic prosperity and resiliency of an area or region. The Planning program helps support organizations, including District Organizations, Indian Tribes, and other eligible recipients, with Short Term and State Planning investments designed to guide the eventual creation and retention of high-quality jobs, particularly for the unemployed and underemployed in the Nation’s most economically distressed regions. As part of this program, EDA supports Partnership Planning investments to facilitate the development, implementation, revision, or replacement of Comprehensive Economic Development Strategies (CEDS), which articulate and prioritize the strategic economic goals of recipients’ respective regions. The Local
Lake Superior Science Center Feasibility Study Phase II Page 48Lake Superior Science Center Feasibility Study Phase II December 2019 Page 48

Technical Assistance program strengthens the capacity of local or State organizations, institutions of higher education, and other eligible recipients to undertake and promote effective economic development programs through projects such as feasibility studies and impact analyses.
Small Business Innovation Research Program (SBIR)
https://www.sbir.gov/ The Small Business Innovation Research (SBIR) program is a highly competitive program that encourages domestic small businesses to engage in Federal Research/Research and Development (R/R&D) that has the potential for commercialization. Through a competitive awards-based program, SBIR enables small businesses to explore their technological potential and provides the incentive to profit from its commercialization. By including qualified small businesses in the nation's R&D arena, high-tech innovation is stimulated and the United States gains entrepreneurial spirit as it meets its specific research and development needs.
Lake Superior Science Center Feasibility Study Phase II Page 49Lake Superior Science Center Feasibility Study Phase II December 2019 Page 49

Conclusion/Next Steps This analysis is the second phase of a multi-phase study and demonstrates that a proposed Lake Superior Science Center in Ashland, Wisconsin of the scope described by Cedar Corp. in their Phase I report can be financially viable as either a for-profit or not-for-profit development project. A project developed by a for-profit entity would require rents significantly higher than typical market rents for commercial space in Ashland. This is only feasible if the Lake Superior Science Center provides value commensurate with the rents required. Such value can come from having a mix of partners, resources and activities that reinforce each other and create tenant benefits that could not otherwise be derived – benefits such as an increase in regional income from the Lake Superior fishery, from a significant increase in visitors to the region or significant efficiency in conducting research on the Lake Superior ecosystem.
The threshold for a non-profit development of the Lake Superior Science Center would be lower and could potentially be reached with fewer explicit private benefits being generated, but non-profit resources in the project would require substantial public benefits be generated, such as improved services to regional residents, increases in regional household income or the establishment of a market that promises new investment that results in significant increases to the tax base.
A Lake Superior Science Center project on the site that has some reason to attract visitors and potential to impact income from the fishery or other ecological services would generate greater regional economic benefits than developing the site as either a typical housing or commercial development.
The next step for the project should be in developing a clear understanding of the market. What are the needs of the market for information about the Lake Superior ecosystem and what facility and site amenities are required to meet that need? Specifically, what users can realize benefits from co-locating in such a facility? What might be the expectations for such a facility by the prospective tenants? What equipment would be needed? What is the role of the public in such a facility? What role does the site play in attracting either tenants or visitors? What of the programming and management of the facility? The goal of the next phase of the project should be to refine the vision to the point that specific user benefits can be described and to reach out to those prospective users to understand what combination of other users, facility design, equipment availability or services would cause them to commit to the facility.
With that information in hand, a development plan could be prepared and a serious effort at securing local investment/fundraising/grant writing could be undertaken.
Additional Information Sources of additional information about environmental-based science and education programming may be found through these resources:
• Top Environmental Schools - https://www.environmentalscience.org/top-schools
Lake Superior Science Center Feasibility Study Phase II Page 50Lake Superior Science Center Feasibility Study Phase II December 2019 Page 50

• Association of Science Technology Centers - http://www.astc.org/• Association of Independent Research Institutes - https://www.airi.org/about-
airi/membership/member-list• Association of Ecosystem Research Centers – ecosystemresearch.org• American Association for the Advancement of Science – aaas.org
A development project requires the following elements to be considered successful: • It meets a market need with users securing benefits from their occupancy of the building
that exceeds the rent required by the project;• It has a location that can efficiently serve the market and requires consideration of
access and adjacent uses and activities;• It has a design that is consistent with its purpose, the market and its location;• There is financing available for the project;• Project leadership has the skills, adaptability and knowledge to move the project
forward.
The typical project goes through the following development process: • Define the concept;• Break the concept into components;• Assess the market for each of the components;• Evaluate the user and revenue potential of each component;• Scale the project to match the market;• Identify a location and collect site information;• Prepare a site and building concept plan with rendering;• Begin developing content and programming ideas;• Seek out investors and partners;• Identify a lead organization to develop the project;• Prepare a business plan that describes how the project would be funded, constructed
and operated;• Secure financing and funding commitments;• Enter into construction contracts;• Build the project;• Operate the project;• Monitor the market and tenant value.
This project has a site and a general concept for the facility with a very general space needs analysis and an opinion of probable cost based upon that analysis (Phase I). It has explored the impact of ownership type on the feasibility of the project and it has estimated the economic benefits of the project (Phase II). This work is still part of defining the concept for the Lake Superior Science Center. There is still more work to do to on the concept for the project, primarily providing more detail to understand the specific value that specific tenants might secure from the Lake Superior Science Center, such as researchers, state and federal agencies, visitors, the fishery, and related industries. Related to this is what equipment and
Lake Superior Science Center Feasibility Study Phase II Page 51Lake Superior Science Center Feasibility Study Phase II December 2019 Page 51

configuration of facilities is needed to realize that value. This can only happen by interacting with prospective tenants.
Once that level of detail is secured, a concept plan for the site and facility can be prepared that refines the general concept and can result in more targeted cost estimates. From that point, specific content and programming ideas can be weaved together with the financial and economic information to create a business plan for the facility. This business plan, along with renderings of the site and facility would be critical documents to secure financial commitments from partners, investors and lenders.
Lake Superior Science Center Feasibility Study Phase II Page 52Lake Superior Science Center Feasibility Study Phase II December 2019 Page 52

Appendix A. Amortization Tables1. Private Owner Analysis
Lake Superior Science Center Feasibility Study Phase II Page A-1

2. Non-Profit Owner Analysis
Lake Superior Science Center Feasibility Study Phase II Page A-2

Appendix B. Highlights from the International Joint Commission’s Visit to Northland College
This report may be accessed on-line with this link: https://documentcloud.adobe.com/link/track?uri=urn%3Aaaid%3Ascds%3AUS%3A550bcc7a-4c2f-4189-ba07-870ae1740f80
Lake Superior Science Center Feasibility Study Phase II Page B-1

Water Quality Concerns on the South Shore of Lake SuperiorWhat Might They Tell Us About the Future of the Great Lakes Water Quality Agreement?
A “1,000-year-storm event” in 2016 inundated U.S. Highway 2 and the Bad River Indian Reservation east of Ashland, Wis.
Wisconsin Emergency Management
September 25, 2019
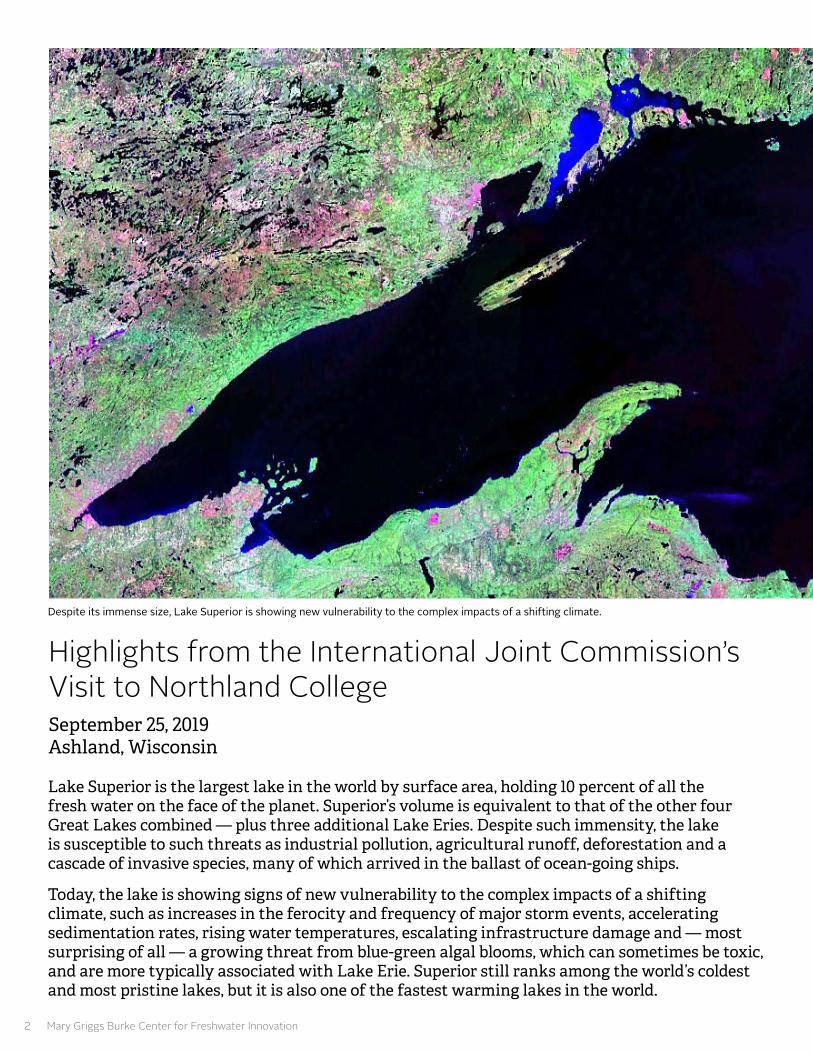
2 Mary Griggs Burke Center for Freshwater Innovation
Lake Superior is the largest lake in the world by surface area, holding 10 percent of all the fresh water on the face of the planet. Superior’s volume is equivalent to that of the other four Great Lakes combined — plus three additional Lake Eries. Despite such immensity, the lake is susceptible to such threats as industrial pollution, agricultural runoff, deforestation and a cascade of invasive species, many of which arrived in the ballast of ocean-going ships.
Today, the lake is showing signs of new vulnerability to the complex impacts of a shifting climate, such as increases in the ferocity and frequency of major storm events, accelerating sedimentation rates, rising water temperatures, escalating infrastructure damage and — most surprising of all — a growing threat from blue-green algal blooms, which can sometimes be toxic, and are more typically associated with Lake Erie. Superior still ranks among the world’s coldest and most pristine lakes, but it is also one of the fastest warming lakes in the world.
Highlights from the International Joint Commission’s Visit to Northland CollegeSeptember 25, 2019 Ashland, Wisconsin
Despite its immense size, Lake Superior is showing new vulnerability to the complex impacts of a shifting climate.

Water Quality Concerns on the South Shore of Lake Superior 3
On Sept. 25, 2019, a delegation from the International Joint Commission (IJC) traveled to Ashland, Wis., on the shores of Lake Superior as part of a listening tour of U.S. and Canadian communities in the Great Lakes basin. In addition to Ashland, this leg of the IJC’s journey also included stops in Thunder Bay, Ont., and Duluth, Minn. More than 200 people turned out for the public comment period at Northland College in Ashland, roughly half of them Northland students. During several hours of public comments that evening, dozens of students and local residents expressed concerns to the IJC commissioners about declining water quality in Lake Superior. “Lake Superior has been a draw for many people who inhabit this region,” Auggie Walheim, a freshman at Northland, told the commissioners. “[But] the destruction and alteration of shoreline and rivers that run into Lake Superior puts point and nonpoint pollution into the water ... I have done all that I can to protect the water, and it is my hope that all of you will do whatever you can in your power to protect the lake and make sure that it will still be clean, clear and beautiful seven generations from now.”
The IJC was created in 1909 to help resolve transboundary water disputes all along the U.S./Canada border — from the St. Croix River in the east, to the Yukon River in the west. The IJC consists of three commissioners appointed by the federal government of the United States, three commissioners appointed by the federal government of Canada, as well as an extensive binational team of experts and support staff. During the first several decades of its history, the IJC focused primarily on water-quantity issues, but starting in the 1970s, it took a more proactive focus on water quality, particularly in the Great Lakes. The IJC’s role is important, but advisory, leaving actual policymaking and regulatory action to the U.S. and Canadian federal governments. The Great Lakes Water Quality Agreement (GLWQA) is the IJC’s key water quality instrument in the Great Lakes region. It is a massive governance document first prepared in 1972, and updated several times since, to identify and track progress (or decline) on maintaining (or restoring) “the chemical, physical and biological integrity of the waters of the Great Lakes.” Water quality improvements that have occurred under the agreement are currently being assessed by the IJC, and it launched its 2019 Great Lakes listening tour as an opportunity for the public to “step in and speak out” about the state of the lakes and the health of shoreline communities. While they were in Ashland, the commissioners and staff also received a series of expert briefings earlier in the day from scientists, resource managers, tribal leaders and public works officials. These briefings were arranged by the Mary Griggs Burke Center for Freshwater Innovation at Northland College to provide depth and historical context to some of the key water quality issues facing the south shore of Lake Superior — especially the beautiful stretch of Wisconsin shoreline spanning from Duluth, Minn., to the Upper Peninsula of Michigan. This section of
On Sept. 25, 2019, more than 200 people attended an IJC public hearing in Ashland, Wis. focused on water quality in Lake Superior.
billkelleyphoto.com
Despite its immense size, Lake Superior is showing new vulnerability to the complex impacts of a shifting climate.
NASA

4 Mary Griggs Burke Center for Freshwater Innovation
shoreline includes the shallow and productive waters of Chequamegon Bay, the Apostle Islands National Lakeshore, the Frog Bay Tribal National Park on the Red Cliff Indian Reservation and the Bad River/Kakagon Slough, which is a globally recognized Ramsar Wetland of International Importance located on the Bad River Indian Reservation. This white paper is designed to capture and highlight the key water quality concerns that the IJC delegation heard about during its day-long visit to the area. The idea is to provide a water quality snapshot-in-time, as the key water quality issues of today are very different from those of 20 years ago, and today’s water quality concerns could end up being different from — or very similar to — the challenges to be faced in decades to come. This white paper is also designed to put Lake Superior’s contemporary water quality concerns into the broader overall context of the Great Lakes Water Quality Agreement.Some of the key regional water quality issues to be highlighted include:• An apparent climate-change-driven increase in highly
damaging storms in the Lake Superior watershed, which have produced massive and frequent sediment plumes in the lake
• A surprising recent emergence of potentially toxic algal blooms along Superior’s south shore
• A persistent problem with contaminated storm-related overflows from the aging sewer system in Ashland, Wis.
• Concerns about agricultural runoff, especially from a recently proposed 26,000-hog concentrated animal feeding operation (CAFO) about eight miles from Lake Superior
• Recent discoveries that storm-related erosion has exposed formerly buried sections of the controversial Enbridge Line 5 oil pipeline that passes through the Bad River Indian Reservation
• Concerns about recently proposed mining activity in the headwaters of some Lake Superior tributary streams
• Inadequate long-term planning and a fragmented approach to water quality management
Superior StormsLake Superior’s violent weather — especially during the month of November — has been memorialized in books and song. But in recent years, the south shore of Lake Superior has experienced unprecedented, violent weather during the summer months. In June 2012, Duluth, Minn., was hit by a “500-year storm” that turned streets into rushing rivers and devastated the city’s water infrastructure, as well as numerous farms and communities in nearby northwest Wisconsin. The storm’s nutrient-rich runoff spilled into Lake Superior and led to the first documented widespread blue-green algal bloom along the south shore of the famously pristine lake. In July of 2016, an even bigger “1,000-year storm event” struck wide swaths of land across east-central Minnesota and northwest Wisconsin, with the worst effects being felt near Ashland. The storm blew out numerous sections of federal, state and county highways, cutting off road access for 8,000 Ashland residents from all directions except the west.The raging flood waters of 2016 caused several deaths in northern Wisconsin, destroyed a Lake Superior harbor, gutted fields, caused millions in damage and spawned yet another rare blue-green algal bloom in the lake. The storm pushed sediment plumes far out into Superior, with loads of fine clay sediments (along with other soils and a range of undesirable nutrients, both natural and human-caused). The runoff was a reminder that
the regional landscape is still recovering from the “cutover” period of more than a century ago when Lake Superior’s old-growth forests were clear-cut from horizon-to-horizon, loosening topsoil and turning healthy river systems into gulches. The post-cutover ecosystem “remains unstable,” Matt Hudson, associate director of the Burke Center,
Raging runoff from a 1,000-year storm in 2016 blew out numerous federal, state and county highways near Ashland, Wis.
Frog Bay Tribal National Park on the Red Cliff Indian Reservation near Bayfield, Wis.
Wisconsin DNR Bayfield County
Matt Hudson, Burke Center
billkelleyphoto.com

Water Quality Concerns on the South Shore of Lake Superior 5
told the IJC. “And the excess sedimentation it produces is the largest nonpoint-source pollution issue in this region of the Great Lakes.”Then in June of 2018, yet another 1,000-year storm swept through the same area, bringing similar devastation to the region for the third time in seven years, including millions of gallons of storm water overflows in Ashland, and devastating damage to Houghton, Mich., 150 miles to the east. The 2018 storm led to yet another blue-green algal bloom in Lake Superior, this time forcing the National Park Service to post water quality warnings for the Apostle Islands National Lakeshore near the Red Cliff Indian Reservation, attracting the attention of The New York Times.The south shore of Lake Superior — stretching eastward from Duluth to the Upper Peninsula of Michigan — has been hit by so many damaging downpours since 2012 that it has made a mockery of the term “1,000-year-storm event.” This new normal has brought transformative change to the region’s largely rural and indigenous communities, heavily taxing agricultural systems and indigenous food sources as well as road and water infrastructure. “Climate change is hitting us like a freight train,” Ashland resident Richard Ketring told the IJC commissioners at the hearing. “We can’t sit by and wait for action.” As Matt Hudson told the IJC, “Culverts under roadways were
sized for rainfall intensities of the past, and thus are undersized for current and future conditions … that [highway] engineers are running smack-dab into the problem of having all their culverts blown out is an example of the aging infrastructure problem that keeps hitting us in the face.”
A section of the south shore of Lake Superior stretching from Duluth, Minn., to the Upper Peninsula of Michigan was hit by three massive 500-to-1,000-year storms between 2012 and 2018, causing more than $150 million in damage.
20 MILES
A 1,000-year storm in 2018 blew out this section of U.S. Highway 2 between Ashland, Wis., and Duluth, Minn. Precipitation data that highway engineers use to size bridges and culverts is rapidly becoming obsolete.
AirFoxPhotographyLLC
Richard Ketring, Ashland resident
billkelleyphoto.com

6 Mary Griggs Burke Center for Freshwater Innovation
The National Oceanic and Atmospheric Administration (NOAA) says the Ashland region is a notable “hotspot” of rainfall patterns far outside historical norms. Estimates put the losses of public infrastructure from the three recent, massive storm events in the range of $150 million, but the future cost will be much greater. NOAA estimates that intense rainfall amounts in the Ashland area are 37 percent higher than the mid-20th-century assumptions used by engineers and transportation planners to build much of the region’s transportation infrastructure, like bridges and culverts. What’s more, these new precipitation estimates don’t even factor in the large, intense storms since 2012. Still harder to gauge: long-term, reputational damage from these storms and their secondary effects on a regional tourism industry founded on Lake Superior’s pristine image as the cleanest of the Great Lakes.
Have we entered the Algal Bloom Era on Lake Superior?Scientists, natural resource managers and tribal leaders are becoming increasingly alarmed by the recent series of unprecedented and potentially toxic blue-green algal blooms on the south shore of Lake Superior. Superior is the largest, coldest and cleanest of the Great Lakes — characteristics not normally associated with algal blooms. But Superior is also one of the world’s fastest warming lakes, and higher water temperatures, combined with excess nutrients, are key drivers of algae outbreaks.
Brenda Moraska Lafrancois, an aquatic ecologist for the Midwest Region of the National Park Service, told the IJC that until 2012, the only reports of algal blooms in western Lake Superior were few and anecdotal. A handful of small bloom reports in the 1960s were attributed to iron enrichment of lake water from mine tailings, and a few more undocumented blooms may have occurred in the waters around the Apostle Islands National Lakeshore in the 1980s.
Algal blooms on Lake Superior in 2018 received national attention.
Three massive storms between 2012 and 2018 along the south shore of Lake Superior created sediment plumes so large that they were visible from space.
Brenda Moraska Lafrancois, National Park Service
billkelleyphoto.com
NASA

Water Quality Concerns on the South Shore of Lake Superior 7
The 2012 bloom was the first really noticeable, well-documented event, and it came during warm July weather, weeks after the 500-year storm centered on Duluth. The bloom lasted a couple of days and was followed in 2016 and 2017 by small blooms, noticed only by a few Apostle Islands staff.The August 2018 bloom followed a 1,000-year event in some parts of the region that occurred earlier in the summer. The bloom stretched roughly 80 miles from Duluth’s sister city of Superior, Wis., to parts of the Apostle Islands, including Long Island, just 10 miles from downtown Ashland. It lasted about five days, growing intensely enough for green water to reach the shoreline.The drivers of the blooms since 2012 appear to include big storm events, with the blooms following after a lag of several weeks. Higher stream flows mean elevated delivery of nitrogen, phosphorus and other nutrients. The blooms appear in the warm-weather months, as is typical elsewhere, but also in years when cumulative temperatures, as measured in degree days, are elevated overall. Lafrancois told the IJC that lab tests subjecting the algae to different temperatures, nutrient concentrations and water types showed the blooms may originate from upland sources.The particular strain of blue-green algae, or cyanobacteria, implicated in these blooms, is Dolichospermum lemmermannii. It can produce several serious toxins, though none have been detected at hazardous levels in the Superior blooms as yet. On the other hand, Lafrancois noted, the sample sizes were small, the list of toxins tested was short, and cyanobacteria produce many toxins for which no health standard has been established. At this point, more blooms are expected, most likely as recurring but unpredictable events. It’s a lesson in Superior’s vulnerability. “This is still a big, fabulous, gorgeous, immense lake,” Lafrancois told the IJC. “But it’s not immune to the types of environmental changes that are occurring elsewhere in the Great Lakes.”
Contaminated Flows into Lake Superior from the Ashland Sewer SystemThe City of Ashland’s sanitary sewer system has struggled with storm water overflows for years. Public Works Director John Butler told the IJC that it’s a matter of simple math: The city’s wastewater treatment plant’s capacity is 3.84 million gallons, nearly four times the average daily flow of just 1 million. It also has an 8.5 million-gallon overflow basin, for a total capacity of 12.3 million gallons. But storms routinely push the 24-hour flow
above 20 million gallons. When this happens, the system experiences “sanitary sewer overflow” – a technical term for mixing storm water with toilet flushings, and discharges from dishwashers, laundry, showers, etc., all of which enter Chequamegon Bay without required treatments. In 2018, the Ashland Daily Press used a Freedom of Information Act request to access records showing that at least 19 discharges of untreated sewage, totaling more than 75 million gallons, flowed into the bay in recent years. That’s illegal, and earned the city’s wasterwater utility three violation notices from the state. Those discharges prompted concerns from area residents that the overflows were leading to beach closures and other water quality problems, which have yet to be verified. Much of the problem with the overflow issue involves the city’s aging sanitary and storm sewer infrastructure. The city has about 60 miles of sewer line, a quarter of which is over 100 years old. Many sections are made of leaky, vitrified clay, and long past its serviceable life. The cost to excavate and replace old pipe, of course, is sobering and many other communities across the country face the same problem. City officials have repeatedly expressed concerns that Ashland simply does not have the resources to undertake a major overhaul, and that the city might even have trouble coming up with the matching funds required to qualify for government aid.
Controlling Agricultural Runoff Amid a Trend Toward Larger FarmsSoils throughout much of the Ashland region have a heavy clay content, whose relative impermeability to rainfall makes for bigger, faster runoff flows — even before the recent trend of increasing rainfall and intensifying storm events. These soil conditions also pose a challenge to traditional agricultural cultivation and — along with unfavorably cold temperatures relative to other regions — have tended to keep farm sizes somewhat smaller and “a little lighter on the landscape,” Jason Fischbach, agricultural agent for
the University of Wisconsin-Madison Division of Extension, told the IJC. Compared to three ag-heavy Wisconsin counties on Lake Michigan, the four counties along the south shore of Lake Superior have about one-twentieth the number of cows, pastured on about five times as much acreage per animal — basically the opposite of the modern, concentrated
livestock operation. The landscape also retains more woodland and pastured acreage, with less conversion to the row-cropping of annual small grains, corn and
John Butler, City of Ashland, Wis.
billkelleyphoto.com
Jason Fischbach, UW Extension
billkelleyphoto.com

8 Mary Griggs Burke Center for Freshwater Innovation
soybeans. Still, existing runoff patterns have degraded water quality with sediment and nutrients, especially phosphorus and nitrogen — which promote algae growth — not to mention the potential threat posed by contamination from E. coli bacteria from livestock operations. Now the area’s difficult, labor-intensive farming conditions are combining with slumping land values to drive a sharp decline in small farming operations generally, and dairy especially. Bayfield County, west of Ashland, had well over 100 dairy farms in 1992; today it has around 20. Iron County, east of Ashland, has one. Mostly this is happening as local farmers buy out neighbors and expand their acreage. But the situation is also a magnet to outside corporations who see opportunities for assembling massive, concentrated livestock operations on a scale the south shore of Lake Superior has not yet seen.For example, in 2015 Reicks View Farms of Iowa proposed to raise 26,000 hogs in a CAFO in the Fish Creek watershed, about eight miles from Lake Superior’s Chequamegon Bay. The proposed “Badgerwood” project wouldn’t raise an eyebrow in Iowa, but it would have been the largest hog operation in Wisconsin and one of the first CAFOs in the Lake Superior basin — producing, storing and spreading 6.8 million gallons of manure per year on predominantly clay soil. That proposal now appears to have been abandoned, in Fischbach’s view, because the likely requirements to manage phosphorus pollution from associated row crop fields would have limited the operation’s ability to produce enough animal feed. The truly difficult challenge of controlling runoff and pollution from clay soils, Fischbach explained, is that traditional methods, which work well elsewhere — such as reducing or eliminating tillage, planting cover crops and buffer strips, a variety of precision management techniques in fertilizer application and drainage control — are inadequate in this region. The most promising path to renewing the regional farm economy while preserving water quality, he said, is to convert a lot of land from annual crops to perennial plantings with deep root structures and simpler nutrient needs. An especially promising approach called agroforestry mixes grassy forages with woody shrubs and trees. These approaches are ready for field-scale research and demonstration projects to show farmers they can realize income from working outside the realm of conventional agriculture. “Our focus needs to be not so much on mitigating annual row crops,” Fischbach said. “That’s the approach we’ve taken forever and look what’s happened to our 303(d) list [of pollution-impaired waterways]. It gets longer, and longer, and longer, and longer.”
Mines and Pipelines in the Headwaters of Lake Superior TributariesAmong the resources of the Ashland region that attract industrial interest, and raise water quality concerns, are the iron deposits of the Penokee/Gogebic Range, which runs roughly 80 miles from Lake Namekagon in Bayfield County, southwest of Ashland, into Michigan’s Upper Peninsula, east of Ashland. The iron here is in a form called magnetite, which is a lower-grade ore that is typically mined in large, open pits. In 2011, Gogebic Taconite, LLC proposed a massive, open-pit mine in the Penokee/Gogebic Range, similar in size to some of the largest on Minnesota’s Mesabi Range.The first potential problem with that project, Northland College Geoscience Professor Tom Fitz told the IJC, is that “you can’t dig a hole in the ground that’s 4.5 miles long and 1,000 feet deep without a big effect on surface water and groundwater.” The area contains a large number of wetlands, and although the company said it would not be mining in those areas, Fitz noted, the wet areas would have become the repository for piles of waste-rock tailings. These ores contain a lot of iron pyrite, a sulfide mineral which reacts with water to release sulfuric acid. There were concerns that acid-mine drainage would have flowed to the Bad River, potentially poisoning the Great Lakes basin’s largest wild rice beds, located where the river approaches Lake Superior. Moreover, some portions of the proposed pit were rich in amphibole minerals, which form the long, needle-like fibers characteristic of asbestos. “There has not been a mine anywhere in the world that we know of,” Fitz said, “where asbestiform minerals of this type have been mined and people have not died.” The mine project was shelved in 2015 due to concerns about impacts on wetlands and the threat of litigation.But mining projects tend to fade as prices in the metals markets fall, and then they often revive when prices rise, as Bad River tribal chairman Mike Wiggins, Jr. pointed out. He said his reservation feels under perpetual pressure from projects like Gogebic Taconite, the Badgerwood CAFO, and increasing concerns about Enbridge Inc.’s embattled Line 5 pipeline, which transports petroleum products through northern Wisconsin and Michigan to Sarnia, Ont., on the St. Clair River north of Detroit. This is the same aging pipeline that has caused so much concern in the state of Michigan, where it lies on the bottom of the Straits of Mackinac, between the state’s upper and lower peninsulas. But hundreds of miles to the west, the pipeline also crosses the Bad River Reservation. In the summer of 2019, a section was found to have been “unburied” by watery erosion,
Michael Wiggins, Jr., Bad River Band of the Lake Superior Tribe of Chippewa Indians
billkelleyphoto.com
Tom Fitz, Northland College
billkelleyphoto.com
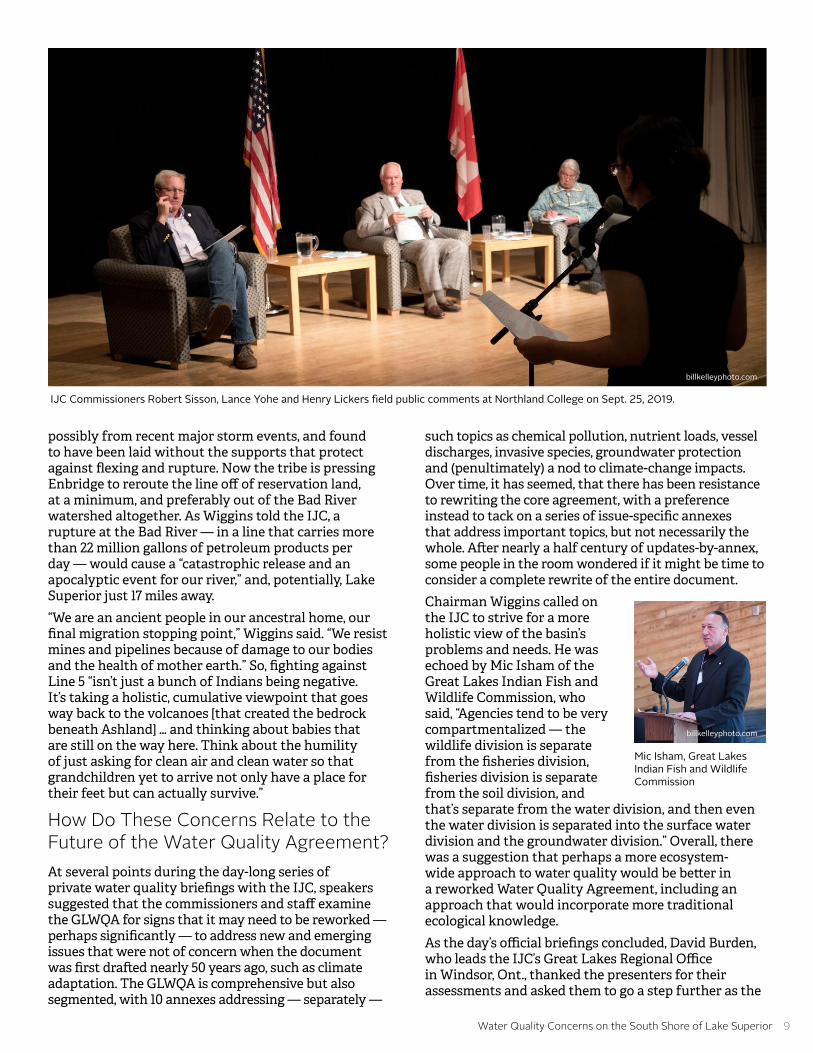
Water Quality Concerns on the South Shore of Lake Superior 9
possibly from recent major storm events, and found to have been laid without the supports that protect against flexing and rupture. Now the tribe is pressing Enbridge to reroute the line off of reservation land, at a minimum, and preferably out of the Bad River watershed altogether. As Wiggins told the IJC, a rupture at the Bad River — in a line that carries more than 22 million gallons of petroleum products per day — would cause a “catastrophic release and an apocalyptic event for our river,” and, potentially, Lake Superior just 17 miles away. “We are an ancient people in our ancestral home, our final migration stopping point,” Wiggins said. “We resist mines and pipelines because of damage to our bodies and the health of mother earth.” So, fighting against Line 5 “isn’t just a bunch of Indians being negative. It’s taking a holistic, cumulative viewpoint that goes way back to the volcanoes [that created the bedrock beneath Ashland] … and thinking about babies that are still on the way here. Think about the humility of just asking for clean air and clean water so that grandchildren yet to arrive not only have a place for their feet but can actually survive.”
How Do These Concerns Relate to the Future of the Water Quality Agreement?At several points during the day-long series of private water quality briefings with the IJC, speakers suggested that the commissioners and staff examine the GLWQA for signs that it may need to be reworked — perhaps significantly — to address new and emerging issues that were not of concern when the document was first drafted nearly 50 years ago, such as climate adaptation. The GLWQA is comprehensive but also segmented, with 10 annexes addressing — separately —
such topics as chemical pollution, nutrient loads, vessel discharges, invasive species, groundwater protection and (penultimately) a nod to climate-change impacts. Over time, it has seemed, that there has been resistance to rewriting the core agreement, with a preference instead to tack on a series of issue-specific annexes that address important topics, but not necessarily the whole. After nearly a half century of updates-by-annex, some people in the room wondered if it might be time to consider a complete rewrite of the entire document.Chairman Wiggins called on the IJC to strive for a more holistic view of the basin’s problems and needs. He was echoed by Mic Isham of the Great Lakes Indian Fish and Wildlife Commission, who said, “Agencies tend to be very compartmentalized — the wildlife division is separate from the fisheries division, fisheries division is separate from the soil division, and that’s separate from the water division, and then even the water division is separated into the surface water division and the groundwater division.” Overall, there was a suggestion that perhaps a more ecosystem-wide approach to water quality would be better in a reworked Water Quality Agreement, including an approach that would incorporate more traditional ecological knowledge. As the day’s official briefings concluded, David Burden, who leads the IJC’s Great Lakes Regional Office in Windsor, Ont., thanked the presenters for their assessments and asked them to go a step further as the
IJC Commissioners Robert Sisson, Lance Yohe and Henry Lickers field public comments at Northland College on Sept. 25, 2019.
billkelleyphoto.com
Mic Isham, Great Lakes Indian Fish and Wildlife Commission
billkelleyphoto.com
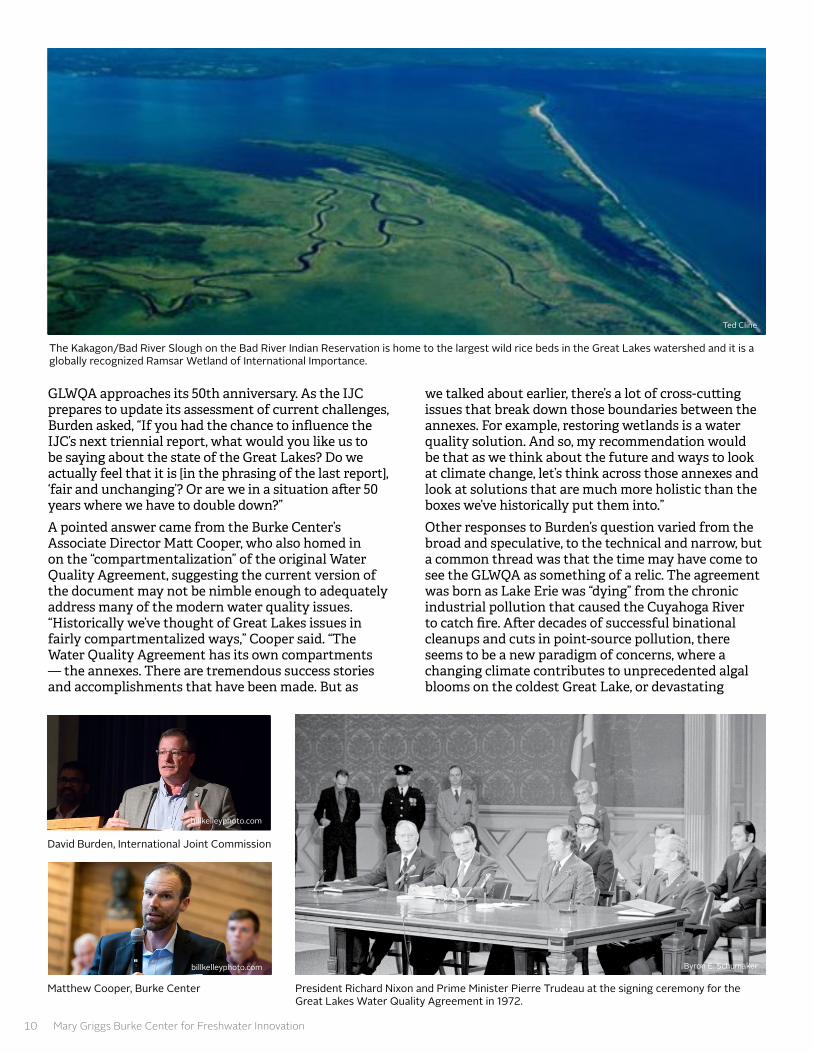
10 Mary Griggs Burke Center for Freshwater Innovation
GLWQA approaches its 50th anniversary. As the IJC prepares to update its assessment of current challenges, Burden asked, “If you had the chance to influence the IJC’s next triennial report, what would you like us to be saying about the state of the Great Lakes? Do we actually feel that it is [in the phrasing of the last report], ‘fair and unchanging’? Or are we in a situation after 50 years where we have to double down?” A pointed answer came from the Burke Center’s Associate Director Matt Cooper, who also homed in on the “compartmentalization” of the original Water Quality Agreement, suggesting the current version of the document may not be nimble enough to adequately address many of the modern water quality issues. “Historically we’ve thought of Great Lakes issues in fairly compartmentalized ways,” Cooper said. “The Water Quality Agreement has its own compartments — the annexes. There are tremendous success stories and accomplishments that have been made. But as
we talked about earlier, there’s a lot of cross-cutting issues that break down those boundaries between the annexes. For example, restoring wetlands is a water quality solution. And so, my recommendation would be that as we think about the future and ways to look at climate change, let’s think across those annexes and look at solutions that are much more holistic than the boxes we’ve historically put them into.” Other responses to Burden’s question varied from the broad and speculative, to the technical and narrow, but a common thread was that the time may have come to see the GLWQA as something of a relic. The agreement was born as Lake Erie was “dying” from the chronic industrial pollution that caused the Cuyahoga River to catch fire. After decades of successful binational cleanups and cuts in point-source pollution, there seems to be a new paradigm of concerns, where a changing climate contributes to unprecedented algal blooms on the coldest Great Lake, or devastating
President Richard Nixon and Prime Minister Pierre Trudeau at the signing ceremony for the Great Lakes Water Quality Agreement in 1972.
David Burden, International Joint Commission
Matthew Cooper, Burke Center
The Kakagon/Bad River Slough on the Bad River Indian Reservation is home to the largest wild rice beds in the Great Lakes watershed and it is a globally recognized Ramsar Wetland of International Importance.
Ted Cline
billkelleyphoto.com
billkelleyphoto.com
Byron E. Schumaker

Water Quality Concerns on the South Shore of Lake Superior 11
blooms on Lake Erie, the warmest Great Lake — such as those in 2014 that prompted officials to cut off drinking water access for days to half a million people in Toledo.Back in the 1970s, one of the biggest concerns in Lake Superior was controlling the sea lamprey that threatened native fisheries. Federal officials in the United States and Canada worked together to contain the lamprey problem and confront many other environmental issues in the Great Lakes. But in recent years, that binational commitment does not seem as coordinated or strong as it was when the Water Quality Agreement was created. This transition in the binational water quality relationship has occurred as climate change is bringing massive storms, amplified runoff, infrastructure collapse and potentially toxic algal blooms to south shore communities of a lake once believed to be immune from such threats. How should the federal governments tweak the Water Quality Agreement to help tackle the algal-bloom era on Lake Superior and the algal-bloom era on Lake Erie — two very different lakes that are part of the same complex binational ecosystem? Where old patterns are giving way to a new normal, the situation may require not just redoubled efforts but perhaps completely revising instruments that help design and direct actions to protect water quality — not just along the south shore of Lake Superior but throughout the entire Great Lakes system. In other words, tweaking may not be enough. Perhaps a thoroughly revised Water Quality Agreement could also reinvigorate the binational water quality relationship, bringing new attention and new vigor to the complex Great Lakes water quality challenges of the 21st century. But for the next generation of water quality stewards at Northland College — and throughout the watershed — the situation will require more than just vigor. It will require tangible binational action that leads to measurable and significant improvements to “the chemical, physical and biological integrity of the waters of the Great Lakes.”
The Apostle Islands National Lakeshore is one of the most popular tourist destinations on the south shore of Lake Superior.

ASHLAND MEETING PRESENTERS & CONTRIBUTORSPeter Annin, Director, Mary Griggs Burke Center for Freshwater Innovation, Northland College
John Butler, Director of Public Works, City of Ashland, Wis.
Dr. Matthew Cooper, Associate Director, Mary Griggs Burke Center for Freshwater Innovation, Northland College
Valerie Damstra, Operations Manager, Mary Griggs Burke Center for Freshwater Innovation, Northland College
James Dunn, Hydrogeologist, Wisconsin Department of Natural Resources (retired)
Jason Fischbach, Agricultural Agent, Bayfield/Ashland Counties, University of Wisconsin-Madison Division of Extension
Dr. Tom Fitz, Professor of Geoscience, Northland College
Matthew Hudson, Associate Director, Mary Griggs Burke Center for Freshwater Innovation, Northland College
Michael Isham, Jr., Executive Administrator, Great Lakes Indian Fish and Wildlife Commission
Dr. Brenda Moraska Lafrancois, Aquatic Ecologist, Midwest Region, National Park Service
Linda Nguyen, Environmental Director, Red Cliff Band of Lake Superior Chippewa
Aidan Reilly, Research Specialist, Mary Griggs Burke Center for Freshwater Innovation, Northland College
Michael Wiggins, Jr., Chairman, Bad River Band of the Lake Superior Tribe of Chippewa Indians
INTERNATIONAL JOINT COMMISSION PARTICIPANTSHenry Lickers, Canadian Commissioner, International Joint Commission
Robert Sisson, U.S. Commissioner, International Joint Commission
Lance Yohe, U.S. Commissioner, International Joint Commission
Raj Bejankiwar, Physical Scientist, International Joint Commission, Great Lakes Office
David Burden, Director, International Joint Commission, Great Lakes Office
Matthew Child, Physical Scientist, International Joint Commission, Great Lakes Office
Sally Cole-Misch, Public Affairs Officer, International Joint Commission, Great Lakes Office
Sarah Lobrichon, Public Affairs Advisor, International Joint Commission, Ottawa Office
Allison Voglesong Zejnati, Video-Communications Specialist, International Joint Commission, Great Lakes Office
WHITE PAPER TEAMPeter Annin, Editor
Ron Meador, Author
Aidan Reilly, Emma Holtan, Research
Dr. Matthew Cooper, Valerie Damstra, Matthew Hudson, Reviewers
Jerry Lehman, Layout and Design
Julie Buckles, Communications Director
Demeri Mullikin, Production Editor
Northland College would like to thank Debbie Cervenka of Duluth, Minn., and George and Jane Shinners of Antigo, Wis., for generously supporting the 2019 Water Summit and white paper.
MARY GRIGGS BURKE CENTER FOR FRESHWATER INNOVATIONNORTHLAND COLLEGE 1411 Ellis Avenue Ashland, Wis. 54806 northland.edu/sustainability/mgbc 715-682-1699
The Northland College campus with Chequamegon Bay in the background.
Disclaimer: This white paper is a nonpartisan endeavor authored and produced by Northland College. While the white paper is meant to reflect the Water Summit discussions that took place on Sept. 25, 2019, the analysis and conclusions herein were produced by Northland College. None of the participants in the Water Summit, nor any of the funders, necessarily endorses any of the analysis or specific conclusions contained in this document. Northland College is solely responsible for this content.
Northland College integrates liberal arts studies with an environmental emphasis, enabling those it serves to address the challenges of the future.

Appendix C. Phase I Feasibility Study
Lake Superior Science Center Feasibility Study Phase II Page C-1

Feasibility Study for
Lake Superior Science Center (Phase 1)
June 6, 2019 Prepared for the
Ashland Area Development Corporation Ashland WI
By
604 Wilson Avenue Menomonie, WI 54751

Lake Superior Science Center Feasibility Study
Committee Chair:
Vice Chair:
Secretary/Treasurer:
Pat Kinney
Betsey Harries
Pete Mann
Committee Members: Mike Bailey
Cliff Grand
Susan Hedman
Mike Hoff
Richard Ketring
Dale Kupczyk
The Committee wishes to acknowledge the following individuals:
Congressman David Obey for his leadership in securing funding for the USGS Research Vessel Kiyi and docking facilities located in Ashland, Wisconsin. The RV Kiyi is the flagship fishery research vessel on the Great Lakes. Congressman Obey’s vision included a Research Center to support research on the world’s greatest lake.
Owen Gorman for his contributions over the past 20 years in support of this vision. Mr. Gorman’s role was that of a resource; to provide rationale, vision, correction, and encouragement.
Ashland Area Development Corporation
Executive Director: Betsey Harries
ACKNOWLEDGEMENTS

Lake Superior Science Center Feasibility Study
Donors and Grantors This report is funded in part by the Wisconsin Department of Administration; the Wisconsin
Coastal Management Program; the National Oceanic and Atmospheric Administration, Office for Coastal Management under the Coastal Zone Management Act: Grant # NA15NOS4190094;
Wisconsin Economic Development Corporation; the Business Leaders Fund of the Duluth Superior Area Community Foundation; and the generous contributions of the following
organizations and individuals:
Apostle Islands Sport Fishermen’s Association City of Ashland, Wisconsin
Mike Bailey Bayfield Chamber of Commerce
Duluth Superior Area Community Foundation Enbridge Energy
Florio Wealth Advisors Betsey Harries Susan Hedman Richard Ketring
Pat Kinney Jeffrey and Debra Lewis
Charles Madenjian Pete Mann
National Oceanic and Atmospheric Administration North Wisconsin Rod & Gun Club
Technology Council Innovation Network – Lake Superior Chapter James & Courtney Tucker
Wisconsin Coastal Management Program Wisconsin Economic Development Corporation
Xcel Energy

Lake Superior Science Center Feasibility Study
Table of Contents
Executive Summary ..........................................................................................................1 I. Project Overview ..............................................................................................................2 II. Feasibility Process ............................................................................................................3 III. Potential Long-Term Tenants ...........................................................................................4 IV. Interviews ..........................................................................................................................4 V. Current Facility .................................................................................................................5 VI. Proposed Site Location and Conditions ............................................................................5 VII. Federal Solicitation Process ..............................................................................................6 VIII. Hypothetical Scenario – Research Institution in Partnership with USGS and FWS
Including Public Space and Café ......................................................................................7 IX. Next Steps .......................................................................................................................11
Appendices Appendix A – Existing Site Conditions Appendix B - Maps Appendix C - Proforma Scenarios Appendix D - Final Phase II Environmental Site Assessment Report, Ashland Ore Dock

Lake Superior Science Center Feasibility Study
Page 1 of 11
Executive Summary This study examined establishing the Lake Superior Center for Fisheries, Aquatic Science and Education (Center). The vision for the Center is a facility in Ashland, Wisconsin, on the shore of Lake Superior where scientists engage in research to monitor, restore, and protect resources in the Lake Superior basin. The Center will support public education and outreach related to resources in the basin. It is envisioned that the Center will be located on a parcel of land owned by the City of Ashland that is adjacent to Lake Superior and is in close proximity to the dock where the U.S. Geological Survey’s Research Vessel Kiyi is moored, a facility capable of hosting visiting research vessels from other organizations and agencies. The proposed location is within the Ashland Ore Dock Project Area, an area that the City of Ashland is redeveloping. The study began by examining an unsuccessful effort in 2005 to obtain Congressional funding for a Research Center for USGS on the proposed site. The USGS operates the Lake Superior Biological Station that was established in 1957 in Ashland, Wisconsin, to provide science-based monitoring and research on the fish communities of Lake Superior in support of the U.S.-Canada Bi-National Program to conserve, restore, and manage the fish communities of the Great Lakes. The Station is a component of the Great Lakes Science Center located in Ann Arbor, Michigan. The Center focuses its research on the aquatic resources of the Great Lakes and administrates stations on each of the Great Lakes. The Bi-National Program operates under the auspices of the 1955 International Convention on Great Lakes Fisheries and the 1997 Joint Strategic Plan for Management of Great Lakes Fisheries and is facilitated by the Great Lakes Fishery Commission. Early in the study, it was determined that it is very unlikely that the Center would be funded through Congress. Further, the Department of Interior (DOI) prefers that the Ashland offices of the United States Geological Survey (USGS), Fish and Wildlife Service (FWS), and National Park Service (NPS) be located within the same facility. The study examined relocating all of USGS, FWS, and NPS to the Center and found that the DOI was not likely to support a new Center due to current contracts that didn’t include a stated need to be closer to Lake Superior. The current facilities are more than a mile from the dock for the Kiyi. The DOI, however, has a provision to consider new facilities that are under 20,000 square feet. That would be sufficient space to relocate USGS and/or FWS. To gain support from DOI, it will be highly desirable to include a research institution. USGS has relationships with research institutions at other facilities but lacks such a relationship at the facility in Ashland, WI. A research institution would have the capacity to attract sources of funding to expand research on Lake Superior.

Lake Superior Science Center Feasibility Study
Page 2 of 11
The study determined a research institution is needed as a catalyst to initiate establishment of the Center. The research institution would determine if it has an interest in engaging USGS in the establishment of the Center. The next steps in establishment of the Center are:
1. City of Ashland formally designates site near the Kiyi dock for development of the
Center 2. Outreach to educational/research institutions to determine their interest in the Center 3. Outreach to state and federal agencies that provide grants that could be used to fund
the Center
I. Project Overview The Ashland Area Economic Development Corporation’s Lake Superior Center (LSC) Committee commissioned this feasibility study for the establishment of the proposed Lake Superior Center for Fisheries, Aquatic Science, and Education Center in Ashland, Wisconsin.
The primary mission of the Center is to focus on advancing research and monitoring of the Lake Superior ecosystem and to foster education and awareness of the natural, social, cultural, and economic resources of the Lake Superior basin.
The primary goals of the Center are:
1. Support sound science that will provide the best information for conservation and
management of the natural resources of the Lake Superior Basin Ecosystem 2. Provide opportunities for inter-agency collaboration and knowledge sharing 3. Inform the public of science and management programs and the current knowledge
base of the ecosystem 4. Provide opportunities for public participation in science, policy, conservation, and
management of the ecosystem
The feasibility study’s goal is to leverage community assets in the creation of an integrated cooperative research center involving national, state, provincial and regional agencies, academic institutions, and tribal resources in research for the ecosystems in the Lake Superior basin. The feasibility study looks at the demand for such a space by working with existing federal agencies, as well as state and regional entities, that could benefit from co-locating in a modern space that offers direct access to Lake Superior while matching the current budgets of the primary tenants with the economic realities of constructing and maintaining the Center.

Lake Superior Science Center Feasibility Study
Page 3 of 11
II. Feasibility Process The Committee identified the need to commission a feasibility study to determine the viability of the Center and to establish a road map to achieve the Center’s goals. The steps were designed to guide the process realizing that, as the feasibility study progressed, the approach may need to be altered in order to respond to information obtained. This flexibility helped to ensure that the study was built on sound data while making efficient use of funding. The steps used to achieve this are outlined below.
1. Identify shared objectives and interests of potential long-term tenants of the Center.
a. Undertake a needs assessment of what would be required of each to participate in the development and operation of the Center;
b. identify impediments that would prevent each from collaborating with the Center; c. provide copies of current local lease agreements of each primary stakeholders
contacted.
2. Determine the amount of space that should be devoted to additional short-term tenants of the Center.
3. Program the space of the Center (prepare a conceptual plan) that would accommodate
the Center’s long-term and short-term tenants and provide facilities for research, education, conferences, and public events.
4. Develop a preliminary estimate of cost for constructing and operating the Center.
a. Develop a second alternative preliminary estimate of cost for constructing and operating the Center with the incorporation of green building design standards.
5. Prepare a pro-forma for the construction and operation of the Center.
a. Prepare a second pro-forma for the construction and operation of the Center constructed as a showcase of green building best practices; provide a percentage of savings in operating costs that should be expected for each green building attribute incorporated into the design.
6. Identify sources of local, regional, national and international financial, and
programmatic support for cooperative research, management, and educational programs of the Center.
The steps were designed to guide the process realizing that, as the feasibility study progresses, the approach may need to be altered in order to respond to information. This flexibility will help ensure that the study is built on sound data and limited funds were not squandered.

Lake Superior Science Center Feasibility Study
Page 4 of 11
III. Potential Long-Term Tenants The LSC Committee identified the U.S. Geological Survey (USGS), U.S. Fish and Wildlife Services (FWS), and National Park Service (NPS) as potential long-term tenants of the Center. All three bureaus fall under the jurisdiction of the U.S. Department of the Interior. Currently, the three bureaus are co-located at 2800 Lake Shore Drive East, Ashland, WI. The LSC Committee has expressed its desire that, at a minimum, the USGS would need to be a part of the proposed Center for the project to move forward.
IV. Interviews In-person interviews and facility tours were held with the USGS, FWS, and NPS. The interviews centered on how each agency utilizes their current space and what modifications, space needs, equipment, production flow, etc., they would prefer to see in the future. In summary, all three agencies stated that they currently have adequate space albeit with shortcomings in the following areas: 1. The amount of vehicle/garage storage 2. The lack of large group meeting rooms with video conference capabilities and
electronic boards 3. Inadequate or no break room space 4. No secured monitored entrance 5. Inadequate bandwidth hindering research abilities 6. Multiple chest freezers throughout the facility that not only take up valuable floor
space but are not on a backup generator. Due to a lack of funding, the agencies have managed to address some of the above-mentioned limitations by: 1. Utilizing the Northern Great Lakes Visitor Center for large group meetings and
training sessions. This facility has an auditorium with up-to-date A/V communications technology
2. Using their current meeting rooms as break room space 3. Storing some of their vehicles outdoors while storing others in a barn on the
Whittlesey Creek Refuge at the west side of Chequamegon Bay (about fifteen minutes away)
4. Planning for a walk-in style cooler that could be shared by all three agencies and allow for better utilization of garage storage space.

Lake Superior Science Center Feasibility Study
Page 5 of 11
When asked about the need for interpretive learning space, the interviewees all stated that it was rare to have visitors at the current facility and that any public educational opportunities that the agencies might provide would be best served at the Northern Great Lakes Visitor Center. On the issue of educational partnerships, all three agencies stated that they do work with summer interns; however, the methodology on how the internships are coordinated and implemented seem to be disjointed and not coordinated. In many cases, the agencies seem to wait for higher educational institutions to contact lead scientists at the corresponding agencies versus having a “contractual relationship” between the entities. This could be due to the nature of the work and the uncertainty of annual funding levels.
V. Current Facility Currently, the total leased space for all three tenants is approximately 27,500 SF of building space on approximately 96,200 SF area of land, or 2.2 acres. The current full-service lease of $13.39 SF was executed by GSA in 2016. The 10-year lease is broken into a 5-year firm (expires in 3 yrs.) and a 5-year option. A full-service lease typically refers to a leasing agreement in which the owner (lessor) is responsible for covering the building’s operating expenses in the rent. Those expenses that are covered in the rent can include, but are not limited to, real property taxes, insurance, utilities, maintenance, etc. So, to be clear, the full-service rate of a commercial property lease covers building operating costs in the rent. Current staffing levels between the three entities is approximately 38 full-time staff with 9 of those positions filled by temporary contract employees. Additionally, during the summer the three agencies host approximately 9-10 interns from around the country. • USGS: 8 full-time staff, 3 temporary contractors and 3-5 part-time students • FWS: 10 full-time staff, 6 full-time term staff, 3 summer interns • NPS: 11 full-time staff, 2 part-time, 2-3 interns (contract workers are off-site)
Out of the three agencies interviewed, the USGS was the least optimistic relative to staffing and funding. At the time of the interview, the USGS did not see any increase in staffing for the foreseeable future (2-6 years) and envisions a situation where additional staffing would be switched from permanent to temporary contractors.
VI. Proposed Site Location and Conditions The LSC Committee working in conjunction with the City of Ashland has identified a potential site for the proposed Lake Superior Science Center. The site comprises a full City block and is located directly across from the proposed Ore Dock redevelopment on Chequamegon Bay, Lake Superior (“the bay”). The site is bounded by Water St., Stuntz

Lake Superior Science Center Feasibility Study
Page 6 of 11
Ave., 7th Ave. and St Claire St. and is currently owned by the City of Ashland. The surrounding uses are predominantly residential in nature with a few undeveloped parcels on the east side. Please see Appendix A – Existing Site Conditions and Appendix B – Maps.
VII. Federal Solicitation Process A first step in considering locating one or all of USGS, FWS, and NPS in the Center is understanding the Federal solicitation process. Typically, the Government Services Administration (GSA), the federal entity responsible for property acquisition and leases, would draft an RFP seeking new space for a federal Agency/Bureau with criteria that would then be run through an open bid process. In most cases, if all aspects of the criteria are met, then the low bid is accepted. GSA is currently under rules that severely restrict their ability to seek new construction. Therefore, their priority is to use existing structures. In some cases, a sole source solicitation can be requested for “special cases.” The USGS has special solicitation authority granted to it by Congress. This authority, if blessed by the GSA, enables USGS to procure space directly. The USGS can use this authority if it is: 1. Directly leasing under 20,000 SF of space. 2. Entering into a cooperative agreement/lease with an educational entity, such as
university. The drawback to a cooperative agreement is that it has to remain non-binding, meaning the USGS could vacate the space at any time. This approach could be problematic as many property owners need binding leases to ensure project cash flow.
Since the USGS, FWS, and NPS collectively need more than the 20,000 SF of space, and the GSA is restricted in its ability to seek new construction to meet its space needs, it was determined that relocating all the federal agencies (USGS/FWS/NSP) to a new building is not feasible for the foreseeable future. Based on this, there remain two alternatives for a Center to proceed as proposed: Alternative 1: A yet to be identified research institution takes the initiative to be a tenant in the Center and then seeks participation from USGS/FWS as cooperative tenants, or USGS requests GSA approval for a direct lease assuming the USGS and FWS only need 20,000 SF or less of combined space in the Center. Alternative 2: An institution such as four-year college or non-profit would fund the development of the Center and oversee it. To support research, the Center would have enough space and

Lake Superior Science Center Feasibility Study
Page 7 of 11
equipment to support the research conducted through grants. The Center may also incorporate public space to support education along with retail space.
VIII. Hypothetical Scenario – Research institution in partnership with USGS and FWS including public space and cafe
A. Determination of Space Needs Based on the potential needs of a yet to be identified research institution and the needs of USGS and/or FWS, the Center would need to provide, at a minimum: office space, lab space, meeting rooms, shared break room, collaborative space, vehicle and boat storage, cooler/freezer storage, and maintenance/repair/workshop space. Finally, to meet the objectives of the Center, the new space would also need to incorporate interpretive and large group meeting space. To support the needs listed above, the Center is envisioned to be approximately 25,000 – 30,000 +/- SF. The new structure will need to be located on the site to effectively screen equipment and vehicles used in support of the tenant’s daily actives, along with staff parking, from the surrounding residential units and the public arterial access to the Ore Dock. It is also being proposed to incorporate the garage within the building and site design to limit the amount of equipment that would be in the public view. The concept plan contemplates a portion of the proposed structure could be below finished grade and/or some of the structure may be multi-story. This would be done to maximize the structures on the proposed site while creating a statement that draws the eye from the Ore Dock development to the Center. Additionally, due to the proposed site being in close proximity to the water and on a hill, the design could take advantage of the views of Lake Superior, the USGS vessel, and the Ore Dock development by ensuring pedestrian connections and design features that contemplate the other projects.
B. Proposed Conceptual Site Plan and Building Layout The proposed site plan and building layout were developed after examining the physical characteristics of the site, surrounding uses, existing transportation infrastructure, utilities, City of Ashland zoning code, and the ultimate needs of the tenants of the Center along with the desire for public space. Other factors taken into consideration were the property’s location to the surrounding area and amenities such as the USGS research vessel, the Ore Dock project, Kreher RV Camp, and the proposed park at the former Northern States Power Company/Xcel site. The conceptual site plan and conceptual building layout were developed with the goal of maximizing the land and space while ensuring that the Center was affordable to construct. Please see Appendix C – Conceptual Site Plan and Building Layout.

Lake Superior Science Center Feasibility Study
Page 8 of 11
C. Proforma Analysis Several financial scenarios (proformas) were run to determine the viability of the Center and how to best fund the construction of the Center. The following assumptions were used in the creation of the final proforma. • The Center would be owned by yet to be determined entity • The Center would pay taxes at the City’s mill rate of $24.84 per $1,000 in value • Assessed value generated by the Center would go back into the project via TIF
assistance • Lease rates for the USGS and FWS would not exceed the current lease rate of
$13.39 SF • Total leased space to the USGS and FWS would not exceed 20,000 SF in order to
stay under the solicitation rules that enabled the USGS to procure space directly. • Other tenant space was determined using 120 SF per office space (which would
include shared common space). For example, 4,500 SF of research institution space would accommodate an estimated 37 individuals.
D. Estimated Space Breakdown and Estimated Construction Costs The numbers used throughout the scenario process (building layout, tenant mix, and proforma) are estimates based on conceptual tenant mix and tenant needs. No tenants have been identified as part of this process. However, to determine the feasibility of the Center estimated numbers were used including square foot numbers for each of the potential tenants that might locate in the Center. The total Center space was broken down into the following subgroup space: Research Institution Space, Garage, Storage, Office, Lab, Auditorium/Shared, Café/Kitchen. Preliminary construction cost estimates were assigned to each subgroup. As the project moves into the design phase, detailed costs estimates should be run to further refine the costs. Rates used in the analysis are as follows.
Subgroup Space Estimates SF construction cost (2018)
Research Institution Space $180 Garage $150 Storage $100 Office $180 Lab $225 Auditorium/Shared $225 Café/Kitchen $225

Lake Superior Science Center Feasibility Study
Page 9 of 11
The subgroup spaces were then assigned a square foot number based on the needs of the long-term tenants. To remain below the 20,000 SF target, space such as meeting rooms and restrooms have been moved into the Auditorium/shared space. Additionally, breakroom space has been removed from the tenant space and combined with the auditorium/shared space and is envisioned to be part of a café area that would serve prepared food as well as allow for tenants to bring food to be consumed in a shared eating environment. Finally, kitchen space has been carved out as part of the café which would be leased out, creating additional revenue. Each tenant was then assigned a square foot number by subgroup space type that would fall under their respected lease.
Tenants Garage Storage Office Lab Auditorium Shared Space
Café Kitchen
Total
Research Institution
4,500 4,500
USGS 3,470 2,248 2,242 526 8,486 FWS 4,200 2,248 2,242 526 9,216 Auditorium Shared Space
2,925 2,925
Café/Kitchen 600 600
TOTAL 25,727
Based on the square feet for each subgroup space type, the need of the tenant, and the estimated square foot cost to construct, a Preliminary Construction Cost was derived. A 10% contingency and soft cost estimate of 8% to cover design, bidding, and construction management was added to get to the Total Project Cost. Finally, the estimated taxes that the Center would pay assuming a 75% assessed value was added to the final number to determine the annual payment by each tenant type. Note, taxes were prorated so that no taxes were added to the auditorium/shared space annual payment. Finally, Tax Increment generated by the project is then brought into the proforma to offset the cost of the auditorium/shared space. Any remaining costs not covered by the tax increment is offset by rents paid by the other tenants and the café.

Lake Superior Science Center Feasibility Study
Page 10 of 11
E. Scenario The included scenario is designed to provide one potential scenario of the estimated space needs and potential costs for the Center. At this time, no organization has decided to participate in the Center, and no definitive plans are being made for a Center based on these numbers.
This summary and corresponding spreadsheet should be used as a guide only to foster additional conversation and to gain feedback from potentially interested parties. The scenario is intended to show how one potential outcome could occur. Please See Appendix C for the corresponding spreadsheet.
Scenario
1. A 30-year fixed loan at 6%2. Idle Sites Grant from Wisconsin Economic Development Corporation of
$500,000 (max)3. An additional $500,000 in grants or funds are raised4. Research Institution Space of 4,500 SF and Café/Kitchen Space of 600 SF each at
$13.39/SF5. Auditorium/Shared Space of 2,925 SF that is paid for through TIF generated from
the project, leaving around $13,800 +/- annually of unspent tax increment6. USGS and FWS leasing 17,702 SF at $13.39/SF, their current lease rate
F. Summary There are many moving parts and unknowns to this project, however we have learned that:
• USGS/FWS/NPS have adequate space and resources at the current time. There is,however, little room to accommodate future growth.
• GSA is not likely to support a sole source solicitation for a project to relocateUSGS/FWS/NPS. This is, in part, because USGS recently renewed their leasewithout demonstrating a need to be closer to Lake Superior or in a building withadditional space or resources. The space for USGS/FWS/NPS combined isapproximately 28,000 SF.
• If a research institution takes the initiative to become a tenant in the Center anddesires to include USGS/FWS, then GSA may consider a direct lease forUSGS/FWS space, if said space is under 20,000 SF.
• The project pencils assuming a 30-year fixed loan at 6%; an additional $1,000,000in grants or fund raising is secured, and a TIF District is created. This would setthe least rates at an estimated $13.39 SF for the Research Institution, USGS,FWS, and Café.

Lake Superior Science Center Feasibility Study
Page 11 of 11
IX. Next steps
1. City of Ashland formally designates site near the Kiyi mooring/ore dock for construction of the Center
2. Outreach to educational/research institutions that may have an interest in using Center facilities
3. Outreach to state and federal agencies that provide grants that could be used to fund the Center
If sufficient progress is made on steps 1 -3, then the following additional steps would need to be taken. 1. Secure $500,000 of grant funds from the WEDC and/or other entities 2. Raise an additional $500,000 in grants or funds 3. Facilitate the creation of a TIF district to support the project 4. Secure funding at 5.75% or lower

Appendix A
Existing Site Conditions

Appendix A Existing Site Conditions
I. Existing Site Conditions A. Size
The site is approximately 2.04 +/- acres or 89,167 +/- square feet and is predominantly cleared of structures except for two houses which are vacant and listed for demolition or removal by the City. Based on the City’s set back requirements, the site has a total build-out capacity of 56,971 +/- SF. Please see Appendix B - Buildable Area and Setbacks Map.
B. Topography The site is flat with no significant grade changes. Please see Appendix B - Site Topography Map.
C. Wetlands/Wetland Indicators There are no identified wetlands on the site however, wetland indicator soils are present on the parcel. This does not mean wetlands are present, however the Department of Natural Resources may require a wetland delineation to determine the full extent of potential wetlands be completed before any area over one acre is disturbed. Please see Appendix B - Development Limitations Map.
D. Transportation The site sits two blocks off USH 2, northern Wisconsin’s east west connector. State Highway 2 runs from the interchange with USH 53 to the west to Iron Wood where it connects to USH 51. Although the site can be accessed from USH 2 at multiple points, it is envisioned that most of the traffic will access the site from either Willis Ave./6th Ave. or 7th Ave. Please see Appendix B - Site Location Map. Another alternative would be to construct the connector road between the existing Stuntz Ave. on the east side of USH 2 and the existing Stuntz Ave. on the west side of USH 2. This could be done in conjunction with creating a pedestrian path as proposed in the Ore Dock Redevelopment Plan.
E. Connectivity Tenants of the Center would have excellent access to Chequamegon Bay and the USGS research vessel the Kiyi. The Center would be only a few hundred feet away from the Ore Dock redevelopment project and would offer great views of that development as well as the Bay. Finally, the site would enable the Center to tie into the overall vision the community has for activating the waterfront area through its proximity to Kreher RV park and the recently proposed park at the former Northern States Power Company/Xcel site. Please see Appendix B – Potential Connectivity Map.
F. Environmental The site was formally owned by Canadian National railroad and was used as the main rail access point to the former SOO Line Ore Dock when it was operating. Please see Appendix D for the executive summary of the Phase II Environmental Site
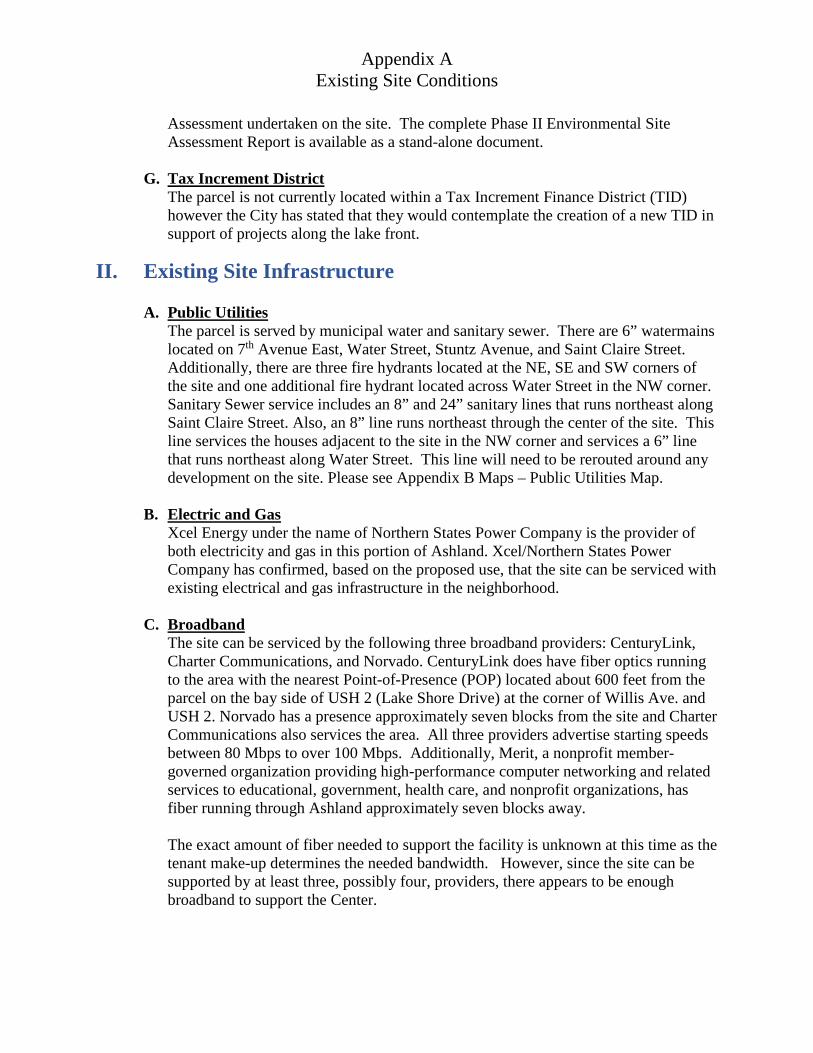
Appendix A Existing Site Conditions
Assessment undertaken on the site. The complete Phase II Environmental Site Assessment Report is available as a stand-alone document.
G. Tax Increment District The parcel is not currently located within a Tax Increment Finance District (TID) however the City has stated that they would contemplate the creation of a new TID in support of projects along the lake front.
II. Existing Site Infrastructure
A. Public Utilities The parcel is served by municipal water and sanitary sewer. There are 6” watermains located on 7th Avenue East, Water Street, Stuntz Avenue, and Saint Claire Street. Additionally, there are three fire hydrants located at the NE, SE and SW corners of the site and one additional fire hydrant located across Water Street in the NW corner. Sanitary Sewer service includes an 8” and 24” sanitary lines that runs northeast along Saint Claire Street. Also, an 8” line runs northeast through the center of the site. This line services the houses adjacent to the site in the NW corner and services a 6” line that runs northeast along Water Street. This line will need to be rerouted around any development on the site. Please see Appendix B Maps – Public Utilities Map.
B. Electric and Gas Xcel Energy under the name of Northern States Power Company is the provider of both electricity and gas in this portion of Ashland. Xcel/Northern States Power Company has confirmed, based on the proposed use, that the site can be serviced with existing electrical and gas infrastructure in the neighborhood.
C. Broadband The site can be serviced by the following three broadband providers: CenturyLink, Charter Communications, and Norvado. CenturyLink does have fiber optics running to the area with the nearest Point-of-Presence (POP) located about 600 feet from the parcel on the bay side of USH 2 (Lake Shore Drive) at the corner of Willis Ave. and USH 2. Norvado has a presence approximately seven blocks from the site and Charter Communications also services the area. All three providers advertise starting speeds between 80 Mbps to over 100 Mbps. Additionally, Merit, a nonprofit member-governed organization providing high-performance computer networking and related services to educational, government, health care, and nonprofit organizations, has fiber running through Ashland approximately seven blocks away. The exact amount of fiber needed to support the facility is unknown at this time as the tenant make-up determines the needed bandwidth. However, since the site can be supported by at least three, possibly four, providers, there appears to be enough broadband to support the Center.

Appendix A Existing Site Conditions
III. Existing Regulations There are several City of Ashland regulatory and planning documents that provide regulations for the development of the parcel but also highlight the future vision for the area. These documents were reviewed to gain insight into the type of development the community envisions for the proposed Center site and the surrounding area. Both the Comprehensive Plan and the City’s Zoning Code contemplate the redevelopment of the lake shore with development that embraces and supports Lake Superior and its importance to the community.
A. City of Ashland Comprehensive Plan
Ashland’s recently adopted Comprehensive Plan, 2015-2020 Authentic Ashland, discusses multiple ways the community can increase the physical connections between Lake Superior, it’s shoreline, and the everyday fabric of the community. The Living Our Values section of the Comprehensive Plan states that Authentic Ashland means environmentally sustainable. It goes on to state, “We choose to be stewards of our setting along the pristine shores of Lake Superior and amid the wilderness of Northern Wisconsin.” Among other things, the section states that the community will make policies and act to…
• “Ensure the lake is an amenity that serves a wide range of recreational and
commercial needs including swimming, boating, fishing, running, and walking along the shoreline trails, and that the lake continues to be the centerpiece of our beloved view shed;
• Protect Lake Superior and continue efforts to physically and civically connect Ashland with this Great Lake.”
The Comprehensive Plan lists six priorities, one of which is to “Protect and Connect the Lake”. The Comprehensive Plan suggests the following three ways to move forward on this priority.
1. Capitalize upon the Waterfront Trail as a protection area 2. Complete the ore dock and park project 3. Ensure that the reuse of the superfund cleanup site protects the integrity of the lake
The notion of increased connectivity to the Lake runs throughout the Comprehensive Plan including better trail access, increased visual corridors of the lake, and future development of the proposed Center site and the surrounding sites. B. City of Ashland Zoning Code
The parcel is currently zoned W-PI: Waterfront Public/Institutional District. The intent of the district is to facilitate the development of public and institutional uses that have a strong relationship with the waterfront.
Appendix A Existing Site Conditions
Permitted uses in the W-PI Waterfront Public District. a. Public, civic, and institutional uses.
(1) Arboretum (2) Festival grounds (3) Government or community service use (4) Marina (5) Museum (6) Public park with or without a campground, pursuant to City of Ashland
Ordinance 871 (7) Water oriented research facilities
b. Utility and communication uses.
(1) Essential services
c. Open spaces. (1) Open spaces: public or private
d. Temporary, seasonal, or land filling/excavation uses.
(1) Land filling and/or excavation (excluding mining) involving fifty (50) cubic yards or less of material and three thousand five hundred (3,500) square feet or less of land disturbance, pursuant to Section 6.1, H.: Grading, land filling, and/or excavation
(2) Seasonal market pursuant to Section 5.5, D.: Seasonal Market e. Other uses.
(1) Other uses not specifically listed in this Ordinance, but for which Zoning Administrator or Designated Authorized Agent has determined that the use is consistent with the intent of the permitted uses in this district.
Conditional uses in the W-PI Waterfront Public District a. Commercial uses.
(1) Terminal: passenger ship, including, but not limited to a cruise or sightseeing boat
(2) Water-oriented commercial use that is incidental or accessory to a public, civic, or institutional uses. An individual water-oriented commercial use shall not exceed a gross area of two thousand five hundred (2,500) square feet.
b. Industrial uses.
(1) Terminal: ship, in accordance with applicable state or federal agreements for use of said ship terminal and provided that the use was in existence and a conforming use prior to adoption of this ordinance

Appendix A Existing Site Conditions
c. Public, civic, and institutional uses. (1) Boat landing (2) College (3) School: primary, secondary or specialty (4) Zoo
d. Utility and communication uses.
(1) Communication equipment: major, pursuant to Section 5.4, A.: Communication Equipment: Major
(2) Utility facilities, pursuant to Section 5.4, C.: Utility Facilities (3) Wind energy facility, pursuant to Section 5.4. D. Wind Energy Facility
e. Temporary, seasonal, or land filling/excavation uses.
(1) Land filling and/or excavation (excluding mining), involving more than fifty (50) cubic yards of material or more than three thousand five hundred (3,500) square feet of land disturbance, and as a separate activity that is not associated with a development permit, pursuant to Section 6.1, H.: Grading, land filling, and/or excavation
(2) Temporary construction building f. Other uses.
(1) Accessory building, if the accessory building exceeds the pertinent standards specified in Section 5.6, A.: Accessory Building
(2) Parking lot as a principal use (3) Other uses not specifically listed in this Ordinance, but for which Zoning
Administrator or Designated Authorized Agent has determined that the use is consistent with the intent of conditional uses in this district.
Permitted accessory use to a permitted or conditional use in the W-PI District.
(1) Accessory buildings, pursuant to Section 5.6, A.: Accessory Building (2) Communication equipment: minor, pursuant to Section 5.4, B.:
Communication Equipment: Minor (3) Composting, pursuant to City of Ashland Ordinance 750, Section 750.B.7. (4) Fence, pursuant to Section 6.5: Fences (5) Landscaping and/or gardening, pursuant to Section 6.4: Landscaping, Buffers,
and Screening (6) Off-street parking, loading, and access drives, pursuant to Section 6.3: Parking
and Loading (7) Outdoor mechanical and electrical equipment, pursuant to Section 5.6, E.:
Outdoor Mechanical Equipment (8) Patio, deck, terrace, and similar uses, pursuant to Section 5.6, G.: Patio, Deck,
Terrace, and Similar Uses (9) Signs, pursuant to Section 6.6: Signs (10) Solar equipment, pursuant to Section 5.6, J.: Solar Equipment and Solar
Rights

Appendix A Existing Site Conditions
(11) Sport court for recreation use, pursuant to Section 5.6, K.: Sport Court, Play Equipment, and Similar Uses
(12) Swimming pool, pursuant to Section 5.6, L.: Swimming Pool (13) Temporary construction building, pursuant to Section 5.5, B.: Temporary
Construction Building (14) Other accessory uses incidental and customary to permitted and
conditional uses of this district as determined by the Zoning Administrator or Designated Authorized Agent.
Setback requirements The minimum setback requirements for principal buildings from parcel lines shall be as follows, except as may be modified pursuant to Section 6.1, B.: Setbacks. a. Minimum principal building setback from road right-of-way line. Thirty (30) feet. b. Minimum principal building setback from corner street side parcel line. Thirty (30)
feet.
Height requirements Maximum height of principal building. Thirty-five (35) feet, as measured pursuant to Section 6.1, C.: Building Height.
C. Planned Unit Development
The Ashland zoning ordinance permits the creation of a Planned Unit Development (PUD) to foster certain types of projects such as the proposed Center. The term Planned Unit Development (PUD) is used to describe a type of development and the regulatory process that permits a developer to meet overall community density and land use goals without being bound by existing zoning requirements. PUD is a special type of “floating overlay district” which generally does not appear on the municipal zoning map until a designation is requested. This is applied at the time a project is approved and may include provisions to encourage clustering of buildings, designation of common open space, and incorporation of a variety of building types and mixed land uses. A PUD is planned and built as a unit thus fixing the type and location of uses and buildings over the entire project. Potential benefits of a PUD include more efficient site design, preservation of amenities such as open space, lower costs for street construction and utility extension for the developer, and lower maintenance costs for the municipality.

Appendix B
Maps


Potential ConnectivityLake Superior Science Center
May 01, 2019I:\Clients-Meno\A\A5989 Ashland Area Development Corporation\001 Lake Superior Center\GIS\Lake Superior Science Center.qgs


Appendix C
Proforma Scenario

Estimated Scenario June,2019
Assumes research institute in partnership with USGS and FWS, auditorium and shared space, café/kitchen funded over 30 years with TIF assistance and $1M in grants/fundraising
Financial Assumptions
USGS
Fish &
Wildlife
Research
Institute
Auditorium
Shared
Café
Kitchen Total by Space Costs/SF USGS Fish & Wildlife Loan
Research Institution 4,500 4,500 $180 $0 $0 Years 30
Garage 3,470 4,200 7,670 $150 $520,500 $630,000 Interest 6.00%
Storage 2,248 2,248 4,496 $100 $224,800 $224,800 Millrate 24.84
Office 2,242 2,242 4,484 $180 $403,560 $403,560 TID
Lab 526 526 1,052 $225 $118,350 $118,350 Assessed Val 75%
Auditorium/Shared 2,925 2,925 $225 $0 $0 Years 20
Café/Kitchen 600 600 $225 $0 $0 Interest 4.00%
8,486 9,216 4,500 2,925 600 25,727 $1,267,210 $1,376,710 Grant (WEDC) Fundraising $1,000,000
Total USGS/FWS
Sf Cost/sf
Prelim Constr
Cost
Contingency
10%
Estimated
Soft Costs 8% Total Prj Cost
Grant
Prorated
Adj Project
Cost
Taxes 75%
Assessed
Value
Prorated
Property
Taxes
Annual
Payment Pmt/sf
Proposed
Pmt/sf
Annual
Payment
Difference
with Modified
Payment
Research Institution 4,500 $180 $810,000 $81,000 $64,800 $955,800 $174,914 $780,886 $17,806.55 $20,661.80 $77,392.35 $17.20 $13.39 $60,255.00 ($17,137.35)
USGS 8,486 $149.33 $1,267,210 $126,721 $101,377 $1,495,308 $329,848 $1,165,460 $27,857.58 $33,241.93 $117,911.32 $13.89 $13.39 $113,627.54 ($4,283.78)
Fish & Wildlife 9,216 $149.38 $1,376,710 $137,671 $110,137 $1,624,518 $358,223 $1,266,295 $30,264.77 $36,112.30 $128,107.25 $13.90 $13.39 $123,402.24 ($4,705.01)
Auditorium/Shared 2,925 $225 $658,125 $65,813 $52,650 $776,588 $113,694 $662,894 $14,467.83 $0.00 $48,158.51 $16.46 $27.17 $79,477.77 $31,319.26
Café/Kitchen 600 $225 $135,000 $13,500 $10,800 $159,300 $23,322 $135,978 $2,967.76 $3,348.46 $13,227.13 $22.05 $13.39 $8,034.00 ($5,193.13)
Total 25,727 $195 $4,247,045 $424,705 $339,764 $5,011,513 $1,000,000 $4,011,513 $93,364 $384,796.55 $14.96 $14.96 $384,796.55 $0.00
$13,886.72 TIF annual diff.
Sf Cost/sf
Assessed
Value
75 % Taxes
% Prorated
Taxes
Prorated
Taxes TID Incentive $162,533.39 NPV 2019
Research Institution 4,500 $180 $716,850 $17,807 19.74% $20,661.80 $208,412 $175,796.11 NPV 2021
USGS 8,486 $149 $1,121,481 $27,858 37.22% $33,241.93 $326,052
Fish & Wildlife 9,216 $149 $1,218,388 $30,265 40.42% $36,112.30 $354,226
Auditorium/Shared 2,925 $225 $582,441 $14,468 $169,335
Café/Kitchen 600 $225 $119,475 $2,968 2.63% $3,348.46 $34,735
Total 25,727 $195 $3,758,635 $93,364 100.00% $93,364.49 $1,092,760
TIF Assistance
Building
Assumptions
Actual SF
Total by Tenant
17,702
Assistance
Building
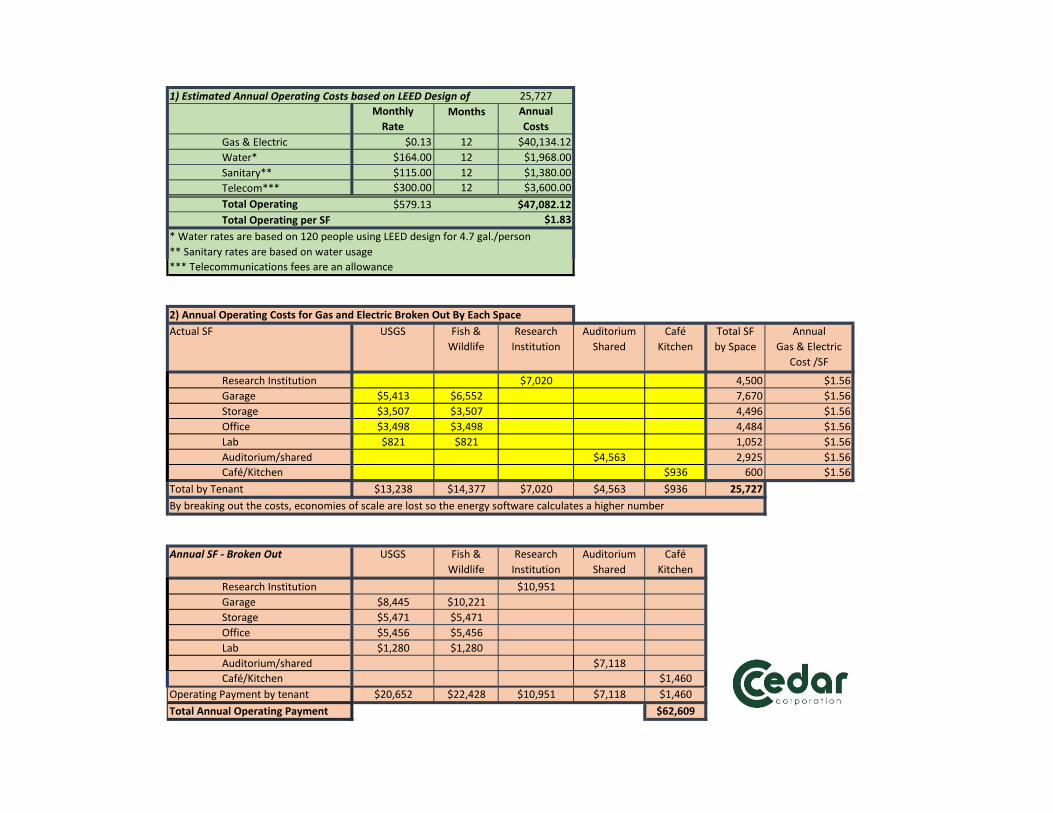
25,727
Monthly
Rate
Months Annual
Costs
Gas & Electric $0.13 12 $40,134.12
Water* $164.00 12 $1,968.00
Sanitary** $115.00 12 $1,380.00
Telecom*** $300.00 12 $3,600.00
Total Operating $579.13 $47,082.12
Total Operating per SF $1.83
* Water rates are based on 120 people using LEED design for 4.7 gal./person
** Sanitary rates are based on water usage
*** Telecommunications fees are an allowance
2) Annual Operating Costs for Gas and Electric Broken Out By Each Space
USGS Fish &
Wildlife
Research
Institution
Auditorium
Shared
Café
Kitchen
Total SF
by Space
Annual
Gas & Electric
Cost /SF
Research Institution $7,020 4,500 $1.56
Garage $5,413 $6,552 7,670 $1.56
Storage $3,507 $3,507 4,496 $1.56
Office $3,498 $3,498 4,484 $1.56
Lab $821 $821 1,052 $1.56
Auditorium/shared $4,563 2,925 $1.56
Café/Kitchen $936 600 $1.56
$13,238 $14,377 $7,020 $4,563 $936 25,727
By breaking out the costs, economies of scale are lost so the energy software calculates a higher number
USGS Fish &
Wildlife
Research
Institution
Auditorium
Shared
Café
Kitchen
Research Institution $10,951
Garage $8,445 $10,221
Storage $5,471 $5,471
Office $5,456 $5,456
Lab $1,280 $1,280
Auditorium/shared $7,118
Café/Kitchen $1,460
Operating Payment by tenant $20,652 $22,428 $10,951 $7,118 $1,460
Total Annual Operating Payment $62,609
Annual SF - Broken Out
Actual SF
Total by Tenant
1) Estimated Annual Operating Costs based on LEED Design of

Appendix D
Executive Summary
Final Phase II
Environmental Site Assessment Report
Ashland Ore Dock, Ashland, WI

Final - Phase II Environmental Site Assessment Report Ashland Ore Dock, Ashland, Wisconsin
BWJ170680 ES-1 DMS #2310287
EXECUTIVE SUMMARY
Bay West LLC (Bay West) completed a Phase II Environmental Site Assessment (ESA) on the Ashland Ore Dock site in the City of Ashland, Wisconsin. The scope of the Phase II ESA was based on recognized environmental conditions (RECs) identified in a Phase I ESA completed for the property by AECOM in August 2016. The RECs associated with the Site included:
• Site development since before 1884 and associated historical waste disposal practices and building heating fuel sources.
• The suspected large quantity of treated wood on-site related to the former rail trestle/foundation and on the railroad ties on the Site.
• Fill soil of unknown origin at multiple locations, especially within the former rail corridors, along the Chequamegon Bay shoreline, and the ore dock approach.
Bay West’s Phase II ESA scope included advancing 23 soil borings to depths ranging from 10 to 20 feet below ground surface (bgs). Eleven borings were completed along the Chequamegon Bay shoreline to assess the area for fill material and soil quality related to the former rail spur that ran along the shoreline. The remaining 12 borings were advanced along the former railroad trestle that serviced the ore dock and railroad spurs on the property. Soil samples were collected at each boring from predetermined depth intervals and submitted for analysis of contaminants of concern related to historical property uses. Soil analytes included Resource Conservation and Recovery Act (RCRA) metals, petroleum volatile organic compounds (PVOCs), diesel range organics (DRO), polynuclear aromatic hydrocarbons (PAHs), and semi-volatile organic compounds (SVOCs). One groundwater sample was collected near the shoreline and analyzed for SVOCs, dissolved RCRA metals and volatile organic compounds (VOCs). Bay West also collected representative samples of the wood trestle material and railroad tie material for waste characterization analysis. Field observations indicated the presence of fill material in the 11 borings completed along the shoreline consisting of interbedded sand, silts, and clays and variable amounts of wood chips, a coal-like material, and soil exhibiting a creosote-like odor. The 12 borings completed further south and southeast of the shoreline also exhibited limited amounts of fill material, less extensive and to shallower depths than observed along the shoreline. Field screening for organic vapors did not exhibit widespread indications of volatile compound contamination, with elevated photoionization detector (PID) responses only noted at three boring locations. Carcinogenic PAHs (cPAHs) were observed exceeding the cumulative excess cancer risk of 5.0 x 10⁻⁵ at five boring locations (SB-2, SB-10, SB-15, SB-20, and SB-21) in near-surface soil samples. Arsenic was detected exceeding the residual contaminant level (RCL) in near-surface soil samples at four boring locations. The presence of PAHs and arsenic is likely related to historical railroad track and railroad trestle use and unlikely to extend to depths beyond 2 to 3 feet bgs. None of the deep soil samples collected at 9 to 10 feet bgs contained contaminants exceeding the cumulative excess cancer risk for cPAHs or RCLs. DRO was observed at 18 of the 23 shallow soil sample locations at concentrations less than 100 milligrams per kilogram (mg/kg). It appears that widespread DRO contamination at similar concentrations may be associated with former rail operations. Other petroleum-related VOCs were also present and widespread across the site, but at concentrations less than the non-industrial RCLs.

Final - Phase II Environmental Site Assessment Report Ashland Ore Dock, Ashland, Wisconsin
BWJ170680 ES-2 DMS #2310287
Bay West advanced seven borings to approximately 20 feet bgs to collect groundwater samples; however, Bay West was only able to collect groundwater at one boring location (SB-11) located within approximately 50 to 60 feet of Chequamegon Bay. Soil observed at the seven original groundwater borings was dry to 20 feet bgs, with no indication of saturated conditions indicative of a water table aquifer. The single groundwater sample collected at the Site did not contain contaminants exceeding Wisconsin Enforcement Standards or United States Environmental Protection Agency (USEPA) maximum contaminant levels (MCLs). Bay West collected samples of railroad tie and railroad trestle material for Toxicity Characteristic Leaching Procedure (TCLP) metals and SVOC analysis. The analytical results did not suggest leachable contaminants that would necessitate management of these material as anything other than demolition material. cPAH, petroleum, and arsenic detections indicate that soil may require management in the form of a Construction Contingency/Soil Management Plan during future development activities. Site-wide removal of former rail bed and rail trestle material to a predetermined depth to eliminate the direct contact exposure pathway to residual contaminants may be warranted. Bay West was unable to fully characterize groundwater quality in the Site area; groundwater appears to be present at depths greater than 20 feet bgs across most of the Site. The presence of groundwater is unlikely to impact future development activities, except for work directly adjacent to Lake Superior.