feasibility study of economics and performance of wind turbine
TRANSCRIPT

NREL is a national laboratory of the U.S. Department of Energy Office of Energy Efficiency & Renewable Energy Operated by the Alliance for Sustainable Energy, LLC.
This report is available at no cost from the National Renewable Energy Laboratory (NREL) at www.nrel.gov/publications.
Contract No. DE-AC36-08GO28308
Feasibility Study of Economics and Performance of Wind Turbine Generators at the Newport Indiana Chemical Depot Site Joseph Owen Roberts and Gail Mosey Produced under direction of U.S. Environmental Protection Agency (EPA) by the National Renewable Energy Laboratory (NREL) under Interagency Agreement IAG-09-1750 and Task No. WFD3.1001.
Technical Report NREL/TP-5000-58900 November 2013

NREL is a national laboratory of the U.S. Department of Energy Office of Energy Efficiency & Renewable Energy Operated by the Alliance for Sustainable Energy, LLC.
This report is available at no cost from the National Renewable Energy Laboratory (NREL) at www.nrel.gov/publications.
Contract No. DE-AC36-08GO28308
National Renewable Energy Laboratory 15013 Denver West Parkway Golden, CO 80401 303-275-3000 • www.nrel.gov
Feasibility Study of Economics and Performance of Wind Turbine Generators at the Newport Indiana Chemical Depot Site Joseph Owen Roberts and Gail Mosey
Prepared under Task No. WFD3.1001
Technical Report NREL/TP-5000-58900 November 2013

NOTICE
This report was prepared as an account of work sponsored by an agency of the United States government. Neither the United States government nor any agency thereof, nor any of their employees, makes any warranty, express or implied, or assumes any legal liability or responsibility for the accuracy, completeness, or usefulness of any information, apparatus, product, or process disclosed, or represents that its use would not infringe privately owned rights. Reference herein to any specific commercial product, process, or service by trade name, trademark, manufacturer, or otherwise does not necessarily constitute or imply its endorsement, recommendation, or favoring by the United States government or any agency thereof. The views and opinions of authors expressed herein do not necessarily state or reflect those of the United States government or any agency thereof.
This report is available at no cost from the National Renewable Energy Laboratory (NREL) at www.nrel.gov/publications.
Available electronically at http://www.osti.gov/bridge
Available for a processing fee to U.S. Department of Energy and its contractors, in paper, from:
U.S. Department of Energy Office of Scientific and Technical Information P.O. Box 62 Oak Ridge, TN 37831-0062 phone: 865.576.8401 fax: 865.576.5728 email: mailto:[email protected]
Available for sale to the public, in paper, from:
U.S. Department of Commerce National Technical Information Service 5285 Port Royal Road Springfield, VA 22161 phone: 800.553.6847 fax: 703.605.6900 email: [email protected] online ordering: http://www.ntis.gov/help/ordermethods.aspx
Cover Photos: (left to right) photo by Pat Corkery, NREL 16416, photo from SunEdison, NREL 17423, photo by Pat Corkery, NREL 16560, photo by Dennis Schroeder, NREL 17613, photo by Dean Armstrong, NREL 17436, photo by Pat Corkery, NREL 17721.
Printed on paper containing at least 50% wastepaper, including 10% post consumer waste.

iii
Acknowledgments The National Renewable Energy Laboratory (NREL) thanks the U.S. Environmental Protection Agency (EPA) for its interest in securing NREL’s technical expertise. In particular, NREL and the assessment team for this project are grateful to the Newport Indiana Chemical Depot facility managers, engineers, and operators for their generous assistance and cooperation.
Special thanks go to Steve Aker from the Newport Chemical Depot Reuse Authority and to Katie Brown, AAAS Science & Technology Policy fellow hosted by EPA, for hosting the site visit. Thanks also go to Lura Matthews, Jessica Trice, and Shea Jones of EPA. The authors would also like to thank everyone who participated in the site visit for sharing the rich history of the Newport Chemical Depot and allowing NREL and EPA to assist in the potential reuse of the land.
This report is available at no cost from the National Renewable Energy Laboratory (NREL) at www.nrel.gov/publications.

iv
Executive Summary The U.S. Environmental Protection Agency (EPA), in accordance with the RE-Powering America’s Land initiative, selected the Newport Indiana Chemical Depot site in Newport, Indiana, for a feasibility study of renewable energy production. The National Renewable Energy Laboratory (NREL) was contacted to provide technical assistance for this project. The purpose of this report is to assess the site for possible wind turbine electrical generator installation and estimate the cost, performance, and site impacts of different wind energy options. In addition, the report recommends financing options that could assist in the implementation of a wind system at the site.
The feasibility of wind systems installed at this site is highly impacted by the available area for a project, wind resource, operating status, ground conditions and restrictions, distance to electrical infrastructure, future uses, and distance to major roads. The Newport Indiana Chemical Depot is suitable in area to have a large-scale wind farm, and the wind resource is also appropriate.
The site is approximately 22,000 acres with approximately 7,200 acres appropriate for installation of a wind farm. While this entire area does not need to be developed at one time due to the feasibility of staging installation as land or funding becomes available, calculations for this analysis reflect the wind potential if the restricted area only is used.
The economic feasibility of a potential wind farm on the site depends greatly on the purchase price of the electricity produced. The economics of the potential systems were analyzed using the current Midwest Independent Transmission System Operator (MISO) wholesale electric rate of $69/MWh and incentives available to the site. It is also assumed that the production tax credit incentive would be captured for the system.
This report is available at no cost from the National Renewable Energy Laboratory (NREL) at www.nrel.gov/publications.

v
Table of Contents 1 Site Background .................................................................................................................................... 1 2 Wind Energy .......................................................................................................................................... 2
2.1 Wind Characteristics ...................................................................................................................... 2 2.2 Wind Turbines ............................................................................................................................... 4
3 Potential Turbine Locations ................................................................................................................. 7 3.1 Site-Specific Considerations .......................................................................................................... 7 3.2 Permitting and Setbacks................................................................................................................. 9 3.3 Environmental Siting Considerations .......................................................................................... 10 3.4 Local Wind Resource Characteristics .......................................................................................... 15 3.5 Estimated Power Production and Cost of Energy From a Potential Wind Facility at
Newport Chemical Depot ............................................................................................................ 21 3.6 Newport Indiana Chemical Depot Energy Usage ........................................................................ 21
3.6.1 Ownership ....................................................................................................................... 22 4 Project Financial Performance .......................................................................................................... 23 5 Conclusions and Recommendations ................................................................................................ 25
This report is available at no cost from the National Renewable Energy Laboratory (NREL) at www.nrel.gov/publications.

vi
List of Figures Figure 1. U.S. national wind resource map ................................................................................................... 3 Figure 2. Indiana 80-m annual average wind speed map .............................................................................. 4 Figure 3. Modern utility-scale wind turbines ................................................................................................ 5 Figure 4. Newport Chemical Depot property extent ..................................................................................... 8 Figure 5. Long-range radar impact potential ................................................................................................. 9 Figure 6. NEXRAD radar impact potential ................................................................................................. 10 Figure 7. Potentially developable areas ....................................................................................................... 11 Figure 8. Levelized cost of energy comparison of modern turbines with historical performance, .............. 16 Figure 9. Wind rose at Newport Chemical Depot ....................................................................................... 17 Figure 10. Frequency of wind speeds at the Newport site ........................................................................... 18 Figure 11. Monthly long-term wind speed averages ................................................................................... 18 Figure 12. Long-term modeled diurnal wind speed profile ......................................................................... 19 Figure 13. Average wind shear .................................................................................................................... 20 Figure 14. Installed wind power project costs by region: 2012 projects ..................................................... 24
List of Tables Table 1. Turbine Production Estimates With Increased Cut in Speeds ....................................................... 14 Table 2. Newport Chemical Depot Wind Farm Financial Assumptions ..................................................... 23
This report is available at no cost from the National Renewable Energy Laboratory (NREL) at www.nrel.gov/publications.

1
1 Site Background The Newport Indiana Chemical Depot is located south of Newport, Indiana and is being developed as an industrial site and is called the Vermilion Rise Mega Park.1 The site has many possible development options, but many of these options will consume large amounts of electricity. Currently, there is a 20-MW substation on site, but there are plans to expand this to as large as 500 MW.2 The developable area for wind allows for roughly ten to fourteen 100-m rotor diameter wind turbines (16–35 MW), depending on setbacks from potential bat habitats.
Under the RE-Powering America’s Land Initiative, the U.S. Environmental Protection Agency (EPA) provided funding to the National Renewable Energy Laboratory (NREL) to support a feasibility study of wind renewable energy generation at the site. The site was used for heavy water production, chemical weapons manufacturing, storage, and decommissioning as well as explosives manufacturing and was in operation from 1942 to 2010.
The site concluded all remediation and weapons decommissioning verification in 2010. Currently, there are no large areas of contamination that pose any risk to earth movement as appropriate for wind farm construction. The site has a large network of paved access roads and the topography is flat to rolling hills, which should facilitate typical construction practices.
Feasibility assessment team members from NREL, the Newport Chemical Depot Reuse Authority, and EPA conducted a site assessment visit to gather information integral to this economic feasibility study. Information, including wind resource, transmission availability, community acceptance, and ground conditions, were considered.
1 Vermillion Rise Mega Park. Accessed November 20, 2013: http://vermillionrise.com/. 2 Aker, S., phone conversation, executive deputy director of Vermilion Rise Mega Park, April 9, 2012.
This report is available at no cost from the National Renewable Energy Laboratory (NREL) at www.nrel.gov/publications.

2
2 Wind Energy Uneven heating of the earth’s surface creates motion of the atmosphere and thus kinetic energy in this movement. Variation in heating and factors, such as surface orientation or slope and rate of reflectivity, absorptivity, and transmissivity also affect the wind resource. In addition, the wind resource can be affected (accelerated, decelerated, or made turbulent) by factors such as terrain, bodies of water, buildings, and vegetative cover.
Wind is air with kinetic energy that can be transformed into useful work via wind turbine blades and a generator. Overall, wind is a diffuse resource that can generate electricity cost effectively and competitively in regions with a good wind resource, high cost of electricity, or both.
2.1 Wind Characteristics Winds vary with the season, time of day, and weather events. Analysis of wind data focuses on several critical aspects of the data—average annual wind speed, frequency distribution of the wind at various speeds, turbulence, vertical wind shear, and maximum gusts. These parameters allow for estimation of available energy in the wind and the suitability of turbine technology for the site.
The wind speed at any given time determines the amount of power available in the wind. The power available in the wind is given by:
P = (A ρV3)/2
where
P = power of the wind [W]
A = windswept area of the rotor (blades) [m2] = πD2/4 = πr2
ρ = density of the air [kg/m3] (at sea level at 15°C)
V = velocity of the wind [m/s].
As shown, wind power is proportional to velocity cubed (V3). This matters because, if wind velocity is doubled, wind power increases by a factor of eight (23 = 8). Consequently, a small difference (e.g., increase) in average speed causes significant differences (e.g., increases) in energy production. Examining ways to increase the wind velocity at a particular turbine location should be considered through modeling the terrain and micro-siting the turbines. Normally, the easiest way to accomplish this is to increase the height of the tower. The wind industry has been moving toward higher towers, and the industry norm has increased from 30 m to 80 m over the last 15–20 years.
The map of the national wind resource can be seen in Figure 1. Wind maps can give a visual approximation of the wind resource in an area but do not provide enough data for
This report is available at no cost from the National Renewable Energy Laboratory (NREL) at www.nrel.gov/publications.

3
estimating annual electricity output at a particular site. On-site wind data is typically collected for a period of 1–3 years and is necessary to estimate wind turbine performance.
Figure 1. U.S. national wind resource map3
Figure 2 shows the Indiana state wind resource at 80 m above ground level. The Newport Chemical Depot is shown on the western edge of the state.
3 DOE. “Utility-Scale Land-Based 80-Meter Wind Maps. Accessed November 20, 2013: http://www.windpoweringamerica.gov/wind_maps.asp.
This report is available at no cost from the National Renewable Energy Laboratory (NREL) at www.nrel.gov/publications.

4
Figure 2. Indiana 80-m annual average wind speed map4
2.2 Wind Turbines Wind turbines consist of rotating blades that convert the kinetic energy of the wind to electric power. They have a number of moving parts and require regularly scheduled and unscheduled maintenance. Manufacturer warranties cover the first 2–10 years. Professional wind turbine maintenance contractors are recommended after the warranty period. Figure 3 shows large wind turbines that are of the scale and general size that might be considered at Newport.
4 DOE. “Indiana 80-Meter Wind Map and Wind Resource Potential.” Accessed November 20, 2013: http://www.windpoweringamerica.gov/wind_resource_maps.asp?stateab=in.
Newport Chemical Depot
This report is available at no cost from the National Renewable Energy Laboratory (NREL) at www.nrel.gov/publications.

5
Figure 3. Modern utility-scale wind turbines. Photo by Joseph Owen Roberts
Wind farms are typically cost effective where the average wind speed is high, where the competing energy costs are high, or a combination of both. Large wind farms of 100–500 MW are commonly deployed because of lower installed costs largely due to economies of scale and improved low wind speed turbine technology which result in an overall lower cost of energy.
In the United States, about 60,000 MW of wind power have been installed.5 Turbines are available from as small as 250 W to as large as 5 MW. For the size of the wind plants considered here, large turbines in the range of 1,000 kW to 3,000 kW per turbine would be appropriate.
Wind power became a commercial-scale industry more than 30 years ago. Over that time, wind power has moved from the fringes of the electric power sector to a mainstream resource responsible for 35% of U.S. new power capacity from 2007 through 2011; it is second in new capacity additions only to new natural gas power.6 In the best resource areas or localities with exceptionally high electricity costs, wind power can be cost effective even in the absence of direct financial incentives or subsidies. Recent
5 Wiser, R.; Bollinger, M. 2012 Wind Technologies Market Report. Washington, D.C.: Department of Energy, 2012. http://www1.eere.energy.gov/wind/pdfs/2012_wind_technologies_market_report.pdf 6 Williams, E.; Hensley, J. AWEA U.S. Wind Industry Annual Market Report 2012. 2013.
This report is available at no cost from the National Renewable Energy Laboratory (NREL) at www.nrel.gov/publications.

6
technological improvements7 are expected to significantly lower the life cycle cost of wind energy. Initial investment costs for wind power are relatively high compared to natural gas or other forms of generation8; however, with zero fuel costs and relatively modest fixed annual operations expenditures, wind-generated electricity is often a favorable generation resource over the long term.
7 Wiser, R.; Lantz, E.; Bolinger, M.; Hand, M. (February 2012). Recent Developments in the Levelized Cost of Energy from U.S. Wind Power Projects. http://eetd.lbl.gov/ea/ems/reports/wind-energy-costs-2-2012.pdf. 8 U.S. EIA. Updated Capital Cost Estimates for Utility Scale Electricity Generation Plants. April 2013. Accessed November 20, 2013: http://www.eia.gov/forecasts/capitalcost/pdf/updated_capcost.pdf.
This report is available at no cost from the National Renewable Energy Laboratory (NREL) at www.nrel.gov/publications.

7
3 Potential Turbine Locations 3.1 Site-Specific Considerations The site has sufficient space to allow for the installation of several utility-scale turbines, as shown in Figure 4, with the white outline representing the site property boundaries, with the maximum nameplate capacity of approximately 50MW if more turbines are added to the proposed layouts in this report. There is an on-site 69-kV substation that would need to be rebuilt to be usable (estimated 20-MW capacity), with the possibility of a new 500-MW substation depending on the new tenants of the industrial park. There are also two 345-kV transmission circuits less than 1 mile west of the western edge of the site.
This report is available at no cost from the National Renewable Energy Laboratory (NREL) at www.nrel.gov/publications.

8
Figure 4. Newport Chemical Depot property extent
Illustration done in Google Earth
This report is available at no cost from the National Renewable Energy Laboratory (NREL) at www.nrel.gov/publications.
9
3.2 Permitting and Setbacks One of the largest constraints to permitting large wind turbines can be avoiding interference with air traffic, weather radar, and military operations. The Newport site is not within any direct flight paths that would automatically preclude it from the possibility of installing a utility-scale turbine with the closest airspace approximately 8 miles to the Southeast outside of Clinton, IN, at the Clinton li-7 airport.
Local ordinances might also apply to a potential turbine at the site and should be investigated further, as some local governments have regulations that constrain the overall height of structures for viewshed reasons.
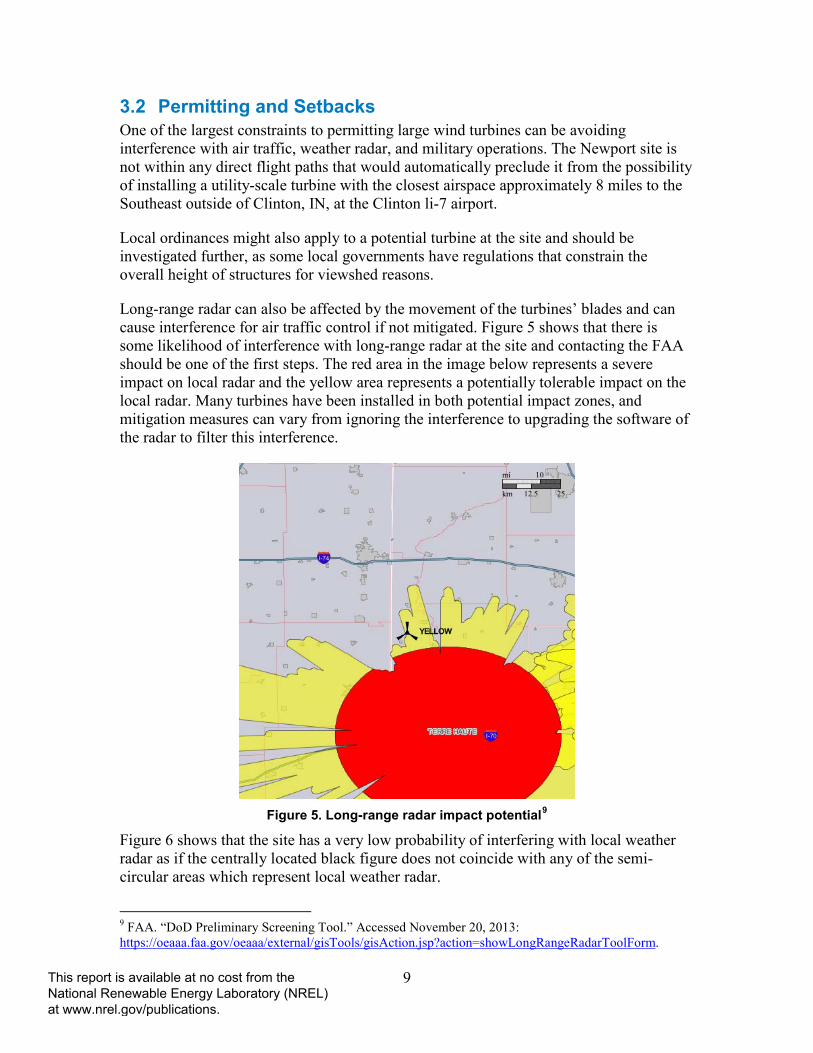
Long-range radar can also be affected by the movement of the turbines’ blades and can cause interference for air traffic control if not mitigated. Figure 5 shows that there is some likelihood of interference with long-range radar at the site and contacting the FAA should be one of the first steps. The red area in the image below represents a severe impact on local radar and the yellow area represents a potentially tolerable impact on the local radar. Many turbines have been installed in both potential impact zones, and mitigation measures can vary from ignoring the interference to upgrading the software of the radar to filter this interference.
Figure 5. Long-range radar impact potential9
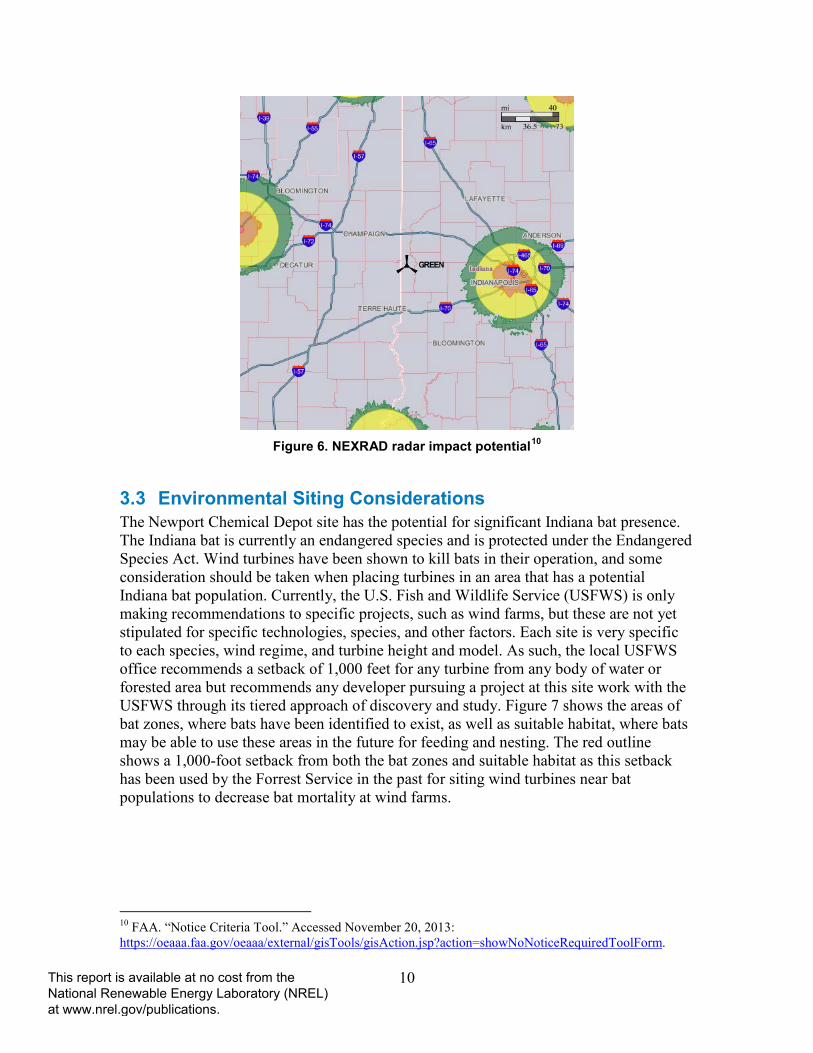
Figure 6 shows that the site has a very low probability of interfering with local weather radar as if the centrally located black figure does not coincide with any of the semi-circular areas which represent local weather radar.
9 FAA. “DoD Preliminary Screening Tool.” Accessed November 20, 2013: https://oeaaa.faa.gov/oeaaa/external/gisTools/gisAction.jsp?action=showLongRangeRadarToolForm.
This report is available at no cost from the National Renewable Energy Laboratory (NREL) at www.nrel.gov/publications.
10
Figure 6. NEXRAD radar impact potential10
3.3 Environmental Siting Considerations The Newport Chemical Depot site has the potential for significant Indiana bat presence. The Indiana bat is currently an endangered species and is protected under the Endangered Species Act. Wind turbines have been shown to kill bats in their operation, and some consideration should be taken when placing turbines in an area that has a potential Indiana bat population. Currently, the U.S. Fish and Wildlife Service (USFWS) is only making recommendations to specific projects, such as wind farms, but these are not yet stipulated for specific technologies, species, and other factors. Each site is very specific to each species, wind regime, and turbine height and model. As such, the local USFWS office recommends a setback of 1,000 feet for any turbine from any body of water or forested area but recommends any developer pursuing a project at this site work with the USFWS through its tiered approach of discovery and study. Figure 7 shows the areas of bat zones, where bats have been identified to exist, as well as suitable habitat, where bats may be able to use these areas in the future for feeding and nesting. The red outline shows a 1,000-foot setback from both the bat zones and suitable habitat as this setback has been used by the Forrest Service in the past for siting wind turbines near bat populations to decrease bat mortality at wind farms.
10 FAA. “Notice Criteria Tool.” Accessed November 20, 2013: https://oeaaa.faa.gov/oeaaa/external/gisTools/gisAction.jsp?action=showNoNoticeRequiredToolForm.
This report is available at no cost from the National Renewable Energy Laboratory (NREL) at www.nrel.gov/publications.

11
Figure 7. Potentially developable areas
Illustration done in Google Earth
The Vermilion Rise Mega Park has over 7,200 acres of land potentially suitable for placement of wind turbines. Some of these areas which are not excluded due to bat habitat may be excluded for potential bat migration paths as well as business development and infrastructure and further work with the development of the industrial park planners is recommended. Figure 7 shows the suitable bat habitat is shown shaded in red as designated by the Forrest Service. The green place marks represent potential turbine locations considering a 1,000-foot setback for the bat habitat. If a mitigation strategy is approved by the Forrest Service, such as curtailing the turbines to a higher cut in wind speed, place marks shown in red represent turbine locations where turbines may be deployed.
Taking into consideration recommendations developed within a Federal Advisory Committee process, the USFWS developed voluntary land-based wind energy guidelines.
This report is available at no cost from the National Renewable Energy Laboratory (NREL) at www.nrel.gov/publications.

12
Released in March 2012, the guidelines can be found at the USFWS website11 or in a fact sheet that summarizes this process.12
The guidelines describe a tiered approach, where each tier can provide a developer with information that can then be used to make decisions on how to move forward with a wind project at a particular site. As stated previously, the USFWS only provides recommendations, and it is up to the developer to choose to follow the recommendation. Tier 1 is a preliminary site evaluation typically conducted as a desktop study. The developer should utilize all available information for this initial screening, but no site visit is needed. Tier 2 is frequently referred to as “boots on the ground,” where a site visit is needed and a site characterization can be done. Tier 3 is typically where pre-construction site assessments are conducted and are focused on species or habitat considerations that were identified during Tier 2. Tier 4 focuses on post-construction monitoring to coincide with whatever species of importance were identified and assessed during Tier 3. Finally, if the site has a major species issue but the developer is still interested in going forward with the project, more complex studies or research would be conducted under Tier 5. The need for Tier 5 research is likely to be determined during Tier 3, so these two activities should align.
Summary of tier activities:
• Tier 1 – Preliminary site evaluation (landscape-scale screening of possible project sites)
• Tier 2 – Site characterization (broad characterization of one or more potential project sites)
• Tier 3 – Field studies to document site wildlife and habitat and predict project impacts
• Tier 4 – Post-construction studies to estimate impacts
• Tier 5 – Other post-construction studies and research.
It is assumed that at least Tier 1 and Tier 2 studies will be recommended for the Newport Chemical Depot, with those findings determining if further study will be recommended.
The National Wind Coordinating Collaborative published the “Comprehensive Guide to Studying Wind Energy/Wildlife Interactions” in 2011.13 This document is a resource
11 USFWS. “Wind Energy Development Information.” Accessed November 20, 2013: http://www.fws.gov/windenergy/. 12 USFWS. “Fact Sheet: Final Voluntary Land-Based Wind Energy Guidelines.” Accessed November 20, 2013: http://www.fws.gov/windenergy/docs/DOI_FWS_Final_Wind_Guidelines_FactSheet_final.pdf. 13 National Wind Coordinating Collaborative. “Comprehensive Guide to Studying Wind Energy/Wildlife Interactions.” Accessed November 20, 2013: http://www.nationalwind.org/assets/publications/Comprehensive_Guide_to_Studying_Wind_Energy_Wildlife_Interactions_2011_Updated.pdf.
This report is available at no cost from the National Renewable Energy Laboratory (NREL) at www.nrel.gov/publications.

13
describing methods and metrics for conducting wildlife studies at wind facilities and is referenced in the USFWS guidelines.
The BWEC has focused on mitigation for reducing bat fatalities at wind facilities. NREL has learned that bats are more active when winds are lower—and during this time, the wind facility may generate little if any kilowatt energy. By changing the cut in speed (i.e., raising the speed at which the turbine will produce power for the grid), the opportunity for bat/turbine interaction is significantly reduced; thus, the fatalities are reduced. Results of these research trials (which can be found on the BWEC website) have proved promising. The economic impacts to the project appear to be minimal and certainly, if considered during the risk assessment phase of the project development, could be better understood. Bat-use patterns (time of year, time of day) should be understood to optimally design this operational curtailment strategy.
Research on land-based wind/wildlife interactions has been conducted beginning with the first wind facilities in California. As wind development has moved across the country, various species- and habitat-specific issues have been raised. Research is now being conducted or supported by a wide range of sectors and stakeholders including the federal government (e.g., DOE, DOI), states (including AFWA), trade industry, academia, non-governmental organizations (e.g., The Nature Conservancy, Union of Concerned Scientists, Audubon Society, Defenders of Wildlife), individual wind developers, and virtually all other sectors and stakeholders.
Those species currently of most interest include eagles, greater sage grouse, greater and lesser prairie chickens, bats, whooping cranes, condors, and marbled murrelet. Habitat fragmentation and disturbance is also an issue—it is not just about collision with a wind turbine but how the species could be affected by the presence of the wind turbines and the effects on the landscape due to the building of the facility. Other species, such as federally threatened and endangered bird and bat species, candidate species, state species of concern, and various other raptor species, including several hawk and owl species, for example, should also to be considered. Our understanding (or lack thereof) of cumulative impacts, species-specific populations, and uncertainties with how climate change will affect species complicates all of this.
There are a number of species-specific research activities that are currently supported by DOE/NREL through collaborative agreements. Research to determine what, if any, impacts wind development has on greater sage grouse is being conducted through the Sage Grouse Collaborative.14 Under the Grassland Community Collaborative, a 6-year research project to assess what, if any, impacts wind development has on greater prairie chickens is concluding.15 Reports and manuscripts are in various stages of completion, but it is anticipated that much will be published over the next year. The Wildlife Workgroup of the National Wind Coordinating Collaborative (NWCC) has been
14 NWCC. “Sage-Grouse Research Collaborative.” Accessed November 20, 2013: http://www.nationalwind.org/sagegrouse.aspx. 15 NWCC. “Grassland Community Collaborative.” Accessed November 20, 2013: http://www.nationalwind.org//issues/wildlife/oversightcommittee.aspx.
This report is available at no cost from the National Renewable Energy Laboratory (NREL) at www.nrel.gov/publications.
14
focused on wind/wildlife impact issues since 1994. Bat fatalities have occurred at wind facilities across the country. The Bats and Wind Energy Cooperative (BWEC) was formed in 2004 to address this issue. The BWEC website16 contains information on results of research activities conducted over the last decade. Several mitigation strategies have been developed and are proving successful.
The NWCC17 has hosted nine research workshops between 1994 and 2012, and the proceedings of all (except the November 2012 meeting) can be found on the NWCC website. These proceedings contain a wealth of information on research conducted on this topic.
Although the USFWS guidelines are voluntary, there is a discussion of adherence in the guidelines, which says “Adherence to the Guidelines is voluntary and does not relieve any individual, company or agency of the responsibility to comply with laws and regulations. However, if a violation occurs the Service will consider a developer’s documented efforts to communicate with the Service and adhere to the Guidelines” (p. vii).
Work has also been done on developing an acoustic deterrent. A reduction in fatalities has been shown; however, more work is needed to develop a commercially viable product.
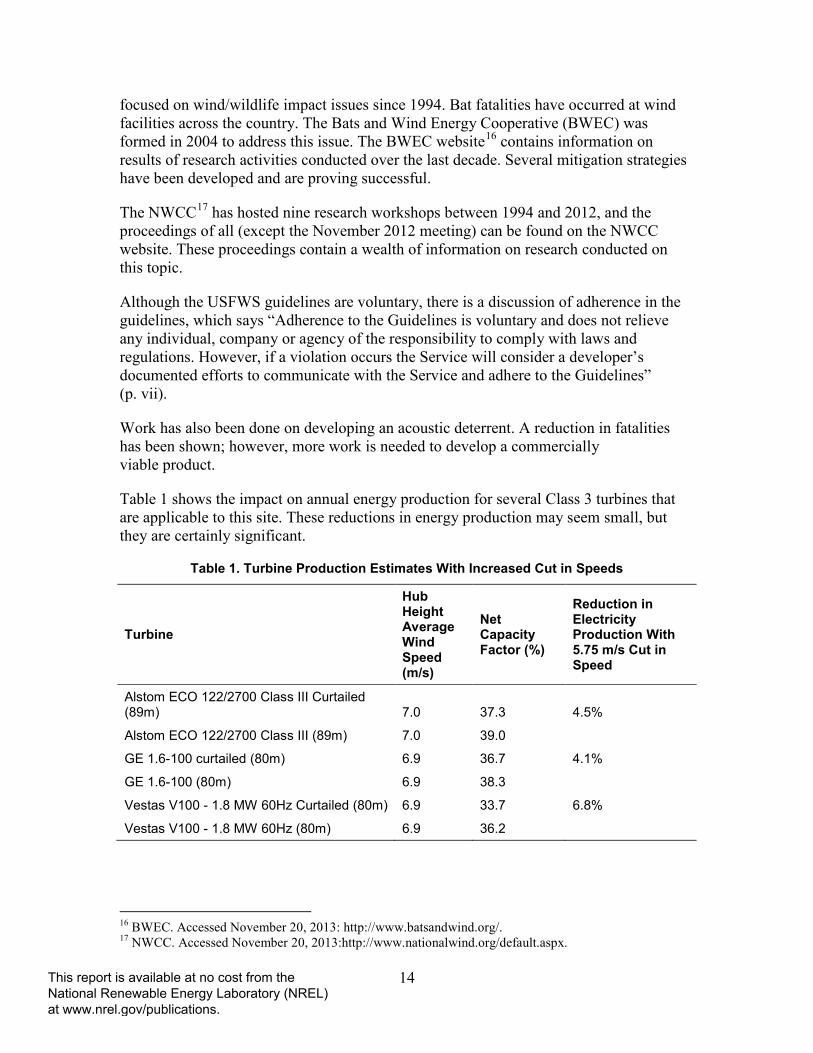
Table 1 shows the impact on annual energy production for several Class 3 turbines that are applicable to this site. These reductions in energy production may seem small, but they are certainly significant.
Table 1. Turbine Production Estimates With Increased Cut in Speeds
Turbine
Hub Height Average Wind Speed (m/s)
Net Capacity Factor (%)
Reduction in Electricity Production With 5.75 m/s Cut in Speed
Alstom ECO 122/2700 Class III Curtailed (89m) 7.0 37.3 4.5%
Alstom ECO 122/2700 Class III (89m) 7.0 39.0
GE 1.6-100 curtailed (80m) 6.9 36.7 4.1%
GE 1.6-100 (80m) 6.9 38.3
Vestas V100 - 1.8 MW 60Hz Curtailed (80m) 6.9 33.7 6.8%
Vestas V100 - 1.8 MW 60Hz (80m) 6.9 36.2
16 BWEC. Accessed November 20, 2013: http://www.batsandwind.org/. 17 NWCC. Accessed November 20, 2013:http://www.nationalwind.org/default.aspx.
This report is available at no cost from the National Renewable Energy Laboratory (NREL) at www.nrel.gov/publications.

15
3.4 Local Wind Resource Characteristics This study assumed the use of utility-scale wind turbines with 80 m or greater hub heights. Modern turbine technology as well as improvements in modeling wind resources in North America has changed what wind resources are cost effective to develop for utility-scale wind energy. NREL and AWS Truepower previously partnered to determine the potential for wind development in all U.S. states.18 These potential state-installed capacities were developed assuming some older turbine technologies that now underestimate the total potential for installed capacity.
As no on-site observations were performed for this study, typical meteorological year data from AWS Truepower was used to estimate various turbine outputs at the site. This data is created from numerical weather models and is adjusted using surface observations such as airport weather stations. The data is then compiled to create a typical year of hourly data that should be representative of an average year at the site.
Advancements in modern, commercially available turbine technology have drastically changed the energy yield from turbines, especially for lower wind speed sites. The industry trend for utility-scale wind turbines is larger rotor diameters and smaller electrical nameplate capacities for lower wind speed regimes. This has been shown to be cost effective, especially for lower wind speed sites as shown in Figure 8. 19
18 DOE. “Wind Resource Maps and Anemometer Loan Program Data.” Accessed November 20, 2013: http://www.windpoweringamerica.gov/windmaps/. 19 Wiser, R.; Lantz, E.; Bolinger, M.; Hand, M. (February 2012). Recent Developments in the Levelized Cost of Energy from U.S. Wind Power Projects. http://eetd.lbl.gov/ea/ems/reports/wind-energy-costs-2-2012.pdf.
This report is available at no cost from the National Renewable Energy Laboratory (NREL) at www.nrel.gov/publications.

16
Figure 8. Levelized cost of energy comparison of modern turbines with
historical performance20,21
These data show that for turbines currently being produced and installed in North America, the cost of energy, especially for lower wind speed sites such as the Newport Chemical Depot site, now have a much better chance at producing cost-effective electricity, depending on incentives and project and turbine costs, for example. It appears that the industry is continuing in this direction, and the next generation of turbines already being tested and installed may have a similar impact on the cost of energy as their rotors are even larger. It is yet to be seen where turbine pricing for these new machines will fall, but recent industry trends indicate that prices will continue to decrease.22 It is also worth noting that modern IEC Class III turbines with larger rotor to nameplate electrical capacity typically reduce the volatility of annual variations in the wind resource. As the datasets used are focused on temporally longer periods, turbulence intensity is not included as part of either dataset. As such, standard industry practice or discussions with a financier or turbine manufacturer who has confidence in the wind regime in the area are recommended to any developer.
20 Wiser, R.; Lantz, E.; Bolinger, M.; Hand, M. (February 2012). Recent Developments in the Levelized Cost of Energy from U.S. Wind Power Projects. http://eetd.lbl.gov/ea/ems/reports/wind-energy-costs-2-2012.pdf. 21 This model assumes current turbine and installation pricing, reduced operation and maintenance (O&M) costs, production tax credits (PTC) and modified accelerated cost-recovery system (MACRS) tax incentives, increased turbine availability, and the comparative capacity factors for the current and previous generation turbine technologies. 22 Wiser, R.; Lantz, E.; Bolinger, M.; Hand, M. (February 2012). Recent Developments in the Levelized Cost of Energy from U.S. Wind Power Projects. http://eetd.lbl.gov/ea/ems/reports/wind-energy-costs-2-2012.pdf.
8 m/s
7 m/s
6 m/s
$0
$20
$40
$60
$80
$100
$120
$140
2002-03 Current, 2012-13
Standard Technology Technology Choice
Leve
lized
Cos
t of E
nerg
y ($
/MW
h)No
Ince
ntiv
es
31% Cost Reduction
17% Cost Reduction
This report is available at no cost from the National Renewable Energy Laboratory (NREL) at www.nrel.gov/publications.

17
The modeled data provide significant additional insights regarding the wind resource at the site. Figure 9 shows the directionality of the wind resource at the Newport. The blue area of the figure plots the total wind energy from a given direction.
Figure 9. Wind rose at Newport Chemical Depot
Figure 10 shows the frequency of occurrence on the y-axis and the wind speed on the x-axis. This histogram illustrates the frequency of different wind speeds at the site, which is critical to turbine selection and energy production.
Proportion of Total Wind Energy vs. DIR80 BIN 0.3600°
22.5°
45°
67.5°
90°
112.5°
135°
157.5°
180°
202.5°
225°
247.5°
270°
292.5°
315°
337.5°
0%
12%
24%
WS140 BIN 0.360 WPDWS110 BIN 0.360 WPDSynthesized 89 m WPDWS80 BIN 0.360 WPDSynthesized 78 m WPDWS50 BIN 0.360 WPD
This report is available at no cost from the National Renewable Energy Laboratory (NREL) at www.nrel.gov/publications.

18
Figure 10. Frequency of wind speeds at the Newport site
Figure 11 indicate that the strongest winds occur in the winter. Such variability is not expected to have a significant impact on the economic viability of wind power on the local utility.
Figure 11. Monthly long-term wind speed averages
Figure 12 shows how the average wind speed varies over an average day. The x-axis is measured in hours with the beginning of the day starting at 0 Coordinated Universal Time, not local time.
0 5 10 15 20 250
1
2
3
4
5
6
7
Freq
uenc
y (%
)
Probability Distribution Function
WS80 BIN 0.360 (m/s)Actual data Best-f it Weibull distribution (k=2.32, c=7.74 m/s)
This report is available at no cost from the National Renewable Energy Laboratory (NREL) at www.nrel.gov/publications.

19
Figure 12. Long-term modeled diurnal wind speed profile23
Figure 13 shows the average wind shear, or how the average wind speed as height above the ground increases, at the site. The shear is of a high enough value to consider taller turbines as the increased energy productions from the higher wind speeds for taller turbines may be cost effective.
23 Times in the plot are Universal Time. To adjust for local time, subtract 6 hours for standard time.
This report is available at no cost from the National Renewable Energy Laboratory (NREL) at www.nrel.gov/publications.

20
Figure 13. Average wind shear
The average annual wind shear at the Newport Chemical Depot site is characterized by a power law equation exponent of 0.203. This value is consistent with what is expected in this area of the country and could suggest that higher hub-height turbines may be cost effective. This is because, as hub height of a given turbine increases, the cost for construction in materials and labor also increases, but the return on investment from the increased turbine production outweighs this cost.
This report is available at no cost from the National Renewable Energy Laboratory (NREL) at www.nrel.gov/publications.

21
3.5 Estimated Power Production and Cost of Energy From a Potential Wind Facility at Newport Chemical Depot
There are four key elements that are necessary to estimate power production from a wind facility:
1. Wind resource potential
2. Project size or capacity (in MW)
3. The respective wind turbine power curve, a function that demonstrates the energy produced at a given wind speed
4. Estimated losses likely associated with a given project.
The potential project size at the Newport Chemical Depot is highly constrained by industry standard setbacks from adjacent landowners, bat habitat and buffer, and future use areas for the industrial park development. Figure 7 shows two separate possible turbine layouts depending on the setback requirement for bat habitats. The green markers show possible turbine locations if a 1,000-foot setback from all bat habitats is required. This scenario results in roughly 10 suitable turbine sites with adequate turbine spacing. If the bat setback constraint is removed (e.g., by increasing cut in speed or if detailed surveys do not reveal any bats living in these possible habitats), then roughly 14 suitable turbine sites are possible given adequate turbine spacing (shown as red markers).
Modern utility-scale turbines, especially turbines designed for the lower wind resource areas, are reducing the cost differential between lesser wind resource sites and sites where the wind resource is stronger. This trend is illustrated in Figure 8. Energy production estimates are based on inputs of wind resource potential derived from the AWS-modeled data, turbine-specific power curves extracted from manufacturer data by NREL, and estimated losses. Energy production estimates were then used to estimate the average capacity factor for the respective hypothetical facilities noted in Table 1.
3.6 Newport Indiana Chemical Depot Energy Usage The site may have some large electrical loads from industrial customers in the future. However, currently the electrical loads are small and this study focuses on the possibility of a utility-scale wind farm. It is highly unlikely that any state policy, Renewable Portfolio Standard (RPS), or other legislation would allow connection of a utility-scale project behind the meter at this scale. Indiana does have an RPS that escalates into 2025, which requires 10% renewable energy from all utilities.24 Indiana also has a net-metering policy, but the capacity for any net-metered facility is capped at 1 MW.25As such, a conventional third-party ownership model may be the most likely scenario for a utility-scale project at Newport. If a third-party PPA is to be pursued, the first step would be to 24 DSIRE. “Indiana.” Accessed November 20, 2013: http://www.dsireusa.org/incentives/incentive.cfm?Incentive_Code=IN12R. 25 DSIRE. “Indiana.” Accessed November 20, 2013: http://www.dsireusa.org/incentives/incentive.cfm?Incentive_Code=IN05R&re=0&ee=0
This report is available at no cost from the National Renewable Energy Laboratory (NREL) at www.nrel.gov/publications.

22
finalize what areas of the site can be set aside for wind development. Integral to this land allocation a final ruling by USFW should be in place to ensure the bat habitat is protected. The site also needs an electrical interconnection capable of handling the capacity of the wind farm. As previously noted the current electrical interconnection on site is inadequate for the size of project in this report but there are preliminary plans that industrial customers will require a large electrical service on the site. After these critical steps are taken a request for proposal can be generated by the Vermilion Rise Mega Park and be made public to gauge interest by third-party developers and owners to own and operate a wind farm on the site.
3.6.1 Ownership In the case where a third party would own and operate a wind farm on the Newport Chemical Depot lands, the owner would lease land and the rights to install turbines and electrical components from the industrial park. The magnitude of this payment may be on the order of $5,000–$10,000 per turbine, which is typical for agricultural areas.
This report is available at no cost from the National Renewable Energy Laboratory (NREL) at www.nrel.gov/publications.

23
4 Project Financial Performance The NREL System Advisor Model (SAM)26 was used to model the financial performance of one possible project scenario at the Newport Chemical Depot. Assuming a conventional third-party ownership and utilization of the production tax credit, this project may be financially viable in the Midwest Independent Transmission System Operator, given the assumptions below. The assumptions in Table 2 use turbine prices and installed costs from 2011 and do not reflect any advantages or disadvantages of economies of scale, existing or planned substations, or current construction costs and turbine prices. This financial model is not meant to be representative of an actual project cost but to indicate what a project may cost in this terrain, region, and general state of the industry.
Table 2. Newport Chemical Depot Wind Farm Financial Assumptions
Annual energy 52,055,256 kWh Turbine capacity 1.62 MW Wind farm capacity (MW) 16.20 MW Capacity factor 36.70% Losses (including bat curtailment) 19.10% Installed cost $1,850/kW Land lease cost (annually) $100,000 Project life 20 years PPA price 65.0 $/MWh LCOE nominal 77.5 $/MWh LCOE real 63.4 $/MWh Internal rate of return (%) 30.39% Minimum DSCR 1.01 Net present value ($) $7,791,893.50 Calculated PPA escalation (%) 2.50% Calculated debt fraction (%) 70.00% Loan rate 9% Loan term 20 years Fed income tax rate 35% State income tax rate 3.90% Inflation rate 2.50% Nominal discount rate 9% Production tax credit value (non-escalating) $0.02
Accelerated depreciation 5 years
26 SAM. Accessed June 5, 2013: https://sam.nrel.gov/.
This report is available at no cost from the National Renewable Energy Laboratory (NREL) at www.nrel.gov/publications.

24
Figure 14 shows that for projects built in the interior region in 2012, the average cost of installation was $1,760/kW. It is also worth noting that this region has the lowest average cost as well as the most project cost data points and fewest outliers of project costs.
Figure 14. Installed wind power project costs by region: 2012 projects27
27 Wiser, R.; Bollinger, M. 2012 Wind Technologies Market Report. Washington, D.C.: Department of Energy, August 2013. Accessed November 19, 2013: http://www.nrel.gov/docs/fy13osti/58784.pdf.
This report is available at no cost from the National Renewable Energy Laboratory (NREL) at www.nrel.gov/publications.

25
5 Conclusions and Recommendations The site locations considered for a wind system in this report are suitable areas in which to implement wind systems. Using land that cannot be used for other purposes would minimize the environmental impact of a wind generation plant or collocating turbines with agricultural lands. The site also has the following attributes, which greatly increase the viability of a potential wind project at the Newport Chemical Depot site:
• Unlikely radar and FAA interference
• Adequate wind resource
• Low potential for public opposition due to land use
• Provides access to multiple transmission lines
• Potential for wind to co-exist with future uses of site
• Constructible site with flat terrain. Further investigation into bat impact and mitigation measures should be undertaken as the amount of developable area is significantly increased if the 1,000-foot setbacks can be reduced with increased turbine cut in speeds.
Multiple customers on site may be interested in paying for portions of the wind energy, a more local example of consumers paying for renewable energy credits or local energy. Further development of ownership and investment options should be explored.
It is recommended that the Newport Chemical Depot Reuse Authority further pursue opportunities for a wind system installation on the Newport Indiana Chemical Depot site. It is recommended that a public request for intent be issued to gauge interest from developers in the location and site. For multiple reasons—a combination of acceptable resource, potential developable area, utilization of contaminated lands, on-site loads, on-site electrical infrastructure, and low impact to surrounding neighbors—this report shows that a wind system is a reasonable use for the site. A third-party ownership PPA is the most feasible way for a system to be financed and installed on this site; as ownership of the wind farm would require substantial financing, transaction costs for production tax credits, and renewable energy credits. There is also the risk of turbine failure and potential future environmental issues (e.g., bat conflicts) which may be easier for a larger developer/owner to manage, should they arise.
This report is available at no cost from the National Renewable Energy Laboratory (NREL) at www.nrel.gov/publications.