federal oversight, local control, and the specter of ... · pdf fileanalyzing data for the 100...
TRANSCRIPT

Federal Oversight, Local Control, and the Specter of “Resegregation” in Southern SchoolsCharles T. Clotfelter, Helen F. Ladd, and Jacob L. VigdorJanuary 2005JEL No. I28
Abstract
Analyzing data for the 100 largest school districts in the South and Border states, we ask
whether there is evidence of “resegregation” of school districts and whether levels of segregation
can be linked to judicial decisions. We distinguish segregation measures indicating the extent of
racial isolation from those indicating the degree of racial imbalance across schools. For the
period 1994 to 2004 the trend in only one measure of racial isolation is consistent with the
hypothesis that districts in these regions are resegregating. Yet the increase in this measure
appears to be driven by the general increase in the nonwhite percentage in the student population
rather than policy-determined increases in racial imbalance. Racial imbalance itself shows no
trend over this period. Racial imbalance is nevertheless associated with judicial declarations of
unitary status, suggesting that segregation in schools might have declined had it not been for the
actions of federal courts. This estimated relationship is subject to a lag, which is in keeping with
the tendency for courts to grant unitary status only if districts agree to limit their own freedom to
reassign students.
Charles T. Clotfelter, Duke University and NBERBox 90245 Duke University, Durham NC [email protected]
Helen F. Ladd, Duke University Box 90245 Duke University, Durham NC [email protected]
Jacob L. Vigdor, Duke University and NBER
Box 90245 Duke University, Durham NC 27708

1 We are grateful to John Charles Boger and Jeffrey Kling for comments on an earlierversion of this paper and to Roger Aliaga Diaz, Janeil Belle, Demarron Berkley, MeganFotheringham, Felicity Kolp, Robert Malme, and Dallas Stallings for research assistance.
1
1/20/05
Federal Oversight, Local Control, and the Specter of “Resegregation” in Southern Schools1
Charles T. Clotfelter, Helen F. Ladd, and Jacob L. Vigdor
I. Introduction
The historic movement toward racially integrated schools, initiated by Brown v. Board of
Education and advanced by subsequent Supreme Court decisions, was marked by a dramatic
decline in the number of students attending “racially identifiable” schools. In the South, the
percentage of black students enrolled in schools with 90-100% nonwhite enrollments fell from
100% in 1954 to 78% in 1968 and to 25% by 1972. Consistent with this decline, the comparable
percentage for the country as a whole fell from 64% in 1968 to less than 34% in both 1980 and
1989 (Clotfelter 2004, p.56).
Since 1990, however, this measure of racial isolation has begun to creep up again. It rose
to 37.4% for the nation by the fall of 2000 and between 1991 and 2000 it increased in every
region of the country (Clotfelter 2004, p. 56). These developments have raised alarms about the
“resegregation” of schools. Observers have expressed special concern about the South, where
Jim Crow apartheid gave way to sweeping change in the late 1960s, transforming schools in that
region from the most segregated to the least segregated in the country.
A prominently cited culprit behind this apparent turnaround is the federal judiciary.

2Rather than having to eliminate simultaneously all vestiges of past discrimination, asenumerated by Green v. New Kent County (1968) in order to achieve unitary status, the Courtruled that these factors only needed to be addressed successfully sometime.
2
According to Orfield and Eaton (1996, p. 1), the key to understanding the reversal in trends after
1990 is a pair of Supreme Court decisions in 1991 and 1992. The 1991 decision, Board of
Education of Oklahoma v. Dowell, allowed districts to be released from judicial control once
they had been declared “unitary” and thus to be free to assign students to schools, if they wished,
by neighborhood of residence. Owing to the pervasive racial segregation in existing housing
patterns, the use of such neighborhood-based attendance zones quite naturally tends to produce
de facto segregation in schools. In the second decision, Freeman v. Pitts (1990), the Court
effectively eased the requirements necessary for a district to be declared unitary.2 Orfield and
Eaton (1996, p. 1) state:
these historic High Court decisions were a triumph for the decades-long
powerful, politicized attacks on school desegregation. The new policies
reflected the victory of the conservative movement that altered the federal courts
and turned the nation from the dream of Brown toward accepting a return
to segregation.
The NAACP Legal Defense Fund’s 2000 annual report concurs: “When there are findings of
unitary status, as in Oklahoma City and Norfolk, resegregation has become the rule” (NAACP
2000, p. 8).
Whatever its causes, not everyone agrees that resegregation is in fact occurring. Logan
(2004) argues that increases in measures of racial isolation are merely a reflection of the
country’s changing racial composition and that schools are no more segregated today than they
were before these court decisions were handed down. Using data on public schools from across
3 Following Orfield and Monfort (1992, p. 2), these regions are defined as follows:Border: Delaware, District of Columbia, Kentucky, Maryland, Missouri, Oklahoma, WestVirginia; South: Alabama, Arkansas, Florida, Georgia, Louisiana, Mississippi, North Carolina,South Carolina, Tennessee, Texas, Virginia. In fact, public schools had been segregated by lawnot only in the eleven states of the former Confederacy, the six Border states, and the District ofColumbia, but also in parts of Kansas, Arizona, and New Mexico (Clotfelter 2004, p. 18)
3
the country, he documents the general increase in the proportion of nonwhite students between
1990 and 2000. He shows that the proportion of all students attending predominantly white
schools declined, for example, while the percentage attending schools 90% or more nonwhite
increased (Logan 2004, p. 9). According to Logan, it is the increase in the nonwhite share and
the consequent increase in predominantly nonwhite schools that raises measures of racial
isolation such as the percentage of black students attending 90-100% nonwhite schools.
Our aims in this paper are two-fold. One goal is to examine the extent to which
“resegregation” has occurred during the past 10 years, with particular reference to the 100 largest
districts in Southern and near-Southern (or “Border”) states. We focus on districts in these states
because, given their policy of official segregation before 1954, they have been a focal point for
the widely-expressed concern about resegregation.3 The second goal is to determine what role
the courts have played in whatever resegregation has occurred, with particular attention to
judicial declarations of unitary status and the rulings in the Fourth Circuit.
To preview our conclusions, we find first that whether and to what extent segregation
appears to be reemerging differs according to the construct used to measure segregation. If we
define segregation as racial isolation, we find some evidence of increasing segregation across
schools within districts during the 1993-2003 period, but only when we use the specific measure
cited at the beginning of the paper, the percentage of black students attending schools 90-100%

4
nonwhite. If we define segregation not as racial isolation, but rather as racial imbalance within
districts, we find, somewhat to our surprise, no evidence of resegregation. Nor, however, do we
find any evidence that segregation is declining. Thus, within districts, the trends in school
segregation contrast markedly with the trends for the same period in residential segregation
(measured at the metropolitan level), which decreased quite substantially in some Southern
metropolitan areas (Glaeser and Vigdor, 2003). The decline in residential segregation creates the
possibility that, even in the absence of rising school segregation, were it not for judicial rulings of
unitary status, racial segregation across schools might have declined.
Second, we find some suggestive links between the decisions of federal courts and school
segregation as reflected in two measures of racial imbalance, but these findings are by no means
definitive proof that court decisions have opened the door to resegregation. We find higher
levels of racial imbalance among districts that were declared unitary before 1993 than among
those which have never been so declared. We also find an increase over time in racial imbalance
among districts in the Fourth Circuit, which finding could be the result of decisions unique to
that circuit. With the exception of one specification, we find no association between judicial
rulings or jurisdictions and a measure of racial isolation, probably because that measure is so
strongly influenced by demographic changes. Since those demographic changes are outside the
control of district policymakers, it is difficult to isolate the effects of judicial action on the school
assignment decisions over which they do have control.
Section II of the paper discusses various measures of segregation and section III
documents changes over the 10-year period for our sample of 100 large districts. Section IV
provides an overview of legal issues related to school desegregation cases, with emphasis on the

4 The preponderant importance of de jure segregation at the time of Brown is alsoillustrated by the emphasis placed on state support of segregation in a statement by prominentsocial scientists that was submitted as part of an amicus brief to the Court in 1953 (“The Effectsof Segregation...” 1953).
5
role of declarations of unitary status and decisions in the Fourth Circuit. That historical overview
serves as background to the empirical investigation of their effects on segregation in section V.
The paper ends with a brief concluding section.
II. Recognizing “Resegregation”
The “segregation” referred to in the Brown decision was a system of laws whereby
students of different races were assigned to separate schools with separate faculties.4 In
contemporary discussions in the school context, the term segregation has become an attribute of
enrollment patterns by race – typically across schools within a district – and is typically measured
in quantitative terms so that one pattern can be judged more segregated than another.
Contemporary measures of segregation can be grouped into two main categories: measures of
racial isolation and measures of racial imbalance.
Racial Isolation
The measure used at the beginning of this paper, the percentage of black students in
schools that are 90-100% nonwhite, is one widely used measure of racial isolation. By
summarizing the extent to which black students are in schools primarily with other minority
students, it indicates the degree to which black students are isolated from (non-Hispanic) white
students. Its focus on the nature of schools attended by black students reflects the historical fact

6
that blacks were both the principal minority group in the South and the group whose history of
subjugation and discrimination made its legal status central to the Brown case.
In recent years, owing to the growth in Hispanic and other nonwhite enrollments, the
percentage of nonwhite students who are black has fallen in many districts. Thus it is useful to
distinguish this first measure from a closely related measure of racial isolation that also focuses
on the schools attended by black students: the percentage of black students in schools that are 90-
100 percent black. In contrast to the prior measure, this one measures the extent to which black
students are concentrated in schools with students like themselves. In the absence of Hispanic or
other non-black minority students, the two measures would of course be identical. In districts
with a growing number of Hispanic students, however, trends in the two measures could well
diverge.
A somewhat different measure of racial isolation, defined once again from the perspective
of black students, is the rate at which they attend school with other black students. Also referred
to as the exposure rate of black students to black students, this rate is:
Ebb = [3 Bj bj ] / 3 Bj,
where Bj is the number of black students in school j and bj is the school’s percentage of black
students. Equivalent to the proportion black in the typical black student’s school, this exposure
rate is one way of indicating how isolated black students are from students of other races.
Importantly, measures of racial isolation are not independent of a district’s overall racial
composition. In general the higher is the proportion of black or of nonwhite students, depending
on the measure used, the higher will be one of these measures of isolation. Stated differently,
measures of racial isolation incorporate into a single measure any imbalance in the racial mix of
7
students across schools as well as the overall racial composition of the district. As a descriptive
device, measuring segregation by means of an index of racial isolation is undoubtedly useful.
From the perspective of district policy makers, however, who are likely to have far greater
control over the extent to which students of different races are distributed among schools in a
balanced or unbalanced manner than over the racial mix of students in the district, it is useful to
have a segregation measure that isolates the aspect of enrollment patterns over which they have
more control. Segregation indexes that measure racial imbalance fit this requirement in that they
are not a function of a school district’s racial composition.
Racial Imbalance
Such indexes are designed to measure the extent to which students of a particular race are
unevenly distributed across schools within the district. At one extreme, segregation would be
complete if members of each racial group attended schools with members of their own race
alone. At the other, there would be no segregation, according to this approach, if all schools had
the same racial composition, which by definition would be the racial composition of the district
as a whole. The calculation of any measure of racial imbalance must begin with a decision about
which racial groups to highlight. For most of our analysis of racial imbalance, we look at the
balance between white and nonwhite students.
One useful measure of racial imbalance is a gap-based segregation index, S, which takes
the following form for segregation within district k:
Sk = (nk - Ewn) / nk ,
where nk is the proportion of the district’s students who are nonwhite and in this case Ewn is the

5The index of dissimilarity is defined asD = 0.5 3 * Nj / N - Wj / W *,
where N and W are total nonwhite and white enrollment in a district, and Nj and Wj are thenonwhite and white enrollment in school j.
8
exposure rate of whites to nonwhites, defined as
Ewn = [3 Wj nj ] / 3 Wj,
Wj is the number of whites in school j, and nj is its nonwhite percentage. The exposure rate Ewn
can be interpreted as the nonwhite percentage in the typical white student’s class, and can range
from zero, where schools are fully separated by race, to nj, where they are racially balanced. Thus
the segregation index is the difference between the maximum exposure rate of whites to
nonwhites, which is simply the nonwhite share of students in the district, and the actual exposure
rate, expressed as a fraction of the maximum. The segregation index runs from 0, which
represents no segregation, to 1, which represents complete segregation.
Another well-known measure of racial imbalance is the dissimilarity index.5 This index,
which also runs from 0 to1, has a simple intuitive interpretation: it indicates the proportion of any
one racial group of students that would have to switch schools to achieve racial balance across
the district. The closer is the number to 1, the more segregated is the district. Though the
dissimilarity index is commonly used in studies of residential segregation, we prefer the gap-
based measure of segregation which we have used extensively in our previous research of school
segregation in North Carolina. Though not of particular usefulness for this paper, a major
advantage of the gap-based measure is that it can be readily decomposed into segregation
between and within schools.
A drawback to measures of racial imbalance such as the gap-based segregation index and

6For expositions of this index, see, for example, Theil 1972 or Iceland 2002.
9
the dissimilarity index is that, because they are calculated by dividing the relevant population
into two groups, they cannot reflect differences in racial balance among multiple groups. One
index that is able to account for multiple groups is the entropy index, based on Theil’s
information theory where g indexes racial groups and j indicates schools. A district’s entropy
index is
H = 3 tj (F - Fj ) / F
j
where tj is school j’s proportion of district enrollment,
Fj = 3 pgj ln (1/pgj), and
g
F = 3 pg ln (1/pg) , g
where pgj is group g’s proportion in school j, and pg is group g’s proportion of district
enrollment.6 We divide students into four groups: white, black, Hispanic, and other nonwhites.
Like the other two measures of racial imbalance, noted above, H has a maximum value of 1,
indicating schools that are completely separated by race, and a minimum value of 0, indicating
racially balanced schools.
Level of Analysis
Quite apart from the concept of segregation employed, another issue central to the
measure of school segregation is the level of analysis. The standard approach is to measure
segregation across schools within a single school district. That is the approach implicit in the
summary measures cited at the beginning of the paper and also in our discussion of the various

7In our earlier work, we used classroom-level data on racial composition for the entirestate of North Carolina. We found only a minimal amount of within-school segregation inelementary schools. At secondary schools, which are more likely to employ tracking and othercurricular policies that separate students on different academic tracks, within-school segregationis more prominent. We found evidence that all forms of segregation, both within- and between-school, increased between 1994 and 2001. These increases were found in both urban and ruraldistricts, and in parts of the state varying widely in terms of racial composition.
8 For an explanation of the decomposition into these two parts, see Clotfelter (1999) orClotfelter, Ladd, and Vigdor (2003); for a discussion of these changes over time, see Clotfelter(2004, chapter 2). The last of these also includes the effect of private school enrollment, but thequantitative effect of that aspect is not large.
10
definitions of racial segregation. Although we have used data at the classroom level to measure
segregation in some of our previous work (Clotfelter, Ladd, and Vigdor 2003), we are restricted
to data collected at the school level for the analysis in this paper.7 In some of our work, we have
also examined segregation at the metropolitan area level, making it possible to separate
segregation attributable to racial disparities within school districts – the basis for conventional
measures – from that due to racial disparities between school districts. It turns out that changes
in school segregation at the metropolitan level between 1970 and 2000 were affected by contrary
movements in these two components: the movement of whites to suburban school districts
caused segregation of the second variety to increase at the same time that within-district
segregation was declining.8
In this paper, we restrict our attention to segregation within school districts. Consequently
changes in measures of segregation based on imbalance, which effectively abstract from any
changes in the racial composition of the district, will fail to pick up any new segregation that
results from growing racial disparities between districts within a metropolitan area. In contrast,
changes in measures of racial isolation at the district level inevitably reflect in part changes in the

9 Percentage based on K-12 enrollments from the NCES Common Core of Data. Fordistricts that were subject to consolidation or annexation, we included all of the subsequentcomponents throughout the time period of analysis. For school years through 2002/03, the datawere generally available in the Common Core of Data. To supplement these publicly availabledata with information from the most recent school year, we requested from individual districtscomparable data on enrollment by race of each school for the 2003/04 year. A complete listingof these districts is given in Appendix Table 1.
11
racial mix of students in each district, changes that may be the result of differential movement of
students by race across districts within a metropolitan area. In particular, the movement of white
students out of city districts either to suburban districts or to private schools will result in rising
nonwhite proportions in city districts, and, most likely, into greater racial isolation. Because they
reflect different aspects of racial segregation, we therefore draw attention both to measures of
racial isolation and to measures of imbalance to assess whether recent enrollment trends justify
the characterization of “resegregation.” We turn now to that assessment.
III. Segregation Trends in the 100 Largest Southern Districts
We base our analysis on enrollment data for the largest 100 districts in the South and
Border regions (based on 2001/02 enrollments), some of which we have collected ourselves
directly from the districts. These districts represent some 15% of total K-12 enrollment in the
South and Border regions in the 2001/02 school year.9 In size, these districts ranged from 31,190
in Calcasieu Parish (Lake Charles) to 365,343 in Dade County (Miami), Florida. In racial
composition, they ranged from 13.3% nonwhite in Pasco County (suburban Tampa) to 97.5% in
Birmingham, Alabama.
Table 1 presents summary statistics for a number of district characteristics as well as the
six segregation measures defined in the previous section. Means and standard deviations are

12
reported for the 1993/94 and 2003/04 school years, which comprise the endpoints for our panel
dataset. All summary statistics are weighted by enrollment. Most school districts in our sample
experienced substantial population growth during this time period, reflecting strong growth rates
in the region as a whole. Almost all of this growth occurred in the nonwhite population: average
white enrollment shows virtually no trend, and the nonwhite share of enrollment increased by ten
percentage points over ten years. The bottom panel of the table refers to information related to
judicial decisions to which we will return in section IV. At this point, we simply note that
districts in the Fourth Circuit serve about 1 out of 4 students in the sample and that districts in
the Eleventh District serve more than a third of the students.
With respect to trends in segregation, the table shows a small increase in one measure, the
dissimilarity index, and a substantial increase in the percent of black students in 90-100 percent
nonwhite schools. As shown in the first row, that measure of racial isolation increased from
about 27 percent in 1993-94 to 34 percent in 2003/04. Intriguingly, this trend does not appear to
be attributable to an increased tendency for blacks to attend overwhelmingly black schools. The
share of black students attending 90-100% black schools fell slightly and the exposure rate of
blacks to other blacks ended the decade unchanged. Thus, any increase in racial isolation of
black students appears to have far more to do with the growth in proportions of students who are
neither non-Hispanic white nor non-Hispanic black, the majority of whom are likely to be
Hispanic, than with changes in enrollment patterns of black and white students.
Consistent with the view that district-wide demographic changes are driving the growth
in the proportion of black students in 90-100 percent nonwhite schools, the measures of racial
imbalance show little or no increase in segregation over time. Thus, aside from changes over

10 For the purpose of making the figure, values were interpolated for five districts withmissing data in several years.
13
time in the racial composition of enrollments in the 100 large districts, we find no strong
evidence of a rise in racial segregation.
Figure 1 plots the five segregation measures over time, incorporating enrollment data
from intervening years.10 The graph confirms the basic summary statistics in Table 1. Only the
proportion of black students attending 90-100% nonwhite schools shows any significant time
trend over this ten-year period, a very smooth upward progression spanning the entire ten-year
period. The other five indices, including the proportion of blacks attending 90-100% black
schools, display only a small amount of fluctuation over this time period, with no discernible
drift either upward or downward.
The contribution of students who are neither white nor black to trends in racial isolation
is underscored by Figure 2, which displays the racial composition of the school attended by the
typical white, black, Hispanic, or other nonwhite student in 1993/94 and 2003/04. The graph
shows that students of all races, including whites, tended to witness decreases in the proportion
of non-Hispanic white students in their schools between 1993/94 and 2003/04. The average
share of black students, though generally higher for blacks than for students of other races,
remained virtually unchanged for students of every race. Whites, Hispanics, and students of
other races attended schools that were about 25% black in both 1993/94 and 2003/04. The
typical black student attended a school slightly more than 45% black in both years, as indicated
by the black-black exposure rate in Table 1. In the case of each racial group, the reduction in
white student share was almost exactly compensated by an increase in the proportion of Hispanic

14
and other nonwhite students.
The relative stability of mean values shown in Figure 1 may mask considerable variation
across particular types of districts or between regions. Table 2 shows mean values for two
segregation indices, one measure of racial isolation and one of racial imbalance, at two points in
time for various categories of districts. We categorize districts by region, and, whether central
city, suburban or consolidated, and by percent nonwhite enrollment in the initial year of the
panel, 1993/94 as well as by federal court circuit.
The regional breakdown is of general interest because of the regions’ different histories.
Whereas districts in the Border region generally began to comply with Brown almost
immediately, those in the South were famously reluctant, often aggressively so. The table shows
that the Border districts in the sample tended to have higher levels of racial imbalance and racial
isolation, as well as greater rates of white enrollment loss. However, the ten-year trends in racial
separation, whether measured by imbalance or by racial isolation, appear quite similar in both
regions.
As shown by the next set of categories, school segregation is most severe in districts that
serve central cities of metropolitan statistical areas (MSAs). More than three of every four
students enrolled in these districts in the 1993/94 school year were nonwhite. Over the decade
analyzed here, segregation as measured by imbalance declined somewhat in these districts while
the isolation of black students rose, possibly reflecting the substantial losses in white enrollment
over the period. While continued “white flight” is a sensible explanation for the increased
isolation of black students in central city districts, trends in suburban and city-county

11 For purposes of this analysis, school districts serving independent cities or cities thatattained county-equivalent status prior to World War II are classified as central city districts. Districts affected by this classification rule include Orleans parish (coterminous with the City ofNew Orleans since 1870), Baltimore City, St. Louis City, Newport News, Norfolk, VirginiaBeach, and Washington, DC. Our choice of cutoff date reflects the onset of rapidsuburbanization in the postwar era. Cities consolidating with their overlying counties afterWorld War II, including Jacksonville, Miami, Nashville, Augusta, Lexington, and Louisville, areclassified as consolidated districts.
15
consolidated districts imply a more complicated story.11 In these districts, where losses in white
enrollment were much less severe, the proportion of black students in 90-100% nonwhite schools
increased just as rapidly, if not more, than in central city districts. Among the 42 suburban
districts in the sample, for example, ten experienced increases in their percentage nonwhite of 20
points or more. By 2003/04, seven suburban districts had nonwhite percentages of 80% or more.
White enrollments declined the least rapidly in consolidated districts, which helped served to
stabilize their racial compositions. Over the 10-year period, none of the 36 consolidated districts
experienced an increase in the nonwhite percentage as large as 20 points.
Classifying districts by initial percent nonwhite as in the next panel of the tables reveals
some noteworthy differences in trends. Rates of white enrollment loss were largest in majority-
nonwhite districts, a pattern confirmed by the scatterplot in Figure 3. As white enrollment
declined in these districts, the share of black students attending overwhelmingly nonwhite
schools increased, as shown in Table 3. That the segregation indices posted either very modest
gains or declines in the face of these losses implies that districts managed to maintain a similar
degree of racial balance in attendance patterns across schools despite the change in racial
composition. A somewhat different pattern emerges in overwhelmingly white school districts.
12 The federal judicial circuits for the relevant states containing the sample districts are:Fourth: Maryland, North Carolina, South Carolina, and Virginia; Fifth: Louisiana, Mississippi,and Texas; Sixth: Kentucky and Tennessee; Eighth: Missouri; Eleventh: Alabama, Florida, andGeorgia; D.C.: D.C.
16
The final panel refers to differences by federal judicial circuit.12 We return to these
differences later in the paper.
For a comprehensive overview of changes in segregation and racial isolation between
1993/94 and 2003/04, Figures 4 and 5 show scatterplots of index values from the two years, with
a 45-degree line separating those districts experiencing increases from those exhibiting decreases.
In Figure 4, the gap-based measure of racial imbalance displays some mean-reversion over time.
Districts experiencing increases in segregation tended to have low levels to start with, while
those with high levels were more likely to decrease than increase. Figure 5, which plots the share
of black students attending 90-100% nonwhite schools in the two years, shows a cluster of points
near zero in both years, but a generally larger collection of points above the 45-degree line,
highlighting the general increase in this measure of racial isolation.
IV. Changes in the Legal Landscape
We now turn to the more complex question of what role judicial actions have played in
the segregation patterns just described. The data presented so far suggest that the relaxation of
judicial constraints may be far less implicated in the changes than analysts such as Orfield have
claimed. Recall that trends in measures of racial isolation such as the percentage of black
students in 90-100 percent nonwhite schools have been used to support the notion that racial
segregation in schools is increasing. Yet, as we have already shown, the rise in this measure is
13 391 U.S. 430 (1968). See also Boger (2000, p. 1733).
17
largely attributable to the changing demographics of the districts in our sample. Because our
measures of racial imbalance are not affected by such changes, they provide a “cleaner” measure
of the segregation that results from district level decisions about student assignment. Given that
these measures show no upward trend over time, one might conclude that there is nothing left to
be explained by the court decisions. At the same time, however, because residential segregation
declined during the same 10-year period, it could be that in the absence of judicial decisions,
segregation in the schools would have declined. In addition, because court decisions apply to
particular districts or sets of districts, such decisions could help explain the variation in trends
across districts.
Before turning to our empirical analysis we provide some background regarding federal
judicial rulings in desegregation cases, with emphasis on those rulings relating to racial balance
in school assignments and declarations of unitary status. As we will show, identifying the judicial
actions relevant to our empirical analysis is not an easy task. We begin with rulings in which the
courts declared districts to be unitary, and, hence, no longer subject to active judicial oversight.
Unitary Status
The Supreme Court’s 1968 decision in Green v. County School Board of New Kent
County stated emphatically that segregated, or “dual,” school systems could not meet the
admonition promulgated in Brown unless racially identifiable schools were eliminated.13 As one
of six factors set down in this case, this pupil assignment criterion suggested, but did not dictate,
racial balance as a desideratum. Three years later, in Swann v. Charlotte-Mecklenburg Board of

14 “No per se rule can adequately embrace all the difficulties of reconciling the competinginterests involved; but in a system with a history of segregation the need for remedial criteria ofsufficient specificity to assure a school authority’s compliance with its constitutional dutywarrants a presumption against schools that are substantially disproportionate in their racialcomposition.” Swann v. Charlotte-Mecklenburg Board of Education, 402 U.S. 1, 26 (1971).
15 402 U.S. 1 (1971); Armor (1995).
16 402 U.S. 1, 31 (1971). Some critics maintain that lower courts ignored this distinction,instead equating desegregation with racial balance. See, for example, Armor (1995, p. 32).
17 498 U.S. 237 (1991); 503 U.S. 467 (1992); Boger (2000, p. 1737).
18
Education, the Court came close to ordering just that, stating “a presumption against schools that
are substantially disproportionate in their racial composition."14 Ratifying a plan that paired
schools and transported students across the district to achieve racially balanced schools, the
decision set off a series of lower court decisions in the South and Border states that employed
methods such as these to achieve racially balanced schools.15 In the same decision, however, the
Court also implied that court supervision, and thus extraordinary measures to maintain racial
balance in schools, along with racial guidelines for schools, would not be a permanent state of
affairs. Once deemed unitary, a school district would not have to make continual adjustments to
maintain racially balanced enrollments in its schools.16
In Green and Swann, therefore, the Court set the stage for a district to be freed from
active judicial oversight once it had been declared unitary. In two decisions, Board of Education
of Oklahoma v. Dowell (1991) and Freeman v. Pitts (1992), the Supreme Court clarified what it
meant to be deemed unitary.17 After a district has shown a good-faith effort to eliminate vestiges
of past segregation and has satisfied the requirements of Green, it stated, the district can be
declared unitary, after which any racial imbalance among its schools arising from residential

18 See, for example, Armor (1995, pp. 52-54); Orfield and Eaton (1996, p. 2) state:“These decisions view racial integration not as a goal that segregated districts should strive toattain, but as a merely temporary punishment for historic violations, an imposition to be liftedafter a few years. After the sentence of desegregation has been served, the normal, “natural”pattern of segregated schools can be restored.”
19 The decisions are Capacchione v. Charlotte-Mecklenburg Schools, 57 F. Supp. 2d 228(W.D.N.C. 1999), Eisenberg v. Montgomery County Public Schools, 197 F.3d 123 (4th Cir.1999), and Tuttle v. Arlington County School Board, 195 F.3d 698 (4th Cir. 1999). For adiscussion of these cases, see Boger (2000, pp. 1721, 1740, and 1780).
19
segregation would be permitted.18 Since desegregation orders often entailed extensive micro-
management, very often extending down to the detail of specifying precise attendance boundaries
for individual schools, receiving a unitary status declaration would appear to free a district to
determine student assignments for itself. In fact, however, the practical import of unitary status
has rarely been as simple as the evaporation of outside control, as we discuss below.
Fourth Circuit Rulings on Race-conscious Assignment
A related but distinct legal question is whether a district not under court order to
desegregate – either by having been declared unitary or by never having been subject to an order
– can base school assignments by race. Needless to say, any desegregation plan that aimed at
racial balance had to devise assignment patterns that would keep all schools in a district close to
the district’s overall racial composition. But in a series of decisions meant to apply to districts
not under court order, the Fourth Circuit Court of Appeals ruled that race could not be used in
assigning students, presumably making it impossible for a district to maintain racial balance
through the adjustment of student assignments.19 Boger (2000, p. 1794) warns that these
decisions could have dire consequences:

20 As of this writing, two federal district courts have allowed racially conscious schoolassignment plans, citing Grutter and Gratz, but one circuit’s court of appeals has disallowedanother such plan, citing the same decisions. See Comfort v. Lynn School Committee (2003),McFarland v. Jefferson Co. Public Schools (2004), and Parents Involved in Community Schoolsv. Seattle School District, No. 1 (2004).
20
if willing school boards cannot assign students by race or ethnicity, we risk a rapid return
to a time when each school child could, and did, identify “white schools” and “black
schools” simply by reference to the predominant race of the children attending them. Far
more certainly than school boards’ good-faith efforts to assure of educational diversity,
this de facto resegregation of our schools will re-create the conditions condemned in
Brown in 1954.
As of this writing, the legal status of these Fourth Circuit rulings remains unsettled. The
Supreme Court’s 2003 decision in Grutter v. Bollinger reaffirmed that race could be taken into
consideration in making admissions decisions to a law school if this aspect were merely one part
of a full evaluation of candidates; it is as yet uncertain how this ruling will be applied to K-12
school assignment plans that take race into account.20 And whether these Fourth Circuit rulings
could have influenced the decisions of school districts before 1999, when they were handed
down, is highly uncertain. Only to the extent that school districts in the Fourth Circuit
anticipated the subsequent rulings could the rulings have had an impact before 1999.
Variations in the Meaning of Unitary Status
Overlaying these general legal issues is local particularity. Each district has its own
particular history of policies, political forces, issues in dispute, rulings, and compliance, and the
meaning of unitary status has likewise differed across districts, to be sure. A few districts seem
to present clear cases of how changes in judicial doctrine can open the door to de facto

21 Website of the Charlotte-Mecklenburg Schools,www.cms.k12.nc.us/discover/narrative.asp, last visited 1/31/03.
21
segregation. Two such examples are Charlotte-Mecklenburg and Winston-Salem/Forsyth, North
Carolina. After tiring of the extensive pairing and busing plan made famous in the Swann case
for more than 20 years, Charlotte-Mecklenburg in 1992 launched a magnet school program,
hoping to attract whites to downtown schools voluntarily, with racial balance maintained by
quotas for acceptance. It was these quotas that were challenged, successfully, establishing one of
the Fourth Circuit’s rulings against race-conscious assignments (Capacchione v. Charlotte-
Mecklenburg Schools, 2001). The school board adopted a new student assignment plan (in the
fall of 2002) allowing families limited choice among schools, but which guaranteed most
students the option of attending neighborhood schools.21 The apparent result of this change in
assignment plans was an increase in racial isolation. Whereas the percentage of black students
attending 90-100% minority schools in 1995 was 4%; this share rose to 11% in 2001/02 and 23%
in 2003/04. In the case of Charlotte-Mecklenburg, the change in assignment (2002) occurred
immediately after the official ruling of unitary status (2001).
A similar district with a similar history yields a quite different sequence of dates.
Winston-Salem/Forsyth, another county-wide district in North Carolina, operated a district-wide
busing plan much like Charlotte’s beginning in 1971, making its schools, like Charlotte’s, very
balanced. The district was declared unitary soon thereafter, in 1974, but continued nevertheless
to operate its desegregation plan. In 1995 a newly elected school board voted to adopt a new
approach to student assignment based, like Charlotte’s, on parental choice. The plan divided the
district into eight zones and would, when fully implemented, give each elementary and middle

22 Dawn Ziegenbalg, “Civil-Rights Inquiry into Schools Ending; No Major RedistrictingChanges Expected,” Winston-Salem Journal, January 7, 2000, p. A1; telephone conversationwith Doug Punger, attorney for the Winston-Salem/Forsyth School Board, May 15, 2003.
22
school a unique theme and allow parents to choose their children’s school from among those
within their own geographic zone. Although the school board expressed a wish that the resulting
enrollment patterns would not produce large racial disparities across schools (in the form of a
guideline that no school would deviate by more than 20 percentage points from the district’s
overall nonwhite percentage), no controls were put in place to limit parental choices. Indeed, the
plan did lead to racial disparities among schools, which sparked complaints. After investigating
these complaints, the Office for Civil Rights, in light of the Fourth Circuit decisions disallowing
the use of race in assignment, officially gave its blessing to the plan in 2000, after the district
pledged to create several district-wide magnet schools.22 The resulting measure of racial
isolation, like Charlotte’s, showed increases. The percentage of black students attending 90-
100% minority schools in the district rose from 6% in 1995 to 22% in 2001 and to 23% in 2003.
But unitary status has not always meant handing a district a free pass, as might be inferred
from these two examples from North Carolina. To be sure, in some cases a court’s declaration
that a district is unitary has been by all appearances an official blessing with few strings attached.
The unitary declarations covering such districts as Oklahoma City in 1991, Chatham County
(Savannah) in 1994, DeKalb County (suburban Atlanta) in 1996, Muscogee County (Columbus,
GA) in 1997, and the Florida districts of Dade (Miami), Duval (Jacksonville), and Hillsborough
(Tampa) in 2001 were more or less unconditional terminations of formal, continuing oversight of
a desegregation plan. In these cases, unitary status meant that the court had formally washed its
hands of further involvement in the details of student assignment and would instead merely stand

23 To illustrate, the decision in Muscogee County stated: “The district court's conclusionsthat the school board has eliminated the vestiges of de jure segregation as far as practicable andthat the school board has shown a good faith commitment to and compliance with thedesegregation plan were not clearly erroneous. Accordingly, we affirm the district court's finaldismissal and declaration that the school board has attained unitary status.” Lockett v. MuscogeeBoard of Education, 111 F.3d 839 (1997). Other references are: Oklahoma City: Dowell ex rel.Dowell v. Board of Educ., 778 F.Supp. 1144 (1991); Chatham County: US and Stell v. Savannah-Chatham County Board of Education, 860 F. Supp. 1563 (1994); DeKalb County: Mills v.Freedman, 942 F. Supp. 1449 (1996); Dade County: “Miami District Declared Unitary,”Education Week, July 11, 2001; Duval: NAACP v. Duval County, 273 F.3d 960 (2001); Hillsborough : Manning v. Board of Public Instruction of Hillsborough County, 244 F.3d 927,(2001). The Dade County decision allowed the district to maintain race conscious programs until2002.
24 Kathleen Kennedy Manzo, “Curtain Falls on Desegregation Era in Nashville,”Education Week, October 7, 1998; http://www.edweek.org/ew/vol-18/06deseg.h18, last visited7/6/04.
23
by to adjudicate any new complaint alleging racial discrimination.23 But in more than a few
instances, unitary status has been granted only with strings attached. In these cases, unitary status
was merely one component of a broader consent decree or other agreement in which the district
commits itself to certain practices for some period. Nor do unitary declarations always coincide
with the end of court supervision. Five examples serve to illustrate the varied meanings of
unitary status.
First, Nashville-Davidson was ruled unitary in 1998, but only as part of a negotiated
agreement that allowed the district to replace its cross-district busing plan and the accompanying
racial goals for schools with a plan that allowed students to choose neighborhood schools or
magnets but also obligated the district to spend some $200 million over the following five years
on construction and renovation of schools, many in predominantly black neighborhoods.24
Second, in Lee County (FL), a federal judge declared the district unitary in 1999, but did not end
supervision until 2004. And these declarations were made only after the school district agreed to

25 Dave Breitenstein, “‘Children Have Changed Our Community” Lee Official Says,”Naples Daily News, May 16, 2004; http://www.naplesnews.com, last visited 7/6/04.
26 For the 2000/01 to 2002/03 years, the previous assignment plan would be continued;for the 2003/04 to 2006/07 years, a controlled choice plan would be implemented wherebyschools would have no more than 42% black enrollments. U.S. District Court, Case No. 8:64-CV-98-T-23B. http://www.pinellas.k12.fl.us/usi/htm/FinalOrder.pdfSchool Board of Pinellas County, Choice Plan, October 24, 2000 http://www.pinellas.k12.fl.us/USI/choiceplan.html
24
consult with a Unitary School System Advisory Committee regarding certain future decisions,
including changes in its student assignment plan and school opening or closings. The school
district also committed itself to continuing a school choice plan that would keep minority
populations in the bulk of its schools within 20 percentage points of the system average.25 Third,
Pinellas County (FL) was declared unitary by a federal district court in 2000, but only subject to
the terms of a negotiated settlement that called for a seven-year transition from an existing
attendance plan utilizing magnet schools and assignments designed to achieve racial balance to a
choice plan that would eventually be unconstrained by racial controls.26
Fourth, as part of a settlement in 2003, the Fulton County (GA) school district agreed to
continue its longstanding minority-to-majority transfer policy for nine years and to examine
enrollments in advanced placement and foreign language courses in its predominantly black
southern schools (Fulton Co., p.6). Fifth, a federal court’s unitary declaration for East Baton
Rouge was similarly made subject to an agreement, covering in this case the succeeding four
school years. This agreement requires the district to continue its existing system of magnet
schools, specifying a target racial composition of 55% black for them and appointing an
independent overseer for the program, continue and actively recruit for its majority-to-minority

27 For magnet schools the agreement specified a target racial composition of 55% blackand 45% nonblack. It give preference to students nearby and who attend racially identifiableschools. “Final Settlement Agreement,” U.S. District Court for the Middle District of Louisiana,Civil Action 56-1662-D-M3, July 16, 2003. See also website for U.S. Attorney, http://www.usdoj.gov/usao/lam/press/press0204.html.
28 Hendrie, Caroline. 1999. “Settlement Ends St. Louis Desegregation Case.” EducationWeek March 24, 1999. (http://www.edweek.org/ew/vol-18/28louis.h18)
25
transfer policy, with rules for transfers stated in terms of specific racial compositions, provide
free transportation for both of these programs, attempt to further desegregation in redrawing
attendance lines, make additional expenditures for certain schools, and continue pre-kindergarten
programs.27 A sixth example, though not technically a unitary declaration, was the ending of
federal oversight over the St. Louis district in 1999. There the court made this withdrawal
subject to a detailed settlement, by which the district agreed to continue operating its group of
magnet schools and the state agreed to continue funding the city-to-suburb transfer voluntary
busing program and to finance the construction and renovation of schools in the district.28
Thus unitary status, or the ending of judicial oversight of a desegregation plan, has meant
different things in different districts at different times. Nor can it be assumed that districts never
subject to any desegregation order, such as Montgomery County, Maryland or Cumberland
County, North Carolina, are not influenced by federal court rulings. As noted above,
Montgomery County was the district to which one of the Fourth Circuit rulings regarding race-
conscious school assignments applied. For districts not under a specific court order, school
boards must worry about potential law suits or federal sanctions arising from the 1964 Civil
Rights Act, by which the federal government can cut off funding to discriminating districts. To

29 The years in which districts in our sample were declared unitary are listed in AppendixTable 1. A detailed summary of the sources used to make these designations is available athttp://www.pubpol.duke.edu/people/faculty/clotfelter/.
26
recap, then, there is no one-to-one connection between unitary status and freedom to return to de
facto segregation.
Because of the importance attached to unitary status in discussions of resegregation, we
have endeavored to ascertain for each of the 100 districts analyzed in the current paper whether
the district has been deemed unitary and, if so, when that declaration was made. For this
purpose, we have drawn on a variety of sources, including published court decisions, district web
pages, and news reports.29
V. The Impact of Court Rulings
We focus here on two main aspects of judicial rulings: the declaration of unitary status
and whether or not a district is located in the Fourth Circuit and, hence, subject to that circuit’s
admonitions to eschew the use of race in student assignments. We begin with some simple trend
analysis and then turn to a more complete multivariate model that permits us to isolate the effects
of the court decisions from other changes.
Role of Fourth Circuit Decisions
The bottom panel of Table 2 above provides some initial insight into the role of the
Fourth Circuit decisions, with attention to our two preferred measures of segregation, one that
measures racial isolation and one that measures racial imbalance. If, as Boger (2000) argues, the
admonitions in that circuit against race-based student assignments had teeth, one might expect

27
segregation to rise more over the period in the Fourth Circuit than in other federal circuits.
Indeed, the two districts with the largest increases in the segregation index over the period,
Charlotte-Mecklenburg and Winston-Salem/Forsyth, are both in the Fourth Circuit. For the
circuit as a whole the table entries confirm that pattern. During the 10-year period, racial
isolation increased in all of the circuits identified, but it grew far faster in the Fourth Circuit (57
percent) than in the other circuits (10 to 33 percent). With respect to racial imbalance, as
measured by the gap-based segregation index, only the Fourth Circuit exhibited an increase –
and quite a substantial one at that – in its segregation index. In each of the other relevant federal
court circuits, schools became less racially unbalanced over the 10-year period. Thus we have
some initial evidence that the rulings in the Fourth District exacerbated segregation.
Unitary status
Our initial trend analysis of unitary status leads to a different conclusion. For this purpose
we compared the trend in the proportion of students attending schools in districts deemed to
unitary to the trends in segregation indexes. The bottom panel of Table 1 shows that by 2003 a
far higher percentage of students in our sample districts were attending schools in districts
declared unitary than in 1993, and Figure 6 shows how the number of districts so designated
increased year by year. Between 1993 and 1999, the fraction of districts deemed unitary,
weighted by enrollment, increased gradually, from about 12% to just over 20%. Starting in 1999
and continuing over the next three years, the rate of growth increased markedly, with the
(weighted) share of districts with unitary status increasing from just over 20% to 45%. This
clearly nonlinear pattern contrasts with the smoother trends exhibited by segregation indices in

30 The sample covers years from 1993/94 to 2003/04, with these exceptions necessitatedby missing data in the Common Core of Data. Data for Georgia districts in 1992/93 weremissing, which necessitated omitting observations in 1993/94, owing to the use of laggedvariables. School-level data for Tennessee districts were missing in 1997/98 and 1999/2000 to2002/03, making it impossible to calculate segregation measures for those years.
28
Figure 1. Were unitary status responsible for a large portion of the increases in segregation, we
would expect a break in trend coinciding with or following closely the surge in unitary status
declarations after 1999. But the trends in segregation are not consistent with this supposition;
indeed, with one exception our measures of segregation are not even rising. At first blush,
therefore, we find little reason to blame judicial decisions relating to unitary status for any rise in
segregation levels. This conclusion must be tempered, however, considering that the
counterfactual is not clearly specified and the possibility that any effects of unitary status might
occur with a substantial lag. For these reasons we turn to a more comprehensive multivariate
analysis.
Multivariate Regression Analysis
Beyond enabling us to simultaneously examine the impact of multiple explanatory
factors, the analysis in this section expands on the simple examination of trends above by
introducing cross-sectional variation in segregation. As Figures 4 and 5 indicate, districts
differed widely in their experiences over time.
The ordinary least squares regression estimates in Table 3 use three segregation measures
as dependent variables: a racial isolation measure (the fraction of black students attending
schools with nonwhite shares between 90 and 100%) and two racial imbalance measures (the
gap-based measure of segregation between whites and nonwhites and the entropy index).30 The

31 Nor do F-tests of the coefficients in columns 1 and 2 allow us to reject the hypothesisthat either racial isolation or racial imbalance was the same in all years.
29
specifications in columns (1), (2) and (3) include only year fixed effects, to illustrate the overall
time trend in each segregation measure. In all three columns, none of the coefficients on
individual year indicator variables is statistically distinguishable from zero, indicating that we
cannot reject the hypothesis that differences in segregation between 1993 and any subsequent
year are due to random fluctuations in the data.31 In general, the coefficients confirm the
patterns shown in Figure 1: the racial isolation measure trends upward over time, while there is
no discernible trend in either measure of racial imbalance.
In columns (4) through (6), we add a number of controls for school district
characteristics, including an indicator variable for whether a district had been declared unitary by
a particular year. Comparison of columns (1) and (4) reveals that this set of control variables is
sufficient to explain the upward trend in racial isolation over time. The only statistically
significant coefficient on a time-varying variable in this regression pertains to the lagged
nonwhite share of enrollment in the district. As suggested by much of the simple evidence
presented above, the best explanation for the increasing proportion of black students attending
overwhelmingly nonwhite schools is the relative increase in the nonwhite, non-black population
in the districts they attend.
We find significant associations between segregation and several time-invariant control
variables. Physically large districts tend to be more segregated, holding enrollment levels
constant. This may reflect the desire in lower density districts to reduce overall transportation
costs by operating more schools. Operating more schools, in turn, enables greater separation of

30
students by race. Districts with a greater proportion of nonwhite students also tend to be more
segregated by either measure. Such a pattern would occur, for example, if “white flight” tends to
occur when the nonwhite share in a white student’s school exceeds a certain threshold, and
districts take explicit or implied actions to ensure that this threshold is not exceeded (Clotfelter,
Ladd and Vigdor 2003).
Coefficients on judicial circuit indicator variables show no evidence of persistently higher
segregation levels in the Fourth Circuit. In fact, school districts in the Fourth Circuit have the
lowest proportion of black students attending 90-100% nonwhite schools, controlling for other
factors. It is important to note that this coefficient tests only for a permanent difference in
segregation levels across appeals court circuits. In Table 2 above, we found suggestive evidence
of differential trends in segregation across circuits. We test the hypothesis of differential trends
in a regression framework below.
As shown in column (4), unitary status is not significantly related to racial isolation. In
contrast, we find evidence in columns (5) and (6) that districts covered by a unitary status ruling
tend to have higher degrees of racial imbalance across schools. The statistically significant
positive coefficient in (5) indicates that such districts tend to have white-nonwhite segregation
indices almost four percentage points, roughly one-third of a standard deviation, higher than
otherwise equivalent districts without unitary status. The estimated effect of unitary status on the
entropy measure is also statistically significant, but smaller, roughly one-fifth of a standard
deviation. Whether these findings represent a causal effect of unitary status or simply a positive
correlation between being unitary and having other factors that raise segregation is impossible to
say.

31
Table 4 presents results from two alternative specifications that expand the set of control
variables to include some related to time. To examine the possibility that the Fourth Circuit’s
prohibition of race-conscious school assignments might have led to greater segregation over
time, in columns (1) through (3) we interact the Fourth Circuit indicator with a linear time trend.
The main linear time trend effect in this specification is subsumed by the year fixed effects. The
results in columns (2) and (3) show that racial imbalance in school districts within the Fourth
Circuit increased significantly over time relative to similar districts served by other federal
circuits. A similar result does not hold when the racial isolation index is substituted for the
measure of imbalance (column (1)). Because it was not until 1999 that the Fourth Circuit Court
of Appeals handed down their decisions prohibiting race-conscious student assignments, one
would not expect any effort before that year except to the extent the decision was anticipated.
When we added additional variables to allow for a change in circuit effect in that year, however,
we obtained statistically insignificant estimated coefficients, leaving us unpersuaded that these
decisions were responsible in any increase in segregation by the end of our sample period.
Columns (4) through (6) test for a potential lagged impact of unitary status rulings, by
replacing the single unitary status indicator variable with a series of four mutually exclusive
indicators, which indicate whether a district was declared unitary in the year of observation, one
year earlier, two years earlier, or three or more years earlier. As in previous specifications, there
is no significant impact of unitary status on our measure of racial isolation, shown in column (4).
The last two regressions in this table, however, show significant evidence of a latency period of
at least three years between the declaration of unitary status and a significant impact on our

32
measure of racial imbalance. In contrast, more recent unitary declarations are not associated with
higher levels of segregation.
There are two reasons to be cautious in interpreting the unitary status results in Tables 3
and 4. First, we have only a limited number of district-specific control variables available. The
positive effect of unitary status in Table 3 and for unitary status after three years in Table 4 are
identified largely by comparing districts that have had unitary status for the duration of our panel
to districts that never received unitary status. Differences between these types of districts could
generate significant variation in racial imbalance even in the absence of court rulings. A second
reason is the potential for serial correlation in the outcome measure of interest. In a panel
framework such as ours, we must be attuned to the possibility of spurious difference-in-
difference estimates rooted in serial correlation in outcomes.
To address both of these concerns, we re-estimated equations (4)-(6) in Tables 3 and 4
using district fixed effects. By so doing, we restricted our ability to observe an association
between segregation and unitary status to those districts in which unitary status actually changed
during the sample period or shortly before. These fixed-effects regressions appear in Table 5.
As in the two previous tables, equation (1) shows that the measure of racial isolation is unrelated
to unitary status. Equations (2) and (3) in the table show that the addition of district fixed effects
greatly attenuates the association with unitary status, the estimated coefficient being about half
the size of the corresponding coefficient in the equation without fixed effects and being
statistically significant only in equation (3). The second set of equations allows for the same type
of lagged effect of unitary status as shown in Table 4. As in those previous equations, there is no
statistically significant association between any of the three measures of segregation and unitary

32 Lutz’s (2004) paper differs in several other ways from ours, including the use ofslightly different measures of segregation and a sample that is larger and which includes districtsoutside of the South and Border states.
33
status declarations in the current year, in the previous year, or in the year before that. However,
for all three of the measures unitary status declarations three or more years before do show a
statistically significant association with the designated measures of segregation. These equations
suggest again that unitary status is associated with increased segregation, but the effect appears
only with a lag. These findings are broadly consistent with those of Lutz (2004). Employing a
model that allows for more flexibility in the time pattern of effects, he finds that the end of court-
ordered desegregation in a district was followed by a gradual linear increase in segregation.32
This delayed response to unitary status is very much in keeping with the common
tendency for courts to attach conditions when declaring school districts to be unitary. As our
review of specific cases indicated, it was typical for the end of court supervision to be
accompanied by an agreement by the school district to continue certain specified practices for a
period of time that would have the effect of maintaining some degree of racial balance in
enrollments. Only when the period covered by those agreements came to an end were districts
really free to chart their own course regarding student assignments, including the return to
neighborhood school assignments and hence to racially imbalanced schools.
VI. Conclusion
Analysis of the 100 largest districts in the South and Border regions shows unmistakably
that public schools in these regions have become more nonwhite over the past ten years. They
have not, however, witnessed a systematic increase in the segregation of white students. Rather,

34
black and white students alike now attend schools with greater proportions of Hispanic, Asian,
and students of other races. This development creates the impression of increasing segregation
when segregation is measured by one widely-used index – the proportion of blacks attending 90-
100% nonwhite schools – but the rise in this measure is the result of demographic change rather
than any growing racial imbalance among schools. As a consequence of the increasing racial
diversification of American schools, this particular measure of racial isolation may have lost
much of its meaning as a measure of racial segregation. All of the other school segregation
measures examined in this paper point to a different conclusion – that the average level of
segregation in large Southern school districts has not changed much over the last decade.
Averages are not the whole story, however. One of our main objectives in this paper has
been to investigate the effect of unitary status declarations by federal courts. A fear has been that
such a declaration essentially gives a district permission to base school assignments solely on
neighborhood residence, which will tend to make schools more racially segregated, given the
segregation in existing housing patterns. The case of Charlotte-Mecklenburg – where a
neighborhood assignment plan and resegregation did indeed follow quickly on the heels of a
unitary declaration – appears to offer graphic justification for this fear. In our regression analysis
examining the experience of 100 districts over 10 years, we found that unitary status is in fact
associated with increased white-nonwhite segregation, in the sense of racial imbalance. Our
estimates suggest that, for the districts serving nearly half of all students in the sample where
courts have issued unitary status declarations, segregation levels were higher than in other
districts. But this result is largely driven by higher segregation rates in districts that were declared
unitary before 1993. For only one of our two measures of racial imbalance do we observe any

33 See Clotfelter, Ladd, and Vigdor (2003) and Clotfelter (2004).
35
effect of unitary status declarations during our sample period, and the size of that effect is only
about as half as large as that implied by previous specifications. The absence of a
contemporaneous effect could be due to the tendency of such declarations to be accompanied by
agreements that placed constraints on the freedom of school districts to return to neighborhood
school assignment or by other factors that delay the effect. We also find that segregation as racial
imbalance increased in districts governed by the Fourth Circuit, the judicial circuit that has most
prominently ruled against racially-conscious student assignments, but that effect is not restricted
to the period after the relevant rulings.
In all but one of the regressions explaining the percentage of blacks in 90-100% nonwhite
schools, neither unitary status nor Fourth Circuit jurisdiction has any explanatory power,
suggesting, as above, that this measure is driven largely by the steady increase in the nonwhite
percentage in the public school population, not by increases in racial imbalance. Only in the
fixed-effect regression using lags is this measure associated at standard levels of statistical
significance with unitary status.
A final caveat is worth re-emphasizing. In this paper, we base our measures of
segregation and racial isolation on disparities between schools in districts. Our analysis
measures neither disparities between districts nor disparities within schools. Nor do our
measures account for segregation arising from private school enrollment. Our previous research
suggests that the first two of these sources of segregation is generally quite important and that the
third can be significant in some localities.33 Although it considers only segregation across
schools in public school districts, however, the current paper is quite relevant to the current

36
concern over resegregation and the role of federal court rulings, for it finds some justification for
fears that the two are linked. Participants in these debates need to be wary of the evidence they
cite, however, especially when using statistics that reflect racial isolation rather than racial
imbalance.

37
References
Armor, David J. 1995. Forced Justice: School Desegregation and the Law. New York:Oxford University Press.
Boger, John Charles, “Willful Colorblindness: The New Racial Piety and theResegregation of Public Schools,” North Carolina Law Review 78 (September 2000), 1719-1796.
Clotfelter, Charles T. 1999. “Public School Segregation in Metropolitan Areas,” LandEconomics 75 (November), 487-504.
Clotfelter, Charles T. 2004. After Brown: The Rise and Retreat of School Desegregation.Princeton, N.J.: Princeton University Press.
Clotfelter, Charles T., Helen F. Ladd, and Jacob L. Vigdor. 2003. “Segregation andResegregation in North Carolina's Public School Classrooms,” North Carolina Law Review 81(May), 1463-1511.
“The Effects of Segregation and the Consequences of Desegregation: A Social ScienceStatement,” Minnesota Law Review 37 (1953), 427-439.
Frankenberg, Erica and Chungmei Lee. 2002. “Race in American Public Schools: RapidlyResegregating School Districts,” The Civil Rights Project, Harvard University, August.
Frankenberg, Erica, Chungmei Lee, and Gary Orfield, A Multiracial Society withSegregated Schools: Are We Losing the Dream? Civil Rights Project, January 2003.
Fulton County Schools. 2003. Annual Report to the Community.http://www.fulton.k12.ga.us/ez/detail.asp?q=160, 7/6/04.
Glaeser, E.L. and J.L. Vigdor. “Racial Segregation: Promising News.” in RedefiningUrban & Suburban America: Evidence from Census 2000, Volume I, B. Katz and R. Lang, eds.,pp.211-234. Brookings Institution Press, 2003.
Iceland, John. 2002. “Beyond Black and White: Metropolitan Residential Segregation inMulti-Ethnic America,” paper presented at the American Sociological Association meetings,August. www.census.gov/hhes/www/housing/resseg/pdf/beyond_black_and_white.pdf, last visited11/27/04

38
Logan, John. 2004. “Resegregation in American Public Schools? Not in the 1990s.”Report, Lew Mumford Center for Comparative Urban and Regional Research, University atAlbany, April 26.
Lutz, Byron F., “After Brown: The Effects of the End of Court-Ordered Desegregation,”unpublished paper, MIT Department of Economics, November 2004.
Massey, Douglas S. and Nancy A. Denton, “The Dimensions of Residential Segregation,”Social Forces 67 (December 1988), 281-315.
NAACP Legal Defense and Educational Fund, Inc., Herschel Lee Johnson, ed. 2000Annual Report. New York: NAACP.http://www.naacpldf.org/content/pdf/pubs/annual/2000_Annual_Report.pdf (7/7/2004).
Orfield, Gary, and Susan E. Eaton. 1996. Dismantling Desegregation: The QuietReversal of Brown v. Board of Education. New York: The New Press.
Orfield, Gary and Nora Gordon, “Schools More Separate: Consequences of a Decade ofResegregation,” unpublished paper, Harvard University, July 2001.
Orfield, Gary and Chungmei Lee. 2004. “Brown at 50: King’s Dream or Plessy’sNightmare?” The Civil Rights Project, Harvard University, January.
Orfield, Gary and Frank Monfort. 1992. Status of School Desegregation: The NextGeneration. Cambridge, MA: Metropolitan Opportunity Project, Harvard University. March.
Theil, Henri. 1972. Statistical Decomposition Analysis. Amsterdam: North-HollandPublishing Co.
CasesBoard of Education of Oklahoma v. Dowell, 498 U.S. 237 (1991).Brown v. Board of Education of Topeka, 347 U.S. 483 (1954).Capacchione v. Charlotte-Mecklenburg Schools, 57 F. Supp. 2d 228 (W.D.N.C. 1999).Comfort v. Lynn School Committee, 28 F. Supp. 2d 328 (D. Mass. 2003).Eisenberg v. Montgomery County Public Schools, 197 F.3d 123 (4th Cir. 1999).Freeman v. Pitts, 503 U.S. 467 (1992).Green v. County School Board of New Kent County, 391 U.S. 430 (1968).Grutter v. Bollinger, 71 U.S.L.W. 4498 (2003).McFarland v. Jefferson Co. Public Schools, 330 F. Supp. 2d 834 (W.D. Ky. 2004).Parents Involved in Community Schools v. Seattle School District, No. 1, 377 F. 3d 949
(9th Cir. 2004)Swann v. Charlotte-Mecklenburg Board of Education, 402 U.S. 1 (1971).

39
Tuttle v. Arlington County School Board, 195 F.3d 698 (4th Cir. 1999).
G:\teachq\ctcdocs\PUBrown\PUBrowndraft20905.wpd

40
Table 1. Mean Values of Variables, Weighted by Enrollment, 100 Districts1993/94 2003/04
Variable Mean Std. dev. Mean Std. dev.
Segregation %B in 90-100%NW schools 0.269 0.303 0.341 0.331 %B in 90-100%B schools 0.170 0.233 0.153 0.231 Black-black exposure 0.464 0.245 0.464 0.237 White-nonwhite segregation 0.201 0.120 0.200 0.101 Dissimilarity index (W-NW) 0.413 0.151 0.426 0.142 Entropy 0.197 0.121 0.195 0.103District characteristics Average district enrollment 88,908 66,188 107,790 82,082 Average white enrollment 37,352 24,448 36,713 26,083 Percent nonwhite 0.503 0.251 0.601 0.225 %NW: 0 to less than 25% 0.170 0.429 0.048 0.465 %NW: from 25 to less than 50% 0.416 0.493 0.324 0.468 %NW: from 50 to less than 75% 0.141 0.349 0.337 0.473 %NW: from 75 to 100% 0.272 0.445 0.291 0.454 Average district land area* 615 543 639 549Type Central city* 0.248 0.483 0.208 0.488 Consolidated* 0.417 0.493 0.426 0.494 Suburban* 0.335 0.472 0.367 0.482Region Border state* 0.159 0.366 0.143 0.350 Southern state* 0.841 0.366 0.857 0.350Judicial characteristics Unitary 0.121 0.326 0.446 0.497 Fourth Circuit* 0.241 0.415 0.244 0.407 Fifth Circuit* 0.272 0.445 0.260 0.439 Eleventh Circuit* 0.374 0.484 0.402 0.490 All other federal circuits* 0.113 0.316 0.094 0.292 Unitary status before 1993* 0.176 0.476 0.161 0.477 Unitary status in ’93-‘03* 0.288 0.453 0.295 0.456 Never became unitary* 0.535 0.499 0.544 0.498
Source: Common Core of Data, unpublished data from districts, and authors’ calculations, for the100 largest school districts in the South and Border in 2001/02. See Appendix 1A for a list ofthe districts.* Difference across years are due to difference in weights used in the averages.
11/30/04

41
Table 2 . Mean V alues of Selec ted Me asures, for Se lected Cate gories, 100 Districts
Racial isolation:
%B in 9 0-100% NW schools
Racial imb alance:
W-NW segregationEntropy
Sample
Number of
districts
Average growth
rate of whites
2003-1993
1993/94
%NW 1993/94 2003/04 1993/94 2003/04 1993/94 2003/04
Full sample 100 -0.017 0.503 0.269 0.341 0.201 0.200 0.197 0.195
Region
Border 15 -0.026 0.517 0.293 0.370 0.228 0.218 0.193 0.192
South 85 -0.015 0.501 0.264 0.336 0.196 0.197 0.218 0.213
Type *** *** *** *** *** * *** ***
Central city 22 -0.044 0.771 0.585 0.660 0.268 0.244 0.304 0.272
Consolidated 36 -0.007 0.448 0.215 0.299 0.196 0.195 0.180 0.191
Suburban 42 -0.013 0.374 0.101 0.210 0.158 0.180 0.140 0.156
% nonwhite, 93/94 *** *** *** *** *** ***
0-25% 24 0.008 0.185 0.019 0.034 0.122 0.159 0.121 0.198
25-50% 39 -0.004 0.371 0.121 0.200 0.190 0.202 0.149 0.222
50-75% 19 -0.034 0.602 0.258 0.399 0.208 0.214 0.183 0.192
75-100% 18 -0.052 0.853 0.655 0.817 0.264 0.220 0.326 0.121
Federal C ircuit ** ** **
Fourth 24 -0.010 0.413 0.133 0.210 0.173 0.203 0.152 0.166
Fifth 32 -0.030 0.629 0.362 0.431 0.191 0.181 0.211 0.190
Eleventh 32 -0.009 0.466 0.262 0.351 0.211 0.203 0.207 0.206
All others 12 -0.031 0.503 0.353 0.390 0.255 0.228 0.230 0.235
Source: C ommon Core of D ata, unpub lished data fro m districts, and authors’ calcu lations, for the 1 00 largest sc hool districts in the South and Borde r in
2001/0 2. See Ap pendix 1 A for a list of the d istricts. Mean s are weighted by district enro llment.
*; **; *** : Means are different from e ach other w ithin the catego ry at 10% level; 5% le vel and 1% level, respec tively.

42
Table 3. Regressions Explaining Segregation and Racial Isolation, Pooled Sample
Independent variable(1)
%B 90-100% NW
(2)W-NW Seg.
(3)Entropy
(4)%B90-100%NW
(5)W-NW seg.
(6)Entropy
Years (omitted 1993)
1994 0.008
[0.047]
0.001
[0.016]
-0.000
[0.016]
0.001
[0.023]
0.008
[0.015]
0.003
[0.012]
1995 0.015
[0.047]
0.001
[0.016]
0.001
[0.016]
-0.002
[0.023]
0.007
[0.015]
0.001
[0.012]
1996 0.022
[0.047]
0.002
[0.016]
0.004
[0.016]
-0.008
[0.023]
0.007
[0.015]
0.003
[0.012]
1997 0.026
[0.047]
-0.003
[0.016]
-0.004
[0.016]
-0.011
[0.023]
0.002
[0.015]
-0.004
[0.012]
1998 0.036
[0.046]
0.003
[0.016]
0.002
[0.016]
-0.007
[0.023]
0.008
[0.015]
-0.000
[0.012]
1999 0.040
[0.047]
-0.002
[0.016]
-0.002
[0.016]
-0.011
[0.023]
0.003
[0.015]
-0.005
[0.012]
2000 0.047
[0.047]
-0.001
[0.016]
-0.002
[0.016]
-0.011
[0.023]
0.002
[0.015]
-0.007
[0.012]
2001 0.056
[0.046]
-0.002
[0.016]
-0.002
[0.016]
-0.014
[0.023]
0.000
[0.015]
-0.011
[0.012]
2002 0.060
[0.046]
-0.001
[0.016]
-0.002
[0.016]
-0.019
[0.024]
-0.001
[0.015]
-0.012
[0.012]
2003 0.070
[0.046]
-0.004
[0.016]
-0.005
[0.016]
-0.017
[0.024]
-0.006
[0.016]
-0.018
[0.012]

43
Lagged lo g(enrollme nt) __ __ __ -0.005
[0.011]
-0.001
[0.007]
0.003
[0.006]
Log(land area) __ __ __ 0.066***
[0.008]
0.039
[0.005]
0.041***
[0.004]
Lagged %NW D istrict __ __ __ 0.972***
[0.029]
0.157***
[0.019]
0.230***
[0.015]
Type (o mitted centra l city)
Consolidated __ __ __ -0.158***
[0.019]
-0.039***
[0.012]
-0.076***
[0.010]
Suburban __ __ __ -0.101***
[0.107]
-0.021*
[0.011]
-0.043***
[0.009]
Federal circuit (omitted
Fifth)
Fourth Cir cuit __ __ __ -0.034**
[0.014]
0.007
[0.009]
-0.005
[0.007]
Eleventh C ircuit __ __ __ 0.034**
[0.015]
0.023**
[0.010]
0.020***
[0.008]
All Others __ __ __ 0.048**
[0.019]
0.042***
[0.012]
0.043***
[0.010]
Unitary status __ __ __ 0.015
[0.013]
0.038***
[0.009]
0.022***
[0.007]
Observations 1070 1070 1070 1061 1061 1061
R2 .00 .00 .00 .72 .20 .41
Note: No GA observations for 2003 due to missing lag of NW%11/4/04

44
Table 4. Additional regressions specifications, with time trend (Year-1992) variable
Independent variable(1)
%B 90-100% NW
(2)W-NW Seg.
(3)Entropy
(4)%B90-100%NW
(5)W-NW seg.
(6)Entropy
Lagged lo g(enrollme nt) -0.005
[0.011]
-0.001
[0.007]
0.003
[0.006]
-0.004
[0.011]
-0.007
[0.007]
0.005
[0.006]
Log(land area) 0.066***
[0.008]
0.039
[0.005]
0.041***
[0.004]
0.066***
[0.008]
0.038***
[0.005]
0.040***
[0.004]
Lagged %NW D istrict 0.972***
[0.029]
0.157***
[0.019]
0.230***
[0.015]
0.973***
[0.029]
0.159***
[0.019]
0.231***
[0.015]
Type (o mitted centra l city)
Consolidated -0.158***
[0.019]
-0.039***
[0.012]
-0.076***
[0.010]
-0.154***
[0.019]
-0.031**
[0.013]
-0.072***
[0.010]
Suburban -0.101***
[0.107]
-0.021*
[0.011]
-0.043***
[0.009]
-0.099***
[0.017]
-0.015
[0.011]
-0.040***
[0.009]
Federal circuit (omitted
Fifth)
Fourth Cir cuit -0.031
[0.026]
0.024
[0.017]
-0.021
[0.013]
-0.035**
[0.014]
0.005
[0.009]
-0.007
[0.007]
Eleventh C ircuit 0.034**
[0.015]
0.024**
[0.010]
0.020***
[0.008]
0.035**
[0.015]
0.025**
[0.010]
0.021***
[0.008]
All Others 0.048**
[0.019]
0.041***
[0.012]
0.043***
[0.009]
0.049**
[0.019]
0.045***
[0.013]
0.044***
[0.010]
Unitary status 0.015
[0.013]
0.039***
[0.009]
0.022***
[0.007]
__ __ __

45
Fourth Circuit*Linear time
trend (Year-1992)
-0.001
[0.004]
0.005**
[0.002]
0.003
[0.002]
__ __ __
Declared unitary this year __ __ __ 0.005
[0.035]
-0.005
[0.023]
0.001
[0.018]
Declared unitary one year
ago__ __ __ 0.001
[0.039]
-0.005
[0.025]
-0.003
[0.020]
Declared unitary two years
ago__ __ __ -0.027
[0.040]
-0.003
[0.026]
-0.001
[0.021]
Declared unitary three or
more years ago__ __ __ 0.022
[0.015]
0.053***
[0.010]
0.029***
[0.008]
Year fixed effects Yes Yes Yes Yes Yes Yes
Observations 1061 1061 1061 1061 1061 1061
R2 .72 .20 .41 .72 .20 .41
Note: No GA observations for 2003 due to missing lag of NW%
11/4/04

46
Table 5: Regressions Explaining Segregation and Racial Isolation, Pooled Sample with DistrictFixed Effects
(1) (2) (3) (4) (5) (6)
%B 90-
100%NWW-NW
seg.Entropy %B 90-
100%NWW-NW
seg.Entropy
Laggedlog(enrollment)
-0.172***
[0.027]
0.044***
[0.013]
0.011
[0.012]
-0.169***
[0.027]
0.045***
[0.013]
0.013
[0.012]
Lagged %NW 0.762***
[0.078]
0.004
[0.038]
0.087**
[0.035]
0.782***
[0.077]
0.015
[0.038]
0.096***
[0.035]
Unitary status 0.014
[0.009]
0.004
[0.005]
0.011***
[0.004]__ __ __
Unitary statuscurrent year
__ __ __ -0.001
[0.012]
-0.006
[0.006]
0.003
[0.006]
Unitary status pastyear
__ __ __ 0.015
[0.014]
0.002
[0.007]
0.009
[0.006]
Unitary status twoyears ago
__ __ __ 0.004
[0.014]
0.009
[0.007]
0.012*
[0.006]
Unitary statusthree or moreyears ago
__ __ __ 0.055***
[0.013]
0.022***
[0.007]
0.030***
[0.006]
N 1061
.48
1061
.04
1061
.31
1061
.50
1061
.07
1061
.31R2
Year fixedeffects?
Yes Yes Yes Yes Yes Yes
11/24/04

47
Figure 1. Measures of Segregation, Isolation, and Interracial Exposure, 100 Districts, 1993/94 to2003/04.
Note: Data interpolated for 5 districts in TN due to missing data in 1997, 1999-2002.
11/30/04

48
Figure 2. Exposure Rates by Race and Overall Racial Composition, 100 Districts, 1993/94 and 2003/04
Source: See Table 1.
Note: Each of the first eight bars gives the racial composition for the school attended by the typical student of each
indicated racial group for the indicated year. The last two bars give the overall racial composition of schools in the
100 districts.
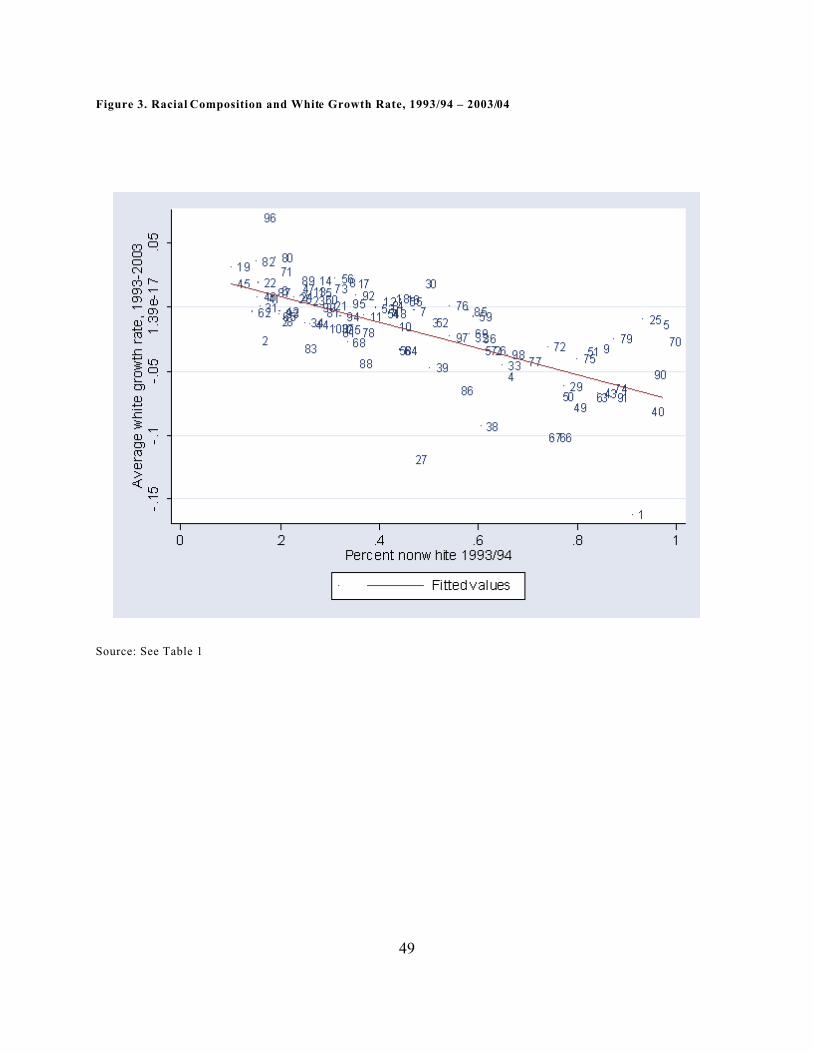
49
Figure 3. Racial Composition and White Growth Rate, 1993/94 – 2003/04
Source: See Table 1

50
Figure 4. White-nonwhite Segregation Index, 1993/94 and 2003/04
Source: See Table 1

51
Figure 5. Percentage of Black Students in 90-100% Nonwhite Schools, 1993/94 and 2003/04
Source: See Table 1

52
Figure 6. Districts in Sample with Unitary Status (fraction of total enro llment)
Source: See text

53
Appendix Table 1. 100 Largest School Districts in South and Border States, 2003/04.
Percentageblack students
Percent in schoolsnonwhite Segregation Dissimilarity 90-100% Entropy Unitary
State District Obs. # Enrollment (%) index index nonwhite (%) measure statusAlabama Birmingham City 01 34,377 98.1 0.291 0.653 99.1 .341 Jefferson Co. 02 38,631 30.7 0.293 0.468 5.4 .244 Mobile Co. 03 64,975 54.1 0.503 0.646 61.6 .432 1997 Montgomery Co. 04 32,521 78.1 0.329 0.614 68.7 .310DC D.C. Public Schools 05 58,075 95.4 0.397 0.854 93.5 .448Florida Brevard Co. 06 75,800 24.5 0.096 0.285 0.0 .095 Broward Co. 07 271,353 64.5 0.210 0.393 45.3 .194 1994 Collier Co. 08 38,347 50.5 0.272 0.438 18.8 .180 Dade Co. 09 358,173 89.9 0.136 0.456 83.3 .330 2001 Duval Co. 10 123,786 53.2 0.207 0.358 25.5 .174 2001 Escambia Co. 11 44,572 42.4 0.193 0.353 13.4 .146 Hillsborough Co. 12 181,504 53.9 0.161 0.339 11.7 .136 2001 Lee Co. 13 64,758 39.4 0.076 0.246 0.0 .082 2004 Manatee Co. 14 41,843 37.5 0.172 0.338 7.0 .116 Marion Co. 15 39,983 34.6 0.084 0.236 1.2 .084 1995 Orange Co. 16 168,334 60.4 0.190 0.369 36.4 .185 Osceola Co. 17 43,874 59.2 0.236 0.416 2.0 .132 Palm Beach Co. 18 171,848 56.5 0.256 0.448 30.3 .202 2002 Pasco Co. 19 55,859 17.4 0.099 0.277 5.2 .091 Pinellas Co. 20 119,948 31.6 0.105 0.296 0.0 .095 2000 Polk Co. 21 80,982 40.2 0.073 0.215 0.0 .077 2000 Sarasota Co. 22 39,273 23.4 0.197 0.367 14.1 .162 Seminole Co. 23 64,192 36.3 0.063 0.209 0.0 .055 Volusia Co. 24 63,383 29.9 0.132 0.309 0.0 .148Georgia Atlanta City 25 51,315 92.8 0.534 0.847 92.4 .479 1975 Chatham Co. 26 33,364 71.7 0.218 0.440 43.5 .189 1994

54
Clayton Co. 27 49,854 88.3 0.074 0.321 50.3 .097 Cobb Co. 28 100,999 44.4 0.292 0.479 12.2 .246 DeKalb Co. 29 96,875 89.8 0.355 0.741 89.1 .405 1996 Fulton Co. 30 73,138 57.4 0.392 0.582 62.8 .350 2003 Gwinett Co. 31 128,386 49.6 0.205 0.384 9.3 .130 Muscogee Co. 32 32,076 67.0 0.309 0.541 51.8 .242 1997 Richmond Co. 33 32,969 76.4 0.244 0.492 50.4 .204Kentucky Fayette Co. 34 32,624 32.8 0.114 0.295 0.0 .109 Jefferson Co. 35 92,694 42.6 0.088 0.250 0.0 .069 2000Louisiana Caddo Parish 36 43,209 63.6 0.351 0.568 51.1 .309 2001 Calcasieu Parish 37 31,096 35.3 0.488 0.615 49.5 .396 East Baton Rouge Parish 38 44,876 79.2 0.242 0.531 56.6 .245 2003 Jefferson Parish 39 49,739 64.6 0.171 0.352 18.1 .144 Orleans Parish 40 64,461 96.4 0.329 0.768 97.0 .366 St. Tammany Parish 41 34,218 20.3 0.111 0.319 0.0 .105Maryland Anne Arundel Co. 42 73,262 27.5 0.223 0.424 5.2 .160 Baltimore City 43 91,738 90.7 0.342 0.676 81.2 .368 Baltimore County 44 108,792 44.1 0.371 0.523 45.9 .281 Frederick Co. 45 38,519 15.8 0.150 0.434 0.0 .133 Harford Co. 46 40,015 22.1 0.190 0.475 0.0 .165 Howard Co. 47 46,516 34.5 0.102 0.269 0.0 .069 Montgomery Co. 48 136,915 55.1 0.185 0.363 4.9 .124 Prince George’s Co. 49 137,177 91.9 0.166 0.532 80.1 .237 2002Missouri Kansas City School District 33 50 30,472 85.7 0.251 0.523 72.7 .317 2003 St. Louis City 51 37,142 84.9 0.258 0.599 66.8 .294 1999*N Carolina Cumberland Co. 52 53,584 59.9 0.143 0.333 6.1 .090 Forsyth-Winston-Salem Co. 53 46,354 49.7 0.244 0.411 21.7 .184 1974 Guilford Co. 54 66,733 54.8 0.286 0.458 35.7 .198 Charlotte-Mecklenburg 55 113,729 58.6 0.302 0.490 22.5 .192 2001 Wake Co. 56 108,175 41.6 0.092 0.256 0.6 .085Oklahoma Oklahoma City 57 38,180 72.6 0.142 0.335 34.4 .224 1991 Tulsa City 58 41,413 59.7 0.162 0.326 29.2 .157S Carolina Charleston Co. 59 42,901 60.0 0.369 0.569 39.2 .291 1992

55
Greenville Co. 60 63,452 35.6 0.156 0.321 3.5 .118 1985Tennessee Hamilton Co. 61 40,507 38.3 0.433 0.564 36.0 .352 1986 Knox Co. 62 52,698 18.1 0.232 0.415 5.1 .214 Memphis City 63 116,857 92.1 0.308 0.710 86.2 .340 Nashville-Davidson Co. 64 70,002 59.7 0.151 0.316 11.9 .152 1998 Shelby Co. 65 47,042 33.1 0.204 0.366 7.5 .154Texas Aldine 66 53,086 93.3 0.031 0.251 79.9 .089 Alief 67 43,188 93.1 0.032 0.279 82.5 .045 Arlington 68 59,301 59.3 0.237 0.425 3.4 .142 Austin 69 73,922 68.3 0.347 0.564 49.0 .150 1983 Brownsville 70 42,687 98.1 0.014 0.379 100.0 .095 Conroe 71 38,102 28.4 0.164 0.348 0.0 .126 Corpus Christi 72 37,899 79.4 0.148 0.419 41.6 .128 Cypress-Fairbanks 73 72,623 47.2 0.147 0.318 0.0 .084 Dallas 74 152,684 93.6 0.192 0.600 86.1 .301 2003 El Paso 75 60,615 86.5 0.106 0.408 18.7 .155 Fort Bend 76 60,067 68.0 0.211 0.439 45.8 .218 Fort Worth 77 76,080 81.6 0.273 0.552 58.6 .302 1990 Garland 78 53,259 59.7 0.074 0.233 0.0 .062 Houston 79 195,686 90.4 0.282 0.664 84.6 .344 1983 Katy 80 40,881 35.6 0.090 0.273 0.0 .083 Klein 81 34,645 44.7 0.290 0.482 27.6 .162 Lewisville 82 43,249 30.9 0.172 0.373 0.0 .141 Mesquite 83 33,591 53.9 0.044 0.187 0.0 .042 North East 84 55,035 54.2 0.156 0.339 2.5 .114 Northside 85 69,453 68.2 0.127 0.326 10.4 .090 Pasadena 86 43,922 80.0 0.111 0.344 19.1 .142 Plano 87 50,228 37.1 0.060 0.192 0.0 .085 Richardson 88 33,205 58.7 0.202 0.374 19.3 .166 Round Rock 89 34,792 39.0 0.073 0.225 0.0 .083 San Antonio 90 52,697 96.3 0.028 0.322 95.6 .253 Ysleta 91 44,769 93.1 0.059 0.447 28.4 .124Virginia Chesapeake City 92 39,412 40.2 0.218 0.410 6.2 .160

56
Chesterfield Co. 93 54,124 32.8 0.181 0.354 0.0 .129 1972 Fairfax Co. 94 161,890 47.1 0.133 0.305 2.9 .105 Henrico Co. 95 43,958 45.3 0.323 0.496 23.8 .276 1972 Loudoun Co. 96 39,004 27.9 0.094 0.265 0.0 .074 Newport News City 97 31,142 64.2 0.097 0.250 12.4 .076 Norfolk City 98 32,650 74.3 0.141 0.351 26.1 .123 1986* Prince William Co. 99 64,192 49.0 0.159 0.344 0.0 .095 Virginia Beach City 100 75,900 40.0 0.127 0.305 2.8 .085
* No official designation of unitary status, but effectively treated by courts as such.Source: Tabulations provided by school districts; authors' calculations.Note: Following Orfield and Monfort (1992, p. 2), regions are defined as follows: Border: Delaware, District of Columbia, Kentucky, Maryland,Missouri, Oklahoma, West Virginia; South: Alabama, Arkansas, Florida, Georgia, Louisiana, Mississippi, North Carolina, South Carolina,Tennessee, Texas, Virginia.
11/16/04