federal reserve bank of new york staff reports big to fail after all these years donald p. morgan...
TRANSCRIPT

Federal Reserve Bank of New YorkStaff Reports
Too Big to Fail after All These Years
Donald P. MorganKevin J. Stiroh
Staff Report no. 220September 2005
This paper presents preliminary findings and is being distributed to economistsand other interested readers solely to stimulate discussion and elicit comments.The views expressed in the paper are those of the authors and are not necessarilyreflective of views at the Federal Reserve Bank of New York or the FederalReserve System. Any errors or omissions are the responsibility of the authors.
Too Big to Fail after All These Years
Donald P. Morgan and Kevin J. Stiroh
Federal Reserve Bank of New York Staff Reports, no. 220
September 2005
JEL classification: G2, G3, N2
Abstract
The naming of eleven banks as “too big to fail (TBTF)” in 1984 led bond raters to raise
their ratings on new bond issues of TBTF banks about a notch relative to those of other,
unnamed banks. The relationship between bond spreads and ratings for the TBTF banks
tended to flatten after that event, suggesting that investors were even more optimistic than
raters about the probability of support for those banks. The spread-rating relationship in the
1990s remained flatter for TBTF banks (or their descendants) even after the passage of the
Federal Deposit Insurance Corporation Improvement Act of 1991 (FDICIA), suggesting that
investors still see those banks as TBTF. Until investors are disabused of such beliefs,
investor discipline of big banks will be less than complete.
Key words: market discipline, too big to fail
Morgan: Federal Reserve Bank of New York (e-mail: [email protected]). Stiroh: Federal Reserve
Bank of New York (e-mail: [email protected]). This paper is a substantially revised version of
“‘Too Big to Fail’ and Market Discipline of Banks: A Cross-Sector Study of Investor Perception.” The
authors thank seminar participants at Rutgers University, the Stockholm Institute of Financial Research,
and the Federal Reserve Bank of New York for their comments. Special thanks to João Santos for
providing data. The views expressed in this paper are those of the authors and do not necessarily reflect
the position of the Federal Reserve Bank of New York or the Federal Reserve System.
1
I. Introduction
In May of 1984, the federal government contributed roughly $1 billion to save
Continental Illinois Bank from default. Then the 7th largest bank in the United States,
Continental was also a money center bank holding large deposits of hundreds of smaller banks
throughout the Midwest. The failure of such a large, money center bank might have tipped many
smaller banks into default so the controlling authority, the Comptroller of the Currency,
engineered a rescue that saved bank depositors and stock and bond investors in the holding
company. The rescue was controversial so Congress called the Comptroller to testify. When the
Comptroller admitted (under intense questioning) that other large banks might warrant support,
Congressman McKinney uttered the now famous phrase:
“Mr. Chairman, We have a new kind of bank. It is called too big to fail. TBTF and it is a wonderful bank.”
(Hearings before the Subcommittee on Financial Institutions, 1994)
Whatever the benefits of the Continental bailout (in terms of averted crises), the cost of
the TBTF mentality it engendered is obvious: weaker market discipline. Insuring bond holders
of very large banks turns them into yet another class of risk-indifferent claimants (like insured
depositors) with little incentive to monitor and penalize (via higher spreads) risk taking by banks
perceived as TBTF. Evidence from that era suggests that the bailout and the Comptroller’s
testimony had exactly that effect. O’Hara and Shaw (1990) find that stock prices of the eleven
banks named as TBTF by Carrington (1984) after the Comptroller’s testimony rose 1.3 percent
immediately after they were named. Avery et al. (1988) found that bank bond spreads were
barely related to ratings, and unrelated to accounting or bank balance sheet risk measures.
Market discipline of banks, they concluded, is weak.

2
Lawmakers and regulators recognize the distortions created by a TBTF mentality among
investors and have taken measures to change the market’s mind. FDICIA (Federal Deposit
Insurance Corporation Improvement Act of 1991) obligates regulators to take prompt corrective
action against severely distressed banks and strictly limits regulators’ discretion to support
distressed banks that are considered “essential” (Wall, 1993). P and A (purchase and
assumption) default resolutions, developed after the Continental bailout, enable regulators to
save insured bank depositors without necessarily sparing bond holders or other uninsured
investors (Kwast et al., 1994). P and A resolution does put bank bond investors at risk, even for
big banks; when the Bank of New England failed in 1991, bond holders of the holding company
were not made whole (Federal Deposit Insurance Corporation, 1998).
Research since these reforms finds that bank bond spreads have become more sensitive to
bank risk. In a study of bank bond spreads observed over 1983-1991, Flannery and Sorescu
(1996) find a significant, positive relationship between spreads and accounting measures of bank
risk in the later (post-TBTF) years of their sample.
Theirs and subsequent studies confirm the existence of market discipline after FDICIA,
but our paper investigates its strength around the Comptroller’s announcement and more
recently.1 We investigate whether investors monitor and price the risk of the very biggest
banks—the banks actually named as TBTF in 1984—as closely as for other banks.2 Our
question is a basic one that has gone unasked for U.S. banks.3 Avery et al. (1988) and especially
1Avery et al (1998) suggested that TBTF might explain the missing link between bank bond spreads and risk. Morgan and Stiroh (2001), Sironi (2003), and Kwast et al (2004) also find evidence of market discipline. 2Penas and Unal (2004) classify a bank as TBTF if its assets exceed two percent of all bank assets. They find that bank bond prices react most favorably to merger announcements when the merger might elevate two medium sized banks to TBTF status. 3Gropp et al. (2004) find that credit spreads predict ratings downgrades to C or lower on Fitch’s scale of individual (excluding the possibility of public support) bank strength ratings only for banks Fitch considered unlikely to receive public support in the event of default. For TBTF banks, investors evidently could not anticipate Fitch’s next move,
3
Flannery and Sorescu (1998) observe that the TBTF mentality undermines market discipline, but
neither tests whether the relationship between bank bond spreads and risk is weaker for the
particular banks, namely big ones, that investors are most likely to consider TBTF. Our
reasoning is simple: if the TBTF mentality leads investors to discount bank default risk, the
naming of TBTF banks in 1984 should have altered the relationship between bank bond spreads
and risk relative to other banks. If investors still expect support for those banks, any such
differences that emerged after 1984 should persist even after FDICIA.
As many researchers have, we use bond ratings as a proxy for default risk, but our use of
ratings raises one complication. Moody’s and S&P ratings on bank bonds reflect the possibility
of government support for a given bank (as judged by the agencies),4 so how can the relationship
between bond spreads and ratings tell us whether investors consider a bank TBTF if the bank’s
rating reflects whether raters consider it so?5 Using a simple model, we show that if investors
expect support for a particular bank, then the relationship between spreads and ratings for that
bank will differ from that of banks for which investors do not expect support. The precise nature
of that difference—whether the spread-rating relationship is steeper or flatter—will depend on
whether investors are more or less optimistic about the probability of support for a given bank,
but that is secondary given our question. The main insight from the model is how to use
differences in the spread-rating relationship to identify whether the TBTF announcement in 1984
or Fitch raters ignored risk-relevant information in past market spreads. Either way, it suggests TBTF for European banks alters the relationship between bond spreads and risk, and by extension, market discipline. Our question is largely the same as Gropp et al (2004), but we study U.S. banks, and we look at contemporaneous, not time-series, relationship. 4For example, S&P’s “bank survivability assessment” rating reflects a bank’s position in the financial system and the possibility of direct government support. 5Were we interested in the raters’ views on TBTF, we could just study their government support ratings. It is investors who impose market discipline (via prices) so it is their beliefs that we are after.

4
led investors to discount risk for the banks named as TBTF, and, whether they still do, even after
FDICIA.
We examine the spreads-rating relationship using a sample of new bank bonds issued
over two windows: 1982-1986 and 1993-1998. The early window is centered around 1984:Q3,
when Carrington (1984) named the TBTF banks alluded to by the Comptroller. The later period
starts about a year after FDICIA (1991). Using difference-in-difference regressions, we first
show that the ratings for the banks named as TBTF in 1984 improved by about a notch relative to
other banks. The relationship between spreads and ratings for the TBTF banks also flattened
after those banks were named, implying (via our model) that the TBTF announcement made
investors even more optimistic than raters about the possibility of support. We find very similar
differences in the spread-rating relationship for the banks that were named as TBTF (or their
descendants) over the post- FDICIA period.
The change in the relationship between spread and ratings after 1984 suggests that the
TBTF mentality undermined market discipline of very large banks. The persistence of that
difference suggests that FDICIA has not entirely shaken investors’ beliefs in TBTF. Until that
occurs, bond market discipline of the very largest banks will be less than complete.6
II. Changes in Ratings and Spreads after the TBTF Announcement
Before testing whether the TBTF event changed the relationship between bond spreads
and ratings, we first investigate whether that event affected either variable separately. The
naming of those banks moved stock prices (O’Hara and Shaw, 1990), so we want to see how that
event registered in the bond market.
6See Stern and Feldman (2004) for a thorough discussion of the TBTF problem and possible solutions.
5
Our event study uses spreads, ratings, and other terms on 162 new bonds issued by banks
(or holding companies) between 1982:Q2-1984:Q2 and 1984:Q4-1986:Q4. We exclude
1984:Q3—the quarter when TBTF banks were named—giving us equal sized windows of nine
quarters before that event and nine quarters after.7
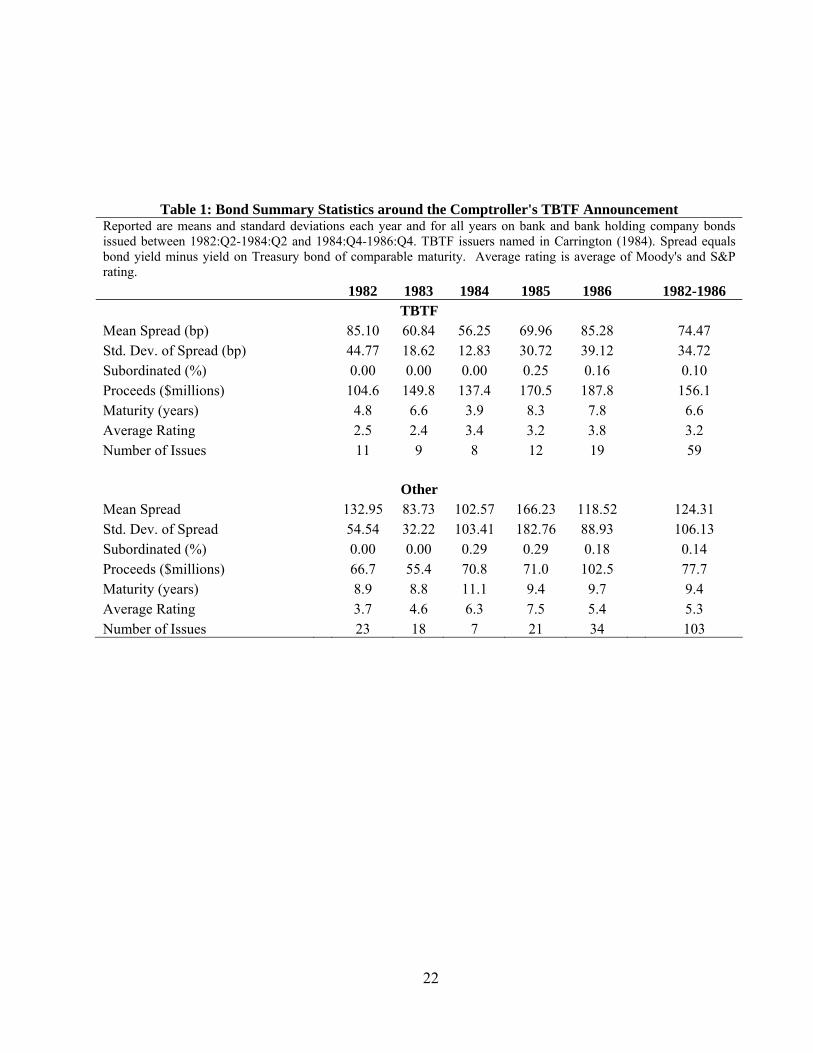
Our data, summarized in Table 1, require little description. Spread equals the yield on a
given issue minus the yield on a Treasury bond of comparable maturity. Rating equals the
average of Moody’s and Standard and Poor’s (S&P) rating on each bond, with one representing
the highest/safest rating and 16 the lowest/riskiest. Both agencies intend the ratings as relatively
stable (over the business cycle) measures of the risk default, and of expected loss given default
(Moody’s (2002) and S&P (2004)).
These are spreads and ratings on new bond issues, so the spreads reflect actual transaction
prices (not matrix extrapolations) and the ratings reflect raters’ real-time (not outdated) risk
estimates. Issue size (Proceeds) makes a good proxy for issuer size and a reasonable proxy for
liquidity (as long as some transaction costs are fixed). Subordination equals one for
subordinated issues or zero for senior issues. That variable may be measured with error (zero
subordination before 1985 seems dubious), but none of the interesting results hinge on it.
Figure 1 plots Spread against Rating. Lower rated bonds tended to pay higher spreads,
but the relationship is not strictly linear, or even monotonic; some curvature in the relationship is
evident, and there is a distinct kink at 10, the cutoff between investment grade and high-yield
7The data, from Security Data Corp’s Domestic New Bond database, were provided to us by Joao Santos. Santos (2004) describes the data more thoroughly. We excluded asset-backed bonds, convertible bonds, bonds issued in 1984:Q3, and bonds without the necessary data to compute a spread. We cannot control for the option features of issue; these data were mostly missing so we elected to omit them altogether. Options are obviously an important bond feature, but their omission here should not bias results. Calls options are standard across issues so omitting that term should not be a problem. Puts appear to be less common; if their incidence varies across bank and other issues, bias is possible.
6
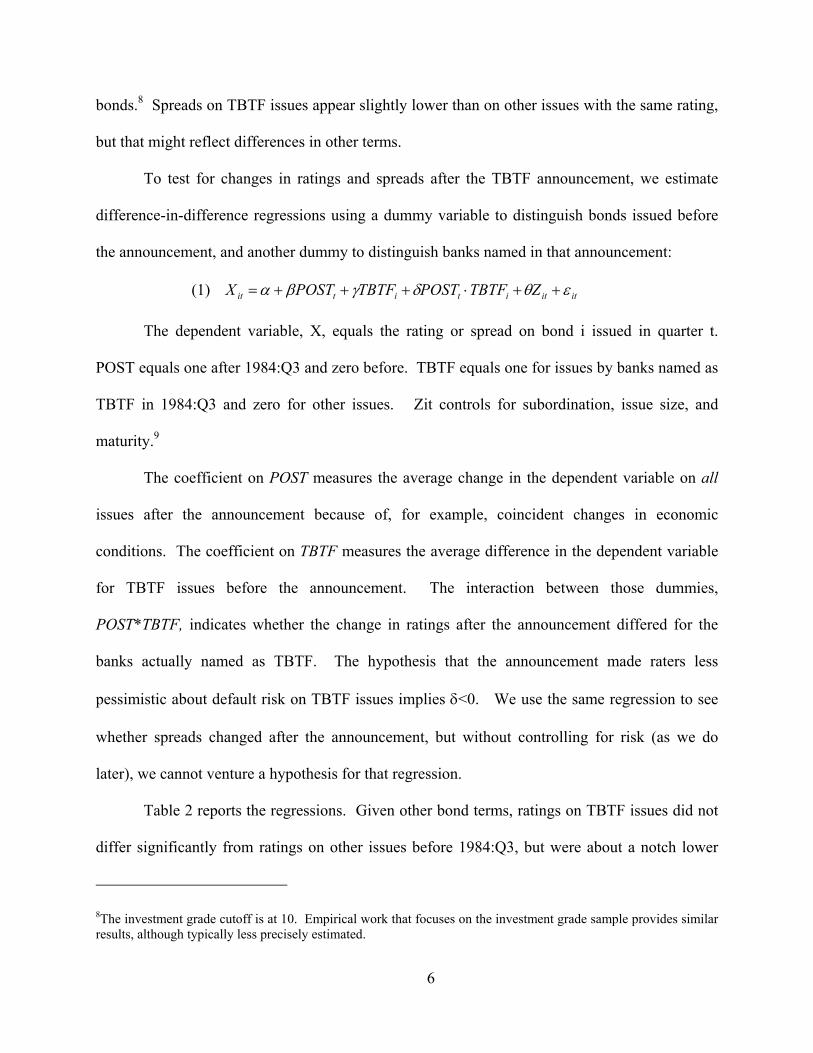
bonds.8 Spreads on TBTF issues appear slightly lower than on other issues with the same rating,
but that might reflect differences in other terms.
To test for changes in ratings and spreads after the TBTF announcement, we estimate
difference-in-difference regressions using a dummy variable to distinguish bonds issued before
the announcement, and another dummy to distinguish banks named in that announcement:
(1) ititititit ZTBTFPOSTTBTFPOSTX εθδγβα ++⋅+++=
The dependent variable, X, equals the rating or spread on bond i issued in quarter t.
POST equals one after 1984:Q3 and zero before. TBTF equals one for issues by banks named as
TBTF in 1984:Q3 and zero for other issues. Zit controls for subordination, issue size, and
maturity.9
The coefficient on POST measures the average change in the dependent variable on all
issues after the announcement because of, for example, coincident changes in economic
conditions. The coefficient on TBTF measures the average difference in the dependent variable
for TBTF issues before the announcement. The interaction between those dummies,
POST*TBTF, indicates whether the change in ratings after the announcement differed for the
banks actually named as TBTF. The hypothesis that the announcement made raters less
pessimistic about default risk on TBTF issues implies δ<0. We use the same regression to see
whether spreads changed after the announcement, but without controlling for risk (as we do
later), we cannot venture a hypothesis for that regression.
Table 2 reports the regressions. Given other bond terms, ratings on TBTF issues did not
differ significantly from ratings on other issues before 1984:Q3, but were about a notch lower
8The investment grade cutoff is at 10. Empirical work that focuses on the investment grade sample provides similar results, although typically less precisely estimated.
7
afterward (column 4). More precisely, the ratings on other issues worsened by 2.2 notches after
1984:Q3, but the ratings on TBTF issues worsened by just 1.1 notches. By contrast, the spreads
on TBTF issues did not differ significantly, either before or after 1984:Q3 (column 2). Spreads
on TBTF issues tended to fall relative to other issues after 1984:Q3, but that 31.9 basis point
relative decline, though large, is not quite statistically significant (p-value=0.12).
Table 2 indicates that that the TBTF announcement did register in the bond market, at
least among raters. The impact on spreads was less significant, but without controlling for risk,
the spread regressions in Table 2 are hard to interpret. The next set of regressions have the bond
rating on the right side and the bond spread on the left. Those regressions will reveal whether
risk, as proxied by ratings, mattered less for spreads after the TBTF announcement. Before we
estimate those spread-rating regressions, we discuss a simple model that shows how we can
identify investors’ expectations of support from the spread-rating relationship even if the rating
reflects raters’ expectations of support.
III. Identifying Investors’ TBTF Beliefs from the Bond Spread-Rating Relationship
The model in this section shows how we can infer whether investors expect support for a
particular bank by comparing spreads, conditional on ratings, across banks. Our model is simple,
but not unrealistic. We assume that analysts—raters and investors—do not know for sure which
banks are TBTF and which are not, so they have to estimate the probability of support for each
bank that might be TBTF. As a result, their estimates may differ. As it turns out, it is precisely
when investors and raters’ estimates of support do differ that we can infer whether investors, in
particular, expect support for a given bank.
9We do not include issuer fixed effects because we are interested in differences between (TBTF and other) issues, not within issues over time
8
Analyst uncertainty about regulator behavior—will they or won’t they support a given
bank—is reasonable. According to Freixas (2000), regulators should keep the market guessing
via “creative ambiguity” if they want to maintain some measure of market discipline without
credibly committing to a laizess-faire policy, and regulators seem to follow that prescription.
The Comptroller of the Currency, for example, only alluded to banks that his agency considered
TBTF in his testimony to Congress in 1984, but avoided naming names. The ambiguity worked
to some extent, evidently, because Carrington’s (1984) list of TBTF banks differed slightly from
the list in Business Week (O’Hara and Shaw, 1990). Analysts’ uncertainty about regulatory
behavior was probably heightened by FDICIA, as the constraints imposed on regulators in that
act are still untested. Creative ambiguity still seems to be the unofficial policy among high-
ranking bank regulators who (perhaps having learned from the Comptroller’s experience)
regularly avow that no bank is too big to fail.
Allowing for analyst uncertainty, and by extension, disagreement among analysts, also
squares with what raters say on the matter:
“…banking authorities pay … lip service to the concept of market discipline …
so the analyst must make his own judgment of the likely behavior
of the authorities.” (Moody’s, 1993)
We also allow for analysts’ uncertainty about the fundamental (unsupported) probability
of default for banks.10 Raters and investors in our model must estimate default probabilities for
any bank where support is not certain. They form independent estimates, but in the end,
investors back out the numerical default probability implied by a given rating by reversing the
mapping (rating category → % default) made available to investors by the rating agencies. In

9
other words, investors use ratings as a noisy signal of default risk. Our modeling on this point
closely resembles Moody’s (2002, p. 5) remarks on ratings for banks:
“…the opacity of bank accounting (makes) true solvency unknowable even to bond
raters…” and ratings should be viewed as “forecasts with uncertainty” (Moody’s, 2002)
Given those two assumptions, we follow straightforward asset pricing intuition and
model the interest spread on bonds as a function of investors’ estimates of the probability of
default (or losses given default). If investors believe the government will assist the bank, they
discount the underlying risk of loss accordingly. To illustrate, consider a bond issued by such a
small bank that neither investors nor raters assign any probability that the bank is TBTF. Let Z
denote the underlying probability that the bank will default on the bond, and let ZR=Z + eR denote
bond raters’ estimate of Z, where eR denotes error in the estimate. Suppose raters convert their
default risk estimates into ratings using a linear formula:
(2) ( )ReZaR +=
where a ≥ 0. In reality, ratings reflect the probability of default (PD) and loss given default
(LGD). Incorporating that distinction (by defining Z ≡ PDxLGD) does not alter the point we are
making, so we ignore it. Allowing a more realistic, discrete rating formula (Z ≤ k ⇒ R = 1, etc.)
does not change our point either, so we maintain the continuous version (2).
Now consider investors and spreads. Suppose the marginal investor’s default risk
estimate is ZI = Z + eI where eI represents error in the investor’s risk estimate. Risk can affect
spreads in a complicated way, but it seems safe to suppose that spreads will be non-decreasing in
ZI:
10Morgan (2002) concludes that banks are more opaque than other firms, but Flannery et al. (2004) conclude the
10
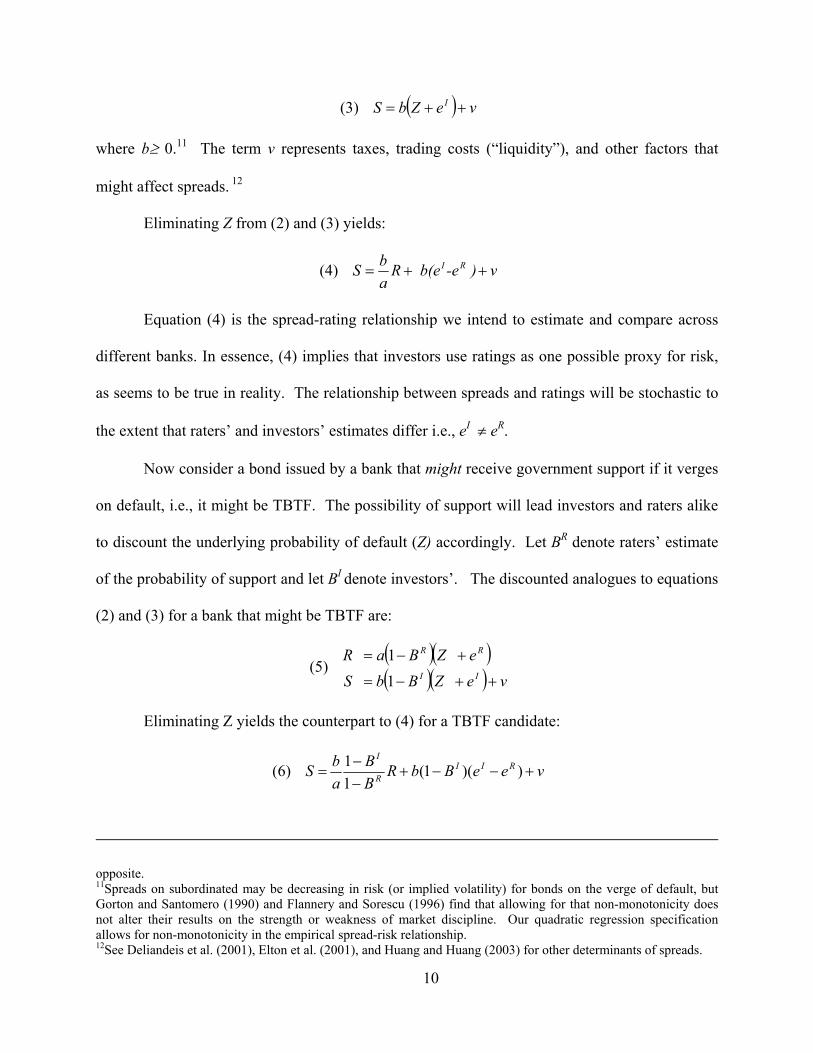
(3) ( ) veZbS I ++=
where b≥ 0.11 The term v represents taxes, trading costs (“liquidity”), and other factors that
might affect spreads. 12
Eliminating Z from (2) and (3) yields:
(4) v )-e b(eRabS RI ++=
Equation (4) is the spread-rating relationship we intend to estimate and compare across
different banks. In essence, (4) implies that investors use ratings as one possible proxy for risk,
as seems to be true in reality. The relationship between spreads and ratings will be stochastic to
the extent that raters’ and investors’ estimates differ i.e., eI ≠ eR.
Now consider a bond issued by a bank that might receive government support if it verges
on default, i.e., it might be TBTF. The possibility of support will lead investors and raters alike
to discount the underlying probability of default (Z) accordingly. Let BR denote raters’ estimate
of the probability of support and let BI denote investors’. The discounted analogues to equations
(2) and (3) for a bank that might be TBTF are:
(5) ( )( )( )( ) veZBbS
eZBaRII
RR
++−=
+−=
11
Eliminating Z yields the counterpart to (4) for a TBTF candidate:
(6) veeBbRBB
abS RII
R
I
+−−+−−
= ))(1(11
opposite. 11Spreads on subordinated may be decreasing in risk (or implied volatility) for bonds on the verge of default, but Gorton and Santomero (1990) and Flannery and Sorescu (1996) find that allowing for that non-monotonicity does not alter their results on the strength or weakness of market discipline. Our quadratic regression specification allows for non-monotonicity in the empirical spread-risk relationship. 12See Deliandeis et al. (2001), Elton et al. (2001), and Huang and Huang (2003) for other determinants of spreads.
11
A comparison of Equations (4) and (6) shows that the relationship between spreads and
ratings will differ for TBTF candidates to the extent that investors and raters disagree about the
probability of support. If investors are more optimistic than raters (BI > BR), the spread-rating
relationship will be flatter for TBTF banks. The relatively optimistic investors in that case will
tend to downplay a low rating by the (more pessimistic) raters, so the spread for a given rating
will be smaller than for a non-TBTF bank. In the limit, where investors are certain about a
bailout ( 1=IB ), spreads on TBTF banks would be independent of ratings. By contrast, if
investors are less optimistic than raters (BI < BR), they will view a risky rating by the more
optimistic raters as an especially bad sign, implying a higher premium for a given rating for the
TBTF candidate.
Our null hypothesis is that investors were not swayed by the TBTF announcement, i.e.,
BI=0. Given that null, there are two potentially problematic cases. If 0=> IR BB , we would
mistakenly reject BI = 0 only because raters (but not investors) expect a bailout. If 0>= IR BB ,
we would mistakenly accept BI = 0 because investors and raters happen to consider support
equally likely. Both cases are knife-edge in the sense that BI must equal a precise value (0 or
BR) so the likelihood of false inferences, though possible, seems remote.13
Equations (4) and (6) are the spread-rating relationships we estimate and compare across
potential TBTF candidates and others. 14 We estimate relatively parsimonious equations, so we
have to consider whether the omission of other factors that affect bonds spreads, e.g., the v in (4)
and (6), might bias our comparison. If those factors are also correlated with bonds ratings, their
omission will bias our estimates of b/a. So long as the correlation between v and ratings does not
13In addition, evidence from the stock market in O’Hara and Shaw (1990) suggests that it is unlikely that BI=0. 14We can allow investors to base their risk estimate (and hence spreads) directly on the ratings, or vice-versa, but not both.
12
systematically differ between bonds issued by TBTF banks and bonds issued by other banks,
however, our comparison across those two sets of issues will remain unbiased. In effect, we are
differencing out any bias. A second possible bias occurs if the errors in risk estimates by
investors and raters, eI and eR, are correlated with ratings. If the difference in errors (eI - eR) is
uncorrelated with ratings, those errors will not bias our estimates of b/a.15 Even if that difference
is correlated with ratings (thus biasing our b/a estimates), our comparison across TBTF issues
and other issues will again be unbiased as long as the correlation does not systematically differ
between those two sets of issues.16
IV. Changes in the Spread-Rating Relationship after the TBTF Announcement
Using the data over the 1984:Q2-1986:Q4 period described in Section II, we estimate
regressions of the form:
(7)
,)()( ,,
,
i,tiitit
tii,tti,tititi
tiiitti
ePOSTλXX POST)TBTFF(Rating)POSTF(RatingTBTFRatingFRatingF
POSTTBTFPOSTTBTFaaSpread
+⋅+
+⋅+++
+⋅++++=
γ
δβα
where the function F is linear or quadratic in Rating.
TBTF equals 1 for issues by banks named in 1984:Q3 and zero for other issues. POST
equals one after 1984:Q3 and zero before. Xit controls for other bond terms: subordination, issue
size, and maturity. The quarter dummy, at, allows for fixed differences in spreads over time.
We do not include a bank fixed effect because we are interested in the differences between TBTF
15Bond ratings by Moody’s and S&P are more likely split over riskier bonds (Morgan, 2002), so differences between raters and investors may increase with risk as well. 16Selection bias is possible with the new issue data we are studying if the propensity to issue depends on spreads (Covitz et al. (2004)), but our comparison across TBTF and other issuers will be unbiased as long as the selection bias does not differ systematically across those sets of issuers.
13
and other issues, rather than differences within issuers over time. We allow for correlation in
errors for a given issuer, but assume (as is standard) independence of errors across issuers.
Allowing for correlation within issuers tends to increase standard errors and reduce statistical
significance.
Table 3 reports the both the linear and quadratic regression results. Note that we report
the estimates of Equation (7) as if we estimated separate regressions before and after the
announcement (to ease exposition), but in fact, we pooled the data and used the dummy POST to
capture differences before and after the announcement. Thus, the difference column for each
regression (linear and quadratic) equals the coefficient on the POST dummy or its interaction
with other variables.
The results indicate that the relationship between spreads and ratings did differ for TBTF
issuers, but only after they were named as such. In both the linear and quadratic regressions, the
TBTF*Rating coefficients are only significant after Carrington (1984) named them. In the
quadratic specification, for example, the p-value on the joint significance of the TBTF dummy
and interactions is 0.63 before the Comptroller’s announcement and 0.09 afterward.17
Economically, the linear relationship between spreads and rating became flatter for TBTF
issues and steeper for other issues. The changes are substantial. With the linear regression, a one
notch decline in ratings was associated with a 14.5 basis points rise in spreads regardless of
issuer (the TBTF*Rating interaction is not significantly different from zero) in the pre-
announcement period. Post-announcement, a one notch decline in ratings increased spreads by
39.7 basis points for non-TBTF issues, but just 15.4 basis points for TBTF issues. Bond
17We do not focus on the intercept differences because the regressions include quarter dummy variables, so the intercept is sensitive to which quarter is excluded.

14
investors apparently became relatively tough on non-TBTF issues and relatively soft on TBTF
issues.
The quadratic relationship also flattened for TBTF issues. Pre-announcement, the
coefficient on Rating2 and all the TBTF coefficients were individually and jointly insignificant,
implying a nearly straight-line relationship between spreads and ratings for both sets of issues.
After the announcement, the coefficients on Rating and Rating2 were negative and positive,
respectively, implying a lazy J relationship between spreads and ratings.18 The coefficients on
the TBTF*Rating interactions very nearly cancel the coefficients on Rating, implying a much
flatter curve for the TBTF issues.19 The difference in the Rating coefficients (pre minus post-
announcement) is significant for other issues, but not for TBTF issues, which implies that the
spread-rating relationship for TBTF issues flattened relative to other issues.
Interpreted through our model, the flatter spread-rating relationship for TBTF issues
implies that investors took the higher risk ratings of TBTF issues less seriously after the
Comptroller’s announcement. Recall from Table 2 that raters raised ratings on TBTF issues
about one notch (relative to other issues) after the TBTF announcement, suggesting raters viewed
support as more likely afterwards. The flattening of the spread-rating line after TBTF issuers
means investors were even more optimistic than raters after the announcement.
This interpretation is also consistent with the different incentives of investors and raters.
Efficient investors can avoid idiosyncratic risk by holding a diversified portfolio of bonds.
Raters, by contrast, are clearly motivated to avoid missing a default, whether it results from
18This reflects, in part, the presence of more low-grade, high-yield bonds. 19For TBTF issues, the linear portion became more positive (TBTF*Rating=40.06, p=0.03), while the quadratic portion became more negative (TBTF*Rating2=-3.85, p = 0.02). This implies a flatter curve for the TBTF issues.

15
idiosyncratic or market events. Thus, investors may care less than raters about mistakes, so they
can afford to be more optimistic about government support.
A final implication is that investors became relatively tougher on the other bank issues
not named as TBTF. One interpretation is that the Comptroller’s announcement resolved some
ambiguity about exactly which institutions were candidates for government support. If so, we
would expect higher spreads for the banks revealed as not too big to fail. This interpretation
contrasts with Black et al. (1997), who argue that the TBTF event weakened market discipline
for BHCs generally, even those smaller than the 11 actually named as TBTF,20 but is consistent
with Penas and Unal (2004), who document the value of being perceived as TBTF.
V. Differences in the Spread-Rating Relationship in the Post-FDICIA Era
Have FDICIA and other reforms eliminated the differences in the spread-rating
relationship that emerged after the Comptroller’s announcement? To answer that, we estimate
spread-rating regressions using data from 1993 to 1998, which spans part of what Covitz et al.
(2004) call the “post-FDICIA regime.”21 FDICIA mandated least-cost resolution of failed banks,
making it harder for regulators to justify resolutions that involved insurance for non-insured
claimants. A loophole in FDICIA provides for additional assistance for “essential,” i.e., TBTF,
banks, but the conditions for providing such assistance are more stringent than before FDICIA.22
If FDICIA weakened investors’ expectations of support for TBTF banks, as was intended, we
would expect smaller differences in the spread-rating relationship for TBTF banks over our post-
20They report increased institutional holdings of BHCs relative to comparable, non-financial firms after the TBTF announcement, and reduced stock market reaction to BHC dividend cuts and omissions. 21The “post-FDICIA” period in Covitz et al. (2004) spans 1993-2002. 22Providing such support requires approval by two-thirds of the FDIC’s directors, the Board of Governors of the Federal Reserve, and concurrence of the Secretary of the Treasury (Wall, 1993).
16
FDICIA window. In fact, we find difference very similar to those that emerged right after the
Comptroller’s announcement.
a) Data and Results Table 4 compares terms on TBTF and other issues for the 1993-1998 period where TBTF
issues are identified as those from the original 1984 list and their surviving descendants.23
Subordination was more common on TBTF, especially after 1996, but the other terms were fairly
similar.24 By contrast, the terms on TBTF issues changed quite substantially between the TBTF
and post-FDICIA era (compare Tables 1 and 4). The average TBTF issue was rated 3.5 over
1984-86 (the post-announcement period) versus 6.0 over 1993-98. Despite that two and a half
notch downgrade, TBTF spreads barely changed between eras.
Figure 2 plots average spreads against ratings for TBTF and other issues. Both curves
mostly slope upward with a kink at the investment grade cutoff of 10. The correlation between
spreads and ratings was lower for TBTF issues than for other issues (0.51 versus 0.69),
suggesting a weaker link between spreads and ratings for the former.
Table 5 reports regressions of spreads on ratings as in Equation (6) using these more
recent data.25 Note that there is no obvious counterpart to the Comptroller’s announcement to do
a before and after comparison, so we estimate the regressions over the entire 1993-1998 period.
As in the earlier post-announcement period, the linear relationship between spreads and ratings
(column 1) is significantly flatter for TBTF issues. The difference appears substantial: one lower
notch on TBTF issues increased spreads by 8 basis points, compared to 19.2 for other issues.
23 Morgan and Stiroh (2001) describe these data in more detail. 24TBTF spreads were about four basis points higher, their ratings were about 0.3 notches lower (i.e., safer), and they were about a year longer (in maturity) than other issues. 25Recall that we are defining TBTF issues based on the original list of 1984 and their descendants. To the extent that we are missing some other banks that have grown into TBTF status, we are biasing the results against finding significant differences between the TBTF and other issues.

17
The quadratic relationship is also different for TBTF issues. The curve for other issues has the
same right-leaning J-shape estimated for the early period (Table 3) and the estimated curve for
TBTF issues is flatter.
The differences in the spread-rating relationship for TBTF and other issues in the post-
FDICIA era resemble the differences that emerged after TBTF banks were named (compare
Tables 3, column 5 vs. Table 5, column 2). This suggests that those large banks, and their
descendents, may still enjoy the privileged position as TBTF that emerged after the
Comptroller’s announcement in 1984.
b) Robustness Tests
This section discusses several alternative cuts of the data that serve as robustness tests for
our analysis of the data for 1993 to 1998. One obvious candidate is to identify potential TBTF
issues by size rather than by the original 1984 list. Whether “big” is defined as assets over $100
billion, over $85 billion (roughly the sample mean), over $50 billion (roughly the sample
median), or using the definition of Penas and Unal (2004), we always reject that the spread-
rating relationship for “big” banks was the same as for other banks.
The differences are still significant, although weaker, if we exclude non-investment grade
issues for the post-FDICIA period. Excluding those issues considerably weakens the differences
around the TBTF announcement (in Table 3), but we suspect that is because our sample over that
period is small, and, because the extra variation with those issues included is important to
identifying the differences during that period.
Finally, the differences evident in Table 5 were also significant if we estimated piece-
wise linear regressions, where the step in spreads can change from rating to rating. In that case,
we rejected the null that the TBTF banks had the same spread-rating relationship as for other
issues.

18
VI. Conclusions
The naming of TBTF banks in 1984 elevated bond ratings for those banks about a notch
compared to other, unnamed, banks. The naming of those banks also tended to flatten the
relationship between the spreads on their bonds and the bonds’ ratings. Interpreted through our
model of how spreads will relate to ratings when both investors and raters believe in TBTF—but
in different degree—suggests that the naming of TBTF banks made investors even more
optimistic than raters about future support of TBTF-named banks. These findings for bank
bonds are consistent with, and extend, O’Hara and Shaw’s (1990) finding of an increase in stock
prices for the TBTF banks after those banks were named by Carrington (1984).
We find similar differences in the bond spread-rating relationship for the descendants of
the TBTF banks over a post-FDICIA window using more recent data, suggesting that investors
still consider the possibility of support for TBTF banks when judging and pricing the risk of
those banks’ bonds. Until bond holders no longer consider the possibility of support for those
banks, bond market discipline of TBTF candidates will be less than complete.
19
References
Avery, R., T. Belton, and M. Goldberg, 1988. “Market Discipline in Regulating Bank Risk: New Evidence from the Capital Markets.” Journal of Money, Credit, and Banking. Vol. 3, No. 3, August (Part 1), 597-619.
Benston, George J., William C. Hunter, and Larry D. Wall, 1995. “Motivations for Bank Mergers and Acquisitions: Enhancing the Deposit Insurance Put Option versus Earnings Diversification.” Journal of Money, Credit, and Banking, Vol. 27, No. 3, August, 777-788.
Black, Harold A., M. Cary Collins, Breck L. Robinson, and Robert L. Schweitzer, 1997. “Changes in Market Perception of Riskiness: The Case of Too-Big-To-Fail,” Journal of Financial Research, XX (3), Fall, 389-406
Carrington, Tim, 1984, “U.S. Won’t Let 11 Biggest Banks in Nation Fall,” Wall Street Journal, September 20.
Covitz, Daniel M, Diana Hancock, and Myron L. Kwast, 2004. “A Reconsideration of the Risk Sensitivity of Banking Organization Subordinated Debt Spreads, A Sample Selection Approach,” Economic Policy Review, Federal Reserve Bank of New York, September.
Delianedis, Gordon and Robert Geske, 2001. “The Components of Corporate Credit Spreads: Default, Recovery, Tax, Jumps, Liquidity, and Market Factors.” Anderson School of Management, December.
Elton, Edwin J., Martin J. Gruber, Deepak Agrawal and Christopher Mann, 2001. “Explaining the Rate Spread on Corporate Bonds.” Journal of Finance. LVI (1), February, 247-277.
European Central Bank, 2005. “Bank Market Discipline.” ECB Monthly Bulletin, February.
Federal Deposit Insurance Corporation, 1997. History of the Eighties, Lessons for the Future, Washington DC: FDIC.
_____, various issues. FDIC Quarterly Banking Profile, www.fdic.gov.
_____, 1998. Managing the Crisis: The FDIC and RTC experience, 1980-1994, Volume 1, Washington, D.C.
Flannery, Mark J., 1998. “Using Market Information in Prudential Bank Supervision: A Review of the U.S. Empirical Evidence.” Journal of Money, Credit, and Banking, 30, 273-305.
Flannery, Mark J., S. Kwan, and M Nimalendran, 2004. “Market Evidence on the Opaqueness of Banking Firms’ Assets.” Journal of Financial Economics, 71(3), 419-460.
Flannery, Mark J. and Sorin M. Sorescu, 1996. “Evidence of Bank Market Discipline in Subordinated Debenture Yields.” Journal of Finance, Vol. LI, No. 4, 1347-1377.
20
Freixas, Xavier, 2000. “Optimal Bail Out Policy, Conditionality and Creative Ambiguity.” London School of Economics Financial Markets Group, Discussion Paper 327.
Gorton, Gary and Anthony M. Santomero, 1990. “Market Discipline and Bank Subordinated Debt.” Journal of Money, Credit, and Banking, 22(1), February, 119-128.
Gropp, Reint, Jukka Vesala, and Giuseppe Vulpes, 2004. “Market Indicators, Bank Fragility, and Indirect Market Discipline.” Economic Policy Review, Federal Reserve Bank of New York, September, 53-62.
Hearings Before the Subcommittee on Financial Institutions, Supervision, Regulation and Insurance of the House Committee on Banking Finance and Urban Affairs, 1984, “Inquiry Into Continental Illinois Corp. and Continental Illinois National Bank,” September 18, 19 and October 4, 287-288.
Huang, Jing-zhi and Ming Huang, 2003. “How Much of the Corporate Treasury Yield Spread is Due to Credit Risk”? Mimeo, Penn State University, May.
Kaufman, George G., 2003, “Too Big to Fail in U.S. Banking: Quo Vadis,” Loyola University Working Paper 1-10-03.
Moody’s Investor Services, 1993. “Moody’s Approach to Rating Banks and Bank Holding Companies,” Moody’s Special Comment, April.
Moody’s Investor Services, 2001, “The Truth about Bank Credit Risk,” Special Comment, April.
Moody’s Investor Services, 2002. “Understanding Moody’s Corporate Bond Ratings and Rating Process,” Moody’s Special Comment, May.
Morgan, Donald P. and Kevin J. Stiroh, 2001. “Market Discipline of Banks: The Asset Test.” Journal of Financial Services Research, Vol. 20, No: 2/3, 195-208.
Penas, Maria Fabiana and Haluk Unal, 2004. “Gains in Bank Mergers: Evidence from the Bond Market.” Journal of Financial Economics, 74(1), 149-179.
O’Hara, Maureen and Wayne Shaw, 1990. “Deposit Insurance and Wealth Effects: The Value of Being ‘Too Big to Fail’.” Journal of Finance, Vol. XLV, No. 5, December, 1587-1600.
Rochet, Jean-Charles, 2004. “Rebalancing the Three Pillars of Basel II,” Economic Policy Review, Federal Reserve Bank of New York, September, 7-21.
Santos, Joao A.C., 2004. “Why Firm Access to the Bond Market Differs over the Business Cycle: A Theory and Some Evidence, Mimeo, Federal Reserve Bank of New York.
Sarig, Oded and Arthur Warga, 1989. “Some Empirical Estimates of the Risk Structure of Interest Rates.” Journal of Finance, 44, 1351-1360.
21
Sironi, A., 2003. “Testing For Market Discipline in The European Banking Industry: Evidence form Subordinated Debt Issues.” Journal of Money, Credit, and Banking, 35 , No.3, June, 443-72.
Slovin, Myron B Sushka, Marie E, and John Polonchek, 1993, “The Value of Bank Durability: Borrowers as Bank Stakeholders,” Journal of Finance, v. 48, 1, 247-66.
Standard and Poor’s. Financial Institutions Ratings Criteria, 2004, Standard & Poor’s Credit Ratings, New York, September.
Stern, Gary H. and Ron J. Feldman. Too Big to Fail: The Hazards of Bank Bailouts. Brookings Institution Press, Washington D.C. 2004.
Wall, Larry D., 1993. “Too-Big-to-Fail after FDICIA.” Economic Review, Federal Reserve Bank of Atlanta, Vol. 78, No. 1, January-February, 1-14.
22
Table 1: Bond Summary Statistics around the Comptroller's TBTF Announcement
Reported are means and standard deviations each year and for all years on bank and bank holding company bonds issued between 1982:Q2-1984:Q2 and 1984:Q4-1986:Q4. TBTF issuers named in Carrington (1984). Spread equals bond yield minus yield on Treasury bond of comparable maturity. Average rating is average of Moody's and S&P rating. 1982 1983 1984 1985 1986 1982-1986
TBTF Mean Spread (bp) 85.10 60.84 56.25 69.96 85.28 74.47 Std. Dev. of Spread (bp) 44.77 18.62 12.83 30.72 39.12 34.72 Subordinated (%) 0.00 0.00 0.00 0.25 0.16 0.10 Proceeds ($millions) 104.6 149.8 137.4 170.5 187.8 156.1 Maturity (years) 4.8 6.6 3.9 8.3 7.8 6.6 Average Rating 2.5 2.4 3.4 3.2 3.8 3.2 Number of Issues 11 9 8 12 19 59
Other Mean Spread 132.95 83.73 102.57 166.23 118.52 124.31 Std. Dev. of Spread 54.54 32.22 103.41 182.76 88.93 106.13 Subordinated (%) 0.00 0.00 0.29 0.29 0.18 0.14 Proceeds ($millions) 66.7 55.4 70.8 71.0 102.5 77.7 Maturity (years) 8.9 8.8 11.1 9.4 9.7 9.4 Average Rating 3.7 4.6 6.3 7.5 5.4 5.3 Number of Issues 23 18 7 21 34 103

23
Table 2: Difference in Spreads and Ratings for TBTF Issues and Change After 1984:3 OLS regression coefficients (robust standard errors) estimated using 162 new bonds issued by banks and bank holding company between 1982:Q1–1986:Q4, excluding 1984:Q3 when TBTF banks were named. TBTF = 1 for issues of banks named TBTF by Carrington (1984); =0 for others. POST = 1 for issues after 1984:Q3; =0 before. Dependent Variable: Spread Rating Constant 106.680*** 136.253** 4.200*** 10.408*** (7.721) (53.311) (0.291) (1.402) POST 31.301 23.100 2.024*** 2.157*** (19.140) (16.910) (0.518) (0.423) TBTF -35.430*** -2.171 -1.617*** 0.002 (10.418) (14.193) (0.345) (0.461) Post*TBTF -25.881 -31.916 -1.050* -1.068* (21.224) (20.625) (0.614) (0.567) Subordinated Dummy 68.222* 2.354*** (38.060) (0.643) Ln(Proceeds) -18.762 -1.757*** (11.857) (0.306) Maturity 4.763** 0.083* (1.994) (0.050) Joint sig. of TBTF (p-values) 0.00 0.12 0.00 0.08 Joint sig. of Post (p-values) 0.22 0.30 0.00 0.00 Adjusted-R2 0.07 0.22 0.24 0.44 ***, **, * indicate statistical significance at the 1%, 5%, and 10% level, respectively.
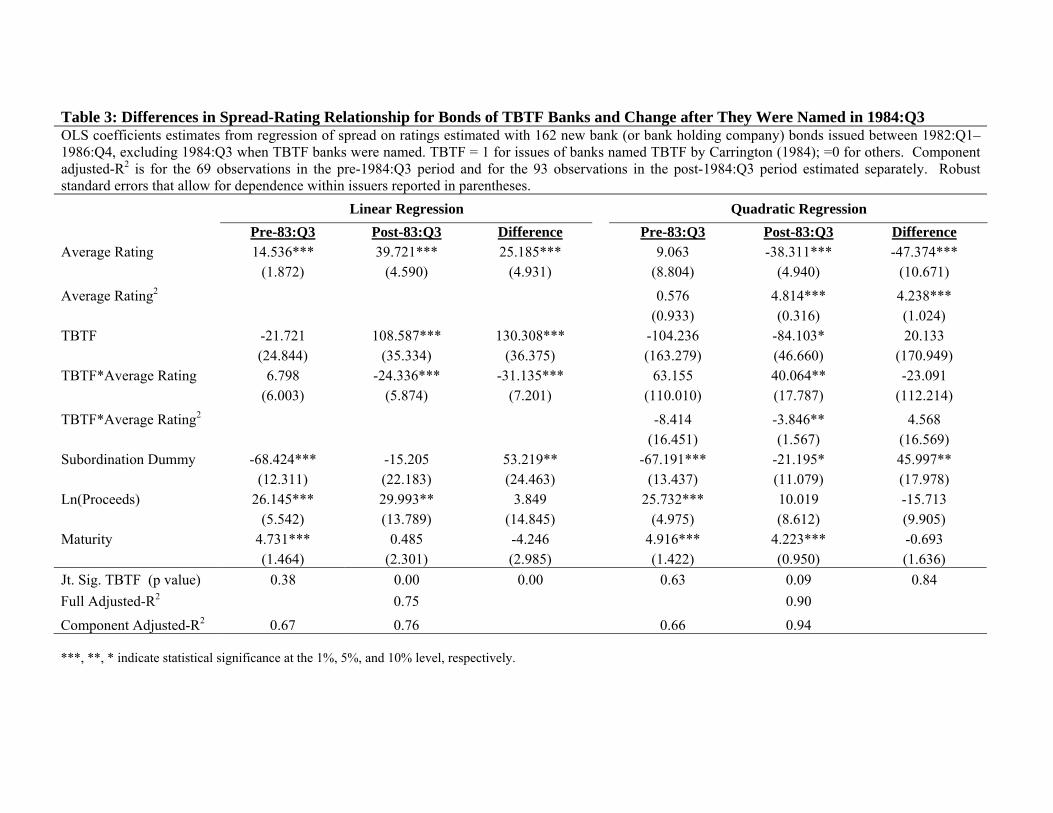
Table 3: Differences in Spread-Rating Relationship for Bonds of TBTF Banks and Change after They Were Named in 1984:Q3 OLS coefficients estimates from regression of spread on ratings estimated with 162 new bank (or bank holding company) bonds issued between 1982:Q1–1986:Q4, excluding 1984:Q3 when TBTF banks were named. TBTF = 1 for issues of banks named TBTF by Carrington (1984); =0 for others. Component adjusted-R2 is for the 69 observations in the pre-1984:Q3 period and for the 93 observations in the post-1984:Q3 period estimated separately. Robust standard errors that allow for dependence within issuers reported in parentheses.
Linear Regression Quadratic Regression Pre-83:Q3 Post-83:Q3 Difference Pre-83:Q3 Post-83:Q3 Difference Average Rating 14.536*** 39.721*** 25.185*** 9.063 -38.311*** -47.374*** (1.872) (4.590) (4.931) (8.804) (4.940) (10.671) Average Rating2 0.576 4.814*** 4.238*** (0.933) (0.316) (1.024) TBTF -21.721 108.587*** 130.308*** -104.236 -84.103* 20.133 (24.844) (35.334) (36.375) (163.279) (46.660) (170.949) TBTF*Average Rating 6.798 -24.336*** -31.135*** 63.155 40.064** -23.091 (6.003) (5.874) (7.201) (110.010) (17.787) (112.214) TBTF*Average Rating2 -8.414 -3.846** 4.568 (16.451) (1.567) (16.569) Subordination Dummy -68.424*** -15.205 53.219** -67.191*** -21.195* 45.997** (12.311) (22.183) (24.463) (13.437) (11.079) (17.978) Ln(Proceeds) 26.145*** 29.993** 3.849 25.732*** 10.019 -15.713 (5.542) (13.789) (14.845) (4.975) (8.612) (9.905) Maturity 4.731*** 0.485 -4.246 4.916*** 4.223*** -0.693 (1.464) (2.301) (2.985) (1.422) (0.950) (1.636) Jt. Sig. TBTF (p value) 0.38 0.00 0.00 0.63 0.09 0.84 Full Adjusted-R2 0.75 0.90 Component Adjusted-R2 0.67 0.76 0.66 0.94
***, **, * indicate statistical significance at the 1%, 5%, and 10% level, respectively.

Table 4: Characteristics of New Bonds Issued by TBTF and Other Banks: 1993 - 1998 Sample statistics calculated (at issuance) for 584 conventional, fixed-rate bonds. TBTF Issues include bonds issued by the 11 bank holding companies identified by Carrington (1984) and descendants. Other Issues include all other bank, bank holding company, and S&L bonds. Spread is the difference (in basis points) between the bond yield at issuance and a Treasury security of comparable maturity.
1993 1994 1995 1996 1997 1998 1993-98 TBTF Issues Mean Spread (basis points) 79.8 77.8 84.0 57.8 71.6 78.0 73.2 Std. Dev. Of Spread (bp) 32.8 17.7 36.5 28.2 36.4 6.0 31.9 Subordinated (%) 75.0 77.8 45.5 41.5 80.0 100.0 57.8 Proceeds ($million) 224.6 185.6 115.3 160.2 290.0 233.3 173.1 Maturity (years) 9.7 10.7 9.0 8.9 14.4 10.0 9.6 Average Rating 7.0 6.6 5.4 5.5 5.6 5.8 6.0 Number of Issues 28 18 33 41 5 3 128 Other Issues Mean Spread (bp) 75.7 52.7 74.8 64.9 81.2 80.3 69.1 Std. Dev. Of Spread (bp) 62.8 36.7 84.1 60.4 55.0 15.9 63.7 Subordinated (%) 51.4 31.0 26.8 31.6 44.4 42.9 35.7 Proceeds ($million) 154.4 130.3 136.7 152.0 243.3 275.5 153.6 Maturity (years) 7.4 6.5 7.9 9.9 12.1 13.2 8.4 Average Rating 6.7 5.3 6.5 6.4 6.6 6.6 6.3 Number of Issues 107 87 127 98 9 28 456
Source: Author's calculations using data from Securities Data Corporation.
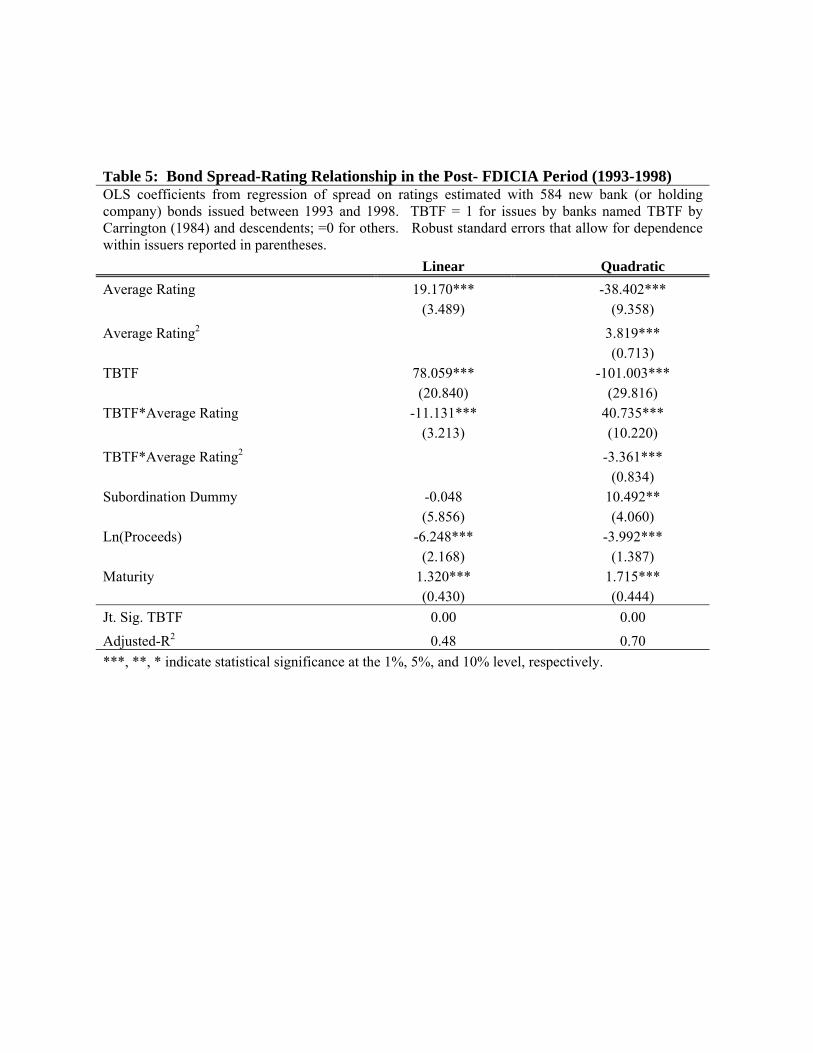
Table 5: Bond Spread-Rating Relationship in the Post- FDICIA Period (1993-1998) OLS coefficients from regression of spread on ratings estimated with 584 new bank (or holding company) bonds issued between 1993 and 1998. TBTF = 1 for issues by banks named TBTF by Carrington (1984) and descendents; =0 for others. Robust standard errors that allow for dependence within issuers reported in parentheses. Linear Quadratic Average Rating 19.170*** -38.402*** (3.489) (9.358) Average Rating2 3.819*** (0.713) TBTF 78.059*** -101.003*** (20.840) (29.816) TBTF*Average Rating -11.131*** 40.735*** (3.213) (10.220) TBTF*Average Rating2 -3.361*** (0.834) Subordination Dummy -0.048 10.492** (5.856) (4.060) Ln(Proceeds) -6.248*** -3.992*** (2.168) (1.387) Maturity 1.320*** 1.715*** (0.430) (0.444) Jt. Sig. TBTF 0.00 0.00 Adjusted-R2 0.48 0.70 ***, **, * indicate statistical significance at the 1%, 5%, and 10% level, respectively.

1
Figure 1: Spreads vs. Ratings for 1982:Q2-1986:Q4
0
100
200
300
400
500
600
0 2 4 6 8 10 12 14 16
TBTF Other
Ratings
Spre
ads

2
Figure 2: Spreads vs. Ratings for 1993-1998
0
100
200
300
400
500
600
700
800
0 2 4 6 8 10 12 14 16 18
TBTF Other
Ratings
Spre
ads