feedstock supply system design and analysis
TRANSCRIPT

The INL is a U.S. Department of Energy National Laboratory operated by Battelle Energy Alliance
INL/EXT-14-33227
Feedstock Supply System Design
and Analysis
“The Feedstock Logistics Design Case for
Multiple Conversion Pathways”
Idaho National Laboratory
Bioenergy Program
Idaho Falls, Idaho 83415
http://www.inl.gov
September 2014
Prepared for the
U.S. Department of Energy
Office of Biomass Program
Under DOE Idaho Operations Office
Contract DE-AC07-05ID14517

DISCLAIMER
This information was prepared as an account of work sponsored by an
agency of the U.S. Government. Neither the U.S. Government nor any
agency thereof, nor any of their employees, makes any warranty, expressed
or implied, or assumes any legal liability or responsibility for the accuracy,
completeness, or usefulness, of any information, apparatus, product, or
process disclosed, or represents that its use would not infringe privately
owned rights. References herein to any specific commercial product,
process, or service by trade name, trademark, manufacturer, or otherwise,
does not necessarily constitute or imply its endorsement, recommendation,
or favoring by the U.S. Government or any agency thereof. The views and
opinions of authors expressed herein do not necessarily state or reflect
those of the U.S. Government or any agency thereof.

INL/EXT-14-33227
Biomass Feedstock
Supply System Design and Analysis
September 2014
Idaho National Laboratory
Bioenergy Program
Idaho Falls, Idaho 83415
http://www.inl.gov
Prepared for the
U.S. Department of Energy
Office of Biomass Program
Under DOE Idaho Operations Office
Contract DE-AC07-05ID14517

2
Executive Summary The U.S. Department of Energy (DOE) aims to make cellulosic biofuels competitive with
petroleum-based fuels at a modeled cost of mature bio-oil technology of $3/gallon gasoline
equivalent (gge) ($2011) by the year 2022. The DOE Bioenergy Technologies Office (BETO)
Terrestrial Feedstock Technology Area supports this goal by demonstrating a modeled delivered
feedstock cost of $80/dry T (dry U.S. short ton) by the year 2017. The purpose of this report is to
document a feasible feedstock supply system for various conversion pathway designs capable of
achieving this 2017 target. This design is referred to in this report as the “2017 Design Case.”
Idaho National Laboratory (INL) supports the U.S. Department of Energy’s bioenergy research
program. As part of the research program INL investigates the feedstock logistics economics and
sustainability of these fuels. A series of reports were published between 2000 and 2013 to
demonstrate the feedstock logistics cost. Those reports were tailored to specific feedstock and
conversion process. Although those reports are different in terms of conversion, the strategies to
improve logistics operations are similar at each conversion process. Therefore, this report is
designed in such a way that it can capture different feedstock logistics cost while eliminating the
need of writing a conversion specific design report.
This report provides feedstock design cost analysis for five conversion pathways: 1) Biological
Conversion of Sugars to Hydrocarbons, 2) Lignocellulosic Biomass conversion to Hydrocarbon
Fuels via Fast Pyrolysis and Hydrotreating Bio-Oil Pathway, 3) Catalytic Conversion of Sugars
to Hydrocarbons ,4) Conversion of Lignocellulosic Biomass to Hydrocarbon Fuels via
Thermochemical Pathways with In Situ and Ex Situ Upgrading of Fast Pyrolysis Vapors, and 5)
Conversion of Lignocellulosic Biomass to High Octane Gasoline via Indirect Gasification and
Methanol Intermediate. The delivered feedstock composition assumed at the process design for
Biological Conversion of Sugars to Hydrocarbons and Catalytic Conversion of Sugars to
Hydrocarbons is the same. Therefore, feedstock supply chain design cost analysis will be the
same for these two conversions pathways. Similarly the delivered feedstock composition
assumed at the process design for conversion of Lignocellulosic Biomass to Hydrocarbon Fuels
via 1) Fast Pyrolysis and Hydrotreating Bio-Oil Pathway, 2) Thermochemical Pathways with In
Situ and Ex Situ Upgrading of Fast Pyrolysis Vapors, and 3) Indirect Gasification and Methanol
Intermediate is the same. As a result feedstock design cost analysis is the same for these three
conversion pathways. As each of these conversion pathways mature and additional information
is added to the feedstock in-feed specifications the chapters for each pathway will be updated
based on the new information.
The goal of the 2017 Design Case is to enable expansion of biofuels production beyond highly
productive resource areas by breaking the reliance of cost-competitive biofuel production on a
single, abundant, low-cost feedstock. If this goal is not achieved, biofuel plants are destined to be
small and/or clustered in select regions of the country that have a lock on low-cost feedstock. To
put the 2017 cost target into perspective of past accomplishments of the cellulosic ethanol
pathway, the $80/dry ton target encompasses total delivered feedstock cost, including both
grower payment and logistics costs, while meeting all conversion in-feed quality targets. The
2012 programmatic target of $35/dry ton included only logistics costs with a limited focus on
biomass quality.
3
The 2017 Design Case explores two approaches to addressing the logistics challenge: one is an
agronomic solution based on blending and integrated landscape management and the second is a
logistics solution based on distributed biomass preprocessing depots. The concept behind
blended feedstocks and integrated landscape management is to gain access to more regional
feedstock at lower access fees (i.e., grower payment) and to reduce preprocessing costs by
blending high quality feedstocks with marginal quality feedstocks. Blending has been used in the
grain industry for a long time; however, the concept of blended feedstocks in the biofuel industry
is a relatively new concept. The blended feedstock strategy relies on the availability of multiple
feedstock sources that are blended using a least-cost formulation within an economical supply
radius, which, in turn, decreases the grower payment by reducing the amount of any single
biomass. This report will introduce the concepts of blending and integrated landscape
management and justify their importance in meeting the 2017 programmatic goals.
The biomass feedstock supply system is a combination of multiple operations that include
harvest and collection, storage, preprocessing, and transportation. Each operation within the
supply system incurs a cost while influencing the biomass quality. This report summarizes the
improvements that are being targeted, based on the research objectives in the following five
research areas: (1) blending, (2) harvest and collection, (3) storage, (4) preprocessing, and
(5) transportation and handling. Feedstock logistics research aims to reduce delivered cost,
improve or preserve feedstock quality, and expand feedstock access. Strategies to improve
logistics operations include (1) organizing logistics in innovative ways, (2) improving existing
operations for efficiency and interaction with other operations, and (3) implementing new
technologies to overcome quality issues. The result is a new advanced biomass supply system
that meets the $80/dry T. delivered cost.

4
Table E-1. Summary of assumptions underpinning progressive design implementations for biological
conversion of sugars to hydrocarbons and catalytic conversion of sugars to hydrocarbons.
2012 Conventional Design Baseline 2017 Design Case
Feedstock(s) Corn stover Corn stover Blended feedstock: corn
stover, switchgrass, and
select municipal solid waste
(MSW)
Grower payment Minimal Increases based on marginal
cost differential
Calculated and modeled
according to specific
location and resource
blend/formulation
Moisture Field dried to 12% Arrives at 30%
Dried to 20%
Arrives: corn stover 30%,
switchgrass 20%, and
MSW 20%;
All dried to 9%
Ash No ash management
assumed
11%, dockage accessed for
ash content Greater than 5%
spec
Blended ash content of 4.9%
Corn stover: multi-pass 7%;
single-pass 3.5%
Switchgrass: 4%
MSW: 10%
Logistics Uses existing systems Uses existing systems Fractional milling
High-moisture densification
Rail transportation for MSW
Quality controls
(passive)
Field drying to meet
moisture spec
Ample available resource;
quality spec manually
selected
Dockage fee assessed to
supplier for below-quality
material
Multi versus single-pass
harvest/ collection
Harvest/collection and
storage best management
practices
Quality controls
(active)
None assumed Rotary drying Multiple resource
blending/formulation
High-moisture densification
High-efficiency pellet drying
Meets quality
target
No Yes Yes
Meets cost target Yes No Yes
Accesses dispersed
resources
No No Yes

5
Table E-2. Summary of assumptions underpinning progressive design implementations for
thermochemical conversion(Fast Pyrolysis and Hydro treating Bio-Oil Pathway, Thermochemical
Pathways with In Situ and Ex Situ Upgrading of Fast Pyrolysis Vapors, Indirect Gasification) (INL 2017
Design Case).
2012 Conventional Design Baseline 2017 Design Case
Feedstock(s) Pulpwood Pulpwood Blended feedstock:
pulpwood, wood residues,
switchgrass, and select
construction and demolition
wastes (C &D)
Grower payment Breakeven cost of
production
Increases based on marginal
cost differential
Calculated and modeled
according to specific location
and resource
blend/formulation
Moisture Field dried to 40% Field dried to 40% Arrives: Pulpwood chips
30% wood residue chips
30%, switchgrass 20%, and
C& D ground 20%;
All dried to 9% pellets
Ash Debark/delimb Debark/delimb Debark/delimb pulpwood
Trommel screen residues
Wash and sort C& D waste
Blended ash content of <1%
Debarked pulpwood <1%,
screened wood residues
1.4%; washed and sorted
C&D 1.0 %
Logistics Uses existing systems Uses existing systems Pneumatics attached to
hammermill
High-moisture densification
Quality controls
(passive)
Field drying to reduce
moisture
Ample available resource;
quality spec manually
selected
Field drying to meet
moisture spec
Harvest/collection and
storage best management
practices for pulpwood and
switchgrass
More rigorous field drying of
pulpwood and residues
Quality controls
(active)
Waste heat dryer Rotary drying Multiple resource
blending/formulation
High-moisture densification
High-efficiency pellet drying
Meets quality
target
Yes Yes Yes
Meets cost target Yes No Yes
Accesses dispersed
resources
No No Yes

6
Authors and Contributors Jacob J. Jacobson
Mohammad S. Roni
Kara G. Cafferty
Kevin Kenney
Erin Searcy
Jason Hansen
7
Table of Contents
EXECUTIVE SUMMARY ................................................................................................................... 2
AUTHORS AND CONTRIBUTORS ................................................................................................. 6
TABLE OF CONTENTS ........................................................................................................................... 7
FIGURES .................................................................................................................................................. 12
TABLES .................................................................................................................................................... 15
LIST OF ACRONYMS ........................................................................................................................ 18
1. 2017 DESIGN CASE .................................................................................................................... 19
2. LIMITATIONS OF CONVENTIONAL SUPPLY SYSTEM DESIGNS ........................ 20
Expansion Beyond Highly Productive Regions ......................................................................................... 21
Feedstock Quality Specifications ............................................................................................................. 22 2.2.1 Moisture Specification ............................................................................................................................... 24 2.2.2 Ash Specification(s) ................................................................................................................................... 25
3. MOVING BEYOND THE 2012 CONVENTIONAL DESIGN .......................................... 28
4. APPROACH OF THE 2017 DESIGN CASE ......................................................................... 30
Addressing the Farm Gate Price Challenge .............................................................................................. 30
Addressing the Feedstock Specification Challenge .................................................................................. 32
Addressing the Logistics Challenge .......................................................................................................... 33
5. 2017 FEEDSTOCK SUPPLY SYSTEM DESIGN ................................................................ 35
2013 State of Technology ........................................................................................................................ 35
Resource Selection Cost Estimation ......................................................................................................... 36
6. FEEDSTOCK SUPPLY SYSTEM UNIT OPERATIONS .................................................. 38
Harvest and Collection Operations .......................................................................................................... 38

8
6.1.1 State of Technology ................................................................................................................................... 38 6.1.2 Improvement of Harvesting and Collection ............................................................................................... 41
Storage .................................................................................................................................................... 42 6.2.1 State of Technology Herbaceous Residues/Energy Crops ......................................................................... 42 6.2.2 State of Technology Woody Biomass ........................................................................................................ 45
Preprocessing .......................................................................................................................................... 47 6.3.1 Comminution ............................................................................................................................................. 47
Sequential Two-Stage Grinding _______________________________________________ 47 Pneumatic separation ______________________________________________________ 48 Fractional Milling Design Basis ______________________________________________ 49 Fractional Milling Dry Biomass ______________________________________________ 53 Fractional Milling High-Moisture Biomass ______________________________________ 54
6.3.2 Drying ........................................................................................................................................................ 54 6.3.3 Densification .............................................................................................................................................. 55
Conventional Pelletizing ____________________________________________________ 55 High-Moisture Densification Design Basis _______________________________________ 56
Transportation ........................................................................................................................................ 58
Handling and Queuing ............................................................................................................................. 58
7. SUPPLY SYSTEM DESIGN: ARRANGEMENT OF UNIT OPERATIONS ............... 59
Conventional Feedstock Supply System .................................................................................................. 59
Advanced Supply System ........................................................................................................................ 59
8. BIOLOGICAL CONVERSION OF SUGARS TO HYDROCARBONS ......................... 61
Summary ................................................................................................................................................. 61
Feedstock Composition (In-feed quality specifications) ........................................................................... 64
Feedstock Selection Cost Estimation ....................................................................................................... 65
Quality Specification and Design Assumptions ........................................................................................ 67
Feedstock Logistics .................................................................................................................................. 67 8.5.1 Harvest and Collection ............................................................................................................................... 67
Overview _______________________________________________________________ 67 Harvest and Collection Design Basis ___________________________________________ 68 Harvest and Collection Cost Estimation _________________________________________ 69
8.5.2 Storage ....................................................................................................................................................... 70 Biomass Storage Design Base ________________________________________________ 70 Biomass Storage Cost Estimation _____________________________________________ 73
8.5.3 Preprocessing ............................................................................................................................................. 73 Size Reduction ___________________________________________________________ 75 Fractional Milling Cost Estimation ____________________________________________ 76 Drying and Densification ___________________________________________________ 76

9
Cost Estimation for High-Moisture Densification __________________________________ 76 Formulation/Blending _____________________________________________________ 78 Formulation Design Basis __________________________________________________ 78 Cost Estimation for Formulation ______________________________________________ 80
8.5.4 Transportation and Handling ...................................................................................................................... 80 Cost Estimation for Transportation ____________________________________________ 81
Life Cycle Assessment: ............................................................................................................................. 81
9. CONVERSION OF LIGNOCELLULOSIC BIOMASS TO HYDROCARBON
FUELS: FAST PYROLYSIS AND HYDROTREATING BIO-OIL PATHWAY ................. 83
Summary ................................................................................................................................................. 83
Feedstock Composition (In-feed quality specifications) ........................................................................... 85
Feedstock Selection Cost Estimation ....................................................................................................... 86
Quality Specification and Design Assumptions ........................................................................................ 88
Feedstock Logistics .................................................................................................................................. 90 9.5.1 Harvest and Collection ............................................................................................................................... 90
Harvest and Collection Design Basis ___________________________________________ 90 Harvest and Collection Cost Estimation _________________________________________ 92
9.5.2 Storage ....................................................................................................................................................... 93 2013 State of Technology ___________________________________________________ 93 Storage Design Basis ______________________________________________________ 94 Biomass Storage Cost Estimation _____________________________________________ 94
9.5.3 Preprocessing ............................................................................................................................................. 94 State of Technology:_______________________________________________________ 96 Size Reduction Cost Estimation _______________________________________________ 96 Drying and Densification ___________________________________________________ 97 Cost Estimation for High-Moisture Densification __________________________________ 98 Formulation/Blending _____________________________________________________ 98
10. CONVERSION OF LIGNOCELLULOSIC BIOMASS TO HYDROCARBON
FUELS: THERMOCHEMICAL PATHWAYS WITH IN SITU AND EX SITU
UPGRADING OF FAST PYROLYSIS VAPORS ........................................................................ 98
Summary ................................................................................................................................................. 99
Feedstock Composition (In-feed quality specifications) ......................................................................... 101
Feedstock Selection Cost Estimation ..................................................................................................... 102
Quality Specification and Design Assumptions ...................................................................................... 104
Feedstock Logistics ................................................................................................................................ 106 10.5.1 Harvest and Collection ......................................................................................................................... 106
Harvest and Collection Design Basis __________________________________________ 106 Harvest and Collection Cost Estimation ________________________________________ 108

10
10.5.2 Storage ................................................................................................................................................. 109 2013 State of Technology __________________________________________________ 109 Storage Design Basis _____________________________________________________ 110 Biomass Storage Cost Estimation ____________________________________________ 110
10.5.3 Preprocessing ....................................................................................................................................... 110 State of Technology:______________________________________________________ 112 Size Reduction Cost Estimation ______________________________________________ 112 Drying and Densification __________________________________________________ 113 Cost Estimation for High-Moisture Densification _________________________________ 114 Formulation/Blending ____________________________________________________ 114 Cost Estimation for Formulation. ____________________________________________ 116
10.5.4 Transportation and Handling Design Basis ......................................................................................... 116 Cost Estimation for Transportation and Handling ________________________________ 117
Life Cycle Analysis ................................................................................................................................. 117
11. DILUTE-ACID CONVERSION OF LIGNOCELLULOSIC BIOMASS TO HIGH
OCTANE GASOLINE VIA INDIRECT GASIFICATION AND METHANOL
INTERMEDIATE .............................................................................................................................. 119
Summary ............................................................................................................................................... 119
Feedstock Composition (In-feed quality specifications) ......................................................................... 121
Feedstock Selection Cost Estimation ..................................................................................................... 122
Quality Specification and Design Assumptions ...................................................................................... 124
Feedstock Logistics ................................................................................................................................ 126 11.5.1 Harvest and Collection ......................................................................................................................... 126
Harvest and Collection Design Basis __________________________________________ 126 Harvest and Collection Cost Estimation ________________________________________ 128
11.5.2 Storage ................................................................................................................................................. 129 2013 State of Technology __________________________________________________ 129 Storage Design Basis _____________________________________________________ 130 Biomass Storage Cost Estimation ____________________________________________ 130
11.5.3 Preprocessing ....................................................................................................................................... 130 State of Technology:______________________________________________________ 132 Size Reduction Cost Estimation ______________________________________________ 132 Drying and Densification __________________________________________________ 133 Cost Estimation for High-Moisture Densification _________________________________ 134 Formulation/Blending ____________________________________________________ 134 Cost Estimation for Formulation. ____________________________________________ 135
11.5.4 Transportation and Handling Design Basis ......................................................................................... 136 Cost Estimation for Transportation and Handling ________________________________ 136
Life Cycle Analysis ................................................................................................................................. 137
REFERENCES ................................................................................................................................... 139
APPENDIX A ........................................................................................................................................ 143

11
APPENDIX B ........................................................................................................................................ 147
APPENDIX C ........................................................................................................................................ 153
APPENDIX D........................................................................................................................................ 156
APPENDIX E ........................................................................................................................................ 159

12
Figures Figure 1. Total tons per county of available pulpwood at $60/dry T farm gate price. Yellow
circles show areas represented in the 2012 Conventional Design and the Relocated
(2013) Design Case 5. ................................................................................................................. 21
Figure 2. Total tons per county of available corn stover at $40/dry T farm gate price. Circles show
areas represented in the 2012 Conventional Design and the Relocated (2013) Design
Case. ........................................................................................................................................... 22
Figure 3. Flow diagram of the 2012 Relocated (Baseline) Design Case to supply thermochemical
conversion refineries 12. .............................................................................................................. 28
Figure 4. Marginal and average farm gate costs versus supply quantities derived from BT2 data
for the U.S. predicted out to 2022 1. ........................................................................................... 31
Figure 5. U.S. Marginal farm gate prices projected for 2022 by POLYSYS 1. .......................................... 32
Figure 6. Historical pulpwood stumpage prices for the southern U.S. in $/dry Ton
(http://www.timbermart-south.com/prices.html). ....................................................................... 36
Figure 7. National estimated pulpwood stumpage prices 1. ........................................................................ 36
Figure 8. Ash content of corn stover bales from Stevens County, Kansas, that are collected using
single pass baling and a variety of multi-pass methods, including two rakes, two balers,
a mower, and a flail shredding windrower. ................................................................................ 40
Figure 9. Ash content (bars) and yield (text) of corn stover bales from Stevens County, Kansas,
show the impact of collection efficiency and windrowing equipment on yield and soil
entrainment. ................................................................................................................................ 41
Figure 10. Dry matter loss of corn stover in laboratory storage conditions at fixed moisture
contents 32. ................................................................................................................................. 43
Figure 11. Change in moisture content of stacked corn stover bales in northern Iowa. Image
depicts the variation in moisture content of a four-high column of bales stored outdoors
for up to 9 months 32. .................................................................................................................. 44
Figure 12. Change in glucan and xylan over time as corn stover is stored in laboratory reactors 32. ......... 45
Figure 13. Dry matter loss and self-heating of 50% initial moisture pine chips stored under
aerobic conditions using laboratory scale reactors at INL. ......................................................... 46
Figure 14. Comparison of comminution capacities (tons of through put per operating hour) for
woody biomass as a result of adding pneumatic transfer assist (PTS) 38. ................................... 48
Figure 15. Change in moisture content during comminution using pneumatic transfer assist (PTS) 38. ................................................................................................................................................. 48
Figure 16. Ash content in various screen sizes for pinyon-juniper biomass 38 41. ....................................... 49
Figure 17. Particle-size distributions for five grinding scenarios 41. ........................................................... 50
Figure 18. Comparison of conventional, two-stage grinding and fractional milling 41. .............................. 51
Figure 19. Grinding energy and throughput is highly dependent on screen size 41. ................................... 52
Figure 20. Hammer mill energy consumption is highly dependent on biomass moisture content
(INL PDU Data). ........................................................................................................................ 53
13
Figure 21. Conventional pelletization process. ........................................................................................... 56
Figure 22. High-moisture pelletization process. ......................................................................................... 57
Figure 23. Conventional feedstock system for herbaceous lignocellulosic biomass. ................................. 59
Figure 24. Advanced supply system designs (Advanced Uniform) follow the model of the current
grain commodity supply system, which manages crop diversity at the point of harvest
and/or depot, allowing all subsequent feedstock supply system infrastructure to be
similar for all biomass resources4. .............................................................................................. 60
Figure 25. Comparison of individual and blended feedstock costs. A blend of 60% corn stover,
35% switchgrass, and 5% municipal solid waste is needed to hit the $80 feedstock cost
target. .......................................................................................................................................... 63
Figure 26. Resource selections for the 2017 Design Case to support biochemical conversion.
Figure shows tonnages available at $40/dry ton. Green represents higher amounts of
tonnage available, red represents no available tonnage available at $40/dry ton 47. ................... 66
Figure 27. The impact of dry matter loss on bale ash content and final conversion efficiency
(based on a 30% initial moisture and 12% ash). ......................................................................... 71
Figure 28. Dry matter loss of corn stover in the simulated storage conditions, with three air flows
simulating three different oxygen availabilities. ......................................................................... 72
Figure 29. Material flow in the 2017 Design Case that incorporates many improvements in
preprocessing, including fractional milling, chemical preconversion, high-moisture
densification, and formulation/blending. .................................................................................... 74
Figure 30. Total tons per county of available pulpwood at $60/dry T farm gate price. Yellow
circles show areas represented in the 2012 Conventional Design and the Relocated
(2013) Design Case 5. ................................................................................................................. 87
Figure 31. Conventional (left) and high-capacity grapple skidder (right) for transporting small
diameter pulpwood from the forest to the landing. Photo credit: Auburn University
High Tonnage Forest Biomass Project 58. ................................................................................... 91
Figure 32. Ash and moisture content of switchgrass harvested in Oklahoma, 2010 by Oklahoma
State University. Error bars represent one standard deviation. Ash samples for October,
December, and January are three samples comprised of six individual core samples
composited. ................................................................................................................................. 92
Figure 33. Material flow in the 2017 Design Case that incorporates many improvements in
preprocessing, including pneumatics, high-moisture densification, and
formulation/blending. ................................................................................................................. 95
Figure 34. Total tons per county of available pulpwood at $60/dry T farm gate price. Yellow
circles show areas represented in the 2012 Conventional Design and the Relocated
(2013) Design Case 5. ............................................................................................................... 103
Figure 35. Conventional (left) and high-capacity grapple skidder (right) for transporting small
diameter pulpwood from the forest to the landing. Photo credit: Auburn University
High Tonnage Forest Biomass Project 58. ................................................................................. 107
Figure 36. Ash and moisture content of switchgrass harvested in Oklahoma, 2010 by Oklahoma
State University. Error bars represent one standard deviation. Ash samples for October,
14
December, and January are three samples comprised of six individual core samples
composited. ............................................................................................................................... 108
Figure 37. Material flow in the 2017 Design Case that incorporates many improvements in
preprocessing, including pneumatics, high-moisture densification, and
formulation/blending. ............................................................................................................... 111
Figure 38. Total tons per county of available pulpwood at $60/dry T farm gate price. Yellow
circles show areas represented in the 2012 Conventional Design and the Relocated
(2013) Design Case 5. ............................................................................................................... 123
Figure 39. Conventional (left) and high-capacity grapple skidder (right) for transporting small
diameter pulpwood from the forest to the landing. Photo credit: Auburn University
High Tonnage Forest Biomass Project 58. ................................................................................. 127
Figure 40. Ash and moisture content of switchgrass harvested in Oklahoma, 2010 by Oklahoma
State University. Error bars represent one standard deviation. Ash samples for October,
December, and January are three samples comprised of six individual core samples
composited. ............................................................................................................................... 128
Figure 41. Material flow in the 2017 Design Case that incorporates many improvements in
preprocessing, including pneumatics, high-moisture densification, and
formulation/blending. ............................................................................................................... 131
Figure B 1.The farm gate cost curves suggest that corn stover is the preferred feedstock because it
is less expensive than switchgrass. ........................................................................................... 148
Figure B 2. Accounting for quality (dockage)—shows that about 300,000 tons of switchgrass can
be supplied at a lower cost than corn stover. ............................................................................ 149
Figure B 3. A corn stover/switchgrass blend that will deliver at about $81/dry T. .................................. 150
Figure B 4. A minimum of 5% MSW (at $1/dry T) is needed to achieve the $80/dry T cost target
with a corn stover, switchgrass, and municipal solid waste blend............................................ 151
Figure B 5. Comparison of individual and blended feedstock costs. A blend of 60% corn stover,
35% switchgrass, and 5% municipal solid waste is needed to hit the $80 feedstock cost
target. ........................................................................................................................................ 151
Figure C 1. Sensitivity of dockage by altering feedstock ash content relative to the baseline ash
content of 4.9% 83. .................................................................................................................... 153
Figure C 2. Sensitivity of the costs impacts to altering feedstock price relative to the base case of
58.50 $/dry T for a delivered feedstock with 10% ash83. .......................................................... 154
Figure C 3. Total dockage based on shifting baseline ash content for a range of received materials
at a feedstock price of 58.50 $/dry T83. ..................................................................................... 155

15
Tables Table E-1. Summary of assumptions underpinning progressive design implementations for
biological conversion of sugars to hydrocarbons and catalytic conversion of sugars to
hydrocarbons. ............................................................................................................................... 4
Table E-2. Summary of assumptions underpinning progressive design implementations for
thermochemical conversion(Fast Pyrolysis and Hydro treating Bio-Oil Pathway,
Thermochemical Pathways with In Situ and Ex Situ Upgrading of Fast Pyrolysis
Vapors, Indirect Gasification) (INL 2017 Design Case). ............................................................. 5
Table 1. Delivered woody feedstock composition and processing assumptions for the fast
pyrolysis and hydrotreating design report 6. ............................................................................... 23
Table 2. Potential effect of higher biomass ash content .............................................................................. 26
Table 3. Costs and specifications for woody feedstocks and blends (INL analysis). ................................. 27
Table 4. 2013 SOT cost estimate (all costs are in 2011 USD). ................................................................... 29
Table 5. Resource access cost estimate 5 and INL Material Solid Waste (MSW Data) ............................. 37
Table 6. Mean total ash values and ranges for selected lignocellulosic biomass ........................................ 39
Table 7. Drying and densification design basis. ......................................................................................... 57
Table 8. Biochemical conversion feedstock design cost analysis. .............................................................. 62
Table 9. Delivered Feedstock Composition Assumed in the Present Design 44. ......................................... 65
Table 10. Resource farm gate price. ........................................................................................................... 66
Table 11. Summary of assumptions underpinning progressive design implementations. .......................... 67
Table 13. Biomass harvest and collection cost estimates. .......................................................................... 70
Table 14. Biomass storage design basis. ..................................................................................................... 73
Table 15. Field-side storage cost estimation. .............................................................................................. 73
Table 16. Size-reduction design basis. ........................................................................................................ 76
Table 17. Fractional milling cost estimates ................................................................................................ 76
Table 18. Drying and densification design basis. ....................................................................................... 77
Table 19. Drying and densification cost estimates. .................................................................................... 78
Table 20. Feedstock formulation/blending of ash and moisture contents*. ................................................ 78
Table 21. Feedstock formulation design basis. ........................................................................................... 79
Table 22. Formulation cost estimation. ....................................................................................................... 80
Table 23. Transportation cost estimates. ..................................................................................................... 81
Table 24. Energy consumption for Biochemical conversion supply chain design. .................................... 82
Table 25. GHG contribution for biochemical conversion supply chain design. ......................................... 82
Table 26. Thermochemical feedstock design cost analysis for 2017. ......................................................... 84
16
Table 27. Delivered woody feedstock composition and processing assumptions for the fast
pyrolysis and hydrotreating design report 6. ............................................................................... 86
Table 28. Resource access cost estimate (U.S. DOE 2011 5 and INL MSW Data). ................................... 88
Table 29. Summary of assumptions underpinning progressive design implementations 57. ....................... 89
Table 30. Biomass harvest and collection cost estimates derived from INL analysis. ............................... 93
Table 31. Technical targets for biomass field storage of resources in the 2017 Design Case. ................... 94
Table 32. Field-side storage cost estimation. .............................................................................................. 94
Table 33. Size-reduction design basis. ........................................................................................................ 96
Table 34. Size reduction cost estimates. ..................................................................................................... 96
Table 35. Drying and densification design basis. ....................................................................................... 97
Table 36. Drying and densification cost estimates. .................................................................................... 98
Table 37. Feedstock formulation/blending of ash and moisture contents*. ................................................ 98
Table 39. Delivered woody feedstock composition and processing assumptions for the In Situ and
Ex Situ Upgrading of Fast Pyrolysis Vapors 6. ......................................................................... 102
Table 40. Resource access cost estimate (U.S. DOE 2011 5, and INL MSW Data). ............................... 104
Table 41. Summary of assumptions underpinning progressive design implementations 57. ..................... 105
Table 42. Biomass harvest and collection cost estimates derived from INL analysis. ............................. 109
Table 43. Technical targets for biomass field storage of resources in the 2017 Design Case. ................. 110
Table 44. Field-side storage cost estimation. ............................................................................................ 110
Table 45. Size-reduction design basis. ...................................................................................................... 112
Table 46. Size reduction cost estimates. ................................................................................................... 113
Table 47. Drying and densification design basis. ..................................................................................... 113
Table 48. Drying and densification cost estimates. .................................................................................. 114
Table 49. Feedstock formulation/blending of ash and moisture contents*. .............................................. 115
Table 50. Feedstock formulation design basis. ......................................................................................... 115
Table 51. Formulation cost estimation. ..................................................................................................... 116
Table 52. Transportation cost estimates. ................................................................................................... 117
Table 53. Energy Consumption for Thermochemical conversion supply chain design. ........................... 118
Table 54. GHG contribution for thermochemical conversion supply chain design. ................................. 118
Table 55. Thermochemical feedstock design cost analysis for 2017. ....................................................... 120
Table 56. Delivered woody feedstock composition and processing assumptions for the fast
pyrolysis and hydrotreating design report 6. ............................................................................. 122
Table 57. Resource access cost estimate (U.S. DOE 2011 5, and INL MSW Data). ................................ 124
Table 58. Summary of assumptions underpinning progressive design implementations 57. ..................... 125
Table 59. Biomass harvest and collection cost estimates derived from INL analysis. ............................. 129

17
Table 60. Technical targets for biomass field storage of resources in the 2017 Design Case. ................. 130
Table 61. Field-side storage cost estimation. ............................................................................................ 130
Table 62. Size-reduction design basis. ...................................................................................................... 132
Table 63. Size reduction cost estimates. ................................................................................................... 132
Table 64. Drying and densification design basis. ..................................................................................... 133
Table 65. Drying and densification cost estimates. .................................................................................. 134
Table 66. Feedstock formulation/blending of ash and moisture contents*. .............................................. 134
Table 67. Feedstock formulation design basis. ......................................................................................... 135
Table 68. Formulation cost estimation. ..................................................................................................... 136
Table 69. Transportation cost estimates. ................................................................................................... 137
Table 70. Energy Consumption for Thermochemical conversion supply chain design. ........................... 137
Table 71. GHG contribution for thermochemical conversion supply chain design. ................................. 138
Table A 1. Potential C&D available in select counties in western South Carolina. ................................. 143
Table A 2. National average municipal solid waste composition. ............................................................ 144
Table A 3. Per capita generation rates for various fractions of municipal solid waste and
construction and demolition waste (lb/person/day). ................................................................. 145
Table A 4. Physical parameters of solid waste ......................................................................................... 146
Table D 1. Expected unit operations and assumptions for the application of a drain and fill
leaching system for the removal of soluble ash from biomass in a feedstock depot. ............... 157

18
List of Acronyms
C&D waste Construction and demolition waste
Dry T Dry Ton
MSW Municipal Solid Waste
BETO Bioenergy Technology Office
BT2 Billion Ton Study Update
DMT Dry Matter Ton (U.S. short ton)
DOE U.S. Department of Energy
GGE Gallon Gasoline Equivalent
I&D Interest and Depreciation (costs)
IH&T Insurance Housing and Taxes (costs)
INL Idaho National Laboratory
MC Moisture Content
MESP Minimum Ethanol Selling Price
ORNL Oakridge National Laboratory
PDU Process Demonstration Unit (at INL)
R&M Repairs and Maintenance (costs)
TEA Techno-Economic Analysis
LCF Least Cost formulation
PNNL Pacific Northwest National Laboratory
NREL National Renewable Energy Laboratory

19
1. 2017 Design Case The success of the earlier logistic pathway designs (Biochemical and Thermochemical) from a
feedstock perspective was that it demonstrated that through proper equipment selection and best
management practices, conventional supply systems (referred to in this report as “conventional
designs,” or specifically the 2012 Conventional Design) can be successfully implemented to
address dry matter loss, quality issues, and enable feedstock cost reductions that help to reduce
feedstock risk of variable supply and quality and enable industry to commercialize biomass
feedstock supply chains. The caveat of this success is that conventional designs depend on high
density, low-cost biomass with no disruption from incremental weather. In this respect, the
success of conventional designs is tied to specific, highly productive regions such as the
southeastern U.S. which has traditionally supported numerous pulp and paper industries or the
Midwest U.S for corn stover.
The goal of the 2017 Logistics Design Case is to increase availability of affordable biomass
beyond only highly productive resource areas. The 2017 programmatic target is to supply the
conversion facility with a feedstock that meets the conversion feedstock specifications at a total
delivered cost of $80/dry T. This design document describes a feedstock logistics design capable
of achieving this goal, discusses the limitations of the conventional supply systems when applied
outside of highly productive resource areas and shows how these limitations can be resolved
through integration of multiple types of feedstocks, clear definition of biomass quality
specifications, and technology advancement in logistics and preprocessing.
The $80/dry T target encompasses a total delivered feedstock cost, including both grower
payment and logistics, and meeting all conversion in-feed quantity and quality targets. The 2012
$55/dry T target for the thermochemical conversion pathway and the $35/dry T biochemical
conversion pathway target included only logistics costs and only included passive quality control
methods. An estimated grower payment associated with the 2012 Conventional Design was
$15.20/dry T based on the break-even cost of production 1. Adding grower payment and
logistics, the total delivered feedstock cost was $70.20/dry T for thermochemical conversion and
$50.20/dry T for biochemical conversion in 2007 dollars. Translating the $70.20/dry T to 2011
dollars, the total delivered feedstock cost of the 2012 Conventional Design scales to about
$80/dry T. This demonstrates that for a conventional supply system it is possible to deliver
feedstock to various conversion pathways for $80/dry T or less, but only for of tightly coupled
set of designs that require high quality, low moisture harvested material. First, the 2012
Conventional Design assumed field drying the material. Next, it was assumed that waste heat
from the conversion facility would be available for further drying requirements. And finally, the
design assumed that biomass was available in high yield regions, minimizing transportation
distances. Each of these assumptions limits the size and location of conversion facilities and
assumes that weather will not impact biomass quality. Achieving the goals of the 2017 Design
Case will require innovative solutions and significant technological advancements as pivotal
assumptions within the 2012 Conventional Design are removed.
This report is intended to describe the feedstock logistic pathway for supplying biomass to a
conversion facility. The logistic designs are not conversion pathway specific, but discuss in
general the methods and processes necessary to stabilize and densify large volumes of biomass

20
that can then be delivered to the specific conversion pathways at a specified quality level.
Sections 8–11 will then outline the costs and quality impacts for the current conversion
pathways. Feedstock design reports associated with alternate hydrocarbon pathways of BETO
will be published subsequent to this report.
2. Limitations of Conventional Supply System Designs Conventional design is based on the supply system where corn stover or other herbaceous
residues are procured through contracts with local growers, harvested, stored at field side, and
delivered in bale format to the conversion facility. A detailed description of conventional supply
system is provided in section 7.1.Conventional designs are the backbone of an emerging biofuels
industry. In fact, conventional designs have been successfully implemented by pioneer (1st of a
kind, small capacity) biorefineries currently in operation. However, conventional supply systems
have limitations2,3 that prohibit them from being broadly implemented to access the diverse set
of resources needed to support a national biorefinery capability. These limitations, including
biomass availability, feedstock quality and high costs, are discussed in this section.
The viability of the 2012 Conventional Design is rooted in areas that have a concentrated supply
of easily accessible, and low-cost biomass resources (i.e., termed highly productive resource
areas in this 2017 Design Case). Moving outside of these select regions, the feedstock supply
system must be adapted to accommodate a different supply-demand dynamic brought about by
changing cost, quality, and conversion facility size constraints. When located outside highly
productive areas, biorefineries that rely on conventional designs are likely to be small due to the
high cost of transportation of low density biomass, limiting their ability to achieve economies of
scale, because feedstock costs and risks are likely to be prohibitive4.
Biomass is highly variable in quality (e.g., ash, moisture, and particle size). Conventional
systems can only address feedstock quality indirectly through passive controls such as resource
selection or best management practices, and harvest technique. When positioned in a highly
productive area, biorefineries can be selective in contracting only those feedstocks that meet their
specifications. Best management practices also can be used to reduce issues of moisture and ash,
but they will not eliminate them. Additional work needs to be done both on the conversion side
as well as the feedstock side to identify additional quality specifications and to align them with
the various feedstocks which match up with the conversion process including woody, herbaceous
residues, energy crops and various municipal solid wastes (MSW). The new quality
specifications could include breaking down total ash by species (e.g. potassium and other alkali),
cellulose, hemicellulose, lignin, and other extractives. Each conversion pathway will have a
select set of quality specifications that may very well dictate regions of the country that are better
aligned to supply feedstocks.
Two requirements that distinguish the 2017 Design Case from the 2012 Conventional Design are
first expansion beyond highly productive resource areas and second adherence to feedstock
specifications. These requirements are discussed in detail in the following subsections.
21
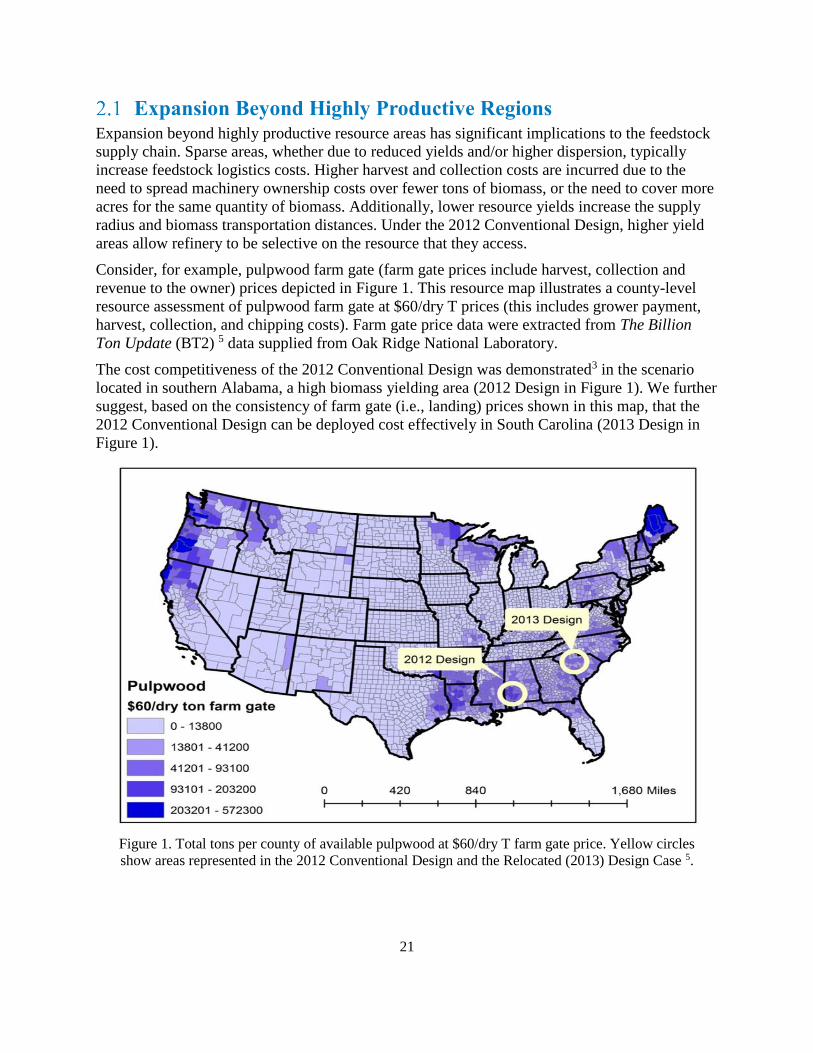
Expansion Beyond Highly Productive Regions Expansion beyond highly productive resource areas has significant implications to the feedstock
supply chain. Sparse areas, whether due to reduced yields and/or higher dispersion, typically
increase feedstock logistics costs. Higher harvest and collection costs are incurred due to the
need to spread machinery ownership costs over fewer tons of biomass, or the need to cover more
acres for the same quantity of biomass. Additionally, lower resource yields increase the supply
radius and biomass transportation distances. Under the 2012 Conventional Design, higher yield
areas allow refinery to be selective on the resource that they access.
Consider, for example, pulpwood farm gate (farm gate prices include harvest, collection and
revenue to the owner) prices depicted in Figure 1. This resource map illustrates a county-level
resource assessment of pulpwood farm gate at $60/dry T prices (this includes grower payment,
harvest, collection, and chipping costs). Farm gate price data were extracted from The Billion
Ton Update (BT2) 5 data supplied from Oak Ridge National Laboratory.
The cost competitiveness of the 2012 Conventional Design was demonstrated3 in the scenario
located in southern Alabama, a high biomass yielding area (2012 Design in Figure 1). We further
suggest, based on the consistency of farm gate (i.e., landing) prices shown in this map, that the
2012 Conventional Design can be deployed cost effectively in South Carolina (2013 Design in
Figure 1).
Figure 1. Total tons per county of available pulpwood at $60/dry T farm gate price. Yellow circles
show areas represented in the 2012 Conventional Design and the Relocated (2013) Design Case 5.

22
The map depicts a fairly steep gradient where resource available at $60/dry T farm gate price
rapidly decreases (lighter colors) for areas outside the southern area that traditionally supported a
thriving pulp and paper industry. Significant county-to-county fluctuations in available resources
are seen as well. In these areas, as in the scenario depicted in western South Carolina, sufficient
pulpwood exists to support an 800,000 ton per year biorefinery; however resource selectivity to
passively mitigate quality will be constrained due to the limited amount of biomass (i.e.,
selecting only the higher quality material and leaving the low quality material behind). In this
scenario, a more dispersed pulpwood resource, due to lower yields in these regions, also results
in increased harvest, collection, and transportation costs compared to the lower-cost scenario.
To reinforce this concept and to expand the analysis to other feedstocks, Figure 2 depicts farm
gate price for corn stover in the Midwest for two areas. The first is in Iowa where corn yields are
high and the second area moves to western Kansas with lower yields. The map also depicts (as in
the pulpwood case) a fairly steep gradient where at $40/dry T farm gate price resources rapidly
decrease toward the fringes of the Corn Belt. Significant county-to-county fluctuations in
resources are seen within this fringe zone as well. In these areas, as in the scenario depicted in
western Kansas, ample corn stover exists to support large-scale biorefineries however; feedstock
access costs alone may be more than double the Corn Belt prices. A more dispersed corn stover
resource, due to lower yields in these regions, also results in increased harvest, collection, and
transportation costs compared to the lower-cost scenario.
Figure 2. Total tons per county of available corn stover at $40/dry T farm gate price. Circles show areas
represented in the 2012 Conventional Design and the Relocated (2013) Design Case.
Feedstock Quality Specifications Techno-economic models often involve process simulations wherein mass and energy balances
converged across a number of unit operations to assess the entire system as a whole. Feedstock
compositions and heating values are required inputs to these balances. The fast pyrolysis and
hydrotreating conversion pathway (Section 9) feedstock specifications are shown in Table 1.
23
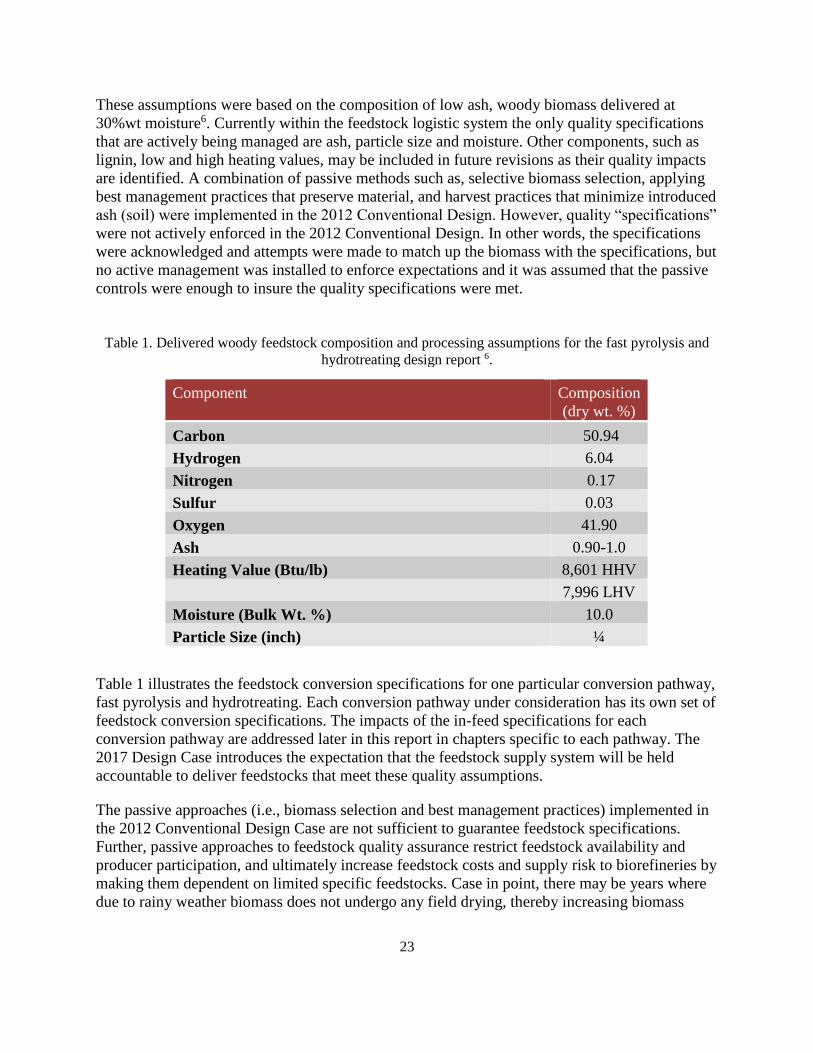
These assumptions were based on the composition of low ash, woody biomass delivered at
30%wt moisture6. Currently within the feedstock logistic system the only quality specifications
that are actively being managed are ash, particle size and moisture. Other components, such as
lignin, low and high heating values, may be included in future revisions as their quality impacts
are identified. A combination of passive methods such as, selective biomass selection, applying
best management practices that preserve material, and harvest practices that minimize introduced
ash (soil) were implemented in the 2012 Conventional Design. However, quality “specifications”
were not actively enforced in the 2012 Conventional Design. In other words, the specifications
were acknowledged and attempts were made to match up the biomass with the specifications, but
no active management was installed to enforce expectations and it was assumed that the passive
controls were enough to insure the quality specifications were met.
Table 1. Delivered woody feedstock composition and processing assumptions for the fast pyrolysis and
hydrotreating design report 6.
Component Composition
(dry wt. %)
Carbon 50.94
Hydrogen 6.04
Nitrogen 0.17
Sulfur 0.03
Oxygen 41.90
Ash 0.90-1.0
Heating Value (Btu/lb) 8,601 HHV
7,996 LHV
Moisture (Bulk Wt. %) 10.0
Particle Size (inch) ¼
Table 1 illustrates the feedstock conversion specifications for one particular conversion pathway,
fast pyrolysis and hydrotreating. Each conversion pathway under consideration has its own set of
feedstock conversion specifications. The impacts of the in-feed specifications for each
conversion pathway are addressed later in this report in chapters specific to each pathway. The
2017 Design Case introduces the expectation that the feedstock supply system will be held
accountable to deliver feedstocks that meet these quality assumptions.
The passive approaches (i.e., biomass selection and best management practices) implemented in
the 2012 Conventional Design Case are not sufficient to guarantee feedstock specifications.
Further, passive approaches to feedstock quality assurance restrict feedstock availability and
producer participation, and ultimately increase feedstock costs and supply risk to biorefineries by
making them dependent on limited specific feedstocks. Case in point, there may be years where
due to rainy weather biomass does not undergo any field drying, thereby increasing biomass

24
moisture which results in decreased harvest yields, increased dry matter loss, transportation
costs, grinding costs and drying costs each of which increase the cost to the biorefinery.
The solution to be implemented in the 2017 Design Case still includes biomass selection and best
management practices; however, this design also introduces active quality controls into the
feedstock supply system. The 2017 Design Case approach enables access to the vast and diverse
biomass resources available to support a national biofuels production capacity, while assuring
strict adherence to biorefinery quality specifications.
A significant challenge for implementing active quality controls is that adding in additional
processes adds cost to an already cost-constrained system. Therefore, the insertion of active
controls into the 2017 Design Case must balance the cost/benefit of mitigation in the feedstock
supply system and the cost of further biorefinery processing of off-spec feedstock.
In commercial practice, this normalization function is implemented through a dockage fee. A
dockage fee is the penalty a feedstock supplier incurs from payment by the biorefinery for
delivery of off-specification feedstock. The dockage fee is established based on the additional
cost the biorefinery incurs to process off-specification feedstock; the dockage fee is subtracted
from the contracted feedstock payment the biorefinery agreed to pay a supplier. If the pre-
delivery cost of mitigation by the feedstock supplier exceeds the dockage fee, the dockage fee is
the lowest cost option; otherwise, the feedstock supplier could implement corrective strategies to
avoid the dockage penalty and remain economically competitive. For example, if ash removal is
required to meet the biorefinery feedstock quality specification and mitigation within the
feedstock supply system costs the supplier $15/dry T, but the biorefinery is able to mitigate the
ash for $10/dry T, the feedstock supplier may choose to accept the $10/dry T dockage fee rather
than implement ash reduction, for a net $5/dry T savings. For further discussion on dockage see
Appendix C
Implementation of a dockage-based quality assurance approach, much like in the grain industry,
requires accurate assessment of the cost/specification relationship(s), the practicality and cost
effectiveness of the mitigation approach, and the availability of rapid and accurate analytical
methods for measurement of the specifications at the point of sale. The following list describes
an initial approach to establishing dockage for moisture and ash content.
2.2.1 Moisture Specification
For some conversion processes, i.e. thermochemical processing, feedstock moisture content has a
strong influence on the process economics. High quality heat in the reactor will be required to
evaporate the extra moisture which can be a significant penalty on the process depending on how
it is configured 7.The reality is that the moisture has a high impact on both the feedstock supply
system as well as the conversion process. In addition to its implications on storage stability,
biomass moisture content can significantly affect transportation, preprocessing, and feedstock
handling 8. These logistics-related costs are discussed in Section 3. Since the logistics supply
system is designed to meet the moisture target there will not be a dockage assessed by the
biorefinery for excessive feedstock moisture content.

25
2.2.2 Ash Specification(s)
Feedstock ash content has a big impact on liquid yields for most conversion processes. Ash in
this context is a combination of inorganic material that has two parts: (1) the mineral matter
taken up from the soil and retained as part of the plant or tree; (aka physiological ash), and (2)
inorganic material that was collected with the biomass during harvesting/collection (e.g. soil
matter, dirt, etc.). Both parts are not converted during conversion and represent solid input that
goes through the process and requires disposal. This extra inert mass causes a decrease in
conversion efficiency and creates a waste stream that needs additional removal costs. Current
predicted disposal costs are $18/T for pyrolysis 9. The cost for other conversion processes may
be different.
The goal of implementing improved feedstock supply system design is to minimize the inorganic
material collected during harvest/collection and not address the physiological ash in the plants. In
future supply systems, advanced preprocessing may be required to address physiological ash.
Another option worth pursuing is that feedstock with higher ash is purchased at a low enough
price to compensate for the losses in fast pyrolysis liquid yield or an added cleanup process to
bring it in on specification. INL, in collaboration with NREL and PNNL, are researching the
benefits/costs of both methods. Table 2 illustrates the effect of ash content on fast pyrolysis
liquid yield. Additionally, feedstock ash content represents an additional variable operational
cost to the biorefinery, because it reduces pretreatment efficacy, increases wear in handling and
feeding systems, accumulates as a waste stream that requires disposal, and increases water
treatment costs 10. While ash entrained in the liquid could impact downstream catalysis, it is
unknown at this time if the ash is soluble or attached to the char. There is a filtration step prior to
condensed-phase upgrading that can help reduce the impacts. If the ash is soluble, it may impact
the catalyst life.
Limited understanding is known about the efficiency of upgrading high-ash feedstock pyrolysis
oils. Preliminary efforts indicate that oil produced from high-ash feedstocks actually performs
better during hydrotreating. This would indicate that the loss of efficiency during pyrolysis is
balanced by improved efficiency during hydrotreating. This might actually be an improved
scenario because lost efficiency during hydrotreating is typically related to small molecular
weight acids that consume hydrogen before being lost to the fuel gas 11.

26
Table 2. Potential effect of higher biomass ash content 6.
Cost and Consumption
Base Case
with 0.9%wt Ash
Base Case
with 1.9%wt Ash
Fuel yield,
gal/dry T. biomass
84 75
Natural gas
usage, scf/gal
19.3 5.9
H₂ demand,
MMscfd
44.5 40
TCI, million $ 700 672
MESP, $/gge 3.39 3.55
Note: TCI (Total Cost Indicator), scf = standard cubic feet
Crop residues forest thinnings, logging residues, and construction and demolition (C&D) wastes
are low cost resources to procure, but also have unfavorable quality specifications, specifically
ash content. It should be noted that the ash type and quantity may have an effect on the yield of
fast pyrolysis oil as certain ash constituents can cause an increase in the gas production at the
expense of condensable liquids; however more research is needed to understand the impacts of
ash on conversion.
Because these biomass resources are low cost, supply chains that include active ash management
preprocessing unit operations can be purchased. Prior to preprocessing, certain resources can be
blended to reduce the overall percentage of ash and moisture, thereby reducing the costs and
severity needed to reduce the ash to in-feed specifications. Table 3 shows an example
formulation.

27
Table 3. Costs and specifications for woody feedstocks and blends (INL analysis).
Feedstock
Reactor Throat
Feedstock Cost
($/dry T)2
Formulation
Fraction (%)
% Ash Delivered
to Throat of
Conversion Reactor
Pulp 99.49 45 0.5
Wood Residues1 67.51 32 1
Switchgrass 66.68 3 4.0
C&D Wastes 58.12 20 1.0
Formulation
Totals 80.00 100 <1
1 residues do not include costs for harvest and collection; they are moved to landing while attached to the merchantable portion of
the tree (for example, timber or pulpwood)
2 includes ash mitigation
The C&D wastes are incorporated because of its low access fee cost and assumed low ash
content. C&D wastes were limited in quantity due to the uncertainty of available supplies.
Current research shows significant quantities of C&D, but there are uncertainties with EPA
qualifying C&D waste for credit for RIN’s and competition from other markets. This is only an
example; the actual blends will be regionally based designs that take advantage of local
feedstocks and their biomass characteristics. Additionally the ability to blend feedstocks to a
specification has the potential to reduce some of the risks associated with the seasonality of
feedstocks.
28
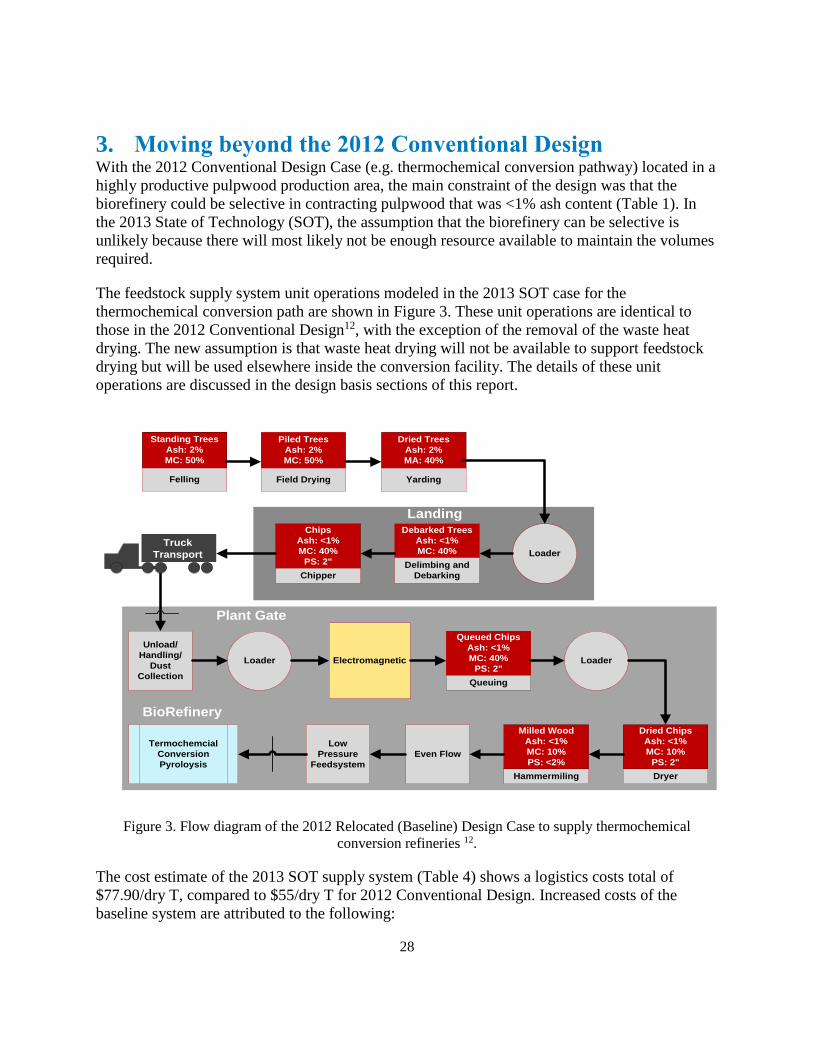
3. Moving beyond the 2012 Conventional Design With the 2012 Conventional Design Case (e.g. thermochemical conversion pathway) located in a
highly productive pulpwood production area, the main constraint of the design was that the
biorefinery could be selective in contracting pulpwood that was <1% ash content (Table 1). In
the 2013 State of Technology (SOT), the assumption that the biorefinery can be selective is
unlikely because there will most likely not be enough resource available to maintain the volumes
required.
The feedstock supply system unit operations modeled in the 2013 SOT case for the
thermochemical conversion path are shown in Figure 3. These unit operations are identical to
those in the 2012 Conventional Design12, with the exception of the removal of the waste heat
drying. The new assumption is that waste heat drying will not be available to support feedstock
drying but will be used elsewhere inside the conversion facility. The details of these unit
operations are discussed in the design basis sections of this report.
Piled Trees
Ash: 2%
MC: 50%
Field Drying
Dried Trees
Ash: 2%
MA: 40%
Yarding
Standing Trees
Ash: 2%
MC: 50%
Felling
Debarked Trees
Ash: <1%
MC: 40%
Delimbing and
Debarking
Chips
Ash: <1%
MC: 40%
PS: 2"
Chipper
Loader
Unload/
Handling/
Dust
Collection
Electromagnetic
Queued Chips
Ash: <1%
MC: 40%
PS: 2"
Queuing
Loader
Dried Chips
Ash: <1%
MC: 10%
PS: 2"
Dryer
Milled Wood
Ash: <1%
MC: 10%
PS: <2%
Hammermiling
Even Flow
Low
Pressure
Feedsystem
Termochemcial
Conversion
Pyroloysis
Loader
Plant Gate
BioRefinery
Truck
Transport
Landing
Figure 3. Flow diagram of the 2012 Relocated (Baseline) Design Case to supply thermochemical
conversion refineries 12.
The cost estimate of the 2013 SOT supply system (Table 4) shows a logistics costs total of
$77.90/dry T, compared to $55/dry T for 2012 Conventional Design. Increased costs of the
baseline system are attributed to the following:
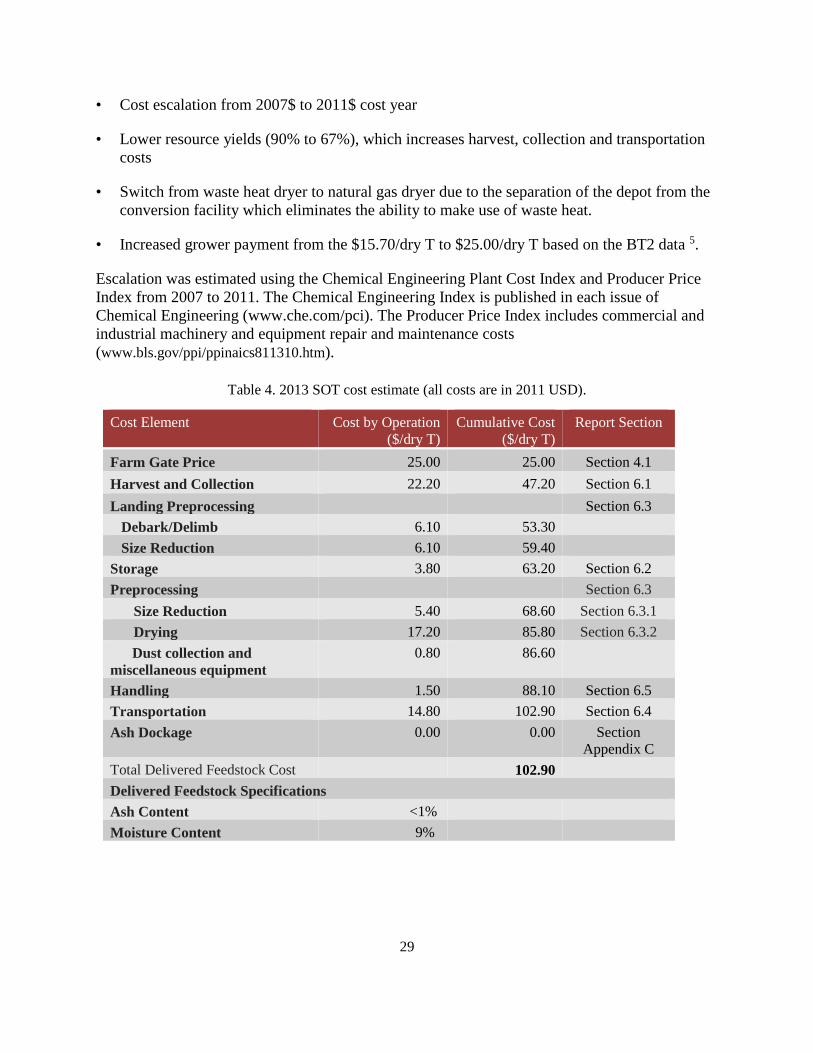
29
• Cost escalation from 2007$ to 2011$ cost year
• Lower resource yields (90% to 67%), which increases harvest, collection and transportation
costs
• Switch from waste heat dryer to natural gas dryer due to the separation of the depot from the
conversion facility which eliminates the ability to make use of waste heat.
• Increased grower payment from the $15.70/dry T to $25.00/dry T based on the BT2 data 5.
Escalation was estimated using the Chemical Engineering Plant Cost Index and Producer Price
Index from 2007 to 2011. The Chemical Engineering Index is published in each issue of
Chemical Engineering (www.che.com/pci). The Producer Price Index includes commercial and
industrial machinery and equipment repair and maintenance costs
(www.bls.gov/ppi/ppinaics811310.htm).
Table 4. 2013 SOT cost estimate (all costs are in 2011 USD).
Cost Element Cost by Operation
($/dry T)
Cumulative Cost
($/dry T)
Report Section
Farm Gate Price 25.00 25.00 Section 4.1
Harvest and Collection 22.20 47.20 Section 6.1
Landing Preprocessing Section 6.3
Debark/Delimb 6.10 53.30
Size Reduction 6.10 59.40
Storage 3.80 63.20 Section 6.2
Preprocessing Section 6.3
Size Reduction 5.40 68.60 Section 6.3.1
Drying 17.20 85.80 Section 6.3.2
Dust collection and
miscellaneous equipment
0.80 86.60
Handling 1.50 88.10 Section 6.5
Transportation 14.80 102.90 Section 6.4
Ash Dockage 0.00 0.00 Section
Appendix C
Total Delivered Feedstock Cost 102.90
Delivered Feedstock Specifications
Ash Content <1%
Moisture Content 9%

30
4. Approach of the 2017 Design Case The 2013 SOT Design presented above illustrates the barriers of the conventional biomass
supply system that will limit expansion of a national biorefinery industry. This section will
address three specific challenges for reducing the current estimated feedstock costs to achieve
the $80/dry T cost target. These challenges include price of biomass resources (grower payment),
feedstock quality, and the ability of the logistics system to handle increased volumes at reduced
costs. First, cumulative grower payment (access costs) must be reduced. This does not suggest
that the per producer payment will decrease; rather it will be shown that the grower payments
can be reduced by selecting multiple feedstocks, thereby decreasing the total amount of any
single feedstock, thus working lower on the supply curve and reducing the access cost. Second,
the conventional biomass supply system has no mechanisms for preserving or addressing
feedstock quality. Biorefinery conversion efficiency is tightly coupled to the quality of the
feedstock 6. There are operations that can be included in the feedstock logistic supply system that
address these quality issues and deliver a feedstock that meets the in-feed quality specifications.
Third, technological improvements in all supply chain unit operations must occur to reduce
logistics costs and handle larger more dispersed volumes of biomass material. This section
discusses the general approach of the 2017 Design Case for addressing these challenges.
Addressing the Farm Gate Price Challenge The Billion Ton Update (BT2)5, which is the definitive source of national biomass supply/cost
data, represents biomass access costs in terms of “farm gate” price, which includes the cost of
production, harvest, collection and chipping at the landing, compensation for soil nutrient
removal, and grower profit. However, feedstock logistics designs also consider harvest,
collection, and chipping operations within logistics costs, therefore it is necessary to subtract
harvest, collection, and landing preprocessing costs from the reported farm gate price and refer to
difference as the grower payment. The grower payment would then consist of feedstock
production, soil nutrient replacement, and profit margin.
Neither grower payment nor farm gate prices are constant; rather they are functions of the
marginal cost of procuring the next additional quantity of biomass from that area. BT2 scenarios
provide projected farm gate prices for each county in the United States for all available
feedstocks for the years 2012 through 2030. When examines the BT2 results, very little biomass
is accessible until farm gate prices reach $40/dry T. This means that producers are not willing to
allow access to their biomass until they are offered at least $40/dry T farm gate price.
Figure 4 below shows the step-wise supply curve for marginal and average feedstock costs
versus supply quantities accessible from the BT2 scenario. These cost curves are used to
determine the quantity of biomass that can be accessed at the different farm gate prices. The BT2
data is generated in increments of $10/T cost targets, hence the step functions. It is important to
note the difference in marginal versus average costs. The width of the boxes displays the
increased amount in total tons that shows up for each type of biomass as the price increases,
these incremental costs represent the marginal costs. Looking at Figure 4, at $50/dry T around 40
million dry T of woody residues could be procured and a small amount of dedicated feedstocks.
At $60/dry T, an additional 160 million dry T of stover could be procured and an additional 15

31
million dry T of dedicated feedstocks. The average price is the weighted average of the amount
of biomass at $50/dry T with the amount of biomass at $60/dry T. Note that the biorefinery
would not pay the marginal cost of feedstock but the average cost.
Figure 4. Marginal and average farm gate costs versus supply quantities derived from BT2 data for the
U.S. predicted out to 2022 1.
Figure 5 below shows a national set of farm gate prices for the U.S. At $55/dry T over 100 MM
dry T of woody biomass can be secured, but only about 15 MM dry T of poplar. If 100 MM dry
T of biomass was required to supply a biofuel industry, one path would be to pay an average of
$55/dry T for 100 MM dry T of woody biomass. A blended strategy (i.e. blended feedstocks)
could select 85 MM dry T of woody biomass at $50/dry T and supplement the rest with a
combination of wheatstraw, sweet sorghum, and poplar at $50/dry T for an average price $50/dry
T. This would decrease the overall cost of biomass by $5/dry T. What still needs to be
determined is if blended feedstocks will behave like a single feedstock in a conversion facility.
The testing of blends is currently underway for several conversion technologies to determine
feedstock behavior from front-end through finished blendstock.
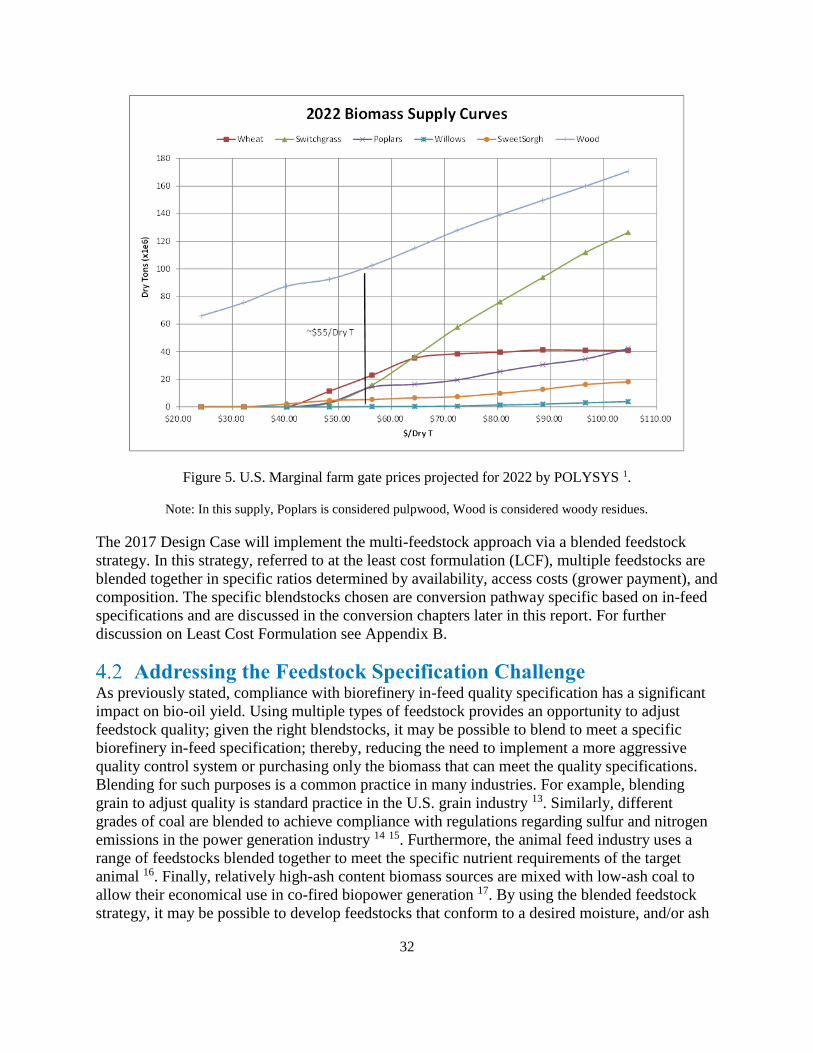
32
Figure 5. U.S. Marginal farm gate prices projected for 2022 by POLYSYS 1.
Note: In this supply, Poplars is considered pulpwood, Wood is considered woody residues.
The 2017 Design Case will implement the multi-feedstock approach via a blended feedstock
strategy. In this strategy, referred to at the least cost formulation (LCF), multiple feedstocks are
blended together in specific ratios determined by availability, access costs (grower payment), and
composition. The specific blendstocks chosen are conversion pathway specific based on in-feed
specifications and are discussed in the conversion chapters later in this report. For further
discussion on Least Cost Formulation see Appendix B.
Addressing the Feedstock Specification Challenge As previously stated, compliance with biorefinery in-feed quality specification has a significant
impact on bio-oil yield. Using multiple types of feedstock provides an opportunity to adjust
feedstock quality; given the right blendstocks, it may be possible to blend to meet a specific
biorefinery in-feed specification; thereby, reducing the need to implement a more aggressive
quality control system or purchasing only the biomass that can meet the quality specifications.
Blending for such purposes is a common practice in many industries. For example, blending
grain to adjust quality is standard practice in the U.S. grain industry 13. Similarly, different
grades of coal are blended to achieve compliance with regulations regarding sulfur and nitrogen
emissions in the power generation industry 14 15. Furthermore, the animal feed industry uses a
range of feedstocks blended together to meet the specific nutrient requirements of the target
animal 16. Finally, relatively high-ash content biomass sources are mixed with low-ash coal to
allow their economical use in co-fired biopower generation 17. By using the blended feedstock
strategy, it may be possible to develop feedstocks that conform to a desired moisture, and/or ash
33
specification without using expensive preprocessing technologies. More research is required to
understand the behavior blended feedstocks will have on overall fuel conversion. Even though it
may be possible to blend to specification as measured by composition and physical properties, an
additional challenge of the blended feedstock approach is to have the blended feedstock actually
perform as well as or better than a singular feedstock in the conversion process. Better
understanding of the interactions of blendstocks in the conversion process will require additional
research and development focus to better inform blended feedstock development.
Addressing the Logistics Challenge Moving beyond high yield areas reduces the quantity of feedstock that can be passively
eliminated if not compliant with feedstock specifications. In other words, in Iowa, with high
yields, only dry, low ash material can be secured while leaving the remainder of the residues for
other uses. In Kansas or other lower yield areas, there may not be enough extra biomass to allow
such down selection of material. The high logistics costs of the baseline case, compared to the
2012 Conventional Design Case, are mostly attributed to resource dispersion and moisture
mitigation.
Additionally, the elimination of waste heat in the baseline case more realistically reflects the
costs incurred by the system, since it is unreasonable to assume that the conversion facility and
the depot will be co-located where they can take advantage of the waste heat. Therefore,
improvements in supply systems are needed to reduce the sensitivity of grinding and
transportation to biomass moisture and ash content. Additional quality specifications currently
not addressed in these designs such as, high heating value (HHV) and low heating value (LHV),
could also become important in future design cases. Solutions to these barriers could include
fractional milling and high moisture densification with a cross flow pellet drying system. Finally,
as multiple feedstocks are incorporated into the system, logistic solutions also are needed to
reduce the cost that would occur due to the complexity of handling multiple types of biomass.
The blended feedstock strategy, which relies on the availability of multiple feedstock sources
within an economical supply radius, adds an additional logistics challenge to the 2017 Design
Case. The complex nature of this approach could bring in more business management overhead
to simultaneously manage multiple feedstocks. However, this approach could increase the total
amount of biomass in an area that would traditionally not have enough of a single resource to
economically supply a biorefinery. Overcoming the logistics challenge of a blended feedstock
design will require system-level solutions. The 2017 Design Case explores two approaches: (1)
an agronomic solution based on integrated landscape management, and (2) a logistics solution
based on biomass depots.
Compared to traditional cropping systems that manage productivity and environmental
sustainability on an overall average field scale, integrated landscape management considers
subfield-scale variability to substitute low productive crops with annual or perennial biomass
crops (herbaceous or wood) for improved environmental and productive performance. For
example, with the integrated landscape management approach, perennial energy crops may be
planted in a pulpwood stand to improve biodiversity or protect sensitive waterways prone to
erosion. Similarly, areas of a field that typically under-produce and result in lost revenue for the
producer may be planted in a biomass crop (such as switchgrass) that is better suited to the

34
productive potential of the soil. This approach would result in a landscape mosaic where a stand
is interspersed with areas of switchgrass and willow. Successful integrated landscape
management will produce both economic and environmental benefits to growers, thereby
improving the biomass supply-demand dynamic and making more biomass available at lower
access costs. Further, such a system alleviates the logistics challenge of dispersed resources by
co-locating crops and making more biomass available within smaller supply radii than even the
single feedstock scenario.
Biomass depots also may provide logistics solutions for sourcing multiple biomass resources to a
biorefinery, whether these resources are largely dispersed or co-located. In this scenario, regional
biomass depots may emerge as business elements to lessen the complexity of a blended
feedstock supply system. The economic advantage of a depot, in this scenario, may be its
specialization to supply and preprocess a single blendstock. This specialization eliminates the
need for a single entity to make the capital investment and establish the expertise to contract,
preprocess, and supply a diversity of resources that may have different preprocessing
requirements.

35
5. 2017 Feedstock Supply System Design The least-cost formulation (blending) approach to resource selection was introduced in Section
4.1as a solution to the Farm Gate Price challenge (i.e., to reduce feedstock access costs). This
section builds on the 2013 SOT thermochemical conversion scenario located in eastern South
Carolina to illustrate the least-cost formulation approach to resource selection for the 2017
Design Case. Note: A similar approach is done for the biochemical conversion pathways based
on herbaceous residues and energy crops. This approach challenges the single-feedstock
paradigm by allowing available resources to compete based on cost, quantity, and quality
considerations. It is also shown that such an approach can contribute significant cost reductions
to biomass feedstock supply.
2013 State of Technology Most cellulosic biomass supply systems are designed around a single feedstock, typically clean
woodchips for thermochemical conversion processes like fast pyrolysis. Note that these supply
curves represent the projected cost (i.e., farm gate) and quantity available in 2017 based on data
from the BT2 analysis. Figure 7 shows the estimated supply curve for pulpwood based on the
stumpage price the buyer is willing to pay. Note that if the biofuel industry starts to require large
amounts of pulpwood then the price of pulpwood will respond according to an increased
demand. The price of pulpwood will increase substantially for large quantities to move into the
system. The 2013 SOT Design was developed around the concept of a single biorefinery and the
supply system was designed accordingly. The 2017 Design Case is designed around supplying
biomass to a developing industry and not for a single biorefinery.
The woody biomass scenarios/information in the BT2 database was developed using a different
set of algorithms and models than the herbaceous biomass. The usage of the data needs to be
adjusted accordingly. The woody scenarios were generated from estimates from the U.S. Forest
Service Forest Inventory Model and represents estimates of large areas and not county level
estimates as is the case for herbaceous biomass. Due to this difference, for estimates of grower
payments for small demands (<1 Million dry tons), it is assumed that the current market price
would be more appropriate to reflect local supply costs. Figure 6 shows the historical stumpage
pulpwood prices for the southern U.S. The prices reflect approximately 57 million tons of
pulpwood purchased each year. The stumpage price is for green biomass (as opposed to dry). If
you assume around 50% moisture for pulpwood, the grower payment would be double the
stumpage price and average around $20/dry T. A single biorefinery would require less than a
million tons of biomass each year and hence would not significantly influence the stumpage
price currently being paid. A single biorefinery could expect to pay around $20-$25/dry T when
competition for the biomass is low. For the 2017 Design Case we assumed the high end for a
single refinery of $25/dry T, assuming that they will be competing for the biomass and thus
driving the prices towards the high end.

36
Figure 6. Historical pulpwood stumpage prices for the southern U.S. in $/dry Ton
(http://www.timbermart-south.com/prices.html).
There is a significant difference in the requested amount of biomass that will be required to fuel
an industry versus a single biorefinery. Oak Ridge National Laboratory in their Billion Ton
Update 5 estimated that upwards of 35 million dry T of woody biomass will be required for the
thermochemical biofuel conversion industry as it matures toward the 2022 Design Cases. Based
on Figure 7, the farm gate price to access 35 million tons would be around $50/dry T. It should
be noted that this is based on 2022 estimates, there may in fact not be a demand as high as 35
million tons, but it is important to analyze the system based on projected industry demand and
identify potential barriers that will surface when analyzing a single biorefinery supply system.
What is important is to identify that as the biofuel industry grows it will begin to require large
volumes of biomass that will in fact influence the supply dynamics and increase the cost to
access the biomass. If the industry does grow significantly in the future then the farm gate price
will increase and could be barrier that needs to be addressed.
Figure 7. National estimated pulpwood stumpage prices 1.
Resource Selection Cost Estimation In order to represent the cost impact of the least-cost formulation approach for resource
selection, it is necessary to discuss resource costs in terms of access cost, often referred to as

37
grower payment. However, in order to avoid the misperception that with least-cost formulation
in the 2017 Design Case the reduction of access cost means the growers get less, we use the term
access cost.
Access costs are calculated from the grower payment cost curves shown in Figure 6, which are
derived from historical prices. The 2017 Design Case basis discussion presented above provided
the least-cost formulation approach for reducing access costs by accessing multiple feedstocks.
With this approach, reduced quantities of each blendstock allows us to stay lower on the supply
curve than if we had to supply the entire refinery with any single biomass feedstock. The impact
of this approach is shown in Table 5. The 2013 State of Technology assumes a 100% supply of
pulpwood of 909,100 dry T at an estimated $60/dry T farm gate or a $25/dry T access cost. In
comparison, the 2017 Design Case blend of 45% pulpwood, 32% wood residues, 20% C & D
waste, and 3% switchgrass results in a weighted average feedstock cost that is nearly 15% lower
than the access cost of pulpwood alone.
Table 5. Resource access cost estimate 5 and INL Material Solid Waste (MSW Data)
2013 SOT 2017 Target
Access Cost
(2011 $/dry T)
Tons Access Cost
(2011 $/dry T)
Tons
Pulpwood 25.00 909,100* 25.00 425,700*
Wood Residues NA NA 26.35 412,800**
Switchgrass NA NA 19.67 25,800
C&D NA NA 8.15 172,000
Totals 25.00 NA 21.90 1,036,300
*assumes 10% loss of material to debark/delimb 18
**assumes 40% loss of material to clean up residues 19
38
6. Feedstock Supply System Unit Operations A biomass feedstock supply system also called supply chain or logistics system is a complex
organization of operations necessary to transform biomass into usable feedstock that can feed
into a conversion process. The feedstock supply system encompasses all operations necessary to
format and move biomass from standing at the location of production (field or forest) to the
conversion reactor infeed system at the biorefinery 20. The logistics of biomass harvest and
collection, storage, preprocessing, handling, and transportation represent a large challenge to this
industry. In this section we will discuss the different components (unit operations) of a feedstock
supply system.
Harvest and Collection Operations Harvest and collection operations encompass all activities required to cut and remove feedstock
from the place of production to field side or landing. These operations also condition material for
downstream use and can perform preliminary quality mitigation (moisture content, ash content
etc.). The specific method of harvest is highly dependent on feedstock type. For example
herbaceous feedstock (i.e., corn stover, switchgrass, wheatstraw, etc.) harvest systems could
include a combine, rake, baler, windrower, and or forage chopper while a woody feedstock (i.e.,
thinnings, slash, pulpwood, etc.) harvest system could include a feller buncher, skidder, and
chipper. Due to growing seasons, variations biomass harvests can occur due to environmental
and crop conditions.
Collection involves moving harvested biomass to a centralized location, such as a field side stack
or a landing deck. Potential collection equipment includes roadsiders, loaders, skidders, and
cable systems. Like harvest, collection also only occurs during a specified window where
optimal conditions can be achieved to maximize biomass quality and reduce material loss. For a
herbaceous supply system, baling and collection typically occurs after some field drying. For a
woody system collection typically happens at the time of harvest. However, for a woody system,
there may be some cost advantages to delay collection until harvest is complete to improve
collection efficiency and take advantage of field drying while an herbaceous system there may be
advantages for using a single pass supply system where the biomass is baled as it is harvested.
6.1.1 State of Technology
Conventional harvest and collection employ multi-pass systems to process biomass. Existing
multi pass collection systems for agricultural residues typically involve cutting the feedstock,
raking the material into a windrow, and baling the windrowed material. For corn stover, cutting
may or may not be done at the time of corn harvest, which impacts material quality and removal
yields. In multi-pass operations, raking is performed to facilitate baling and improve yield. No
consideration is given to the impact of raking on soil entrainment in the final baled feedstock. In
single-pass corn stover baling, the stover is fed directly into a baler towed by the combine. This
harvesting method eliminates soil contact and results in lower stover ash content and higher
removal yields. However, it also eliminates field drying, which results in a higher initial bale
moisture content. This elevated moisture presents a challenge to feedstock stability and increases
dry matter loss in storage.
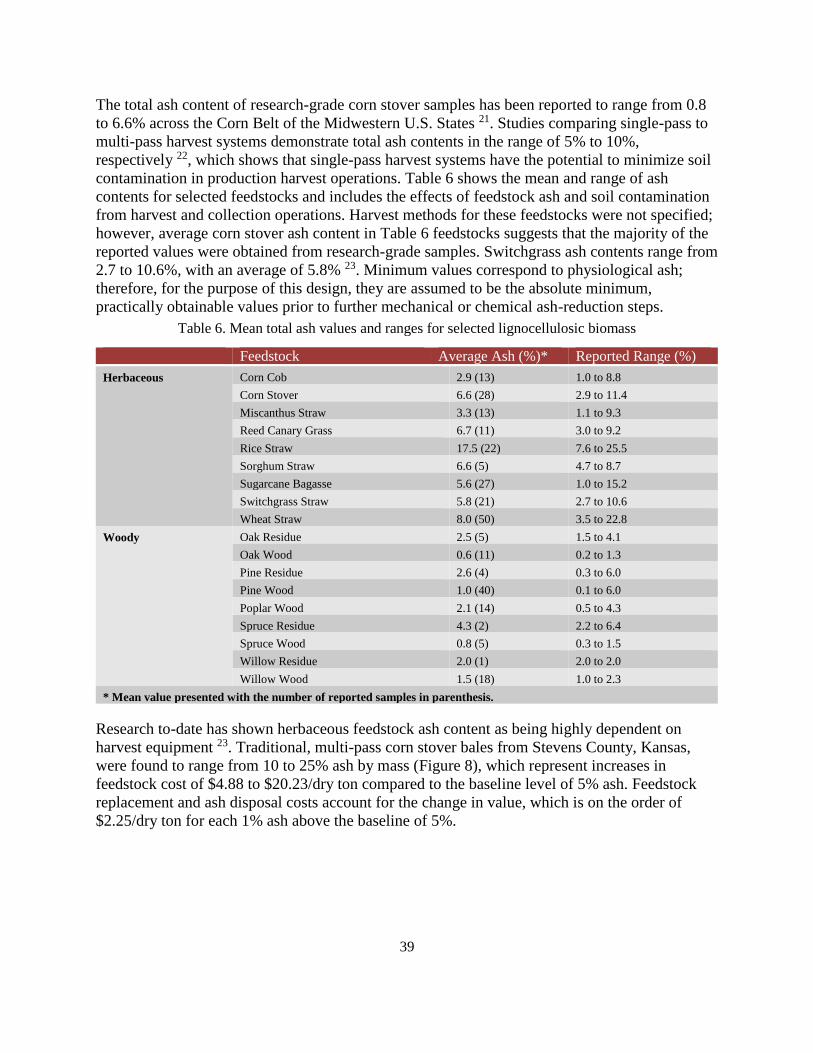
39
The total ash content of research-grade corn stover samples has been reported to range from 0.8
to 6.6% across the Corn Belt of the Midwestern U.S. States 21. Studies comparing single-pass to
multi-pass harvest systems demonstrate total ash contents in the range of 5% to 10%,
respectively 22, which shows that single-pass harvest systems have the potential to minimize soil
contamination in production harvest operations. Table 6 shows the mean and range of ash
contents for selected feedstocks and includes the effects of feedstock ash and soil contamination
from harvest and collection operations. Harvest methods for these feedstocks were not specified;
however, average corn stover ash content in Table 6 feedstocks suggests that the majority of the
reported values were obtained from research-grade samples. Switchgrass ash contents range from
2.7 to 10.6%, with an average of 5.8% 23. Minimum values correspond to physiological ash;
therefore, for the purpose of this design, they are assumed to be the absolute minimum,
practically obtainable values prior to further mechanical or chemical ash-reduction steps.
Table 6. Mean total ash values and ranges for selected lignocellulosic biomass
Feedstock Average Ash (%)* Reported Range (%)
Herbaceous Corn Cob 2.9 (13) 1.0 to 8.8
Corn Stover 6.6 (28) 2.9 to 11.4
Miscanthus Straw 3.3 (13) 1.1 to 9.3
Reed Canary Grass 6.7 (11) 3.0 to 9.2
Rice Straw 17.5 (22) 7.6 to 25.5
Sorghum Straw 6.6 (5) 4.7 to 8.7
Sugarcane Bagasse 5.6 (27) 1.0 to 15.2
Switchgrass Straw 5.8 (21) 2.7 to 10.6
Wheat Straw 8.0 (50) 3.5 to 22.8
Woody Oak Residue 2.5 (5) 1.5 to 4.1
Oak Wood 0.6 (11) 0.2 to 1.3
Pine Residue 2.6 (4) 0.3 to 6.0
Pine Wood 1.0 (40) 0.1 to 6.0
Poplar Wood 2.1 (14) 0.5 to 4.3
Spruce Residue 4.3 (2) 2.2 to 6.4
Spruce Wood 0.8 (5) 0.3 to 1.5
Willow Residue 2.0 (1) 2.0 to 2.0
Willow Wood 1.5 (18) 1.0 to 2.3
* Mean value presented with the number of reported samples in parenthesis.
Research to-date has shown herbaceous feedstock ash content as being highly dependent on
harvest equipment 23. Traditional, multi-pass corn stover bales from Stevens County, Kansas,
were found to range from 10 to 25% ash by mass (Figure 8), which represent increases in
feedstock cost of $4.88 to $20.23/dry ton compared to the baseline level of 5% ash. Feedstock
replacement and ash disposal costs account for the change in value, which is on the order of
$2.25/dry ton for each 1% ash above the baseline of 5%.
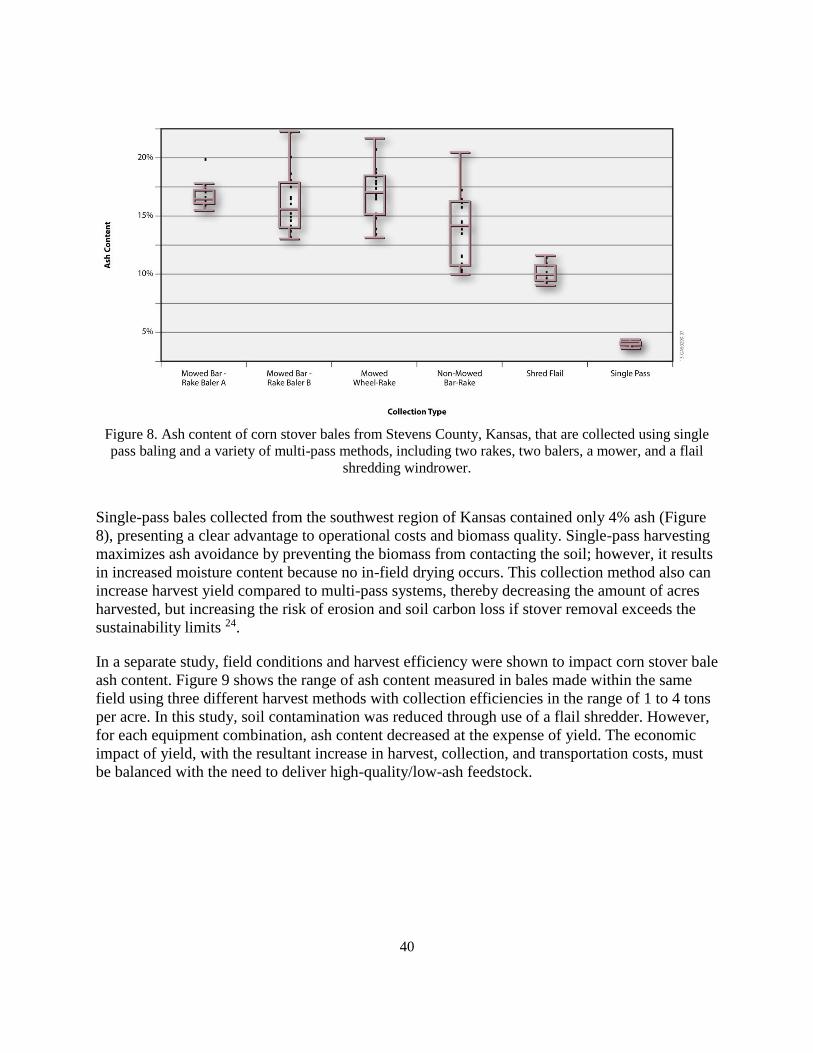
40
Figure 8. Ash content of corn stover bales from Stevens County, Kansas, that are collected using single
pass baling and a variety of multi-pass methods, including two rakes, two balers, a mower, and a flail
shredding windrower.
Single-pass bales collected from the southwest region of Kansas contained only 4% ash (Figure
8), presenting a clear advantage to operational costs and biomass quality. Single-pass harvesting
maximizes ash avoidance by preventing the biomass from contacting the soil; however, it results
in increased moisture content because no in-field drying occurs. This collection method also can
increase harvest yield compared to multi-pass systems, thereby decreasing the amount of acres
harvested, but increasing the risk of erosion and soil carbon loss if stover removal exceeds the
sustainability limits 24.
In a separate study, field conditions and harvest efficiency were shown to impact corn stover bale
ash content. Figure 9 shows the range of ash content measured in bales made within the same
field using three different harvest methods with collection efficiencies in the range of 1 to 4 tons
per acre. In this study, soil contamination was reduced through use of a flail shredder. However,
for each equipment combination, ash content decreased at the expense of yield. The economic
impact of yield, with the resultant increase in harvest, collection, and transportation costs, must
be balanced with the need to deliver high-quality/low-ash feedstock.
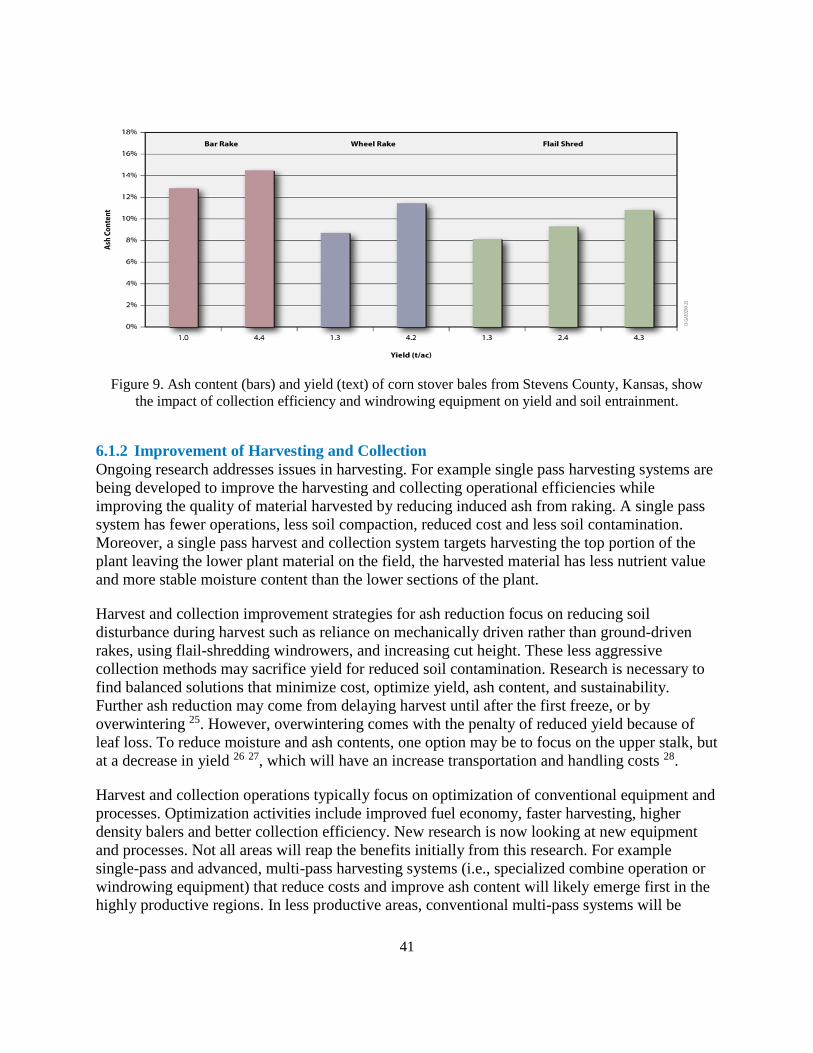
41
Figure 9. Ash content (bars) and yield (text) of corn stover bales from Stevens County, Kansas, show
the impact of collection efficiency and windrowing equipment on yield and soil entrainment.
6.1.2 Improvement of Harvesting and Collection
Ongoing research addresses issues in harvesting. For example single pass harvesting systems are
being developed to improve the harvesting and collecting operational efficiencies while
improving the quality of material harvested by reducing induced ash from raking. A single pass
system has fewer operations, less soil compaction, reduced cost and less soil contamination.
Moreover, a single pass harvest and collection system targets harvesting the top portion of the
plant leaving the lower plant material on the field, the harvested material has less nutrient value
and more stable moisture content than the lower sections of the plant.
Harvest and collection improvement strategies for ash reduction focus on reducing soil
disturbance during harvest such as reliance on mechanically driven rather than ground-driven
rakes, using flail-shredding windrowers, and increasing cut height. These less aggressive
collection methods may sacrifice yield for reduced soil contamination. Research is necessary to
find balanced solutions that minimize cost, optimize yield, ash content, and sustainability.
Further ash reduction may come from delaying harvest until after the first freeze, or by
overwintering 25. However, overwintering comes with the penalty of reduced yield because of
leaf loss. To reduce moisture and ash contents, one option may be to focus on the upper stalk, but
at a decrease in yield 26 27, which will have an increase transportation and handling costs 28.
Harvest and collection operations typically focus on optimization of conventional equipment and
processes. Optimization activities include improved fuel economy, faster harvesting, higher
density balers and better collection efficiency. New research is now looking at new equipment
and processes. Not all areas will reap the benefits initially from this research. For example
single-pass and advanced, multi-pass harvesting systems (i.e., specialized combine operation or
windrowing equipment) that reduce costs and improve ash content will likely emerge first in the
highly productive regions. In less productive areas, conventional multi-pass systems will be

42
operated with greater focus on reducing feedstock moisture content and improving storage
stability to avoid ash enrichment throughout storage 8.
Storage Storage involves stockpiling material to either provide an adequate lead time to more expensive
processes downstream, accumulate appropriate quantities making movement more economical,
or minimize the footprint and storage infrastructure at the refinery. Storage is mainly comprised
of infrastructure, which can include cement, gravel or asphalt pads, silos, storage bins, and tarps.
Additionally, storage allows feedstock preservation to enable year-round biorefinery operation
from seasonally available feedstocks. Harvesting of herbaceous feedstocks, specifically
agricultural residues such as corn stover and cereal straws, occurs within limited operational
windows that may span weeks or months, yet ideally, conversion operations occur year-round.
The goal of storage is to preserve the valuable qualities of the feedstock until they can be fully
utilized within the conversion process.
Biomass is subject to degradation by fungi, yeast, and bacteria that alter the feedstock’s
composition through selective removal of valuable components (such as structural sugars).
Consumption of these components results in dry matter loss and enrichment of other components
(such as lignin and ash) within the remaining feedstock. These other components have low or no
value within a sugar-based conversion process. Existing storage practices for feed and forage
rely on drying (e.g., baled forage) or oxygen limitation (e.g., ensiling) to impart long-term
stability. However, these operations have the potential to exceed the allowable storage and
handling costs for biomass feedstocks. A more practical solution to storage losses is to control
biological degradation and to maintain acceptable feedstock characteristics such as;
specifications of component concentration or product yield. The relationship between feedstock
properties, storage conditions, and dry matter loss forms the basis of a product shelf life, which
allows perishable feedstocks to be used while they still retain their value.
Appropriate storage sites provide adequate drainage away from the stack to prevent the
accumulation of moisture around the stack, provide year-round access, and preferably allow the
stack to be positioned in a north-south orientation. Stacks are constructed with a bale wagon or
loader and covered with high-quality hay tarps which are periodically tightened to prolong tarp
life.
6.2.1 State of Technology Herbaceous Residues/Energy Crops
The current industry standard for assessing storage performance entirely depends on the measure
of dry matter loss. While losses do occur from physical handling, such sources of shrinkage are
minimized by proper practice and are not considered a major factor for improvement. On the
other hand, dry matter loss from biological degradation is highly variable, difficult to measure,
and difficult to control. The major factors that drive biological dry matter loss are moisture
content of the material entering storage and the habitability of the biomass for microbial
organisms, which includes factors such as oxygen availability, pH, and inhibitory substances.
Conventional aerobic storage of biomass does little to limit any of these factors, because
moisture contents often can be well within the range suitable for microbial growth (i.e., greater
43
than 20%) and raw biomass in a baled format presents a near-ideal environment for microbial
growth and resulting degradation (e.g., ample oxygen and digestible substrate). Laboratory-scale
storage experiments conducted at INL have shown significant contribution of moisture content to
dry matter loss of aerobically stored corn stover, with losses ranging from as low as 6% to as
high as almost 40% as moisture increases from 20 to 55%, respectively (Figure 10). Although
the extent of dry matter loss in these experiments matches the field-run storage trials, the loss
rates are increased by a factor of approximately three because of the temperature and moisture
control in the laboratory system.
Figure 10. Dry matter loss of corn stover in laboratory storage conditions at fixed moisture contents 32.
Bale moisture tends to redistribute and even escape the stack during storage, ultimately
contributing to significant moisture reduction throughout many of the bales within the stack
(Figure 10). However, the end state of a stack of bales is no guarantee that its component bales
did not suffer significant dry matter loss in storage or exit in a homogeneous state. The stack
shown in Figure 11was placed on a gravel pad, covered with a tarp, and ultimately dried to from
30 to 19% moisture; yet it still suffered 15% dry matter loss and portions of the stack remain at
high moisture. An explanation for this is supported by the data in Figure 10, which indicate that
the rate of dry matter loss is highest early in storage and decreases with time and stabilizing late
in storage. Therefore, unless drying occurs rather rapidly (unlike the stack in Figure 11),
moisture loss during storage is not likely to reduce storage losses significantly. The ultimate
conclusion is that while field drying of stacked bales does occur, the rate at which drying occurs,
the extent to which material may dry, and the extent of degradation that occurred along the way
is largely uncontrollable using current practices.
In addition to management of moisture and the associated dry matter loss, design considerations
for biomass storage systems must include the quality of the final material. Two main
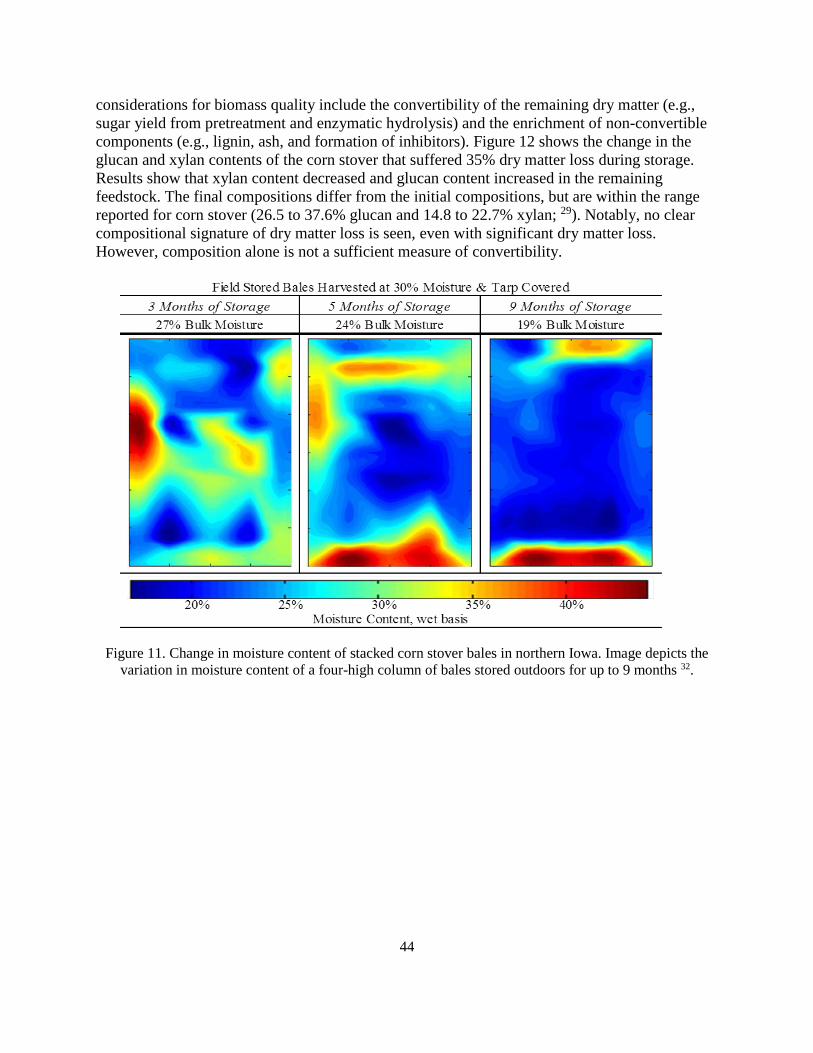
44
considerations for biomass quality include the convertibility of the remaining dry matter (e.g.,
sugar yield from pretreatment and enzymatic hydrolysis) and the enrichment of non-convertible
components (e.g., lignin, ash, and formation of inhibitors). Figure 12 shows the change in the
glucan and xylan contents of the corn stover that suffered 35% dry matter loss during storage.
Results show that xylan content decreased and glucan content increased in the remaining
feedstock. The final compositions differ from the initial compositions, but are within the range
reported for corn stover (26.5 to 37.6% glucan and 14.8 to 22.7% xylan; 29). Notably, no clear
compositional signature of dry matter loss is seen, even with significant dry matter loss.
However, composition alone is not a sufficient measure of convertibility.
Figure 11. Change in moisture content of stacked corn stover bales in northern Iowa. Image depicts the
variation in moisture content of a four-high column of bales stored outdoors for up to 9 months 32.

45
Figure 12. Change in glucan and xylan over time as corn stover is stored in laboratory reactors 32.
Preliminary results suggest that losses that occur in storage result in a decreased sugar yield
following pretreatment, despite this minor composition change. Storage-induced losses may
occur as a result of resistance to pretreatment, over-pretreatment (conversion to furfuraldehyde
and HMF in a dilute-acid pretreatment), and/or reduced enzymatic hydrolysis. Decreased sugar
yields in these processes may result from the selective removal of more easily converted forms
of xylan and glucan during dry matter loss. Over-pretreatment may result from the partial
hydrolysis of structural sugars and formation of lower molecular weight polymers and oligomers,
which are susceptible to oxidation during pretreatment. In each instance, replacement feedstock
is necessary to offset the loss of available sugar in order to maintain production. Ongoing
research is evaluating the impact of dry matter loss relative to the intermittent and final product
yields of the remaining dry matter. Research in Fiscal Year 2015 will quantify the impacts of
storage on the xylose yields during pretreatment and the glucose yields during enzymatic
hydrolysis. This assumption of decreased convertibility due to degradation in storage has been
applied to the 2013 SOT and is explained in more detail in the next section.
6.2.2 State of Technology Woody Biomass
Unlike crop residues, woody feedstocks may be harvested as needed in most southern US
regions and therefore have less need for long-term storage. However, in-field storage may be
used to reduce the moisture content of whole tree or delimbed piles 30 and stacks 31 depending
upon pile configuration and local climate. The 2013 Design Case assumes 10% reduction in
moisture content in pulpwood from 50% to 40% as a result of field drying prior to preprocessing
at the landing. This is a very conservative assumption and therefore the 2017 Design Case
assumes a 20% reduction in moisture from 50% to 30% as a result of field drying prior to
landing preprocessing. Although not used in the 2013 Design Case baseline, wood residues
(limbs and tops) are assumed to have a moisture content of 40% both before and 30% after
storage.

46
Current SOT and 2017 Design Case rely upon available whitewood chips from pulpwood and
residues (tops and limbs) preprocessed at the landing. Dry matter losses during in-field drying of
residues is expected to be low; measured losses under laboratory controlled conditions at
temperatures ranging from 15° to 35° C ranged from 1% to 2% over one month 32. Storage of
logging residues in windrows and bundles was reported33 to result in a <1% dry matter loss per
month in storage; most losses were attributed to the loss of foliage. While the mechanical loss of
small tops and limbs during chain flail debarking is reported to be 15% by mass 34, all costs
incurred to get the material into the debarked chip format will be attributed to the mass of the
chipped biomass. In this design, the flail and trommel remove material that is out of specification
for ash content and is thus not a part of the marketable portion of the biomass.
Following landing preprocessing the current design case relies upon limited on-site chip storage
sufficient to supply three days of feedstock. Chip storage piles present favorable conditions for
microbial growth, biological self-heating, and chip deterioration, which results in feedstock loss,
quality changes, and risks to worker health and safety 35 36 37. On-site chip quantities are limited
to reduce these risks. Design assumptions call for chips to be stored outdoors and handled using
a front-end loader. In the 2013 baseline short-term chip storage of 40% moisture biomass is
assumed to suffer 5% dry matter loss. This assumption is considered to be conservative for the
timeframe in question. INL research using intermediate scale pine chip piles shows temperature
increases in the range of 60 to 65°C within three to seven days of storage depending on location
within the pile 38. Extended exposure to these high-temperature conditions results in acetic acid
formation and changes to color and texture of the chips 39. In laboratory studies conducted by
INL using fresh pine chips at 50% initial moisture, dry matter loss in storage simulation reactors
reached 1.5% by three days in storage during the initiation of self-heating, 2.5% by one week
when a maximum temperature of 60°C was reached, and 6% by one month as shown in Figure
13. Based on these research samples, the dry matter loss assumption of 5% in the 2012 Design
Case baseline does not account for longer storage lengths on-site beyond the three day window,
potential pile wetting due to precipitation and/or moisture migration, and mechanical handling
losses.
Figure 13. Dry matter loss and self-heating of 50% initial moisture pine chips stored under aerobic
conditions using laboratory scale reactors at INL.

47
Preprocessing Preprocessing includes any physical or chemical activity that changes the material such as:
chipping, grinding, drying, and densification. Preprocessing may also include necessary auxiliary
operations such as: dust collection and conveyors. In general, the goal of preprocessing is to
increase the quality and uniformity of biomass in order to decrease transportation and handling
costs further along the supply chain. Different types of preprocessing operations described
below:
6.3.1 Comminution
Biomass size reduction, broadly referred to as comminution takes biomass from its as received
condition (i.e., baled, log, or coarse shredded) to the final particle size specification required by
the end user. Energy-intensive mechanical preprocessing operations like comminution tend to be
expensive; therefore optimization of this stage of preprocessing allows opportunities to reduce
the amount of equipment required and costs. Several aspects of size reduction are considered in
order to optimize the system to reduce cost. Design and performance considerations include the
size distribution of the final milled feedstock and the energy required to process the material.
Each size reduction process encounters biomass loss which has a double cost associated with the
process. First, the lost material must be accounted for by accruing additional biomass to make
up for the loss. Second, all cost prior to the loss are lost so any losses late in the supply chain can
have substantial economic impacts. For instance, encountering a 5% loss of material at the
biorefinery will mean that the harvest, collection, chipping and hauling costs will be lost for that
portion of the material.
Size reduction, or comminution, is an essential component of biomass logistics as downstream
conversion prefers a specific in-feed particle size. Additionally, size reduction aids in
downstream handling and transportation by increased load density and flowability. Comminution
can be conducted with either chippers or grinders but the cutting mechanisms are quite different.
Chippers use knives to cut or shear material while grinders use hammers to smash or crush
material. In general, the type of material dictates the type of comminution equipment to use. In
particular, grinders are used for contaminated material like C&D waste or wood residue due to
their reduced sensitivity to wear compared to chippers. Size and configuration also play a role in
equipment selection as chippers tend to perform better with uniform orientation of in-feed while
grinders do not have an orientation preference.
Hammer mills generally are considered the current SOT for biomass comminution due to their
high throughputs and versatility in processing a wide range of materials. Grinding and separation
process is described below.
Sequential Two-Stage Grinding
Conventional milling operations involve two sequential size-reduction steps to arrive at the final
particle size specification. The first stage of the size reduction process takes the as-received
biomass and converts it (through grinding or chipping) into a product that can be further
preprocessed. In the 2013 SOT scenario, the first stage size reduction is followed by drying and
second-stage size reduction. The 2013 SOT configuration of the first-stage grinding/chipping
process uses a 2 to 3-in. screen for coarse size reduction. This size and type of screen provides
enough size reduction for subsequent drying and final grinding.
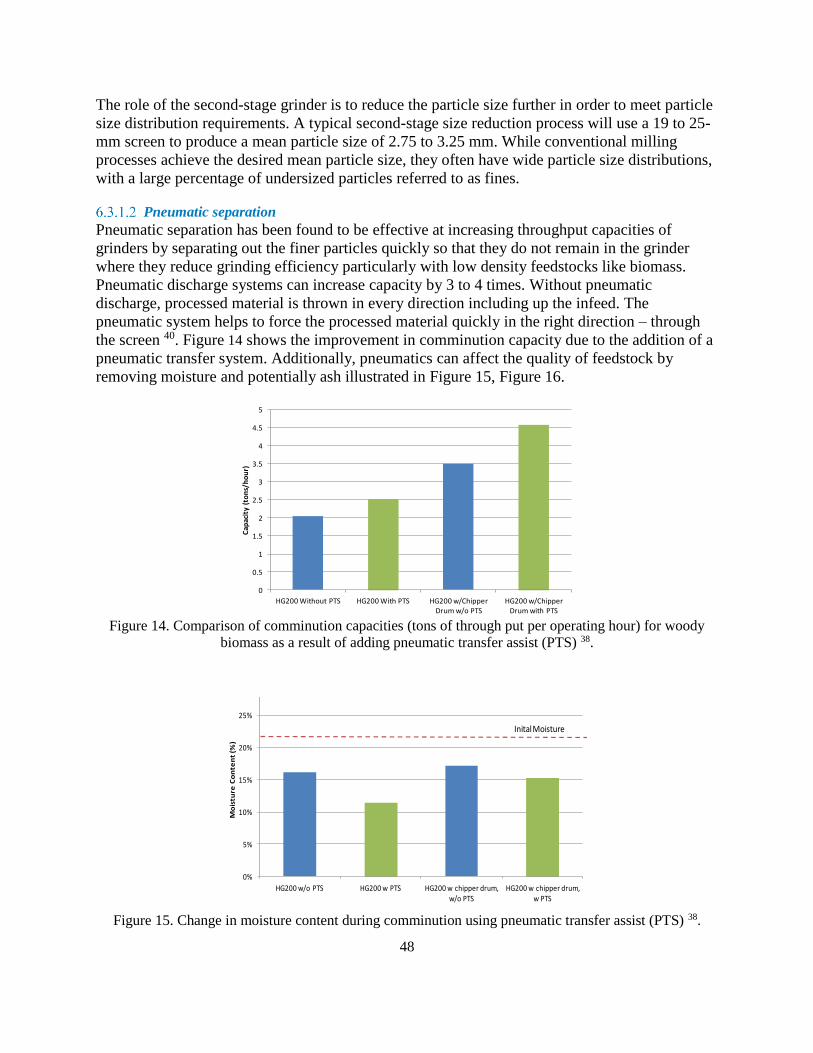
48
The role of the second-stage grinder is to reduce the particle size further in order to meet particle
size distribution requirements. A typical second-stage size reduction process will use a 19 to 25-
mm screen to produce a mean particle size of 2.75 to 3.25 mm. While conventional milling
processes achieve the desired mean particle size, they often have wide particle size distributions,
with a large percentage of undersized particles referred to as fines.
Pneumatic separation
Pneumatic separation has been found to be effective at increasing throughput capacities of
grinders by separating out the finer particles quickly so that they do not remain in the grinder
where they reduce grinding efficiency particularly with low density feedstocks like biomass.
Pneumatic discharge systems can increase capacity by 3 to 4 times. Without pneumatic
discharge, processed material is thrown in every direction including up the infeed. The
pneumatic system helps to force the processed material quickly in the right direction – through
the screen 40. Figure 14 shows the improvement in comminution capacity due to the addition of a
pneumatic transfer system. Additionally, pneumatics can affect the quality of feedstock by
removing moisture and potentially ash illustrated in Figure 15, Figure 16.
Figure 14. Comparison of comminution capacities (tons of through put per operating hour) for woody
biomass as a result of adding pneumatic transfer assist (PTS) 38.
Figure 15. Change in moisture content during comminution using pneumatic transfer assist (PTS) 38.
0
0.5
1
1.5
2
2.5
3
3.5
4
4.5
5
HG200 Without PTS HG200 With PTS HG200 w/Chipper Drum w/o PTS
HG200 w/Chipper Drum with PTS
Cap
acit
y (t
on
s/h
ou
r)
Capacity for Grinding Pinion/Juniper
0%
5%
10%
15%
20%
25%
30%
HG200 w/o PTS HG200 w PTS HG200 w chipper drum, w/o PTS
HG200 w chipper drum, w PTS
Mo
istu
re C
on
ten
t (%
)
Inital Moisture
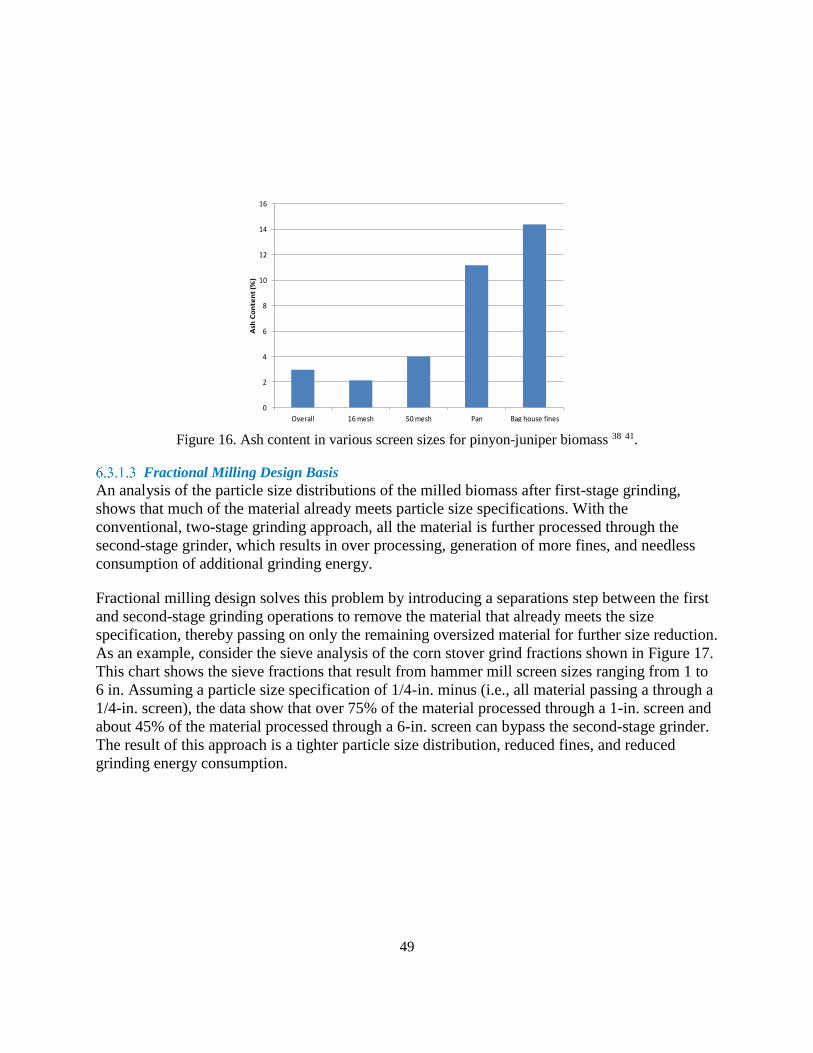
49
Figure 16. Ash content in various screen sizes for pinyon-juniper biomass 38 41.
Fractional Milling Design Basis
An analysis of the particle size distributions of the milled biomass after first-stage grinding,
shows that much of the material already meets particle size specifications. With the
conventional, two-stage grinding approach, all the material is further processed through the
second-stage grinder, which results in over processing, generation of more fines, and needless
consumption of additional grinding energy.
Fractional milling design solves this problem by introducing a separations step between the first
and second-stage grinding operations to remove the material that already meets the size
specification, thereby passing on only the remaining oversized material for further size reduction.
As an example, consider the sieve analysis of the corn stover grind fractions shown in Figure 17.
This chart shows the sieve fractions that result from hammer mill screen sizes ranging from 1 to
6 in. Assuming a particle size specification of 1/4-in. minus (i.e., all material passing a through a
1/4-in. screen), the data show that over 75% of the material processed through a 1-in. screen and
about 45% of the material processed through a 6-in. screen can bypass the second-stage grinder.
The result of this approach is a tighter particle size distribution, reduced fines, and reduced
grinding energy consumption.
0
2
4
6
8
10
12
14
16
Overall 16 mesh 50 mesh Pan Bag house fines
Ash
Co
nte
nt
(%)
Ash Content vs Particle Size

50
Figure 17. Particle-size distributions for five grinding scenarios 41.
With conventional, two-stage milling, the choice of the screen size in the first-stage mill is based
on balancing energy consumption and mass flow rates through the two operations. Figure 18
shows the specific energy consumption (i.e., total consumed power) data for milling corn stover
through a combined two-stage process. In these tests, the screen size of the first-stage hammer
mill grinder was varied from 3/16 to 6 in. as shown on the chart. The second-stage hammer mill
grinder was configured with a 3/16-in. screen for all tests. The highest energy consumption is
observed when size reducing in a single-pass through the first-stage grinder. These tests reveal
that it often is very difficult to optimize a coupled, two-stage-size reduction process, because the
second-stage mill often regulates the capacity of the first-stage mill. For a specific material and
moisture content, the system, whose results are shown in Figure 18, was operating in “a sweet
spot” (where capacities are evenly matched and grinding efficiencies are the greatest) when
either a 1 or 2-in. screen in the first-stage grinder was used. The data show that with larger first-
stage screen sizes, the second-stage grinder has to work harder, reducing the capacity of both
itself and the upstream grinder feeding.

51
Figure 18. Comparison of conventional, two-stage grinding and fractional milling 41.
Decoupling the two sequential grinding operations provides an opportunity to optimize the two
systems independently. For example, when the first-stage grinder is operated alone and the
throughput is not constrained by the throughput of the second-stage grinder, the specific energy
consumption of the first-stage grinder is reduced substantially (Figure 18). Optimization of the
first-stage grinder for the fractional milling design is accomplished by using a 6-in. screen to
maximize throughput and to minimize the amount of fines produced. Extrapolation of the
specific energy data shown in Figure 19 to estimate a design basis for operating with a 6-in.
screen provides an estimated specific energy of 12 kW-hr/ton. This is about a 70% reduction in
energy compared to the current 2013 SOT.
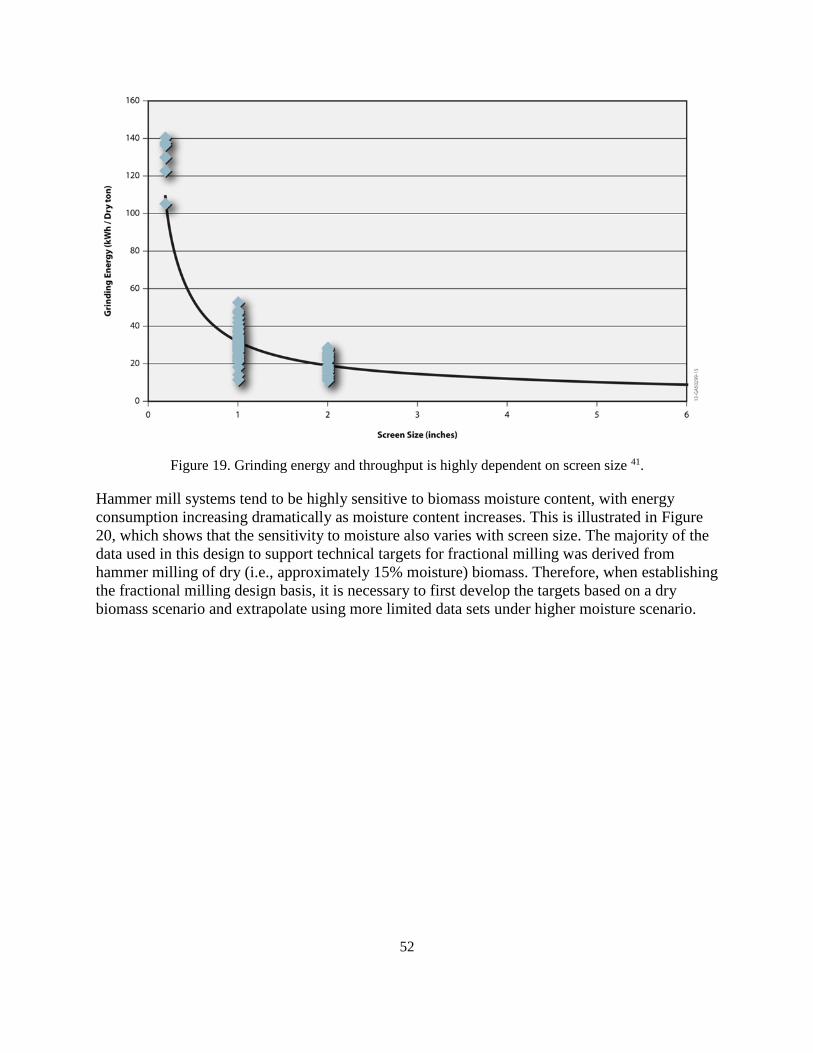
52
Figure 19. Grinding energy and throughput is highly dependent on screen size 41.
Hammer mill systems tend to be highly sensitive to biomass moisture content, with energy
consumption increasing dramatically as moisture content increases. This is illustrated in Figure
20, which shows that the sensitivity to moisture also varies with screen size. The majority of the
data used in this design to support technical targets for fractional milling was derived from
hammer milling of dry (i.e., approximately 15% moisture) biomass. Therefore, when establishing
the fractional milling design basis, it is necessary to first develop the targets based on a dry
biomass scenario and extrapolate using more limited data sets under higher moisture scenario.

53
Figure 20. Hammer mill energy consumption is highly dependent on biomass moisture content (INL
PDU Data).
Fractional Milling Dry Biomass
In this scenario, the data presented in Figure 18, Figure 19, and Figure 20 are used to estimate
the expected performance of a fractional milling design for processing dry (i.e., approximately
15% moisture) herbaceous biomass.
First-stage size reduction: As explained above, decoupling the first and second-stage size
reduction processes allows us to independently optimize the two systems. This is accomplished
using a first-stage hammer mill with a 6-in. screen to maximize throughput and to reduce the
amount of fines that are typically generated when using smaller screens. According to Figure 19,
we estimate that the energy consumption for first-stage milling to be about 10 kWhr/ton.
Second-stage size reduction: The design basis of the second-stage grinding process in this
scenario assumes that the decoupled fractional milling process will allow the second-stage
grinder to operate at the minimum energy requirements (21 kWhr/ton).
Separation: The fractional milling design inserts a separator between the first and second-stage
comminution processes to separate the material from the first-stage comminution process that
meets the size specification from those that are oversized and require further processing through
second-stage comminution. Based on a 1/4-in. particle size specification, the separator will be
configured with a ¼- in. screen; therefore, only the material that is retained on the screen will be
conveyed to the second-stage mill. Using the particle-size distribution data shown in Figure 17,
we assume that following the first-stage hammer milling through a 6-in. screen, approximately
45% of the material will pass through the 1/4-in. separator screen, and the remaining 55% will be
passed to the next mill. With only 55% of the material requiring further processing through the

54
second-stage grinder, the estimated effective specific energy consumption for second-stage
fractional milling is 12 kWhr/ton (21 kWhr/ton multiplied by 0.55).
Fractional Milling High-Moisture Biomass
Considering that the 2017 Design Case includes preprocessing of higher-moisture biomass, the
design basis for fractional milling of dry biomass requires an additional adjustment of the
specific energy assumptions for both the first-stage and the second-stage to account for the
increased energy requirements due to moisture.
First-stage size reduction: Data for single-stage grinding (Figure 20) shows that the sensitivity of
energy consumption to moisture content decreases with an increasing screen size. According to
Figure 20, as moisture increases from 15 to 30%, grinding-specific energy increases by 85 and
65% for 1-in. and 2 in. screen sizes, respectively. Assuming this trend continues, a 6-in. screen
will be much less sensitive to moisture content than the 1 and 2-in. screens shown. We estimate
that energy consumption with a 6-in. screen will increase by about 50% as moisture content
increases from 15 to 30%. Applying this to the first-stage energy consumption assumed in the
dry scenario above, the estimated specific energy consumption for first-stage hammer milling
increases from 10 kWhr/ton at 15% moisture to 15 kWhr/ton at 30% moisture.
Second-stage size reduction: A limited INL data set indicates that the 21-kWhr/ton energy
consumption measured for hammer milling corn stover at 15% moisture (Figure 18) increases to
about 60 kWhr/ton at 30% moisture. For the 2017 Design Case, we assert that improvements to
comminution systems are achievable to reduce the sensitivity of these systems to biomass
moisture content. While improvements to hammer mill systems may be achieved, shear milling
technology generally is considered a better option for higher-moisture materials. A preliminary
data set obtained from testing at INL of a prototype shear mill from an industry collaborator
suggests that shear mill technology may be capable of reducing comminution energy
requirements at higher moisture contents to the level achieved with hammer milling at the lower
moisture levels. Accordingly, a technical target of 21 kWhr/ton is established for the 2017
Design Case second-stage size reduction process (taken from the 2-in. screen data shown in
Figure 20).
Separation: The separations target for the high-moisture scenario is the same as the low-moisture
scenario discussed above. Achieving this target may be more difficult at higher moisture levels,
because the higher-moisture material will likely be tougher and less prone to shattering than the
low-moisture material. Nonetheless, 45% of the material passing through the 1/4-in. separator
screen is established as the target for the 2017 Design Case separation design basis. As was
described for the dry fractional milling scenario, this separations target results in effective energy
consumption for second-stage comminution of 15 kWhr/dry T (calculated as 21 kWhr/dry T
times 0.55), the total effective energy consumption target for fractional milling is 35 kWhr/ton.
6.3.2 Drying
Drying is important from various standpoints. Drying permits long-term storage without
deterioration and aids in the production of a better quality product. Drying could occur at the
field, biorefinery, depot, or during unit operations. Agricultural materials and therefore biomass
materials are dried using a variety of procedures due to differences in material properties and

55
desired outcomes. Factors that influence drying technologies include tolerance to temperature
(i.e. materials may cook or undergo adverse physical changes), response to humidity (i.e.
material undergo physiological may require specific air humidity), compression strength of
material (i.e. materials may crush or deform and must be dried in thin layers) and fluidity (i.e.
poor flowing material must be adjusted for proper angle of repose). Additionally quantity of
materials as well as desired rate, and environmental conditions (weather) influence the
technology applied.
The simplest form of drying is passive drying or field drying. This type of drying takes
advantage of existing environmental conditions to reduce biomass moisture in the field or stand,
but it is not consistently reliable across all spatial and temporal variations. In contrast, active
drying utilizes engineering controls to stabilize material and reduce moisture. Active drying
includes rotary dryers, cross flow dyers, and batch or bin dryers. Rotary dryers reduce moisture
by rotating a material through a heated air in a drum at a set speed so that material is uniformly
delivered at the desired moisture content. Rotary dryers work well for material that has limited
fluidity. Continuous gravity flow dryers, or cross flow dryers, reduce moisture by blowing air
across a column of material. Cross flow dryers work well for materials that flow easily and
permit airflow between individual components (i.e. pellets).Batch or bin driers force air through
a static material in a bin. Material to be bin dried must sufficiently resistant to compression to
allow proper void space for air flow. Finally, biomass like algae may require unique dryers to
remove water from a suspension (e.g. Like in a spray dryer) which uses the difference in air and
solution moisture equilibrium.
In all drying, the rate of water removal depends on the conditions of the air, the properties of the
biomass, and the design of the dryer. Moisture in the biomass can be held in varying degrees of
bonding; easily-removed water is referred to as free water and more tightly-retained water
referred to as bound water.
6.3.3 Densification
Densification process converts the feedstock into a pellet to achieve consistent physical
properties such as size and shape, bulk and unit density, and durability which significantly
influence storage, transportation and handling characteristics, resulting in reduced feedstock cost
and increased quality. A variety of densification systems are considered for producing a uniform
format feedstock commodity for bioenergy applications, such as pellet mill, cuber, screw
extruder, briquette press, roller press, tablet press, and agglomerator. Each of these systems has
varying impacts on feedstock chemical composition physical properties, and energy
consumption.
Conventional Pelletizing
Conventional biomass pellet production (Figure 21) includes initial size reduction to a 2- in.
particle size, followed by drying to 10 to 12% moisture content (wet basis) using a rotary dryer.
The dried biomass is then passed through a second stage grinding process to reduce the particle
size to less than 3/16-in. (typically to 2 mm), steam conditioned, and pelletized 42. Drying is the
major energy consumption unit operation in this process, accounting for about 70% of the total
pelletization energy.

56
Figure 21. Conventional pelletization process.
High-Moisture Densification Design Basis
Significant cost reductions to the conventional drying and pelleting processes are possible with a
process of high-moisture densification (that is under development at INL) that eliminates the
energy intensive rotary drying process prior to pelleting. In this process, the high-temperature
(typically 160 to 180°C) drying step is replaced with a low-temperature (approximately 110°C),
short duration (typically several minutes) preheating step. The combination of preheating with
the additional frictional heat generated in the pellet die results in a reduction of feedstock
moisture content by about 5 to 10 points (e.g., from 30% down to 25 to 20%). The pellets
produced still have high moisture and require further drying to about 7% for safe storage and
transportation (Figure 22). It should also be noted that higher moisture densification does not
include the addition of a binder.
This process has been demonstrated at INL where corn stover, ranging in moisture from 28 to
38%, was preheated at 110°C for 3 to 4 minutes prior to pelleting in a laboratory flat-die pellet
mill using both 8 and 6 mm dies. The pellets exited the mill at 20 to 30% moisture content and,
after drying, exhibited densities greater than 30 lb/ft3 and disabilities greater than 95%. The
specific energy consumption was found to be in the range of 40 to 100 kWhr/ton 43.
The reduction in drying energy is the key advantage of this approach. First, the process uses the
heat generated in the pellet die to partially dry the material. Second, drying the pellets offers cost
and energy advantages over drying loose, bulk material. Loose biomass typically is dried in a
concurrent flow rotary dryer. Rotary biomass dryers typically operate at temperatures of about
150 to 160°C, have greater particulate emissions, greater volatile organic compound emissions,
greater fire hazard, a large footprint, and often have difficulty in controlling the material
moisture. With the increased density, the reduced tendency for material to become entrained in
the air flow, and the increased heat transfer coefficients compared to loose biomass, more
efficient drying technologies options are available for drying pellets. A cross-flow dryer
(common in grain drying) operates at temperatures less than 100°C, reduces the particulate and
volatile organic compound emissions, and will have better temperature distribution. A
comparison of pellet properties and energy balances for conventional and high-moisture

57
pelletization processes is given in Table 7. The table shows 2017 Design Case targets to achieve
a 40 to 50% reduction in the total pelletization and drying energy.
Figure 22. High-moisture pelletization process.
Table 7. Drying and densification design basis.
Moisture Properties 2013 SOT 2017 Target
Infeed Moisture 30% 30%
Dryer Moisture Reduction 18% 11%
Densification Moisture Reduction 3% 10%
Final Pellet Moisture 9% 9%
Densification Energy 75 kWhr/dry T 50 kWhr/dry T
Drying Energy 350 kWhr/ton 100 kWhr/ton
Pellet Properties
Unit Density 70 lb/ft3 65 lb/ft3
Bulk Density 40 lb/ft3 35 lb/ft3
Durability Greater than 97.5% Greater than 97.5%
The high-moisture densification design basis assumptions are as follows:
Our preliminary studies indicated that it is possible to produce high-quality pellets using corn
stover; however, for our 2017 Design Case, we are assuming that the process works for other
woody and herbaceous feedstocks to produce durable, high-density pellets.
• Technical and cost targets are estimated with the assumption that a grain dryer will be used to
dry high-moisture pellets.
• Drying of pellets using energy-efficient driers like grain and belt driers is more economical
compared to conventional rotary driers.

58
• Slow drying at low temperatures of less than 60°C can result in more uniform moisture
distribution in pellets.
Transportation Transportation includes all processes involved in the movement of material from multiple
locations to a centralized location (such as a preprocessing facility or depot or biorefinery).
Processes include loading, trucking, rail transport, and unloading. Whereas transportation relies
on existing roadways, railways, and waterways to move biomass, collection requires the use of
specialized machinery to navigate off-road, gather dispersed biomass from a field or stand, and
move it to the nearby staging location. In terms of biomass, the goal of transportation is to
strategically utilize existing systems efficiency and cost effectively. A national scale biorefinery
industry will require movement of great amounts of biomass and therefore understanding
capacity and time constraints are important issues to consider. Long distance transportation like
rail and barge allow biomass to be transported greater distances but this incurs additional costs.
Densification of material both in particle size and energy content (i.e. torrefied material) allow
for some of these costs to be offset. Unit trains or dedicated transportation of a set amount of
material are additional strategies to be considered to reduce cost but the use of these options are
constrained by location, timing and capacity. Differing transportation modes such as rail and
barge can be cost efficient for long distance and pellet transportation. Understanding rail
movement of freight rail is inherently more complex than estimating costs for trucking, as rail
has to consider many factors such as distance, rail car type, car ownership, switching activities,
shipment volume type, etc.
Handling and Queuing
Handling and queuing involves processes required to move biomass material to inside the gates
at the biorefinery to the throat of the conversion. Handling equipment can include circular pile
reclaimers, loaders, surge bins, conveyors, dust collection, pellet crumblers, and miscellaneous
equipment required to move, queue and consistently deliver material. Handling operations are
influenced by type of feedstock and depend on many factors, including moisture content, bulk
density, particle size and shape distribution. Feedstocks, like corn stover, inherently possess
characteristics that inhibit handling (such as high cohesivity, low density, high compressibility,
and high variability in particle size and shape uniformity) 8. For this reason, feedstock handling
operations are typically designed at 150% of expected capacity. Handling issues can be improved
by either engineering new equipment or engineering the feedstock (uniform particles or densified
materials). Strategies to mix or blend multiple feedstock for cost and quality mitigation will
require additional challenges handling multiple feedstock. For example, formulated feedstocks
will require more complex feed operations, similar to the food industry, that are capable of
consistently delivering a homogeneous and precise ratio of desired material.

59
7. Supply System Design: Arrangement of Unit Operations Organizing feedstock logistics in a way that maintains economic and environmental
sustainability, while providing necessary resource quantities, is a principal challenge that needs
to be addressed before a self-sustaining industry can evolve. Strategies can be taken in three
ways to organize the earlier mentioned supply operations to reduce transportation distance, to
reduce supply risk, and to increase the biomass resource. Supply chain unit operations of
feedstock logistics can be configured depending on existing biomass and future commodity scale
biomass markets. In this section we present conventional and advance supply system.
Conventional Feedstock Supply System The conventional feedstock supply system design is based on practices currently developed for
both the conventional forestry and agriculture industries, and is economical in high-yielding
areas (for example, a corn stover production system in Iowa). The defining characteristic of the
conventional feedstock system is the arrangement of the unit operations which puts
preprocessing behind the biorefinery receiving gate where each biorefinery is designed to accept
a specific local feedstock (Figure 23).In this organization of operations, the burden of adapting to
feedstock resources is assumed primarily by the biorefinery.
Preprocessing
Storage
TransportationHarvest
And Collection
HandlingAnd
Queuing
Farm/Field Gate Biorefinery Gate
Figure 23. Conventional feedstock system for herbaceous lignocellulosic biomass.
In a conventional design, materials are stored on the field without further processing before
transportation and handling operations can move material from long-term storage to shorter-
term, storage at the biorefinery. Preprocessing operations are located at the biorefinery which
include all milling, conveyance, dust collection, and biomass material surge systems is necessary
to reduce biomass size before insertion in the conversion process (e.g., biochemical or
thermochemical).With this arrangement of unit operations, biorefineries will be designed to
accept a specific local feedstock or feedstocks and will need to undertake the burden of
modifying the resource to a usable form.
Advanced Supply System The advanced supply system concept arranges preprocessing technologies to mitigate the density
and stability issues that prevent biomass from being handled in high-efficiency bulk dry solid or
liquid distribution systems. The advanced supply system produces a feedstock supply system in
which the diversity of biomass formats is minimized as early in the supply system as practically
possible through a series of preprocessing steps. The organization of the unit operations in an
advanced supply system allows preprocessing to occur during harvest and collection and/or at
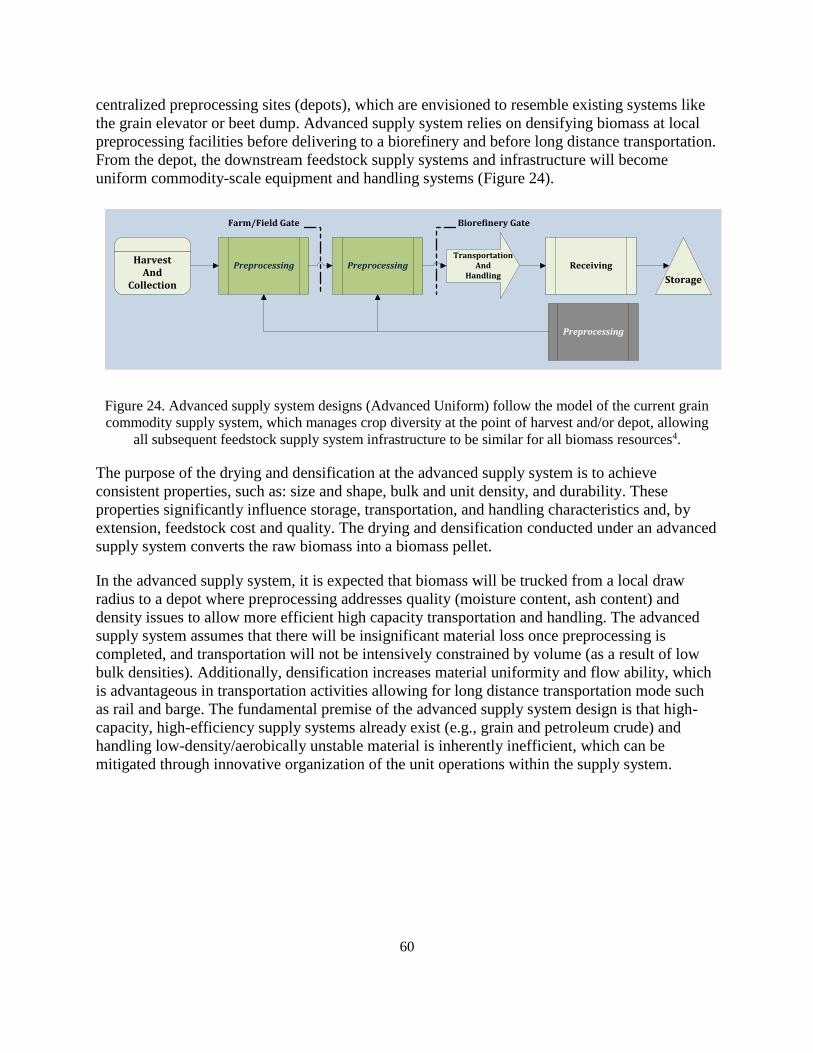
60
centralized preprocessing sites (depots), which are envisioned to resemble existing systems like
the grain elevator or beet dump. Advanced supply system relies on densifying biomass at local
preprocessing facilities before delivering to a biorefinery and before long distance transportation.
From the depot, the downstream feedstock supply systems and infrastructure will become
uniform commodity-scale equipment and handling systems (Figure 24).
Harvest And
CollectionStorage
TransportationAnd
HandlingPreprocessing Preprocessing Receiving
Preprocessing
Farm/Field Gate Biorefinery Gate
Figure 24. Advanced supply system designs (Advanced Uniform) follow the model of the current grain
commodity supply system, which manages crop diversity at the point of harvest and/or depot, allowing
all subsequent feedstock supply system infrastructure to be similar for all biomass resources4.
The purpose of the drying and densification at the advanced supply system is to achieve
consistent properties, such as: size and shape, bulk and unit density, and durability. These
properties significantly influence storage, transportation, and handling characteristics and, by
extension, feedstock cost and quality. The drying and densification conducted under an advanced
supply system converts the raw biomass into a biomass pellet.
In the advanced supply system, it is expected that biomass will be trucked from a local draw
radius to a depot where preprocessing addresses quality (moisture content, ash content) and
density issues to allow more efficient high capacity transportation and handling. The advanced
supply system assumes that there will be insignificant material loss once preprocessing is
completed, and transportation will not be intensively constrained by volume (as a result of low
bulk densities). Additionally, densification increases material uniformity and flow ability, which
is advantageous in transportation activities allowing for long distance transportation mode such
as rail and barge. The fundamental premise of the advanced supply system design is that high-
capacity, high-efficiency supply systems already exist (e.g., grain and petroleum crude) and
handling low-density/aerobically unstable material is inherently inefficient, which can be
mitigated through innovative organization of the unit operations within the supply system.
61
8. Biological Conversion of Sugars to Hydrocarbons The following sections outline the tailored logistic designs including costs and performance
specifications designed to meet the $80 per dry ton costs for Biological Conversion of Sugars to
Hydrocarbons pathway. This conversion path is coupled with the National Renewable Energy
Laboratory’s (NREL’s) hydrocarbon design report, “Dilute-Acid Prehydrolysis and Enzymatic
Hydrolysis Deconstruction of Biomass to Sugars and Biological Conversion of Sugars to
Hydrocarbons,” 44 that describes a viable route from biomass to hydrocarbon fuels. Because of
this coupling, the assumptions of scale and feedstock quality requirements are consistent with the
design case assumptions used by NREL in their report and techno economic assessments. In
addition, this design does not consider the different requirements and nuances of other biological
conversion processes or other hydrocarbon pathways.
Summary Two requirements for the 2017 Design Case that were established early in this report are:
achieving the $80 per dry ton cost target when located outside the Midwest Corn Belt and
achieving biorefinery quality specifications within the $80 per dry ton cost target. Feedstock
curves were developed for the 2017 Design Case scenario located in western Kansas (Figure 25).
These curves included access costs (i.e., grower payment), logistics costs, and dockage costs
(e.g., ash and carbohydrate dockage). Using these curves, it was determined that a feedstock
blend of 60% corn stover, 35% switchgrass, and 5% MSW would meet the $80 per dry ton
delivered feedstock cost target, thus satisfying the cost criterion of the 2017 Design Case (see
Table 8).

62
Table 8. Biochemical conversion feedstock design cost analysis.
Cost Element Single-pass
Corn Stover
Multi-pass
Corn Stover
Switchgrass MSW Blend
Formulation Contribution 35% 25% 35% 5% –
Grower payment/Access Cost 27.20 27.20 29.80 18.00 27.70
Harvest and collection ($/dry T) 10.50 19.20 15.40 – 13.90
Transportation ($/dry T) 8.70 8.30 7.20 18.00 8.60
Preprocessing ($/dry T) 23.40 23.40 19.70 19.70 21.90
Storage ($/dry T) 6.50 6.50 5.50 4.50 6.10
Handling ($/dry T) 1.80 1.80 1.80 1.80 1.80
Total Delivered Feedstock Cost
($/dry T) 78.10 86.40 79.40 62.00 ~80.00
Delivered Feedstock Specifications*
Ash content (wt. %) 3.5 7 4 10 4.9
Moisture content (%, wet basis) 9 9 9 9 9
Carbohydrate content (wt. %) 64 57 57 57 59
*Corn stover and switchgrass composition data were obtained from the INL Biomass Library. See Appendix A for
MSW ash and carbohydrate data.

63
Figure 25. Comparison of individual and blended feedstock costs. A blend of 60% corn stover, 35%
switchgrass, and 5% municipal solid waste is needed to hit the $80 feedstock cost target.
Even though feedstock quality is represented in the cost curves with a dockage fee (in this case,
ash dockage for multi-pass corn stover and MSW ash content in excess of the 5% ash
specification), the least-cost formulation approach does not guarantee that the lowest-cost
feedstock meets spec. In fact, the 60% corn stover, 35% switchgrass, and 5% MSW blend
actually exceeded the ash specification with blended ash content of 6.1%. As a result it was
necessary to replace some of the higher-ash, multi-pass stover with lower–ash, single-pass corn
stover in order to meet the ash specification (Table 9). The rationale for including both single
and multi-pass stover is that because single pass technology is a new technology requiring
additional investment by farmers, it is unlikely it will fully replace multi-pass harvest by 2017.
Sourcing 35% single-pass and 25% multi pass corn stover assumes that about 60% of the stover
will be single-pass and 40% will be multi-pass. This seems to be a reasonable assumption
considering that the 60% may be harvested by a custom harvester and 40% by local farmers.
For the 2017 Design Case scenario located in western Kansas, both the cost and quality criteria
could be achieved through blending. However, there may be other scenarios where reaching the
5% ash specification for biochemical conversion will require the removal of silica. Methods for
accomplishing silica removal include both fine grinding followed by triboelectrostatic separation
and alkali-based processes that dissolve silica 45. A recent analysis for non woody feedstocks
estimated a net cost of $39.93 to $60.80/dry T for removal of alkali metals (up to 95%) by
leaching, followed by removal of silica (up to 75%) by triboelectrostatic separation 45. With an
$80/dry T feedstock cost target, these costs are too high to allow the use of chemical
preconversion as an added unit operation in the current design; the existing feedstock supply

64
chain operations and the grower payment leave little room for added cost. A detailed discussion
of chemical preconversion for ash removal is included in Appendix D. Therefore, for this report,
we have selected feedstocks that can meet the ash specification in a blend with MSW.
The moisture and carbohydrate content of the blended feedstock also meet the specification for
moisture content (i.e., less than 20%) and carbohydrate content (i.e., at least 59%). Because each
feedstock is pelletized prior to blending, the pellets are dried to about 9 to 10% during pellet
production, thereby fixing the moisture content of the blend. Similar to ash content, the
carbohydrate specification is met by blending. The carbohydrate content of MSW varies
depending on the particular fraction, ranging from 46% for yard waste to 64% for food waste.
The MSW carbohydrate content shown in Table 8 is the average of yard waste (46%), food
waste (64%), non-recyclable paper (55%), and C&D waste (61%). Because MSW is such a small
fraction of the overall blend, even food waste blends out to a carbohydrate content of 59%.
Feedstock Composition (In-feed quality specifications) The conversion target for feedstock composition remains consistent with what was assumed in
the 2011 and 2013 design cases; however, the biomass supply composition is updated relative to
the original 2011 case. Previous requirements for feedstocks assumed in the 2011-era ethanol
models included cost targets only for a single biorefinery. There were no quality requirements;
further analysis indicated a mismatch on biomass characteristics and conversion in-feed
specifications. Furthermore, this design case focused more on supplying industry level biomass
supply versus a single biorefinery. The update applied in the 2013 design case and maintained
here improves on the 2011 design basis and the associated original feedstock price of $58.50/dry
ton (2007$), which included a more uncertain grower payment, to a more reasonable target at an
increased price of $80/dry ton including grower payment (2011$). This new price is more
appropriate for a large commodity scale going beyond a “niche market” price.
As has been described in prior conversion design reports, the feedstock composition (Table 9)
plays a critical role on overall process design and economics, primarily with respect to
carbohydrate components (cellulose and hemicellulose), lignin, and increasingly acetate and ash,
given modifications being made to the pretreatment strategy such as the use of deacetylation, as
well as high sensitivity to impurity components such as ash and metals in the catalytic reactor
section of this design. The blended uniform-format feedstock composition assumed here for
purposes of future design case targets is shown below, with supporting details (in the context of
corn stover compositional variability) described in the 2011 ethanol report 46. Also consistent
with prior design cases, the moisture content for the delivered feedstock is 20% or less.
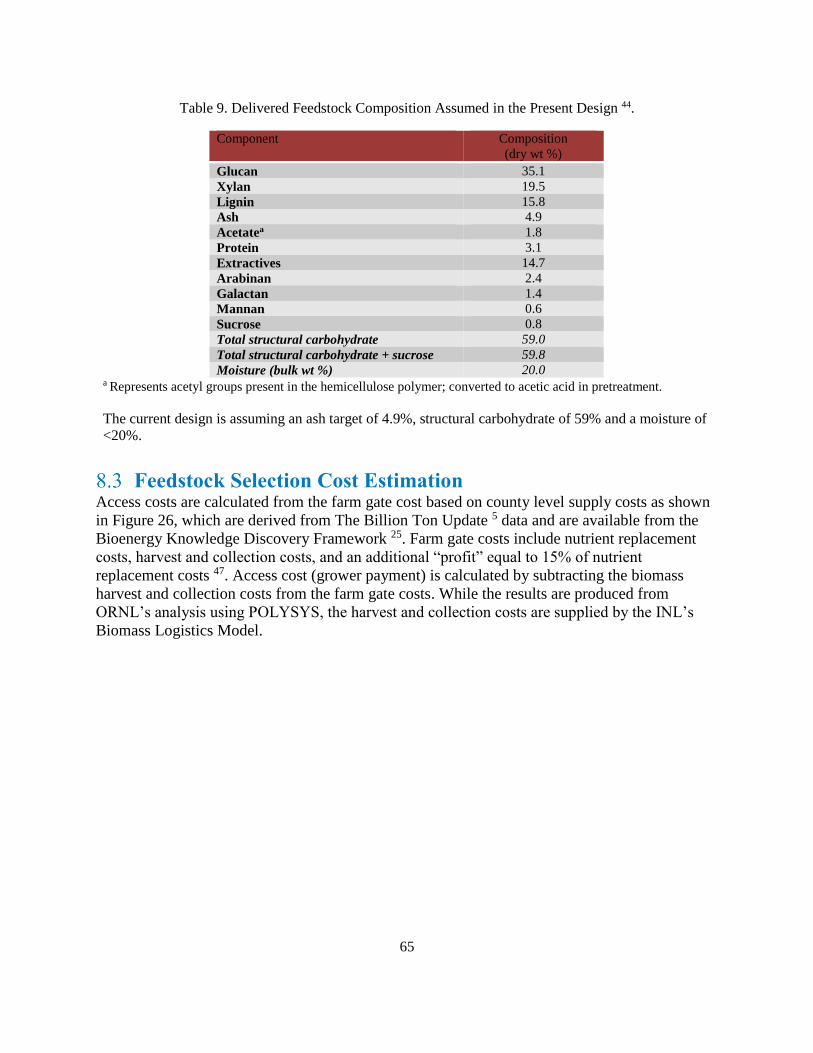
65
Table 9. Delivered Feedstock Composition Assumed in the Present Design 44.
Component Composition
(dry wt %)
Glucan 35.1
Xylan 19.5
Lignin 15.8
Ash 4.9
Acetatea 1.8
Protein 3.1
Extractives 14.7
Arabinan 2.4
Galactan 1.4
Mannan 0.6
Sucrose 0.8
Total structural carbohydrate 59.0
Total structural carbohydrate + sucrose 59.8
Moisture (bulk wt %) 20.0 a Represents acetyl groups present in the hemicellulose polymer; converted to acetic acid in pretreatment.
The current design is assuming an ash target of 4.9%, structural carbohydrate of 59% and a moisture of
<20%.
Feedstock Selection Cost Estimation Access costs are calculated from the farm gate cost based on county level supply costs as shown
in Figure 26, which are derived from The Billion Ton Update 5 data and are available from the
Bioenergy Knowledge Discovery Framework 25. Farm gate costs include nutrient replacement
costs, harvest and collection costs, and an additional “profit” equal to 15% of nutrient
replacement costs 47. Access cost (grower payment) is calculated by subtracting the biomass
harvest and collection costs from the farm gate costs. While the results are produced from
ORNL’s analysis using POLYSYS, the harvest and collection costs are supplied by the INL’s
Biomass Logistics Model.
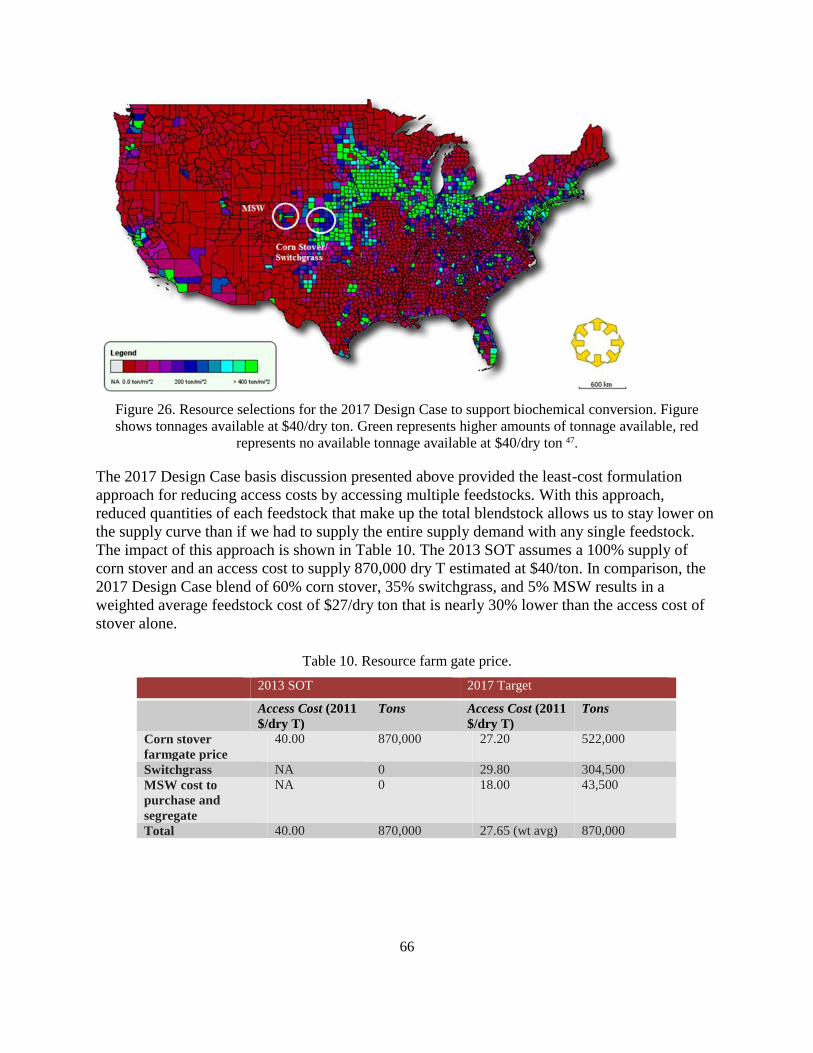
66
Figure 26. Resource selections for the 2017 Design Case to support biochemical conversion. Figure
shows tonnages available at $40/dry ton. Green represents higher amounts of tonnage available, red
represents no available tonnage available at $40/dry ton 47.
The 2017 Design Case basis discussion presented above provided the least-cost formulation
approach for reducing access costs by accessing multiple feedstocks. With this approach,
reduced quantities of each feedstock that make up the total blendstock allows us to stay lower on
the supply curve than if we had to supply the entire supply demand with any single feedstock.
The impact of this approach is shown in Table 10. The 2013 SOT assumes a 100% supply of
corn stover and an access cost to supply 870,000 dry T estimated at $40/ton. In comparison, the
2017 Design Case blend of 60% corn stover, 35% switchgrass, and 5% MSW results in a
weighted average feedstock cost of $27/dry ton that is nearly 30% lower than the access cost of
stover alone.
Table 10. Resource farm gate price.
2013 SOT 2017 Target
Access Cost (2011
$/dry T)
Tons Access Cost (2011
$/dry T)
Tons
Corn stover
farmgate price
40.00 870,000 27.20 522,000
Switchgrass NA 0 29.80 304,500
MSW cost to
purchase and
segregate
NA 0 18.00 43,500
Total 40.00 870,000 27.65 (wt avg) 870,000

67
Quality Specification and Design Assumptions The major assumptions of the 2017 Design Case, compared to the 2012 Conventional Design
and the 2013 SOT are shown in Table 11. The implications of these assumptions on feedstock
supply systems designs are discussed in following sections of the report.
Table 11. Summary of assumptions underpinning progressive design implementations.
2012 Conventional Design 2013 SOT 2017 Design Case
Feedstock(s) Corn stover Corn stover Blended feedstock: corn
stover, switchgrass, and select
municipal solid waste (MSW)
Grower payment Minimal Increases based on marginal
cost differential
Calculated and modeled
according to specific location
and resource
blend/formulation
Moisture Field dried to 12% Arrives at 30%
Dried to 20%
Arrives: corn stover 30%,
switchgrass 20%, and
MSW 20%;
All dried to 7%
Ash No ash management assumed 11%, dockage accessed for ash
content Greater than 5% spec
Corn stover: multi-pass 7%;
single-pass 3.5%
Switchgrass: 4%
MSW: 10%
Blended ash content of 4.9%
Logistics Uses existing systems Uses existing systems Fractional milling
High-moisture densification
Rail transportation for MSW
Quality controls
(passive)
Field drying to meet moisture
spec
Ample available resource;
quality spec manually selected
Dockage fee assessed to
supplier for below-quality
material
Multi versus single-pass
harvest/ collection
Harvest/collection and storage
best management practices
Quality controls
(active)
None assumed Rotary drying Multiple resource
blending/formulation
High-moisture densification
High-efficiency pellet drying
Meets quality target No Yes Yes
Meets cost target Yes No Yes
Accesses dispersed
resources
No No Yes
Feedstock Logistics 8.5.1 Harvest and Collection
Overview
The 2012 Conventional Design focused on conventional multi-pass harvest methods (i.e., the
mowing and/or windrowing operations are separate from the baling operation). Single-pass
harvesting systems (such as those developed through the DOE-funded, high-tonnage, logistics
projects) offer efficiency and quality improvements over conventional, multi-pass systems. The
2017 Design Case assumes that the immaturity of the biomass market will limit the farmer
investment in advanced equipment options. Therefore, with the exception of a few proactive,
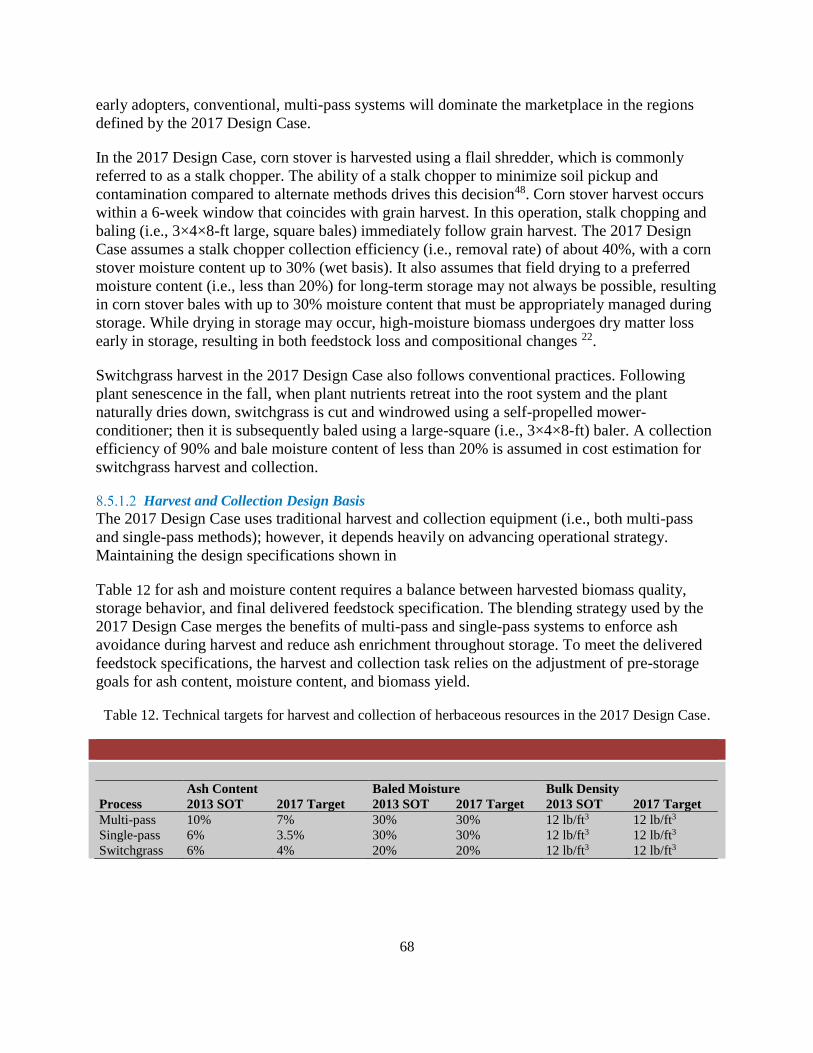
68
early adopters, conventional, multi-pass systems will dominate the marketplace in the regions
defined by the 2017 Design Case.
In the 2017 Design Case, corn stover is harvested using a flail shredder, which is commonly
referred to as a stalk chopper. The ability of a stalk chopper to minimize soil pickup and
contamination compared to alternate methods drives this decision48. Corn stover harvest occurs
within a 6-week window that coincides with grain harvest. In this operation, stalk chopping and
baling (i.e., 3×4×8-ft large, square bales) immediately follow grain harvest. The 2017 Design
Case assumes a stalk chopper collection efficiency (i.e., removal rate) of about 40%, with a corn
stover moisture content up to 30% (wet basis). It also assumes that field drying to a preferred
moisture content (i.e., less than 20%) for long-term storage may not always be possible, resulting
in corn stover bales with up to 30% moisture content that must be appropriately managed during
storage. While drying in storage may occur, high-moisture biomass undergoes dry matter loss
early in storage, resulting in both feedstock loss and compositional changes 22.
Switchgrass harvest in the 2017 Design Case also follows conventional practices. Following
plant senescence in the fall, when plant nutrients retreat into the root system and the plant
naturally dries down, switchgrass is cut and windrowed using a self-propelled mower-
conditioner; then it is subsequently baled using a large-square (i.e., 3×4×8-ft) baler. A collection
efficiency of 90% and bale moisture content of less than 20% is assumed in cost estimation for
switchgrass harvest and collection.
Harvest and Collection Design Basis
The 2017 Design Case uses traditional harvest and collection equipment (i.e., both multi-pass
and single-pass methods); however, it depends heavily on advancing operational strategy.
Maintaining the design specifications shown in
Table 12 for ash and moisture content requires a balance between harvested biomass quality,
storage behavior, and final delivered feedstock specification. The blending strategy used by the
2017 Design Case merges the benefits of multi-pass and single-pass systems to enforce ash
avoidance during harvest and reduce ash enrichment throughout storage. To meet the delivered
feedstock specifications, the harvest and collection task relies on the adjustment of pre-storage
goals for ash content, moisture content, and biomass yield.
Table 12. Technical targets for harvest and collection of herbaceous resources in the 2017 Design Case.
Process
Ash Content Baled Moisture Bulk Density
2013 SOT 2017 Target 2013 SOT 2017 Target 2013 SOT 2017 Target
Multi-pass 10% 7% 30% 30% 12 lb/ft3 12 lb/ft3
Single-pass 6% 3.5% 30% 30% 12 lb/ft3 12 lb/ft3
Switchgrass 6% 4% 20% 20% 12 lb/ft3 12 lb/ft3
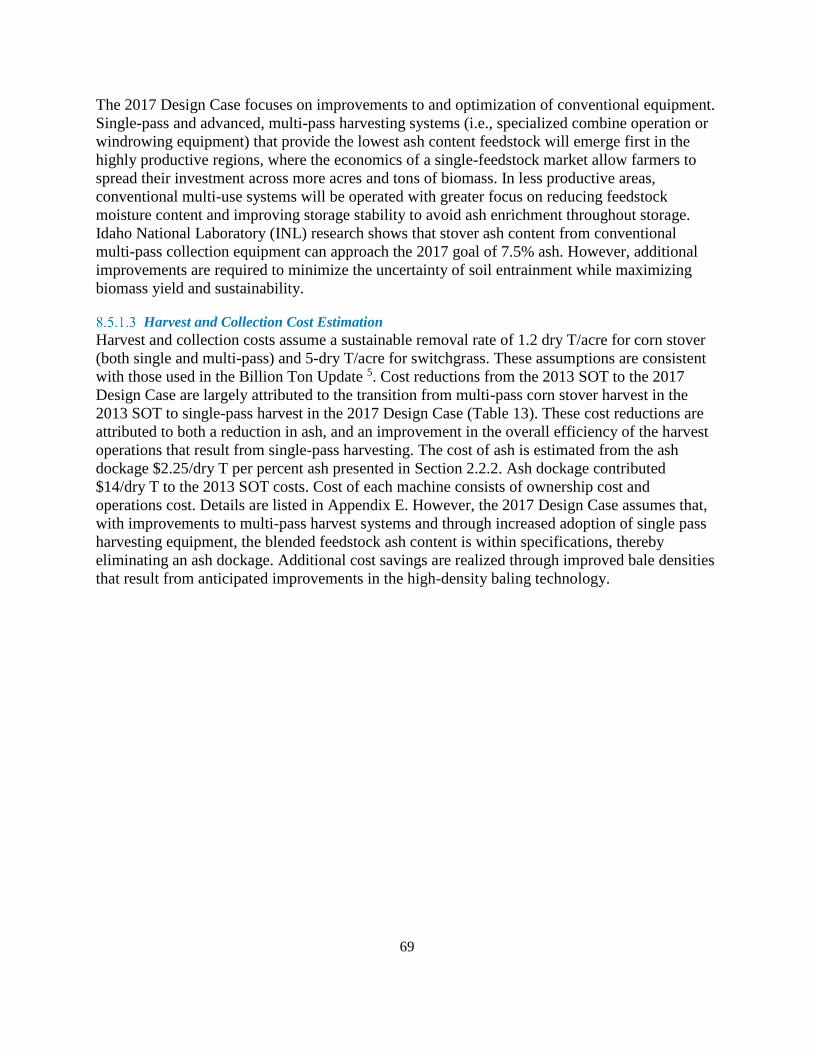
69
The 2017 Design Case focuses on improvements to and optimization of conventional equipment.
Single-pass and advanced, multi-pass harvesting systems (i.e., specialized combine operation or
windrowing equipment) that provide the lowest ash content feedstock will emerge first in the
highly productive regions, where the economics of a single-feedstock market allow farmers to
spread their investment across more acres and tons of biomass. In less productive areas,
conventional multi-use systems will be operated with greater focus on reducing feedstock
moisture content and improving storage stability to avoid ash enrichment throughout storage.
Idaho National Laboratory (INL) research shows that stover ash content from conventional
multi-pass collection equipment can approach the 2017 goal of 7.5% ash. However, additional
improvements are required to minimize the uncertainty of soil entrainment while maximizing
biomass yield and sustainability.
Harvest and Collection Cost Estimation
Harvest and collection costs assume a sustainable removal rate of 1.2 dry T/acre for corn stover
(both single and multi-pass) and 5-dry T/acre for switchgrass. These assumptions are consistent
with those used in the Billion Ton Update 5. Cost reductions from the 2013 SOT to the 2017
Design Case are largely attributed to the transition from multi-pass corn stover harvest in the
2013 SOT to single-pass harvest in the 2017 Design Case (Table 13). These cost reductions are
attributed to both a reduction in ash, and an improvement in the overall efficiency of the harvest
operations that result from single-pass harvesting. The cost of ash is estimated from the ash
dockage $2.25/dry T per percent ash presented in Section 2.2.2. Ash dockage contributed
$14/dry T to the 2013 SOT costs. Cost of each machine consists of ownership cost and
operations cost. Details are listed in Appendix E. However, the 2017 Design Case assumes that,
with improvements to multi-pass harvest systems and through increased adoption of single pass
harvesting equipment, the blended feedstock ash content is within specifications, thereby
eliminating an ash dockage. Additional cost savings are realized through improved bale densities
that result from anticipated improvements in the high-density baling technology.

70
Table 13. Biomass harvest and collection cost estimates.
Machine 2013 SOT
(2011 $/dry T)
2017 Target (2011
$/dry T)
Total Total
Multi-pass corn stover
Combine* 0.00 0.00
Shredder 5.30 5.30
Baler 10.60 10.60
Bale collection/stacking 3.30 3.30
Ash dockage 14.00 0.00
Totals 33.20 19.20
Single-pass corn stover
Combine* 0.00
Baler 7.20 7.20
Bale collection/stacking 3.30 3.30
Totals 10.50 10.50
Switchgrass
Mower-conditioner 4.80 4.80
Baler 7.30 7.30
Bale collection/stacking 3.30 3.30
Totals 15.40 15.40
* Costed to grain group.
8.5.2 Storage
The 2017 Design Case assumes that storage of corn stover and switchgrass will occur field
side or at a similar unimproved storage site. Biomass storage systems in the 2017 Design Case
seek to provide a low-cost, low-maintenance, moisture-tolerant solution that focuses on the
predictability of dry matter losses and compositional changes to inform an active inventory
management approach to large-scale, long-term storage.
Biomass Storage Design Base
The 2017 Design Case is based on material entering storage with 30% moisture. While it is
recognized that this condition is not the norm for many areas and that storage performance will
vary accordingly, use of this approach ensures the supply system will be capable of dealing with
unstable, non-ideal feedstock. According to INL data shown in Figure 27, we assume that corn
stover at 30% moisture accumulates, at-worst, 12% dry matter loss after about 150 days in
storage (adjusted for time scale) if additional moisture is not inserted. This upper limit for dry
matter loss was assumed for the entire year’s lot of feedstock.

71
Figure 27. The impact of dry matter loss on bale ash content and final conversion efficiency (based on
a 30% initial moisture and 12% ash).
As discussed in terms of the 2013 SOT, the passive loss of moisture during storage using
conventional practice cannot be depended on as means to safely store wet feedstock. Therefore,
storage practices developed by 2017 must be capable of limiting dry matter loss and its
associated impact on convertibility, even when moisture contents entering storage are not
favorable. To this end, the reduction of dry matter loss will be achieved through actively
controlled improvements to storage in a way that moisture loss can be reliably achieved and/or
oxygen availability can be limited in baled storage; both of which effectively limit microbial
growth. Laboratory testing at INL has demonstrated that the availability of oxygen (while
maintaining an aerobic storage environment) can effectively reduce the rates of dry matter loss in
storage (Figure 28). These high-moisture corn stover samples (i.e., 50% wet basis) demonstrate

72
how oxygen limitation can extend the shelf life in aerobic storage. Ongoing research will
determine how practical measures, such as increasing bale density, high-density stacking
configurations, and tarping, can be used to limit oxygen availability and improve storage stability
in high-moisture, baled, and bulk stored feedstocks.
Figure 28. Dry matter loss of corn stover in the simulated storage conditions, with three air flows
simulating three different oxygen availabilities.
The 2017 Design Case shifts the traditional focus of storage management away from a singular
goal of minimizing dry matter loss to a more informed focus on the final material’s
convertibility. This approach allows the conversion yield, reasonably derived from stored
biomass, to be assessed in addition to the mass loss incurred. The 2017 Design Case assumes that
structural carbohydrates consumed during storage leave the remaining dry matter less convertible
than the starting material. As an example of this effect, a hypothetical analysis of a storage
scenario using the 2013 Base Case feedstock (30% moisture and 12% ash) was cast in terms of
the existing biochemical ethanol conversion pathway 46. Regardless of final product class (e.g.,
ethanol versus bio-based hydrocarbon fuels), it is assumed the decreased conversion performance
due to degradation in storage will have comparable impacts on the feedstock supply system, with
actual impacts dependent on product-specific conversion specifications. For the purpose of this
analysis, calculation in terms of ethanol presents the opportunity for a direct comparison of
feedstock performance and should not be inferred as yield goals for 2017. The analysis shows a
conversion efficiency drop to 70 gal/dry T, which is an 11% reduction compared to the baseline
of 79 gal/dry T (Figure 29). The analysis assumes that dry matter losses are confined to the non-
ash biomass fraction, dry matter loss occurs proportionally across all non-ash components, and
for each 1% dry matter lost, there is a 0.25% decrease in conversion efficiency, which is defined
as a reduction in final product yield. As a result, when dry matter loss is accumulated over time
in storage (Figure 27, top), several important behaviors and interactions are occurring, primarily
the relative ash content of the material is becoming enriched (Figure 27, middle), causing the
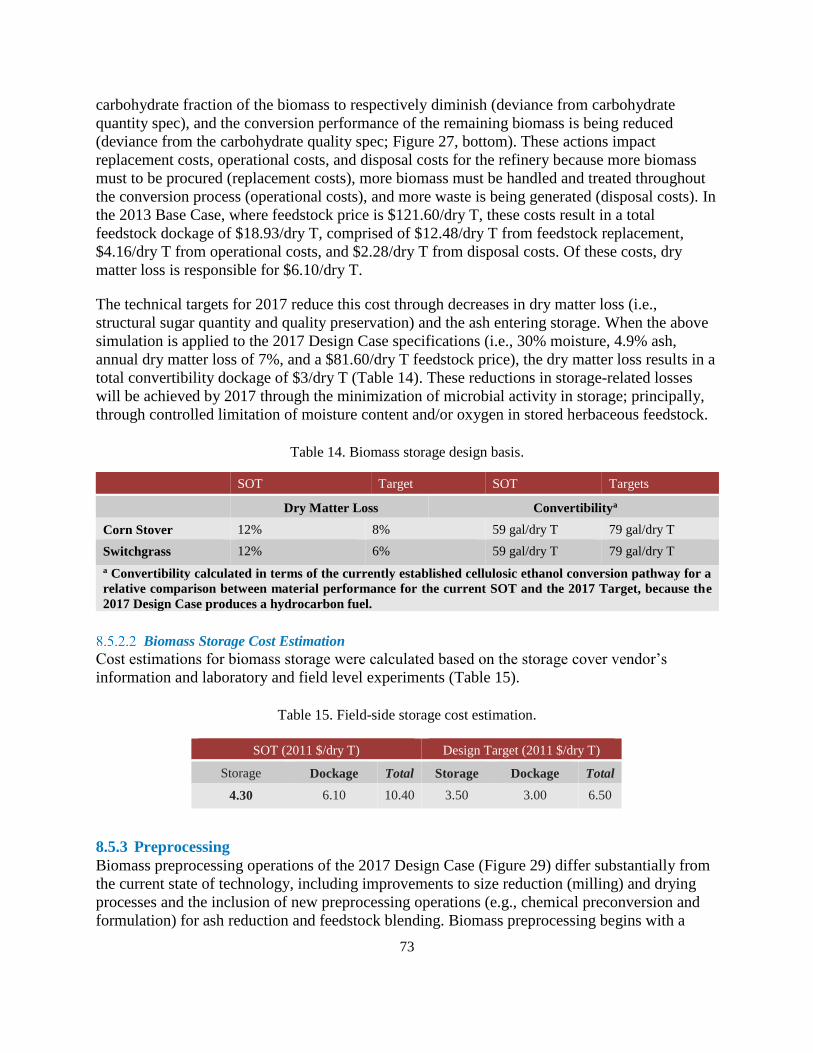
73
carbohydrate fraction of the biomass to respectively diminish (deviance from carbohydrate
quantity spec), and the conversion performance of the remaining biomass is being reduced
(deviance from the carbohydrate quality spec; Figure 27, bottom). These actions impact
replacement costs, operational costs, and disposal costs for the refinery because more biomass
must to be procured (replacement costs), more biomass must be handled and treated throughout
the conversion process (operational costs), and more waste is being generated (disposal costs). In
the 2013 Base Case, where feedstock price is $121.60/dry T, these costs result in a total
feedstock dockage of $18.93/dry T, comprised of $12.48/dry T from feedstock replacement,
$4.16/dry T from operational costs, and $2.28/dry T from disposal costs. Of these costs, dry
matter loss is responsible for $6.10/dry T.
The technical targets for 2017 reduce this cost through decreases in dry matter loss (i.e.,
structural sugar quantity and quality preservation) and the ash entering storage. When the above
simulation is applied to the 2017 Design Case specifications (i.e., 30% moisture, 4.9% ash,
annual dry matter loss of 7%, and a $81.60/dry T feedstock price), the dry matter loss results in a
total convertibility dockage of $3/dry T (Table 14). These reductions in storage-related losses
will be achieved by 2017 through the minimization of microbial activity in storage; principally,
through controlled limitation of moisture content and/or oxygen in stored herbaceous feedstock.
Table 14. Biomass storage design basis.
SOT Target SOT Targets
Dry Matter Loss Convertibilitya
Corn Stover 12% 8% 59 gal/dry T 79 gal/dry T
Switchgrass 12% 6% 59 gal/dry T 79 gal/dry T
a Convertibility calculated in terms of the currently established cellulosic ethanol conversion pathway for a
relative comparison between material performance for the current SOT and the 2017 Target, because the
2017 Design Case produces a hydrocarbon fuel.
Biomass Storage Cost Estimation
Cost estimations for biomass storage were calculated based on the storage cover vendor’s
information and laboratory and field level experiments (Table 15).
Table 15. Field-side storage cost estimation.
SOT (2011 $/dry T) Design Target (2011 $/dry T)
Storage Dockage Total Storage Dockage Total
4.30 6.10 10.40 3.50 3.00 6.50
8.5.3 Preprocessing
Biomass preprocessing operations of the 2017 Design Case (Figure 29) differ substantially from
the current state of technology, including improvements to size reduction (milling) and drying
processes and the inclusion of new preprocessing operations (e.g., chemical preconversion and
formulation) for ash reduction and feedstock blending. Biomass preprocessing begins with a

74
coarse (i.e., Stage 1) size reduction to break the bale and facilitate the subsequent separations
process. The next step is to separate the fractional material into two streams, one stream needing
further grinding and the other stream that is at final size. The objective of biomass separations is
to reduce the quantity of material that requires further preprocessing, differentiating among
anatomical or size fractions based on size, material properties (e.g., moisture and density), and/or
composition. In the 2017 Design Case, substantial cost savings in size reduction are realized by
separating the fraction of the biomass that meets the particle size specification as it exits the
Stage 1 size-reduction process, passing only the remaining over-sized materials on to the Stage 2
size-reduction process.
Separation/sorting of MSW is required to remove recyclables (e.g., metal, paper, and cardboard),
contaminants (e.g., plastics and concrete), and other unusable fractions to isolate only those
fractions that meet the cost and quality requirements for biofuel feedstocks. In the 2017 Design
Case, MSW is sorted to supply only yard and construction/demolition waste, which consists
mainly of wood waste (e.g., tree trimmings and lumber), as a feedstock to be blended with corn
stover and switchgrass. The ash content of these select MSW fractions is estimated to be about
10%. Chemical preconversion will be necessary for additional ash reduction (see Appendix B).
Following final milling of over-sized materials to the particle-size specification (i.e., 1/4-in.
minus), feedstocks are pelletized.
The 2017 Design Case incorporates many improvements in preprocessing, including fractional
milling, chemical preconversion, high-moisture densification, and formulation/blending. Figure
29 outlines the material flow given for these improvements.
Figure 29. Material flow in the 2017 Design Case that incorporates many improvements in preprocessing,
including fractional milling, chemical preconversion, high-moisture densification, and
formulation/blending.
The logistics of a blended feedstock scenario are certainly more complex than a single-feedstock
scenario. The 2017 Design Case assumes that preprocessing of MSW will occur at a
preprocessing depot located at the source landfill or refuse transfer station, and MSW pellets will
be shipped from the depot to the blending depot located within proximity of the biorefinery.
Corn stover and switchgrass that is formatted in large square bales will be delivered to the
blending depot, where they will be processed into pellets. Corn stover, switchgrass, and MSW

75
pellets will be queued up in blending bunkers or silos. The pellets of the three blendstocks (i.e.,
corn stover, switchgrass, and MSW) are then metered from the blending bunkers in the ratios
required of the blended feedstock and are conveyed from the preprocessing facility/depot to the
conversion facility.
Size Reduction
For the 2017 Design Case, a geometric mean particle size of ¼- in. is the target size specification
optimal for densification. Particle size after grinding is dictated by a number of factors, including
biomass physical and material properties, process variable of the comminution system, shear and
impact forces imparted by the comminution system, and the size opening of the screen used to
retain material in the system until the material is sufficiently processed to pass through the
screen.
Hammer mills generally are considered the current state of technology for biomass comminution
due to their high throughputs and versatility in processing a wide range of materials. As a general
rule of thumb, the geometric mean particle size achieved by hammer milling typically is an order
of magnitude smaller than the screen size opening
The fractional milling design basis is summarized in Table 16. Preprocessing starts with an
initial (Stage 1) coarse size reduction using a 400-hp horizontal grinder configured with a 6-in.
screen. Upon exiting the first-stage grinder, the coarse-ground material passes through a
separator that is configured with a 1/4-in. screen. The fraction that meets the size specification
will pass through the screen and move onto densification, while the fraction that is retained on
the screen will be conveyed into the second-stage size-reduction process for final milling to the
particle size specification. The fractional milling process will reduce the total effective energy
consumption for biomass size reduction by about 60 and 70% for dry (15%) and wet (30%)
biomass, respectively. Note that this calculation is based on the effective energy consumption for
second-stage comminution (see footnote to Table 16).
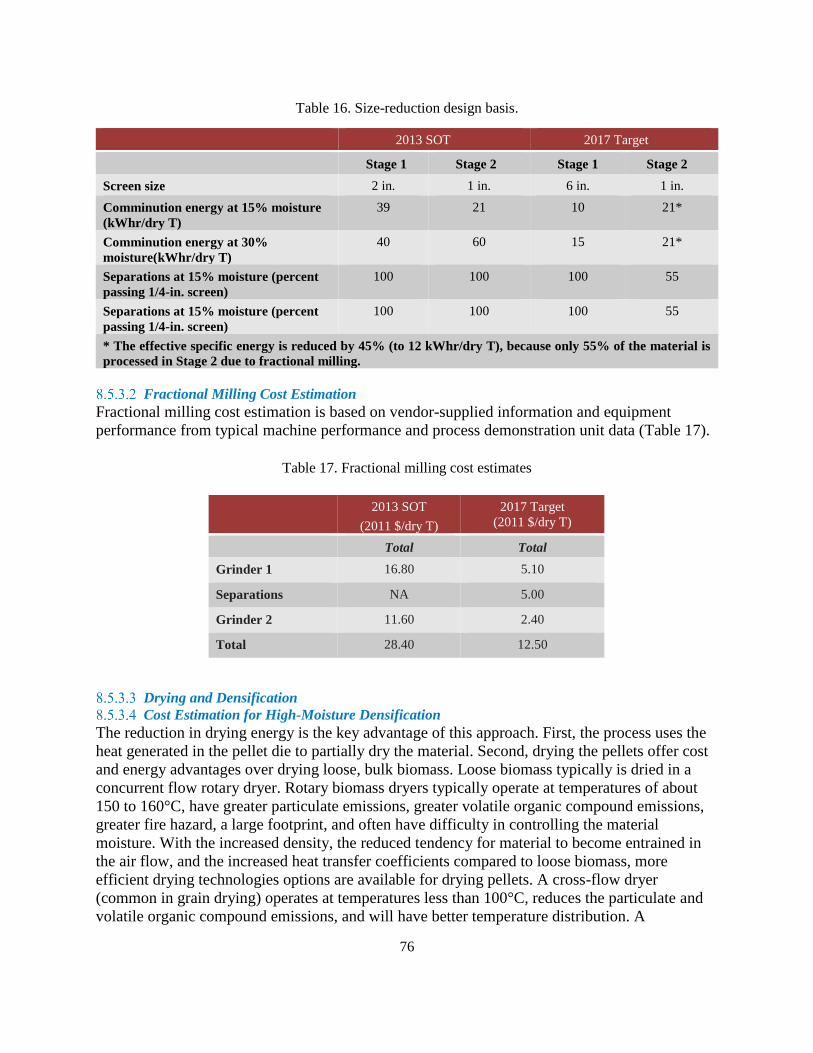
76
Table 16. Size-reduction design basis.
2013 SOT 2017 Target
Stage 1 Stage 2 Stage 1 Stage 2
Screen size 2 in. 1 in. 6 in. 1 in.
Comminution energy at 15% moisture
(kWhr/dry T)
39 21 10 21*
Comminution energy at 30%
moisture(kWhr/dry T)
40 60 15 21*
Separations at 15% moisture (percent
passing 1/4-in. screen)
100 100 100 55
Separations at 15% moisture (percent
passing 1/4-in. screen)
100 100 100 55
* The effective specific energy is reduced by 45% (to 12 kWhr/dry T), because only 55% of the material is
processed in Stage 2 due to fractional milling.
Fractional Milling Cost Estimation
Fractional milling cost estimation is based on vendor-supplied information and equipment
performance from typical machine performance and process demonstration unit data (Table 17).
Table 17. Fractional milling cost estimates
2013 SOT
(2011 $/dry T)
2017 Target
(2011 $/dry T)
Total Total
Grinder 1 16.80 5.10
Separations NA 5.00
Grinder 2 11.60 2.40
Total 28.40 12.50
Drying and Densification
Cost Estimation for High-Moisture Densification
The reduction in drying energy is the key advantage of this approach. First, the process uses the
heat generated in the pellet die to partially dry the material. Second, drying the pellets offer cost
and energy advantages over drying loose, bulk biomass. Loose biomass typically is dried in a
concurrent flow rotary dryer. Rotary biomass dryers typically operate at temperatures of about
150 to 160°C, have greater particulate emissions, greater volatile organic compound emissions,
greater fire hazard, a large footprint, and often have difficulty in controlling the material
moisture. With the increased density, the reduced tendency for material to become entrained in
the air flow, and the increased heat transfer coefficients compared to loose biomass, more
efficient drying technologies options are available for drying pellets. A cross-flow dryer
(common in grain drying) operates at temperatures less than 100°C, reduces the particulate and
volatile organic compound emissions, and will have better temperature distribution. A

77
comparison of pellet properties and energy balances for conventional and high-moisture
pelletization processes is given in Table 18. The table shows 2017 Design Case targets to achieve
a 40 to 50% reduction in the total pelletization and drying energy.
Table 18. Drying and densification design basis.
Moisture Properties 2013 SOT 2017 Target
Infeed Moisture 30% 30%
Dryer Moisture Reduction 18% 11%
Densification Moisture Reduction 3% 10%
Final Pellet Moisture 9% 9%
Densification Energy 75 kWhr/dry T 50 kWhr/dry T
Drying Energy 350 kWhr/ton 100 kWhr/ton
Pellet Properties
Unit Density 70 lb/ft3 65 lb/ft3
Bulk Density 40 lb/ft3 35 lb/ft3
Durability Greater than 97.5% Greater than 97.5%
The cost of densification was estimated using vendor-supplied information and the capacity and
energy assumptions shown in Table 19. Rotary drying costs associated with the 2013 SOT were
based on data supplied by Anco-Eaglin, Inc. As described above, because of the similarity of
pellets and grain, grain drying technology is the basis of the 2017 Design Case. Accordingly,
grain drying costs also the source of the pellet drying cost estimate. Using a grain drying
calculator found at Iowa State 49, we estimate the cost of drying grain of a similar moisture
content to be $10 to $14/ton. Estimated pellet drying costs were reduced from these values
because we assume that the porous nature of pellets and less structural heterogeneities in pellets
will promote more rapid and uniform drying compared to grain that has the outer pericarp layer
that limits moisture transfer.

78
Table 19. Drying and densification cost estimates.
2013 SOT
(2011 $/dry T)
2017 Target (2011
$/dry T)
Total Total
Drying 15.20 5.60
Densification 7.70 4.40
Totals 22.90 10.00
Formulation/Blending
Overview
Feedstock formulation is not a new concept in many market sectors. For example, different
grades of coal are blended to reduce sulfur and nitrogen contents for power generation 14, grain is
blended at elevators to adjust moisture content 13, animal feeds are blended to balance nutrient
content 16, and high-ash biomass sources are mixed with low-ash coal to allow their use in
biopower 17. However, blending/formulation is not part of the baseline design.
Formulation Design Basis
To meet feedstock specifications required for various conversion pathways, formulation of specific
mixtures of feedstocks will likely be required. Examples include mixing high and low-cost
feedstocks to meet cost targets, mixing high and low-ash feedstocks to meet an ash target, mixing
of high and low-carbohydrate feedstocks to meet a yield target, and mixing easily and poorly
reactive feedstocks to meet a convertibility target. An example of blending to meet an ash and
moisture specification is shown in Table 20.
Table 20. Feedstock formulation/blending of ash and moisture contents*.
Content Delivered to
Biorefinery Infeed
Single-pass
cornstover(35%)
Multi-pass
cornstover (25%)
Switchgrass (35%)
MSW
(5%)
Final Blend
Ash content (wt. %) 3.5 7 4 10 4.9
Moisture content (%, wet
basis)
9 9 9 9 9
Carbohydrate content (wt.
%)
64 57 57 57 59
Assumptions for the formulation design basis are as follows:
Blended feedstocks will be selected and developed to achieve conversion yield
specifications. It is currently unknown how blended feedstocks will perform in the
conversion pathways. The simplest assumption is that the performance of the blended
feedstocks would be the sum of performances of each individual component. However, two,
small-scale studies demonstrated that the performance of blended feedstocks ranged from
under to over performance, depending on the conditions assessed. In the first study50, a blend
of wheat straw, barley straw, hardwood, and softwood subjected to three different types of
pretreatments: dilute acid, lime, and soaking in aqueous ammonia was examined. After
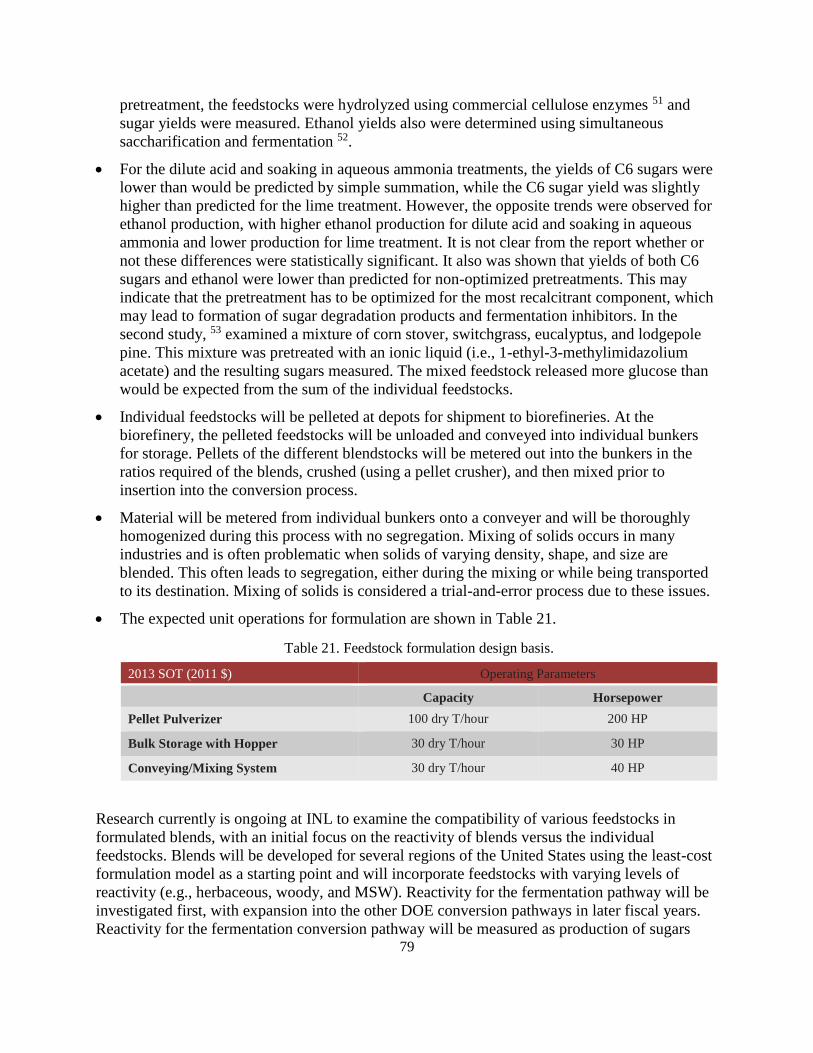
79
pretreatment, the feedstocks were hydrolyzed using commercial cellulose enzymes 51 and
sugar yields were measured. Ethanol yields also were determined using simultaneous
saccharification and fermentation 52.
For the dilute acid and soaking in aqueous ammonia treatments, the yields of C6 sugars were
lower than would be predicted by simple summation, while the C6 sugar yield was slightly
higher than predicted for the lime treatment. However, the opposite trends were observed for
ethanol production, with higher ethanol production for dilute acid and soaking in aqueous
ammonia and lower production for lime treatment. It is not clear from the report whether or
not these differences were statistically significant. It also was shown that yields of both C6
sugars and ethanol were lower than predicted for non-optimized pretreatments. This may
indicate that the pretreatment has to be optimized for the most recalcitrant component, which
may lead to formation of sugar degradation products and fermentation inhibitors. In the
second study, 53 examined a mixture of corn stover, switchgrass, eucalyptus, and lodgepole
pine. This mixture was pretreated with an ionic liquid (i.e., 1-ethyl-3-methylimidazolium
acetate) and the resulting sugars measured. The mixed feedstock released more glucose than
would be expected from the sum of the individual feedstocks.
Individual feedstocks will be pelleted at depots for shipment to biorefineries. At the
biorefinery, the pelleted feedstocks will be unloaded and conveyed into individual bunkers
for storage. Pellets of the different blendstocks will be metered out into the bunkers in the
ratios required of the blends, crushed (using a pellet crusher), and then mixed prior to
insertion into the conversion process.
Material will be metered from individual bunkers onto a conveyer and will be thoroughly
homogenized during this process with no segregation. Mixing of solids occurs in many
industries and is often problematic when solids of varying density, shape, and size are
blended. This often leads to segregation, either during the mixing or while being transported
to its destination. Mixing of solids is considered a trial-and-error process due to these issues.
The expected unit operations for formulation are shown in Table 21.
Table 21. Feedstock formulation design basis.
2013 SOT (2011 $) Operating Parameters
Capacity Horsepower
Pellet Pulverizer 100 dry T/hour 200 HP
Bulk Storage with Hopper 30 dry T/hour 30 HP
Conveying/Mixing System 30 dry T/hour 40 HP
Research currently is ongoing at INL to examine the compatibility of various feedstocks in
formulated blends, with an initial focus on the reactivity of blends versus the individual
feedstocks. Blends will be developed for several regions of the United States using the least-cost
formulation model as a starting point and will incorporate feedstocks with varying levels of
reactivity (e.g., herbaceous, woody, and MSW). Reactivity for the fermentation pathway will be
investigated first, with expansion into the other DOE conversion pathways in later fiscal years.
Reactivity for the fermentation conversion pathway will be measured as production of sugars
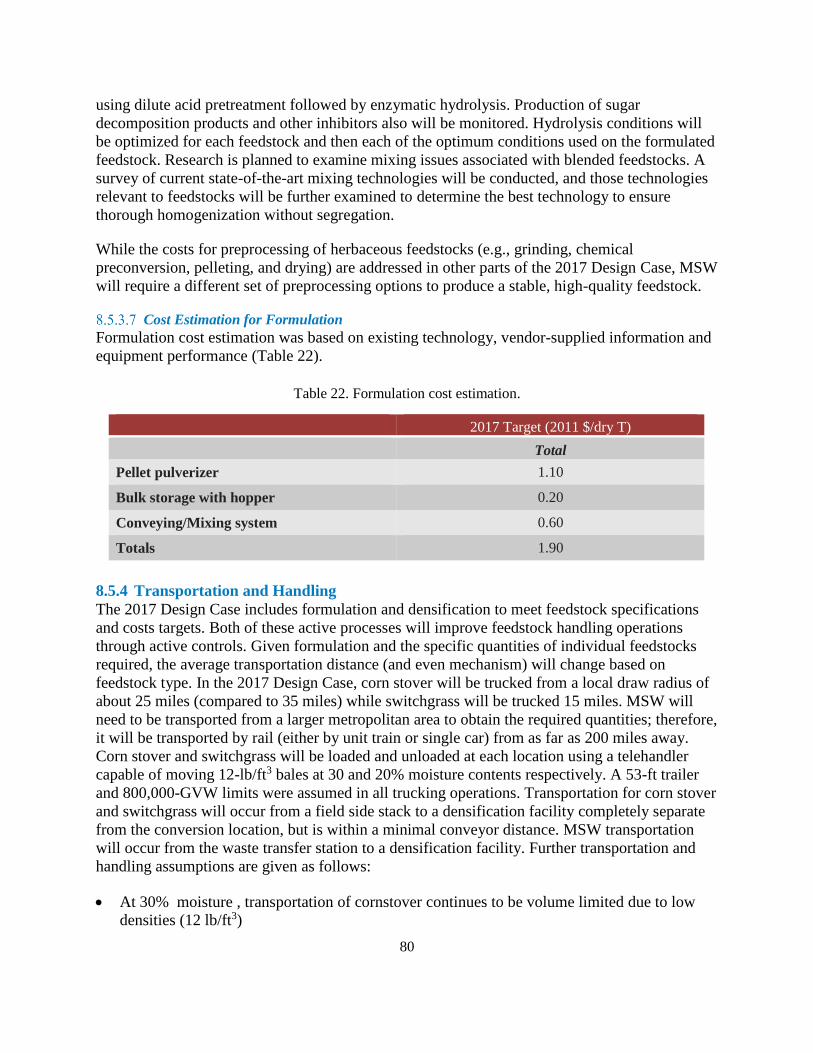
80
using dilute acid pretreatment followed by enzymatic hydrolysis. Production of sugar
decomposition products and other inhibitors also will be monitored. Hydrolysis conditions will
be optimized for each feedstock and then each of the optimum conditions used on the formulated
feedstock. Research is planned to examine mixing issues associated with blended feedstocks. A
survey of current state-of-the-art mixing technologies will be conducted, and those technologies
relevant to feedstocks will be further examined to determine the best technology to ensure
thorough homogenization without segregation.
While the costs for preprocessing of herbaceous feedstocks (e.g., grinding, chemical
preconversion, pelleting, and drying) are addressed in other parts of the 2017 Design Case, MSW
will require a different set of preprocessing options to produce a stable, high-quality feedstock.
Cost Estimation for Formulation
Formulation cost estimation was based on existing technology, vendor-supplied information and
equipment performance (Table 22).
Table 22. Formulation cost estimation.
2017 Target (2011 $/dry T)
Total
Pellet pulverizer 1.10
Bulk storage with hopper 0.20
Conveying/Mixing system 0.60
Totals 1.90
8.5.4 Transportation and Handling
The 2017 Design Case includes formulation and densification to meet feedstock specifications
and costs targets. Both of these active processes will improve feedstock handling operations
through active controls. Given formulation and the specific quantities of individual feedstocks
required, the average transportation distance (and even mechanism) will change based on
feedstock type. In the 2017 Design Case, corn stover will be trucked from a local draw radius of
about 25 miles (compared to 35 miles) while switchgrass will be trucked 15 miles. MSW will
need to be transported from a larger metropolitan area to obtain the required quantities; therefore,
it will be transported by rail (either by unit train or single car) from as far as 200 miles away.
Corn stover and switchgrass will be loaded and unloaded at each location using a telehandler
capable of moving 12-lb/ft3 bales at 30 and 20% moisture contents respectively. A 53-ft trailer
and 800,000-GVW limits were assumed in all trucking operations. Transportation for corn stover
and switchgrass will occur from a field side stack to a densification facility completely separate
from the conversion location, but is within a minimal conveyor distance. MSW transportation
will occur from the waste transfer station to a densification facility. Further transportation and
handling assumptions are given as follows:
At 30% moisture , transportation of cornstover continues to be volume limited due to low
densities (12 lb/ft3)

81
At 20% moisture , transportation of switchgrass continues to be volume limited due to low
densities (12 lb/ft3)
There will be insignificant material losses throughout transportation and handling.
Densification will increase material uniformity and flowability.
Cost Estimation for Transportation
The cost estimation for transportation and handling was based on vendor-supplied information
and equipment performance from typical machines (Table 23).Rail transportation costs were
based on work from Searcy using a jumbo hopper car 54 adjusted for U.S. conditions.
Table 23. Transportation cost estimates.
2013 SOT
(2011 $/dry T)
2017 Target
(2011 $/dry T)
Total Total
Truck 11.50 8.30
Rail* 0.00 18.00
*For specific feedstocks only to obtain required quantity.
Life Cycle Assessment: This section uses a life-cycle assessment (LCA) to evaluate the energy input and GHG emissions
for Biological Conversion of Sugars to Hydrocarbons. LCA considered the unit processes
involved in the biomass logistics. Table 24 shows the energy consumption and Table 25 shows
GHG contribution for Biochemical conversion supply chain design.
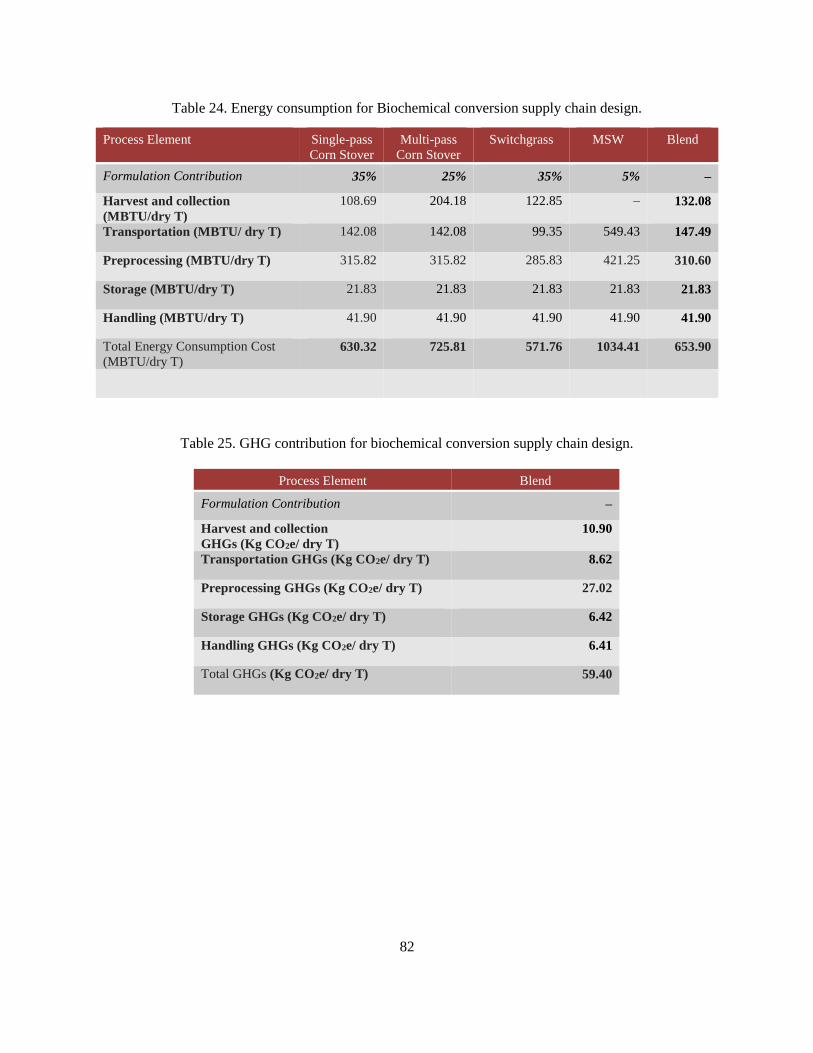
82
Table 24. Energy consumption for Biochemical conversion supply chain design.
Process Element Single-pass
Corn Stover
Multi-pass
Corn Stover
Switchgrass MSW Blend
Formulation Contribution 35% 25% 35% 5% –
Harvest and collection
(MBTU/dry T)
108.69 204.18 122.85 – 132.08
Transportation (MBTU/ dry T) 142.08 142.08 99.35 549.43 147.49
Preprocessing (MBTU/dry T) 315.82 315.82 285.83 421.25 310.60
Storage (MBTU/dry T) 21.83 21.83 21.83 21.83 21.83
Handling (MBTU/dry T) 41.90 41.90 41.90 41.90 41.90
Total Energy Consumption Cost
(MBTU/dry T) 630.32 725.81 571.76 1034.41 653.90
Table 25. GHG contribution for biochemical conversion supply chain design.
Process Element Blend
Formulation Contribution –
Harvest and collection
GHGs (Kg CO2e/ dry T)
10.90
Transportation GHGs (Kg CO2e/ dry T) 8.62
Preprocessing GHGs (Kg CO2e/ dry T) 27.02
Storage GHGs (Kg CO2e/ dry T) 6.42
Handling GHGs (Kg CO2e/ dry T) 6.41
Total GHGs (Kg CO2e/ dry T) 59.40
83
9. Conversion of Lignocellulosic Biomass to Hydrocarbon
Fuels: Fast Pyrolysis and Hydrotreating Bio-Oil Pathway This section is intended to couple with the Pacific Northwest National Laboratory’s (PNNL’s)
hydrocarbon design report, “Process Design and Economics for the Conversion of
Lignocellulosic Biomass to Hydrocarbon Fuels: Fast Pyrolysis and Hydrotreating Bio-Oil
Pathway” 55 that describes a viable route from biomass to hydrocarbon fuels. The assumptions of
scale and feedstock quality requirements are consistent with the design case assumptions used by
PNNL in their report and techno economic assessments. This design does not consider the
different requirements and nuances of other thermochemical conversion processes or other
hydrocarbon pathways.
Summary This report establishes a plausible case for achieving the 2017 Design Case for Fast Pyrolysis
conversion to bio-oils cost goals of delivering a biomass feedstock to the conversion facility at a
cost of $80/dry T (Table 26). The least-cost formulation approach (Appendix B) illustrates the
importance of cost estimates for determining the total cost of feedstock to a biorefinery,
including grower payment (access costs), logistics costs, and quality/dockage cost. It also
illustrates the importance of refining and updating these costs as analyses and data improve to
better inform the estimates. The following conclusions are presented to document the specific
areas that require additional attention to further strengthen and support the feedstock design
detailed in this report.
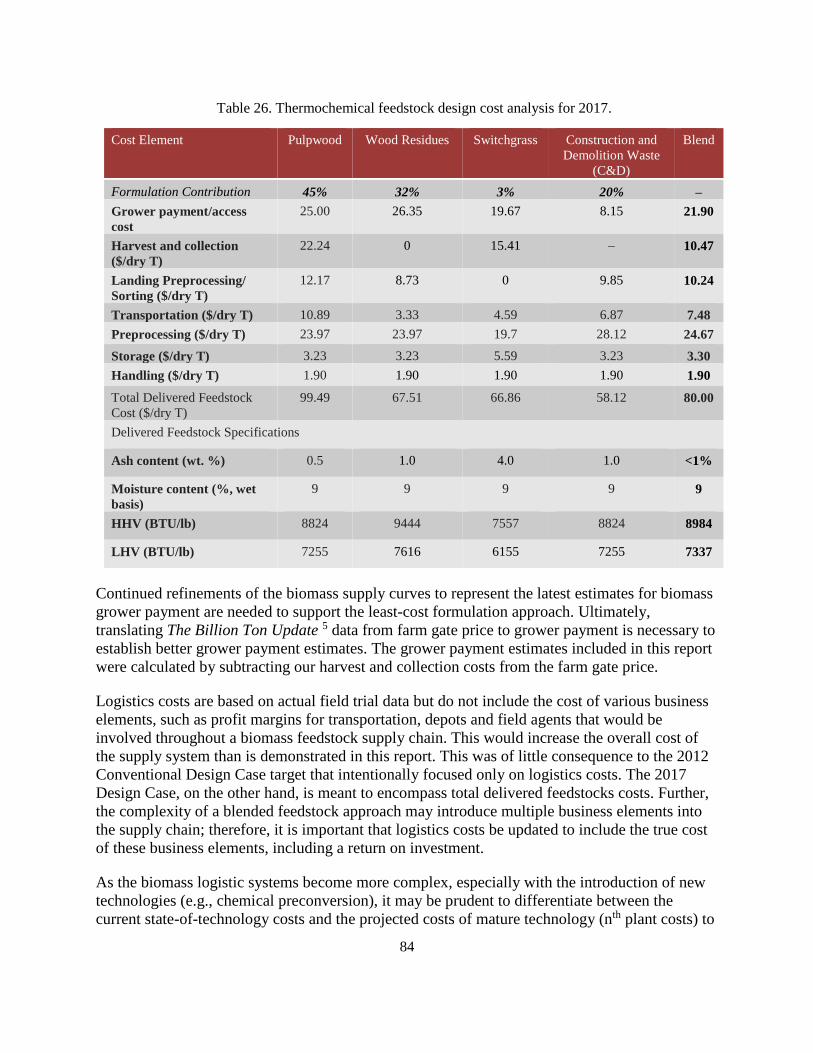
84
Table 26. Thermochemical feedstock design cost analysis for 2017.
Cost Element Pulpwood Wood Residues Switchgrass Construction and
Demolition Waste
(C&D)
Blend
Formulation Contribution 45% 32% 3% 20% –
Grower payment/access
cost
25.00 26.35 19.67 8.15 21.90
Harvest and collection
($/dry T)
22.24 0 15.41 – 10.47
Landing Preprocessing/
Sorting ($/dry T)
12.17 8.73 0 9.85 10.24
Transportation ($/dry T) 10.89 3.33 4.59 6.87 7.48
Preprocessing ($/dry T) 23.97 23.97 19.7 28.12 24.67
Storage ($/dry T) 3.23 3.23 5.59 3.23 3.30
Handling ($/dry T) 1.90 1.90 1.90 1.90 1.90
Total Delivered Feedstock
Cost ($/dry T)
99.49 67.51 66.86 58.12 80.00
Delivered Feedstock Specifications
Ash content (wt. %) 0.5 1.0 4.0 1.0 <1%
Moisture content (%, wet
basis)
9 9 9 9 9
HHV (BTU/lb) 8824 9444 7557 8824 8984
LHV (BTU/lb) 7255 7616 6155 7255 7337
Continued refinements of the biomass supply curves to represent the latest estimates for biomass
grower payment are needed to support the least-cost formulation approach. Ultimately,
translating The Billion Ton Update 5 data from farm gate price to grower payment is necessary to
establish better grower payment estimates. The grower payment estimates included in this report
were calculated by subtracting our harvest and collection costs from the farm gate price.
Logistics costs are based on actual field trial data but do not include the cost of various business
elements, such as profit margins for transportation, depots and field agents that would be
involved throughout a biomass feedstock supply chain. This would increase the overall cost of
the supply system than is demonstrated in this report. This was of little consequence to the 2012
Conventional Design Case target that intentionally focused only on logistics costs. The 2017
Design Case, on the other hand, is meant to encompass total delivered feedstocks costs. Further,
the complexity of a blended feedstock approach may introduce multiple business elements into
the supply chain; therefore, it is important that logistics costs be updated to include the true cost
of these business elements, including a return on investment.
As the biomass logistic systems become more complex, especially with the introduction of new
technologies (e.g., chemical preconversion), it may be prudent to differentiate between the
current state-of-technology costs and the projected costs of mature technology (nth plant costs) to

85
be consistent with conversion platform terminology. This was not an issue with conventional
feedstock designs that were intrinsically tied to current SOT; however, for technology
maturation, cost reductions may be worth considering for advanced feedstock designs.
Admittedly, it also is necessary to tighten the design and cost estimates around formulation and
the engineering systems for crushing the pellets and blending prior to insertion into the
conversion process. A better understanding of C&D availability, cost, and conversion
performance is needed to solidify its position in the 2017 Design Case. Likewise, the viability of
blended feedstocks as a whole depends on their conversion performance. DOE Bioenergy
Technology Office funded research is investigating the conversion performance of blends
(including C&D blends) and evaluating the compatibilities and incompatibilities of blendstocks.
The results of this research are critical to further development of blended feedstocks.
Feedstock Composition (In-feed quality specifications) The dry basis elemental composition of the feedstock, shown In Table 26, is identical to previous
NREL and PNNL design reports6. The composition was originally assumed to come from
pulpwood. Recent feedstock logistics work suggests the use of blended material may be required
to meet a cost target of $80/dry US ton while still meeting these specifications. For the purpose
of this report, it is assumed that any blended material provided to meet this feedstock elemental
composition will not adversely affect fast pyrolysis conversion efficiencies. Ongoing studies
being conducted jointly by INL, NREL and PNNL will provide experimental evidence of the
impact of blended feedstocks on fast pyrolysis and gasification processes. Future TEA will be
modified to reflect conversion impacts inferred from such studies. As has been described in prior
conversion design reports, the feedstock composition plays a critical role on overall process
design and economics, primarily with respect to high and low heating values, carbon as well as
high sensitivity to impurity components such as ash and metals in this design. The blended
uniform-format feedstock composition assumed here for purposes of future design case targets is
shown below, with supporting details described in the 2011 ethanol report 46. Also consistent
with prior design cases, the moisture content for the delivered feedstock is 10% or less.

86
Table 27. Delivered woody feedstock composition and processing assumptions for the fast pyrolysis and
hydrotreating design report 6.
Component Composition
(dry wt. %)
Carbon 50.94
Hydrogen 6.04
Nitrogen 0.17
Sulfur 0.03
Oxygen 41.90
Ash 0.90-1.0
Heating Value (Btu/lb) 8,601 HHV
7,996 LHV
Moisture (Bulk Wt. %) 10.0
Particle Size (inch) 1/4
Feedstock Selection Cost Estimation Expansion beyond highly productive resource areas has significant implications to the feedstock
supply chain. Sparse areas, whether due to reduced yields and/or higher dispersion, typically
increase feedstock logistics costs. Higher harvest and collection costs are incurred due to the
need to spread machinery ownership costs over fewer tons of biomass or the need to cover more
acres for the same quantity of biomass. Additionally, lower resource yields increase the supply
radius and biomass transportation distances. Under the 2012 Conventional Design, higher yield
areas allow refinery to be selective on the resource that they access.
Consider, for example, the scenarios depicted in Figure 30. This resource map illustrates a
county-level resource assessment of pulpwood farm gate at $60/dry T prices (this includes
grower payment, harvest, collection, and chipping costs). Farm gate price data were extracted
from The Billion Ton Update (BT2) 5 data supplied from Oak Ridge National Laboratory. It
should be noted that while the data is reported at a county-level, the data should be applied at the
wood shed (typically much larger area than a county) level because it was derived from the U.S.
Forest Service Forest Inventory and Assessment Data (FIA) 56, and does not equate to county
levels accurately. The FIA is a woodshed level assessment and therefore to use the data correctly
it is necessary to combine multiple counties.
The cost competitiveness of the 2012 Conventional Design was demonstrated in the scenario
located in southern Alabama, a high biomass yielding area 3. We further suggest, based on the
consistency of farm gate (i.e., landing) prices shown in this map, that the 2012 Conventional
Design can be deployed cost effectively in South Carolina. Commercial readiness of
conventional supply systems ultimately will be demonstrated by commercial-scale cellulosic
ethanol plants opening in these areas in the near future.

87
Figure 30. Total tons per county of available pulpwood at $60/dry T farm gate price. Yellow circles show
areas represented in the 2012 Conventional Design and the Relocated (2013) Design Case 5.
Access costs are calculated from the grower payment cost curves shown in Figure 6, which are
derived from historical prices. The 2017 Design Case basis discussion presented above provided
the least-cost formulation approach for reducing access costs by accessing multiple feedstocks.
With this approach, reduced quantities of each feedstock allows us to stay lower on the supply
curve than if we had to supply the entire refinery with any single feedstock. The impact of this
approach is shown in Table 28. The 2013 State of Technology assumes a 100% supply of
pulpwood of 909,100 dry T at an estimated $60/dry T farm gate or a $25/dry T access cost. In
comparison, the 2017 Design Case blend of 45% pulpwood, 32% wood residues, 20% C & D
waste, and 3% switchgrass results in a weighted average feedstock cost that is nearly 15% lower
than the access cost of pulpwood alone.

88
Table 28. Resource access cost estimate (U.S. DOE 2011 5 and INL MSW Data).
2013 SOT 2017 Target
Access Cost
(2011 $/dry T)
Tons Access Cost
(2011 $/dry T)
Tons
Pulpwood 25.00 909,100* 25.00 425,700*
Wood Residues NA NA 26.35 412,800**
Switchgrass NA NA 19.67 25,800
C&D NA NA 8.15 172,000
Totals 25.00 NA 21.90 1,036,300
*assumes 10% loss of material to debark/delimb 18.
**assumes 40% loss of material to clean up residues 19.
Quality Specification and Design Assumptions The 2012 Conventional Design focused on conventional woody harvest operations (i.e., felling
and/ or skidding operations are separate from landing preprocessing operations). In addition to
including switchgrass into the feedstock blend, the 2017 Design Case assumes that the
immaturity of the biomass market will limit the forest and farm owner’s investment in advanced
equipment options for both woody and herbaceous feedstocks. Therefore, with the exception of a
few proactive, early adopters, conventional forestry and farming operations will dominate the
market in the regions defined by the 2017 Design Case. Table 29 below summarizes the
assumptions and differences between the 2012 and 2017 logistic designs.

89
Table 29. Summary of assumptions underpinning progressive design implementations 57.
2012Conventional Design Baseline 2017 Design Case
Feedstock(s) Pulpwood Blended feedstock: pulpwood, wood
residues, switchgrass, and select
construction and demolition wastes (C
&D)
Grower
payment
Breakeven cost of
production
Pulpwood Calculated and modeled according to
specific location and resource
blend/formulation
Moisture Field dried to 40% Field dried to
40%
Arrives: Pulpwood chips 30% wood
residue chips 30%, switchgrass 20%,
and C& D ground 20%;
All dried to 9% pellets
Ash Debark/delimb Debark/delimb Debark/delimb pulpwood
Trommel screen residues
Wash and sort C& D waste
Blended ash content of <1%
Debarked pulpwood <1%, screened
wood residues 1.4%; washed and
sorted C&D 1.0 %
Logistics Uses existing systems Uses existing
systems
Pneumatics attached to hammermill
High-moisture densification
Quality controls
(passive)
Field drying to reduce
moisture
Ample available resource;
quality spec manually
selected
Field drying to
meet moisture
spec
Harvest/collection and storage best
management practices for pulpwood
and switchgrass
More rigorous field drying of
pulpwood and residues
Quality controls
(active)
Waste heat dryer Rotary drying Multiple resource
blending/formulation
High-moisture densification
High-efficiency pellet drying
Meets quality
target
Yes Yes Yes
Meets cost
target
Yes No Yes
Accesses
dispersed
resources
No No Yes
Relative to the woody feedstocks used in the Thermochemical Design Case, the 2013 baseline
and 2017 Design Case are similar in many ways for harvest and collection, but the latter has two
key changes to improve quality and production of woody materials. While each system is
discussed later, the key differences of the 2017 Design Case are first inclusion of woody residues

90
sourced from pulpwood operations, and second in-forest drying of whole tree piles at the landing
to achieve a more aggressive moisture content of 30%. In this design debarking and delimbing
are conducted to improve biomass quality. Construction and demolition wastes are considered to
enter the feedstock logistics system at the preprocessing stage and are therefore not discussed
here.
Feedstock Logistics 9.5.1 Harvest and Collection
Conventional wood harvest and collection relies on existing forestry technologies designed for
timber and pulp and paper production. Collection systems for woody material involve cutting the
feedstock with a tracked feller buncher and transporting the material to the landing with a
grapple skidder immediately after felling. Felling and skidding operations increase the overall
ash content of harvested whole-trees by introducing soil as it is moved in contact with the ground
from one location to the next 58. Thermochemical conversion processes via fast pyrolysis are
highly sensitive to silica, alkali, and transition metals found in most soils, impacting process
performance 59 60 61. In both the 2013 and 2017 Design Cases active management strategies are
employed during the landing preprocessing to reduce biomass ash content .Current forestry
production of pine pulpwood is reported to yield roundwood with a moisture content of 45-55%
and a whole-tree ash content ranging from 1% to 3% 62 63 64. The 2013 baseline assumes the
moisture content of pulpwood to be 50% for whole-trees entering storage.
Woody residues are generated through typical commercial forestry operations on southern pine
plantations where trees are harvested for pulpwood, chip-and-saw, and saw timber. Similar to the
above described collection of pulpwood, these operations bring whole trees to the landing where
they are delimbed and topped using a pull-through delimber. The roundwood is then loaded onto
trucks for delivery to the mill while the residues are piled at the landing. While not collected in
the 2013 baseline, the 2017 Design Case utilizes these materials as a fraction of the feedstock
blend. The baseline for residue moisture content is reported at 40%, while ash content has been
reported to range from 2% to 4% 47, 62, 65 66. Switchgrass, which is part of the blend, harvest and
collection systems use a conventional windrowing harvester and rectangular baler (3x4x8-ft).
Harvest and Collection Design Basis
The 2017 Design Case incorporates a chain flail debarker during preprocessing at the landing to
increase the quality of the final chipped pulpwood product. Therefore moisture and ash contents
of material entering storage are not different between the 2013 and 2017 Designs. However,
there is still impetus to increase the operational efficiency of roundwood collection for reducing
costs 67 68 This can be achieved through forest management shifts to short-rotation pine
plantations aimed at supplying bioenergy production, increased efficiency of harvesting
machinery, and increased efficiency of grapple skidder transportation. Research conducted by
Auburn University for the DOE High Tonnage Forest Biomass Project has demonstrated high
capacity grapplers to increase productivity by 80 tons per productive machine hour compared to
traditional systems 58 Figure 31 depicts a conventional skidder and a high capacity skidder.
Further development of such operational improvements will play a key role in reducing costs of
clean pulp chips for thermochemical conversion. In addition, transition of forest management to
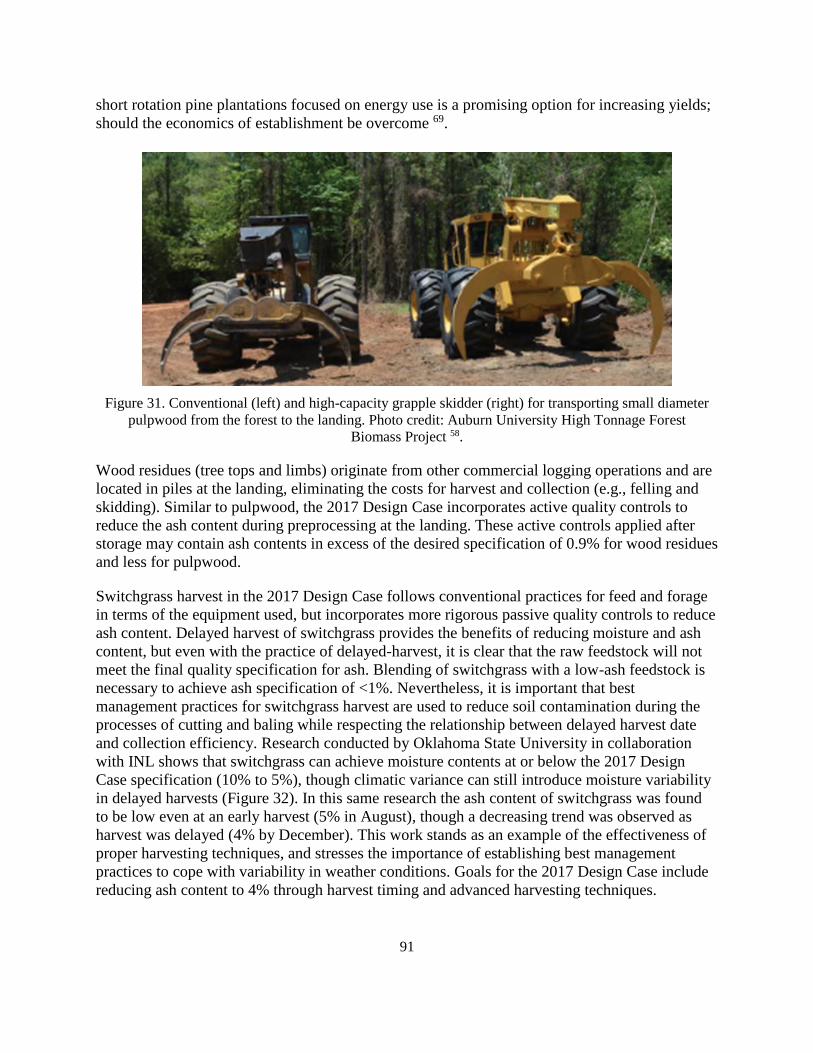
91
short rotation pine plantations focused on energy use is a promising option for increasing yields;
should the economics of establishment be overcome 69.
Figure 31. Conventional (left) and high-capacity grapple skidder (right) for transporting small diameter
pulpwood from the forest to the landing. Photo credit: Auburn University High Tonnage Forest
Biomass Project 58.
Wood residues (tree tops and limbs) originate from other commercial logging operations and are
located in piles at the landing, eliminating the costs for harvest and collection (e.g., felling and
skidding). Similar to pulpwood, the 2017 Design Case incorporates active quality controls to
reduce the ash content during preprocessing at the landing. These active controls applied after
storage may contain ash contents in excess of the desired specification of 0.9% for wood residues
and less for pulpwood.
Switchgrass harvest in the 2017 Design Case follows conventional practices for feed and forage
in terms of the equipment used, but incorporates more rigorous passive quality controls to reduce
ash content. Delayed harvest of switchgrass provides the benefits of reducing moisture and ash
content, but even with the practice of delayed-harvest, it is clear that the raw feedstock will not
meet the final quality specification for ash. Blending of switchgrass with a low-ash feedstock is
necessary to achieve ash specification of <1%. Nevertheless, it is important that best
management practices for switchgrass harvest are used to reduce soil contamination during the
processes of cutting and baling while respecting the relationship between delayed harvest date
and collection efficiency. Research conducted by Oklahoma State University in collaboration
with INL shows that switchgrass can achieve moisture contents at or below the 2017 Design
Case specification (10% to 5%), though climatic variance can still introduce moisture variability
in delayed harvests (Figure 32). In this same research the ash content of switchgrass was found
to be low even at an early harvest (5% in August), though a decreasing trend was observed as
harvest was delayed (4% by December). This work stands as an example of the effectiveness of
proper harvesting techniques, and stresses the importance of establishing best management
practices to cope with variability in weather conditions. Goals for the 2017 Design Case include
reducing ash content to 4% through harvest timing and advanced harvesting techniques.

92
Figure 32. Ash and moisture content of switchgrass harvested in Oklahoma, 2010 by Oklahoma State
University. Error bars represent one standard deviation. Ash samples for October, December, and January
are three samples comprised of six individual core samples composited.
Harvest and Collection Cost Estimation
Harvest and collection costs assume a removal rate of 15 dry T./acre for pulpwood 70, 4 dry
T./acre for residues 66, and 5-dry T./acre for switchgrass 71. These assumptions are consistent
with those used in the Billion Ton Update 5. Cost of harvest and collection is shown in Table 30.
The cost of ash at this point within the feedstock logistics system described in section 2.2 is not
yet applicable to pulpwood or wood residue, as the material will undergo active quality controls
during landing preprocessing. Switchgrass may be subjected to an ash dockage at this point in
the process if ash contents are greater than those needed by the feedstock blending process.

93
Table 30. Biomass harvest and collection cost estimates derived from INL analysis.
Machine 2013 SOT
(2011 $/dry T)
2017 Target (2011
$/dry T)
Total Total
Pulpwood
Felling 15.00 15.00
Yarding 7.24 7.24
Totals 22.24 22.24
Wood Residues*
Felling 0.00 0.00
Yarding 0.00 0.00
Totals 0.00 0.00
Switchgrass
Mower-conditioner 4.80 4.80
Baler 7.30 7.30
Bale collection/stacking 3.30 3.30
Totals 15.40 15.40
* Costed to harvest and collection of other process.
9.5.2 Storage 2013 State of Technology
Because the 2017 Design Case utilizes a blended feedstock, switchgrass storage must be
addressed. The storage of switchgrass occurs field side or at a similar on-farm unimproved storage
site. As for any baled feedstock, appropriate storage sites provide adequate drainage away from
the stack to prevent the accumulation of moisture around the stack, provide year-round access, and
preferably allow stack to be positioned in a North-South orientation to reduce moisture
accumulation on the north side of the stack 72. Tarped stacks are chosen as a balance between bale
protection against moisture infiltration, which leads to dry matter loss, and storage configuration
costs 73 22. Stacks are constructed with a self-propelled stacking bale wagon and are six bales high
and covered with a high-quality hay tarp. In order to prolong tarp life, it is also important that
adequate year-round maintenance be provided to periodically tighten the tarps 74. Biomass storage
systems in the current Design Case seek to provide a low-cost, low-maintenance, moisture-tolerant
solution that focus on maintaining moisture content <20%, minimizing dry matter loss and
preserving feedstock composition. Table 31 shows the assumed changes in moisture content
between the 2013 SOT and the 217 Design Case.

94
Table 31. Technical targets for biomass field storage of resources in the 2017 Design Case.
Process After Field Drying
Moisture Content
2013 SOT 2017 Target
Pulpwood 40 % 30%
Wood Residues 40% 30%
Switchgrass 20% 20%
Storage Design Basis
The 2017 Design Case is based on field drying for pulpwood and forest residues, both to 30%
moisture at the time the material enters landing preprocessing. Field studies on field drying of
short rotation southern pine pulpwood and residues have shown final moisture contents of 30%
to be achievable given adequate time 65 58 64.
Since chips are expected to enter storage at 30% moisture in the 2017 Design Case, it is
reasonable to assume that dry matter losses will be much less (nearly negligible) within the three
day holding window. The concerns of unplanned storage extensions, moisture addition, or
mechanical losses could increase this number, and therefore the 2017 Design Case assumes a
target chip-storage dry matter loss of 5%. Protection of chip piles with tarps could help to
prevent these losses, if the additional material and labor costs are merited, and their presence
does not interfere with regular loading and unloading of the piles. Storage of switchgrass is not
expected to deviate from the 2013 Design Case baseline. Due to the low moisture content
entering storage, the use of a tarp to protect from moisture addition through precipitation has
been shown to be sufficient and cost effective when properly applied.
Biomass Storage Cost Estimation
Cost estimations for biomass storage were calculated based on literature values from recent
reviews 74, the storage cover vendor’s information, and laboratory and field level experiments 72
(Table 32).
Table 32. Field-side storage cost estimation.
SOT (2011 $/dry T) Design Target (2011 $/dry T)
Storage Dockage Total Storage Dockage Total
Switchgrass N/A N/A N/A 5.50 0.00 5.50
9.5.3 Preprocessing
The 2017 Design Case that incorporates many improvements in preprocessing, including
pneumatics, high-moisture densification, and formulation/blending. Figure 33 outlines the
material flow given for these improvements. In the 2017 Design Case, substantial cost savings in
size reduction are realized by tailoring the preprocessing stages to the individual feedstock and
not applying a one size fits all approach. For example, pulpwood is debarked and delimbed and
then processed through a chipper to optimize retention of usable material; wood residues are
processed through a first stage grinder then separated by passing through a trommel screen;

95
switchgrass is processed through a grinder while Construction and Demolition (C&D) waste
undergoes sorting and a wash step.
Separation/sorting of C&D waste is required to remove recyclables (e.g., metal, paper, and
cardboard), contaminants (e.g., plastics and concrete), and other unusable fractions to isolate
only those fractions that meet the cost and quality requirements for biofuel feedstocks. In the
2017 Design Case, C&D is sorted to supply usable material for thermochemical conversion.
Prior to any preprocessing the ash content of untreated C&D waste fractions is estimated to be
about 6%. The application of a wash stage further reduces the ash content down to pure wood
levels of about 1 %.( Reference Appendix A).
Pulpwood
Switchgrass
C&D
Wood
Residues Stage II Size
Reduction with
PTS
Stage I Size
Reduction
(Chipper)
De-barker
Washing
Densification Drying
Stage I Size
Reduction
(Grinder)
C&D
Formulation
Sorting
Screening
Wood Residue
Landing Preprocessin
40% Material Loss
10% Material Loss
Figure 33. Material flow in the 2017 Design Case that incorporates many improvements in
preprocessing, including pneumatics, high-moisture densification, and formulation/blending.
The logistics of a blended feedstock scenario are certainly more complex than a single-feedstock
scenario. The 2017 Design Case assumes that preprocessing of C&D will occur at a
preprocessing depot located at the source landfill or refuse transfer station, and C&D pellets will
be shipped from the depot to the blending depot located within proximity of the biorefinery.
Switchgrass that is formatted in large square bales will be delivered to the blending depot, where
they will be processed into pellets. Pulpwood and wood residues will be initially processed at the
landing for initial size reduction and ash mitigation then transported to a processing facility for
pelletization. The pulpwood, wood residues, switchgrass, and C&D pellets will be queued up in
blending bunkers or silos and blended to specification prior to being fed into the conversion
process. The pellets of the four blendstocks (i.e., pulpwood, wood residues, switchgrass, and
C&D) are then metered from the blending bunkers in the ratios required of the blended feedstock
and are conveyed from the preprocessing facility/depot to the conversion facility.

96
State of Technology:
For the 2017 Design Case, a geometric mean particle size of ¼- in. is the target size specification
for the thermochemical conversion process design under development by PNNL. As the target
size specification is the same as biochemical conversion, size reduction system to the final
particle size specification required by the end user will be the same as biochemical conversion.
2013 state of technology follows sequential two stage size reduction described in section
8.5.3.1(Table 33).
Table 33. Size-reduction design basis.
2013 SOT 2017 Target
Equipment Used Screen
Size
Capacity
Ton/hr
Capacity
Ton/hr
First Stage Size Reduction
Pulpwood Chipper 2 in. 17 17
Wood Residue Grinder 2in.
Second Stage Size Reduction
Pulpwood Hammer mill ¼ in. 5 6.5
Wood Residue Hammer mill ¼ in. 5 6.5
Size Reduction Cost Estimation
Milling cost estimation is based on vendor-supplied information and equipment performance
from typical machine performance and process demonstration unit data and is shown in Table
34.
Table 34. Size reduction cost estimates.
2013 SOT
(2011 $/dry T)
2017 Target
(2011 $/dry T)
Total Total
Pulpwood
Chipper 6.10 6.10
Debark/delimb 6.10 6.10
Hammer Mill 17.09 13.97
Total 29.29 26.17
Wood Residue
Grinder 5.39 5.39
Trommel Screen 3.32 3.32
Hammer Mill 17.09 13.97
Total 25.08 22.70
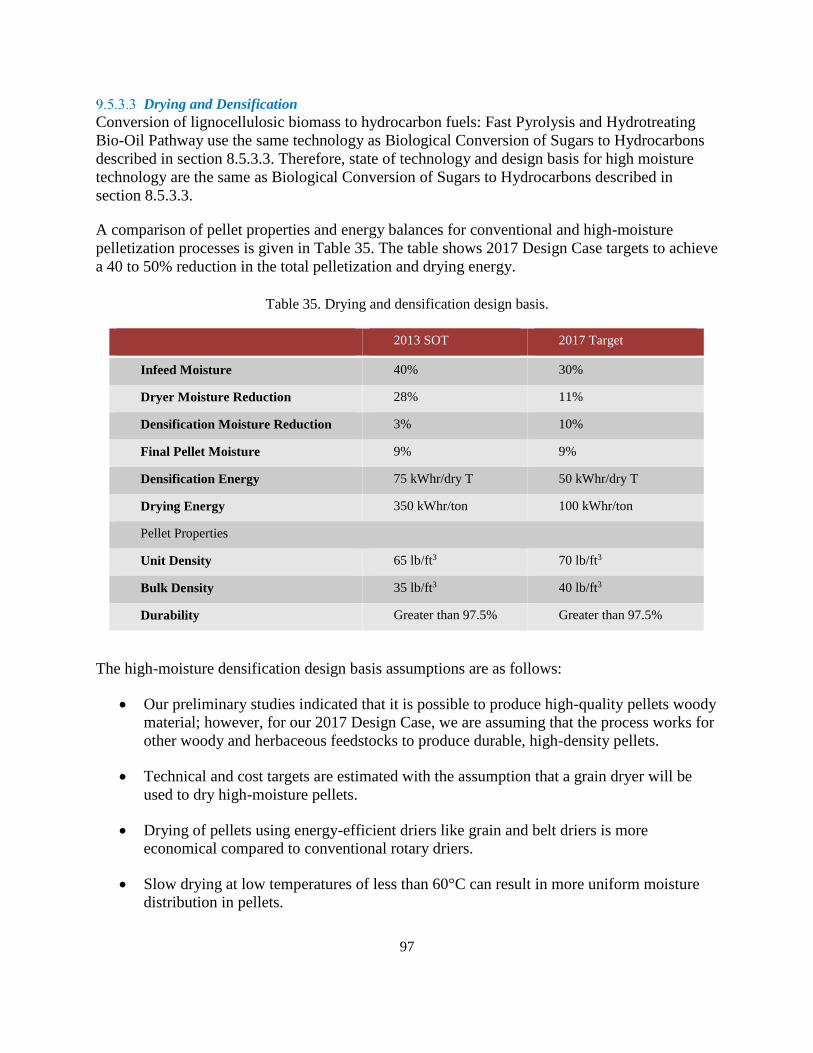
97
Drying and Densification
Conversion of lignocellulosic biomass to hydrocarbon fuels: Fast Pyrolysis and Hydrotreating
Bio-Oil Pathway use the same technology as Biological Conversion of Sugars to Hydrocarbons
described in section 8.5.3.3. Therefore, state of technology and design basis for high moisture
technology are the same as Biological Conversion of Sugars to Hydrocarbons described in
section 8.5.3.3.
A comparison of pellet properties and energy balances for conventional and high-moisture
pelletization processes is given in Table 35. The table shows 2017 Design Case targets to achieve
a 40 to 50% reduction in the total pelletization and drying energy.
Table 35. Drying and densification design basis.
2013 SOT 2017 Target
Infeed Moisture 40% 30%
Dryer Moisture Reduction 28% 11%
Densification Moisture Reduction 3% 10%
Final Pellet Moisture 9% 9%
Densification Energy 75 kWhr/dry T 50 kWhr/dry T
Drying Energy 350 kWhr/ton 100 kWhr/ton
Pellet Properties
Unit Density 65 lb/ft3 70 lb/ft3
Bulk Density 35 lb/ft3 40 lb/ft3
Durability Greater than 97.5% Greater than 97.5%
The high-moisture densification design basis assumptions are as follows:
Our preliminary studies indicated that it is possible to produce high-quality pellets woody
material; however, for our 2017 Design Case, we are assuming that the process works for
other woody and herbaceous feedstocks to produce durable, high-density pellets.
Technical and cost targets are estimated with the assumption that a grain dryer will be
used to dry high-moisture pellets.
Drying of pellets using energy-efficient driers like grain and belt driers is more
economical compared to conventional rotary driers.
Slow drying at low temperatures of less than 60°C can result in more uniform moisture
distribution in pellets.
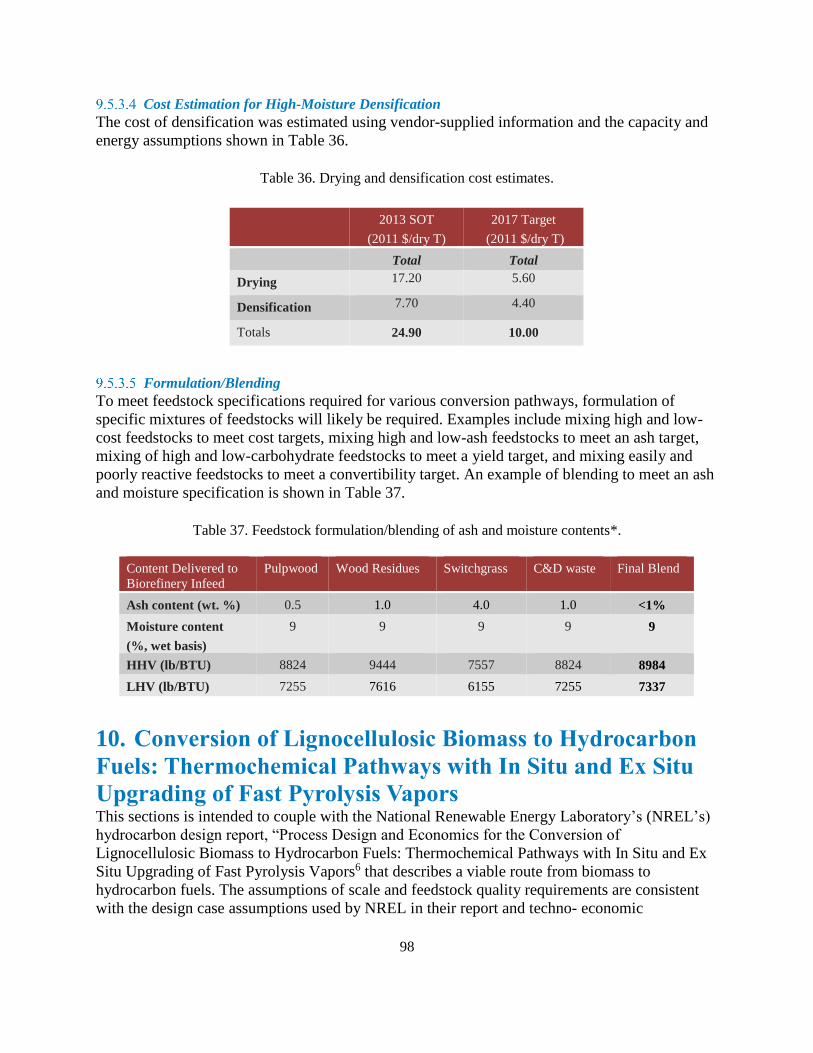
98
Cost Estimation for High-Moisture Densification
The cost of densification was estimated using vendor-supplied information and the capacity and
energy assumptions shown in Table 36.
Table 36. Drying and densification cost estimates.
2013 SOT
(2011 $/dry T)
2017 Target
(2011 $/dry T)
Total Total
Drying 17.20 5.60
Densification 7.70 4.40
Totals 24.90 10.00
Formulation/Blending
To meet feedstock specifications required for various conversion pathways, formulation of
specific mixtures of feedstocks will likely be required. Examples include mixing high and low-
cost feedstocks to meet cost targets, mixing high and low-ash feedstocks to meet an ash target,
mixing of high and low-carbohydrate feedstocks to meet a yield target, and mixing easily and
poorly reactive feedstocks to meet a convertibility target. An example of blending to meet an ash
and moisture specification is shown in Table 37.
Table 37. Feedstock formulation/blending of ash and moisture contents*.
Content Delivered to
Biorefinery Infeed
Pulpwood Wood Residues Switchgrass C&D waste Final Blend
Ash content (wt. %) 0.5 1.0 4.0 1.0 <1%
Moisture content
(%, wet basis)
9 9 9 9 9
HHV (lb/BTU) 8824 9444 7557 8824 8984
LHV (lb/BTU) 7255 7616 6155 7255 7337
10. Conversion of Lignocellulosic Biomass to Hydrocarbon
Fuels: Thermochemical Pathways with In Situ and Ex Situ
Upgrading of Fast Pyrolysis Vapors This sections is intended to couple with the National Renewable Energy Laboratory’s (NREL’s)
hydrocarbon design report, “Process Design and Economics for the Conversion of
Lignocellulosic Biomass to Hydrocarbon Fuels: Thermochemical Pathways with In Situ and Ex
Situ Upgrading of Fast Pyrolysis Vapors6 that describes a viable route from biomass to
hydrocarbon fuels. The assumptions of scale and feedstock quality requirements are consistent
with the design case assumptions used by NREL in their report and techno- economic

99
assessments. This design does not consider the different requirements and nuances of other
thermochemical conversion processes or other hydrocarbon pathways.
Summary This report establishes a plausible case for achieving the 2017 Design Case for Fast Pyrolysis
conversion to bio-oils cost goals of delivering a biomass feedstock to the conversion facility at a
cost of $80/dry T (Table 38). The least-cost formulation approach (Appendix B) illustrates the
importance of cost estimates for determining the total cost of feedstock to a biorefinery,
including grower payment (access costs), logistics costs, and quality/dockage cost. It also
illustrates the importance of refining and updating these costs as analyses and data improve to
better inform the estimates. The following conclusions are presented to document the specific
areas that require additional attention to further strengthen and support the feedstock design
detailed in this report.

100
Table 38. Thermochemical feedstock design cost analysis for 2017.
Cost Element Pulpwood Wood Residues Switchgrass Construction and
Demolition Waste
(C&D)
Blend
Formulation Contribution 45% 32% 3% 20% –
Grower payment/
access cost
25.00 26.35 19.67 8.15 21.90
Harvest and Collection
($/dry T)
22.24 0 15.41 – 10.47
Landing Preprocessing/
Sorting ($/dry T)
12.17 8.73 0 9.85 10.24
Transportation ($/dry T) 10.89 3.33 4.5 6.87 7.48
Preprocessing ($/dry T) 23.97 23.97 19.7 28.12 24.67
Storage ($/dry T) 3.23 3.23 5.5 3.23 3.30
Handling ($/dry T) 1.90 1.90 1.90 1.90 1.90
Total Delivered Feedstock
Cost ($/dry T)
99.49 67.51 66.68 58.12 80.00
Delivered Feedstock Specifications
Ash content (wt. %) 0.5 1.0 4.0 1.0 <1%
Moisture content
(%, wet basis)
9 9 9 9 9
HHV (BTU/lb) 8824 9444 7557 8824 8984
LHV (BTU/lb) 7255 7616 6155 7255 7337
Continued refinements of the biomass supply curves to represent the latest estimates for biomass
grower payment are needed to support the least-cost formulation approach. Ultimately,
translating The Billion Ton Update 5 data from farm gate price to grower payment is necessary to
establish better grower payment estimates. The grower payment estimates included in this report
were calculated by subtracting our harvest and collection costs from the farm gate price.
Logistics costs are based on actual field trial data but do not include the cost of various business
elements, such as profit margins for transportation, depots and field agents that would be
involved throughout a biomass feedstock supply chain. This would increase the overall cost of
the supply system than is demonstrated in this report. This was of little consequence to the 2012
Conventional Design Case target that intentionally focused only on logistics costs. The 2017
Design Case, on the other hand, is meant to encompass total delivered feedstocks costs. Further,
the complexity of a blended feedstock approach may introduce multiple business elements into
the supply chain; therefore, it is important that logistics costs be updated to include the true cost
of these business elements, including a return on investment.
As the biomass logistic systems become more complex, especially with the introduction of new
technologies (e.g., chemical preconversion), it may be prudent to differentiate between the

101
current state-of-technology costs and the projected costs of mature technology (nth plant costs) to
be consistent with conversion platform terminology. This was not an issue with conventional
feedstock designs that were intrinsically tied to current SOT; however, for technology
maturation, cost reductions may be worth considering for advanced feedstock designs.
Admittedly, it also is necessary to tighten the design and cost estimates around formulation and
the engineering systems for crushing the pellets and blending prior to insertion into the
conversion process. A better understanding of C&D availability, cost, and conversion
performance is needed to solidify its position in the 2017 Design Case. Likewise, the viability of
blended feedstocks as a whole depends on their conversion performance. DOE Bioenergy
Technology Office funded research is investigating the conversion performance of blends
(including C&D blends) and evaluating the compatibilities and incompatibilities of blendstocks.
The results of this research are critical to further development of blended feedstocks.
Feedstock Composition (In-feed quality specifications) The dry basis elemental composition of the feedstock, shown in Table 39, is similar to previous
NREL and PNNL design reports6. The composition was originally assumed to come from
pulpwood. Recent feedstock logistics work suggests the use of blended material may be required
to meet a cost target of $80/dry US ton while still meeting these specifications. For the purpose
of this report, it is assumed that any blended material provided to meet this feedstock elemental
composition will not adversely affect fast pyrolysis conversion efficiencies. Ongoing studies
being conducted jointly by INL, NREL and PNNL will provide experimental evidence of the
impact of blended feedstocks on fast pyrolysis and gasification processes. Future TEA will be
modified to reflect conversion impacts inferred from such studies. As has been described in prior
conversion design reports, the feedstock composition plays a critical role on overall process
design and economics, primarily with respect to high and low heating values, carbon as well as
high sensitivity to impurity components such as ash and metals in this design. The blended
uniform-format feedstock composition assumed here for purposes of future design case targets is
shown below, with supporting details described in the 2011 ethanol report 46. Also consistent
with prior design cases, the moisture content for the delivered feedstock is 10% or less.
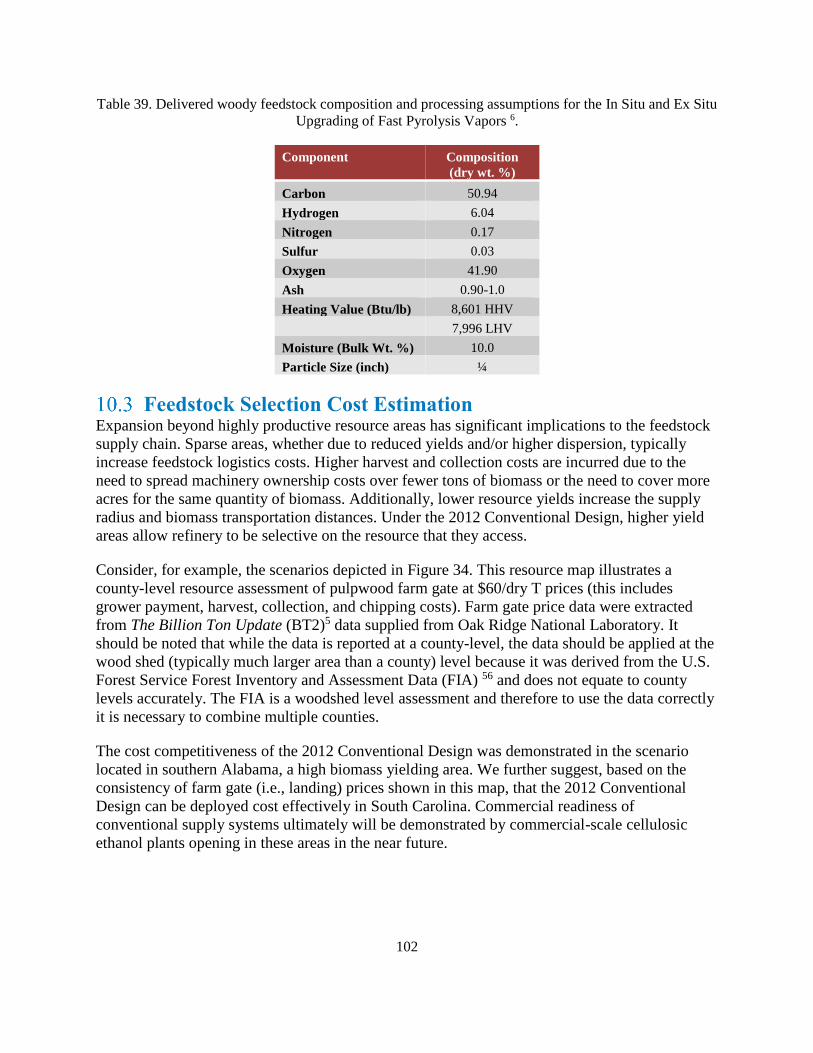
102
Table 39. Delivered woody feedstock composition and processing assumptions for the In Situ and Ex Situ
Upgrading of Fast Pyrolysis Vapors 6.
Component Composition
(dry wt. %)
Carbon 50.94
Hydrogen 6.04
Nitrogen 0.17
Sulfur 0.03
Oxygen 41.90
Ash 0.90-1.0
Heating Value (Btu/lb) 8,601 HHV
7,996 LHV
Moisture (Bulk Wt. %) 10.0
Particle Size (inch) ¼
Feedstock Selection Cost Estimation Expansion beyond highly productive resource areas has significant implications to the feedstock
supply chain. Sparse areas, whether due to reduced yields and/or higher dispersion, typically
increase feedstock logistics costs. Higher harvest and collection costs are incurred due to the
need to spread machinery ownership costs over fewer tons of biomass or the need to cover more
acres for the same quantity of biomass. Additionally, lower resource yields increase the supply
radius and biomass transportation distances. Under the 2012 Conventional Design, higher yield
areas allow refinery to be selective on the resource that they access.
Consider, for example, the scenarios depicted in Figure 34. This resource map illustrates a
county-level resource assessment of pulpwood farm gate at $60/dry T prices (this includes
grower payment, harvest, collection, and chipping costs). Farm gate price data were extracted
from The Billion Ton Update (BT2)5 data supplied from Oak Ridge National Laboratory. It
should be noted that while the data is reported at a county-level, the data should be applied at the
wood shed (typically much larger area than a county) level because it was derived from the U.S.
Forest Service Forest Inventory and Assessment Data (FIA) 56 and does not equate to county
levels accurately. The FIA is a woodshed level assessment and therefore to use the data correctly
it is necessary to combine multiple counties.
The cost competitiveness of the 2012 Conventional Design was demonstrated in the scenario
located in southern Alabama, a high biomass yielding area. We further suggest, based on the
consistency of farm gate (i.e., landing) prices shown in this map, that the 2012 Conventional
Design can be deployed cost effectively in South Carolina. Commercial readiness of
conventional supply systems ultimately will be demonstrated by commercial-scale cellulosic
ethanol plants opening in these areas in the near future.
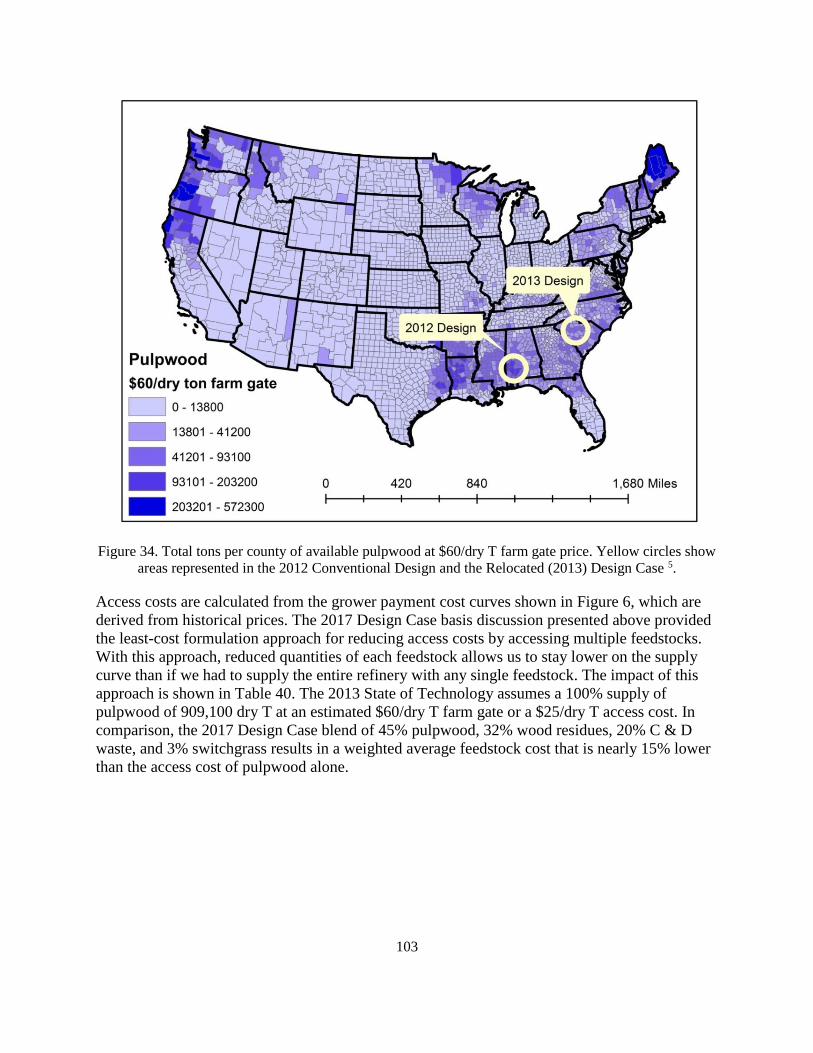
103
Figure 34. Total tons per county of available pulpwood at $60/dry T farm gate price. Yellow circles show
areas represented in the 2012 Conventional Design and the Relocated (2013) Design Case 5.
Access costs are calculated from the grower payment cost curves shown in Figure 6, which are
derived from historical prices. The 2017 Design Case basis discussion presented above provided
the least-cost formulation approach for reducing access costs by accessing multiple feedstocks.
With this approach, reduced quantities of each feedstock allows us to stay lower on the supply
curve than if we had to supply the entire refinery with any single feedstock. The impact of this
approach is shown in Table 40. The 2013 State of Technology assumes a 100% supply of
pulpwood of 909,100 dry T at an estimated $60/dry T farm gate or a $25/dry T access cost. In
comparison, the 2017 Design Case blend of 45% pulpwood, 32% wood residues, 20% C & D
waste, and 3% switchgrass results in a weighted average feedstock cost that is nearly 15% lower
than the access cost of pulpwood alone.
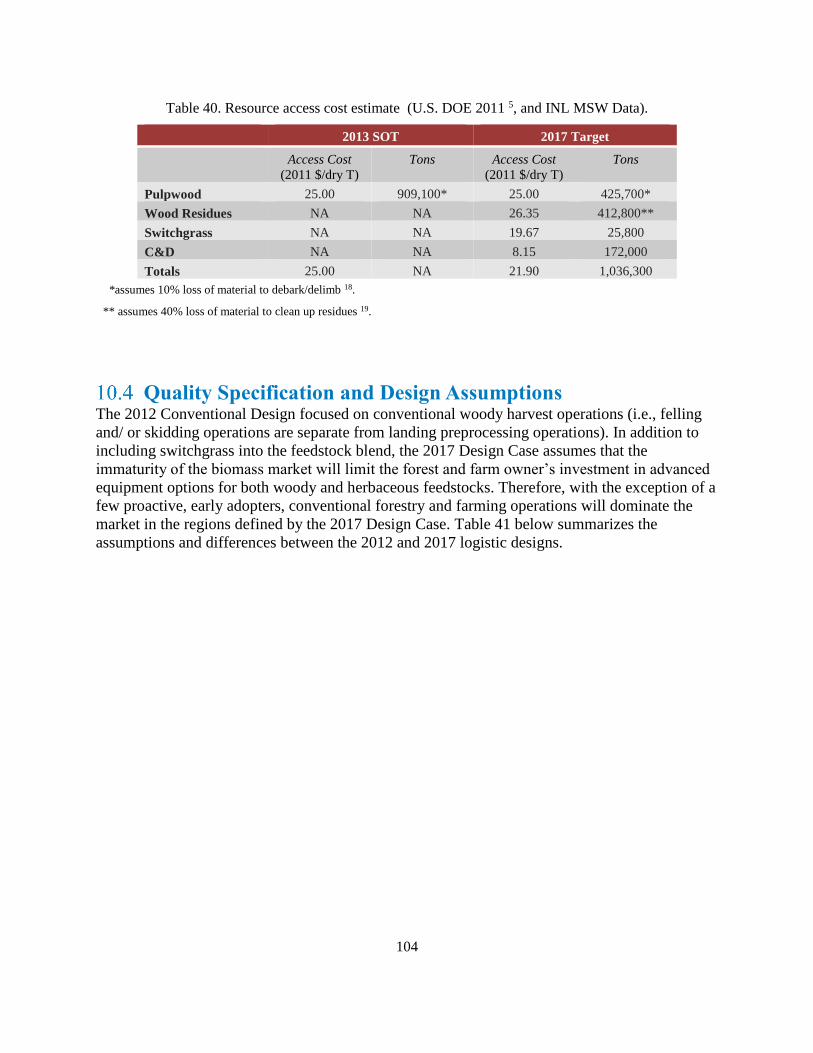
104
Table 40. Resource access cost estimate (U.S. DOE 2011 5, and INL MSW Data).
2013 SOT 2017 Target
Access Cost
(2011 $/dry T)
Tons Access Cost
(2011 $/dry T)
Tons
Pulpwood 25.00 909,100* 25.00 425,700*
Wood Residues NA NA 26.35 412,800**
Switchgrass NA NA 19.67 25,800
C&D NA NA 8.15 172,000
Totals 25.00 NA 21.90 1,036,300
*assumes 10% loss of material to debark/delimb 18.
** assumes 40% loss of material to clean up residues 19.
Quality Specification and Design Assumptions The 2012 Conventional Design focused on conventional woody harvest operations (i.e., felling
and/ or skidding operations are separate from landing preprocessing operations). In addition to
including switchgrass into the feedstock blend, the 2017 Design Case assumes that the
immaturity of the biomass market will limit the forest and farm owner’s investment in advanced
equipment options for both woody and herbaceous feedstocks. Therefore, with the exception of a
few proactive, early adopters, conventional forestry and farming operations will dominate the
market in the regions defined by the 2017 Design Case. Table 41 below summarizes the
assumptions and differences between the 2012 and 2017 logistic designs.

105
Table 41. Summary of assumptions underpinning progressive design implementations 57.
2012 Conventional
Design
Baseline 2017 Design Case
Feedstock(s) Pulpwood Pulpwood Blended feedstock: pulpwood (45%), wood
residues (32%), switchgrass (3%), and select
construction and demolition wastes (C
&D)(20%)
Grower
payment
Breakeven cost of
production
Increases based
on marginal
cost differential
Calculated and modeled according to specific
location and resource blend/formulation
Moisture Field dried to 40% Field dried to
40%
Arrives: Pulpwood chips 30% wood residue
chips 30%, switchgrass 20%, and C& D
ground 20%;
All dried to 9% pellets
Ash Debark/delimb Debark/delimb Debark/delimb pulpwood
Trommel screen residues
Wash and sort C& D waste
Blended ash content of <1%
Debarked pulpwood <1%, screened wood
residues 1.4%; washed and sorted C&D 1.0 %
Logistics Uses existing
systems
Uses existing
systems
Pneumatics attached to hammer mill
High-moisture densification
Quality
controls
(passive)
Field drying to
reduce moisture
Ample available
resource; quality
spec manually
selected
Field drying to
meet moisture
spec
Harvest/collection and storage best management
practices for pulpwood and switchgrass
More rigorous field drying of pulpwood and
residues
Quality
controls
(active)
Waste heat dryer Rotary drying Multiple resource blending/formulation
High-moisture densification
High-efficiency pellet drying
Meets quality
target
Yes Yes Yes
Meets cost
target
Yes No Yes
Accesses
dispersed
resources
No No Yes

106
Relative to the woody feedstocks used in the Thermochemical Design Case, the 2013 baseline
and 2017 Design Case are similar in many ways for harvest and collection, but the latter has two
key changes to improve quality and production of woody materials. While each system is
discussed later, the key differences of the 2017 Design Case are first inclusion of woody residues
sourced from pulpwood operations, and second in-forest drying of whole tree piles at the landing
to achieve a more aggressive moisture content of 30% .In this design debarking and delimbing
are conducted to improve biomass quality. Construction and demolition wastes are considered to
enter the feedstock logistics system at the preprocessing stage and are therefore not discussed
here.
Feedstock Logistics 10.5.1 Harvest and Collection
Conventional wood harvest and collection relies on existing forestry technologies designed for
timber and pulp and paper production. Collection systems for woody material involve cutting the
feedstock with a tracked feller buncher and transporting the material to the landing with a
grapple skidder immediately after felling. Felling and skidding operations increase the overall
ash content of harvested whole-trees by introducing soil as it is moved in contact with the ground
from one location to the next 58. In Situ and Ex Situ Upgrading of Fast Pyrolysis Vapors are
highly sensitive to silica, alkali, and transition metals found in most soils, impacting process
performance 59 60 61. In both the 2013 and 2017 Design Cases active management strategies are
employed during the landing preprocessing to improve biomass ash content .Current forestry
production of pine pulpwood is reported to yield roundwood with a moisture content of 45-55%
and a whole-tree ash content ranging from 1% to 3% 62 63 64 . The 2013 baseline assumes the
moisture content of pulpwood to be 50% for whole-trees entering storage.
Woody residues are generated through typical commercial forestry operations on southern pine
plantations where trees are harvested for pulpwood, chip-and-saw, and saw timber. Similar to the
above described collection of pulpwood, these operations bring whole trees to the landing where
they are delimbed and topped using a pull-through delimber. The roundwood is then loaded onto
trucks for delivery to the mill while the residues are piled at the landing. While not collected in
the 2013 baseline, the 2017 Design Case utilizes these materials as a fraction of the feedstock
blend. The baseline for residue moisture content is reported at 40%, while ash content has been
reported to range from 2% to 4% 47, 62, 65 66. Switchgrass, which is part of the blend, harvest and
collection systems use a conventional windrowing harvester and rectangular baler (3x4x8-ft).
Harvest and Collection Design Basis
The 2017 Design Case incorporates a chain flail debarker during preprocessing at the landing to
increase the quality of the final chipped pulpwood product. Therefore, moisture and ash contents
of material entering storage are not different between the 2013 and 2017 Designs. However,
there is still impetus to increase the operational efficiency of roundwood collection for reducing
costs 67 68 .This can be achieved through forest management shifts to short-rotation pine
plantations aimed at supplying bioenergy production, increased efficiency of harvesting
machinery, and increased efficiency of grapple skidder transportation. Research conducted by
Auburn University for the DOE High Tonnage Forest Biomass Project has demonstrated high
capacity grapplers to increase productivity by 80 tons per productive machine hour compared to

107
traditional systems 58. Figure 35 depicts a conventional skidder and a high capacity skidder.
Further development of such operational improvements will play a key role in reducing costs of
clean pulp chips for thermochemical conversion. In addition, transition of forest management to
short rotation pine plantations focused on energy use is a promising option for increasing yields;
should the economics of establishment be overcome 69.
Figure 35. Conventional (left) and high-capacity grapple skidder (right) for transporting small diameter
pulpwood from the forest to the landing. Photo credit: Auburn University High Tonnage Forest
Biomass Project 58.
Wood residues (tree tops and limbs) originate from other commercial logging operations and are
located in piles at the landing, eliminating the costs for harvest and collection (e.g., felling and
skidding). Similar to pulpwood, the 2017 Design Case incorporates active quality controls to
reduce the ash content during preprocessing at the landing. These active controls applied after
storage may contain ash contents in excess of the desired specification of 0.9% for wood residues
and less for pulpwood.
Switchgrass harvest in the 2017 Design Case follows conventional practices for feed and forage
in terms of the equipment used, but incorporates more rigorous passive quality controls to reduce
ash content. Delayed harvest of switchgrass provides the benefits of reducing moisture and ash
content, but even with the practice of delayed-harvest, it is clear that the raw feedstock will not
meet the final quality specification for ash. Blending of switchgrass with a low-ash feedstock is
necessary to achieve ash specification of <1%. Nevertheless, it is important that best
management practices for switchgrass harvest are used to reduce soil contamination during the
processes of cutting and baling while respecting the relationship between delayed harvest date
and collection efficiency. Research conducted by Oklahoma State University in collaboration
with INL shows that switchgrass can achieve moisture contents at or below the 2017 Design
Case specification (10% to 5%), though climatic variance can still introduce moisture variability
in delayed harvests (Figure 36). In this same research the ash content of switchgrass was found
to be low even at an early harvest (5% in August), though a decreasing trend was observed as
harvest was delayed (4% by December). This work stands as an example of the effectiveness of
proper harvesting techniques, and stresses the importance of establishing best management

108
practices to cope with variability in weather conditions. Goals for the 2017 Design Case include
reducing ash content to 4% through harvest timing and advanced harvesting techniques.
Figure 36. Ash and moisture content of switchgrass harvested in Oklahoma, 2010 by Oklahoma State
University. Error bars represent one standard deviation. Ash samples for October, December, and
January are three samples comprised of six individual core samples composited.
Harvest and Collection Cost Estimation
Harvest and collection costs assume a removal rate of 15 dry T/acre for pulpwood 70, 4 dry
T/acre for residues 66, and 5-dry T/acre for switchgrass 71. These assumptions are consistent with
those used in the Billion Ton Update 5. Cost of harvest and collection is shown in Table 42. The
cost of ash at this point within the feedstock logistics system described in section 4 is not yet
applicable to pulpwood or wood residue, as the material will undergo active quality controls
during landing preprocessing. Switchgrass may be subjected to an ash dockage at this point in
the process if ash contents are greater than those needed by the feedstock blending process.

109
Table 42. Biomass harvest and collection cost estimates derived from INL analysis.
Machine 2013 SOT
(2011 $/dry T)
2017 Target (2011
$/dry T)
Total Total
Pulpwood
Felling 15.00 15.00
Yarding 7.24 7.24
Totals 22.24 22.24
Wood Residues*
Felling 0.00 0.00
Yarding 0.00 0.00
Totals 0.00 0.00
Switchgrass
Mower-conditioner 4.80 4.80
Baler 7.30 7.30
Bale collection/stacking 3.30 3.30
Totals 15.40 15.40
* Costed to harvest and collection of other process.
10.5.2 Storage 2013 State of Technology
Because the 2017 Design Case utilizes a blended feedstock, switchgrass storage must be
addressed. The storage of switchgrass occurs field side or at a similar on-farm unimproved storage
site. As for any baled feedstock, appropriate storage sites provide adequate drainage away from
the stack to prevent the accumulation of moisture around the stack, provide year-round access, and
preferably allow stack to be positioned in a North-South orientation to reduce moisture
accumulation on the north side of the stack 72. Tarped stacks are chosen as a balance between bale
protection against moisture infiltration, which leads to dry matter loss, and storage configuration
costs 73 22. Stacks are constructed with a self-propelled stacking bale wagon and are six bales high
and covered with a high-quality hay tarp. In order to prolong tarp life, it is also important that
adequate year-round maintenance be provided to periodically tighten the tarps 74. Biomass storage
systems in the current Design Case seek to provide a low-cost, low-maintenance, moisture-tolerant
solution that focus on maintaining moisture content <20%, minimizing dry matter loss and
preserving feedstock composition. Table 43 shows the assumed changes in moisture content
between the 2013 SOT and the 2017 Design Case.
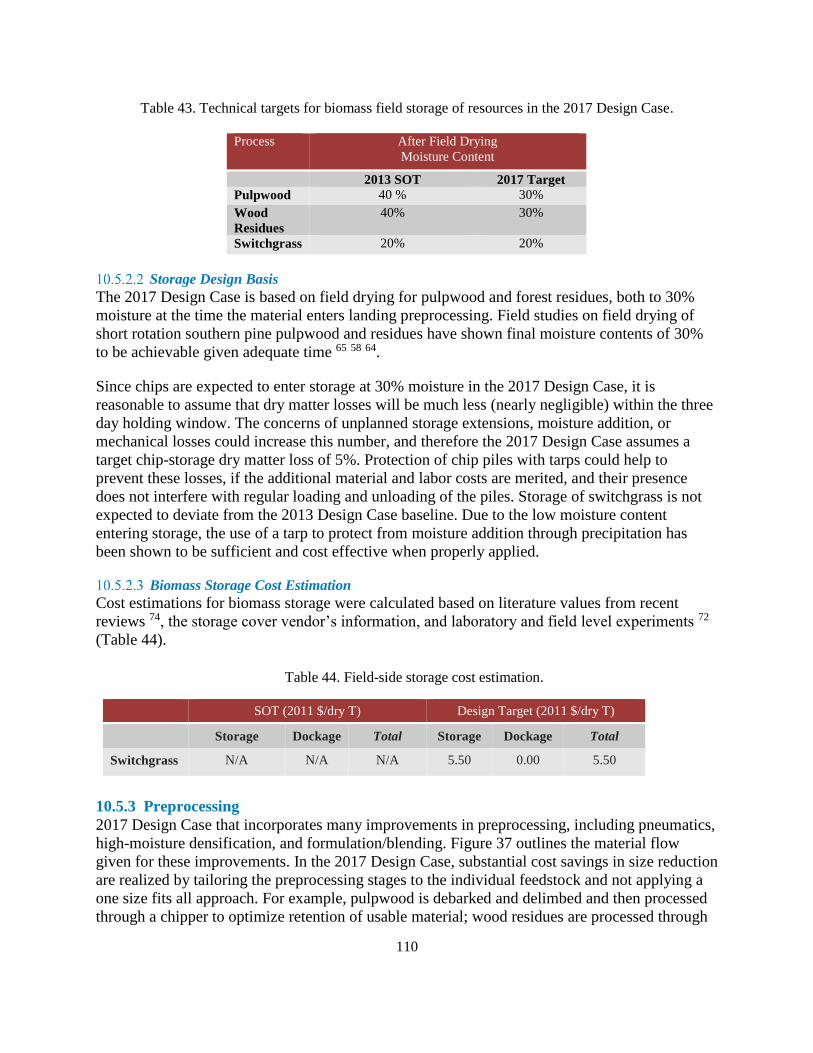
110
Table 43. Technical targets for biomass field storage of resources in the 2017 Design Case.
Process After Field Drying
Moisture Content
2013 SOT 2017 Target
Pulpwood 40 % 30%
Wood
Residues
40% 30%
Switchgrass 20% 20%
Storage Design Basis
The 2017 Design Case is based on field drying for pulpwood and forest residues, both to 30%
moisture at the time the material enters landing preprocessing. Field studies on field drying of
short rotation southern pine pulpwood and residues have shown final moisture contents of 30%
to be achievable given adequate time 65 58 64.
Since chips are expected to enter storage at 30% moisture in the 2017 Design Case, it is
reasonable to assume that dry matter losses will be much less (nearly negligible) within the three
day holding window. The concerns of unplanned storage extensions, moisture addition, or
mechanical losses could increase this number, and therefore the 2017 Design Case assumes a
target chip-storage dry matter loss of 5%. Protection of chip piles with tarps could help to
prevent these losses, if the additional material and labor costs are merited, and their presence
does not interfere with regular loading and unloading of the piles. Storage of switchgrass is not
expected to deviate from the 2013 Design Case baseline. Due to the low moisture content
entering storage, the use of a tarp to protect from moisture addition through precipitation has
been shown to be sufficient and cost effective when properly applied.
Biomass Storage Cost Estimation
Cost estimations for biomass storage were calculated based on literature values from recent
reviews 74, the storage cover vendor’s information, and laboratory and field level experiments 72
(Table 44).
Table 44. Field-side storage cost estimation.
SOT (2011 $/dry T) Design Target (2011 $/dry T)
Storage Dockage Total Storage Dockage Total
Switchgrass N/A N/A N/A 5.50 0.00 5.50
10.5.3 Preprocessing
2017 Design Case that incorporates many improvements in preprocessing, including pneumatics,
high-moisture densification, and formulation/blending. Figure 37 outlines the material flow
given for these improvements. In the 2017 Design Case, substantial cost savings in size reduction
are realized by tailoring the preprocessing stages to the individual feedstock and not applying a
one size fits all approach. For example, pulpwood is debarked and delimbed and then processed
through a chipper to optimize retention of usable material; wood residues are processed through

111
a first stage grinder then separated by passing through a trommel screen; switchgrass is
processed through a grinder while Construction and Demolition (C&D) waste undergoes sorting
and a wash step.
Separation/sorting of C&D waste is required to remove recyclables (e.g., metal, paper, and
cardboard), contaminants (e.g., plastics and concrete), and other unusable fractions to isolate
only those fractions that meet the cost and quality requirements for biofuel feedstocks. In the
2017 Design Case, C&D is sorted to supply usable material for thermochemical conversion.
Prior to any preprocessing the ash content of untreated C&D waste fractions is estimated to be
about 6%. The application of a wash stage further reduces the ash content down to pure wood
levels of about 1%.
Pulpwood
Switchgrass
C&D
Wood
Residues Stage II Size
Reduction with
PTS
Stage I Size
Reduction
(Chipper)
De-barker
Washing
Densification Drying
Stage I Size
Reduction
(Grinder)
C&D
Formulation
Sorting
Screening
Wood Residue
Landing Preprocessin
40% Material Loss
10% Material Loss
Figure 37. Material flow in the 2017 Design Case that incorporates many improvements in preprocessing,
including pneumatics, high-moisture densification, and formulation/blending.
The logistics of a blended feedstock scenario are certainly more complex than a single-feedstock
scenario. The 2017 Design Case assumes that preprocessing of C&D will occur at a
preprocessing depot located at the source landfill or refuse transfer station, and C&D pellets will
be shipped from the depot to the blending depot located within proximity of the biorefinery.
Switchgrass that is formatted in large square bales will be delivered to the blending depot, where
they will be processed into pellets. Pulpwood and wood residues will be initially processed at the
landing for initial size reduction and ash mitigation then transported to a processing facility for
pelletization. The pulpwood, wood residues, switchgrass, and C&D pellets will be queued up in
blending bunkers or silos and blended to specification prior to being fed into the conversion
process. The pellets of the four blendstocks (i.e., pulpwood, wood residues, switchgrass, and
C&D) are then metered from the blending bunkers in the ratios required of the blended feedstock
and are conveyed from the preprocessing facility/depot to the conversion facility.
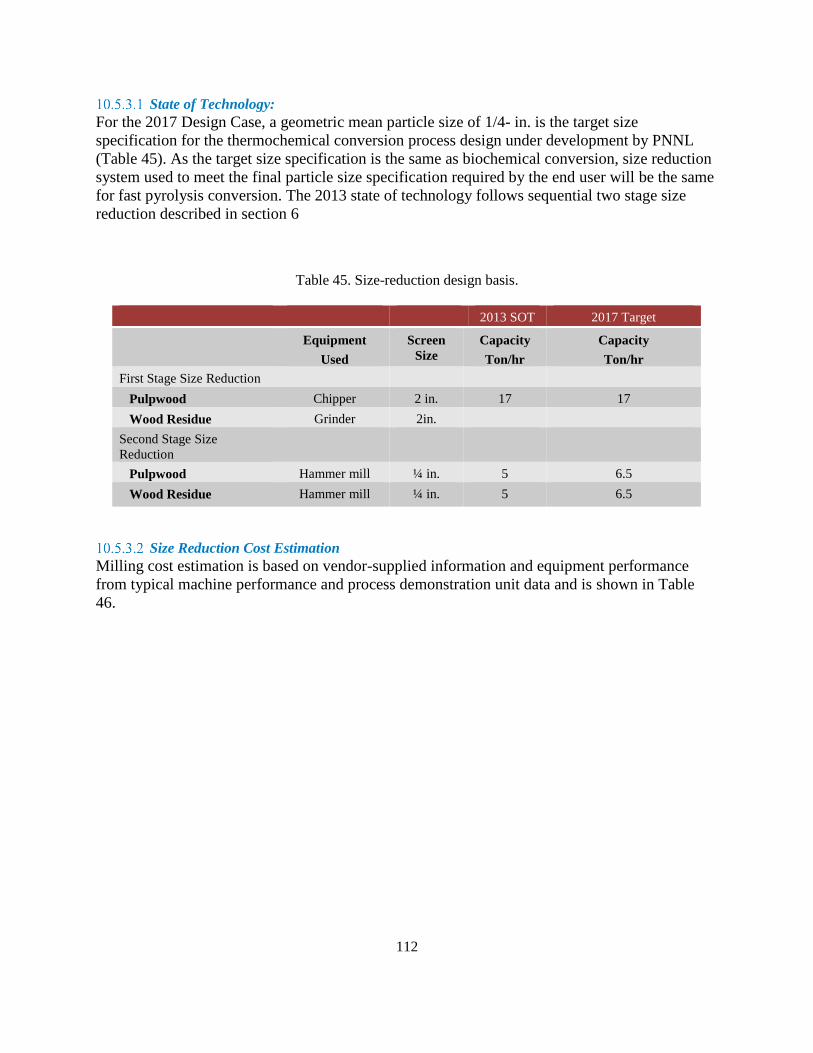
112
State of Technology:
For the 2017 Design Case, a geometric mean particle size of 1/4- in. is the target size
specification for the thermochemical conversion process design under development by PNNL
(Table 45). As the target size specification is the same as biochemical conversion, size reduction
system used to meet the final particle size specification required by the end user will be the same
for fast pyrolysis conversion. The 2013 state of technology follows sequential two stage size
reduction described in section 6
Table 45. Size-reduction design basis.
2013 SOT 2017 Target
Equipment
Used
Screen
Size
Capacity
Ton/hr
Capacity
Ton/hr
First Stage Size Reduction
Pulpwood Chipper 2 in. 17 17
Wood Residue Grinder 2in.
Second Stage Size
Reduction
Pulpwood Hammer mill ¼ in. 5 6.5
Wood Residue Hammer mill ¼ in. 5 6.5
Size Reduction Cost Estimation
Milling cost estimation is based on vendor-supplied information and equipment performance
from typical machine performance and process demonstration unit data and is shown in Table
46.

113
Table 46. Size reduction cost estimates.
2013 SOT
(2011 $/dry T)
2017 Target
(2011 $/dry T)
Total Total
Pulpwood
Chipper 6.10 6.10
Debark/delimb 6.10 6.10
Hammer Mill 17.09 13.97
Total 29.29 26.17
Wood Residue
Grinder 5.39 5.39
Trommel Screen 3.32 3.32
Hammer Mill 17.09 13.97
Total 25.80 22.68
Drying and Densification
A comparison of pellet properties and energy balances for conventional and high-moisture
pelletization processes is given in Table 47. The table shows 2017 Design Case targets to achieve
a 40 to 50% reduction in the total pelletization and drying energy.
Table 47. Drying and densification design basis.
2013 SOT 2017 Target
Infeed Moisture 40% 30%
Dryer Moisture Reduction 28% 11%
Densification Moisture Reduction 3% 10%
Final Pellet Moisture 9% 9%
Densification Energy 75 kWhr/dry T 50 kWhr/dry T
Drying Energy 350 kWhr/ton 100 kWhr/ton
Pellet Properties
Unit Density 65 lb/ft3 70 lb/ft3
Bulk Density 35 lb/ft3 40 lb/ft3
Durability Greater than 97.5% Greater than 97.5%
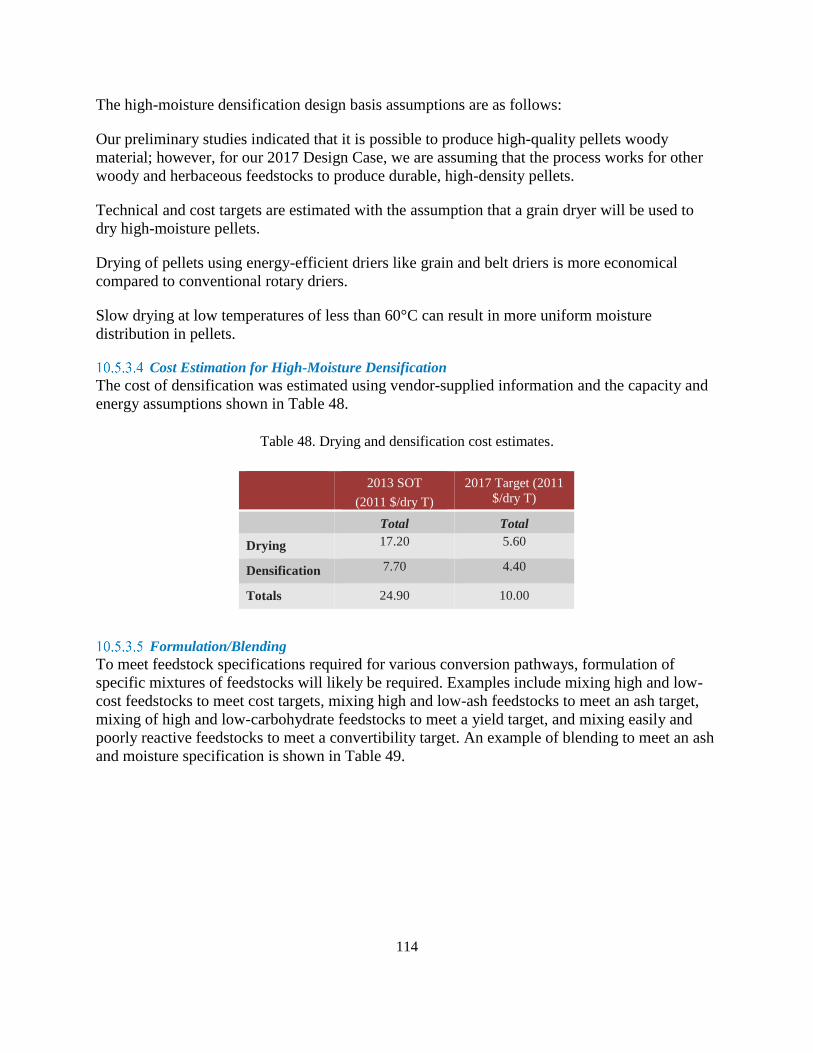
114
The high-moisture densification design basis assumptions are as follows:
Our preliminary studies indicated that it is possible to produce high-quality pellets woody
material; however, for our 2017 Design Case, we are assuming that the process works for other
woody and herbaceous feedstocks to produce durable, high-density pellets.
Technical and cost targets are estimated with the assumption that a grain dryer will be used to
dry high-moisture pellets.
Drying of pellets using energy-efficient driers like grain and belt driers is more economical
compared to conventional rotary driers.
Slow drying at low temperatures of less than 60°C can result in more uniform moisture
distribution in pellets.
Cost Estimation for High-Moisture Densification
The cost of densification was estimated using vendor-supplied information and the capacity and
energy assumptions shown in Table 48.
Table 48. Drying and densification cost estimates.
2013 SOT
(2011 $/dry T)
2017 Target (2011
$/dry T)
Total Total
Drying 17.20 5.60
Densification 7.70 4.40
Totals 24.90 10.00
Formulation/Blending
To meet feedstock specifications required for various conversion pathways, formulation of
specific mixtures of feedstocks will likely be required. Examples include mixing high and low-
cost feedstocks to meet cost targets, mixing high and low-ash feedstocks to meet an ash target,
mixing of high and low-carbohydrate feedstocks to meet a yield target, and mixing easily and
poorly reactive feedstocks to meet a convertibility target. An example of blending to meet an ash
and moisture specification is shown in Table 49.

115
Table 49. Feedstock formulation/blending of ash and moisture contents*.
Content Delivered to
Biorefinery Infeed
Pulpwood(45%) Wood
Residues(32%)
Switchgrass(3%) C&D
Waste(20%)
Final Blend
Ash content (wt. %) 0.5 1.0 4.0 1.0 <1%
Moisture content (%,
wet basis)
9 9 9 9 9
HHV (lb/BTU) 8824 9444 7557 8824 8984
LHV (lb/BTU) 7255 7616 6155 7255 7337
*Pulpwood, wood resides, and switchgrass composition data were obtained from the INL Biomass Library 75.
Assumptions for the formulation design basis are as follows:
Blended feedstocks are selected and developed to achieve conversion yield specifications. It
currently unknown how blended feedstocks will perform in the conversion pathways. The
simplest assumption is that the blended feedstocks would be the sum of performances of each
individual component. There are on-going trials to test various blended feedstocks and to
compare the conversion efficiencies against a single feedstocks.
Individual feedstocks will be pelleted at depots for shipment to biorefineries. At the
biorefinery, these pelleted feedstocks will be unloaded and conveyed into individual bunkers
for storage. Pellets of the different blendstocks will be metered out into the bunkers in the
ratios required of the blends, crushed (using a pellet crusher), and mixed prior to insertion for
the conversion process.
Material will be metered from individual bunkers onto a conveyer and then thoroughly
homogenized through this process with no segregation. Mixing of solids occurs in many
industries and is often problematic when solids of varying density, shape, and size are
blended. This often leads to segregation, either during the mixing or while being transported
to its destination. Mixing of solids is considered a trial-and-error process due to these issues.
The expected unit operations for formulation are shown in Table 50.
Table 50. Feedstock formulation design basis.
2013 SOT (2011 $/dry T) Operating Parameters
Capacity Horsepower
Pellet Pulverizer 100 ton/hour 200 HP
Bulk Storage with Hopper 30 ton/hour 30 HP
Conveying System 30 ton/hour 40 HP
Research is currently ongoing at INL to examine the compatibility of various feedstocks blends,
with an initial focus on the blends reactivity versus the individual feedstocks. Blends will be
developed for several regions of the United States using the least-cost formulation model as a
starting point and will incorporate feedstocks with varying levels of reactivity (e.g., herbaceous,
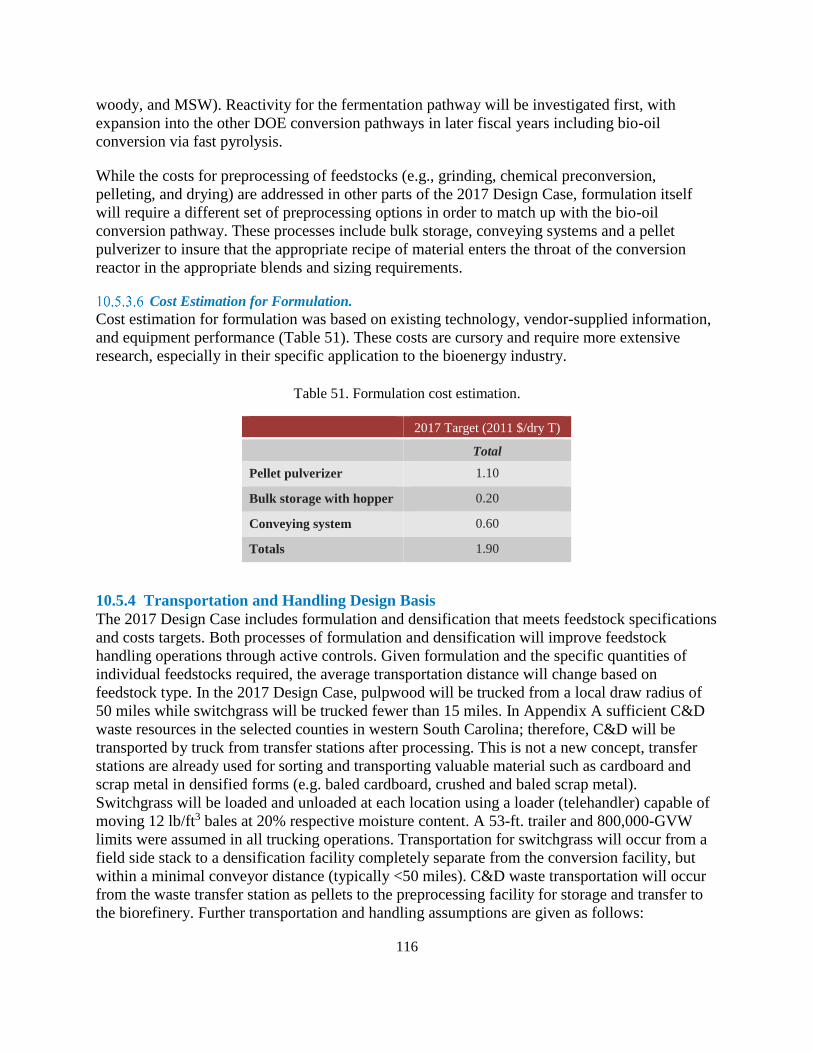
116
woody, and MSW). Reactivity for the fermentation pathway will be investigated first, with
expansion into the other DOE conversion pathways in later fiscal years including bio-oil
conversion via fast pyrolysis.
While the costs for preprocessing of feedstocks (e.g., grinding, chemical preconversion,
pelleting, and drying) are addressed in other parts of the 2017 Design Case, formulation itself
will require a different set of preprocessing options in order to match up with the bio-oil
conversion pathway. These processes include bulk storage, conveying systems and a pellet
pulverizer to insure that the appropriate recipe of material enters the throat of the conversion
reactor in the appropriate blends and sizing requirements.
Cost Estimation for Formulation.
Cost estimation for formulation was based on existing technology, vendor-supplied information,
and equipment performance (Table 51). These costs are cursory and require more extensive
research, especially in their specific application to the bioenergy industry.
Table 51. Formulation cost estimation.
2017 Target (2011 $/dry T)
Total
Pellet pulverizer 1.10
Bulk storage with hopper 0.20
Conveying system 0.60
Totals 1.90
10.5.4 Transportation and Handling Design Basis
The 2017 Design Case includes formulation and densification that meets feedstock specifications
and costs targets. Both processes of formulation and densification will improve feedstock
handling operations through active controls. Given formulation and the specific quantities of
individual feedstocks required, the average transportation distance will change based on
feedstock type. In the 2017 Design Case, pulpwood will be trucked from a local draw radius of
50 miles while switchgrass will be trucked fewer than 15 miles. In Appendix A sufficient C&D
waste resources in the selected counties in western South Carolina; therefore, C&D will be
transported by truck from transfer stations after processing. This is not a new concept, transfer
stations are already used for sorting and transporting valuable material such as cardboard and
scrap metal in densified forms (e.g. baled cardboard, crushed and baled scrap metal).
Switchgrass will be loaded and unloaded at each location using a loader (telehandler) capable of
moving 12 lb/ft3 bales at 20% respective moisture content. A 53-ft. trailer and 800,000-GVW
limits were assumed in all trucking operations. Transportation for switchgrass will occur from a
field side stack to a densification facility completely separate from the conversion facility, but
within a minimal conveyor distance (typically <50 miles). C&D waste transportation will occur
from the waste transfer station as pellets to the preprocessing facility for storage and transfer to
the biorefinery. Further transportation and handling assumptions are given as follows:

117
At 20% moisture, transportation continues to be volume limited at densities of 12 lb/ft3.
At 30% moisture, transportation of chips continues to be volume limited.
At 9% moisture, transportation of pellets is weight limited at 40 lb/ft3.
There will be insignificant material losses throughout transportation and handling.
Densification will increase material uniformity and flowability
Cost Estimation for Transportation and Handling
The cost estimation for transportation and handling was based on vendor-supplied information and
equipment performance from typical machines (Table 52). Rail transportation costs were estimated
using a jumbo hopper car 54 adjusted for U.S. conditions.
Table 52. Transportation cost estimates.
2013 SOT
(2011 $/dry T)
2017 Target
(2011 $/dry T)
Total Total
Truck 14.84* 7.52**
*Individual feedstock therefore one transportation
pathway
**Multiple feedstocks therefore multiple
transportation pathways and draw radiuses.
Life Cycle Analysis This section uses a life-cycle assessment (LCA) to evaluate the energy input and GHG emissions
for conversion In Situ and Ex Situ Upgrading of Fast Pyrolysis Vapors. LCA considered the unit
processes involved in the biomass logistics. Table 53 shows the energy consumption and Table
54 show GHG contribution for In Situ and Ex Situ Upgrading of Fast Pyrolysis Vapors Pathway
conversion supply chain design.

118
Table 53. Energy Consumption for Thermochemical conversion supply chain design.
Process Element Pulpwood Wood
Residues
Switchgrass Construction and
Demolition Waste
(C&D)
Blend
Formulation Contribution 45% 32% 3% 20% –
Harvest and Collection
(MBTU/dry T)
182.78 – 122.85 – 85.94
Landing Preprocessing/
Sorting (MBTU/dry T)
231.52 110.25 – 410.25 221.51
Transportation
(MBTU/dry T)
136.87 101.38 99.35 273.73 151.76
Preprocessing (MBTU/dry
T)
408.01 408.01 285.83 408.01 404.34
Storage (MBTU/dry T) 8.46 8.46 21.83 8.46 8.86
Handling (MBTU/dry T) 42.69 42.69 41.90 42.69 42.67
Total Energy Consumption
(MBTU/dry T) 1001.33 670.79 571.76 1143.14 915.08
Table 54. GHG contribution for thermochemical conversion supply chain design.
Process Element Blend
Formulation Contribution –
Harvest and collection GHGs (Kg CO2e/ dry
T)
8.65
Landing Preprocessing GHGs (Kg CO2e/ dry
T)
18.95
Transportation GHGs (Kg CO2e/ dry T) 8.62
Preprocessing GHGs (Kg CO2e/ dry T) 34.60
Storage GHGs (Kg CO2e/ dry T) 0.89
Handling GHGs (Kg CO2e/ dry T) 4.2
Total GHGs (Kg CO2e/ dry T) 75.91
119
11. Dilute-Acid Conversion of Lignocellulosic Biomass to
High Octane Gasoline via Indirect Gasification and
Methanol Intermediate This sections is intended to couple with the National Renewable Energy Laboratory’s (NREL’s)
hydrocarbon design report, “Process Design and Economics for the Conversion of
Lignocellulosic Biomass to High Octane Gasoline via Indirect Gasification and Methanol
Intermediate”6 that describes a viable route from biomass to hydrocarbon fuels. The assumptions
of scale and feedstock quality requirements are consistent with the design case assumptions used
by NREL in their report and techno economic assessments. This design does not consider the
different requirements and nuances of other thermochemical conversion processes or other
hydrocarbon pathways.
Summary This report establishes a plausible case for achieving the 2017 Design Case for Lignocellulosic
Biomass to High Octane Gasoline via Indirect Gasification and Methanol Intermediate
conversion cost goals of delivering a biomass feedstock to the conversion facility at a cost of
$80/dry T (Table 55). The least-cost formulation approach (Appendix B) illustrates the
importance of cost estimates for determining the total cost of feedstock to a biorefinery,
including grower payment (access costs), logistics costs, and quality/dockage cost. It also
illustrates the importance of refining and updating these costs as analyses and data improve to
better inform the estimates. The following conclusions are presented to document the specific
areas that require additional attention to further strengthen and support the feedstock design
detailed in this report.
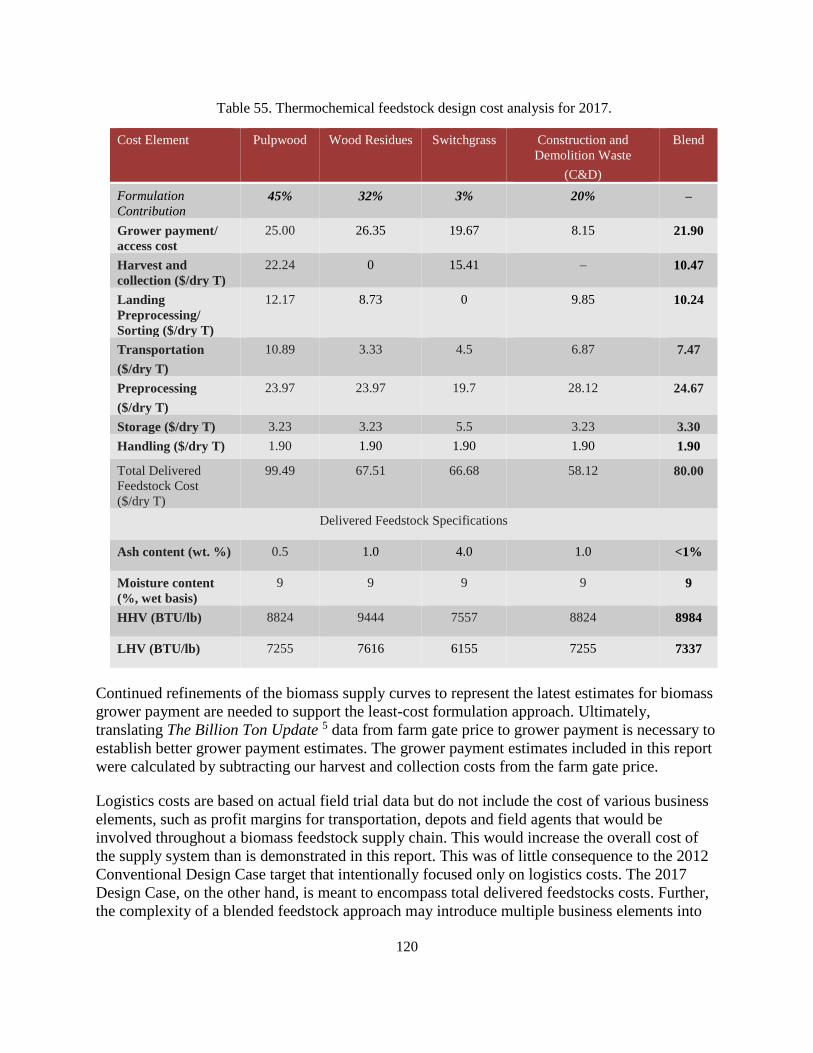
120
Table 55. Thermochemical feedstock design cost analysis for 2017.
Cost Element Pulpwood Wood Residues Switchgrass Construction and
Demolition Waste
(C&D)
Blend
Formulation
Contribution 45% 32% 3% 20% –
Grower payment/
access cost
25.00 26.35 19.67 8.15 21.90
Harvest and
collection ($/dry T)
22.24 0 15.41 – 10.47
Landing
Preprocessing/
Sorting ($/dry T)
12.17 8.73 0 9.85 10.24
Transportation
($/dry T)
10.89 3.33 4.5 6.87 7.47
Preprocessing
($/dry T)
23.97 23.97 19.7 28.12 24.67
Storage ($/dry T) 3.23 3.23 5.5 3.23 3.30
Handling ($/dry T) 1.90 1.90 1.90 1.90 1.90
Total Delivered
Feedstock Cost
($/dry T)
99.49 67.51 66.68 58.12 80.00
Delivered Feedstock Specifications
Ash content (wt. %) 0.5 1.0 4.0 1.0 <1%
Moisture content
(%, wet basis)
9 9 9 9 9
HHV (BTU/lb) 8824 9444 7557 8824 8984
LHV (BTU/lb) 7255 7616 6155 7255 7337
Continued refinements of the biomass supply curves to represent the latest estimates for biomass
grower payment are needed to support the least-cost formulation approach. Ultimately,
translating The Billion Ton Update 5 data from farm gate price to grower payment is necessary to
establish better grower payment estimates. The grower payment estimates included in this report
were calculated by subtracting our harvest and collection costs from the farm gate price.
Logistics costs are based on actual field trial data but do not include the cost of various business
elements, such as profit margins for transportation, depots and field agents that would be
involved throughout a biomass feedstock supply chain. This would increase the overall cost of
the supply system than is demonstrated in this report. This was of little consequence to the 2012
Conventional Design Case target that intentionally focused only on logistics costs. The 2017
Design Case, on the other hand, is meant to encompass total delivered feedstocks costs. Further,
the complexity of a blended feedstock approach may introduce multiple business elements into

121
the supply chain; therefore, it is important that logistics costs be updated to include the true cost
of these business elements, including a return on investment.
As the biomass logistic systems become more complex, especially with the introduction of new
technologies (e.g., chemical preconversion), it may be prudent to differentiate between the
current state-of-technology costs and the projected costs of mature technology (nth plant costs) to
be consistent with conversion platform terminology. This was not an issue with conventional
feedstock designs that were intrinsically tied to current SOT; however, for technology
maturation, cost reductions may be worth considering for advanced feedstock designs.
Admittedly, it also is necessary to tighten the design and cost estimates around formulation and
the engineering systems for crushing the pellets and blending prior to insertion into the
conversion process. A better understanding of C&D availability, cost, and conversion
performance is needed to solidify its position in the 2017 Design Case. Likewise, the viability of
blended feedstocks as a whole depends on their conversion performance. DOE Bioenergy
Technology Office funded research is investigating the conversion performance of blends
(including C&D blends) and evaluating the compatibilities and incompatibilities of blendstocks.
The results of this research are critical to further development of blended feedstocks.
Feedstock Composition (In-feed quality specifications) The dry basis elemental composition of the feedstock, shown in Table 79 is similar to previous
NREL and PNNL design reports6. The composition was originally assumed to come from
pulpwood. Recent feedstock logistics work suggests the use of blended material may be required
to meet a cost target of $80/dry US ton while still meeting these specifications. For the purpose
of this report, it is assumed that any blended material provided to meet this feedstock elemental
composition will not adversely affect fast pyrolysis conversion efficiencies. Ongoing studies
being conducted jointly by INL, NREL and PNNL will provide experimental evidence of the
impact of blended feedstocks on fast pyrolysis and gasification processes. Future TEA will be
modified to reflect conversion impacts inferred from such studies. As has been described in prior
conversion design reports, the feedstock composition plays a critical role on overall process
design and economics, primarily with respect to high and low heating values, carbon as well as
high sensitivity to impurity components such as ash and metals in this design. The blended
uniform-format feedstock composition assumed here for purposes of future design case targets is
shown below, with supporting details described in the 2011 ethanol report 46. Also consistent
with prior design cases, the moisture content for the delivered feedstock is 10% or less.

122
Table 56. Delivered woody feedstock composition and processing assumptions for the fast pyrolysis and
hydrotreating design report 6.
Component Composition
(dry wt. %)
Carbon 50.94
Hydrogen 6.04
Nitrogen 0.17
Sulfur 0.03
Oxygen 41.90
Ash 0.90-1.0
Heating Value (Btu/lb) 8,601 HHV
7,996 LHV
Moisture (Bulk Wt. %) 10.0
Particle Size (inch) 1/4
Feedstock Selection Cost Estimation Expansion beyond highly productive resource areas has significant implications to the feedstock
supply chain. Sparse areas, whether due to reduced yields and/or higher dispersion, typically
increase feedstock logistics costs. Higher harvest and collection costs are incurred due to the
need to spread machinery ownership costs over fewer tons of biomass or the need to cover more
acres for the same quantity of biomass. Additionally, lower resource yields increase the supply
radius and biomass transportation distances. Under the 2012 Conventional Design, higher yield
areas allow refinery to be selective on the resource that they access.
Consider, for example, the scenarios depicted in Figure 38. This resource map illustrates a
county-level resource assessment of pulpwood farm gate at $60/dry T prices (this includes
grower payment, harvest, collection, and chipping costs). Farm gate price data were extracted
from The Billion Ton Update (BT2) 5 data supplied from Oak Ridge National Laboratory. It
should be noted that while the data is reported at a county-level, the data should be applied at the
wood shed (typically much larger area than a county) level because it was derived from the U.S.
Forest Service Forest Inventory and Assessment Data (FIA) 56 and does not equate to county
levels accurately. The FIA is a woodshed level assessment and therefore to use the data correctly
it is necessary to combine multiple counties.
The cost competitiveness of the 2012 Conventional Design was demonstrated by in the scenario
located in southern Alabama, a high biomass yielding area 3. We further suggest, based on the
consistency of farm gate (i.e., landing) prices shown in this map, that the 2012 Conventional
Design can be deployed cost effectively in South Carolina. Commercial readiness of
conventional supply systems ultimately will be demonstrated by commercial-scale cellulosic
ethanol plants opening in these areas in the near future.
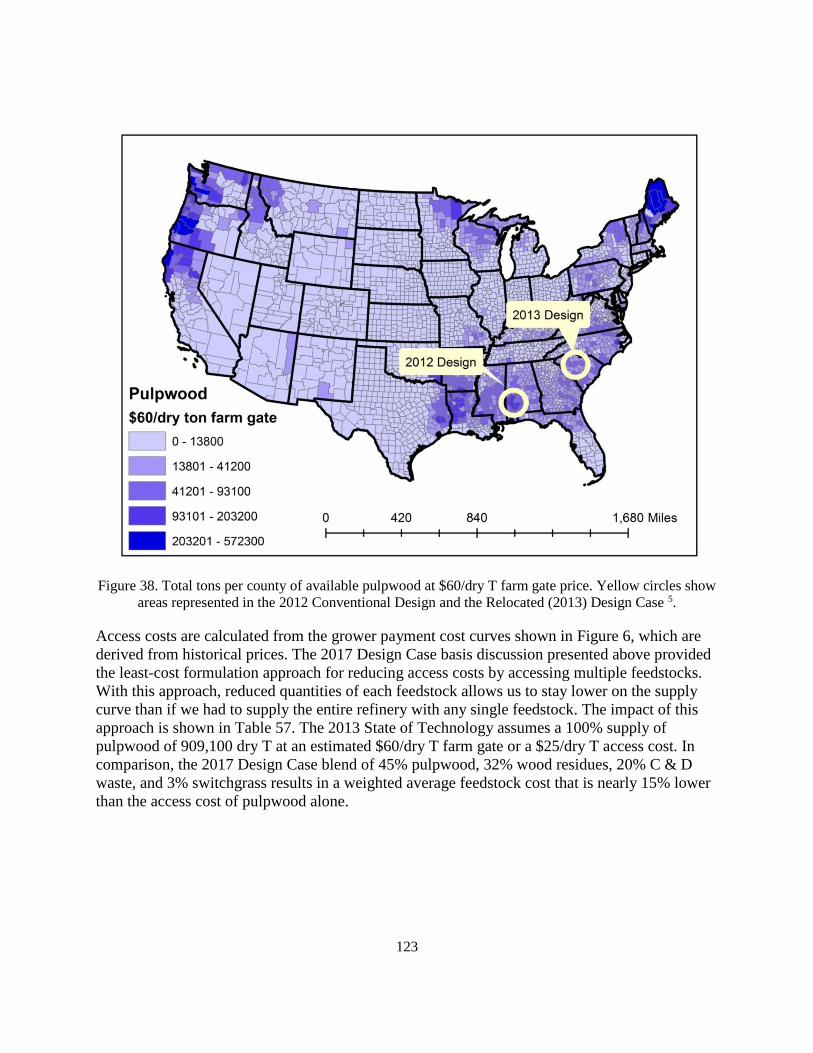
123
Figure 38. Total tons per county of available pulpwood at $60/dry T farm gate price. Yellow circles show
areas represented in the 2012 Conventional Design and the Relocated (2013) Design Case 5.
Access costs are calculated from the grower payment cost curves shown in Figure 6, which are
derived from historical prices. The 2017 Design Case basis discussion presented above provided
the least-cost formulation approach for reducing access costs by accessing multiple feedstocks.
With this approach, reduced quantities of each feedstock allows us to stay lower on the supply
curve than if we had to supply the entire refinery with any single feedstock. The impact of this
approach is shown in Table 57. The 2013 State of Technology assumes a 100% supply of
pulpwood of 909,100 dry T at an estimated $60/dry T farm gate or a $25/dry T access cost. In
comparison, the 2017 Design Case blend of 45% pulpwood, 32% wood residues, 20% C & D
waste, and 3% switchgrass results in a weighted average feedstock cost that is nearly 15% lower
than the access cost of pulpwood alone.

124
Table 57. Resource access cost estimate (U.S. DOE 2011 5, and INL MSW Data).
2013 SOT 2017 Target
Access Cost
(2011 $/dry T)
Tons Access Cost
(2011 $/dry T)
Tons
Pulpwood 25.00 909,100* 25.00 425,700*
Wood Residues NA NA 26.35 412,800**
Switchgrass NA NA 19.67 25,800
C&D NA NA 8.15 172,000
Totals 25.00 NA 21.90 1,036,300
*assumes 10% loss of material to debark/delimb (Walker, 2006)
Quality Specification and Design Assumptions The 2012 Conventional Design focused on conventional woody harvest operations (i.e., felling
and/ or skidding operations are separate from landing preprocessing operations). In addition to
including switchgrass into the feedstock blend, the 2017 Design Case assumes that the
immaturity of the biomass market will limit the forest and farm owner’s investment in advanced
equipment options for both woody and herbaceous feedstocks. Therefore, with the exception of a
few proactive, early adopters, conventional forestry and farming operations will dominate the
market in the regions defined by the 2017 Design Case. Table 58 below summarizes the
assumptions and differences between the 2012 and 2017 logistic designs.

125
Table 58. Summary of assumptions underpinning progressive design implementations 57.
2012
Conventional
Design
Baseline 2017 Design Case
Feedstock(s) Pulpwood Pulpwood Blended feedstock: pulpwood (45%), wood
residues (32%), switchgrass (3%), and select
construction and demolition wastes (C
&D)(20%)
Grower
payment
Breakeven cost of
production
Increases based
on marginal
cost differential
Calculated and modeled according to specific
location and resource blend/formulation
Moisture Field dried to 40% Field dried to
40%
Arrives: Pulpwood chips 30% wood residue
chips 30%, switchgrass 20%, and C& D
ground 20%;
All dried to 9% pellets
Ash Debark/delimb Debark/delimb Debark/delimb pulpwood
Trommel screen residues
Wash and sort C& D waste
Blended ash content of <1%
Debarked pulpwood <1%, screened wood
residues 1.4%; washed and sorted C&D 1.0 %
Logistics Uses existing
systems
Uses existing
systems
Pneumatics attached to hammermill
High-moisture densification
Quality
controls
(passive)
Field drying to
reduce moisture
Ample available
resource; quality
spec manually
selected
Field drying to
meet moisture
spec
Harvest/collection and storage best management
practices for pulpwood and switchgrass
More rigorous field drying of pulpwood and
residues
Quality
controls
(active)
Waste heat dryer Rotary drying Multiple resource blending/formulation
High-moisture densification
High-efficiency pellet drying
Meets quality
target
Yes Yes Yes
Meets cost
target
Yes No Yes
Accesses
dispersed
resources
No No Yes

126
Relative to the woody feedstocks used in the Thermochemical Design Case, the 2013 baseline
and 2017 Design Case are similar in many ways for harvest and collection, but the latter has two
key changes to improve quality and production of woody materials. While each system is
discussed later, the key differences of the 2017 Design Case are first inclusion of woody residues
sourced from pulpwood operations, and second in-forest drying of whole tree piles at the landing
to achieve a more aggressive moisture content of 30% .In this design debarking and delimbing
are conducted to improve biomass quality. Construction and demolition wastes are considered to
enter the feedstock logistics system at the preprocessing stage and are therefore not discussed
here.
Feedstock Logistics 11.5.1 Harvest and Collection
Conventional wood harvest and collection relies on existing forestry technologies designed for
timber and pulp and paper production. Collection systems for woody material involve cutting the
feedstock with a tracked feller buncher and transporting the material to the landing with a
grapple skidder immediately after felling. Felling and skidding operations increase the overall
ash content of harvested whole-trees by introducing soil as it is moved in contact with the ground
from one location to the next 58. Thermochemical conversion processes via fast pyrolysis are
highly sensitive to silica, alkali, and transition metals found in most soils, impacting process
performance 59 60 61. In both the 2013 and 2017 Design Cases active management strategies are
employed during the landing preprocessing to improve biomass ash content .Current forestry
production of pine pulpwood is reported to yield roundwood with a moisture content of 45-55%
and a whole-tree ash content ranging from 1% to 3% 62 63 64 . The 2013 baseline assumes the
moisture content of pulpwood to be 50% for whole-trees entering storage.
Woody residues are generated through typical commercial forestry operations on southern pine
plantations where trees are harvested for pulpwood, chip-and-saw, and saw timber. Similar to the
above described collection of pulpwood, these operations bring whole trees to the landing where
they are delimbed and topped using a pull-through delimber. The roundwood is then loaded onto
trucks for delivery to the mill while the residues are piled at the landing. While not collected in
the 2013 baseline, the 2017 Design Case utilizes these materials as a fraction of the feedstock
blend. The baseline for residue moisture content is reported at 40%, while ash content has been
reported to range from 2% to 4% 47, 62, 65 66. Switchgrass, which is part of the blend, harvest and
collection systems use conventional windrowing harvester and rectangular baler (3x4x8-ft).
Harvest and Collection Design Basis
The 2017 Design Case incorporates a chain flail debarker during preprocessing at the landing to
increase the quality of the final chipped pulpwood product. Therefore, moisture and ash contents
of material entering storage are not different between the 2013 and 2017 Designs. However,
there is still impetus to increase the operational efficiency of roundwood collection for reducing
costs 67 68. This can be achieved through forest management shifts to short-rotation pine
plantations aimed at supplying bioenergy production, increased efficiency of harvesting
machinery, and increased efficiency of grapple skidder transportation. Research conducted by
Auburn University for the DOE High Tonnage Forest Biomass Project has demonstrated high
capacity grapplers to increase productivity by 80 tons per productive machine hour compared to
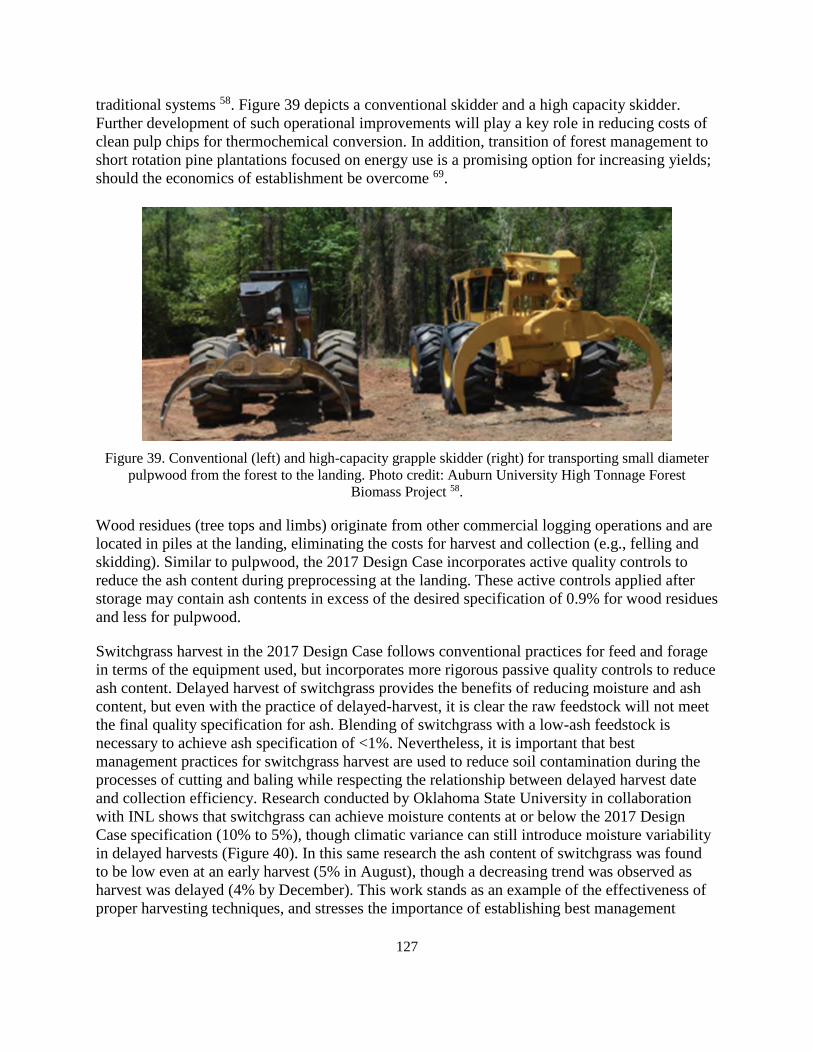
127
traditional systems 58. Figure 39 depicts a conventional skidder and a high capacity skidder.
Further development of such operational improvements will play a key role in reducing costs of
clean pulp chips for thermochemical conversion. In addition, transition of forest management to
short rotation pine plantations focused on energy use is a promising option for increasing yields;
should the economics of establishment be overcome 69.
Figure 39. Conventional (left) and high-capacity grapple skidder (right) for transporting small diameter
pulpwood from the forest to the landing. Photo credit: Auburn University High Tonnage Forest
Biomass Project 58.
Wood residues (tree tops and limbs) originate from other commercial logging operations and are
located in piles at the landing, eliminating the costs for harvest and collection (e.g., felling and
skidding). Similar to pulpwood, the 2017 Design Case incorporates active quality controls to
reduce the ash content during preprocessing at the landing. These active controls applied after
storage may contain ash contents in excess of the desired specification of 0.9% for wood residues
and less for pulpwood.
Switchgrass harvest in the 2017 Design Case follows conventional practices for feed and forage
in terms of the equipment used, but incorporates more rigorous passive quality controls to reduce
ash content. Delayed harvest of switchgrass provides the benefits of reducing moisture and ash
content, but even with the practice of delayed-harvest, it is clear the raw feedstock will not meet
the final quality specification for ash. Blending of switchgrass with a low-ash feedstock is
necessary to achieve ash specification of <1%. Nevertheless, it is important that best
management practices for switchgrass harvest are used to reduce soil contamination during the
processes of cutting and baling while respecting the relationship between delayed harvest date
and collection efficiency. Research conducted by Oklahoma State University in collaboration
with INL shows that switchgrass can achieve moisture contents at or below the 2017 Design
Case specification (10% to 5%), though climatic variance can still introduce moisture variability
in delayed harvests (Figure 40). In this same research the ash content of switchgrass was found
to be low even at an early harvest (5% in August), though a decreasing trend was observed as
harvest was delayed (4% by December). This work stands as an example of the effectiveness of
proper harvesting techniques, and stresses the importance of establishing best management
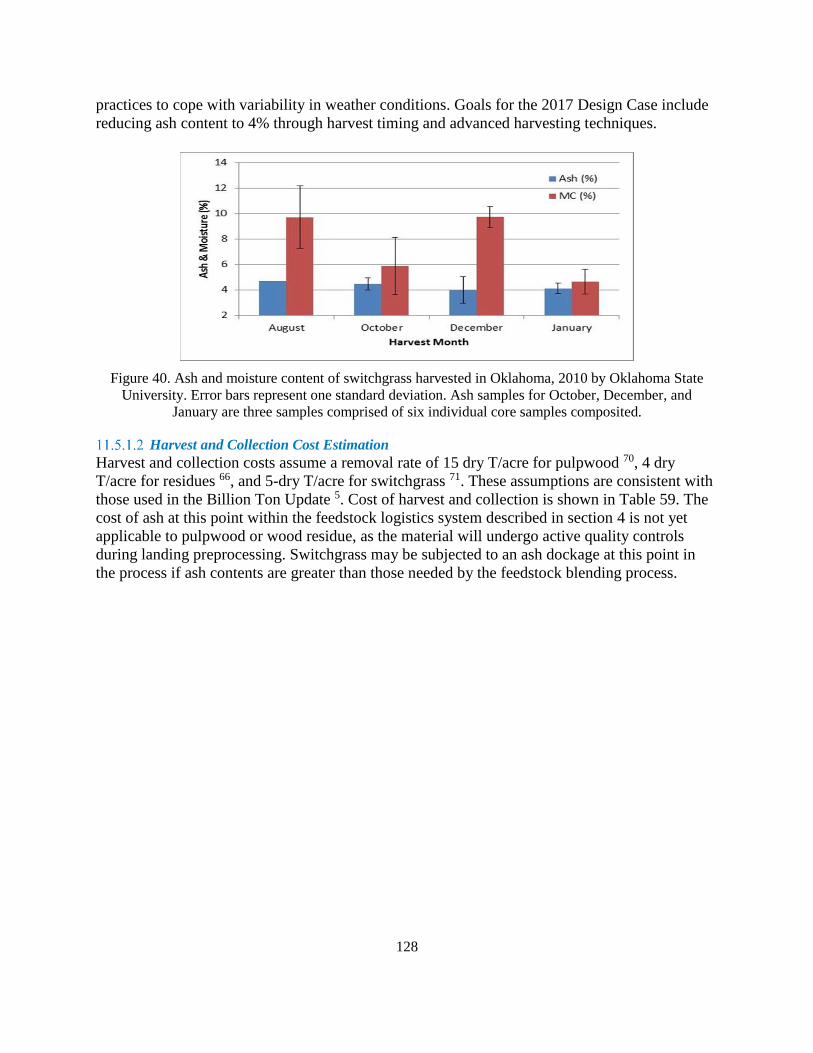
128
practices to cope with variability in weather conditions. Goals for the 2017 Design Case include
reducing ash content to 4% through harvest timing and advanced harvesting techniques.
Figure 40. Ash and moisture content of switchgrass harvested in Oklahoma, 2010 by Oklahoma State
University. Error bars represent one standard deviation. Ash samples for October, December, and
January are three samples comprised of six individual core samples composited.
Harvest and Collection Cost Estimation
Harvest and collection costs assume a removal rate of 15 dry T/acre for pulpwood 70, 4 dry
T/acre for residues 66, and 5-dry T/acre for switchgrass 71. These assumptions are consistent with
those used in the Billion Ton Update 5. Cost of harvest and collection is shown in Table 59. The
cost of ash at this point within the feedstock logistics system described in section 4 is not yet
applicable to pulpwood or wood residue, as the material will undergo active quality controls
during landing preprocessing. Switchgrass may be subjected to an ash dockage at this point in
the process if ash contents are greater than those needed by the feedstock blending process.

129
Table 59. Biomass harvest and collection cost estimates derived from INL analysis.
Machine 2013 SOT
(2011 $/dry T)
2017 Target (2011
$/dry T)
Total Total
Pulpwood
Felling 15.00 15.00
Yarding 7.24 7.24
Totals 22.24 22.24
Wood Residues*
Felling 0.00 0.00
Yarding 0.00 0.00
Totals 0.00 0.00
Switchgrass
Mower-conditioner 4.80 4.80
Baler 7.30 7.30
Bale
collection/stacking
3.30 3.30
Totals 15.40 15.40
* Costed to harvest and collection of other process.
11.5.2 Storage 2013 State of Technology
Because the 2017 Design Case utilizes a blended feedstock, switchgrass storage must be
addressed. The storage of switchgrass occurs field side or at a similar on-farm unimproved
storage site. As for any baled feedstock, appropriate storage sites provide adequate drainage
away from the stack to prevent the accumulation of moisture around the stack, provide year-
round access, and preferably allow stack to be positioned in a North-South orientation to reduce
moisture accumulation on the north side of the stack 72. Tarped stacks are chosen as a balance
between bale protection against moisture infiltration, which leads to dry matter loss, and storage
configuration costs 73 22. Stacks are constructed with a self-propelled stacking bale wagon and
are six bales high and covered with a high-quality hay tarp. To prolong tarp life, it is also
important that adequate year-round maintenance be provided to periodically tighten the tarps 74.
Biomass storage systems in the current Design Case seek to provide a low-cost, low-
maintenance, moisture-tolerant solution that focus on maintaining moisture content <20%,
minimizing dry matter loss and preserving feedstock composition. Table 60 shows the assumed
changes in moisture content between the 2013 SOT and the 2017 Design Case.

130
Table 60. Technical targets for biomass field storage of resources in the 2017 Design Case.
Process After Field Drying
Moisture Content
2013 SOT 2017 Target
Pulpwood 40 % 30%
Wood
Residues
40% 30%
Switchgrass 20% 20%
Storage Design Basis
The 2017 Design Case is based on field drying for pulpwood and forest residues, both to 30%
moisture at the time the material enters landing preprocessing. Field studies on field drying of
short rotation southern pine pulpwood and residues have shown final moisture contents of 30%
to be achievable given adequate time 65 58 64.
Since chips are expected to enter storage at 30% moisture in the 2017 Design Case, it is
reasonable to assume that dry matter losses will be much less (nearly negligible) within the three
day holding window. The concerns of unplanned storage extensions, moisture addition, or
mechanical losses could increase this number, and therefore the 2017 Design Case assumes a
target chip-storage dry matter loss of 5%. Protection of chip piles with tarps could help to
prevent these losses, if the additional material and labor costs are merited, and their presence
does not interfere with regular loading and unloading of the piles. Storage of switchgrass is not
expected to deviate from the 2013 Design Case baseline. Due to the low moisture content
entering storage, the use of a tarp to protect from moisture addition through precipitation has
been shown to be sufficient and cost effective when properly applied.
Biomass Storage Cost Estimation
Cost estimations for biomass storage were calculated based on literature values from recent
reviews 74, the storage cover vendor’s information, and laboratory and field level experiments 72
(Table 61).
Table 61. Field-side storage cost estimation.
SOT (2011 $/dry T) Design Target (2011 $/dry T)
Storage Dockage Total Storage Dockage Total
Switchgrass N/A N/A N/A 5.50 0.00 5.50
11.5.3 Preprocessing
The 2017 Design Case that incorporates many improvements in preprocessing, including
pneumatics, high-moisture densification, and formulation/blending. Figure 41 outlines the
material flow given for these improvements. In the 2017 Design Case, substantial cost savings in
size reduction are realized by tailoring the preprocessing stages to the individual feedstock and
not applying a one size fits all approach. For example, pulpwood is debarked and delimbed and
then processed through a chipper to optimize retention of usable material; wood residues are

131
processed through a first stage grinder then separated by passing through a trommel screen;
switchgrass is processed through a grinder while Construction and Demolition (C&D) waste
undergoes sorting and a wash step.
Separation/sorting of C&D waste is required to remove recyclables (e.g., metal, paper, and
cardboard), contaminants (e.g., plastics and concrete), and other unusable fractions to isolate
only those fractions that meet the cost and quality requirements for biofuel feedstocks. In the
2017 Design Case, C&D is sorted to supply usable material for thermochemical conversion.
Prior to any preprocessing the ash content of untreated C&D waste fractions is estimated to be
about 6%. The application of a wash stage further reduces the ash content down to pure wood
levels of about 1%.
Pulpwood
Switchgrass
C&D
Wood
Residues Stage II Size
Reduction with
PTS
Stage I Size
Reduction
(Chipper)
De-barker
Washing
Densification Drying
Stage I Size
Reduction
(Grinder)
C&D
Formulation
Sorting
Screening
Wood Residue
Landing Preprocessin
40% Material Loss
10% Material Loss
Figure 41. Material flow in the 2017 Design Case that incorporates many improvements in preprocessing,
including pneumatics, high-moisture densification, and formulation/blending.
The logistics of a blended feedstock scenario are certainly more complex than a single-feedstock
scenario. The 2017 Design Case assumes that preprocessing of C&D will occur at a
preprocessing depot located at the source landfill or refuse transfer station, and C&D pellets will
be shipped from the depot to the blending depot located within proximity of the biorefinery.
Switchgrass that is formatted in large square bales will be delivered to the blending depot, where
they will be processed into pellets. Pulpwood and wood residues will be initially processed at the
landing for initial size reduction and ash mitigation then transported to a processing facility for
pelletization. The pulpwood, wood residues, switchgrass, and C&D pellets will be queued up in
blending bunkers or silos and blended to specification prior to being fed into the conversion
process. The pellets of the four blendstocks (i.e., pulpwood, wood residues, switchgrass, and
C&D) are then metered from the blending bunkers in the ratios required of the blended feedstock
and are conveyed from the preprocessing facility/depot to the conversion facility.

132
State of Technology:
For the 2017 Design Case, a geometric mean particle size of 1/4- in. is the target size
specification for the thermochemical conversion process design under development by PNNL
(Table 62). As the target size specification is the same as biochemical conversion, size reduction
system to meet the final particle size specification required by the end user will be the same for
fast pyrolysis conversion. The 2013 state of technology follows sequential two stage size
reduction described in section 9.
Table 62. Size-reduction design basis.
2013
SOT
2017 Target
Equipment
Used
Screen
Size
Capacity
Ton/hr
Capacity
Ton/hr
First stage Size Reduction
Pulpwood Chipper 2 in. 17 17
Wood Residue Grinder 2in.
Second Stage Size Reduction
Pulpwood Hammer mill ¼ in. 5 6.5
Wood Residue Hammer mill ¼ in. 5 6.5
Size Reduction Cost Estimation
Milling cost estimation is based on vendor-supplied information and equipment performance
from typical machine performance and process demonstration unit data and is shown in Table
63.
Table 63. Size reduction cost estimates.
2013 SOT
(2011 $/dry T)
2017 Target
(2011 $/dry T)
Total Total
Pulpwood
Chipper 6.10 6.10
Debark/delimb 6.10 6.10
Hammer Mill 17.09 13.97
Total 29.29 26.17
Wood Residue
Grinder 5.39 5.39
Trommel Screen 3.32 3.32
Hammer Mill 17.09 13.97
Total 25.08 22.70

133
Drying and Densification
Conversion of lignocellulosic biomass to hydrocarbon fuels: Lignocellulosic Biomass to High
Octane Gasoline via Indirect Gasification and Methanol Intermediate use the same technology as
fast pyrolysis case described in section 9. Therefore, state of technology and design basis for
high moisture technology are the same as fast pyrolysis case described in section 9
A comparison of pellet properties and energy balances for conventional and high-moisture
pelletization processes is given in Table 64. The table shows 2017 Design Case targets to achieve
a 40 to 50% reduction in the total pelletization and drying energy.
Table 64. Drying and densification design basis.
2013 SOT 2017 Target
Infeed Moisture 40% 30%
Dryer Moisture Reduction 28% 11%
Densification Moisture
Reduction
3% 10%
Final Pellet Moisture 9% 9%
Densification Energy 75 kWhr/dry T 50 kWhr/dry T
Drying Energy 350 kWhr/ton 100 kWhr/ton
Pellet Properties
Unit Density 65 lb/ft3 70 lb/ft3
Bulk Density 35 lb/ft3 40 lb/ft3
Durability Greater than 97.5% Greater than 97.5%
The high-moisture densification design basis assumptions are as follows:
Our preliminary studies indicated that it is possible to produce high-quality pellets woody
material; however, for our 2017 Design Case, we are assuming that the process works for
other woody and herbaceous feedstocks to produce durable, high-density pellets.
Technical and cost targets are estimated with the assumption that a grain dryer will be used to
dry high-moisture pellets.
Drying of pellets using energy-efficient driers like grain and belt driers is more economical
compared to conventional rotary driers.
Slow drying at low temperatures of less than 60°C can result in more uniform moisture
distribution in pellets.

134
Cost Estimation for High-Moisture Densification
The cost of densification was estimated using vendor-supplied information and the capacity and
energy assumptions shown in Table 65.
Table 65. Drying and densification cost estimates.
2013 SOT
(2011 $/dry T)
2017Target (2011
$/dry T)
Total Total
Drying 17.20 5.60
Densification 7.70 4.40
Totals 24.90 10.00
Formulation/Blending
To meet feedstock specifications required for various conversion pathways, formulation of
specific mixtures of feedstocks will likely be required. Examples include mixing high and low-
cost feedstocks to meet cost targets, mixing high and low-ash feedstocks to meet an ash target,
mixing of high and low-carbohydrate feedstocks to meet a yield target, and mixing easily and
poorly reactive feedstocks to meet a convertibility target. An example of blending to meet an ash
and moisture specification is shown in Table 66.
Table 66. Feedstock formulation/blending of ash and moisture contents*.
Content Delivered to
Biorefinery Infeed
Pulpwood(45%) Wood
Residues(32%)
Switchgrass
(3%)
C&D
waste(20%)
Final Blend
Ash content (wt. %) 0.5 1.0 4.0 1.0 <1%
Moisture content (%, wet
basis)
9 9 9 9 9
HHV (lb/BTU) 8824 9444 7557 8824 8984
LHV (lb/BTU) 7255 7616 6155 7255 7337
*Pulpwood, wood resides, and switchgrass composition data were obtained from the INL Biomass Library 75.
Assumptions for the formulation design basis are as follows:
Blended feedstocks will be selected and developed to achieve conversion yield
specifications. It is currently unknown how blended feedstocks will perform in the
conversion pathways. The simplest assumption is the blended feedstocks would be the sum
of performances of each individual component. There are on-going trials to test various
blended feedstocks and to compare the conversion efficiencies against a single feedstocks.
Individual feedstocks will be pelleted at depots for shipment to biorefineries. At the
biorefinery, these pelleted feedstocks will be unloaded and conveyed into individual bunkers
for storage. Pellets of the different blendstocks will be metered out into the bunkers in the

135
ratios required of the blends, crushed (using a pellet crusher), and mixed prior to insertion for
the conversion process.
Material will be metered from individual bunkers onto a conveyer and then thoroughly
homogenized through this process with no segregation. Mixing of solids occurs in many
industries and is often problematic when solids of varying density, shape, and size are
blended. This often leads to segregation, either during the mixing or while being transported
to its destination. Mixing of solids is considered a trial-and-error process due to these issues.
The expected unit operations for formulation are shown in Table 67.
Table 67. Feedstock formulation design basis.
2013 SOT (2011 $/dry T) Operating Parameters
Capacity Horsepower
Pellet Pulverizer 100 ton/hour 200 HP
Bulk Storage with
Hopper
30 ton/hour 30 HP
Conveying System 30 ton/hour 40 HP
Research is currently ongoing at INL to examine the compatibility of various feedstocks blends,
with an initial focus on the blends reactivity versus the individual feedstocks. Blends will be
developed for several regions of the United States using the least-cost formulation model as a
starting point and will incorporate feedstocks with varying levels of reactivity (e.g., herbaceous,
woody, and MSW). Reactivity for the fermentation pathway will be investigated first, with
expansion into the other DOE conversion pathways in later fiscal years including bio-oil
conversion via fast pyrolysis.
While the costs for preprocessing of feedstocks (e.g., grinding, chemical preconversion,
pelleting, and drying) are addressed in other parts of the 2017 Design Case, formulation itself
will require a different set of preprocessing options in order to match up with the bio-oil
conversion pathway. These processes include bulk storage, conveying systems and a pellet
pulverizer to insure that the appropriate recipe of material enters the throat of the conversion
reactor in the appropriate blends and sizing requirements.
Cost Estimation for Formulation.
Cost estimation for formulation was estimated based on existing technology, vendor-supplied
information, and equipment performance (Table 68). These costs are cursory and require more
extensive research, especially in their specific application to the bioenergy industry.
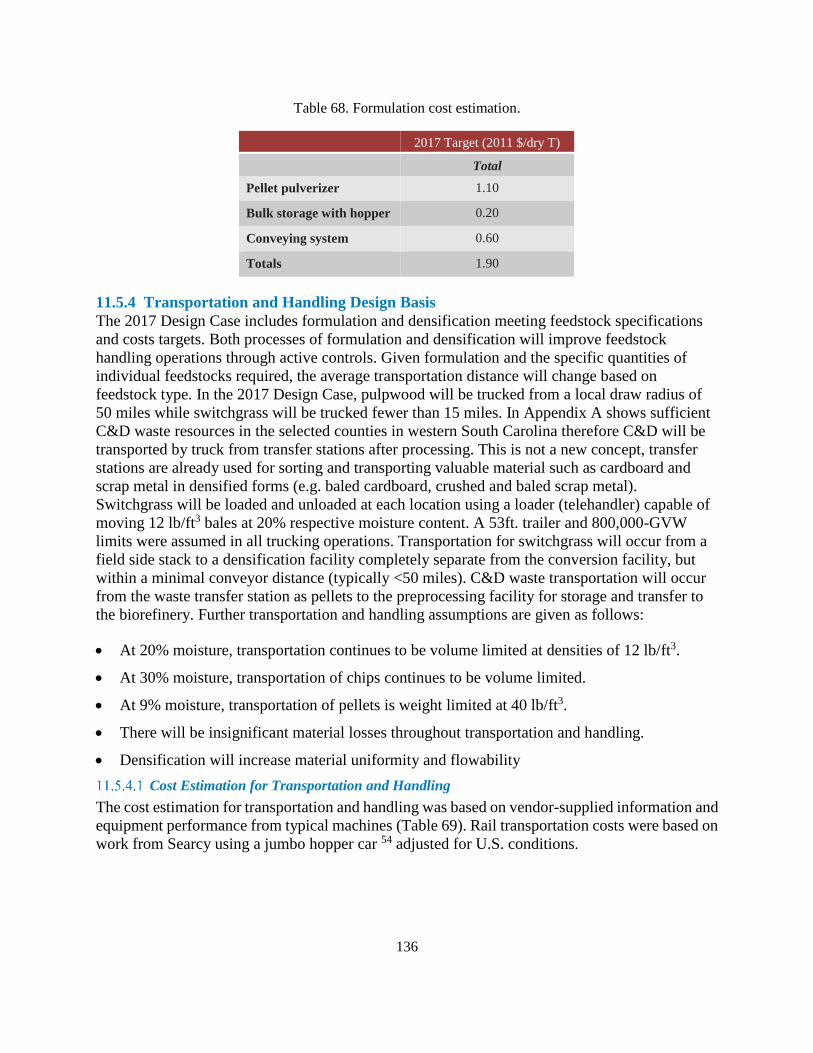
136
Table 68. Formulation cost estimation.
2017 Target (2011 $/dry T)
Total
Pellet pulverizer 1.10
Bulk storage with hopper 0.20
Conveying system 0.60
Totals 1.90
11.5.4 Transportation and Handling Design Basis
The 2017 Design Case includes formulation and densification meeting feedstock specifications
and costs targets. Both processes of formulation and densification will improve feedstock
handling operations through active controls. Given formulation and the specific quantities of
individual feedstocks required, the average transportation distance will change based on
feedstock type. In the 2017 Design Case, pulpwood will be trucked from a local draw radius of
50 miles while switchgrass will be trucked fewer than 15 miles. In Appendix A shows sufficient
C&D waste resources in the selected counties in western South Carolina therefore C&D will be
transported by truck from transfer stations after processing. This is not a new concept, transfer
stations are already used for sorting and transporting valuable material such as cardboard and
scrap metal in densified forms (e.g. baled cardboard, crushed and baled scrap metal).
Switchgrass will be loaded and unloaded at each location using a loader (telehandler) capable of
moving 12 lb/ft3 bales at 20% respective moisture content. A 53ft. trailer and 800,000-GVW
limits were assumed in all trucking operations. Transportation for switchgrass will occur from a
field side stack to a densification facility completely separate from the conversion facility, but
within a minimal conveyor distance (typically <50 miles). C&D waste transportation will occur
from the waste transfer station as pellets to the preprocessing facility for storage and transfer to
the biorefinery. Further transportation and handling assumptions are given as follows:
At 20% moisture, transportation continues to be volume limited at densities of 12 lb/ft3.
At 30% moisture, transportation of chips continues to be volume limited.
At 9% moisture, transportation of pellets is weight limited at 40 lb/ft3.
There will be insignificant material losses throughout transportation and handling.
Densification will increase material uniformity and flowability
Cost Estimation for Transportation and Handling
The cost estimation for transportation and handling was based on vendor-supplied information and
equipment performance from typical machines (Table 69). Rail transportation costs were based on
work from Searcy using a jumbo hopper car 54 adjusted for U.S. conditions.

137
Table 69. Transportation cost estimates.
2013 SOT
(2011 $/dry T)
2017 Target (2011
$/dry T)
Total Total
Truck 14.84* 7.52**
*Individual feedstock therefore one transportation pathway
**Multiple feedstocks therefore multiple transportation
pathways and draw radiuses.
Life Cycle Analysis This section uses a life-cycle assessment (LCA) to evaluate the energy input and GHG emissions
for conversion of Lignocellulosic Biomass to High Octane Gasoline via Indirect Gasification and
Methanol Intermediate Pathway. LCA considered the unit processes involved in the biomass
logistics. Table 70 shows the energy consumption and Table 71 shows GHG contribution for
Lignocellulosic Biomass to High Octane Gasoline via Indirect Gasification and Methanol
Intermediate conversion supply chain design.
Table 70. Energy Consumption for Thermochemical conversion supply chain design.
Process Element Pulpwood Wood
Residues
Switchgrass Construction and
Demolition Waste
(C&D)
Blend
Formulation Contribution 45% 32% 3% 20% –
Harvest and collection
(MBTU/dry T)
182.78 – 122.85 – 85.94
Landing Preprocessing/
Sorting (MBTU/dry T)
231.52 110.25 – 410.25 221.51
Transportation (MBTU/dry
T)
136.87 101.38 99.35 273.73 151.76
Preprocessing (MBTU/dry T) 408.01 408.01 285.83 408.01 404.34
Storage (MBTU/dry T) 8.46 8.46 21.83 8.46 8.86
Handling (MBTU/dry T) 42.69 42.69 41.90 42.69 42.67
Total Energy Consumption
(MBTU/dry T) 1001.33 670.79 571.76 1143.14 915.08

138
Table 71. GHG contribution for thermochemical conversion supply chain design.
Process Element Blend
Formulation Contribution –
Harvest and collection GHGs (Kg CO2e/ dry T) 8.65
Landing Preprocessing GHGs (Kg CO2e/ dry T) 18.95
Transportation GHGs (Kg CO2e/ dry T) 8.62
Preprocessing GHGs (Kg CO2e/ dry T) 34.60
Storage GHGs (Kg CO2e/ dry T) 0.89
Handling GHGs (Kg CO2e/ dry T) 4.2
Total GHGs (Kg CO2e/ dry T) 75.91
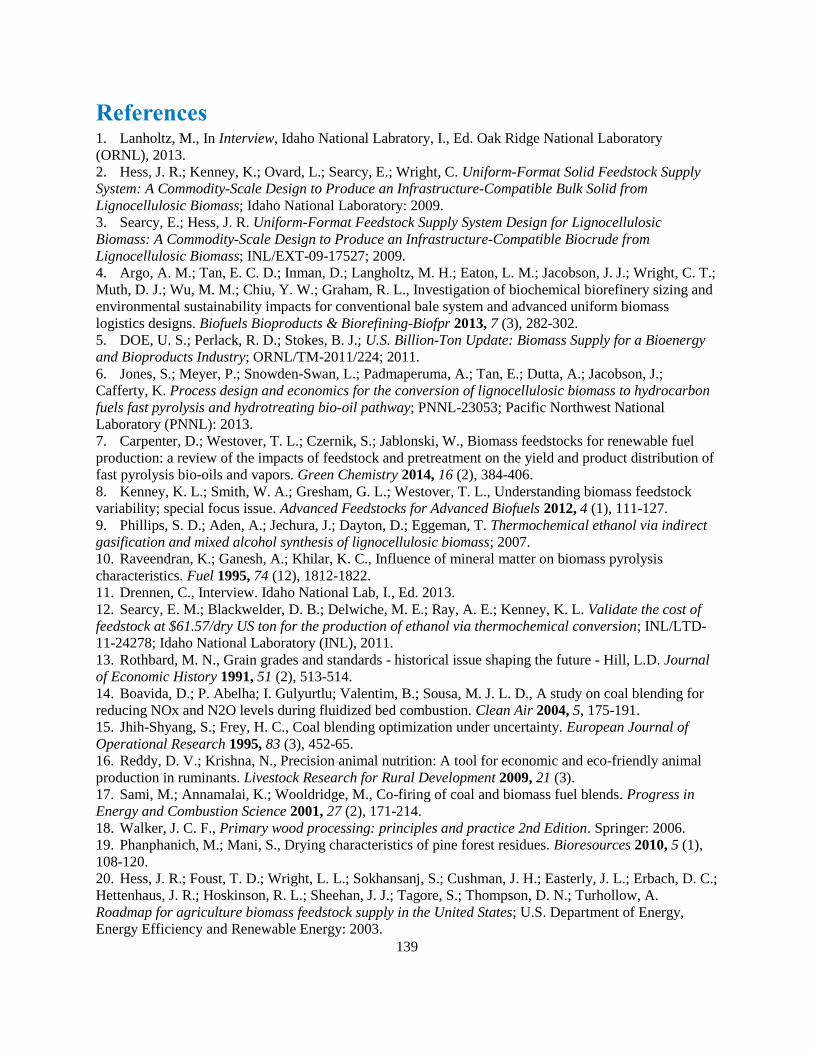
139
References 1. Lanholtz, M., In Interview, Idaho National Labratory, I., Ed. Oak Ridge National Laboratory
(ORNL), 2013.
2. Hess, J. R.; Kenney, K.; Ovard, L.; Searcy, E.; Wright, C. Uniform-Format Solid Feedstock Supply
System: A Commodity-Scale Design to Produce an Infrastructure-Compatible Bulk Solid from
Lignocellulosic Biomass; Idaho National Laboratory: 2009.
3. Searcy, E.; Hess, J. R. Uniform-Format Feedstock Supply System Design for Lignocellulosic
Biomass: A Commodity-Scale Design to Produce an Infrastructure-Compatible Biocrude from
Lignocellulosic Biomass; INL/EXT-09-17527; 2009.
4. Argo, A. M.; Tan, E. C. D.; Inman, D.; Langholtz, M. H.; Eaton, L. M.; Jacobson, J. J.; Wright, C. T.;
Muth, D. J.; Wu, M. M.; Chiu, Y. W.; Graham, R. L., Investigation of biochemical biorefinery sizing and
environmental sustainability impacts for conventional bale system and advanced uniform biomass
logistics designs. Biofuels Bioproducts & Biorefining-Biofpr 2013, 7 (3), 282-302.
5. DOE, U. S.; Perlack, R. D.; Stokes, B. J.; U.S. Billion-Ton Update: Biomass Supply for a Bioenergy
and Bioproducts Industry; ORNL/TM-2011/224; 2011.
6. Jones, S.; Meyer, P.; Snowden-Swan, L.; Padmaperuma, A.; Tan, E.; Dutta, A.; Jacobson, J.;
Cafferty, K. Process design and economics for the conversion of lignocellulosic biomass to hydrocarbon
fuels fast pyrolysis and hydrotreating bio-oil pathway; PNNL-23053; Pacific Northwest National
Laboratory (PNNL): 2013.
7. Carpenter, D.; Westover, T. L.; Czernik, S.; Jablonski, W., Biomass feedstocks for renewable fuel
production: a review of the impacts of feedstock and pretreatment on the yield and product distribution of
fast pyrolysis bio-oils and vapors. Green Chemistry 2014, 16 (2), 384-406.
8. Kenney, K. L.; Smith, W. A.; Gresham, G. L.; Westover, T. L., Understanding biomass feedstock
variability; special focus issue. Advanced Feedstocks for Advanced Biofuels 2012, 4 (1), 111-127.
9. Phillips, S. D.; Aden, A.; Jechura, J.; Dayton, D.; Eggeman, T. Thermochemical ethanol via indirect
gasification and mixed alcohol synthesis of lignocellulosic biomass; 2007.
10. Raveendran, K.; Ganesh, A.; Khilar, K. C., Influence of mineral matter on biomass pyrolysis
characteristics. Fuel 1995, 74 (12), 1812-1822.
11. Drennen, C., Interview. Idaho National Lab, I., Ed. 2013.
12. Searcy, E. M.; Blackwelder, D. B.; Delwiche, M. E.; Ray, A. E.; Kenney, K. L. Validate the cost of
feedstock at $61.57/dry US ton for the production of ethanol via thermochemical conversion; INL/LTD-
11-24278; Idaho National Laboratory (INL), 2011.
13. Rothbard, M. N., Grain grades and standards - historical issue shaping the future - Hill, L.D. Journal
of Economic History 1991, 51 (2), 513-514.
14. Boavida, D.; P. Abelha; I. Gulyurtlu; Valentim, B.; Sousa, M. J. L. D., A study on coal blending for
reducing NOx and N2O levels during fluidized bed combustion. Clean Air 2004, 5, 175-191.
15. Jhih-Shyang, S.; Frey, H. C., Coal blending optimization under uncertainty. European Journal of
Operational Research 1995, 83 (3), 452-65.
16. Reddy, D. V.; Krishna, N., Precision animal nutrition: A tool for economic and eco-friendly animal
production in ruminants. Livestock Research for Rural Development 2009, 21 (3).
17. Sami, M.; Annamalai, K.; Wooldridge, M., Co-firing of coal and biomass fuel blends. Progress in
Energy and Combustion Science 2001, 27 (2), 171-214.
18. Walker, J. C. F., Primary wood processing: principles and practice 2nd Edition. Springer: 2006.
19. Phanphanich, M.; Mani, S., Drying characteristics of pine forest residues. Bioresources 2010, 5 (1),
108-120.
20. Hess, J. R.; Foust, T. D.; Wright, L. L.; Sokhansanj, S.; Cushman, J. H.; Easterly, J. L.; Erbach, D. C.;
Hettenhaus, J. R.; Hoskinson, R. L.; Sheehan, J. J.; Tagore, S.; Thompson, D. N.; Turhollow, A.
Roadmap for agriculture biomass feedstock supply in the United States; U.S. Department of Energy,
Energy Efficiency and Renewable Energy: 2003.

140
21. Templeton, D.; Sluiter, A.; Hayward, T.; Hames, B.; Thomas, S., Assessing corn stover composition
and sources of variability via NIRS. Cellulose 2009, 16 (4), 621-639.
22. Shinners, K. J.; Boettcher, G. C.; Muck, R. E.; Weimer, P. J.; Casler, M. D., Harvest and storage of
two perennial grasses as biomass feedstocks. Transactions of the ASABE 2010, 53 (2), 359-370.
23. Turn, S. Q.; Kinoshita, C. M.; Ishimura, D. M., Removal of inorganic constituents of biomass
feedstocks by mechanical dewatering and leaching. Biomass & Bioenergy 1997, 12 (4), 241-252.
24. Karlen, D. L.; Muth, D. J., Landscape management for sustainable supplies of bioenergy feedstock
and enhanced soil quality. Agrociencia Uruguay, Special Issue 2012.
25. Adler, P. R.; Sanderson, M. A.; Boateng, A. A.; Weimer, P. I.; Jung, H. J. G., Biomass yield and
biofuel quality of switchgrass harvested in fall or spring. Agronomy Journal 2006, 98 (6), 1518-1525.
26. Hoskinson, R. L.; Karlen, D. L.; Birrell, S. J.; Radtke, C. W.; Wilhelm, W. W., Engineering, nutrient
removal, and feedstock conversion evaluations of four corn stover harvest scenarios. ScienceDirect 2007,
(31), 126-136.
27. Wilhelm, W. W.; Johnson, J. M. F.; Lightle, D. T.; Karlen, D. L.; Novak, J. M.; Barbour, N. W.;
Laird, D. A.; Baker, J.; Ochsner, T. E.; Halvorson, A. D.; Archer, D. W.; Arriaga, F., Vertical distribution
of corn stover dry mass grown at several US locations. BioEnergy Research 2011, 4 (1), 11-21.
28. Hess, J. R.; Wright, C. T.; Kenney, K. L., Cellulosic biomass feedstocks and logistics for ethanol
production. Biofuels Bioproducts & Biorefining-Biofpr 2007, 1 (3), 181-190.
29. NREL Process Design and Economics for Biochemical Conversion of Lignocellulosic Biomass to
Ethanol; NREL/TP-5100-47764; September, 2011.
30. Roser, D.; Mola-Yudego, B.; Sikanen, L.; Prinz, R.; Gritten, D.; Emer, B.; Vaatainen, K.; Erkkila, A.,
Natural drying treatments during seasonal storage of wood for bioenergy in different European locations.
Biomass & Bioenergy 2011, 35 (10), 4238-4247.
31. Kim, D.-W.; Murphy, G., Forecasting air-drying rates of small douglas-fir and hybrid poplar stacks in
oregon, USA. International Journal of Forest Engineering 2013, 24 (2), 137-147.
32. He, X.; Lau, A. K.; Sokhansanj, S.; Lim, C. J.; Bi, X. T.; Melin, S., Dry matter losses in combination
with gaseous emissions during the storage of forest residues. Fuel 2012, 95 (1), 662-664.
33. Jirjis, R., Effects of particle size and pile height on storage and fuel quality of comminuted Salix
viminalis. Biomass & Bioenergy 2005, 28 (2), 193-201.
34. Watson, W. F.; Twaddle, A.; Hudson, J. B., Review of chain flail delimbing-debarking. International
Journal of Forest Engineering 1993, 4 (2), 37-51.
35. Jirjis, R., Storage and drying of wood fuel. Biomass & Bioenergy 1995, 9 (1-5), 181-190.
36. Ferrero, F.; Malow, M.; Noll, M., Temperature and gas evolution during large scale outside storage of
wood chips. European Journal of Wood and Wood Products 2011, 69 (4), 587-595.
37. Noll, M.; Jirjis, R., Microbial communities in large-scale wood piles and their effects on wood quality
and the environment. Applied Microbiology and Biotechnology 2012, 95 (3), 551-563.
38. Searcy, E. M.; Blackwelder, D. B.; Delwiche, M. E.; Ray, A. E.; Kenney, K. L., Impact of Screening
on Behavior during Storage and Cost of Ground Small-Diameter Pine Trees: A Case Study. Forest
Products Journal 2011, 61 (7), 570-578.
39. Fuller, W. S., Chip pile storage - a review of practices to avoid deterioration and economic - losses.
Tappi Journal 1985, 68 (8), 48-52.
40. Schutte-Buffalo, H. M. http://www.hammermills.com/size-reduction-product-categories-schutte-
buffalo-hammermill.
41. Yancey, N. A.; Tumuluru, J. S.; Wright, C. T., Drying, Grinding and Pelletization Studies on Raw
and Formulated Biomass Feedstock's for Bioenergy Applications. Journal of Biobased Materials and
Bioenergy 2013, 7 (5), 549-558.
42. Tumuluru, J. S.; Sokhansanj, S.; Hess, J. R.; Wright, C. T.; Boardman, R. D., A review on biomass
torrefaction process and product properties for energy applications. Industrial Biotechnology 2011, 7 (5),
384-401.
43. DOE, U. S. Bioenergy Technologies Office Peer Review 2013.

141
44. Davis, D.; Tao, L.; Tan, E.; Biddy, M.; Beckham, G.; Scarlata, C.; Jacobson, J.; Cafferty, K.; Ross, J.;
Lukas, J.; Knorr, D.; Schoen, P. Process design and economics for the conversion of lignocellulosic
biomass to hydrocarbons: dilute-acid and enzymatic deconstruction of biomass to sugars and biological
conversion of sugars to hydrocarbons; Natioanl Renewable Energy Laboratory: Golden, CO, 2013.
45. CENNATEK Feasibility of improving biomass combustion through extraction of nutrients; 2011; p
107.
46. Humbird, D.; Davis, R.; Tao, L.; Kinchin, C.; Hsu, D.; Aden, A.; Schoen, P.; Lukas, J.; Olthof, B.;
Worley, M.; Sexton, D.; Dudgeon, D. Process design and economics for biochemical conversion of
lignocellulosic biomass to ethanol; 2011.
47. Langholtz, M.; Graham, R.; Eaton, L.; Perlack, R.; Hellwinkel, C.; Ugarte, D. G. D. l. T., Price
projections of feedstocks for biofuels and biopower in the U.S. Energy Policy 2012, 41, 484-493.
48. Bonner, I. J.; Kenney, K. L., Moisture sorption characteristics and modeling of energy sorghum
(Sorghum bicolor (L.) Moench). Journal of Stored Products Research 2013, 52, 128-136.
49. Iowa-State-University, Agriculture and Natural Resources. 2013.
50. Yu, M.; Zeng, G.; Chen, Y.; Yu, H.; Huang, D.; Tang, L., Influence of Phanerochaete chrysosporium
on microbial communities and lignocellulose degradation during solid-state fermentation of rice straw.
Process Biochemistry 2009, 44 (1), 17-22.
51. Selig, M.; Weiss, N.; Ji, Y. Enzymatic saccharification of lignocellulosic biomass: LAP NREL/TP-
510-42629 2008.
52. Dowe, N.; McMillan, J. SSF experimental protocols — lignocellulosic biomass hydrolysis and
fermentation; NREL/TP-510-42630; 2001.
53. Shi, J.; Thompson, V.; Yancey, N.; Stavila, V.; Simmons, B. A.; Singh, S., Impact of mixed
feedstocks and feedstock densification on ionic liquid pretreatment efficiency. Biofuels 2013, 4 (1), 63-
72.
54. Searcy, E.; Flynn, P.; Ghafoori, E.; Kumar, A., The relative cost of biomass energy transport. Applied
Biochemistry and Biotechnology 2007, 137, 639-652.
55. PNNL Process design and economics for the conversion of lignocellulosic biomass to hydrocarbon
fuels; November 2013.
56. Service, U. S. F. Forest Resources of United States, 2012. http://www.fia.fs.fed.us/program-
features/rpa/docs/2012%20RPA_%20Review%20Draft%20Resource%20Tables%2002-18-2014.pdf.
57. Idaho National Lab, I. Feedstock Supply System Design and Economics for Conversion of
Lignocellulosic Biomass to Hydrocarbon Fuels - Conversion Pathway: Biological Conversion of Sugars
to Hydrocarbons: The 2017 Design Case; Idaho Falls, Idaho USA: Idaho National Laboratory, 2013.
58. Taylor, S.; Bob, R.; Corley, F.; Gallagher, T.; Fasina, O.; McDonald, T.; Smidt, M., High tonnage
forest biomass from southern pine. Auburn University: 2012.
59. Werther, J.; Saenger, M.; Hartge, E. U.; Ogada, T.; Siagi, Z., Combustion of agricultural residues.
Progress in Energy and Combustion Science 2000, 26 (1), 1-27.
60. Lindstroem, E.; Oehman, M.; Backman, R.; Bostroem, D., Influence of sand contamination on slag
formation during combustion of wood derived fuels. Energy & Fuels 2008, 22 (4), 2216-2220.
61. Ahmad, M.; Roberts, J.; Hardiman, E.; Singh, R.; Eltis, L.; Bugg, T., Identification of DypB
rhodococcus jostii RHA1 as a lignin perozidase. Biochemistry 2011, 50, 5096-5107.
62. Das, K. C.; Singh, K.; Bibens, B.; Hilten, R.; Baker, S. A.; Greene, W. D.; Peterson, J. D., Pyrolysis
characteristics of forest residues obtained from different harvesting methods. Applied Engineering in
Agriculture 2011, 27 (1), 107-113.
63. Bartels, D.; Sunkar, R., Drought and salt tolerance in plants. Critical Reviews in Plant Sciences 2005,
24 (1), 23-58.
64. Cutshall, J.; Greene, D.; Baker, S.; Mitchell, D., Transpirational drying effects on energy and ash
content from whole-tree chipping operations in a southern pine plantation. 34th Council on Forest
Engineering 2011.

142
65. Dukes, C. C.; Baker, S. A.; Greene, W. D., In-wood grinding and screening of forest residues for
biomass feedstock applications. Biomass & Bioenergy 2013, 54, 18-26.
66. Baker, S. A.; Westbrook, M. D., Jr.; Greene, W. D., Evaluation of integrated harvesting systems in
pine stands of the southern United States. Biomass & Bioenergy 2010, 34 (5), 720-727.
67. Smidt, M.; Tufts, R.; Gallagher, T., Logging efficiency and cost. In ANR-1347 - Alabama
Cooperative Extension System, 2009.
68. Hiesl, P.; Benjamin, J. G., Applicability of international harvesting equipment productivity studies in
maine, USA: a literature review. Forests 2013, 4 (4), 898-921.
69. Jones, P. D.; Grado, S. C.; Demarais, S., Financial analysis of intensive pine plantation establishment.
Journal of Forest Economics 2010, 16 (2), 101-112.
70. Cunningham, K.; Barry, J.; Walkingstick, T. Managing loblolly pine stands...a to z; FSA5023;
University of Arkansas Division of Agriculture, Director, Cooperative Extension Service, University of
Agriculture, Cooperative Extension Service
Arkansas, December 2013, 2013.
71. McLaughlin, S. B.; Kszos, L. A., Development of switchgrass (Panicum virgatum) as a bioenergy
feedstock in the United States. Biomass & Bioenergy 2005, 28 (6), 515-535.
72. Smith, W. A.; Bonner, I. J.; Kenney, K. L.; Wendt, L. M., Practical considerations of moisture in
baled biomass feedstocks. Biofuels 2013, 4 (1), 95-110.
73. Cundiff, J. S.; Marsh, L. S., Harvest and storage costs for bales of switchgrass in the southeastern
United States. Bioresource Technology 1996, 56 (1), 95-101.
74. Darr, M. J.; Shah, A., Biomass storage: and update on industrial solutions for baled biomass
feedstocks. Biofuels 2012, 3 (3), 321-332.
75. Idaho National Laboratory, I. Biomass Analytical Library.
https://inlportal.inl.gov/portal/server.pt?open=514&objID=1350&mode=2.
76. News, W. R. July 20, 2012.
77. Valkenburg, C.; Gerber, M. A.; Walton, C. W.; Jones, S. B.; Thompson, B. L.; Stevens, D. J.,
Municipal solid waste (MSW) to liquid fuels synthesis. Availability of feedstock and technology, 2008, 1
(PNNL-18144).
78. Shi, J.; Ebrik, M.; Yang, B.; Wyman, C., The potential of cellulosic ethanol production from
municipal solid waste: a technical and economic evaluation. University of California Energy Institute:
Berkeley, California, 2009.
79. Gustafson, R.; Bura, R.; Cooper, J.; McMahon, R.; Schmitt, E.; Vajzovic, A., Converting Washington
lignocellulosic rich urban waste to ethanol. Ecology Publication: Washington State University 2009, 09-
07-060.
80. Yan, S.; Yao, J.; Yao, L.; Zhi, Z.; Chen, X.; Wu, J., Fed batch enzymatic saccharification of food
waste improves the sugar concentration in the hydrolysates and eventually the ethanol fermentation by
Saccharomyces cerevisiae H058. Brazilian Arch. Biol. Technology 2012, 55 (2), 183-192.
81. Idaho National Lab, I. Unpublished data generated at INL.
82. Cho, D. H.; Shin, S. J.; Bae, Y.; Park, C.; Kim, Y. H., Ethanol production from acid hydrolysates
based on the construction and demolition wood waste using Pichia stipitis,. Bioresource Technology
2011, 102, 4439-4443.
83. Gresham, G. L.; Emerson, R.; Hoover, A.; Miller, A.; Kenney, K. L. Evolution and Development of
Effective Feedstock Specifications; Milestone Completion Report, #ID 2.1.1.1.A.ML.3; Idaho National
Laboratory, 2013.
84. Jenkins, B. M., Biomass leachate treatment by reverse osmosis. Fuel Processing Technology 2003,
81, 223-246.
85. ASABE ASABE Standards: Agricultural Machinery Management Data. .
http://asae.frymulti.com/standards.asp.
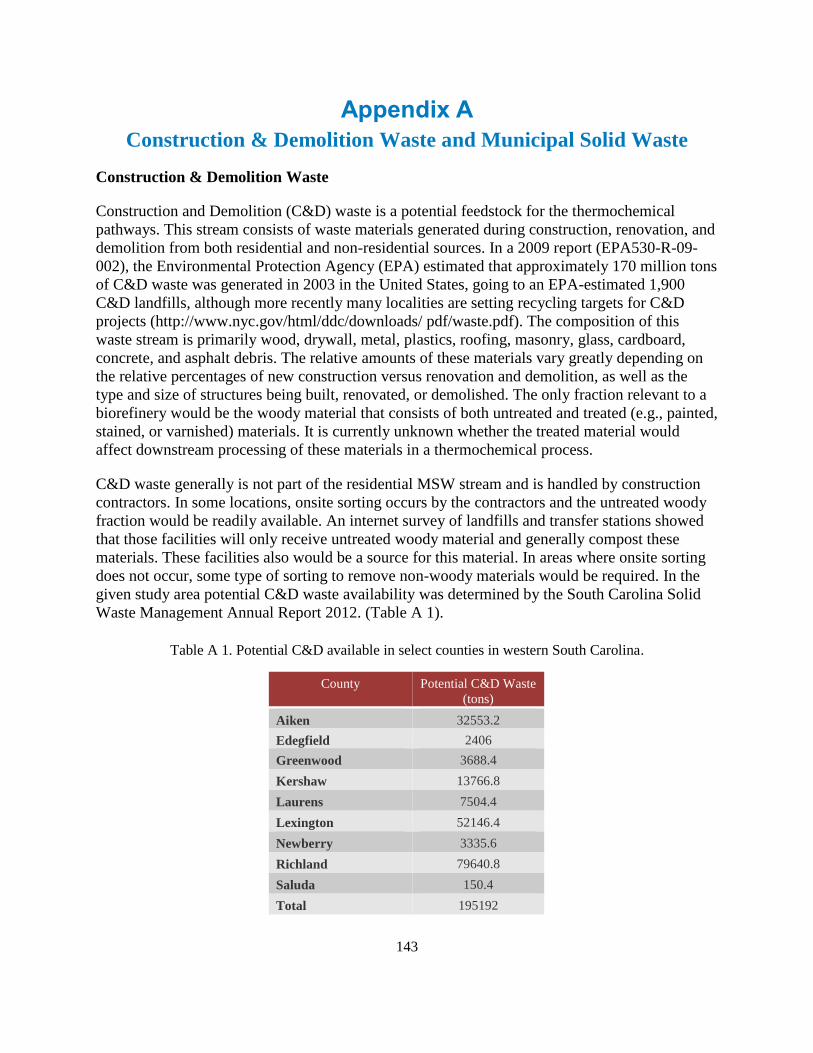
143
Appendix A
Construction & Demolition Waste and Municipal Solid Waste
Construction & Demolition Waste
Construction and Demolition (C&D) waste is a potential feedstock for the thermochemical
pathways. This stream consists of waste materials generated during construction, renovation, and
demolition from both residential and non-residential sources. In a 2009 report (EPA530-R-09-
002), the Environmental Protection Agency (EPA) estimated that approximately 170 million tons
of C&D waste was generated in 2003 in the United States, going to an EPA-estimated 1,900
C&D landfills, although more recently many localities are setting recycling targets for C&D
projects (http://www.nyc.gov/html/ddc/downloads/ pdf/waste.pdf). The composition of this
waste stream is primarily wood, drywall, metal, plastics, roofing, masonry, glass, cardboard,
concrete, and asphalt debris. The relative amounts of these materials vary greatly depending on
the relative percentages of new construction versus renovation and demolition, as well as the
type and size of structures being built, renovated, or demolished. The only fraction relevant to a
biorefinery would be the woody material that consists of both untreated and treated (e.g., painted,
stained, or varnished) materials. It is currently unknown whether the treated material would
affect downstream processing of these materials in a thermochemical process.
C&D waste generally is not part of the residential MSW stream and is handled by construction
contractors. In some locations, onsite sorting occurs by the contractors and the untreated woody
fraction would be readily available. An internet survey of landfills and transfer stations showed
that those facilities will only receive untreated woody material and generally compost these
materials. These facilities also would be a source for this material. In areas where onsite sorting
does not occur, some type of sorting to remove non-woody materials would be required. In the
given study area potential C&D waste availability was determined by the South Carolina Solid
Waste Management Annual Report 2012. (Table A 1).
Table A 1. Potential C&D available in select counties in western South Carolina.
County Potential C&D Waste
(tons)
Aiken 32553.2
Edegfield 2406
Greenwood 3688.4
Kershaw 13766.8
Laurens 7504.4
Lexington 52146.4
Newberry 3335.6
Richland 79640.8
Saluda 150.4
Total 195192

144
Municipal Solid Waste
MSW is attractive as a feedstock because it is available year-round, it already has an established
infrastructure for collection and handling, and it has the potential to be low cost. MSW currently
is a negative cost feedstock because municipalities paid an average of $49.27/ton in 2012, with a
range from $18.43 in Idaho to $105.40 in Massachusetts for landfilling 76. While it is unlikely
that MSW will be available to the biorefinery at negative costs because MSW will require
processing to separate out the fractions of interest and will require other types of preprocessing
to upgrade the quality, it likely will still be available at lower cost than other herbaceous
feedstocks. An average composition of MSW is provided in Table A 2.
Table A 2. National average municipal solid waste composition.
Material % Total MSW
Paper and paperboard 28.5%
Glass 4.6%
Steel 6.8%
Aluminum 1.4%
Other nonferrous metals 0.8%
Plastics 12.4%
Rubber and leather 3.1%
Textiles 5.3%
Wood 6.4%
Other materials 1.9%
Food 13.9%
Yard trimmings 13.4%
Misc. inorganic waste 1.5%
Candidate materials for the biochemical pathway include paper and paperboard, food, and yard
waste. Of these, paper and paperboard are likely to have more value when recycled than as a
feedstock for fuels; however, there is still a significant fraction of paper and paperboard that is
non-recyclable, including coated paper and cardboard, polycoat material, glossy papers such as
magazines, food-contaminated papers and cardboards, and any material with binders such as
phone books.
Table A 3 shows generation rates for these fractions for 14 different state and/or regions. Of
these fractions, food waste has the highest rate of generation and will be available year-round.
Non-recyclable paper has the next highest generation rate and also would be available year-
round. Yard waste has the lowest rate of generation and may not be available year-round
depending on location.

145
Table A 3. Per capita generation rates for various fractions of municipal solid waste and construction and
demolition waste (lb/person/day).
Location Yard waste Food waste Non-recyclable
paper
Untreated wood
C&D waste
AZ – Phoenix1 0.40 0.29 0.11 0.03
CO - Boulder
Co.
0.52 0.58 0.33 0.07
CO - Larimer
Co.
0.19 0.39 0.34 0.12
CT 0.27 0.50 0.44 0.10
DE 0.46 0.66 0.61 0.38
HI 0.16 0.72 0.16 0.09
IA 0.18 0.53 0.40 0.22
IL 0.14 0.95 0.47 0.15
MA -eastern 0.17 0.89 0.47 0.15
MA-central 0.10 0.40 0.19 0.06
MN 0.07 0.41 0.40 0.15
PA 0.06 0.50 0.52 0.24
WA 0.17 0.54 0.22 0.14
WI 0.06 0.49 0.41 0.61
Average 0.21 0.56 0.36 0.18 1See references for information on the individual waste characterization studies.
Other considerations for these MSW fractions include moisture content, ash content,
carbohydrate content, compatibility with other biorefinery operations, and obtaining a clean feed
stream of these fractions from mixed MSW (Table A 4).
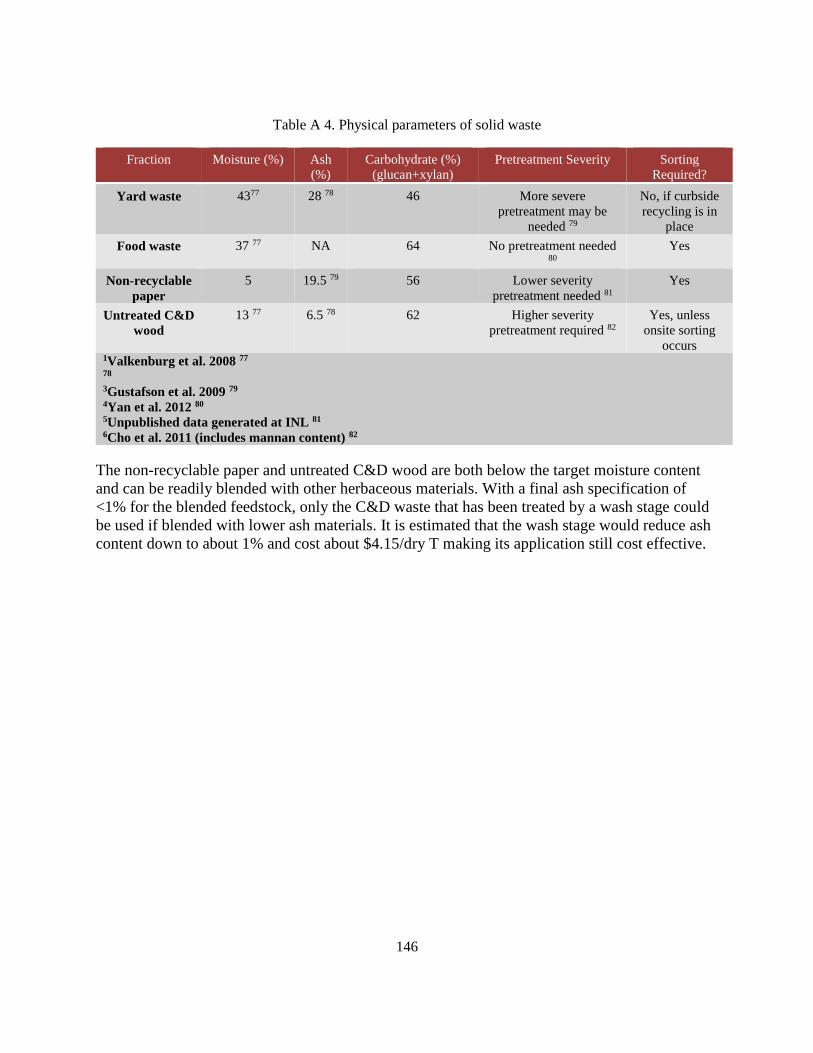
146
Table A 4. Physical parameters of solid waste
Fraction Moisture (%) Ash
(%)
Carbohydrate (%)
(glucan+xylan)
Pretreatment Severity Sorting
Required?
Yard waste 4377 28 78 46 More severe
pretreatment may be
needed 79
No, if curbside
recycling is in
place
Food waste 37 77 NA 64 No pretreatment needed 80
Yes
Non-recyclable
paper
5 19.5 79 56 Lower severity
pretreatment needed 81
Yes
Untreated C&D
wood
13 77 6.5 78 62 Higher severity
pretreatment required 82
Yes, unless
onsite sorting
occurs 1Valkenburg et al. 2008 77 78 3Gustafson et al. 2009 79 4Yan et al. 2012 80 5Unpublished data generated at INL 81 6Cho et al. 2011 (includes mannan content) 82
The non-recyclable paper and untreated C&D wood are both below the target moisture content
and can be readily blended with other herbaceous materials. With a final ash specification of
<1% for the blended feedstock, only the C&D waste that has been treated by a wash stage could
be used if blended with lower ash materials. It is estimated that the wash stage would reduce ash
content down to about 1% and cost about $4.15/dry T making its application still cost effective.

147
Appendix B Least Cost Formulation
The biofuel conversion quality in-feed specifications have a large impact on whether or not a
particular feedstock is cost effective. Raw biomass standing in the field is aerobically unstable,
high in moisture and does not qualify as a feedstock; certain upgrades to the raw biomass are
needed to make it compatible with conversion requirements. In addition, raw biomass is highly
variable even within a single field.
In response to the variability in biomass quality, a variety of more robust biofuel conversion
technologies are being developed, even though it is unlikely a single best conversion technology
will be capable of handling all the variability experienced within raw biomass. Other approaches
to addressing the variability include blending/formulation, leaching, densification, and other
preprocessing options.
By combining analyses using farm gate price assumptions with quality specifications obtained
from the Biomass R&D Library, gains in the projected volumes available at cost and biorefinery
specifications are being realized by transitioning to a blended feedstock approach. Feedstock
blending allows a conversion facility to collect less of any one feedstock and thus pay a lower
average price for each feedstock by moving down the cost vs. supply curve.
In addition, with blended feedstocks biomass quality is a key aspect to consider when analyzing
cost and volume availability. Formulating a designed feedstock through blending and other pre-
processing logistical methods allows low cost and typically low quality biomass to be blended
with biomass of higher cost and typically higher quality to achieve the specifications at the in-
feed of a conversion facility. The use of low cost biomass allows the supply chain to implement
additional preprocessing technologies that actively control feedstock quality, while also bringing
more biomass into the system. This analysis and design approach is being called the “least-cost
formulation” (LCF) strategy.
The LCF concept is best explained through an example of how it is calculated. This analysis
focuses on the baseline scenario located in western Kansas to illustrate the least-cost formulation
approach to resource selection for the 2017 Design Case. This approach challenges the single-
feedstock paradigm by allowing multiple available resources to compete based on cost, quantity,
and quality considerations. It ultimately is demonstrated that such an approach can contribute
significant cost reductions to biomass feedstock supply. Note that it is assumed that a blended
feedstock will perform “like” the single feedstock. There are a number of collaboration projects
between the INL and NREL and PNNL to test these blended feedstocks and evaluate their
performance compared to single feedstocks.
At present most cellulosic biomass feedstock supply systems are designed around a single
feedstock, typically corn stover. Figure B1 illustrates the available corn stover and switchgrass at
varying farm gate prices for the western Kansas scenario. Note that these supply curves represent
the projected cost (i.e., farm gate) and quantity available in 2017 based on data from The Billion
Ton Update 5. In order to account for losses throughout the supply chain, particularly dry matter
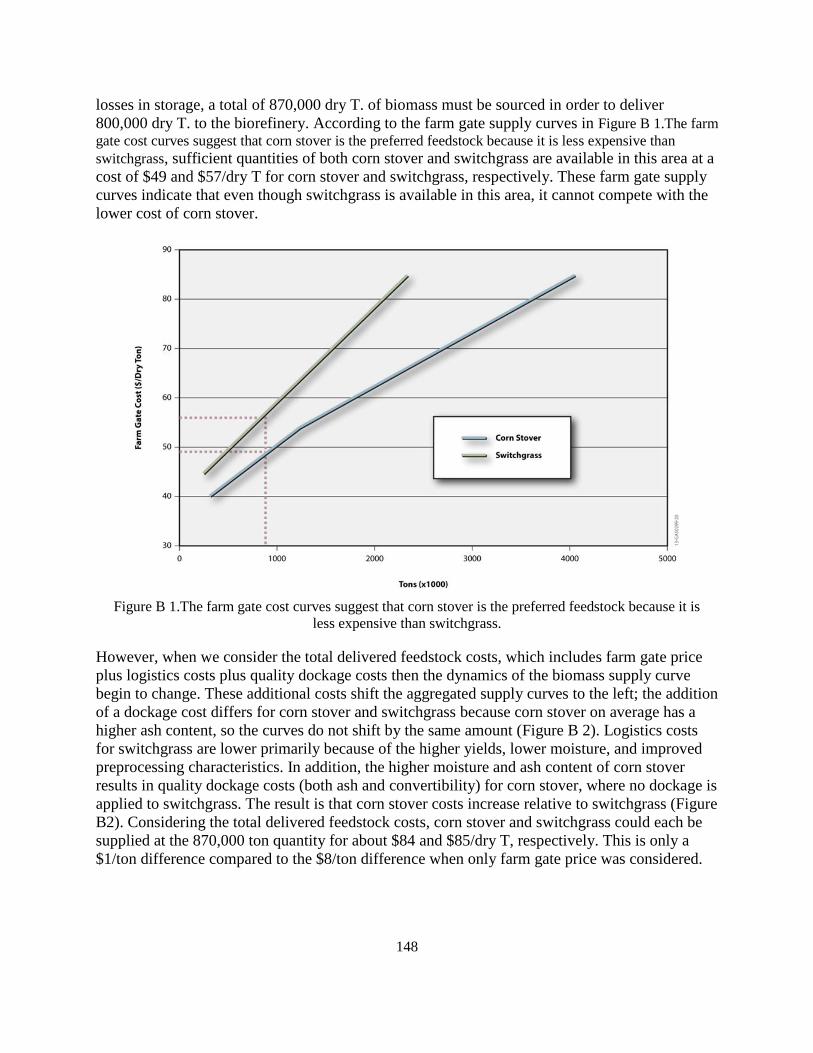
148
losses in storage, a total of 870,000 dry T. of biomass must be sourced in order to deliver
800,000 dry T. to the biorefinery. According to the farm gate supply curves in Figure B 1.The farm
gate cost curves suggest that corn stover is the preferred feedstock because it is less expensive than
switchgrass, sufficient quantities of both corn stover and switchgrass are available in this area at a
cost of $49 and $57/dry T for corn stover and switchgrass, respectively. These farm gate supply
curves indicate that even though switchgrass is available in this area, it cannot compete with the
lower cost of corn stover.
Figure B 1.The farm gate cost curves suggest that corn stover is the preferred feedstock because it is
less expensive than switchgrass.
However, when we consider the total delivered feedstock costs, which includes farm gate price
plus logistics costs plus quality dockage costs then the dynamics of the biomass supply curve
begin to change. These additional costs shift the aggregated supply curves to the left; the addition
of a dockage cost differs for corn stover and switchgrass because corn stover on average has a
higher ash content, so the curves do not shift by the same amount (Figure B 2). Logistics costs
for switchgrass are lower primarily because of the higher yields, lower moisture, and improved
preprocessing characteristics. In addition, the higher moisture and ash content of corn stover
results in quality dockage costs (both ash and convertibility) for corn stover, where no dockage is
applied to switchgrass. The result is that corn stover costs increase relative to switchgrass (Figure
B2). Considering the total delivered feedstock costs, corn stover and switchgrass could each be
supplied at the 870,000 ton quantity for about $84 and $85/dry T, respectively. This is only a
$1/ton difference compared to the $8/ton difference when only farm gate price was considered.

149
Figure B 2. Accounting for quality (dockage)—shows that about 300,000 tons of switchgrass can be
supplied at a lower cost than corn stover.
The feedstock supply curves in Figure B 3 identify an opportunity for those not wed to a single
feedstock. These supply/demand curves indicate that about 300,000 tons of switchgrass can be
sourced at a lower cost than corn stover; however, beyond this amount, corn stove once again is
more affordable. This gives rise to the least-cost formulation or blended feedstock strategy,
which, in this case, replaces higher cost corn stover with lower cost switchgrass. By sourcing
300,000 tons of switchgrass and 550,000 tons of corn stover, a corn stover/switchgrass blend can
be supplied and delivered at about $81/dry T, compared to $84/dry T for corn stover and $85/dry
T for switchgrass (Figure B3)
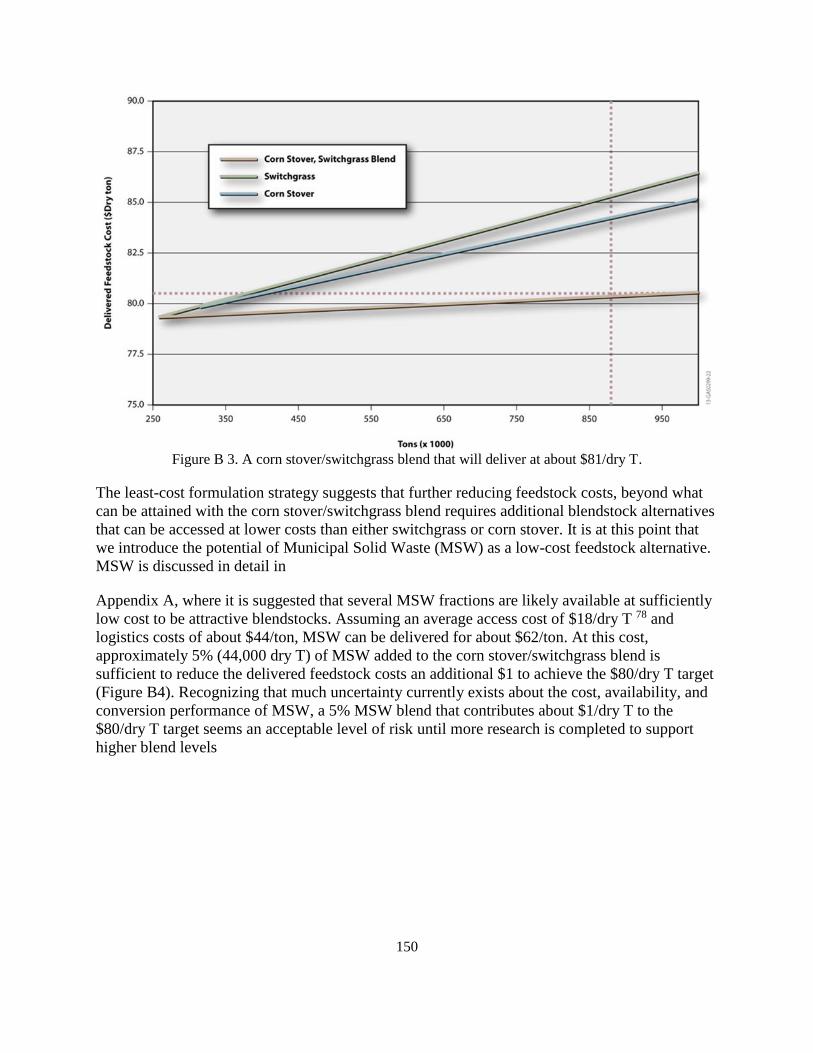
150
Figure B 3. A corn stover/switchgrass blend that will deliver at about $81/dry T.
The least-cost formulation strategy suggests that further reducing feedstock costs, beyond what
can be attained with the corn stover/switchgrass blend requires additional blendstock alternatives
that can be accessed at lower costs than either switchgrass or corn stover. It is at this point that
we introduce the potential of Municipal Solid Waste (MSW) as a low-cost feedstock alternative.
MSW is discussed in detail in
Appendix A, where it is suggested that several MSW fractions are likely available at sufficiently
low cost to be attractive blendstocks. Assuming an average access cost of $18/dry T 78 and
logistics costs of about $44/ton, MSW can be delivered for about $62/ton. At this cost,
approximately 5% (44,000 dry T) of MSW added to the corn stover/switchgrass blend is
sufficient to reduce the delivered feedstock costs an additional $1 to achieve the $80/dry T target
(Figure B4). Recognizing that much uncertainty currently exists about the cost, availability, and
conversion performance of MSW, a 5% MSW blend that contributes about $1/dry T to the
$80/dry T target seems an acceptable level of risk until more research is completed to support
higher blend levels
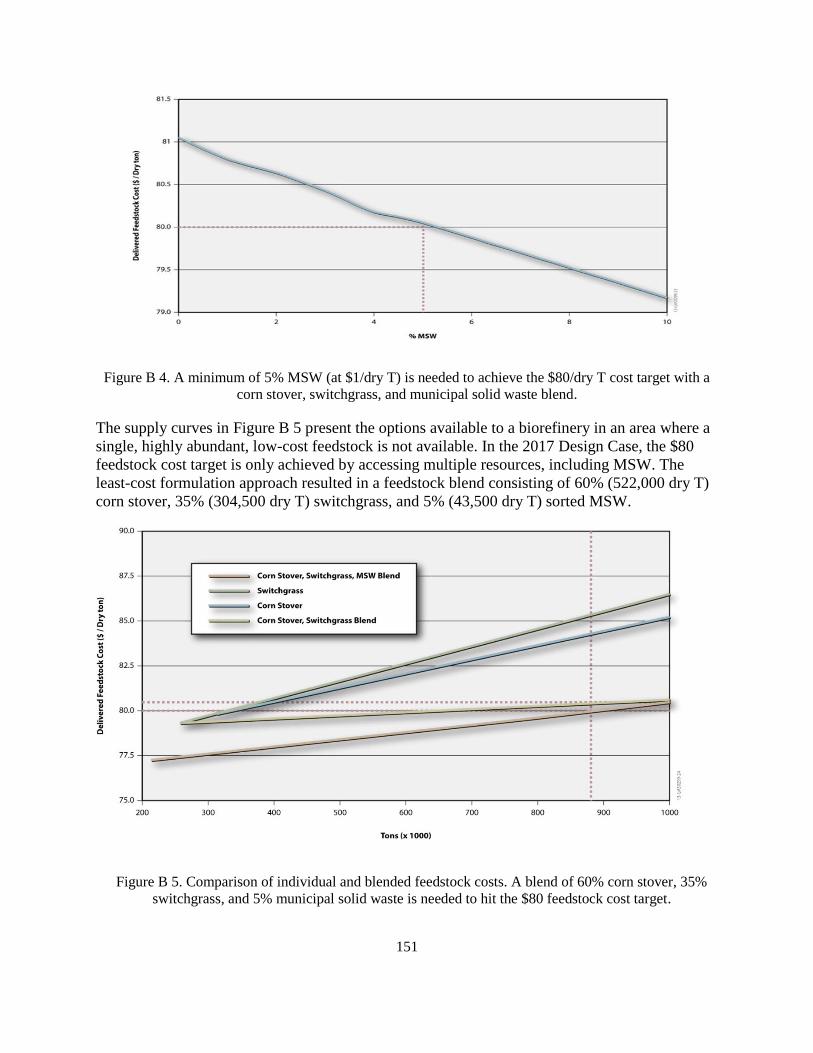
151
Figure B 4. A minimum of 5% MSW (at $1/dry T) is needed to achieve the $80/dry T cost target with a
corn stover, switchgrass, and municipal solid waste blend.
The supply curves in Figure B 5 present the options available to a biorefinery in an area where a
single, highly abundant, low-cost feedstock is not available. In the 2017 Design Case, the $80
feedstock cost target is only achieved by accessing multiple resources, including MSW. The
least-cost formulation approach resulted in a feedstock blend consisting of 60% (522,000 dry T)
corn stover, 35% (304,500 dry T) switchgrass, and 5% (43,500 dry T) sorted MSW.
Figure B 5. Comparison of individual and blended feedstock costs. A blend of 60% corn stover, 35%
switchgrass, and 5% municipal solid waste is needed to hit the $80 feedstock cost target.

152
The availability of these resources for the western Kansas scenario that was chosen to
demonstrate the 2017 Design Case is illustrated in Figure 18. Corn stover and switchgrass are
available within a 35-mile supply radius of the biorefinery. The source of MSW generally is tied
to human generation; therefore, even 5% MSW requires a rather sizeable human population. This
means that the MSW supply associated with this scenario comes out of the Denver, Colorado
metropolitan area. It is not unusual for large metropolitan areas to ship their MSW to distant
landfills; therefore, this scenario is likely replicable to many areas around the country.

153
Appendix C
Off-Specifications Feedstock Dockage Approach
Ash serves no purpose in a conversion process, and in fact will result in additional costs for
disposal, machine wear, and potential negative implications on the process itself. In order to
mitigate these costs, they must be subtracted from the purchase payment of biomass that contains
unacceptable levels of ash contamination. This milestone report demonstrates the potential
impact of off-specification ash content in a traditional, well vetted liquid fuel conversion system.
The analysis below was based on the costs 83 where feedstock procurement is priced at 58.50
$/DMT. Disposal of ash was applied at 28.86 $/dry T of ash. The ethanol conversion yield of 79
gal/dry T was used to estimate non-enzymatic manufacturing costs and capital costs at 23.94
$/dry T and 13.83 $/dry T, respectively. The analysis assumes that ash content is measured at the
point of sale between a feedstock supplier and refinery (exchange-point), and payout is based on
the delivered material’s quality compared to a baseline feedstock containing 5% ash. It was
assumed that production quality and quantity must be maintained, such that the decreased yield
resulting from off-specification (high ash) feedstock will require additional biomass to be
purchased and processed to match the yield anticipated from baseline feedstocks. Five
individually calculated dockages encompass the reduced value of off-specification materials: (1)
the decrease value of above-baseline feedstocks due to mass displacement by ash; ‘off-
specification doc’, (2) the cost of additional ash disposal; ‘disposal doc’, (3) the cost associated
with sourcing additional feedstock; ‘replacement doc’, (4) the added cost of processing more
material on manufacturing expenses; ‘manufacturing doc’, and (5) the cost of capital expansion
from handling addition quantities of material; ‘capital dock’.
Figure C 1. Sensitivity of dockage by altering feedstock ash content relative to the baseline ash content of
4.9% 83.
$(4.00)
$(3.00)
$(2.00)
$(1.00)
$-
$1.00
$2.00
$3.00
$4.00
-60% -40% -20% 0% 20% 40% 60%
Do
ckag
e, $
/DM
T
Change in Feedstock Ash Content Relative to Baseline
Off-Spec Doc
Disposal Doc
Replacement Doc
Manufac Doc
Capital Doc
Total Dock

154
The off-specification dockage was found to be the greatest contributor to the total dockage (45%
of the total dockage), and the most sensitive to increases in delivered feedstock ash content
followed by additional disposal (22% of the total cost; Figure C 2, where a 50% relative increase
in ash equates to 7.4% ash). This is important as the dockage associated with delivering off-
specification material, accounting for additional disposal, and the cost of replacement are largely
process independent and likely to be accounted for in the biomass supply and logistics cost basis.
On the other hand, the estimates of manufacturing and capital are highly process dependent and
thus subject to criticism for their inclusion in a feedstock delivery dockage. Furthermore, the
argument can be made from this data that if a dockage is to be applied to material arriving above
the baseline specification due to its decreased value, materials of value greater (i.e., ash content
lower than the baseline) would in theory warrant a positive purchase price incentive. In the case
of this data, a feedstock delivered at -50% relative ash content to the baseline (2.5% ash) would
in essence qualify for a 3.16 $/dry T bonus on top of the baseline feedstock purchase price of
58.50 $/dry T. While this type of system has not yet been proposed for a commercial system, this
type of financial motivation may provide further incentive for farmers to invest in single-pass
technology as the material generated is truly of higher value to a conversion facility.
Figure C 2. Sensitivity of the costs impacts to altering feedstock price relative to the base case of 58.50
$/dry T for a delivered feedstock with 10% ash83.
To demonstrate the importance of a proper feedstock procurement cost, the analysis was
conducted over a range of feedstock prices, from 29.25 $/dry T to 87.75 $/dry T (-50% to 50%
change, respectively) for a delivered feedstock with 10% ash (Figure C 3). The results clearly
show the impact of feedstock price on off-specification cost impacts and ultimately total costs,
increasing the total costs by 0.03 $/% relative change. When considering the 2017 Design Case
target feedstock price of 80$/dry T (a 37%), the total costs impact rises to 7.91 $/dry T for a 10%
ash delivered material, where the off-specification costs now accounts for 52% of the total cost
impacts. This case exemplifies the ability of feedstock price to inflate off-specification cost
$-
$1
$2
$3
$4
$5
$6
$7
$8
$9
-60% -40% -20% 0% 20% 40% 60%
Do
ckag
e, $
/dry
T
Change in Feedstock Price
Off-Spec Doc
Disposal Doc
Replacement Doc
Manufac Doc
Capital Doc
Total Dock
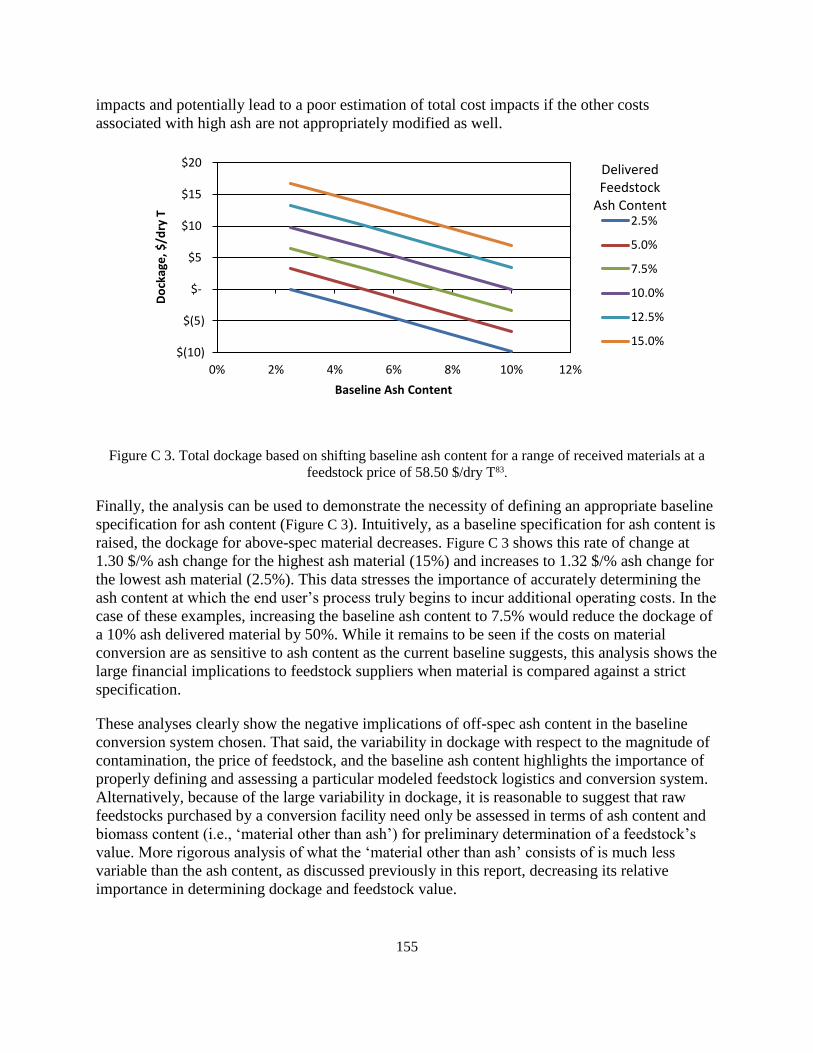
155
impacts and potentially lead to a poor estimation of total cost impacts if the other costs
associated with high ash are not appropriately modified as well.
Figure C 3. Total dockage based on shifting baseline ash content for a range of received materials at a
feedstock price of 58.50 $/dry T83.
Finally, the analysis can be used to demonstrate the necessity of defining an appropriate baseline
specification for ash content (Figure C 3). Intuitively, as a baseline specification for ash content is
raised, the dockage for above-spec material decreases. Figure C 3 shows this rate of change at
1.30 $/% ash change for the highest ash material (15%) and increases to 1.32 $/% ash change for
the lowest ash material (2.5%). This data stresses the importance of accurately determining the
ash content at which the end user’s process truly begins to incur additional operating costs. In the
case of these examples, increasing the baseline ash content to 7.5% would reduce the dockage of
a 10% ash delivered material by 50%. While it remains to be seen if the costs on material
conversion are as sensitive to ash content as the current baseline suggests, this analysis shows the
large financial implications to feedstock suppliers when material is compared against a strict
specification.
These analyses clearly show the negative implications of off-spec ash content in the baseline
conversion system chosen. That said, the variability in dockage with respect to the magnitude of
contamination, the price of feedstock, and the baseline ash content highlights the importance of
properly defining and assessing a particular modeled feedstock logistics and conversion system.
Alternatively, because of the large variability in dockage, it is reasonable to suggest that raw
feedstocks purchased by a conversion facility need only be assessed in terms of ash content and
biomass content (i.e., ‘material other than ash’) for preliminary determination of a feedstock’s
value. More rigorous analysis of what the ‘material other than ash’ consists of is much less
variable than the ash content, as discussed previously in this report, decreasing its relative
importance in determining dockage and feedstock value.
$(10)
$(5)
$-
$5
$10
$15
$20
0% 2% 4% 6% 8% 10% 12%
Do
ckag
e, $
/dry
T
Baseline Ash Content
2.5%
5.0%
7.5%
10.0%
12.5%
15.0%
Delivered Feedstock
Ash Content
156
Appendix D Chemical Preconversion Design Basis
Leaching Technologies for Soluble Ash
Alkali metals can be removed easily from biomass after grinding with simple water leaching.
Alkaline earth metals can be effectively leached with the addition of acid and heat. Simple
leaching with water can be accomplished by spraying while in-field (after windrowing), with
detraction of the potential for high losses of convertible sugars. Engineered systems for leaching
are typically simple in design, allowing for solvent (water or dilute catalyst solutions) addition,
collection, and recycle (if necessary); leachate neutralization and treatment (or disposal); and
drying. A simple design for leaching in a depot is a drain and fill leaching system 84. In this
design, chopped or ground biomass is conveyed into a leach tank and leach solution (with or
without catalyst) is added to achieve the desired percentage solids. Because leaching is solubility
limited, lower percentage solids are preferred; however, if more than one leach cycle can be
accommodated, then higher percentage solids could be used, thereby reducing water usage. After
leaching, the leach solution is drained to a waste tank, and fresh water is introduced to wash the
remaining soluble ash from the biomass (this may occur in several cycles as well). The wash
liquid is drained to the waste tank as well. Once washing is completed, the solids are conveyed
from the leach tank through a roller press, which mechanically dewaters the biomass. The solids
are conveyed to a wet mill and then to a wet pelleting mill. The liquids in the waste tank are
neutralized and processed by reverse osmosis, from which the permeate is recycled to the
makeup water and the retentate is pumped to wastewater treatment. These operations and the
accompanying assumptions are summarized in Table D 1.

157
Table D 1. Expected unit operations and assumptions for the application of a drain and fill leaching
system for the removal of soluble ash from biomass in a feedstock depot.
Expected Unit Operation Assumptions
Convey chopped herbaceous biomass or
shredded MSW to leach tank
• Herbaceous: 2-in. screen
• MSW: 6-in. screen
Leaching (water or dilute acid, steam heat
with agitation)
• Volume tied to depot throughput
• Fill and drain leach tank with agitation
• 10 wt% solids
• 5 cycles of 1 hour
• 95% reduction of alkali metals and alkaline earth metals
• Sulfuric acid at 0.5 wt%
• Heated to 40°C
Drain leach solution to waste tank • Pump not needed
Add water, agitate, and drain liquids to
waste tank
• Pump not needed
• 5 cycles of 30 minutes
Convey leached solids through roller
press, send expressed water to drain tank
• Exiting solids are 50% moisture
• Greater than 95% recovery of solids
Dry solids • Exiting solids are 30% moisture
Convey wet solids to wet mill • Particle size 6 mm or less for herbaceous and MSW
Convey wet solids to wet pelletization NA
Neutralize liquids in waste tank • Final pH 6-8
• Bicarbonate used for acid
Pump neutralized liquids to reverse
osmosis unit and recycle permeate to
makeup water
• 90% removal of ions
• 90% recovery of permeate water
• Flux = 40 L m-2 h-1
Pump retentate to wastewater treatment NA
Ash Removal Technologies for Non-Leachable Ash Components
Silica typically is the largest ash component in biomass and is insoluble in acid and water (it
cannot be leached). Hence, physical and/or chemical methods are required to remove silica from
biomass with minimal loss of organic material. Technologies that can potentially accomplish this
goal include grinding to micron-size particles followed by triboelectrostatic separation and
alkali-based processes that dissolve silica 45. Methods for lignin recovery and precipitation must
be employed in the latter case to avoid significant losses of organic material. These methods
would add unit operations to the feedstock supply chain that exists today, thereby increasing
costs.
Increased costs would arise in the triboelectrostatic separation pathway through increased
grinding cost and the requirement that ground biomass be completely dry, as well as through
losses of some of the convertible matter with the silica. If considered as an addition to the
existing feedstock supply unit operations, the silica dissolution method would increase costs
through the requirement for alkali recovery and the requirement for lignin recovery via acid
precipitation, ultrafiltration, or triboelectrostatic separation from the lignin after concentration
and drying. Acid-soluble lignin also could be lost. However, it is notable that the severity of

158
alkaline treatment required to solubilize the silica would likely disrupt the structure of
herbaceous biomass sufficiently to greatly reduce grinding and pelletization energy
requirements. In any event, if silica or heteroatoms must be removed for a given conversion
process, it may be more cost effective to design the feedstock supply system around the removal
processes rather than vice versa.
Cost Estimation for Chemical Preconversion
Few economic analyses are available in the literature for ash removal. The following provides
overall costs for two systems that are found in the literature and include a technoeconomic
analysis of leaching of alkali metals from rice straw for combustion and a technoeconomic
analysis of removing both alkali metals and silica from non-woody residues (also for
combustion). The cost of 95% alkali metal removal from rice straw by leaching was estimated in
2000 to be $13.61 to $16.33/dry T (Bakker 2000). A more recent analysis for non-woody
feedstocks estimated a net cost of $39.93 to $60.80/dry T for removal of alkali metals (up to
95%) by leaching, followed by removal of silica (up to 75%) with triboelectrostatic separation 45.
Utilizing mechanical and chemical ash removal technologies in tandem to reduce the amount of
non-specification feedstock blend components requiring further preprocessing to meet ash
specifications is a strategy for reducing ash while still meeting cost targets. This can be
accomplished by utilizing fractional grinding to take advantage of the skewed distribution of ash
toward smaller particle sizes for corn stover. Therefore, the performance target for chemical
preconversion is to produce on-spec feedstocks below the biorefinery’s added costs for off-
specification feedstock by either reducing the amount of feedstock requiring chemical ash
removal, reducing the cost of chemical ash removal, or both.

159
Appendix E Cost Calculation
The economic analysis was designed for an 800,000 ton/year pellet demand to produce hydrocarbon fuels.
About cost year indices: The cost-year of 2011 was chosen for this analysis to keep the
consistency across all DOE-BETO platforms for which similar “design case target” reports are
being established during 2013–2014 efforts. Capital costs provided in a year other than 2011$
were adjusted using the Plant Cost Index from Chemical Engineering Magazine to a common
basis year of 2011.
The general formula for year-dollar back-casting is:
2011 Cost = (Base Cost) (2011 Cost Index
Base Year Index)
Ownership cost: Ownership cost consists of interests and depreciation cost, and insurance,
housing and taxes cost and owning the facility.
Interest and depreciation
The ASABE lists two different methods for costing depreciation and interest: (1) calculate
depreciation and interest separately, or (2) calculate depreciation and interest on the value to be
depreciated and then calculate interest on the salvage value. The AAEA uses the second method,
which can be expressed as Equation (1):
iSi
iiSPDI
n
n
11
1)(&
(1)
where
I & D = Interest and Depreciation
P = purchase price of equipment
i = annual interest rate
n = life of the equipment in years
k = sum of rates for taxes, housing (shelter), insurance
S = salvage value (salvage value % × list price) (salvage value percent assumed in the
present study is 30%)
Salvage value (remaining value) must be known or estimated to determine interest and
depreciation. The America Society of Agricultural and Biological Engineers 85 (ASABE) method
was used for determination of salvage value (ASABE, D496.31, 2006, Section 6.2.2).
Insurance, Housing, and Taxes (IH&T)
Insurance, housing (cost of shelter for equipment), and taxes (IH&T) refer to the fixed costs
related to the equipment, and these costs are estimated as percentages of the purchase price
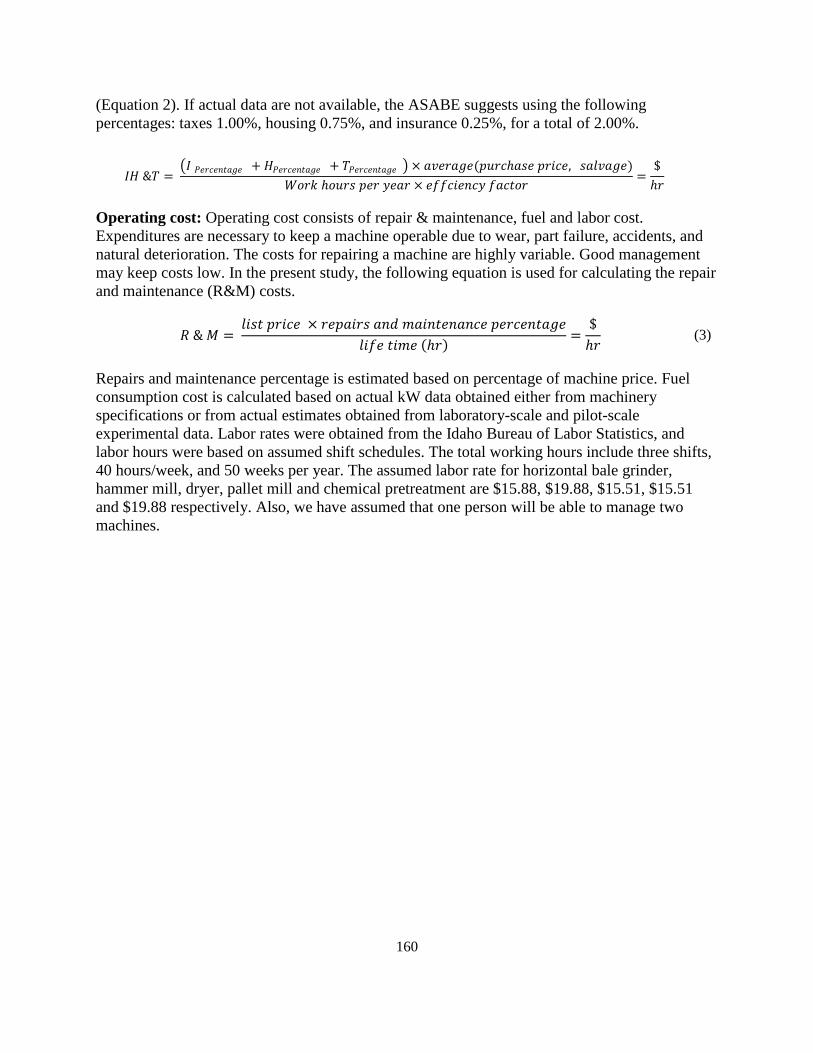
160
(Equation 2). If actual data are not available, the ASABE suggests using the following
percentages: taxes 1.00%, housing 0.75%, and insurance 0.25%, for a total of 2.00%.
Operating cost: Operating cost consists of repair & maintenance, fuel and labor cost.
Expenditures are necessary to keep a machine operable due to wear, part failure, accidents, and
natural deterioration. The costs for repairing a machine are highly variable. Good management
may keep costs low. In the present study, the following equation is used for calculating the repair
and maintenance (R&M) costs.
𝑅 & 𝑀 = 𝑙𝑖𝑠𝑡 𝑝𝑟𝑖𝑐𝑒 × 𝑟𝑒𝑝𝑎𝑖𝑟𝑠 𝑎𝑛𝑑 𝑚𝑎𝑖𝑛𝑡𝑒𝑛𝑎𝑛𝑐𝑒 𝑝𝑒𝑟𝑐𝑒𝑛𝑡𝑎𝑔𝑒
𝑙𝑖𝑓𝑒 𝑡𝑖𝑚𝑒 (ℎ𝑟)=
$
ℎ𝑟 (3)
Repairs and maintenance percentage is estimated based on percentage of machine price. Fuel
consumption cost is calculated based on actual kW data obtained either from machinery
specifications or from actual estimates obtained from laboratory-scale and pilot-scale
experimental data. Labor rates were obtained from the Idaho Bureau of Labor Statistics, and
labor hours were based on assumed shift schedules. The total working hours include three shifts,
40 hours/week, and 50 weeks per year. The assumed labor rate for horizontal bale grinder,
hammer mill, dryer, pallet mill and chemical pretreatment are $15.88, $19.88, $15.51, $15.51
and $19.88 respectively. Also, we have assumed that one person will be able to manage two
machines.
𝐼𝐻 &𝑇 = 𝐼 𝑃𝑒𝑟𝑐𝑒𝑛𝑡𝑎𝑔𝑒 + 𝐻𝑃𝑒𝑟𝑐𝑒𝑛𝑡𝑎𝑔𝑒 + 𝑇𝑃𝑒𝑟𝑐𝑒𝑛𝑡𝑎𝑔𝑒 × 𝑎𝑣𝑒𝑟𝑎𝑔𝑒(𝑝𝑢𝑟𝑐ℎ𝑎𝑠𝑒 𝑝𝑟𝑖𝑐𝑒, 𝑠𝑎𝑙𝑣𝑎𝑔𝑒)
𝑊𝑜𝑟𝑘 ℎ𝑜𝑢𝑟𝑠 𝑝𝑒𝑟 𝑦𝑒𝑎𝑟 × 𝑒𝑓𝑓𝑐𝑖𝑒𝑛𝑐𝑦 𝑓𝑎𝑐𝑡𝑜𝑟=
$
ℎ𝑟

161
Future Work
Foremost, efforts must build upon collaborative interactions with the biochemical and
thermochemical conversion platforms to gain a better understanding of feedstock quality and
conversion performance. Efforts must also focus on robust screening techniques and
methodologies to verify feedstock quality. Relative to ash determinations, a bulk biomass
screening tool that is easy to use, rugged, has low maintenance requirements and field-applicable
is needed to better understand feedstock variability (temporal, seasonal), logistic and
preprocessing intermediates changes and variability and options for mitigating impacts; bringing
to bear all the “architectural’ requirement to support the biorefinery quality specification, and the
initial and intermediate specifications that sustain those specifications.