feem approach to supply chain analysis the coffee sector
TRANSCRIPT

July 2020
ReportFEEM Approach to Supply Chain AnalysisThe coffee sector in Kenya
Lamya Adil Suliman Hussain, FEEM
Federica Inzoli, FEEM
Nicolò Golinucci, FEEM
Nicolò Stevanato, FEEM
Matteo Vincenzo Rocco, Department of Energy, Politecnico di Milano
Emanuela Colombo, Department of Energy, Politecnico di Milano
FEEM Approach to Supply Chain AnalysisThe coffee sector in Kenya

Table of contents
Table of figures
Table of tables
Abbreviations
01 Introduction
02 Methodology
03 Coffee Value Chain Analysis3.1 Policies, Regulations and Core Processes3.2 Farming
3.2.1 Current and forecast scenario and seasonality analysis3.2.2 Description of the farming process3.2.3 Farmers payment rates and costs
3.3 Processing3.3.1 Current scenario3.3.2 Description of the processing3.3.3 Identification of the processing facilities and volumes of processing3.3.4 Mills charges
3.4 Coffee standards and quality3.5 Co-operatives system and associations3.6 Marketing3.7 Exports3.8 Domestic markets3.9 Development plans3.10 Services
04. SWOT Analysis4.1 Weaknesses identified and how to improve the sector4.2 Competitive advantages and Threats and opportunities
05. Conclusion
06. Annex6.1 Coffee production and productivity for some counties6.2 Parchment and mbuni production by county6.3 Mills production6.4 Auction sales per grade and prices6.5 Local vs International coffee prices6.6 Coffee export volumes and FOB values by destination for 2017/2018 and
2016/20176.7 Dealers and marketing agents export performance for 2017/18 and 2016/2017
References
4
5
6
7
11
121214141620232325282829313136393940
424244
47
48484950515253
55
57
FEEM REPORTS | 32 | FEEM REPORTS

Table of tables
Table 1 Distribution of coffee holdings (Source: International Coffee Organization, 2019)Table 2 Production projections (Source: Agriculture and Food Authority, 2018)Table 3 Soil nutrition schedule (Source: Coffee Research Institute)Table 4 Planting holes spacing and population density by coffee varietyTable 5 Cherry payment rates per kg by region and county (Source: International Coffee
Organization, 2019)Table 6 Average costs of production (Source: International Coffee Organization, 2019)Table 7 Clean coffee production by county and sector 2017/2018 (Source: Agriculture and
Food Authority, 2018)Table 8 Coffee millers charges (Source: Agriculture and Food Authority, 2018)Table 9 Coffee grades and screen size (Source: Agriculture and Food Authority, 2018)Table 10 Kenya coffee standards (Source: Kenya Bureau of Standards, 2004)Table 11 Overall marketing agents performance 2017/18 (Source: Agriculture and Food
Authority, 2018)Table 12 Marketing agents performance in auction (Source: Agriculture and Food Authority,
2018)Table 13 Commodities fund loans for the coffee industry (Source: Commodities Fund, 2019)Table 14 Import values in Africa (Workman, 2020)Table 15 Comparative wet mill costs for cooperatives/smallholders (Source: USAID, 2010)Table 16 Coffee production and productivity for some counties (Source: Agriculture and Food
Authority, 2018)Table 17 Parchment and mbuni production by county 2017/2018 (Source: Agriculture and
Food Authority, 2018)Table 18 Mills clean coffee production CY 2017/2018 (Source: Agriculture and Food
Authority, 2018)Table 19 Auction sales per coffee grade CY 2017/2018 (Source: Agriculture and Food
Authority, 2018)Table 20 Local and international coffee prices (Source: Agriculture and Food Authority, 2018)Table 21 Coffee export volumes and FOB values by destination for 2017/2018 (Source:
Agriculture and Food Authority, 2018)Table 22 Coffee export volumes and FOB values by destination for 2016/2017 (Source:
Agriculture and Food Authority, 2018)Table 23 Dealers and marketing agents export performance for 2017/18 (Source: Agriculture
and Food Authority, 2018)Table 24 Dealers and marketing agents export performance for 2016/17 (Source: Agriculture
and Food Authority, 2018)
Table of figures
Figure 1 Coffee growing counties (Source: International Coffee Organization, 2019)Figure 2 Coffee annual harvest area (Source: FAO, 2020)Figure 3 Top 25 coffee producing countries in 2020 (Source: Milton, 2020)Figure 4 Kenyan coffee core process and main actorsFigure 5 Estates and co-operatives coffee production (MT) (Source: International Coffee
Organization, 2019)Figure 6 Coffee harvest and shipping seasons (Source: Baskerville, 2012)Figure 7 Top 8 producing counties (Source: Agriculture and Food Authority, 2018)Figure 8 Estate farmers production cost per kg (Source: Coffee Management Services,
2018)Figure 9 Smallholder farmers production cost per tree (Source: Coffee Management
Services, 2018)Figure 10 Revenue distribution in Kenya Shillings per kg of cherry (Source: Coffee
Management Services, 2018)Figure 11 Wet and dry milling processFigure 12 Coffee milling processFigure 13 Clean coffee top-8 producing mills (Source: Agriculture and Food Authority, 2018)Figure 14 Cooperatives organizationFigure 15 Price comparison NCE vs ICE (Source: Agriculture and Food Authority, 2018)Figure 16 Auction traded weight (kg) (Source: Agriculture and Food Authority, 2018)Figure 17 Auction values (Source: Agriculture and Food Authority, 2018)Figure 18 Direct sales weight (kg) (Source: Agriculture and Food Authority, 2018)Figure 19 Direct sales values (USD) (Source: Agriculture and Food Authority, 2018)Figure 20 Marketing agents direct sales weight (kg) (Source: Agriculture and Food Authority,
2018)Figure 21 Marketing agents direct sales value (USD) (Source: Agriculture and Food Authority,
2018)Figure 22 Marketing agents average direct sales prices USD/50 kg (Source: Agriculture and
Food Authority, 2018)Figure 23 Coffee exports by destination and dealer for CY 2017/2018 (Source: Agriculture
and Food Authority, 2018)Figure 24 Exports net weight (kg) (Source: Agriculture and Food Authority, 2018)Figure 25 Exports FOB value (USD) (Source: Agriculture and Food Authority, 2018)Figure 26 Export volumes by destination (Data Source: Agriculture and Food Authority,
2018)Figure 27 Domestic coffee consumption (Source: Agriculture and Food Authority, 2018)Figure 28 Coffee SWOT analysisFigure 29 Nutritional information for coffee flour
1415181920
2124
29293032
34
41434448
49
50
51
5253
54
55
56
89
101415
161721
22
23
26272831323333343535
36
36
37
373838
394246
FEEM REPORTS | 54 | FEEM REPORTS
01Introduction
Kenya consists of 580,367 km2 making it the world’s 48th largest country by total area. It is made up of 47 semi-autonomous counties and has a population of more than 47.6 million people. Inland water bodies cover around 10,700 km2, the bulk of which in Lakes Victoria and Turkana. The climate of Kenya varies from tropical along the coast to arid in the interior. Kenya’s weather is generally sunny year-round, with the main rainy seasons being from March to May and from November to December.
The main economic activities in Kenya include agriculture, forestry, tourism, fishing, energy and manufacturing. These sectors contributed to an annual growth in national Gross Domestic Product (GDP) of about 5% between 2014 and 2018. Kenya GDP for 2018 was estimated to be $86 billion, making it the 69th largest economy in the world. The agricultural sector contributed on average to 21.9% of the Kenya’s GDP between 2013-2017, with at least 56% of the total labour force employed in agriculture in 2017. Moreover, the agricultural sector contributes to 65% of Kenya’s total exports, with tea, cut flowers, refined petroleum, coffee and legumes being the country’s top exports. The 2017 exports were led by tea which represent 22.3% of the total exports of Kenya followed by cut flowers 11.2% and coffee accounting for 5.5%. The coffee industry contributes to growth in agriculture through foreign exchange earnings of around KShs 23 billion per year, employment creation, family
farm incomes and food security (International Coffee Organization, 2019).
Coffee growing was introduced in Kenya in 1897 by the British. In 1910, the colonists started to plant coffee trees close to Nairobi county, in Kiambu and Thika and soon it became the biggest export crop. From that point, different changes were applied and after about 10 years some of the planters started the Thika Planters Cooperative Union. This was then changed to Kenya Planters Cooperative Union (KPCU) in 1937, to present the interest of small farmers (Muthoni, 2014). In 1932 the Coffee Board of Kenya (CBK) was born and was charged with the responsibility of carrying out regulation and marketing of coffee. In 1944, smallholders were required by law to join local growing cooperatives that were run by the Coffee Board in order to reduce the power of large estates in controlling the Board. In 1934 the coffee auction was established as a mode of selling Kenyan coffee. Furthermore, the colonial government allowed indigenous people to plant coffee under strict regulations, but it didn’t work properly so from 1946 they encouraged Kenyans to start planting cash crops. After 1950 the smallholder sector picked up and after a while it dominated the KPCU. They started to build wet mills and in 1978 the smallholder sector surpassed the large estates in terms of production, and still accounts for more than 70% of the total production (Joakim, 2012).
Abbreviations
CY – Coffee YearKPCU – Kenya Planters Cooperative Union CBK – Coffee Board of Kenya CRF – Coffee Research FoundationCBD – Coffee Berry DiseaseCLR – Coffee Leaf RustBBC – Bacterial Blight of CoffeeCMB – Coffee Marketing Board NCE – Nairobi Coffee Exchange KCPTA – Kenya Coffee Producers and Traders Association KALRO – Kenya Agricultural and Livestock Research Organization KEPHIS – Kenya Plant Health Inspectorate ServicesUSDA – United States Department of AgricultureCRI – Coffee Research Institute AFA – Agriculture and Food Authority ICE – International Coffee ExchangeKCTA – Kenya Coffee Traders Association FOB – value Free on Board valueComFund – Commodities Fund
FEEM REPORTS | 76 | FEEM REPORTS
Due to pressure from the World Bank, the Kenyan government took a series of steps to loosen its control over clusters between 1990 and 2001, this included:i) 1991 - pulling out of cooperative
management; ii) 1995 - ending financial support to
cooperatives (Kenya Planters Cooperative Union and the Coffee Research Foundation (CRF));
iii) 1999 - relaxing regulation of upstream processes and allowing growers to choose among pulping factories, millers, and marketing agents;
iv) 2001 - limiting the role of the CBK as a regulator;
v) privatizing the coffee auction and allowing a
portion of coffee to bypass the auction and to be sold directly to exporters;
vi) 2006 - increasing the number of marketing licenses issued from three to twenty-five (Muthoni, 2014).
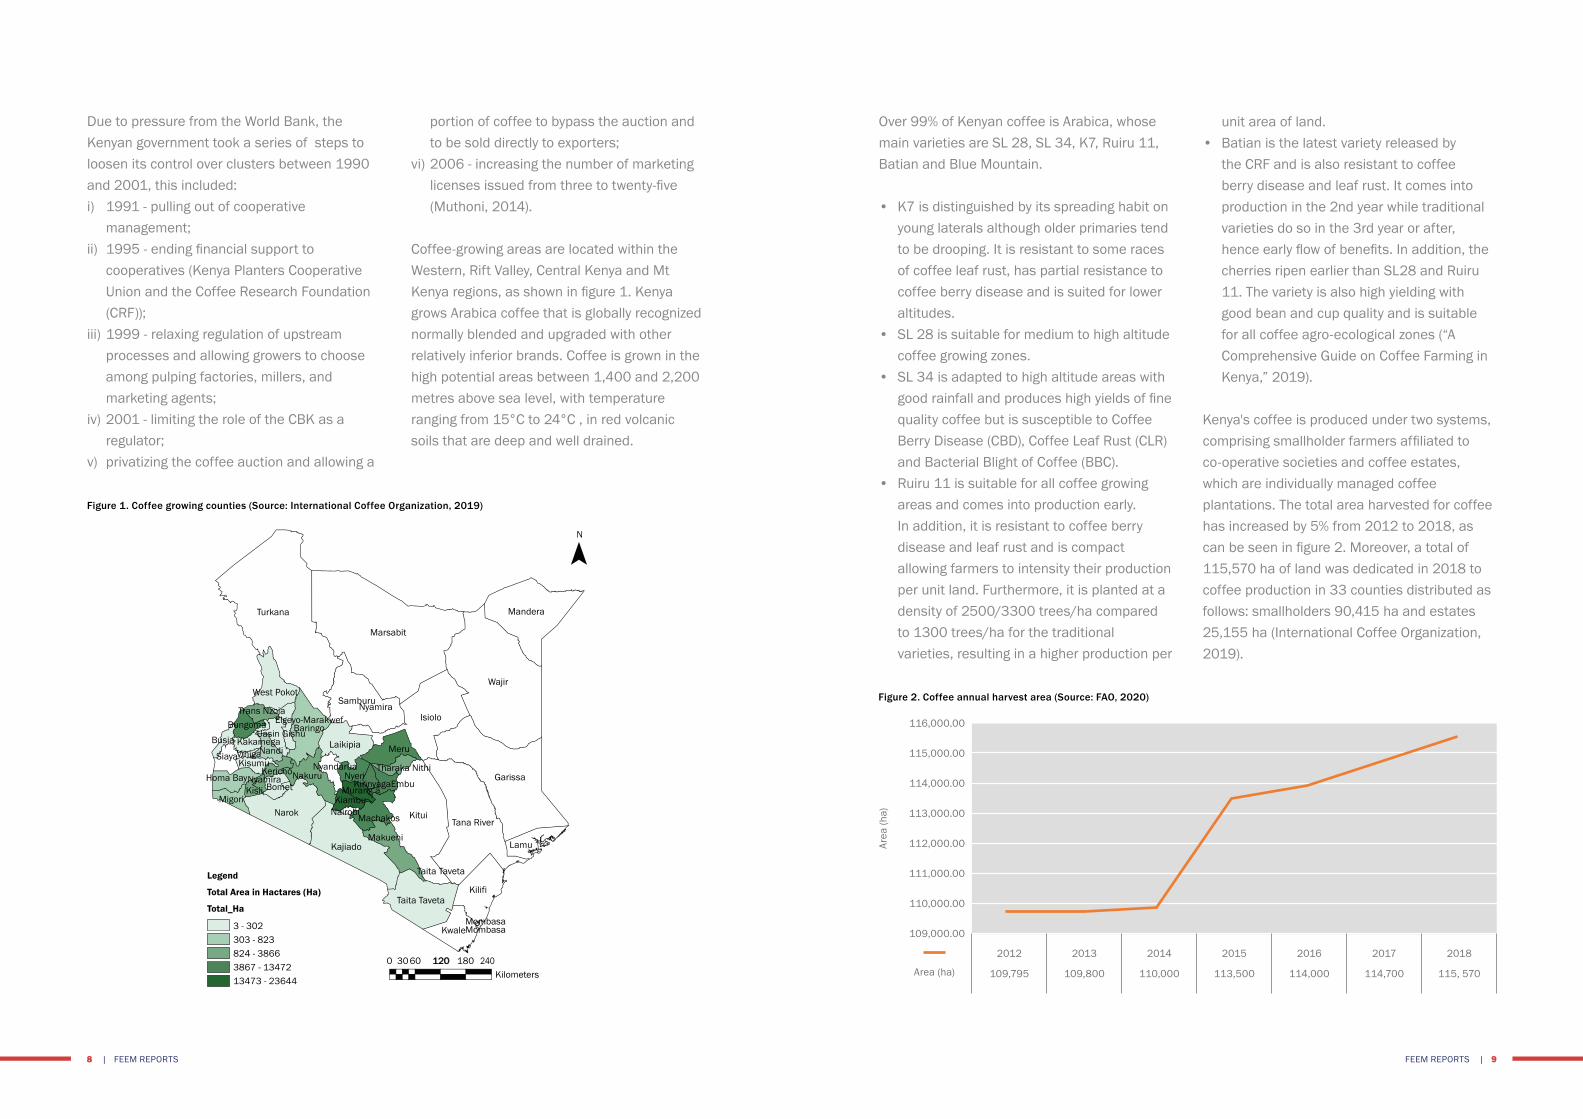
Coffee-growing areas are located within the Western, Rift Valley, Central Kenya and Mt Kenya regions, as shown in figure 1. Kenya grows Arabica coffee that is globally recognized normally blended and upgraded with other relatively inferior brands. Coffee is grown in the high potential areas between 1,400 and 2,200 metres above sea level, with temperature ranging from 15°C to 24°C , in red volcanic soils that are deep and well drained.
Over 99% of Kenyan coffee is Arabica, whose main varieties are SL 28, SL 34, K7, Ruiru 11, Batian and Blue Mountain.
• K7 is distinguished by its spreading habit on young laterals although older primaries tend to be drooping. It is resistant to some races of coffee leaf rust, has partial resistance to coffee berry disease and is suited for lower altitudes.
• SL 28 is suitable for medium to high altitude coffee growing zones.
• SL 34 is adapted to high altitude areas with good rainfall and produces high yields of fine quality coffee but is susceptible to Coffee Berry Disease (CBD), Coffee Leaf Rust (CLR) and Bacterial Blight of Coffee (BBC).
• Ruiru 11 is suitable for all coffee growing areas and comes into production early. In addition, it is resistant to coffee berry disease and leaf rust and is compact allowing farmers to intensity their production per unit land. Furthermore, it is planted at a density of 2500/3300 trees/ha compared to 1300 trees/ha for the traditional varieties, resulting in a higher production per
unit area of land. • Batian is the latest variety released by
the CRF and is also resistant to coffee berry disease and leaf rust. It comes into production in the 2nd year while traditional varieties do so in the 3rd year or after, hence early flow of benefits. In addition, the cherries ripen earlier than SL28 and Ruiru 11. The variety is also high yielding with good bean and cup quality and is suitable for all coffee agro-ecological zones (“A Comprehensive Guide on Coffee Farming in Kenya,” 2019).
Kenya's coffee is produced under two systems, comprising smallholder farmers affiliated to co-operative societies and coffee estates, which are individually managed coffee plantations. The total area harvested for coffee has increased by 5% from 2012 to 2018, as can be seen in figure 2. Moreover, a total of 115,570 ha of land was dedicated in 2018 to coffee production in 33 counties distributed as follows: smallholders 90,415 ha and estates 25,155 ha (International Coffee Organization, 2019).
Figure 1. Coffee growing counties (Source: International Coffee Organization, 2019)
Figure 2. Coffee annual harvest area (Source: FAO, 2020)
Mandera
Wajir
Lamu
Tana River
Taita Taveta
Taita Taveta
Kilometers0 3060 120120 180 240
KwaleMombasaMombasa
Kilifi
N
Turkana
Legend
Total Area in Hactares (Ha)
Total_Ha
3 - 302303 - 823824 - 38663867 - 1347213473 - 23644
West PokotSamburu
Nyamira
NyamiraHoma BayKericho
KisumuVihigaSiaya NandiKakamega
Uasin GishuBungoma
Busia
Trans NzoiaElgeyo-Marakwef
Baringo
NyandaruaNakuru
BometKisiiMigori
Narok
KajiadoMakueni
MachakosNairobiKiambu
Murang’aKirinyagaEmbu
NyeriTharaka Nithi
MeruLaikipia
Marsabit
Isiolo
Kitui
Garissa
116,000.00
115,000.00
114,000.00
113,000.00
112,000.00
111,000.00
110,000.00
109,000.00
2012
109,795
2013
109,800
2014
110,000
2015
113,500
2016
114,000
2017
114,700
2018
115, 570Area (ha)
Area
(ha)
FEEM REPORTS | 98 | FEEM REPORTS

The aim of this study is to identify the bottlenecks of the Kenyan coffee value chain in order to allocate the most relevant inefficiencies of each step and try to find different and innovative solutions to overlap the difficulties that Kenyan coffee is facing. A literature study was conducted during the preparatory stage, in order to obtain a comprehensive understanding of the coffee
value chain. This activity was followed by a field visit to coffee farms in Kenya, between August and September 2019. During this period a number of members in the coffee value chain were interviewed including farmers, wet/dry millers, millers, Coffee Research Institute, Coffee Directorate, Commodities Fund and the representative of these institutions for each coffee grower county.
In addition, the coffee industry is estimated to employ 30% (5 million people) of the agricultural sector labour force. Kenya also has a cooperative system for coffee milling as well as marketing, and auctions are held each Tuesday during the harvest season at the Nairobi Coffee Exchange. Land ownership is culturally dominated by men. However, women provide over 60% of the workforce in farms and coffee wet mills (International Coffee Organization, 2019).
Worldwide coffee is the second most traded
commodity on the planet with more than 9 billion kg being produced annually. Figure 3 shows the top 25 ranked coffee producing countries in 2020. Brazil ranked 1st producing 3,558,000 MT and accounting for one third of the coffee world, followed by Vietnam producing 1,830,000 MT and accounting for 17% of the world coffee; then in 3rd place Colombia which produces 858,000 MT and accounts for 8% of the world production, while Kenya ranks 21st and accounts for 0.4% of the world coffee production (Milton, 2020).
Figure 3. Top 25 coffee producing countries in 2020 (Source: Milton, 2020)
02Methodology
4.000.000
3,500,000
3,000,000
2,500,000
2,000,000
1,500,000
1,000,000
500,000
0
Bra
zil
Viet
nam
Col
ombi
a
Indo
nesi
a
Ethi
opia
Hon
dura
s
Indi
a
Mex
ico
Peru
Uga
nda
Gua
tem
ala
Nic
arag
ua
Chin
a (e
st.)
Mal
aysi
a
Ivor
y C
oast
Cos
ta R
ica
Tanz
ania
Papu
a N
ew G
uine
a
Thai
land
El S
alva
dor
Ken
ya
Vene
zuel
a
Laos
Phili
ppin
es
Cam
eroo
n
MT
FEEM REPORTS | 1110 | FEEM REPORTS

commodity exchange;• complying with rules and directives made
or provided by the board pursuant to section 44 (2) (d) of the Act;
• determining coffee volumes for auctions and price discovery mechanisms in accordance with the Act;
• providing the necessary facilities for operation, management and administration of the exchange;
• performing all acts necessary for the proper performance and operations of the exchange (Nairobi Coffee Exchange, 2014).
The crops (coffee general) regulations 2019 concerns various matters related to the production, processing, and trading of coffee. The purpose of these regulations is:a) to give effect to section 40 of the crops Act
2013,b) to provide for licences to be issued by the
licensing authorities,c) to provide obligations for the licence holders
and service providers,d) to recognize coffee grower as the owner of
coffee until the coffee is sold and paid for,e) to protect growers' rights along the value
chain,f) to provide for transparent and timely
clearing and settlement of coffee sales proceeds to growers and service providers,
g) to provide for collection and maintenance of coffee related data,
h) to ensure better coffee standards, increased production, and support,
i) to regulate the coffee industry.
The regulations require every coffee grower to register with the county governments and the authority for purpose of data collection. Furthermore, county governments issue
certifications and licences for various activities in the coffee industry, including operation of a coffee nursery. The Authority shall promote coffee certification schemes for Kenyan coffee and geographical indications. The Kenya Agricultural and Livestock Research Organization (KALRO) or its authorized agents who operate in coffee seed production units under their supervision, will issue certified coffee seeds or seedlings for multiplication in any coffee nursery for distribution to any other grower or for export. Moreover, in order to establish or operate a coffee nursery, the owner must obtain a license from the county government (FAO, 2019).
Export regulationCoffee exports are regulated by the Coffee General Regulations 2002 and the Kenya Coffee Trading Rules 2012. Dealers/exporters must obtain annually a license from the Coffee Directorate to be eligible to export Kenyan coffee. In addition, a phytosanitary certification must be obtained by exporters from the Kenya Plant Health Inspectorate Services (KEPHIS) and Certificates of Origin from the Coffee Directorate. Exporters must also submit samples for quality checks to the Central Sample Room, that is managed by the NCE and the coffee directorate and approval of consignments is made by the directorate. Dealers are expected to file returns of all coffee exports to the coffee directorate, for monitoring and data collection purposes. Green coffee beans are not subject to export duty or tax as they are considered to be a raw material. However, roasted coffee exports are subject to a 16% Value Added Tax on the value added to the coffee exported (International Coffee Organization, 2019).
3.1 Policies, Regulations and Core ProcessesIn 1971, Act 13 abolished the Coffee Marketing Board (CMB) and consolidated its function of coffee marketing with the regulatory functions of Coffee Board of Kenya (CBK). In 2001, the coffee Act cap 333 was repeated and the coffee Act No. 9 of 2001 was enacted, establishing the Coffee Board as a statutory body under the Ministry of Agriculture, solely to regulate the coffee industry. The object and purpose of the board was to promote competition in the coffee industry, production, processing and value addition including branding of Kenya coffee locally and internationally, and generally to regulate the coffee industry in the public interest.a) formulating policies and rules to regulate
and develop the coffee industry in the consultation with the Ministry of Agriculture;
b) carrying out registration and licensing for coffee nurseries, growers, pulping stations, millers, roasters, packers, warehouse men, marketing agents, management agents, buyers and auctioneers to ensure adherence to standards;
c) providing advisory services related to coffee production and quality enhancement;
d) collecting, collating, analysing data, maintaining a database of the coffee industry and documenting and monitoring it through registration of persons dealing with coffee;
e) advising and guiding the Coffee Research Foundation regarding the carrying out of
research in all matters related to the coffee industry;
f) representing the government abroad with regards to coffee matters;
g) arbitrating in case of disputes in the coffee industry;
h) carrying out other functions aimed at promoting the industry (Wikiprocedure, 2019).
In 2002, the coffee (General) rules gave an association the mandate to manage the Nairobi Coffee Exchange (NCE). Furthermore, in 2006, section 62 of the rules was further amended to specify Kenya Coffee Producers and Traders Association (KCPTA) as managers of the NCE, until July 2013. In 2012, through legal notice 111 section 44 of the coffee Act 2001 the NCE trading rules were established and stipulate the following functions for the NCE:• managing all the operations of the exchange
including the trading floor and the sample room;
• formulating policies, conditions of sale and setting regulations and any other instruments or regulations necessary for the operations of the exchange in consultation with stakeholders in the coffee industry and with the approval of the board;
• promoting and participating in matters that are related to or that affect trading at the exchange;
• promoting efficient, innovative and transparent marketing arrangements at the exchange, including coffee auctions and
03Coffee Value Chain Analysis
FEEM REPORTS | 1312 | FEEM REPORTS
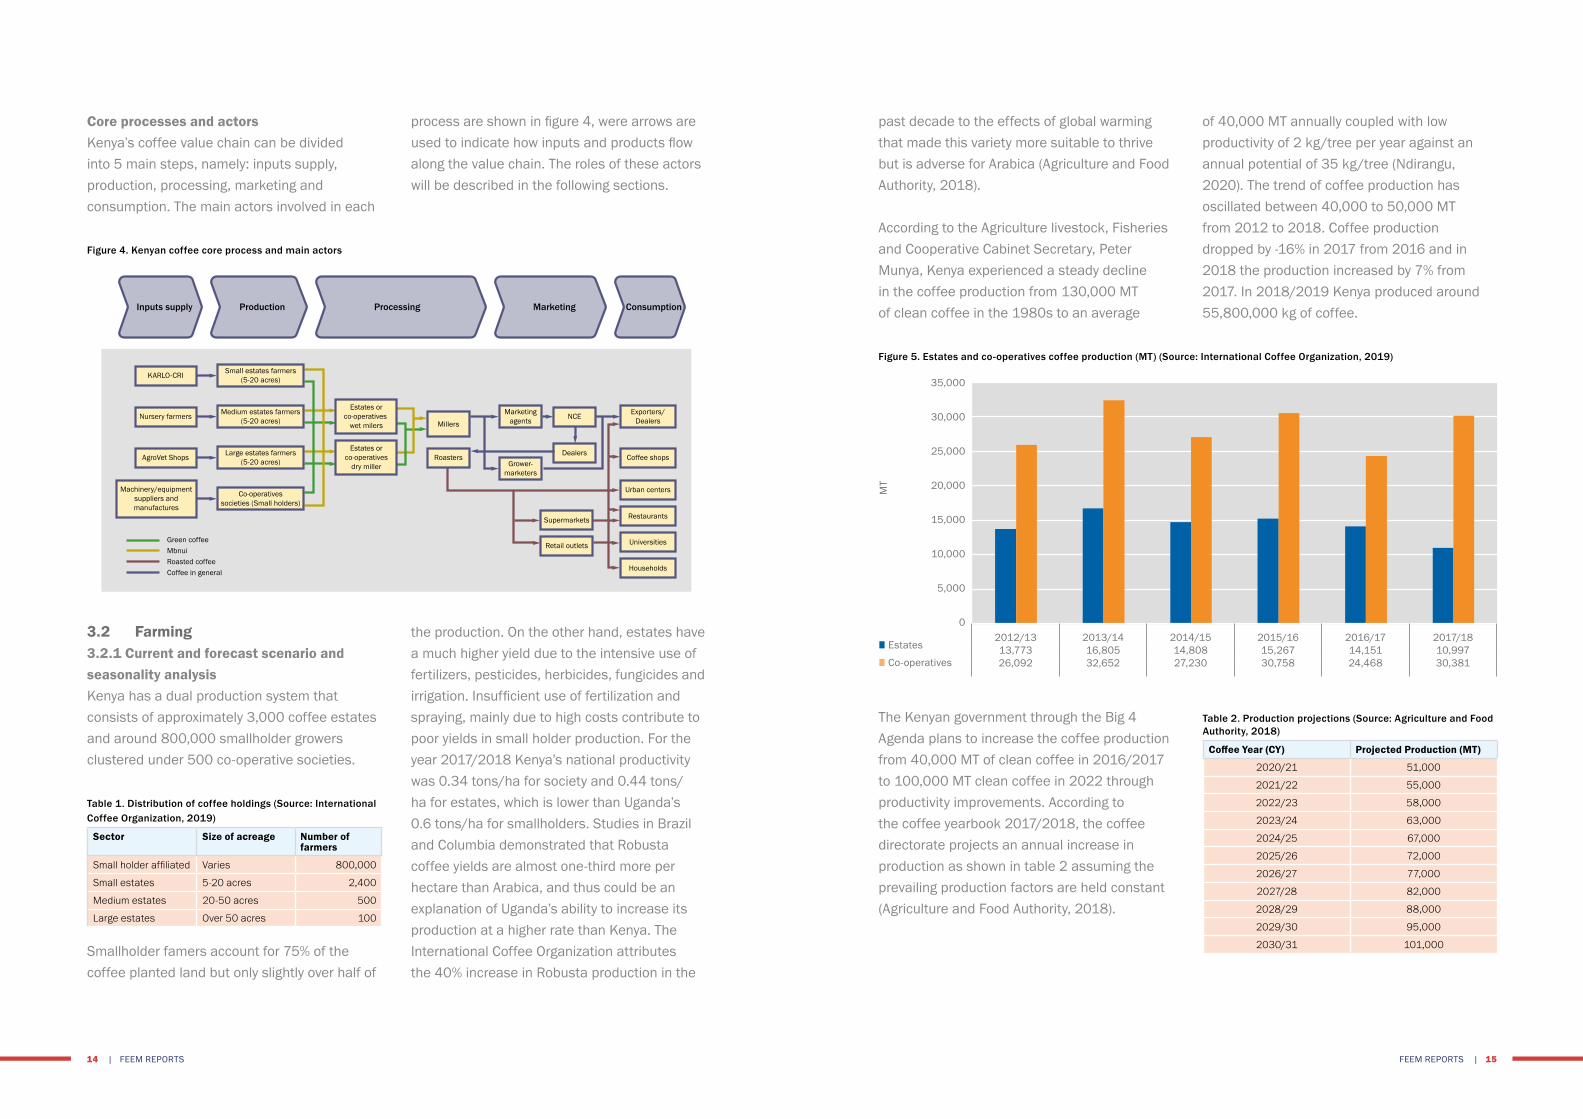
past decade to the effects of global warming that made this variety more suitable to thrive but is adverse for Arabica (Agriculture and Food Authority, 2018).
According to the Agriculture livestock, Fisheries and Cooperative Cabinet Secretary, Peter Munya, Kenya experienced a steady decline in the coffee production from 130,000 MT of clean coffee in the 1980s to an average
of 40,000 MT annually coupled with low productivity of 2 kg/tree per year against an annual potential of 35 kg/tree (Ndirangu, 2020). The trend of coffee production has oscillated between 40,000 to 50,000 MT from 2012 to 2018. Coffee production dropped by -16% in 2017 from 2016 and in 2018 the production increased by 7% from 2017. In 2018/2019 Kenya produced around 55,800,000 kg of coffee.
Core processes and actors Kenya’s coffee value chain can be divided into 5 main steps, namely: inputs supply, production, processing, marketing and consumption. The main actors involved in each
3.2 Farming3.2.1 Current and forecast scenario and seasonality analysisKenya has a dual production system that consists of approximately 3,000 coffee estates and around 800,000 smallholder growers clustered under 500 co-operative societies.
Table 1. Distribution of coffee holdings (Source: International Coffee Organization, 2019)
Sector Size of acreage Number of farmers
Small holder affiliated Varies 800,000
Small estates 5-20 acres 2,400
Medium estates 20-50 acres 500
Large estates Over 50 acres 100
Smallholder famers account for 75% of the coffee planted land but only slightly over half of
process are shown in figure 4, were arrows are used to indicate how inputs and products flow along the value chain. The roles of these actors will be described in the following sections.
the production. On the other hand, estates have a much higher yield due to the intensive use of fertilizers, pesticides, herbicides, fungicides and irrigation. Insufficient use of fertilization and spraying, mainly due to high costs contribute to poor yields in small holder production. For the year 2017/2018 Kenya’s national productivity was 0.34 tons/ha for society and 0.44 tons/ha for estates, which is lower than Uganda’s 0.6 tons/ha for smallholders. Studies in Brazil and Columbia demonstrated that Robusta coffee yields are almost one-third more per hectare than Arabica, and thus could be an explanation of Uganda’s ability to increase its production at a higher rate than Kenya. The International Coffee Organization attributes the 40% increase in Robusta production in the
Figure 4. Kenyan coffee core process and main actors
Figure 5. Estates and co-operatives coffee production (MT) (Source: International Coffee Organization, 2019)
ProductionInputs supply Processing Marketing Consumption
Machinery/equipmentsuppliers andmanufactures
KARLO-CRISmall estates farmers
(5-20 acres)
Medium estates farmers(5-20 acres)
Large estates farmers(5-20 acres)
Estates orco-operatives
wet milers
Marketingagents
Exporters/Dealers
Grower-marketers
Estates orco-operatives
dry miller
Green coffeeMbnuiRoasted coffeeCoffee in general
Co-operativessocieties (Small holders)
Nursery farmers
AgroVet Shops
MillersNCE
Dealers
Supermarkets
Retail outlets
Coffee shops
Urban centers
Restaurants
Universities
Households
Roasters
The Kenyan government through the Big 4 Agenda plans to increase the coffee production from 40,000 MT of clean coffee in 2016/2017 to 100,000 MT clean coffee in 2022 through productivity improvements. According to the coffee yearbook 2017/2018, the coffee directorate projects an annual increase in production as shown in table 2 assuming the prevailing production factors are held constant (Agriculture and Food Authority, 2018).
Table 2. Production projections (Source: Agriculture and Food Authority, 2018)
Coffee Year (CY) Projected Production (MT)
2020/21 51,000
2021/22 55,000
2022/23 58,000
2023/24 63,000
2024/25 67,000
2025/26 72,000
2026/27 77,000
2027/28 82,000
2028/29 88,000
2029/30 95,000
2030/31 101,000
35,000
30,000
25,000
20,000
15,000
10,000
5,000
02012/1313,77326,092
2013/1416,80532,652
2014/1514,80827,230
2015/1615,26730,758
2016/1714,15124,468
2017/1810,99730,381
■ Estates
■ Co-operatives
MT
FEEM REPORTS | 1514 | FEEM REPORTS
Farmers grow coffee seedlings in nursey bags for 6 to 7 months in which they reach a height of 20 to 25 cm, after that they are transplanted in the main filed. Seeds are planted at a distance of 3-5 cm in rows that are 15-20 cm parts. A coffee orchard is expected to produce coffee beans up to 60 years from its establishment.
Land preparationThe land is prepared in advance by digging out all tree stumps, roots, bushes and grasses, then giving 4 or 5 ploughing and harrowing to bring the soil to a fine tilth stage. Land cleared
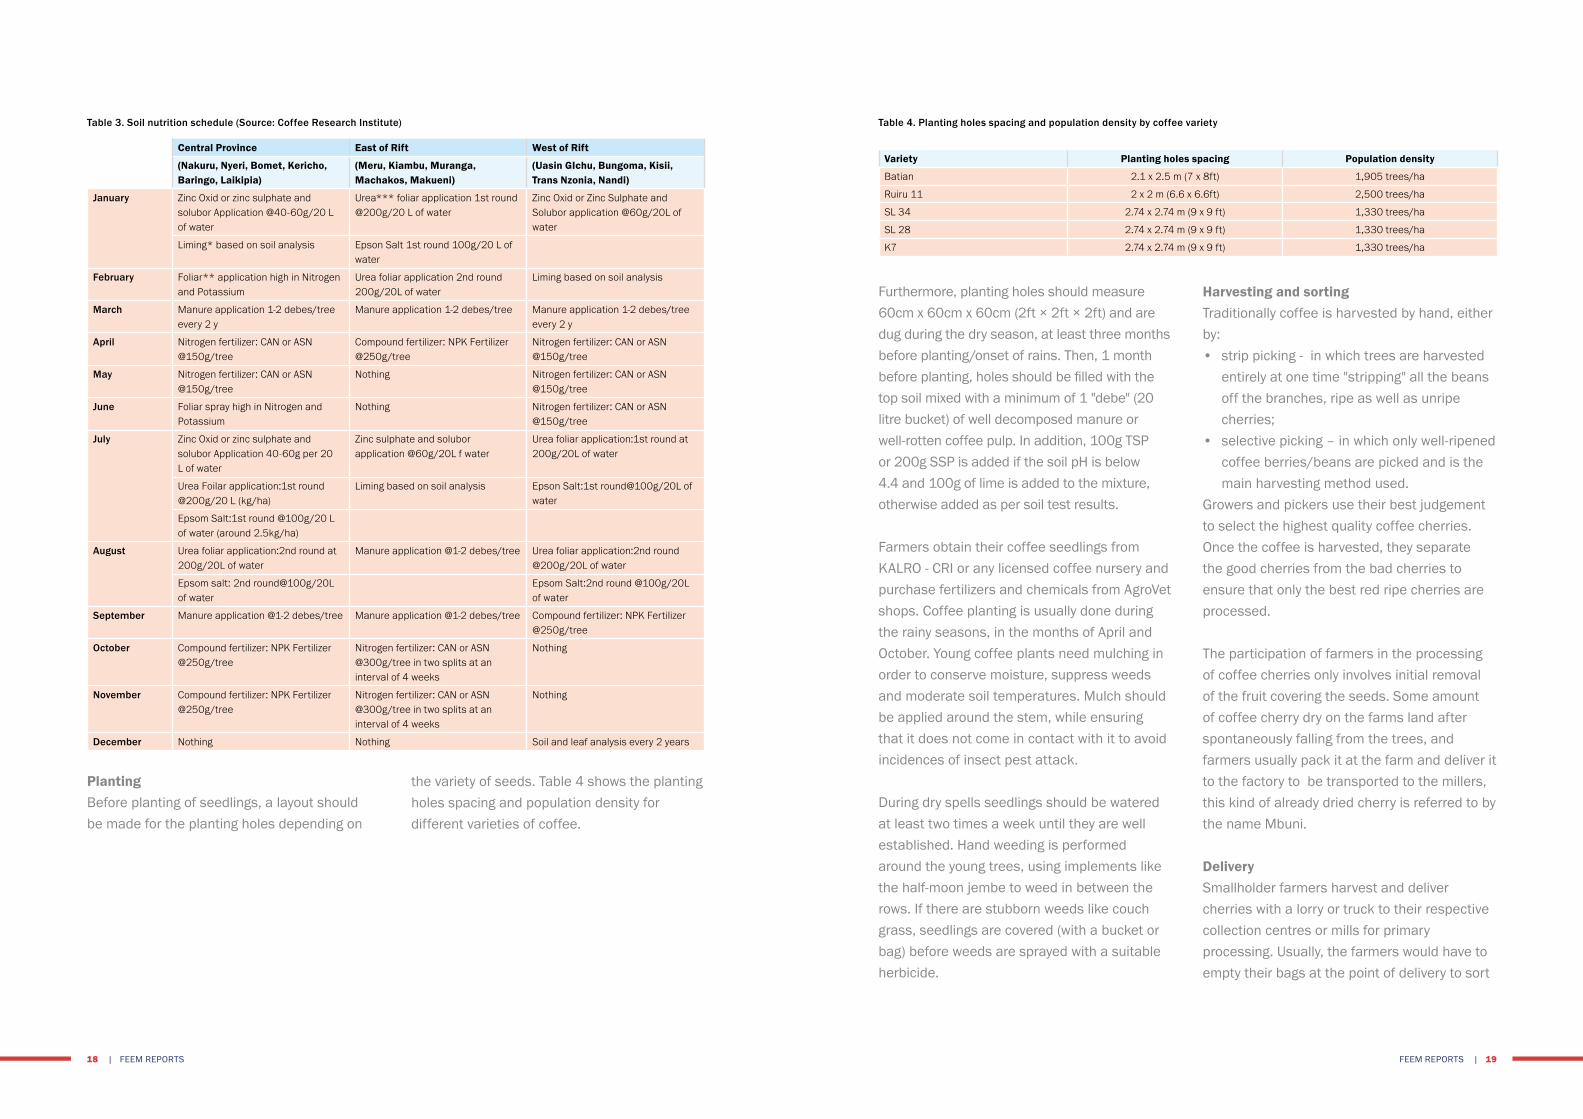
of trees within 6 months should not be used for coffee planting because of the risk of Armillaria, a fungal disease that causes root rot. Soil testing should be done to measure the soil fertility and its suitability. Then, based on soil test reports, the required nutrients should be added to the soil before planting the seedlings. Fertilizers such as phosphorus and lime should be added thoroughly in the soil by ploughing and disking the soil a few months before transplanting the coffee seedlings in the field. Table 3 shows the soil nutrition schedule, redacted by the Coffee Research Institute (CRI).
Figure 6 shows the coffee harvest and shipping seasons in Kenya. Rainfall is distributed in a bimodal pattern in central Kenya, which results in two distinct flowerings each year, shortly after the beginning of the long rains in March/April and October. In western Kenya, rainfall is more evenly distributed, resulting in five different Arabica coffees that compete with Jamaica blues. The main crop ripens from October to December, with the short rains crop harvest beginning in May (Monroy L., Mulinge W., 2013).
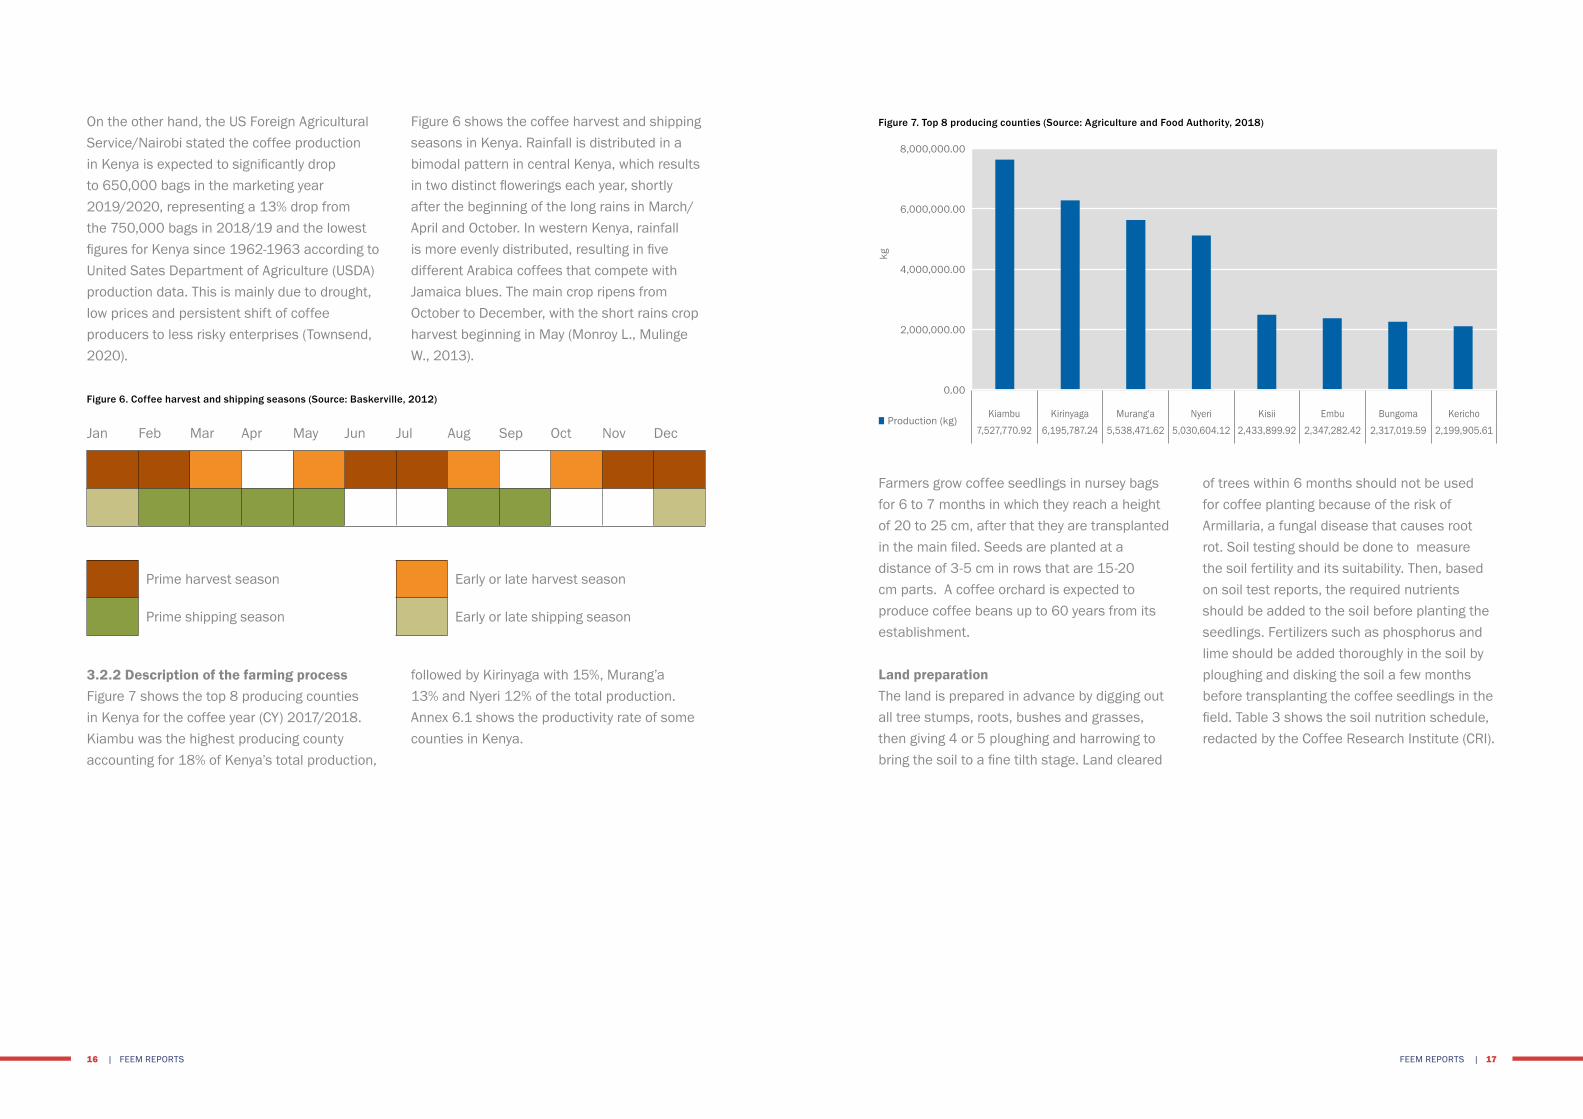
followed by Kirinyaga with 15%, Murang’a 13% and Nyeri 12% of the total production. Annex 6.1 shows the productivity rate of some counties in Kenya.
On the other hand, the US Foreign Agricultural Service/Nairobi stated the coffee production in Kenya is expected to significantly drop to 650,000 bags in the marketing year 2019/2020, representing a 13% drop from the 750,000 bags in 2018/19 and the lowest figures for Kenya since 1962-1963 according to United Sates Department of Agriculture (USDA) production data. This is mainly due to drought, low prices and persistent shift of coffee producers to less risky enterprises (Townsend, 2020).
3.2.2 Description of the farming processFigure 7 shows the top 8 producing counties in Kenya for the coffee year (CY) 2017/2018. Kiambu was the highest producing county accounting for 18% of Kenya’s total production,
Figure 6. Coffee harvest and shipping seasons (Source: Baskerville, 2012)
Jan Feb Mar Apr May Jun Jul Aug Sep Oct Nov Dec
Prime harvest season Early or late harvest season
Prime shipping season Early or late shipping season
Figure 7. Top 8 producing counties (Source: Agriculture and Food Authority, 2018)
8,000,000.00
6,000,000.00
4,000,000.00
2,000,000.00
0.00
Kiambu Kirinyaga Murang'a Nyeri Kisii Embu Bungoma Kericho■ Production (kg)
7,527,770.92 6,195,787.24 5,538,471.62 5,030,604.12 2,433,899.92 2,347,282.42 2,317,019.59 2,199,905.61
kg
FEEM REPORTS | 1716 | FEEM REPORTS
Furthermore, planting holes should measure 60cm x 60cm x 60cm (2ft × 2ft × 2ft) and are dug during the dry season, at least three months before planting/onset of rains. Then, 1 month before planting, holes should be filled with the top soil mixed with a minimum of 1 "debe" (20 litre bucket) of well decomposed manure or well-rotten coffee pulp. In addition, 100g TSP or 200g SSP is added if the soil pH is below 4.4 and 100g of lime is added to the mixture, otherwise added as per soil test results.
Farmers obtain their coffee seedlings from KALRO - CRI or any licensed coffee nursery and purchase fertilizers and chemicals from AgroVet shops. Coffee planting is usually done during the rainy seasons, in the months of April and October. Young coffee plants need mulching in order to conserve moisture, suppress weeds and moderate soil temperatures. Mulch should be applied around the stem, while ensuring that it does not come in contact with it to avoid incidences of insect pest attack.
During dry spells seedlings should be watered at least two times a week until they are well established. Hand weeding is performed around the young trees, using implements like the half-moon jembe to weed in between the rows. If there are stubborn weeds like couch grass, seedlings are covered (with a bucket or bag) before weeds are sprayed with a suitable herbicide.
PlantingBefore planting of seedlings, a layout should be made for the planting holes depending on
Harvesting and sortingTraditionally coffee is harvested by hand, either by: • strip picking - in which trees are harvested
entirely at one time "stripping" all the beans off the branches, ripe as well as unripe cherries;
• selective picking – in which only well-ripened coffee berries/beans are picked and is the main harvesting method used.
Growers and pickers use their best judgement to select the highest quality coffee cherries. Once the coffee is harvested, they separate the good cherries from the bad cherries to ensure that only the best red ripe cherries are processed.
The participation of farmers in the processing of coffee cherries only involves initial removal of the fruit covering the seeds. Some amount of coffee cherry dry on the farms land after spontaneously falling from the trees, and farmers usually pack it at the farm and deliver it to the factory to be transported to the millers, this kind of already dried cherry is referred to by the name Mbuni.
Delivery Smallholder farmers harvest and deliver cherries with a lorry or truck to their respective collection centres or mills for primary processing. Usually, the farmers would have to empty their bags at the point of delivery to sort
the variety of seeds. Table 4 shows the planting holes spacing and population density for different varieties of coffee.
Table 3. Soil nutrition schedule (Source: Coffee Research Institute) Table 4. Planting holes spacing and population density by coffee variety
Central Province East of Rift West of Rift
(Nakuru, Nyeri, Bomet, Kericho, Baringo, Laikipia)
(Meru, Kiambu, Muranga, Machakos, Makueni)
(Uasin GIchu, Bungoma, Kisii, Trans Nzonia, Nandi)
January Zinc Oxid or zinc sulphate and solubor Application @40-60g/20 L of water
Urea*** foliar application 1st round @200g/20 L of water
Zinc Oxid or Zinc Sulphate and Solubor application @60g/20L of water
Liming* based on soil analysis Epson Salt 1st round 100g/20 L of water
February Foliar** application high in Nitrogen and Potassium
Urea foliar application 2nd round 200g/20L of water
Liming based on soil analysis
March Manure application 1-2 debes/tree every 2 y
Manure application 1-2 debes/tree Manure application 1-2 debes/tree every 2 y
April Nitrogen fertilizer: CAN or ASN @150g/tree
Compound fertilizer: NPK Fertilizer @250g/tree
Nitrogen fertilizer: CAN or ASN @150g/tree
May Nitrogen fertilizer: CAN or ASN @150g/tree
Nothing Nitrogen fertilizer: CAN or ASN @150g/tree
June Foliar spray high in Nitrogen and Potassium
Nothing Nitrogen fertilizer: CAN or ASN @150g/tree
July Zinc Oxid or zinc sulphate and solubor Application 40-60g per 20 L of water
Zinc sulphate and solubor application @60g/20L f water
Urea foliar application:1st round at 200g/20L of water
Urea Foilar application:1st round @200g/20 L (kg/ha)
Liming based on soil analysis Epson Salt:1st round@100g/20L of water
Epsom Salt:1st round @100g/20 L of water (around 2.5kg/ha)
August Urea foliar application:2nd round at 200g/20L of water
Manure application @1-2 debes/tree Urea foliar application:2nd round @200g/20L of water
Epsom salt: 2nd round@100g/20L of water
Epsom Salt:2nd round @100g/20L of water
September Manure application @1-2 debes/tree Manure application @1-2 debes/tree Compound fertilizer: NPK Fertilizer @250g/tree
October Compound fertilizer: NPK Fertilizer @250g/tree
Nitrogen fertilizer: CAN or ASN @300g/tree in two splits at an interval of 4 weeks
Nothing
November Compound fertilizer: NPK Fertilizer @250g/tree
Nitrogen fertilizer: CAN or ASN @300g/tree in two splits at an interval of 4 weeks
Nothing
December Nothing Nothing Soil and leaf analysis every 2 years
Variety Planting holes spacing Population density
Batian 2.1 x 2.5 m (7 x 8ft) 1,905 trees/ha
Ruiru 11 2 x 2 m (6.6 x 6.6ft) 2,500 trees/ha
SL 34 2.74 x 2.74 m (9 x 9 ft) 1,330 trees/ha
SL 28 2.74 x 2.74 m (9 x 9 ft) 1,330 trees/ha
K7 2.74 x 2.74 m (9 x 9 ft) 1,330 trees/ha
FEEM REPORTS | 1918 | FEEM REPORTS

Production costs for coffee vary with levels of productivity and between the varieties under establishment. Table 6 shows the average cost
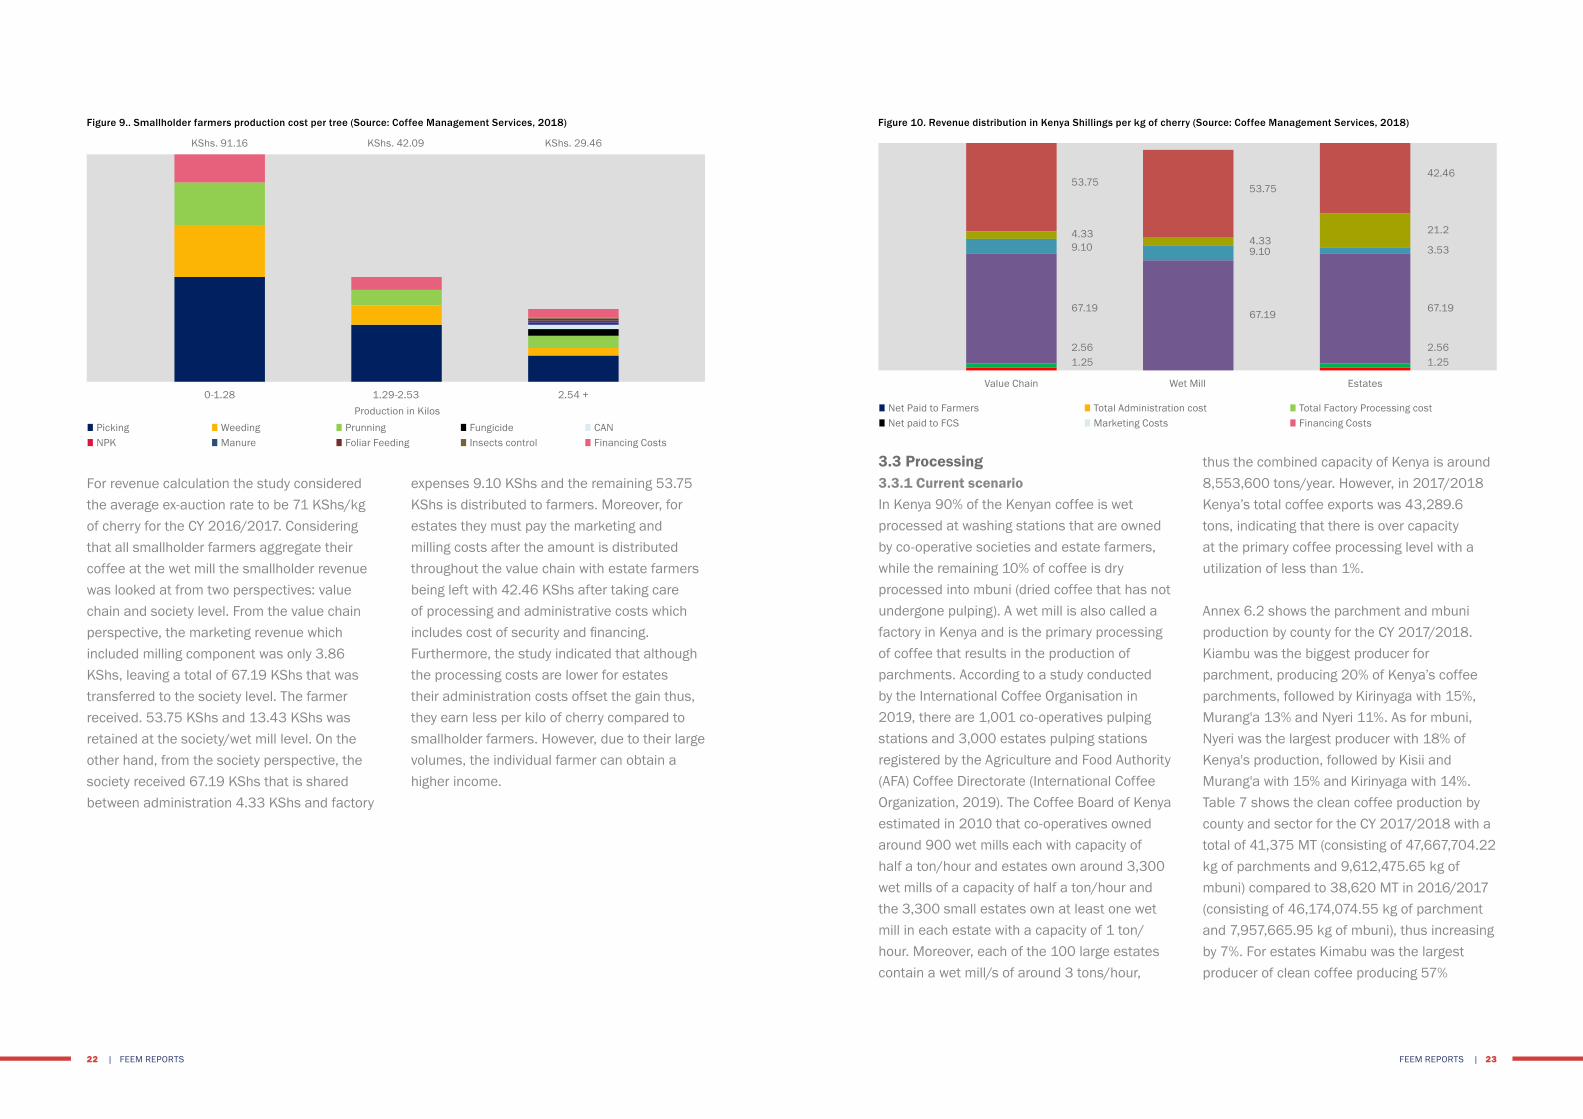
Figures 8 and 9 show the production costs for different farming scales of estates and smallholder farmers, based on a study conducted in 2018, with 540 coffee growers in 20 counties (Coffee Management Services, 2018). For both estates and smallholder farmers the production costs included labour costs for pruning, weed control and picking
of production and revenues per year between 2013 - 2018.
as the main cost components. Furthermore, estates had additional costs of administration and processing which formed a part of their major costs but not found in smallholder farmers. For smallholders cost factors included labour, input costs and coffee varieties, with the bulk of the costs attributed to picking.
farmers are paid is largely dependent on the efficiency of the marketing agents and availability of buyers. Cooperative societies are required to pay at least 80% of sales proceeds to farmers. Table 5 shows the highest and lowest payment rates for cherries per kg by county and region. For 2017/2018 the highest payment rate was 105 KShs/kg at Nyeri and the lowest was 9 KShs/kg at Machakos.
out unripe, overripe and CBD infected cherries. Then, a supervisor inspects the cherries, after which they are weighed, and the farmer is provided with a small up-front payment and a receipt for the amount collected.
3.2.3 Farmers payment rates and costsUpon sale of the coffee, growers get paid directly, if they are estate farmers, or through cooperative societies. The timeframe until
Table 5. Cherry payment rates per kg by region and county (Source: International Coffee Organization, 2019)
Production level Low Mgt Medium Mgt High Mgt Sl Variety Sl Variety Ruiru 11/BatianYield (tonne of clean coffee /ha) 0.27 0.4 0.81 0.95 2 3.57Production/tree (kg of cherry) 1.42 2.11 4.26 5 10.53 10Average price (USD/50 kg cc) 235.48 235.48 235.48 235.48 235.48 235.48Gross revenue (Ksh/hectare) 128,708 194,030 389,995 459,671 967,729 1,727,396Gross revenue (Ksh/tonne) 483,864 483,864 483,864 483,864 483,864 483,864Cost of production/ha 98,367 148,853 258,741 271,678 136,735 106,931Cost of production/tonne 369,801 371,204 321,018 285,977 68,368 29,953Net Revenue per Tonne (Ksh) 17,291 15,887 66,073 101,115 318,724 357,139Production per tree in kgs of cherry 1.4 2.1 4.3 5 10.5 10Cost per kg of cherry 52.83 53.03 45.86 50.16 40.85 9.77Average price per kg of cherry 69.12 69.12 69.12 69.12 69.12 69.12Loss/profit per kg of cherry 16.29 16.09 23.26 18.96 28.27 59.35
Table 6. Average costs of production (Source: International Coffee Organization, 2019)
Figure 8. Estate farmers production cost per kg (Source: Coffee Management Services, 2018)
2015/2016 2016/2017 2017/2018
Region/CountyHighest rate-KES
Lowestrate-KES
Highest rate-KES
Lowestrate-KES
Highest rate-KES
Lowestrate-KES
CENTRAL/MT KENYA WEST 84.6 10.2 119.1 20 105 12.75
KIAMBU 65 25 75.76 25.8 93.43 30
KIRINYAGA 78.7 30.7 119.1 47.72 103 30.95
MURANGA 70.75 10.2 90.1 20 88.1 18.1
NYERI 84.6 20 105 29 105 12.75
MT KENYA EAST 74 14.2 104.88 12 97.45 9
EMBU 74.2 14.2 104.88 26.87 97.45 17.4
MACHAKOS 74 15 75 12 51 9
MAKUENI 56 15 56.5 44.63 34.83 17
MERU 53.23 18 62.05 28 76.4 18.5
TAITA 25 25
THARAKA NITHI 63 35 73 29.5 72 14.04
NORTH RIFT 78 14 66.41 24.2 92.67 28
ELGEYO MARAKWET 44.2 44 44.36 34.62 50 29
NANDI 53 14 53.3 37.5 72 28
TRANS NZOIA 78.2 24 66.41 24.2 92.67 24
UASIN GISHU 27 27 28.13 28.13 34 34
WEST POKOT 48 34 48 37.83 48 37.5
NYANZA 50 10.7 55 17.19 55 9.55
HOMA BAY 50 25 50 30 40 25
KISII 37.75 10.7 54.42 17.19 48.55 9.55
KISUMU 13.5 13.5 55 55 55 55
MIGORI 45 33 54.3 41.5 53 33.8
NYAMIRA 35 15 52.4 29.22 44 12.38
SOUTH RIFT 55.92 14 81 25 78.9 17
BARINGO 43 28.5 64.15 38 45.2 35.54
BOMET 37 14 70.7 25
KERICHO 54.43 31.7 81 31.57 78.9 17
LAIKIPIA 30 30
NAKURU 55.92 29.11 70 44.22 59.4 41
NAROK 23 23
WESTERN 55.7 14 71.31 27.5 77.5 31
BUNGOMA 55.7 14 71.31 27.5 77.5 31
KAKAMEGA 30 30 48 48
Production level Low Mgt Medium Mgt High Mgt Sl Variety Sl Variety Ruiru 11/Batian
Yield (tonne of clean coffee /ha) 0.27 0.4 0.81 0.95 2 3.57
Production/tree (kg of cherry) 1.42 2.11 4.26 5 10.53 10
Average price (USD/50 kg cc) 235.48 235.48 235.48 235.48 235.48 235.48
Gross revenue (Ksh/hectare) 128,708 194,030 389,995 459,671 967,729 1,727,396
Gross revenue (Ksh/tonne) 483,864 483,864 483,864 483,864 483,864 483,864
Cost of production/ha 98,367 148,853 258,741 271,678 136,735 106,931
Cost of production/tonne 369,801 371,204 321,018 285,977 68,368 29,953
Net Revenue per Tonne (Ksh) 17,291 15,887 66,073 101,115 318,724 357,139
Production per tree in kgs of cherry 1.4 2.1 4.3 5 10.5 10
Cost per kg of cherry 52.83 53.03 45.86 50.16 40.85 9.77
Average price per kg of cherry 69.12 69.12 69.12 69.12 69.12 69.12
Loss/profit per kg of cherry 16.29 16.09 23.26 18.96 28.27 59.35
■ Picking ■ Other costs ■ Prunning ■ Fungicide ■ Weeding ■ NPK ■ CAN■ Soil Amelioration ■ Foliar Feeding ■ Irrigation ■ Conservation ■ Insects control ■ Manure
Cos
t in
KSh
s.
Production in Kilos
0-3.94
KShs. 43.65
3.95 - 4.65
KShs. 41.70
4.66 +
KShs. 26.25
FEEM REPORTS | 2120 | FEEM REPORTS
3.3 Processing3.3.1 Current scenarioIn Kenya 90% of the Kenyan coffee is wet processed at washing stations that are owned by co-operative societies and estate farmers, while the remaining 10% of coffee is dry processed into mbuni (dried coffee that has not undergone pulping). A wet mill is also called a factory in Kenya and is the primary processing of coffee that results in the production of parchments. According to a study conducted by the International Coffee Organisation in 2019, there are 1,001 co-operatives pulping stations and 3,000 estates pulping stations registered by the Agriculture and Food Authority (AFA) Coffee Directorate (International Coffee Organization, 2019). The Coffee Board of Kenya estimated in 2010 that co-operatives owned around 900 wet mills each with capacity of half a ton/hour and estates own around 3,300 wet mills of a capacity of half a ton/hour and the 3,300 small estates own at least one wet mill in each estate with a capacity of 1 ton/hour. Moreover, each of the 100 large estates contain a wet mill/s of around 3 tons/hour,
thus the combined capacity of Kenya is around 8,553,600 tons/year. However, in 2017/2018 Kenya’s total coffee exports was 43,289.6 tons, indicating that there is over capacity at the primary coffee processing level with a utilization of less than 1%.
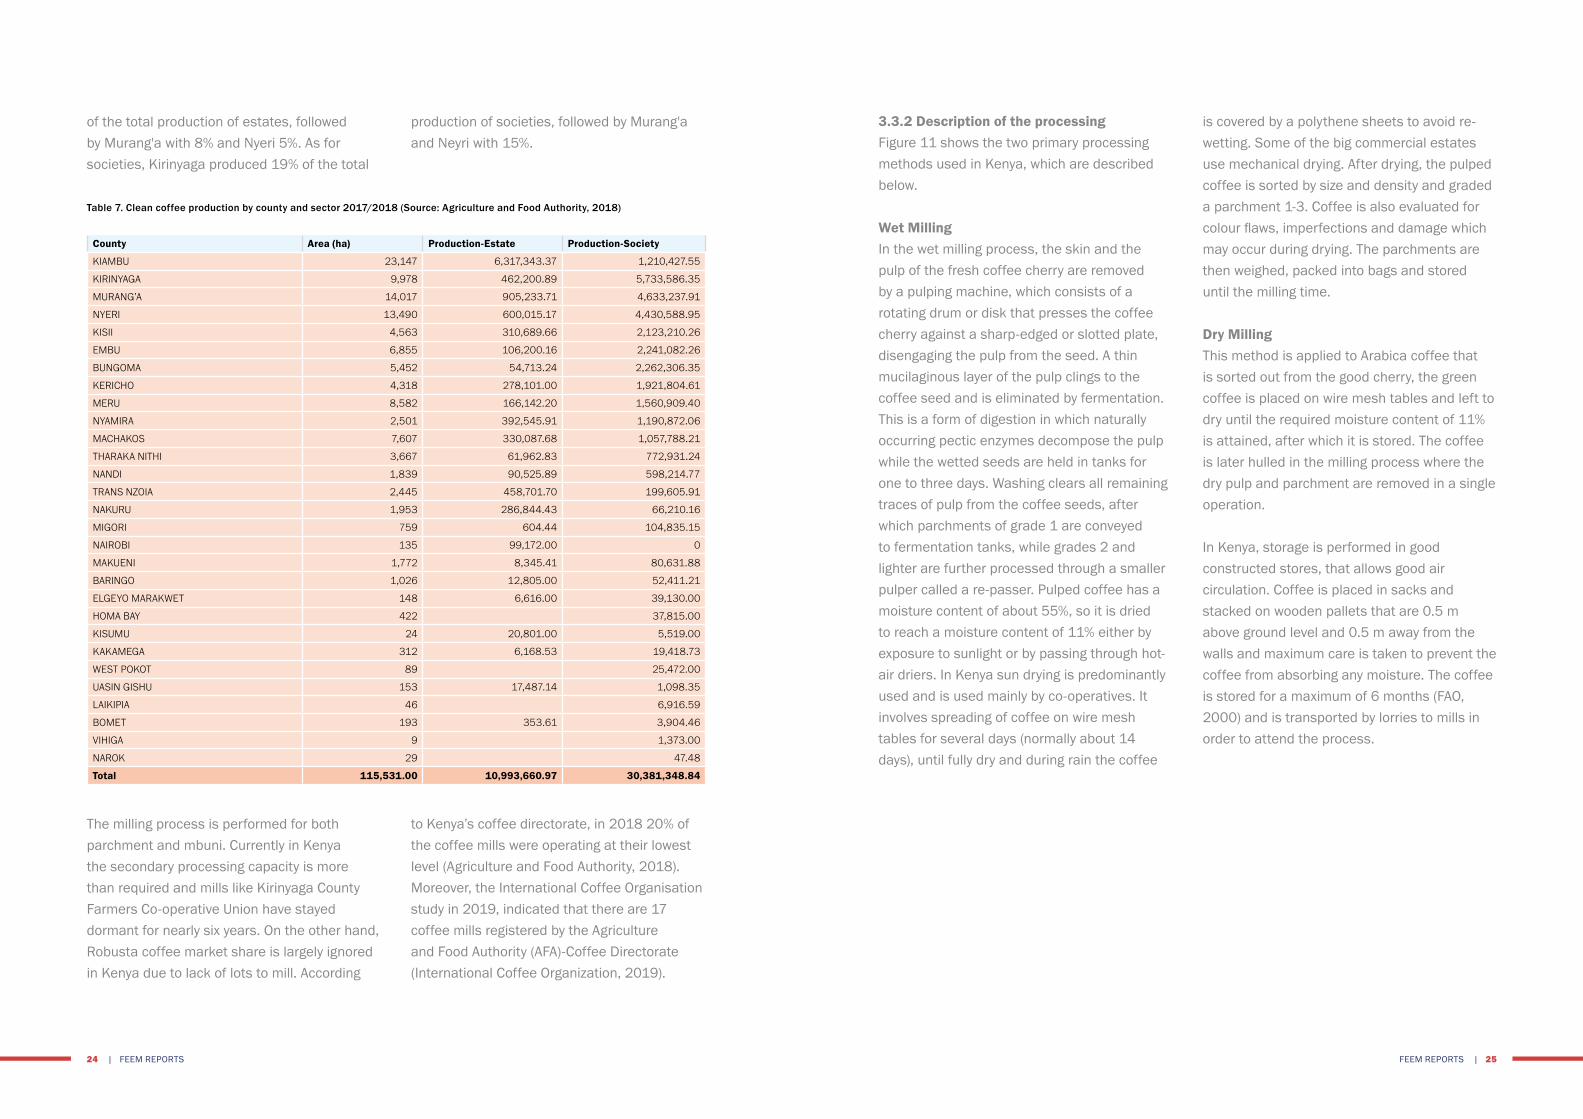
Annex 6.2 shows the parchment and mbuni production by county for the CY 2017/2018. Kiambu was the biggest producer for parchment, producing 20% of Kenya’s coffee parchments, followed by Kirinyaga with 15%, Murang'a 13% and Nyeri 11%. As for mbuni, Nyeri was the largest producer with 18% of Kenya's production, followed by Kisii and Murang'a with 15% and Kirinyaga with 14%. Table 7 shows the clean coffee production by county and sector for the CY 2017/2018 with a total of 41,375 MT (consisting of 47,667,704.22 kg of parchments and 9,612,475.65 kg of mbuni) compared to 38,620 MT in 2016/2017 (consisting of 46,174,074.55 kg of parchment and 7,957,665.95 kg of mbuni), thus increasing by 7%. For estates Kimabu was the largest producer of clean coffee producing 57%
expenses 9.10 KShs and the remaining 53.75 KShs is distributed to farmers. Moreover, for estates they must pay the marketing and milling costs after the amount is distributed throughout the value chain with estate farmers being left with 42.46 KShs after taking care of processing and administrative costs which includes cost of security and financing. Furthermore, the study indicated that although the processing costs are lower for estates their administration costs offset the gain thus, they earn less per kilo of cherry compared to smallholder farmers. However, due to their large volumes, the individual farmer can obtain a higher income.
For revenue calculation the study considered the average ex-auction rate to be 71 KShs/kg of cherry for the CY 2016/2017. Considering that all smallholder farmers aggregate their coffee at the wet mill the smallholder revenue was looked at from two perspectives: value chain and society level. From the value chain perspective, the marketing revenue which included milling component was only 3.86 KShs, leaving a total of 67.19 KShs that was transferred to the society level. The farmer received. 53.75 KShs and 13.43 KShs was retained at the society/wet mill level. On the other hand, from the society perspective, the society received 67.19 KShs that is shared between administration 4.33 KShs and factory
Figure 9.. Smallholder farmers production cost per tree (Source: Coffee Management Services, 2018) Figure 10. Revenue distribution in Kenya Shillings per kg of cherry (Source: Coffee Management Services, 2018)
■ Picking ■ Weeding ■ Prunning ■ Fungicide ■ CAN■ NPK ■ Manure ■ Foliar Feeding ■ Insects control ■ Financing Costs
■ Net Paid to Farmers ■ Total Administration cost ■ Total Factory Processing cost■ Net paid to FCS ■ Marketing Costs ■ Financing Costs
Production in Kilos
0-1.28Value Chain
42.4653.75
53.75
21.24.334.33
3.539.10 9.10
67.1967.1967.19
1.251.252.562.56
KShs. 91.16
1.29-2.53Wet Mill
KShs. 42.09
2.54 +Estates
KShs. 29.46
FEEM REPORTS | 2322 | FEEM REPORTS
3.3.2 Description of the processingFigure 11 shows the two primary processing methods used in Kenya, which are described below.
Wet MillingIn the wet milling process, the skin and the pulp of the fresh coffee cherry are removed by a pulping machine, which consists of a rotating drum or disk that presses the coffee cherry against a sharp-edged or slotted plate, disengaging the pulp from the seed. A thin mucilaginous layer of the pulp clings to the coffee seed and is eliminated by fermentation. This is a form of digestion in which naturally occurring pectic enzymes decompose the pulp while the wetted seeds are held in tanks for one to three days. Washing clears all remaining traces of pulp from the coffee seeds, after which parchments of grade 1 are conveyed to fermentation tanks, while grades 2 and lighter are further processed through a smaller pulper called a re-passer. Pulped coffee has a moisture content of about 55%, so it is dried to reach a moisture content of 11% either by exposure to sunlight or by passing through hot-air driers. In Kenya sun drying is predominantly used and is used mainly by co-operatives. It involves spreading of coffee on wire mesh tables for several days (normally about 14 days), until fully dry and during rain the coffee
is covered by a polythene sheets to avoid re-wetting. Some of the big commercial estates use mechanical drying. After drying, the pulped coffee is sorted by size and density and graded a parchment 1-3. Coffee is also evaluated for colour flaws, imperfections and damage which may occur during drying. The parchments are then weighed, packed into bags and stored until the milling time.
Dry MillingThis method is applied to Arabica coffee that is sorted out from the good cherry, the green coffee is placed on wire mesh tables and left to dry until the required moisture content of 11% is attained, after which it is stored. The coffee is later hulled in the milling process where the dry pulp and parchment are removed in a single operation.
In Kenya, storage is performed in good constructed stores, that allows good air circulation. Coffee is placed in sacks and stacked on wooden pallets that are 0.5 m above ground level and 0.5 m away from the walls and maximum care is taken to prevent the coffee from absorbing any moisture. The coffee is stored for a maximum of 6 months (FAO, 2000) and is transported by lorries to mills in order to attend the process.
production of societies, followed by Murang'a and Neyri with 15%.
to Kenya’s coffee directorate, in 2018 20% of the coffee mills were operating at their lowest level (Agriculture and Food Authority, 2018). Moreover, the International Coffee Organisation study in 2019, indicated that there are 17 coffee mills registered by the Agriculture and Food Authority (AFA)-Coffee Directorate (International Coffee Organization, 2019).
of the total production of estates, followed by Murang'a with 8% and Nyeri 5%. As for societies, Kirinyaga produced 19% of the total
The milling process is performed for both parchment and mbuni. Currently in Kenya the secondary processing capacity is more than required and mills like Kirinyaga County Farmers Co-operative Union have stayed dormant for nearly six years. On the other hand, Robusta coffee market share is largely ignored in Kenya due to lack of lots to mill. According
Table 7. Clean coffee production by county and sector 2017/2018 (Source: Agriculture and Food Authority, 2018)
County Area (ha) Production-Estate Production-Society
KIAMBU 23,147 6,317,343.37 1,210,427.55
KIRINYAGA 9,978 462,200.89 5,733,586.35
MURANG’A 14,017 905,233.71 4,633,237.91
NYERI 13,490 600,015.17 4,430,588.95
KISII 4,563 310,689.66 2,123,210.26
EMBU 6,855 106,200.16 2,241,082.26
BUNGOMA 5,452 54,713.24 2,262,306.35
KERICHO 4,318 278,101.00 1,921,804.61
MERU 8,582 166,142.20 1,560,909.40
NYAMIRA 2,501 392,545.91 1,190,872.06
MACHAKOS 7,607 330,087.68 1,057,788.21
THARAKA NITHI 3,667 61,962.83 772,931.24
NANDI 1,839 90,525.89 598,214.77
TRANS NZOIA 2,445 458,701.70 199,605.91
NAKURU 1,953 286,844.43 66,210.16
MIGORI 759 604.44 104,835.15
NAIROBI 135 99,172.00 0
MAKUENI 1,772 8,345.41 80,631.88
BARINGO 1,026 12,805.00 52,411.21
ELGEYO MARAKWET 148 6,616.00 39,130.00
HOMA BAY 422 37,815.00
KISUMU 24 20,801.00 5,519.00
KAKAMEGA 312 6,168.53 19,418.73
WEST POKOT 89 25,472.00
UASIN GISHU 153 17,487.14 1,098.35
LAIKIPIA 46 6,916.59
BOMET 193 353.61 3,904.46
VIHIGA 9 1,373.00
NAROK 29 47.48
Total 115,531.00 10,993,660.97 30,381,348.84
FEEM REPORTS | 2524 | FEEM REPORTS

where any silver skin that remains on the beans after hulling is removed by machine. Polished beans are considered superior to unpolished ones, however in reality there is little difference between the two.
• Grading and Sorting – This step is done by size and weight, and beans are also reviewed for colour flaws or other imperfections. Beans are sized by being passed through a series of screens. They are also sorted pneumatically by using an
air jet to separate heavy from light beans. Finally, defective beans are removed either by hand or by machinery. Beans that are unsatisfactory due to deficiencies (unacceptable size or colour, over-fermented beans, insect-damaged, un-hulled) are removed. The aim of grading is to group the coffee beans homogeneously into commercial lots that meet defined quality standards and for pricing.
12 below describes the secondary processing undergone by the coffee in Kenya and is called milling. In mills coffee processing involves the following: • Hulling – Machinery is used to remove
the parchment layer (endocarp) from wet processed coffee. Hulling dry processed coffee refers to removing the entire dried husk, the exocarp, mesocarp and endocarp of the dried cherries.
• Polishing – It is an optional process
Secondary processing/MillingUpon arrival to the mill coffee is weighted using a digital weighting machine and a quality analysis is done before the processing step (after sorting and primary processing). This involves a visual inspection of the size in a sample of 1 kg per bag of 50 kg and a moisture content check. For traceability an outturn number is assigned to each 50 kg coffee bag and this depends on the week the coffee is delivered within a coffee year. Figure
Greens to sun drying
Floaters to sun drying
Water to recycling andpulp to composting
Water to wasteor recycling
Cherryreception/sorting
Flotation - wet/dryfeed
Pregrader/pulper
Commercialfarmers
Pre-gradingchannel
Fermentationtanks
Washing
Grading channel(Heavies and lights
separated)
Skin drying(remove) all free/
excess water)
Sun and/ormechanical drying
Storageand conditioning
WET PROCESS
Rubbish to waste
Rubbish to waste
Water to recycling andpulp to composting
Cherryreception/sorting
Flotation - and skindry (optional)
Sun drying/tracking
DRY PROCESS
Figure 11. Wet and dry milling process (USAID, 2010)
Figure 12. Coffee milling process (USAID, 2010)
Rubbish and stone to waste
Parchment shells to waste,furnace or other use. For dry milling,
husk to composting - pods to re-pass
Dust to waste - shell/earsto bagging off
Remove rejects orforeign matter
Pre-cleaning/destoning
Milling/hulling
All cleaning(catador)
Grading by beansize (screening)
Grading by beandensity (gravity table)
Manual or machinesorting
Quality evaluationand classification
Bagging off forshipment in bags or
silo for shipment in bulks
MILLING
FEEM REPORTS | 2726 | FEEM REPORTS

3.3.3 Identification of the processing facilities and volumes of processingFor the CY 2017/2018, NKG mills processed the largest percentage of Kenya coffee compromising of 26% of Kenya’s total produced parchment and 21% of mbuni. For parchments, the second largest processing mill was KOFINAF milling 19%, followed by CKCM
3.3.4 Mills chargesThe charges for coffee millers in Kenya vary according to how they offer differentiated service. The services include milling, grading, handling, transportation fees, provision of exports bags and warehouse charges. Table 8
3.4 Coffee standards and qualityAfter coffee cherries pass through a pulper, they are classified by their density into 3 categories: • Parchment 1 is the heaviest coffee• Parchment 2 is the medium density coffee• Parchment 3 or P-Lights is the lightest one
Table 9 shows the grades of processed coffee,
18% and SASINI PLC 13%. Regarding mbuni, the second largest processing mill was CKM with 18% of Kenya’s milled mbuni, followed by GUSII Farmers Union 15% and KOFINAF 12%. Annex 6.3 show the quantities of mbuni and parchment coffee processed by other mills in Ghana.
shows the charges of some millers for the CY 2017/2018, were the average cost per bag of clean processed coffee ranged between 13.42 USD/bag (1,381.99 KShs/bag) to 7.46 USD/bag (786.77 KShs/bag).
with grades E, AA, AB and PB being regarded as the premium grades. Kenya AA is considered to be one of the world's finest specialty coffees. Grade AB consist of bean types A and B mixed together and is the most plentiful in a particular consignment and used to represent other grades. Other gradings include: SB (sorted beans), UG (ungraded) cherry and HE (hulled ears).
Figure 13. Clean coffee top-8 producing mills (Source: Agriculture and Food Authority, 2018)
Table 8. Coffee millers charges (Source: Agriculture and Food Authority, 2018)
Table 9. Coffee grades and screen size (Source: Agriculture and Food Authority, 2018)
MILLER MILLING CHARGES ($/TON)
HANDLING ($/TON) EXPORT BAGS ($/BAG)
TRANSPORT TO WAREHOUSE ($/BAG)
AVERAGE COST($/BAG)
KPCU 65.00 79.68 3.00 - 13.42
OTHAYA FCS 57.00 - 3.00 3.30 10.40
GUSII 55.00 20.00 3.00 1.90 10.30
CKCM 45.00 25.00 3.40 1.25 9.69
KIPKELION 65.00 - 2.63 2.00 9.31
TCM 45.00 30.00 3.00 0.80 9.20
NKG 65.00 7.50 3.00 0.80 9.02
KCCM 66.00 - 3.00 1.10 8.86
LECOM 65.00 13.28 2.50 0.70 8.84
MERU 40.00 25.00 2.00 1.43 8.11
KOFINAF 65.00 - 3.00 - 7.68
SASINI 45.00 25.00 2.50 - 7.54
THARAKA NITHI 55.00 - 1.80 1.70 7.46
The grading of the coffee does not affect its quality, but rather its class instead. Kenyan coffee can receive a class ranging from 1 (worst) to 10 (best), this allows to further sort coffee within a grade (Nganga, 2019).
Grade and description Screen size
E (Elephant) Two beans joint together Retained by screen 21 (8.3mm)
AA (Flat bean) Retained by screen 18/17 (7.2mm)
AB (Flat bean) Retained by screen 16 (6.35mm)
PB (Peaberry-Oval bean) Retained by screen 12 (4.76mm)
C (Smaller beans) Retained by screen 10 (3.96mm)
TT (Lights from AA and AB) Gravity separated
T (Smallest beans, broken, chipped) Passing through 7 (2.9mm)
Mbuni coffee is graded as follows:• MH (Mbuni Heavy – it depends on the
density)• ML (Mbuni Light – it depends on the density)
10,000,000
9 ,000,000
8 ,000,000
7 ,000,000
6 ,000,000
5 ,000,000
4 ,000,000
3 ,000,000
2 ,000,000
1 ,000,000
0
■ Parchment
NKG KOFINAF CKCM SASINI PLC THIKA COFFEE
MILLS LTD
CMS MILLS LTD
GUSII FARMERS
UNION
MCCM CO-OP UNION LTD
9,428,886 6,976,514 6,594,028 4,737,816 1,910,986 1,583,895 1,560,340 836,716
■ Mbuni 1,012,192 597,869 894,003 446,621 398,383 219,234 755,997 56,014
kg
FEEM REPORTS | 2928 | FEEM REPORTS
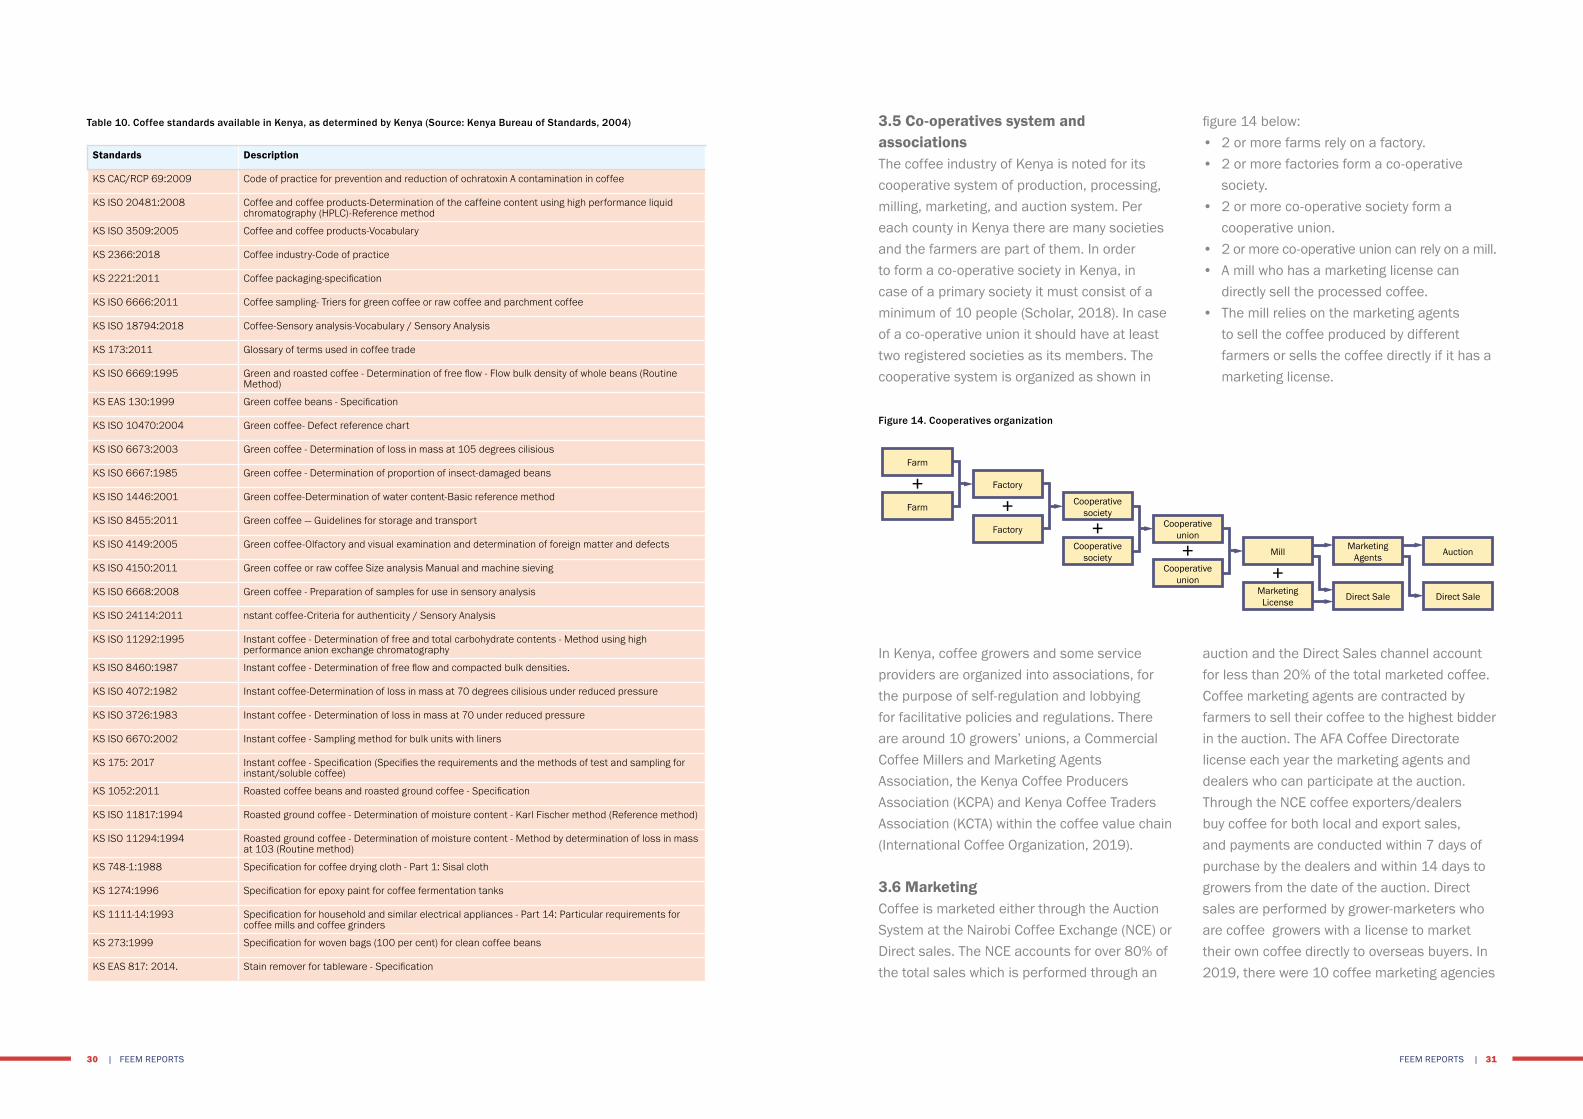
3.5 Co-operatives system and associationsThe coffee industry of Kenya is noted for its cooperative system of production, processing, milling, marketing, and auction system. Per each county in Kenya there are many societies and the farmers are part of them. In order to form a co-operative society in Kenya, in case of a primary society it must consist of a minimum of 10 people (Scholar, 2018). In case of a co-operative union it should have at least two registered societies as its members. The cooperative system is organized as shown in
In Kenya, coffee growers and some service providers are organized into associations, for the purpose of self-regulation and lobbying for facilitative policies and regulations. There are around 10 growers’ unions, a Commercial Coffee Millers and Marketing Agents Association, the Kenya Coffee Producers Association (KCPA) and Kenya Coffee Traders Association (KCTA) within the coffee value chain (International Coffee Organization, 2019).
3.6 Marketing Coffee is marketed either through the Auction System at the Nairobi Coffee Exchange (NCE) or Direct sales. The NCE accounts for over 80% of the total sales which is performed through an
figure 14 below: • 2 or more farms rely on a factory.• 2 or more factories form a co-operative
society.• 2 or more co-operative society form a
cooperative union.• 2 or more co-operative union can rely on a mill.• A mill who has a marketing license can
directly sell the processed coffee.• The mill relies on the marketing agents
to sell the coffee produced by different farmers or sells the coffee directly if it has a marketing license.
auction and the Direct Sales channel account for less than 20% of the total marketed coffee. Coffee marketing agents are contracted by farmers to sell their coffee to the highest bidder in the auction. The AFA Coffee Directorate license each year the marketing agents and dealers who can participate at the auction. Through the NCE coffee exporters/dealers buy coffee for both local and export sales, and payments are conducted within 7 days of purchase by the dealers and within 14 days to growers from the date of the auction. Direct sales are performed by grower-marketers who are coffee growers with a license to market their own coffee directly to overseas buyers. In 2019, there were 10 coffee marketing agencies
Table 10. Coffee standards available in Kenya, as determined by Kenya (Source: Kenya Bureau of Standards, 2004)
Figure 14. Cooperatives organization
+Farm
Farm
Factory
+Factory
Cooperativesociety
+Cooperative
society
Cooperativeunion
+Cooperative
union
Mill
+MarketingLicense
MarketingAgents
Direct Sale
Auction
Direct Sale
Standards Description
KS CAC/RCP 69:2009 Code of practice for prevention and reduction of ochratoxin A contamination in coffee
KS ISO 20481:2008 Coffee and coffee products-Determination of the caffeine content using high performance liquid chromatography (HPLC)-Reference method
KS ISO 3509:2005 Coffee and coffee products-Vocabulary
KS 2366:2018 Coffee industry-Code of practice
KS 2221:2011 Coffee packaging-specification
KS ISO 6666:2011 Coffee sampling- Triers for green coffee or raw coffee and parchment coffee
KS ISO 18794:2018 Coffee-Sensory analysis-Vocabulary / Sensory Analysis
KS 173:2011 Glossary of terms used in coffee trade
KS ISO 6669:1995 Green and roasted coffee - Determination of free flow - Flow bulk density of whole beans (Routine Method)
KS EAS 130:1999 Green coffee beans - Specification
KS ISO 10470:2004 Green coffee- Defect reference chart
KS ISO 6673:2003 Green coffee - Determination of loss in mass at 105 degrees cilisious
KS ISO 6667:1985 Green coffee - Determination of proportion of insect-damaged beans
KS ISO 1446:2001 Green coffee-Determination of water content-Basic reference method
KS ISO 8455:2011 Green coffee — Guidelines for storage and transport
KS ISO 4149:2005 Green coffee-Olfactory and visual examination and determination of foreign matter and defects
KS ISO 4150:2011 Green coffee or raw coffee Size analysis Manual and machine sieving
KS ISO 6668:2008 Green coffee - Preparation of samples for use in sensory analysis
KS ISO 24114:2011 nstant coffee-Criteria for authenticity / Sensory Analysis
KS ISO 11292:1995 Instant coffee - Determination of free and total carbohydrate contents - Method using high performance anion exchange chromatography
KS ISO 8460:1987 Instant coffee - Determination of free flow and compacted bulk densities.
KS ISO 4072:1982 Instant coffee-Determination of loss in mass at 70 degrees cilisious under reduced pressure
KS ISO 3726:1983 Instant coffee - Determination of loss in mass at 70 under reduced pressure
KS ISO 6670:2002 Instant coffee - Sampling method for bulk units with liners
KS 175: 2017 Instant coffee - Specification (Specifies the requirements and the methods of test and sampling for instant/soluble coffee)
KS 1052:2011 Roasted coffee beans and roasted ground coffee - Specification
KS ISO 11817:1994 Roasted ground coffee - Determination of moisture content - Karl Fischer method (Reference method)
KS ISO 11294:1994 Roasted ground coffee - Determination of moisture content - Method by determination of loss in mass at 103 (Routine method)
KS 748-1:1988 Specification for coffee drying cloth - Part 1: Sisal cloth
KS 1274:1996 Specification for epoxy paint for coffee fermentation tanks
KS 1111-14:1993 Specification for household and similar electrical appliances - Part 14: Particular requirements for coffee mills and coffee grinders
KS 273:1999 Specification for woven bags (100 per cent) for clean coffee beans
KS EAS 817: 2014. Stain remover for tableware - Specification
FEEM REPORTS | 3130 | FEEM REPORTS

AuctionFigures 16 and 17 show the performance of the NCE over the last 20 years. Although there was a decline in the volume of coffee marketed through the NCE, its value has been increasing over the years. The decline in volumes may be attributed to shift of many foreign buyers in Kenya from volumes purchasing to purchase of certified and traceable coffee that is highly
Table 12 shows the marketing agents performance in auction were Topical Farm Management, Coffee Management Services,
demanded in Europe and America. In the CY 2017/2018 Arabica coffee grades AA, AB and C dominated the auction. Annex 6.4 shows the auction sales for the various grades of coffee. The main coffee grades (AA, AB, C, E, TT, T, PB) contributed to 79.9% of the sales, while miscellaneous (HE, SB, UG, UG1-3) and mbuni (MH, ML) grades contributed to 21.1% of the sales.
Aristocrats Coffee & Tea and Oaklands Coffee Marketing sold 80% of the total sales in both the CY 2016/2017 and CY 2017/2018.
the marketing agents at the NCE and Direct sales trade for 2017/2018 and their overall performance, were Tropical Farm Management, Coffee Management Services and Aristocrats Coffee & Tea controlled 72% of the coffee market share for both auction and direct sales.
trading units at the auction in NCE. Local prices at the NCE performed well compared to the ICE prices (the data are reported in Annex 6.5).
and 25 coffee marketers. If growers do not have the capacity to market their product directly, commercial marketing agents facilitate the process by drawing up sales agreements between producers and buyers and handling other marketing logistics. Table 11 shows
A comparative price analysis for both Nairobi Coffee Exchange and International Coffee Exchange (ICE) is presented in figure 15. The rates have been converted into equivalent
Table 11. Overall marketing agents performance 2017/18 (Source: Agriculture and Food Authority, 2018)
Figure 15. Price comparison NCE vs ICE (Source: Agriculture and Food Authority, 2018)
Figure 16. Auction traded weight (kg) (Source: Agriculture and Food Authority, 2018)
Figure 17. Auction values (Source: Agriculture and Food Authority, 2018)
MARKETING AGENT (MA) FULL BAGS-50 kg BAGS
WEIGHT BOUGHT-kg VALUE (USD) PERCENT
Tropical Farm Management (K) LTD. 215,927 13,116,705 60,269,920.38 30%
Coffee Management Services 186,346 11,361,732 54,614,602.48 26%
Aristocrats Coffee & Tea 112,672 6,892,636 26,883,356.18 16%
Oaklands Coffee Marketing 63,584 3,903,246 15,909,402.14 9%
Sustainable Management Services 49,390 3,042,120 13,815,216.00 7%
Thika Coffee Marketing 37,438 2,305,264 8,367,352.14 5%
Kenya Cooperative Coffee Exporters 21,778 1,324,764 3,912,028.76 3%
Sucastainability (K) LTD 14,932 926,877 3,714,227.68 2%
Meru County Coffee Marketing 9,658 595,814 1,937,889.86 1%
Classic Coffee LTD 2,703 168,544 776,183.30 0%
Grand Total 714,428 43,637,702 190,200,178.92 100%
90,000,000
80,000,000
70,000,000
60,000,000
50,000,000
40,000,000
30,000,000
250,000,000
200,000,000
150,000,000
100,000,000
50,000,000
kgU
SD
350
300
250
200
150
100
50
0
Oct
13
Jan
14
Apr 1
4
Jul 1
4
Oct
14
Jan
15
Apr 1
5
Aug
15
Nov
15
Feb
16
May
16
Aug
16
Nov
16
Feb
17
May
17
Sep
17
Dec
17
Mar
18
Jul 1
8
USD
/50k
g
NCE (USD/50kg) ICE (USD/50kg)
1998
/199
9
1999
/20
00
200
0/20
01
2001
/20
02
2002
/20
03
2003
/20
04
200
4/20
05
2005
/20
06
2006
/20
07
2007
/20
08
2008
/20
09
2009
/201
0
2010
/201
1
2011
/201
2
201
2/20
13
2013
/201
4
2014
/201
5
2015
/201
6
2016
/201
7
2017
/201
8
1998
/199
9
1999
/20
00
200
0/20
01
2001
/20
02
2002
/20
03
2003
/20
04
200
4/20
05
2005
/20
06
2006
/20
07
2007
/20
08
2008
/20
09
2009
/201
0
2010
/201
1
2011
/201
2
201
2/20
13
2013
/201
4
2014
/201
5
2015
/201
6
2016
/201
7
2017
/201
8
FEEM REPORTS | 3332 | FEEM REPORTS
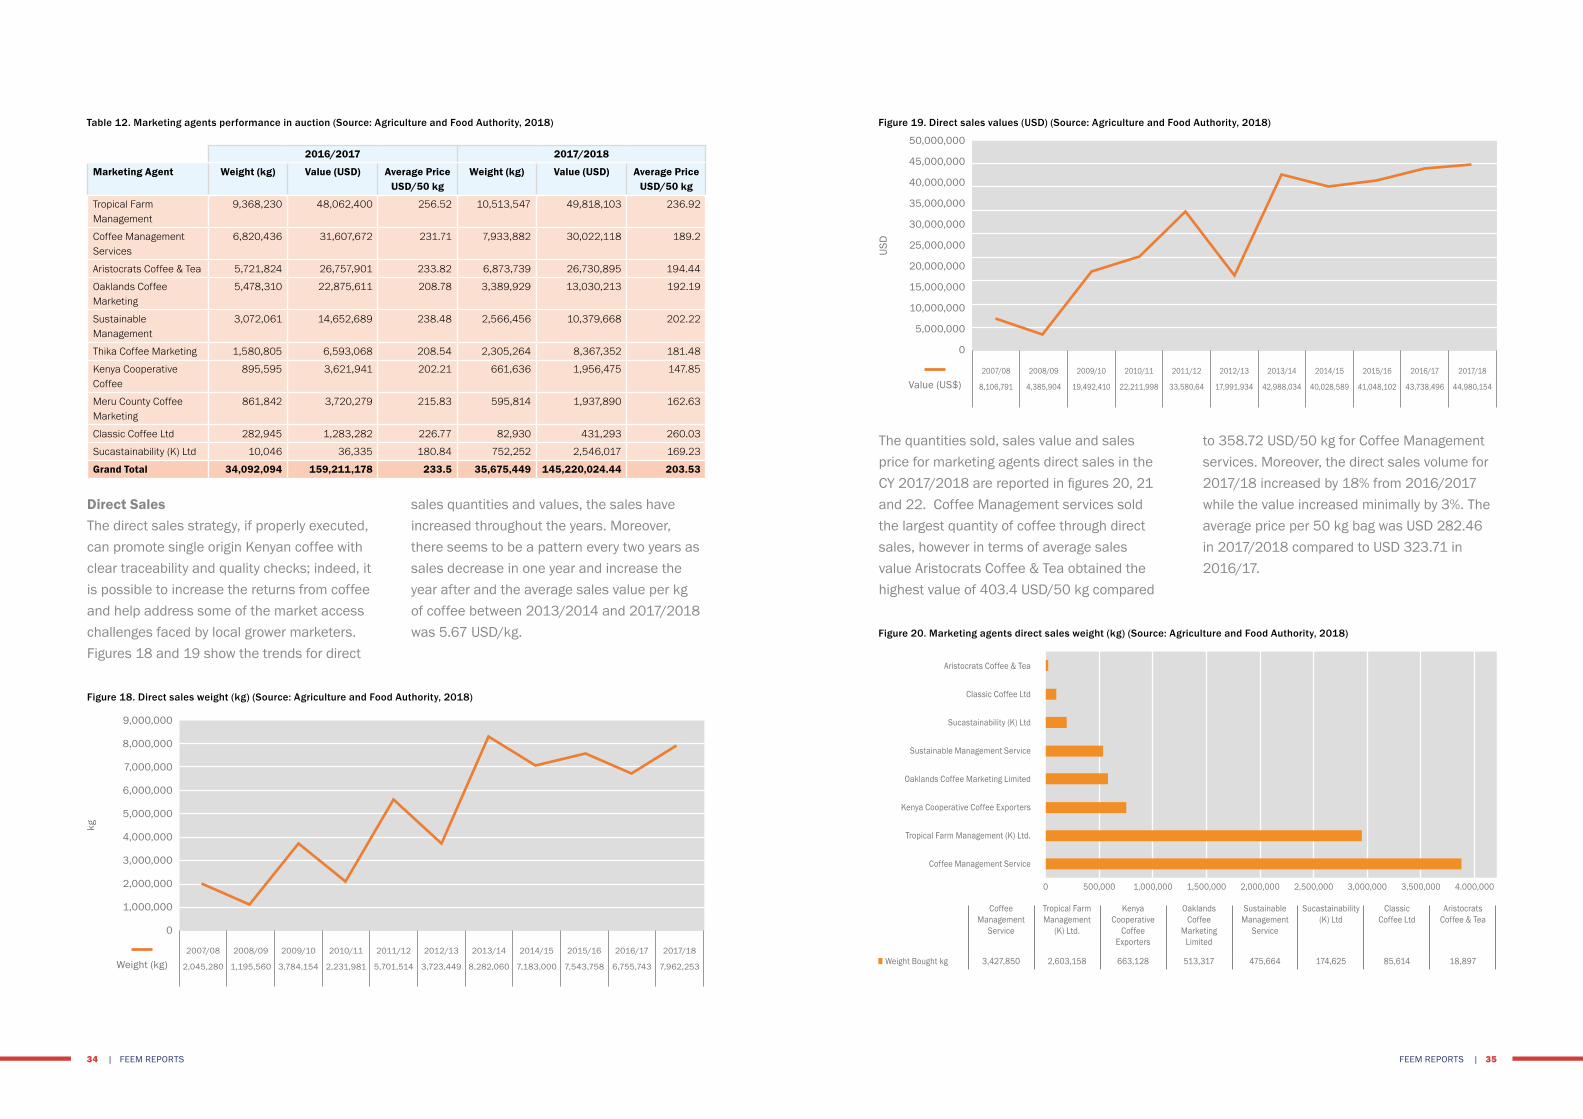
Direct SalesThe direct sales strategy, if properly executed, can promote single origin Kenyan coffee with clear traceability and quality checks; indeed, it is possible to increase the returns from coffee and help address some of the market access challenges faced by local grower marketers. Figures 18 and 19 show the trends for direct
sales quantities and values, the sales have increased throughout the years. Moreover, there seems to be a pattern every two years as sales decrease in one year and increase the year after and the average sales value per kg of coffee between 2013/2014 and 2017/2018 was 5.67 USD/kg.
The quantities sold, sales value and sales price for marketing agents direct sales in the CY 2017/2018 are reported in figures 20, 21 and 22. Coffee Management services sold the largest quantity of coffee through direct sales, however in terms of average sales value Aristocrats Coffee & Tea obtained the highest value of 403.4 USD/50 kg compared
to 358.72 USD/50 kg for Coffee Management services. Moreover, the direct sales volume for 2017/18 increased by 18% from 2016/2017 while the value increased minimally by 3%. The average price per 50 kg bag was USD 282.46 in 2017/2018 compared to USD 323.71 in 2016/17.
Table 12. Marketing agents performance in auction (Source: Agriculture and Food Authority, 2018)
2016/2017 2017/2018
Marketing Agent Weight (kg) Value (USD) Average Price USD/50 kg
Weight (kg) Value (USD) Average Price USD/50 kg
Tropical Farm Management
9,368,230 48,062,400 256.52 10,513,547 49,818,103 236.92
Coffee Management Services
6,820,436 31,607,672 231.71 7,933,882 30,022,118 189.2
Aristocrats Coffee & Tea 5,721,824 26,757,901 233.82 6,873,739 26,730,895 194.44
Oaklands Coffee Marketing
5,478,310 22,875,611 208.78 3,389,929 13,030,213 192.19
Sustainable Management
3,072,061 14,652,689 238.48 2,566,456 10,379,668 202.22
Thika Coffee Marketing 1,580,805 6,593,068 208.54 2,305,264 8,367,352 181.48
Kenya Cooperative Coffee
895,595 3,621,941 202.21 661,636 1,956,475 147.85
Meru County Coffee Marketing
861,842 3,720,279 215.83 595,814 1,937,890 162.63
Classic Coffee Ltd 282,945 1,283,282 226.77 82,930 431,293 260.03
Sucastainability (K) Ltd 10,046 36,335 180.84 752,252 2,546,017 169.23
Grand Total 34,092,094 159,211,178 233.5 35,675,449 145,220,024.44 203.53
Figure 18. Direct sales weight (kg) (Source: Agriculture and Food Authority, 2018)
Figure 19. Direct sales values (USD) (Source: Agriculture and Food Authority, 2018)
Figure 20. Marketing agents direct sales weight (kg) (Source: Agriculture and Food Authority, 2018)
9,000,000
8,000,000
7,000,000
6,000,000
5,000,000
4,000,000
3,000,000
2,000,000
1,000,000
0
Weight (kg)
kg
50,000,000
45,000,000
40,000,000
35,000,000
30,000,000
25,000,000
20,000,000
15,000,000
10,000,000
5,000,000
0
USD
Aristocrats Coffee & Tea
Classic Coffee Ltd
Sucastainability (K) Ltd
Sustainable Management Service
Oaklands Coffee Marketing Limited
Kenya Cooperative Coffee Exporters
Tropical Farm Management (K) Ltd.
Coffee Management Service
Coffee Management
Service
Tropical Farm Management
(K) Ltd.
Kenya Cooperative
Coffee Exporters
Oaklands Coffee
Marketing Limited
Sustainable Management
Service
Sucastainability(K) Ltd
Classic Coffee Ltd
Aristocrats Coffee & Tea
■ Weight Bought kg 3,427,850 2,603,158 663,128 513,317 475,664 174,625 85,614 18,897
0 500,000 3,500,0003,000,0002,500,0002,000,0001,500,0001,000,000 4.000,000
2007/08
2,045,280
2008/09
1,195,560
2009/10
3,784,154
2010/11
2,231,981
2011/12
5,701,514
2012/13
3,723,449
2013/14
8,282,060
2014/15
7,183,000
2015/16
7,543,758
2016/17
6,755,743
2017/18
7,962,253
Value (US$)2007/08
8,106,791
2008/09
4,385,904
2009/10
19,492,410
2010/11
22,211,998
2011/12
33,580,64
2012/13
17,991,934
2013/14
42,988,034
2014/15
40,028,589
2015/16
41,048,102
2016/17
43,738,496
2017/18
44,980,154
FEEM REPORTS | 3534 | FEEM REPORTS
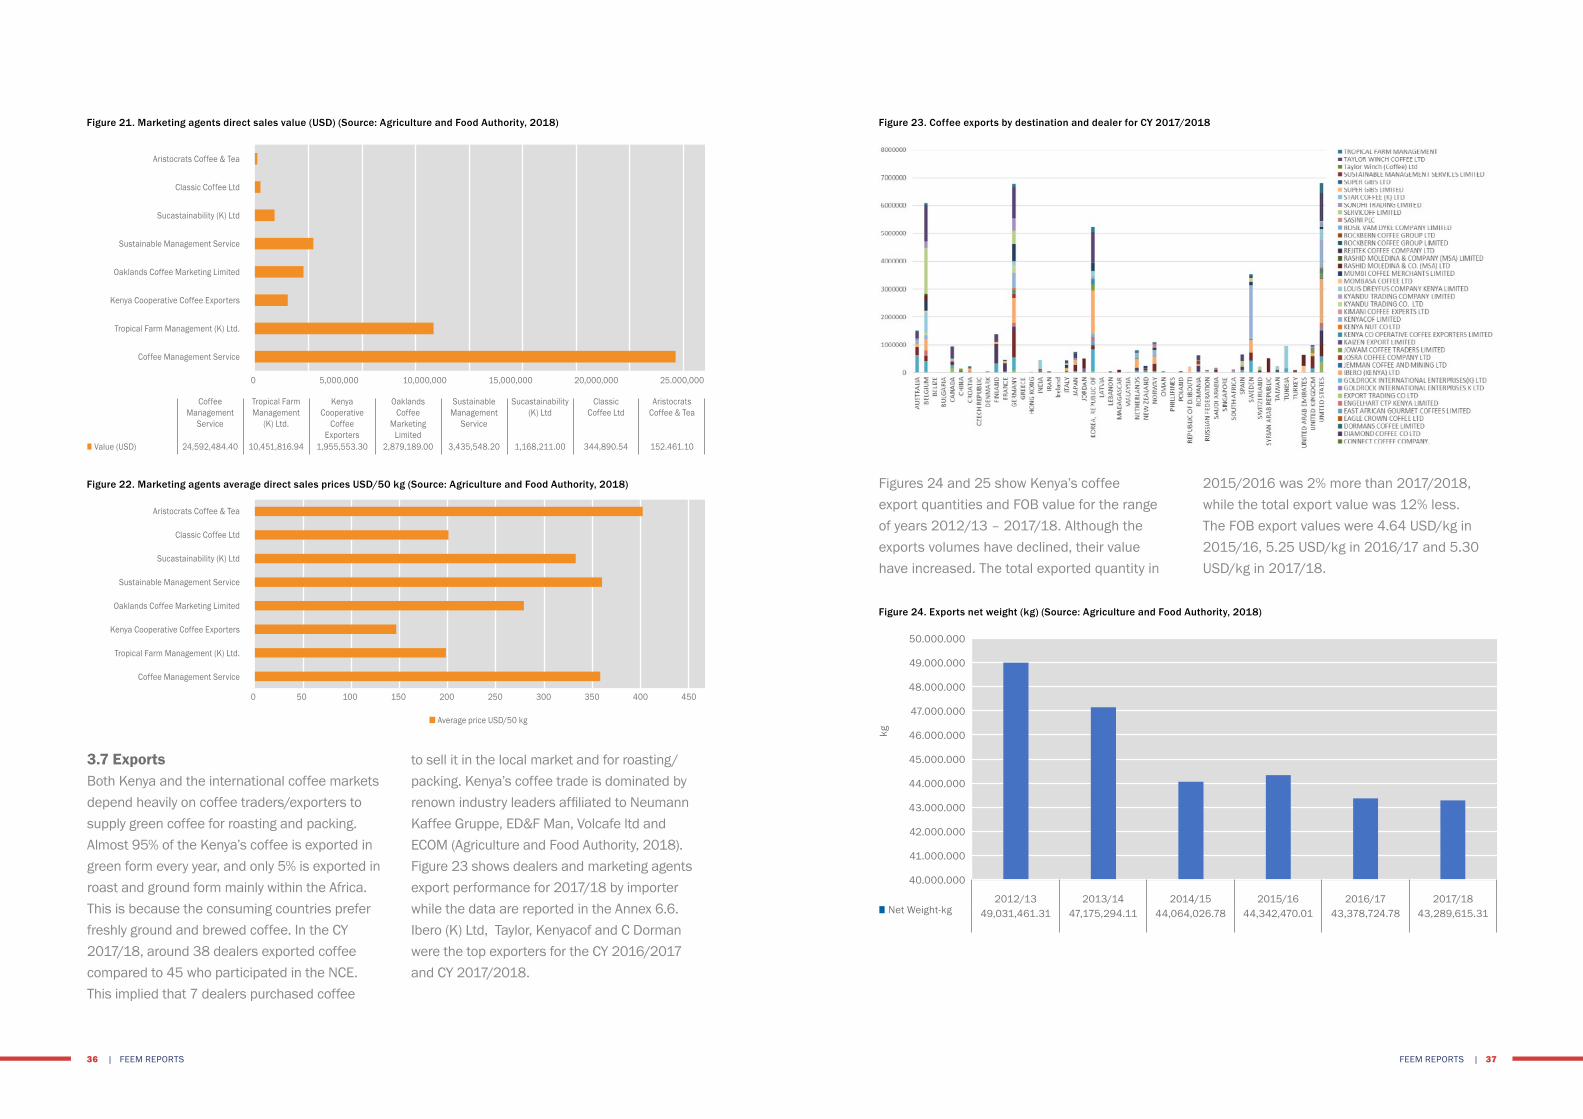
3.7 Exports Both Kenya and the international coffee markets depend heavily on coffee traders/exporters to supply green coffee for roasting and packing. Almost 95% of the Kenya’s coffee is exported in green form every year, and only 5% is exported in roast and ground form mainly within the Africa. This is because the consuming countries prefer freshly ground and brewed coffee. In the CY 2017/18, around 38 dealers exported coffee compared to 45 who participated in the NCE. This implied that 7 dealers purchased coffee
to sell it in the local market and for roasting/packing. Kenya’s coffee trade is dominated by renown industry leaders affiliated to Neumann Kaffee Gruppe, ED&F Man, Volcafe ltd and ECOM (Agriculture and Food Authority, 2018). Figure 23 shows dealers and marketing agents export performance for 2017/18 by importer while the data are reported in the Annex 6.6. Ibero (K) Ltd, Taylor, Kenyacof and C Dorman were the top exporters for the CY 2016/2017 and CY 2017/2018.
Figures 24 and 25 show Kenya’s coffee export quantities and FOB value for the range of years 2012/13 – 2017/18. Although the exports volumes have declined, their value have increased. The total exported quantity in
2015/2016 was 2% more than 2017/2018, while the total export value was 12% less. The FOB export values were 4.64 USD/kg in 2015/16, 5.25 USD/kg in 2016/17 and 5.30 USD/kg in 2017/18.
Figure 21. Marketing agents direct sales value (USD) (Source: Agriculture and Food Authority, 2018) Figure 23. Coffee exports by destination and dealer for CY 2017/2018
Figure 24. Exports net weight (kg) (Source: Agriculture and Food Authority, 2018)
Figure 22. Marketing agents average direct sales prices USD/50 kg (Source: Agriculture and Food Authority, 2018)
Aristocrats Coffee & Tea
Classic Coffee Ltd
Sucastainability (K) Ltd
Sustainable Management Service
Oaklands Coffee Marketing Limited
Kenya Cooperative Coffee Exporters
Tropical Farm Management (K) Ltd.
Coffee Management Service
Aristocrats Coffee & Tea
Classic Coffee Ltd
Sucastainability (K) Ltd
Sustainable Management Service
Oaklands Coffee Marketing Limited
Kenya Cooperative Coffee Exporters
Tropical Farm Management (K) Ltd.
Coffee Management Service
Coffee Management
Service
Tropical Farm Management
(K) Ltd.
Kenya Cooperative
Coffee Exporters
Oaklands Coffee
Marketing Limited
Sustainable Management
Service
Sucastainability(K) Ltd
Classic Coffee Ltd
Aristocrats Coffee & Tea
■ Value (USD) 24,592,484.40 10,451,816.94 1,955,553.30 2,879,189.00 3,435,548.20 1,168,211.00 344,890.54 152.461.10
0
0
5,000,000 20,000,00015,000,00010,000,000 25.000,000
45050 100 150 200 250
n Average price USD/50 kg
300 350 400
50.000.000
49.000.000
48.000.000
47.000.000
46.000.000
45.000.000
44.000.000
43.000.000
42.000.000
41.000.000
40.000.000
2012/13 2013/14 2014/15 2015/16 2016/17 2017/18■ Net Weight-kg 49,031,461.31 47,175,294.11 44,064,026.78 44,342,470.01 43,378,724.78 43,289,615.31
kg
FEEM REPORTS | 3736 | FEEM REPORTS

The US, Germany and Belgium were the three top export destinations for 2016/2017 and 2017/2018. The number of export destinations
increased to 47 in 2017/2018 from 44 in 2016/2017, with quantities and values of exports by destination are shown in Annex 6.7.
Kenya export market is segmented into traditional, specialty and emerging markets. Around 60% of the coffee is exported to the traditional market which is made up mainly of countries in the European Union. An amount of 20% is exported to the speciality market that is led by the USA and includes Japan, Canada and some countries from the European Union. The emerging market imports 15% of
Kenya’s coffee and includes the Gulf region, China, Korea, Malaysia among others and have developed affinity for Kenyan grades T, C, MH, ML, and UGs.
3.8 Domestic marketsIn the CY 2017/2018 the local coffee consumption increased by 49% from 2016/2017 to reach 1,576.7 MT.
According to the International Coffee Organization report published in 2019, there were 25 roasters in 2019, of which 4 are grower marketers and 1 university. The growers and private roasters are licensed to roast, pack and market Kenyan coffee locally and internationally. Coffee is purchased through auction and after roasting is retailed in major urban centres and coffee shops. The number of coffee shops in Kenya increased from 14 in 2001 to 206 in 2015 and 278 in 2017. The domestic market consumes both locally produced and imported coffee products. The locally produced coffee brands include Java, Dormans and Gibsons
coffee and are sold in retail outlets in Uganda, Tanzania and Rwanda. Furthermore, the domestic market is highly diversified from mainstream coffee blends to informal coffee hawkers, a number of independent coffee shops exist alongside big chains such as Java coffee shop, Savannah, Café Deli & Delicatissen, Artcaffe and Bakery ltd, and Avanti Group of restaurants among others.
3.9 Development plansCoffee Revitalization Project - On the 20/04/2020 the Kenyan government launched the coffee revitalization project that aims to
Figure 25. Exports FOB Value (USD) (Source: Agriculture and Food Authority, 2018)
Figure 26. Export volumes by destination (Data Source: Agriculture and Food Authority, 2018)
Figure 27. Domestic coffee consumption (Source: Agriculture and Food Authority, 2018)
235,000,000
230,000,000
225,000,000
220,000,000
215,000,000
210,000,000
205,000,000
200,000,000
195,000,000
190,000,000
2012/13 2013/14 2014/15 2015/16 2016/17 2017/18■ FOB value (USD) 217,018,127.61 228,426,961.63 223,385,715.01 205,674,854.90 227,827,991.12 229,514,404.53
16% 14% 12% 8% 4% 3% 2% 1% 0%
USD
1,800
1,600
1,400
1,200
1,000
800
600
400
200
0
2009/10 2010/11 2011/12 2012/13 2013/14 2014/15 2015/16 2016/17 2017/18509,9 566,6 629,5 716,0 744,0 756,0 771,0 1051,2 1576,70
n Weight (MT)
MT
FEEM REPORTS | 3938 | FEEM REPORTS

increase coffee production. It is a partnership between the Ministry of Agriculture and World Bank with a loan of KShs 1.5 billion in phase one of the two years. The Agriculture livestock, Fisheries and Cooperative Cabinet Secretary, Peter Munya stated during the launch that the programme will also improve the efficiency of farmers co-operatives, support research development and technology and development of alternative coffee markets. The first phase of the project is a pilot and will include the 8 main coffee producing counties (Kiambu, Machakos, Muranga, Nyeri, Embu, Tharaka Nithi, Kirinyanga and Meru). These counties account for approximately 70% of the national production and they have a potential for quick wins through productivity. Moreover, the counties agreed to invest in the project with the smallest producers of Tharaka Nithi and Machakos investing with KShs 50 million, while the big producers will invest KShs 100 million. 20% of the fund will be directed towards the provision of subsidized fertilizers, propagation of seeds and distribution of planting materials. Moreover, 60% of the fund will be used to improve the efficiency of the primary processing infrastructure and the quality of coffee by automating co-operatives systems and modernizing equipment. Furthermore, KShs 150 million will be used to strengthen co-operatives institution and governance and another KShs 150 million will support integration of data base, backstopping and monitoring (Ndirangu, 2020).
3.10 ServicesCoffee Research Institute (CRI) – CRI falls under the Kenya Agriculture Research and Livestock Organization (KARLO) and is responsible for carrying out coffee related research. It provides recommendations regarding good agricultural and manufacturing
practices. The institute conducted a major research to ensure sustainability of production through an efficient value chain and climate mitigation measures. In addition, it develops technologies coffee varieties and carries out research on disease and pest management. Moreover, CRI developed two improved varieties of coffee namely Ruiru11 and Batian, which are resistant to Coffee Berry Disease and Leaf Rust Disease, thus lowering the cost incurred in the control by fungicides.
Coffee extension services – Following the promulgation of the Kenya Constitution 2010 provision of extension services, these services were devolved to the county governments. They promote the coffee sector by providing subsidized inputs, such as fertilizers, and coffee seedlings. Moreover, the Coffee Directorate in collaboration with other relevant stakeholders provide capacity building to the counties’ agricultural staff and other coffee value chain players. The collaborating private agencies include Technoserve, Solidaridad, certification bodies (UTZ, 4C, Fairtrade) and management services providers.
Kenya’s coffee sector is funded by the national and counties government, banks, SACCOs and development partners.
Commodities Fund (ComFund) – ComFund was established under Crops Act 2013 (amended May 2016), Article 9 (1). The Fund is the successor of Coffee Development Fund and Sugar Development Fund which was part of Kenya Sugar Board. Around 100,000 farmers have received loans since this credit facility was established. Table 13 shows the types of loans that are provided by the commodities fund for various actors in the coffee supply chain.
Table 13. Commodities fund loans for the coffee industry (Source: Commodities Fund, 2019)
TERM TYPE OF LOAN PURPOSE PAYMENT DURATION
Interest rate
Short term Loans
Coffee Advances (ADV)
To finance primary production/ processing of crops. 12 months 10%, reducing balance
Coffee Processing loans (CPL)
Cooperatives and estates who want to install or replace obsolete processing units
8 months 10%, reducing balance
Cherry Advance (CHADV)
Picking of cherry (Labour), Processing of cherry, Transport of cherry
8 months 5%, reducing balance
Medium terms Loans
Extended Advance (EXADV)
For producers in need of rehabilitating their crop by purchase of farm inputs, financing Farm operations such as labour and transport
Up to 18 months
10%, reducing balance
Bulk Acquisition of Farm Inputs (BAFI)
Target: Cooperative societies; to improve quality and quantity of coffee produced through organized and purchase of inputs in bulk.
Up to 18 months
5%, reducing balance
Value addition Loan (VA)
Agro–Processing Loan facility for borrowers who are engaged in processing or value addition to agricultural products through processing before selling
Up to 24 Months
10%, reducing balance
Wholesale Lending (WSL)
Targeted at farmer based Saccos, unions, marketing and milling agents and financial institutions involved in agricultural financing, as a means to increase Commodities Fund’s outreach by leveraging on the above institutions’ local presence
18 months 2.5%, Flat rate
Long terms Loans
Coffee Establishment Loan (CEL)
For producers who want to establish new crops or change season, as well as increase acreage
Up to 60 months
10%, reducing balance
Coffee Machinery and Equipment Loan (CMEL)
To facilitate borrowers acquire machinery and equipment. Up to 60 months
10%, reducing balance
Infrastructure Loans This loan facility is meant to assist producers undertake critical construction works.
Up to 60 months
10%, reducing balance
Water Development/Irrigation Loans
This loan facility is aimed at assisting borrowers’ access water on the farm/premises and also installation of irrigation system.
Up to 60 months
10% reducing balance
FEEM REPORTS | 4140 | FEEM REPORTS

Figure 28 shows the strengths, weaknesses, opportunities and threats identified in the
Kenyan coffee industry and are discussed in detail in the following sub-sections.
4.1 Weaknesses identified and how to improve the sectorHigh risk for farmersKenya’s policies and legal frameworks leaves farmers at high risks even when they are incapable of bearing them. Farmers without a marketing license must contract and authorize marketing agents to sell their coffee through the NCE and they only get paid after exporters purchase the coffee which may take up to 5-6 months. This is because Kenya’s coffee sector rules state that a batch of coffee belongs to the farmer up to the point of sale. Thus, the farmers are obliged to the risks at all stages of marketing including quality deterioration, theft and exchange rate volatility. In addition, their earning is cut by intermediaries - marketers and millers to sell their product
through the NCE. One way to overcome this is for farmers to exploit the presence of direct sales, which creates an opportunity for them to increase their earning by cutting out the intermediaries and allocating the extra earnings as contingencies to overcome risks. This is because direct sales promote single origin coffee with clear traceability and quality checks. Moreover, nowadays multinational coffee chains as Starbucks do not only require quality coffee but also coffee that is grown in an ethical and sustainable manner. This is due to mounting pressure from consumers and governments to have ethically sourced goods and services.
Organisations may suffer reputational damage if they are found to be sourcing from suppliers that use exploitative labour. In additions they
may face legal sanctions if their suppliers are found to be involved in corruption or bribery (CIPS, 2013). Moreover, traceability systems are an integral part of food safety management in many countries, including the European Union and a legal requirement for food business operations. It is also an important compliance criteria in many standards adopted at all stages of the food supply chain, including international standards such as ISO 22000 and private voluntary standards such as Global Good Agricultural Practice on farm and standards for food producers (traders, processors, etc.) such as the British Retail Consortium Global Standard Food and International Food Standard (United Nations Industrial Development Organisation, 2013).
Low domestic value additionOnly 5% of Kenya’s exported coffee is roasted and the remainder is exported as clean coffee, thus Kenya misses out on the added value from the sales of roasted and packaged coffee. Moreover, the transport, transaction costs and conversion of coffee beans into the final product by exporters mostly in Europe and America increase the cost of the coffee for the final consumer. In 2019, coffee imports in Africa were 1.1% of the world imports, with a value of 634.2 USD million. The values of some importers are shown in table 14.
Table 14. Import values in Africa (Workman, 2020)
Importer Coffee Imports (USD)
Morocco 102,572,000
South Africa 79,596,000
Libya 32,804,000
Egypt 28,370,000
Tunisia 20,062,000
Algeria 13,613,000
Mauritius 4,328,000
Madagascar 2,062,000
This issue creates an opportunity for Kenya to extend its value addition down the value chain by investing in roasteries, to increase its involvement in the sale of roasted and packaged coffee to African countries, especially considering that Kenyan coffee is considered as a specialty and is known to be one of the best coffees in the world, characterised by its rich flavour along with a deep, wine-like acidity and pleasant aroma. In fact, Kenya’s AA coffee is regarded as a premium coffee in the world. The Kenyan coffee is broadly used for blending coffees and regarded as the most balanced and the most complex of coffee origins. In addition, Kenya is the main coffee logistic hub in Eastern Africa, where all the main international coffee traders are represented. Furthermore, Kenya has a huge pool of coffee expertise from farming to marketing, logistics, and trading. In 2017, three Kenyan factories were ranked among the world’s best speciality coffee producers, with Kabare AA, produced by the Kabare farmers’ cooperative society ranked as the fourth on Coffee Review’s list of Top 30 with a score of 97 points out of 100 (NGUNJIRI, 2018)
Ageing farmers and old technologies – A large age gap exists in the coffee production, since most of the coffee farmers are elders, with more than 50% of the farmers above the age of 60. Thus without millennial aged farmers, the future of Kenya’s production may be further compromised (Ngibuini, 2019). Thus, there is need to promote youth into the coffee farming by encouraging innovation and modifying society regulations to allow landless youth to lease coffee trees instead of having to own a land to be admitted into the society. Furthermore, coffee farmers are reluctant to adopt new technologies resulting in a reduction
04SWOT Analysis
Stregths• Increasing domestic consumption• Recognized quality• Global market• Two options for sale (Direct sale or NCE)
Opportunities• Governent recognition• Rising domestic consumption• Exporting roasted coffee• Generating revenue from coffee pulp
Weakness• Ageing farmers and old technologies• High risk for farmers• Low domestic value addition• Low yields
Trheats• Environmental challenges• Coffee sector is losing competitiveness• Drop in international prices• Pest and disease
S
O
W
T
Figure 28. Coffee SWOT analysis
FEEM REPORTS | 4342 | FEEM REPORTS
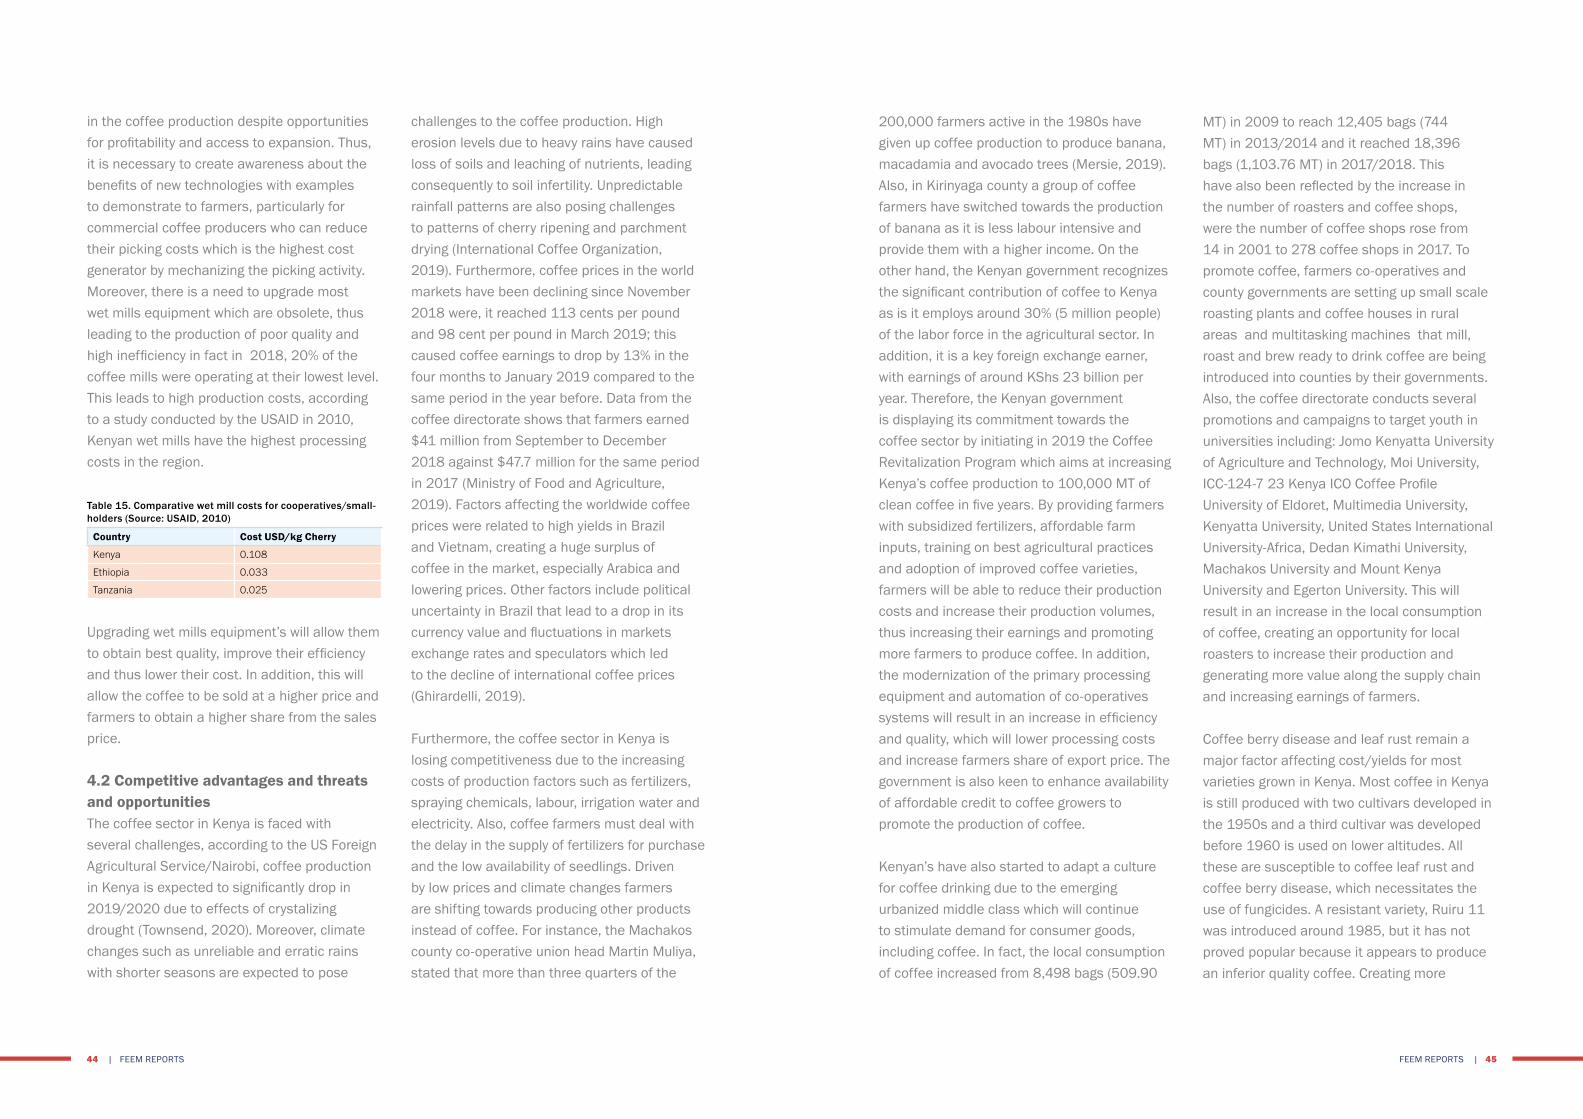
in the coffee production despite opportunities for profitability and access to expansion. Thus, it is necessary to create awareness about the benefits of new technologies with examples to demonstrate to farmers, particularly for commercial coffee producers who can reduce their picking costs which is the highest cost generator by mechanizing the picking activity. Moreover, there is a need to upgrade most wet mills equipment which are obsolete, thus leading to the production of poor quality and high inefficiency in fact in 2018, 20% of the coffee mills were operating at their lowest level. This leads to high production costs, according to a study conducted by the USAID in 2010, Kenyan wet mills have the highest processing costs in the region.
Table 15. Comparative wet mill costs for cooperatives/small-holders (Source: USAID, 2010)
Country Cost USD/kg Cherry
Kenya 0.108
Ethiopia 0.033
Tanzania 0.025
Upgrading wet mills equipment’s will allow them to obtain best quality, improve their efficiency and thus lower their cost. In addition, this will allow the coffee to be sold at a higher price and farmers to obtain a higher share from the sales price.
4.2 Competitive advantages and threats and opportunitiesThe coffee sector in Kenya is faced with several challenges, according to the US Foreign Agricultural Service/Nairobi, coffee production in Kenya is expected to significantly drop in 2019/2020 due to effects of crystalizing drought (Townsend, 2020). Moreover, climate changes such as unreliable and erratic rains with shorter seasons are expected to pose
challenges to the coffee production. High erosion levels due to heavy rains have caused loss of soils and leaching of nutrients, leading consequently to soil infertility. Unpredictable rainfall patterns are also posing challenges to patterns of cherry ripening and parchment drying (International Coffee Organization, 2019). Furthermore, coffee prices in the world markets have been declining since November 2018 were, it reached 113 cents per pound and 98 cent per pound in March 2019; this caused coffee earnings to drop by 13% in the four months to January 2019 compared to the same period in the year before. Data from the coffee directorate shows that farmers earned $41 million from September to December 2018 against $47.7 million for the same period in 2017 (Ministry of Food and Agriculture, 2019). Factors affecting the worldwide coffee prices were related to high yields in Brazil and Vietnam, creating a huge surplus of coffee in the market, especially Arabica and lowering prices. Other factors include political uncertainty in Brazil that lead to a drop in its currency value and fluctuations in markets exchange rates and speculators which led to the decline of international coffee prices (Ghirardelli, 2019).
Furthermore, the coffee sector in Kenya is losing competitiveness due to the increasing costs of production factors such as fertilizers, spraying chemicals, labour, irrigation water and electricity. Also, coffee farmers must deal with the delay in the supply of fertilizers for purchase and the low availability of seedlings. Driven by low prices and climate changes farmers are shifting towards producing other products instead of coffee. For instance, the Machakos county co-operative union head Martin Muliya, stated that more than three quarters of the
200,000 farmers active in the 1980s have given up coffee production to produce banana, macadamia and avocado trees (Mersie, 2019). Also, in Kirinyaga county a group of coffee farmers have switched towards the production of banana as it is less labour intensive and provide them with a higher income. On the other hand, the Kenyan government recognizes the significant contribution of coffee to Kenya as is it employs around 30% (5 million people) of the labor force in the agricultural sector. In addition, it is a key foreign exchange earner, with earnings of around KShs 23 billion per year. Therefore, the Kenyan government is displaying its commitment towards the coffee sector by initiating in 2019 the Coffee Revitalization Program which aims at increasing Kenya’s coffee production to 100,000 MT of clean coffee in five years. By providing farmers with subsidized fertilizers, affordable farm inputs, training on best agricultural practices and adoption of improved coffee varieties, farmers will be able to reduce their production costs and increase their production volumes, thus increasing their earnings and promoting more farmers to produce coffee. In addition, the modernization of the primary processing equipment and automation of co-operatives systems will result in an increase in efficiency and quality, which will lower processing costs and increase farmers share of export price. The government is also keen to enhance availability of affordable credit to coffee growers to promote the production of coffee.
Kenyan’s have also started to adapt a culture for coffee drinking due to the emerging urbanized middle class which will continue to stimulate demand for consumer goods, including coffee. In fact, the local consumption of coffee increased from 8,498 bags (509.90
MT) in 2009 to reach 12,405 bags (744 MT) in 2013/2014 and it reached 18,396 bags (1,103.76 MT) in 2017/2018. This have also been reflected by the increase in the number of roasters and coffee shops, were the number of coffee shops rose from 14 in 2001 to 278 coffee shops in 2017. To promote coffee, farmers co-operatives and county governments are setting up small scale roasting plants and coffee houses in rural areas and multitasking machines that mill, roast and brew ready to drink coffee are being introduced into counties by their governments. Also, the coffee directorate conducts several promotions and campaigns to target youth in universities including: Jomo Kenyatta University of Agriculture and Technology, Moi University, ICC-124-7 23 Kenya ICO Coffee Profile University of Eldoret, Multimedia University, Kenyatta University, United States International University-Africa, Dedan Kimathi University, Machakos University and Mount Kenya University and Egerton University. This will result in an increase in the local consumption of coffee, creating an opportunity for local roasters to increase their production and generating more value along the supply chain and increasing earnings of farmers.
Coffee berry disease and leaf rust remain a major factor affecting cost/yields for most varieties grown in Kenya. Most coffee in Kenya is still produced with two cultivars developed in the 1950s and a third cultivar was developed before 1960 is used on lower altitudes. All these are susceptible to coffee leaf rust and coffee berry disease, which necessitates the use of fungicides. A resistant variety, Ruiru 11 was introduced around 1985, but it has not proved popular because it appears to produce an inferior quality coffee. Creating more
FEEM REPORTS | 4544 | FEEM REPORTS

awareness regarding the benefits of Batian compared to other varieties, can promote farmers to switch towards using it as it allows them to obtain high yields, reduce their costs and thus increase earnings. This is because Batian is resistant to coffee berry disease and leaf rust, in addition it comes into production a year earlier than traditional varieties and its berries ripen earlier than SL28 and Ruiru 11, resulting in early flow of benefits to farmers. Moreover, it provides high yield with a good bean and quality and is suitable for all coffee agro-ecological zones.
Wet milling results in the release of 200,000 tons of pulp into the environment every day in Kenya, which translates into missed opportunities towards environmental and economic benefits for farmers and wet mills (Gituma & Fuchaka, 2017). Coffee cherry waste that ends up in fields and waterways decomposes, releasing harmful mycotoxins that seep into the soil. Coffee pulp can be used instead for several purposes, it can be dried and recycled as mulch for sale as it serves as a very good all-purpose manure or used
to replace fertilizers to reduce farmers costs. Also, coffee biomass can be utilized to produce bioethanol which is a biofuel that can be used as an energy source. Furthermore, coffee pulp can be used to produce coffee flour which is a gluten free alternative for grain based flour that is nutritious (see figure 28), with a tiny bit of caffeine and no taste of coffee but instead it has the floral citrus and roasted fruit notes in its flavour. Coffee flour is currently being manufactured by a company called The Coffee Cherry Co. which is operating in Hawaii, Nicaragua, Guatemala, Mexico and Vietnam. The coffee flour contains more per gram iron than spinach, fibre than whole grain wheat flour, and less fat than coconut flour, more protein than fresh kale, potassium than banana and antioxidants than pomegranate (Markham, 2016). The coffee flour is being sold now online on websites including Amazon at a price of $9.95 for 226 grams. Production of coffee flour from pulp will generate additional revenue for farmers and wet mills and will support in the generation of new jobs and reduction of greenhouse gas emission.
Coffee is considered as a strategic crop in Kenya, contributing to the employment of around 5 million people and is one of Kenya’s main exports since its introduction in 1897. Accounting to 5.5% of Kenya’s exports in 2017 and 0.4% of the world coffee production in 2019. In addition, the coffee industry contributes to growth in agriculture through foreign exchange earnings of around KShs 23 billion per year, family farm incomes and food security. Although the total area harvested decreased by 32% from 170,000 ha in 2004/2005 to reach 115,570 ha in 2017/2018, production volumes remained within 40,000 MT and 50,000 MT during these periods. In the CY 2017/2018 the four counties of Kiambu, Kirinyaga, Murang’a and Nyeri contributed to 58% of Kenya’s total coffee production. Moreover, 90% of the Kenyan coffee is wet processed at washing stations that are owned by co-operative societies and estate farmers, while the remaining 10% of coffee is dry processed into mbuni.
The coffee sector is faced with several obstacles including climate changes that poses challenges to the patterns of cherry ripening and parchment drying, declining world prices that reduces earning and high costs of inputs. That are causing the coffee sector to lose competitiveness and some farmers to switch to the production of other crops. Moreover, Kenya had a primary processing capacity around 8,553,600 tons/year in 2017/2018, which is much higher than Kenya’s total production volumes, with a level
of utilization of less than 1%, causing wet mills to acquire high costs due to inefficiency. Secondary processing facilities face the same issue of overcapacity which caused mills to remain inactive for years. Moreover, Kenyan coffee is regarded as one of the best coffees in the world and exported to 47 countries, with grade AA considered as a premium causing export values to increase in the past years despite the decline in exports volumes. The Coffee Revitalization program is expected to increase coffee production to 100,000 MT in 2024 through fertilizers subsidies, training, and adoption of best practices. In addition, it will involve modernization of the primary processing equipment allowing higher quality and efficiency to be obtained, lower cost and to obtain a higher export price for coffee. Furthermore, several opportunities exit that can be exploited by Kenya’s coffee industry including roasting of coffee for export to African countries whose imports value was 634.2 million USD in 2017. The value addition from roasting will result in the creation of new jobs and higher earnings for coffee farmers. Also, the utilization of coffee waste to produce various products including manure, biofuels and coffee flour resulting in both economic, social and environmental benefits. The growing local market for coffee in Kenya also, creates an opportunity for local roasters to increase their production, generating more value along the supply chain and increasing earnings of farmers. As a result, more farmers can be attracted in the production of coffee.
Figure 29. Nutritional information for coffee flour (The Coffee Cherry Co., 2020)
05Conclusion
Nutritional information per 100g of ingredient (Tipical averaged value, does not equal 100%
Calories 144.9 kcal Vitamins & Minerals Moisture 12% Max
Total Fat 2.3 g Vitamin A 505.3 I.U. Caffeine 530 mg
Saturated Fats 0.5 g Vitamin C < 0.1 g Antioxidants 22 nmol
Unsaturated Fats 0 g Calcium 425 mg
Cholesterol < 5 mg Sodium 15.7 mg
Protein 11.4 g Magnesium 333 mg
Total Carbohydrates 66.3 g Phosphorus 391 mg
Sugars 2.9 g Potassium 11,808 mg
Added Sugars None Copper 4.1 mg
Total Dietary Fiber 51 g Sulfur 527 mg
Soluble Fiber 8.4 g Zinc 4.5 mg
Insoluble Dietary Fiber 42.5 g Iron 49.6 mg
Manganese 8.5 mg
FEEM REPORTS | 4746 | FEEM REPORTS
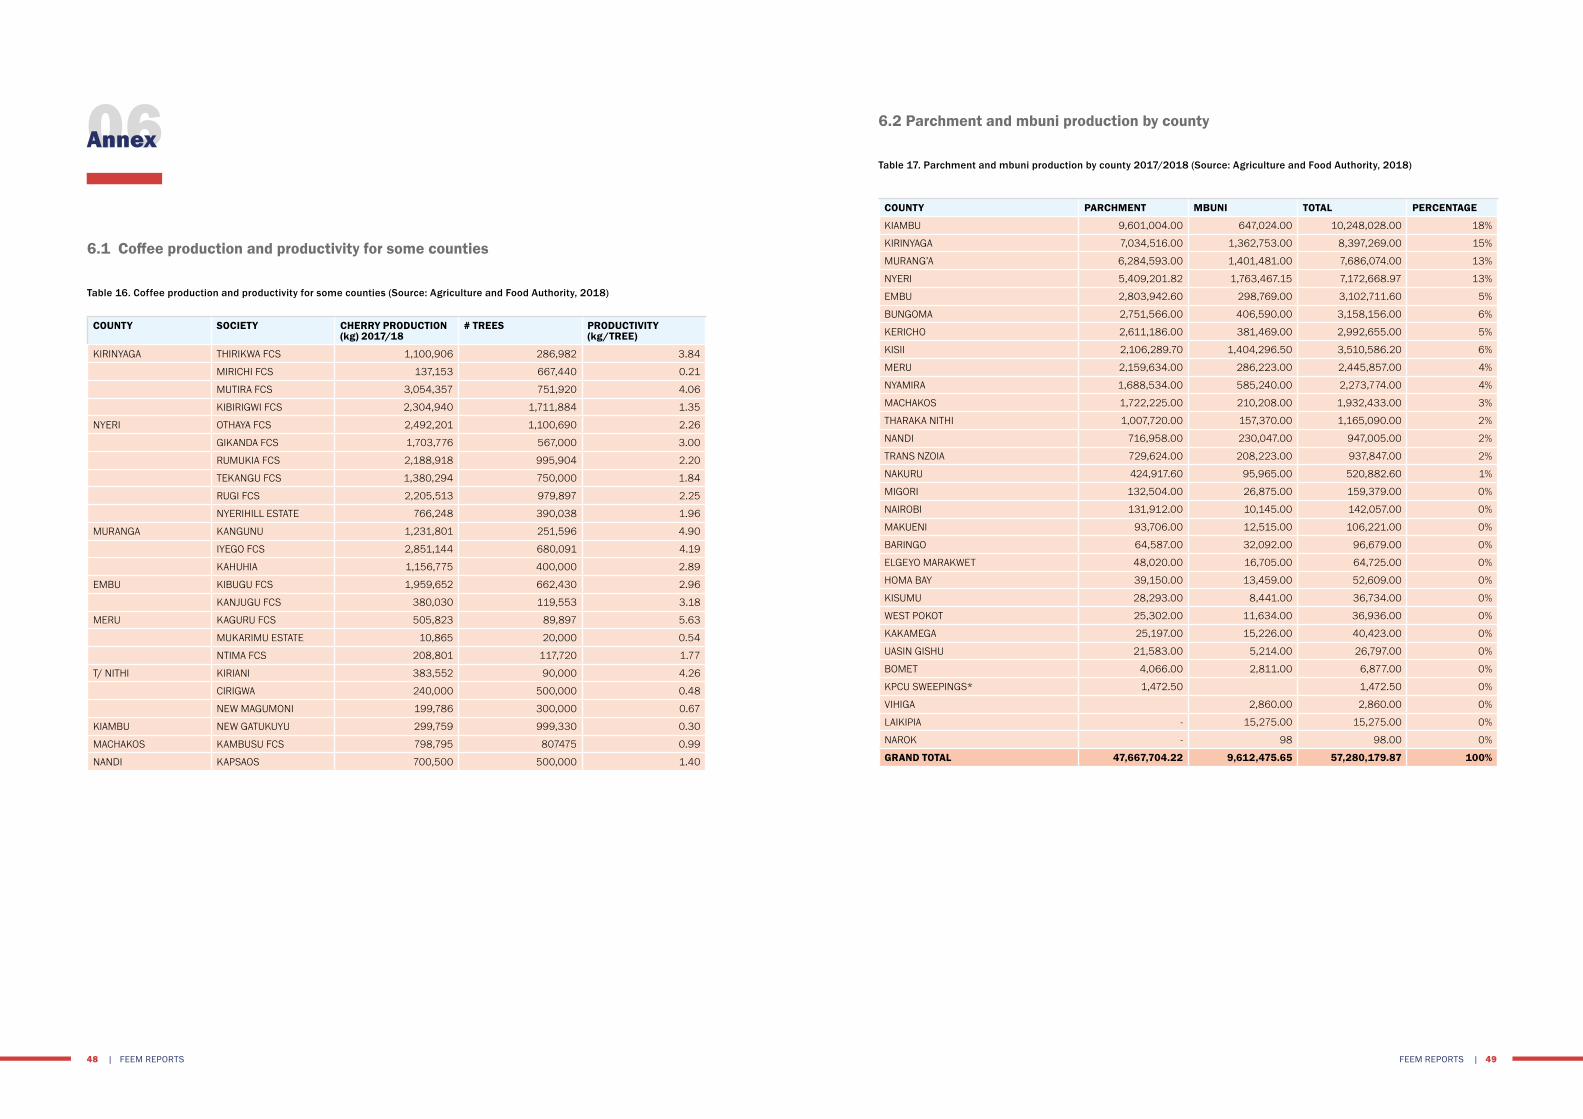
6.1 Coffee production and productivity for some counties
6.2 Parchment and mbuni production by county
Table 16. Coffee production and productivity for some counties (Source: Agriculture and Food Authority, 2018)
Table 17. Parchment and mbuni production by county 2017/2018 (Source: Agriculture and Food Authority, 2018)
06Annex
COUNTY SOCIETY CHERRY PRODUCTION (kg) 2017/18
# TREES PRODUCTIVITY(kg/TREE)
KIRINYAGA THIRIKWA FCS 1,100,906 286,982 3.84
MIRICHI FCS 137,153 667,440 0.21
MUTIRA FCS 3,054,357 751,920 4.06
KIBIRIGWI FCS 2,304,940 1,711,884 1.35
NYERI OTHAYA FCS 2,492,201 1,100,690 2.26
GIKANDA FCS 1,703,776 567,000 3.00
RUMUKIA FCS 2,188,918 995,904 2.20
TEKANGU FCS 1,380,294 750,000 1.84
RUGI FCS 2,205,513 979,897 2.25
NYERIHILL ESTATE 766,248 390,038 1.96
MURANGA KANGUNU 1,231,801 251,596 4.90
IYEGO FCS 2,851,144 680,091 4.19
KAHUHIA 1,156,775 400,000 2.89
EMBU KIBUGU FCS 1,959,652 662,430 2.96
KANJUGU FCS 380,030 119,553 3.18
MERU KAGURU FCS 505,823 89,897 5.63
MUKARIMU ESTATE 10,865 20,000 0.54
NTIMA FCS 208,801 117,720 1.77
T/ NITHI KIRIANI 383,552 90,000 4.26
CIRIGWA 240,000 500,000 0.48
NEW MAGUMONI 199,786 300,000 0.67
KIAMBU NEW GATUKUYU 299,759 999,330 0.30
MACHAKOS KAMBUSU FCS 798,795 807475 0.99
NANDI KAPSAOS 700,500 500,000 1.40
COUNTY PARCHMENT MBUNI TOTAL PERCENTAGE
KIAMBU 9,601,004.00 647,024.00 10,248,028.00 18%
KIRINYAGA 7,034,516.00 1,362,753.00 8,397,269.00 15%
MURANG’A 6,284,593.00 1,401,481.00 7,686,074.00 13%
NYERI 5,409,201.82 1,763,467.15 7,172,668.97 13%
EMBU 2,803,942.60 298,769.00 3,102,711.60 5%
BUNGOMA 2,751,566.00 406,590.00 3,158,156.00 6%
KERICHO 2,611,186.00 381,469.00 2,992,655.00 5%
KISII 2,106,289.70 1,404,296.50 3,510,586.20 6%
MERU 2,159,634.00 286,223.00 2,445,857.00 4%
NYAMIRA 1,688,534.00 585,240.00 2,273,774.00 4%
MACHAKOS 1,722,225.00 210,208.00 1,932,433.00 3%
THARAKA NITHI 1,007,720.00 157,370.00 1,165,090.00 2%
NANDI 716,958.00 230,047.00 947,005.00 2%
TRANS NZOIA 729,624.00 208,223.00 937,847.00 2%
NAKURU 424,917.60 95,965.00 520,882.60 1%
MIGORI 132,504.00 26,875.00 159,379.00 0%
NAIROBI 131,912.00 10,145.00 142,057.00 0%
MAKUENI 93,706.00 12,515.00 106,221.00 0%
BARINGO 64,587.00 32,092.00 96,679.00 0%
ELGEYO MARAKWET 48,020.00 16,705.00 64,725.00 0%
HOMA BAY 39,150.00 13,459.00 52,609.00 0%
KISUMU 28,293.00 8,441.00 36,734.00 0%
WEST POKOT 25,302.00 11,634.00 36,936.00 0%
KAKAMEGA 25,197.00 15,226.00 40,423.00 0%
UASIN GISHU 21,583.00 5,214.00 26,797.00 0%
BOMET 4,066.00 2,811.00 6,877.00 0%
KPCU SWEEPINGS* 1,472.50 1,472.50 0%
VIHIGA 2,860.00 2,860.00 0%
LAIKIPIA - 15,275.00 15,275.00 0%
NAROK - 98 98.00 0%
GRAND TOTAL 47,667,704.22 9,612,475.65 57,280,179.87 100%
FEEM REPORTS | 4948 | FEEM REPORTS
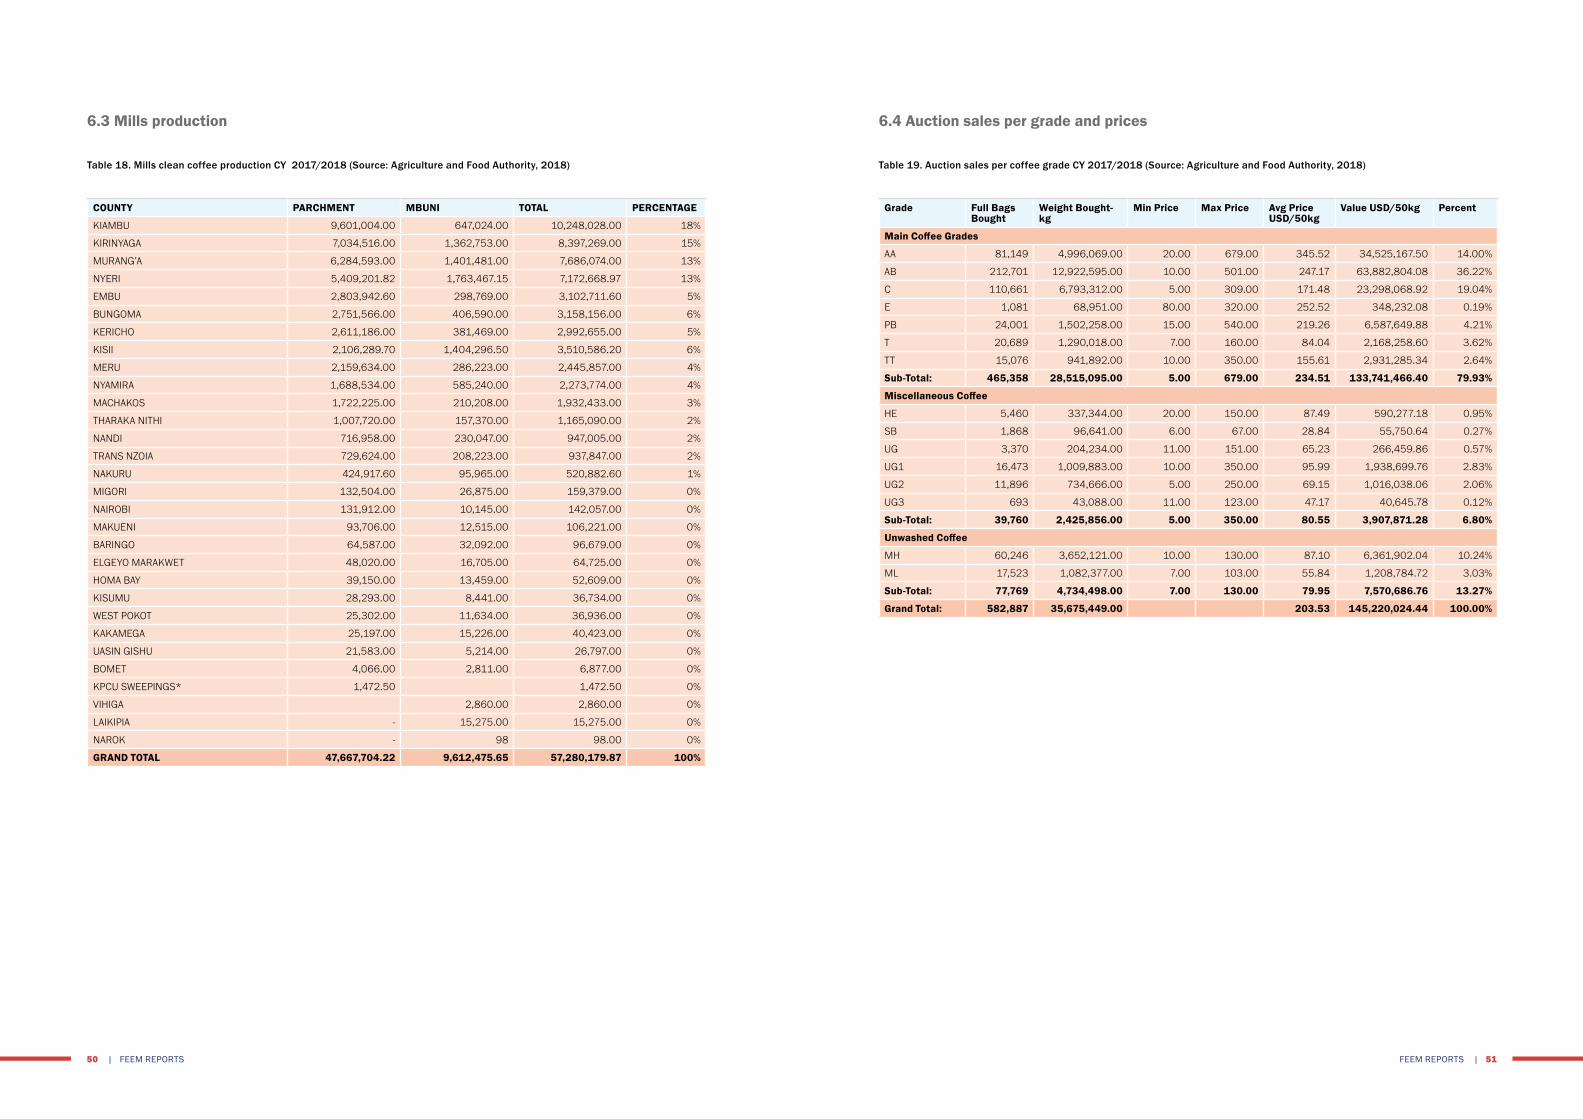
6.3 Mills production 6.4 Auction sales per grade and prices
Table 18. Mills clean coffee production CY 2017/2018 (Source: Agriculture and Food Authority, 2018) Table 19. Auction sales per coffee grade CY 2017/2018 (Source: Agriculture and Food Authority, 2018)
COUNTY PARCHMENT MBUNI TOTAL PERCENTAGE
KIAMBU 9,601,004.00 647,024.00 10,248,028.00 18%
KIRINYAGA 7,034,516.00 1,362,753.00 8,397,269.00 15%
MURANG’A 6,284,593.00 1,401,481.00 7,686,074.00 13%
NYERI 5,409,201.82 1,763,467.15 7,172,668.97 13%
EMBU 2,803,942.60 298,769.00 3,102,711.60 5%
BUNGOMA 2,751,566.00 406,590.00 3,158,156.00 6%
KERICHO 2,611,186.00 381,469.00 2,992,655.00 5%
KISII 2,106,289.70 1,404,296.50 3,510,586.20 6%
MERU 2,159,634.00 286,223.00 2,445,857.00 4%
NYAMIRA 1,688,534.00 585,240.00 2,273,774.00 4%
MACHAKOS 1,722,225.00 210,208.00 1,932,433.00 3%
THARAKA NITHI 1,007,720.00 157,370.00 1,165,090.00 2%
NANDI 716,958.00 230,047.00 947,005.00 2%
TRANS NZOIA 729,624.00 208,223.00 937,847.00 2%
NAKURU 424,917.60 95,965.00 520,882.60 1%
MIGORI 132,504.00 26,875.00 159,379.00 0%
NAIROBI 131,912.00 10,145.00 142,057.00 0%
MAKUENI 93,706.00 12,515.00 106,221.00 0%
BARINGO 64,587.00 32,092.00 96,679.00 0%
ELGEYO MARAKWET 48,020.00 16,705.00 64,725.00 0%
HOMA BAY 39,150.00 13,459.00 52,609.00 0%
KISUMU 28,293.00 8,441.00 36,734.00 0%
WEST POKOT 25,302.00 11,634.00 36,936.00 0%
KAKAMEGA 25,197.00 15,226.00 40,423.00 0%
UASIN GISHU 21,583.00 5,214.00 26,797.00 0%
BOMET 4,066.00 2,811.00 6,877.00 0%
KPCU SWEEPINGS* 1,472.50 1,472.50 0%
VIHIGA 2,860.00 2,860.00 0%
LAIKIPIA - 15,275.00 15,275.00 0%
NAROK - 98 98.00 0%
GRAND TOTAL 47,667,704.22 9,612,475.65 57,280,179.87 100%
Grade Full Bags Bought
Weight Bought-kg
Min Price Max Price Avg Price USD/50kg
Value USD/50kg Percent
Main Coffee Grades
AA 81,149 4,996,069.00 20.00 679.00 345.52 34,525,167.50 14.00%
AB 212,701 12,922,595.00 10.00 501.00 247.17 63,882,804.08 36.22%
C 110,661 6,793,312.00 5.00 309.00 171.48 23,298,068.92 19.04%
E 1,081 68,951.00 80.00 320.00 252.52 348,232.08 0.19%
PB 24,001 1,502,258.00 15.00 540.00 219.26 6,587,649.88 4.21%
T 20,689 1,290,018.00 7.00 160.00 84.04 2,168,258.60 3.62%
TT 15,076 941,892.00 10.00 350.00 155.61 2,931,285.34 2.64%
Sub-Total: 465,358 28,515,095.00 5.00 679.00 234.51 133,741,466.40 79.93%
Miscellaneous Coffee
HE 5,460 337,344.00 20.00 150.00 87.49 590,277.18 0.95%
SB 1,868 96,641.00 6.00 67.00 28.84 55,750.64 0.27%
UG 3,370 204,234.00 11.00 151.00 65.23 266,459.86 0.57%
UG1 16,473 1,009,883.00 10.00 350.00 95.99 1,938,699.76 2.83%
UG2 11,896 734,666.00 5.00 250.00 69.15 1,016,038.06 2.06%
UG3 693 43,088.00 11.00 123.00 47.17 40,645.78 0.12%
Sub-Total: 39,760 2,425,856.00 5.00 350.00 80.55 3,907,871.28 6.80%
Unwashed Coffee
MH 60,246 3,652,121.00 10.00 130.00 87.10 6,361,902.04 10.24%
ML 17,523 1,082,377.00 7.00 103.00 55.84 1,208,784.72 3.03%
Sub-Total: 77,769 4,734,498.00 7.00 130.00 79.95 7,570,686.76 13.27%
Grand Total: 582,887 35,675,449.00 203.53 145,220,024.44 100.00%
FEEM REPORTS | 5150 | FEEM REPORTS

6.5 Local vs International coffee prices 6.6 Coffee export volumes and FOB values by destination for 2017/2018 and 2016/2017
Table 20. Local and international coffee prices (Source: Agriculture and Food Authority, 2018) Table 21. Coffee export volumes and FOB values by destination for 2017/2018 (Source: Agriculture and Food Authority, 2018)
Month NCE (USD/50kg) ICE (USD/50kg) ICE (cts/lb)Oct-13 140.29 142.59 129.36 Nov-13 148.40 136.30 123.65 Dec-13 159.56 140.17 127.16 Jan-14 170.17 146.00 132.45 Feb-14 230.89 182.65 165.70 Mar-14 265.56 214.85 194.91 Apr-14 225.75 229.24 207.96 May-14 199.55 214.89 194.95 Jun-14 204.29 201.75 183.03 Jul-14 179.26 203.16 184.31 Aug-14 216.31 217.61 197.41 Sep-14 227.55 217.08 196.93 Oct-14 236.88 230.27 208.90 Nov-14 228.01 212.51 192.79 Dec-14 228.87 192.12 174.29 Jan-15 225.29 189.09 171.54 Feb-15 267.39 173.47 157.38 Mar-15 206.14 153.68 139.42 Apr-15 166.11 160.75 145.83 May-15 149.87 153.50 139.25 Jul-15 167.74 142.64 129.40 Aug-15 181.20 146.61 133.00 Sep-15 172.86 139.93 126.94 Oct-15 155.46 151.38 137.33 Nov-15 165.06 141.65 128.50 Dec-15 212.99 142.20 129.00 Jan-16 225.67 136.69 124.00 Feb-16 238.25 136.13 123.50 Mar-16 215.44 145.94 132.40 Apr-16 167.77 140.27 127.25 May-16 130.64 143.08 129.80 Jun-16 132.70 154.87 140.50 Jul-16 159.88 164.24 149.00 Aug-16 212.32 158.46 143.75 Sep-16 216.04 165.07 149.75 Oct-16 202.43 174.69 158.48 Nov-16 229.84 180.12 163.40 Dec-16 251.68 160.22 145.35 Jan-17 284.42 167.87 152.29 Feb-17 292.49 161.33 146.36 Mar-17 246.43 164.61 149.33 Apr-17 144.79 159.49 144.69 May-17 133.91 152.67 138.50 Jul-17 202.07 147.53 133.84 Aug-17 213.98 144.51 131.10 Sep-17 221.71 149.80 135.90 Oct-17 197.55 158.57 143.85 Nov-17 202.56 156.87 142.31 Dec-17 219.70 149.05 135.22 Jan-18 256.30 150.02 136.10 Feb-18 284.62 146.66 133.05 Mar-18 236.33 142.90 129.64 Apr-18 151.36 140.86 127.79 May-18 107.58 142.73 129.48 Jul-18 177.23 130.27 118.18 Aug-18 167.63 120.69 109.49 Sep-18 143.14 112.50 102.06
DESTINATION NO BAGS NET WEIGHT-kg FOB VALUE ($) %
UNITED STATES 113,406 6,804,346.80 42,020,595.99 16%
GERMANY 112,917 6,775,017.40 36,384,785.25 16%
BELGIUM 101,235 6,074,113.00 31,370,405.96 14%
KOREA, REPUBLIC OF 87,111 5,226,660.00 25,129,162.36 12%
SWEDEN 58,824 3,529,429.80 20,020,999.94 8%
AUSTRALIA 25,278 1,516,682.00 9,545,978.94 4%
FINLAND 23,076 1,384,560.00 6,667,018.26 3%
NORWAY 18,344 1,100,630.00 7,554,350.60 3%
UNITED KINGDOM 16,599 995,939.00 7,619,340.59 2%
TUNISIA 15,945 956,720.00 2,364,784.63 2%
CANADA 15,599 935,930.00 5,676,682.26 2%
NETHERLANDS 13,412 804,709.00 4,764,372.73 2%
JAPAN 12,587 755,226.51 5,342,535.45 2%
SPAIN 10,637 638,220.00 3,641,816.71 1%
UNITED ARAB EMIRATES 10,454 627,240.00 1,303,651.22 1%
ROMANIA 10,220 613,200.00 3,433,881.12 1%
SYRIAN ARAB REPUBLIC 8,720 523,200.00 988,200.00 1%
JORDAN 8,411 504,660.00 2,105,790.00 1%
FRANCE 7,747 464,820.00 1,289,510.33 1%
INDIA 7,096 425,760.00 995,404.44 1%
ITALY 6,751 405,052.00 1,223,143.75 1%
SWITZERLAND 4,360 261,600.00 1,323,982.08 1%
NEW ZEALAND 4,052 243,108.00 1,359,062.68 1%
CROATIA 3,840 230,400.00 488,781.12 1%
TAIWAN 3,839 230,348.80 1,751,498.77 1%
REPUBLIC OF DJIBOUTI 3,720 223,200.00 308,760.00 1%
SAUDI ARABIA 2,869 172,140.00 1,094,694.66 0%
CHINA 2,447 146,807.00 921,103.90 0%
SOUTH AFRICA 1,843 110,593.00 565,870.15 0%
MADAGASCAR 1,680 100,800.00 252,000.00 0%
TURKEY 1,324 79,440.00 239,375.55 0%
RUSSIAN FEDERATION 1,215 72,900.00 287,635.17 0%
OMAN 989 59,340.00 155,106.90 0%
POLAND 930 55,800.00 100,440.00 0%
DENMARK 678 40,680.00 351,540.77 0%
IRAN 647 38,800.00 139,405.00 0%
MALAYSIA 600 36,000.00 55,908.00 0%
LEBANON 462 27,747.00 79,675.24 0%
HONG KONG 414 24,840.00 157,228.28 0%
BULGARIA 320 19,200.00 121,339.33 0%
GREECE 320 19,200.00 62,976.00 0%
SINGAPORE 250 15,000.00 108,030.00 0%
LATVIA 188 11,280.00 92,587.00 0%
PHILLIPINES 100 6,000.00 36,068.40 0%
CZECH REPUBLIC 18 1,090.00 7,537.00 0%
BELIZE 15 900 7,038.00 0%
IRELAND 5 286 4,350.00 0%
TOTAL 721,494 43,289,615.31 229,514,404.53 100%
FEEM REPORTS | 5352 | FEEM REPORTS

6.7 Dealers and marketing agents export performance for 2017/18 and 2016/2017Table 22. Coffee export volumes and FOB values by destination for 2016/2017 (Source: Agriculture and Food Authority, 2018)
Table 23. Dealers and marketing agents export performance for 2017/18 (Source: Agriculture and Food Authority, 2018)DESTINATION NO BAGS NET WEIGHT-kg FOB VALUE ($) %
UNITED STATES 147,846 8,870,757.80 54,677,941.23 20%
GERMANY 138,139 8,288,360.00 40,145,963.19 19%
BELGIUM 99,295 5,957,720.00 31,821,911.87 14%
SWEDEN 61,453 3,687,200.00 20,592,971.46 9%
KOREA, REPUBLIC OF 41,581 2,494,845.60 12,674,192.50 6%
FINLAND 24,760 1,485,600.00 7,337,307.61 3%
UNITED KINGDOM 19,564 1,173,839.00 7,964,024.33 3%
NORWAY 18,627 1,117,602.00 7,277,733.94 3%
FRANCE 16,341 980,450.00 2,803,088.37 2%
AUSTRALIA 16,314 978,841.00 6,156,357.56 2%
SPAIN 14,602 876,120.00 4,155,924.63 2%
CANADA 13,533 811,960.00 4,629,647.21 2%
JAPAN 12,839 770,360.00 4,940,041.66 2%
SYRIAN ARAB REPUBLIC 11,950 717,000.00 1,316,304.00 2%
NETHERLANDS 10,460 627,600.00 3,740,219.14 1%
SAUDI ARABIA 7,987 479,220.00 1,460,118.04 1%
UNITED ARAB EMIRATES 7,367 442,000.00 1,143,863.00 1%
TAIWAN 5,900 354,014.80 1,690,667.90 1%
INDIA 5,483 328,980.00 529,476.60 1%
DENMARK 5,062 303,694.58 1,722,844.85 1%
NEW ZEALAND 5,018 301,080.00 1,466,311.74 1%
TUNISIA 5,000 300,000.00 1,225,626.60 1%
ITALY 4,932 295,900.00 1,247,808.63 1%
ROMANIA 4,540 272,400.00 1,721,128.80 1%
JORDAN 4,084 245,040.00 1,034,173.00 1%
RUSSIAN FEDERATION 2,720 163,200.00 333,223.92 0%
SWITZERLAND 2,560 153,600.00 639,744.00 0%
TURKEY 1,637 98,220.00 284,475.10 0%
CHILE 1,600 96,000.00 164,280.00 0%
GREECE 1,600 96,000.00 341,184.00 0%
MOROCCO 1,600 96,000.00 164,760.00 0%
CHINA 1,448 86,870.00 671,798.02 0%
IRELAND 1,285 77,100.00 471,364.95 0%
ISRAEL 1,280 76,800.00 268,393.69 0%
SOUTH AFRICA 1,075 64,500.00 317,050.80 0%
SOUTH SUDAN 960 57,600.00 107,520.00 0%
LEBANON 640 38,400.00 78,600.00 0%
MALAYSIA 521 31,260.00 105,781.39 0%
OMAN 327 19,620.00 51,764.20 0%
BELIZE 316 18,930.00 159,874.80 0%
IRAN 300 18,000.00 67,800.00 0%
NIGERIA 272 16,320.00 67,674.00 0%
SINGAPORE 100 6,000.00 31,572.39 0%
HONG KONG 62 3,720.00 25,482.00 0%
TOTAL 722,979 43,378,724.78 227,827,991.12 100%
EXPORTER NO. OF BAGS (60 kg) NET WEIGHT-kg FOB VALUE (US$) %
IBERO (KENYA) LTD 107,096 6,425,760.20 32,906,170.01 14.8%
TAYLOR WINCH COFFEE LTD 104,886 6,293,184.00 27,777,900.29 14.5%
KENYACOF LIMITED 69,718 4,183,105.00 24,581,194.57 9.7%
C DORMAN LTD 69,152 4,149,117.80 25,857,344.31 9.6%
COFFEE MANAGEMENT SERVICES LIMITED 59,019 3,541,128.80 28,846,144.14 8.2%
LOUIS DREYFUS COMPANY KENYA LIMITED 46,600 2,796,020.00 10,419,553.76 6.5%
SERVICOFF LIMITED 44,820 2,689,200.00 18,853,849.92 6.2%
DIAMOND COFFEE CO LTD 33,395 2,003,700.00 9,217,872.00 4.6%
RASHID MOLEDINA & CO. (MSA) LTD 28,422 1,705,300.00 4,241,436.00 3.9%
MUMBI COFFEE MERCHANTS LIMITED 28,243 1,694,580.00 6,484,611.86 3.9%
TROPICAL FARM MANAGEMENT 18,928 1,135,680.00 5,757,837.44 2.6%
SONDHI TRADING LIMITED 18,308 1,098,493.00 5,244,396.64 2.5%
ENGELHART CTP KENYA LIMITED 12,900 774,000.00 3,368,607.36 1.8%
JOWAM COFFEE TRADERS LIMITED 11,860 711,600.00 4,161,458.40 1.6%
AFRICOFF TRADING COMPANY LIMITED 11,612 696,737.00 3,889,225.00 1.6%
MOMBASA COFFEE LTD 8,564 513,840.00 813,433.68 1.2%
KENYA CO OPERATIVE COFFEE EXPORTERS LIMITED
8,310 498,593.00 3,826,452.93 1.2%
KYANDU TRADING CO. LTD 8,049 482,962.00 1,928,989.82 1.1%
JOSRA COFFEE COMPANY LTD 4,630 277,783.00 1,932,618.56 0.6%
EAST AFRICAN GOURMET COFFEES LIMITED 4,200 252,000.00 1,841,987.93 0.6%
ALANWOOD LIMITED 3,700 222,020.00 977,124.00 0.5%
SASINI PLC 2,801 168,060.00 1,201,324.19 0.4%
AFRICA GOLD COFFEE LIMITED 2,330 139,800.00 630,204.00 0.3%
KENYA NUT CO LTD 1,972 118,320.00 892,233.66 0.3%
KIMANI COFFEE EXPERTS LIMITED 1,965 117,910.00 732,586.40 0.3%
GOLDROCK INTERNATIONAL ENTERPRISES(K) LTD
1,747 104,805.00 445,053.10 0.2%
EAGLE CROWN COFFEE LTD 1,605 96,300.00 439,548.12 0.2%
ROSIE VAM DYKE COMPANY LIMITED 1,135 68,100.00 387,830.00 0.2%
CONNECT COFFEE COMPANY. 960 57,600.00 512,568.00 0.1%
AFRICA TEA AND COFFEE CO. LTD 900 54,000.00 72,900.00 0.1%
STAR COFFEE (K) LTD 840 50,400.00 375,120.00 0.1%
EXPORT TRADING CO LTD 772 46,346.00 109,636.47 0.1%
REJITEK COFFEE COMPANY LTD 643 38,567.00 144,250.00 0.1%
CLASSIC COFFEE LIMITED 405 24,300.00 145,175.00 0.1%
JEMMAN COFFEE AND MINING LTD 333 20,000.00 184,000.00 0.0%
SUPER GIBS LTD 271 16,246.00 78,270.00 0.0%
ROCKBERN COFFEE GROUP LTD 206 12,389.00 122,863.25 0.0%
SUSTAINABLE MANAGEMENT SERVICES LIMITED 110 6,600.00 69,328.32 0.0%
COFFEE EXPORTERS (K)LTD 61 3,652.00 23,738.00 0.0%
KAIZEN EXPORT LIMITED 16 930.00 8,649.00 0.0%
DORMANS COFFEE LIMITED 8 486.51 10,918.40 0.0%
GRAND TOTAL 721,494 43,289,615.31 229,514,404.50 100.0%
FEEM REPORTS | 5554 | FEEM REPORTS

Table 24. Dealers and marketing agents export performance for 2016/17 (Source: Agriculture and Food Authority, 2018) References
A Comprehensive Guide on Coffee Farming
in Kenya. (2019). Retrieved from https://
farmerstrend.co.ke/coffee-farming-guide/
Agriculture and Food Authority. (2018). Coffe
Year Book 2017/2018.
CIPS. (2013). Ethical and Sustainable.
Coffee Management Services. (2018). Coffee
Economic Viability Study.
FAO. (2000). POST HARVEST HANDLING AND
PROCESSING OF COFFEE IN AFRICAN COUNTRIES.
Retrieved from http://www.fao.org/3/x6939e/
X6939e11.htm
FAO. (2019). Crops (Coffee) (General) Regulations,
2019 (L.N. No. 102 of 2019). Retrieved from http://
www.fao.org/faolex/results/details/en/c/LEX-
FAOC187959/
Ghirardelli, E. (2019). Coffee Prices Decline, Why
It Happened And How To Stop It. Retrieved from
https://coffeebi.com/2019/01/07/coffee-prices-
decline-why-it-happened-and-how-to-stop-it/
Gituma, K., & Fuchaka, W. (2017). Enhancing
benefits from biomass wastes within small-medium
scale coffee processing factories in Kiambu County,
Kenya. African Journal of Environmental Science
and Technology, 11(4), 198–206. https://doi.
org/10.5897/ajest2016.2243
Kenya Bureau of Standards. (2004). Coffee
Standards. Retrieved from http://onlinecatalogue.
kebs.org/webquery.dll
International Coffee Organization, 2019.
COUNTRY COFFEE PROFILE KENYA, (March).
Joakim, P. (2012). Kenya General Information.
Retrieved from https://nordicapproach.
no/2012/05/20120520kenya-general-information/
Markham, D. (2016). This company converts
coffee cherry pulp into a nutritious (flourless) flour.
Retrieved from https://www.treehugger.com/
green-food/company-converts-coffee-cherry-pulp-
nutritious-flourless-flour.html
Mersie, A. (2019). Kenya’s coffee crop nosedives
due to high temperatures, low prices. Retrieved from
https://www.reuters.com/article/us-climate-change-
kenya-coffee/kenyas-coffee-crop-nosedives-due-to-
high-temperatures-low-prices-idUSKBN1YE1EK
Milton, J. (2020). 25 Top Coffee-Producing
Countries in 2020. Retrieved from https://
elevencoffees.com/top-coffee-producing-countries/
Monroy L., Mulinge W., W. M. (2013). Analysis of
Incentives and Disincentives for Coffee in Kenya July
2013, (July).
Ministry of Food and Agriculture. (2019).
MEDIUM TERM EXPENDITURE FRAMEWORK (MTEF).
Muthoni, M. P. (2014). Coffee Value Chain Analysis
in Kenya ( A case of Kenya Planters Cooperative
Union ), 6(5), 207–215.
Nairobi Coffee Exchange, N. (2014). Nairobi
Coffee Exchange, 8. Retrieved from http://
nairobicoffeeexchange.co.ke/phocadownload/
General/NCE-2014-2017-Strategic-Plan.pdf
EXPORTER NO. OF BAGS (60kg) NET WEIGHT –kg FOB VALUE (US$) %
IBERO (KENYA) LTD 107,362 6,441,724.00 31,180,612.14 14.80%
TAYLOR WINCH COFFEE LTD 93,133 5,587,972.00 26,976,258.40 12.90%
KENYACOF LIMITED 72,732 4,363,932.00 22,808,636.81 10.10%
C DORMAN LTD 59,121 3,547,270.00 23,035,657.35 8.20%
ENGELHART CTP KENYA LIMITED 43,396 2,603,770.00 12,601,944.59 6.00%
LOUIS DREYFUS COMPANY KENYA LIMITED 38,170 2,290,229.80 10,364,591.86 5.30%
DIAMOND COFFEE CO LTD 34,307 2,058,400.00 9,158,892.00 4.70%
SERVICOFF LIMITED 32,586 1,955,160.00 14,558,195.21 4.50%
RASHID MOLEDINA & COMPANY (MSA) LIMITED 23,331 1,399,840.00 3,263,869.00 3.20%
MUMBI COFFEE MERCHANTS LIMITED 22,122 1,370,520.00 4,792,604.32 3.20%
SONDHI TRADING LIMITED 11,832 709,920.00 3,983,367.09 1.60%
MOMBASA COFFEE LTD 9,80 589,800.00 1,012,046.00 1.40%
EAST AFRICAN GOURMET COFFEES LIMITED 9,60 576,000.00 3,600,356.92 1.30%
AFRICOFF TRADING COMPANY LIMITED 9,341 560,440.00 2,811,342.00 1.30%
KYANDU TRADING COMPANY LIMITED 9,229 553,730.00 1,531,676.08 1.30%
REJITEK COFFEE COMPANY LTD 8,640 518,400.00 1,075,680.00 1.20%
KENYA CO OPERATIVE COFFEE EXPORTERS LIMITED
7,567 454,014.80 3,666,713.52 1.00%
JOWAM COFFEE TRADERS LIMITED 6,320 379,200.00 2,144,010.00 0.90%
JOSRA COFFEE COMPANY LTD 4,837 290,220.00 1,869,018.51 0.70%
AFRICA GOLD COFFEE LIMITED 3,055 183,320.00 400,236.00 0.40%
AFRICAN COFFEE ROASTERS EPZ LTD 2,797 167,818.58 1,136,844.78 0.40%
ALANWOOD LIMITED 2,548 152,880.00 735,413.00 0.40%
SANGANA COMMODITIES LTD 2,541 152,432.00 817,042.23 0.40%
M. A. PANJU & BROTHERS LTD 1,963 117,804.00 812,092.88 0.30%
EXPORT TRADING COMPANY LTD 1,480 88,800.00 185,767.92 0.20%
MERALI DEWJI & SONS (K) LTD 1,432 85,940.00 470,591.72 0.20%
EAGLE CROWN COFFEE LTD 1,274 76,440.00 598,890.78 0.20%
KENYA NUT COMPANY LTD 1,000 60,000.00 468,579.93 0.10%
STAR COFFEE (K) LTD 912 54,720.00 305,810.00 0.10%
SUPER GIBS LIMITED 760 45,600.00 296,514.00 0.10%
KIMANI COFFEE EXPERTS LIMITED 663 39,780.00 268,038.93 0.10%
WAYLITE ENTERPRISES LIMITED 640 38,400.00 78,600.00 0.10%
EXPORT TRADING CO LTD 320 19,200.00 92,359.68 0.00%
PROSPECTS INTERNATIONAL LIMITED 320 19,200.00 44,544.00 0.00%
KUTTUM LIMITED 311 18,660.00 26,124.00 0.00%
GLOBAL AFREA COMPANY LIMITED 105 6,270.00 43,124.70 0.00%
DORMANS COFFEE LIMITED 18 1,101.60 26,501.26 0.00%
ORION EAST AFRICA LIMITED 4 216 97.2 0.00%
COFFEE MANAGEMENT SERVICES LIMITED 63,000 3,780,016.00 29,150,820.97 8.70%
TROPICAL FARM MANAGEMENT 13,596 815,770.00 3,411,057.08 1.90%
SASINI LIMITED 12,370 742,200.00 5,325,917.76 1.70%
OAKLANDS COFFEE MARKETING LIMITED 5,760 345,600.00 1,941,399.36 0.80%
CLASSIC COFFEE LIMITED 1,049 62,925.00 397,401.53 0.10%
SUSTAINABLE MANAGEMENT SERVICES LIMITED 885 53,089.00 358,749.61 0.10%
GRAND TOTAL 722,259 43,378,724.78 227,827,991.10 100.00%
FEEM REPORTS | 5756 | FEEM REPORTS
Ndirangu, W. (2020). Government Launches
Coffee Revitalization Project. Retrieved from https://
www.kenyanews.go.ke/government-launches-coffee-
revitalization-project/
Nganga, J. N. (2019). Kenya Coffee Grading.
Retrieved from https://espressocoffeeguide.com/
gourmet-coffee/arabian-and-african-coffees/kenya-
coffee/kenya-coffee-grading/
Ngibuini, D. (2019). What’s Causing The
Generation Gap in Kenyan Coffee Production?
Retrieved from https://perfectdailygrind.
com/2019/12/whats-causing-the-generation-gap-
in-kenyan-coffee-production/
NGUNJIRI, J. (2018). Kenyan coffee ranks among
the world’s top beans. Retrieved from https://www.
nation.co.ke/lifestyle/smartcompany/Kenyan-
coffee-ranks-among-the-world/1226-4255704-
2dbddf/index.html
Scholar, L. (2018). Formation and Regesteration
of Co-operative Societies. Retrieved from https://
legalscholarsite.com/formation-and-registration-of-
co-operative-societies-kenya/
The Coffee Cherry Co. (2020). Coffee nutritional
information. Retrieved from https://coffeecherryco.
com/nutrition/
Townsend, S. (2020). Kenya Coffee Annual Kenya
Coffee Sector to Decline as Reforms Fall Short.
United Nations Industrial Development
Organisation. (2013). Traceability Manual :
Traceability in the Green Coffee.
USAID. (2010). KENYA COFFEE INDUSTRY VALUE
CHAIN ANALYSIS, (May).
Wikiprocedure. (2019). Kericho - Obtain Coffee
Warehouseman Certificate. Retrieved from https://
www.wikiprocedure.com/index.php/Kericho_-_
Obtain_Coffee_Warehouseman_Certificate
Workman, D. (2020). Coffee Imports by Country.
Retrieved from http://www.worldstopexports.com/
coffee-imports-by-country/
FEEM REPORTS | 5958 | FEEM REPORTS
The Fondazione Eni Enrico Mattei (FEEM), founded in 1989, is a non profit, policy-oriented, international research center and a think-tank producing high-quality, innovative, interdisciplinary and scientifically sound research on sustainable development. It contributes to the quality of decision-making in public and private spheres through analytical studies, policy advice, scientific dissemination and high-level education. Thanks to its international network, FEEM integrates its research and dissemination activities with those of the best academic institutions and think tanks around the world.
Fondazione Eni Enrico Mattei Corso Magenta 63, Milano – Italia
Tel. +39 02.520.36934Fax. +39.02.520.36946
E-mail: [email protected] www.feem.it