fertigation / chemigation
TRANSCRIPT

FERTIGATION / CHEMIGATION
MIDWEST LABORATORIES, INC. • 13611 B STREET • OMAHA, NE 68144 • 402-334-7770 • FAX 402-334-9121

i
TABLE OF CONTENTS
Acknowledgements .................................................................................................... ii
Introduction .................................................................................................................. 1
Agronomic Considerations for Fertigation ............................................................ 1-3
When and How to Apply/Fertigation Crop Requirements ................................... 3-7
Chemigation Strategies.............................................................................................. 3-4Nitrogen ................................................................................................................... 4Phosphorus .............................................................................................................. 4Potassium and Magnesium .................................................................................... 5Sulfur ........................................................................................................................ 5Zinc and Other Micronutrients ................................................................................ 6-7Fertigation Schedule ............................................................................................... 7
Selection of Materials ................................................................................................. 8-10Nitrogen ................................................................................................................... 8Phosphates .............................................................................................................. 8-9Potassium and Magnesium .................................................................................... 9Sulfur ........................................................................................................................ 9-10Zinc and Other Micronutrients ................................................................................ 10
Chemigation ................................................................................................................. 10-13Herbigation .............................................................................................................. 11Insectigation ............................................................................................................ 11-12Fungigation .............................................................................................................. 12Considerations in Reviewing Agents Prior to Chemigation ................................. 12-13
Fertigation Chemigation Precautions of Use......................................................... 13-16
Chemigation System Design ..................................................................................... 16-24
Chemical Effects on Irrigation System Components ........................................... 24
Irrigation Systems for Dairy Manure ....................................................................... 24-31
Appendix ....................................................................................................................... 32-103
References.................................................................................................................... 105-106
Index .............................................................................................................................. 107
LIMITATION OF LIABILITY
The information in this publication is based on the best information available to the author at the time of publication. Itis not intended to be used in place of instruction issued by the manufacturer of any product. All agricultural materialsshould be used in strict compliance with label directions, and the user assumes all liability for results of deviation fromsuch directions.
Copyright 1994, Midwest Laboratories, Inc., Omaha, NE

ii
ACKNOWLEDGEMENTS
The following people have lent considerable time and effort into making this resourcehandbook both understandable and credible. Their efforts and contributions aresincerely appreciated.
Steve Curley; C.P.Ag./S.S.Midwest Laboratories AgronomistEditor
Richard D. Curley; C.P.Ag. (contributing editor)Fremont, Nebraska
Richard Goff; C.P.Ag. (contributing editor)Midwest Laboratories AgronomistNew Ulm, Minnesota
Robert Hecht; C.P.Ag. (contributing editor)Midwest Laboratories AgronomistSeneca, Kansas
Jim EitingValmont IrrigationValmont IndustriesValley, Nebraska
Don JohnsonArcadian Corporation
Ed KryslHickson Kerley, Inc.Phoeniz, Arizona
John Menghini; C.P.Ag. (contributing editor)Midwest Laboratories AgronomistOmaha, Nebraska
Kennard Pohlman; C.P.Ag./S.S.Managing Director and PresidentMidwest Laboratories, Inc.Omaha, Nebraska
Richard H. Vande WalleMartin Marietta Chemicals
R. J. WallerColumbia Nitrogen Corporation

1
FERTILIZER AND CHEMICAL APPLICATIONSTHROUGH IRRIGATION SYSTEMS
Applying fertilizer solutions through irrigation water is not a recent development; the first agriculturaluse of anhydrous ammonia was through application in irrigation water in the early 1930’s (2). Withthe mechanization of irrigation, particularly with the development of center pivot sprinkler irrigationsystems, new application techniques have opened up for fertilizer and chemical solutions. Newwords describing these application techniques include fertigation, chemigation, fungigation,herbigation, insectigation and pestigation (18).
Many considerations must be evaluated and properly managed to effectively apply fertilizer andchemical solutions through irrigation systems, such as soil types, when and how to apply fertilizerand chemicals according to crop requirements, and selection and types of materials suited for use.
AGRONOMIC CONSIDERATIONS FOR FERTIGATION:
Fertigation (hereafter referring to application of fertilizer into irrigation water) will generally showgood crop response on all soil types if managed correctly. However, sandier, well-drained soils, willtend to reflect a greater degree of response due to a higher rate of water intake which lessens runoffand decreases the possibility of fertilizer and chemical loss. In the case of nitrogen fertigation onsandier soils, nitrate nitrogen losses can be decreased by permitting small more frequentapplications (10) (13).
A comprehensive soil analysis is an essential guideline aiding in scheduling irrigation and additionsof supplemental nutrient applications. Besides percent organic matter, soil pH and nutrient levels,soil analysis can supply guidelines in areas of particle size distribution (percent sand, salt and clay),bulk density, and available soil moisture determination as well. Soil survey maps can pinpointlocations of each soil type.
A more balanced, complete fertilizer program can be justified under irrigated conditions. Nebraskadata shown in Table 1 shows a 100-bushel per acre response to required additions of N-P-K-S onirrigated corn.
Table 1.
Irrigated Corn Response to Balanced Fertility Inputs (NE)
Fluid Corn Yield Response to Fertilizer Value of Extra YieldFertilizer bu/A bu/A $/A
- 97 - -N 178 81 202.50NP 187 9 22.50NPS 192 5 12.50NPKS 197 5 12.50
Fertigation of a 20-0-3-4S solution on corn grown on a sandy soil at Muscatine, Iowa, showed a 75-bushel per acre response over fertigation using only UAN 28 solution (Table 2).
Table 2. Influence of N, K & S Fertigation on Corn Yield1/
20-0-3-4S 28-0-0G X L2/ : Yield (bu/A) G X L : Yield (bu/A)16 X 45 : 180 14 X 30 : 105
1/Curley, S. H. 1986. Fertigation field trial. Muscatine, IA2/G X L = Girth (no. of kernels) X Ear Length (no. of kernels)
2
Irrigation response is not limited to crops grown on sandy soils and/or in limited rainfall areas.Studies have shown that the total amount of annual rainfall for a given crop isn't as important as thetiming of the rain (4) (17). Properly managed irrigation can apply water in the right amount and atthe correct time to economically justify irrigation even in areas where the annual rainfall exceeds 40inches on medium and fine-textured soils.
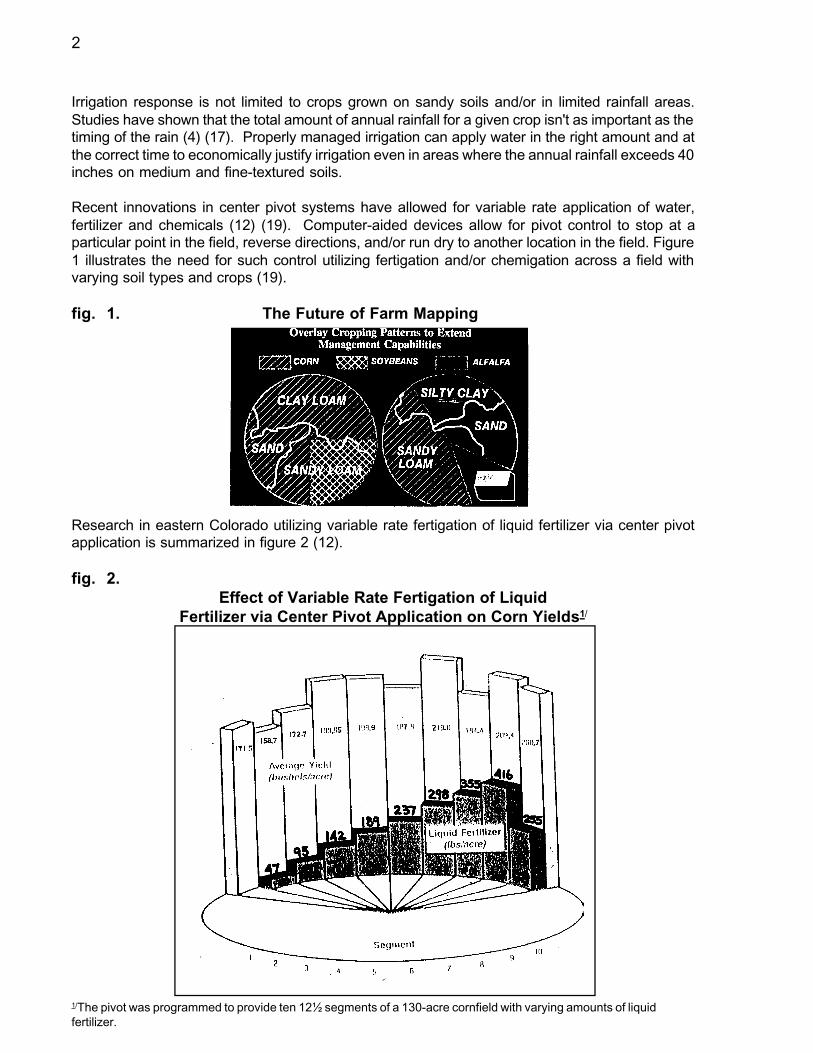
Recent innovations in center pivot systems have allowed for variable rate application of water,fertilizer and chemicals (12) (19). Computer-aided devices allow for pivot control to stop at aparticular point in the field, reverse directions, and/or run dry to another location in the field. Figure1 illustrates the need for such control utilizing fertigation and/or chemigation across a field withvarying soil types and crops (19).
fig. 1.
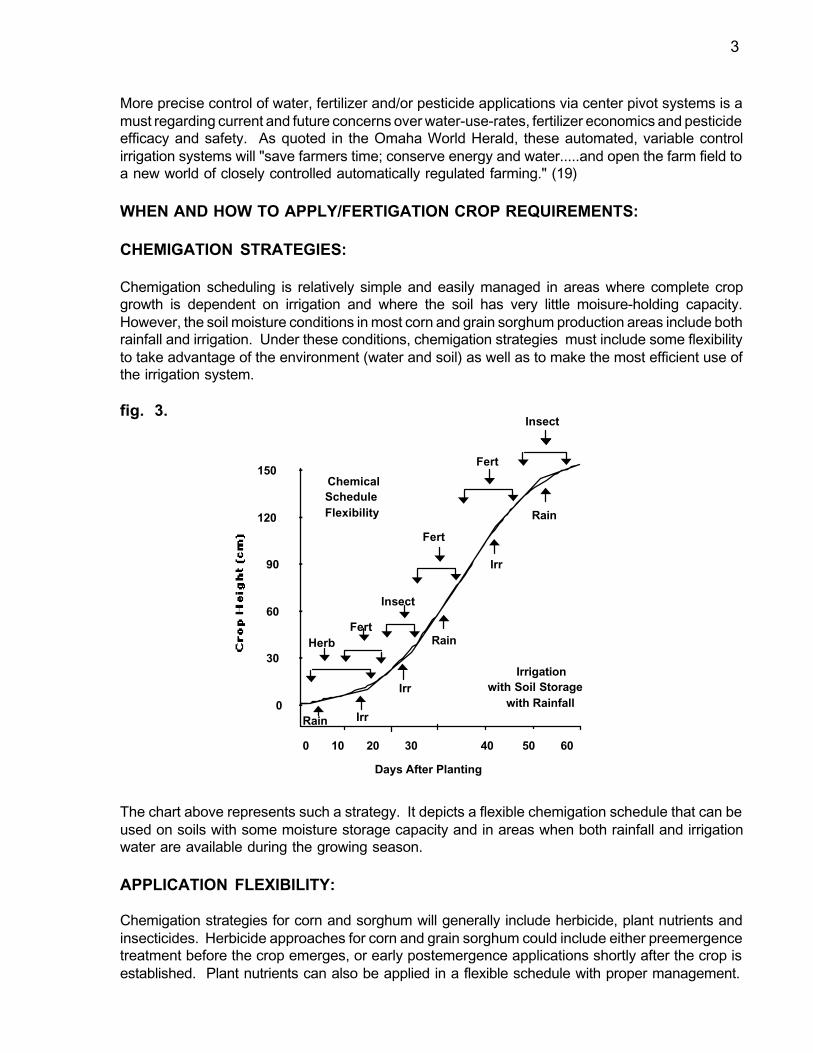
Research in eastern Colorado utilizing variable rate fertigation of liquid fertilizer via center pivotapplication is summarized in figure 2 (12).
fig. 2.Effect of Variable Rate Fertigation of Liquid
Fertilizer via Center Pivot Application on Corn Yields1/
1/The pivot was programmed to provide ten 12½ segments of a 130-acre cornfield with varying amounts of liquidfertilizer.
The Future of Farm Mapping
3
More precise control of water, fertilizer and/or pesticide applications via center pivot systems is amust regarding current and future concerns over water-use-rates, fertilizer economics and pesticideefficacy and safety. As quoted in the Omaha World Herald, these automated, variable controlirrigation systems will "save farmers time; conserve energy and water.....and open the farm field toa new world of closely controlled automatically regulated farming." (19)
WHEN AND HOW TO APPLY/FERTIGATION CROP REQUIREMENTS:
CHEMIGATION STRATEGIES:
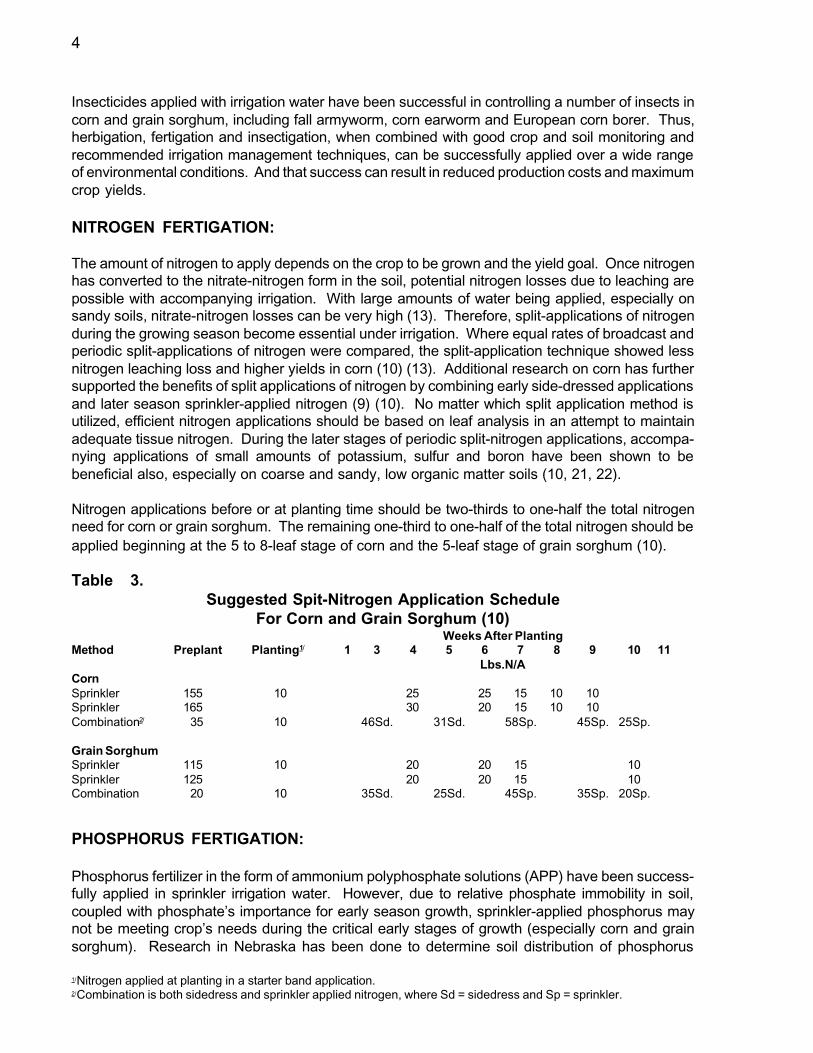
Chemigation scheduling is relatively simple and easily managed in areas where complete cropgrowth is dependent on irrigation and where the soil has very little moisure-holding capacity.However, the soil moisture conditions in most corn and grain sorghum production areas include bothrainfall and irrigation. Under these conditions, chemigation strategies must include some flexibilityto take advantage of the environment (water and soil) as well as to make the most efficient use ofthe irrigation system.
fig. 3.
The chart above represents such a strategy. It depicts a flexible chemigation schedule that can beused on soils with some moisture storage capacity and in areas when both rainfall and irrigationwater are available during the growing season.
APPLICATION FLEXIBILITY:
Chemigation strategies for corn and sorghum will generally include herbicide, plant nutrients andinsecticides. Herbicide approaches for corn and grain sorghum could include either preemergencetreatment before the crop emerges, or early postemergence applications shortly after the crop isestablished. Plant nutrients can also be applied in a flexible schedule with proper management.
150
120
90
60
30
0
0 10 20 30 40 50 60
Days After Planting
Irrigationwith Soil Storage
with Rainfall
ChemicalScheduleFlexibility
Insect
Fert
Fert
Insect
FertHerb
Rain Irr
Irr
Rain
Irr
Rain
-
-
-
-
-
-
4
Insecticides applied with irrigation water have been successful in controlling a number of insects incorn and grain sorghum, including fall armyworm, corn earworm and European corn borer. Thus,herbigation, fertigation and insectigation, when combined with good crop and soil monitoring andrecommended irrigation management techniques, can be successfully applied over a wide rangeof environmental conditions. And that success can result in reduced production costs and maximumcrop yields.
NITROGEN FERTIGATION:
The amount of nitrogen to apply depends on the crop to be grown and the yield goal. Once nitrogenhas converted to the nitrate-nitrogen form in the soil, potential nitrogen losses due to leaching arepossible with accompanying irrigation. With large amounts of water being applied, especially onsandy soils, nitrate-nitrogen losses can be very high (13). Therefore, split-applications of nitrogenduring the growing season become essential under irrigation. Where equal rates of broadcast andperiodic split-applications of nitrogen were compared, the split-application technique showed lessnitrogen leaching loss and higher yields in corn (10) (13). Additional research on corn has furthersupported the benefits of split applications of nitrogen by combining early side-dressed applicationsand later season sprinkler-applied nitrogen (9) (10). No matter which split application method isutilized, efficient nitrogen applications should be based on leaf analysis in an attempt to maintainadequate tissue nitrogen. During the later stages of periodic split-nitrogen applications, accompa-nying applications of small amounts of potassium, sulfur and boron have been shown to bebeneficial also, especially on coarse and sandy, low organic matter soils (10, 21, 22).
Nitrogen applications before or at planting time should be two-thirds to one-half the total nitrogenneed for corn or grain sorghum. The remaining one-third to one-half of the total nitrogen should beapplied beginning at the 5 to 8-leaf stage of corn and the 5-leaf stage of grain sorghum (10).
Table 3.Suggested Spit-Nitrogen Application Schedule
For Corn and Grain Sorghum (10)Weeks After Planting
Method Preplant Planting1/ 1 3 4 5 6 7 8 9 10 11Lbs.N/A
CornSprinkler 155 10 25 25 15 10 10Sprinkler 165 30 20 15 10 10Combination2/ 35 10 46Sd. 31Sd. 58Sp. 45Sp. 25Sp.
Grain SorghumSprinkler 115 10 20 20 15 10Sprinkler 125 20 20 15 10Combination 20 10 35Sd. 25Sd. 45Sp. 35Sp. 20Sp.
PHOSPHORUS FERTIGATION:
Phosphorus fertilizer in the form of ammonium polyphosphate solutions (APP) have been success-fully applied in sprinkler irrigation water. However, due to relative phosphate immobility in soil,coupled with phosphate’s importance for early season growth, sprinkler-applied phosphorus maynot be meeting crop’s needs during the critical early stages of growth (especially corn and grainsorghum). Research in Nebraska has been done to determine soil distribution of phosphorus
1/Nitrogen applied at planting in a starter band application.2/Combination is both sidedress and sprinkler applied nitrogen, where Sd = sidedress and Sp = sprinkler.
5
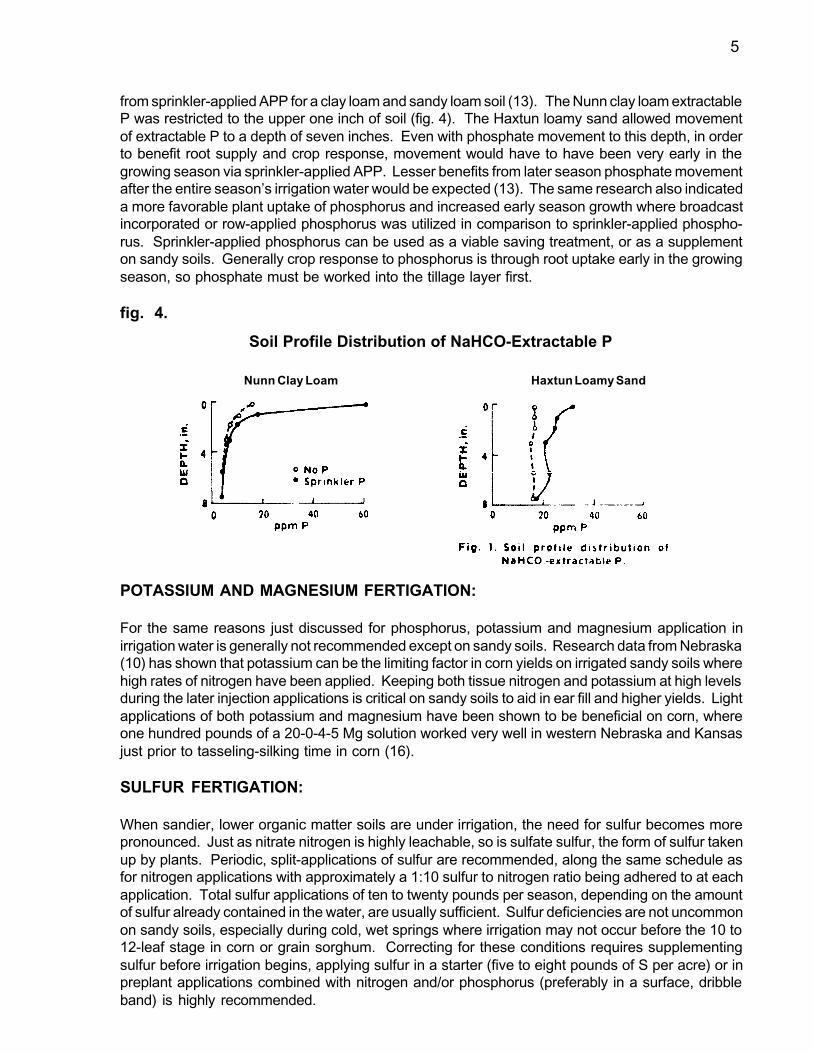
from sprinkler-applied APP for a clay loam and sandy loam soil (13). The Nunn clay loam extractableP was restricted to the upper one inch of soil (fig. 4). The Haxtun loamy sand allowed movementof extractable P to a depth of seven inches. Even with phosphate movement to this depth, in orderto benefit root supply and crop response, movement would have to have been very early in thegrowing season via sprinkler-applied APP. Lesser benefits from later season phosphate movementafter the entire season’s irrigation water would be expected (13). The same research also indicateda more favorable plant uptake of phosphorus and increased early season growth where broadcastincorporated or row-applied phosphorus was utilized in comparison to sprinkler-applied phospho-rus. Sprinkler-applied phosphorus can be used as a viable saving treatment, or as a supplementon sandy soils. Generally crop response to phosphorus is through root uptake early in the growingseason, so phosphate must be worked into the tillage layer first.
fig. 4.
Soil Profile Distribution of NaHCO-Extractable P
POTASSIUM AND MAGNESIUM FERTIGATION:
For the same reasons just discussed for phosphorus, potassium and magnesium application inirrigation water is generally not recommended except on sandy soils. Research data from Nebraska(10) has shown that potassium can be the limiting factor in corn yields on irrigated sandy soils wherehigh rates of nitrogen have been applied. Keeping both tissue nitrogen and potassium at high levelsduring the later injection applications is critical on sandy soils to aid in ear fill and higher yields. Lightapplications of both potassium and magnesium have been shown to be beneficial on corn, whereone hundred pounds of a 20-0-4-5 Mg solution worked very well in western Nebraska and Kansasjust prior to tasseling-silking time in corn (16).
SULFUR FERTIGATION:
When sandier, lower organic matter soils are under irrigation, the need for sulfur becomes morepronounced. Just as nitrate nitrogen is highly leachable, so is sulfate sulfur, the form of sulfur takenup by plants. Periodic, split-applications of sulfur are recommended, along the same schedule asfor nitrogen applications with approximately a 1:10 sulfur to nitrogen ratio being adhered to at eachapplication. Total sulfur applications of ten to twenty pounds per season, depending on the amountof sulfur already contained in the water, are usually sufficient. Sulfur deficiencies are not uncommonon sandy soils, especially during cold, wet springs where irrigation may not occur before the 10 to12-leaf stage in corn or grain sorghum. Correcting for these conditions requires supplementingsulfur before irrigation begins, applying sulfur in a starter (five to eight pounds of S per acre) or inpreplant applications combined with nitrogen and/or phosphorus (preferably in a surface, dribbleband) is highly recommended.
Nunn Clay Loam Haxtun Loamy Sand

6
ZINC AND OTHER MICRONUTRIENT FERTIGATION:
The benefits of sprinkler system foliar applications of micronutrient are not always evident. Nutrientconcentrations in irrigation water are generally at such a low level that foliar feeding through sprinklersystems is not effective. Generally, irrigation supplies one-half to one inch of water per application,while lower limits can be as low as one-fourth to one-third inch of water equalling an application of7,000 to 9,000 gallons per acre (13). A 30-pounds per acre nitrogen application of urea ammoniumnitrate (UAN28) in one-third inch of water equals a concentration of 200 ppm urea N, 100 ppmammonium-N, and 100 ppm nitrate N. Normally, foliar feeding rates of 10 to 20 gallons per acre ofconcentrated fertilizer solution are applied, making the concentration of nutrients in irrigation waterquite low in comparison, especially considering proportional amounts of micronutrients.
Responses to micronutrient fertigation cannot be entirely written off, however; quick-fix or rescuetreatments in severe cases utilizing fertigated micronutrients may show favorable results. Figure5 lends a possible explanation. Sprinkler application will thoroughly wet the entire plant, increasingthe probability of foliar absorption nutrients. Additionally, water flowing off the leaf surface wouldtend to be directed downward and concentrate at the base of the stem, concentrating nutrients forroot uptake. The positive interaction of moist soil, concentrated nutrients, as well as nitrogen presentin the solution would contribute to the possibility of response to fertigated micronutrients.
fig. 5.
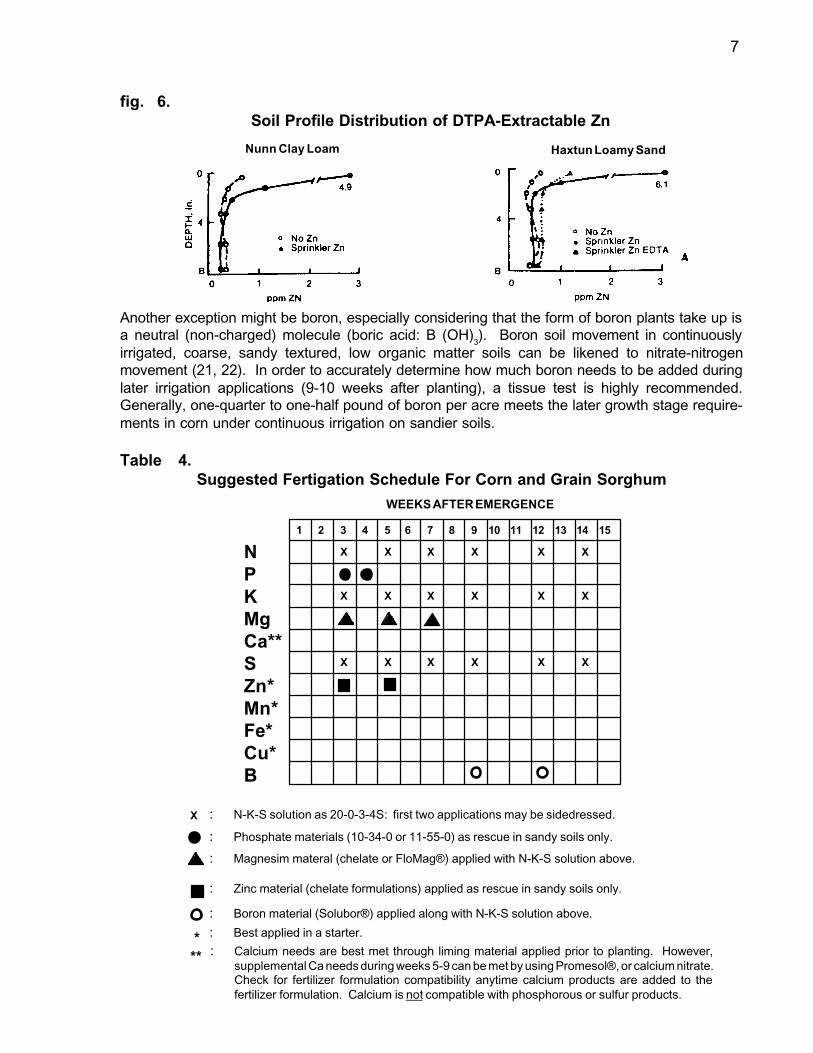
Due to the importance of micronutrients at early stages of growth, in-row applications (zinc, iron,manganese, or copper) or broadcast incorporated (boron) are recommended. A notable exceptionmight be zinc, as in-season zinc deficiencies in corn have been corrected with ZnEDTA on sandiersoils (10). Research done on a sandy loam soil shows ZnEDTA movement to the four-inch depth,sufficient enough to correct in-season zinc deficiencies if applied early in the growing season (figure6).
7
fig. 6.Soil Profile Distribution of DTPA-Extractable Zn
Another exception might be boron, especially considering that the form of boron plants take up isa neutral (non-charged) molecule (boric acid: B (OH)
3). Boron soil movement in continuously
irrigated, coarse, sandy textured, low organic matter soils can be likened to nitrate-nitrogenmovement (21, 22). In order to accurately determine how much boron needs to be added duringlater irrigation applications (9-10 weeks after planting), a tissue test is highly recommended.Generally, one-quarter to one-half pound of boron per acre meets the later growth stage require-ments in corn under continuous irrigation on sandier soils.
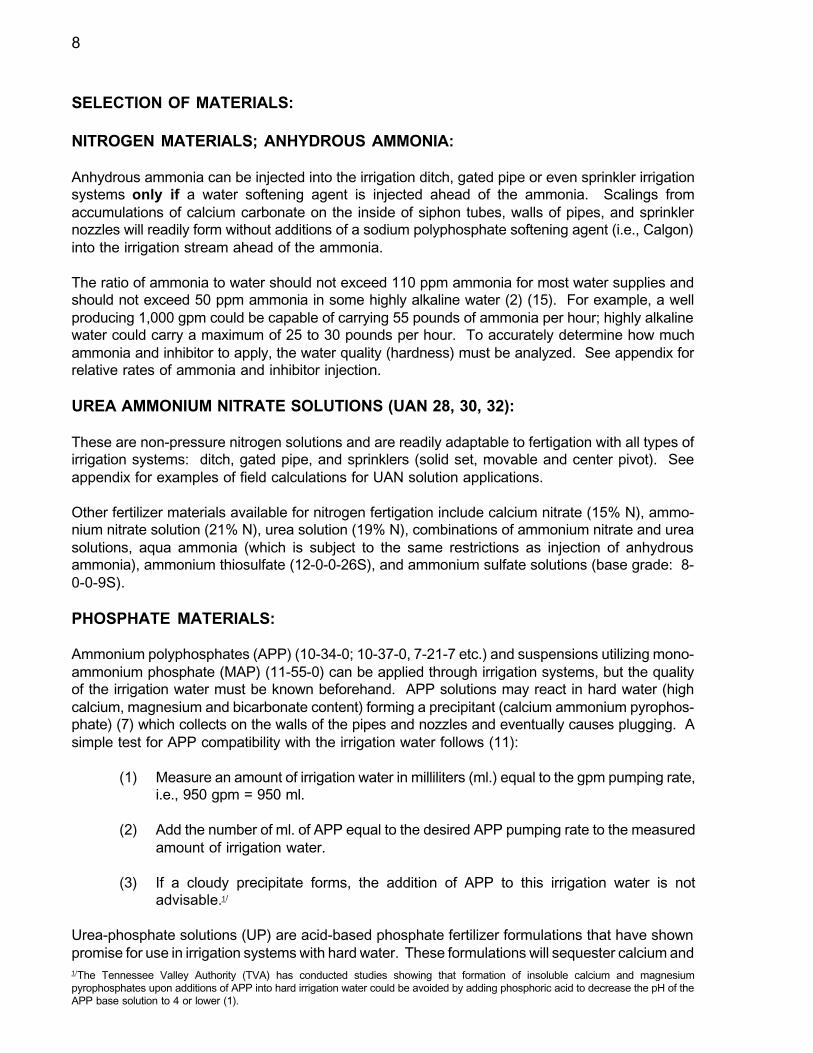
Table 4.Suggested Fertigation Schedule For Corn and Grain Sorghum
WEEKS AFTER EMERGENCE
Haxtun Loamy SandNunn Clay Loam
1 2 3 4 5 6 7 8 9 10 11 12 13 14 15
X X
X
X
X
X
X
X
XX
X
X
X
X
X
X
X
X
X
***
: N-K-S solution as 20-0-3-4S: first two applications may be sidedressed.
: Phosphate materials (10-34-0 or 11-55-0) as rescue in sandy soils only.
: Magnesim materal (chelate or FloMag®) applied with N-K-S solution above.
: Zinc material (chelate formulations) applied as rescue in sandy soils only.
: Boron material (Solubor®) applied along with N-K-S solution above.
: Best applied in a starter.
: Calcium needs are best met through liming material applied prior to planting. However,supplemental Ca needs during weeks 5-9 can be met by using Promesol®, or calcium nitrate.Check for fertilizer formulation compatibility anytime calcium products are added to thefertilizer formulation. Calcium is not compatible with phosphorous or sulfur products.
NPKMgCa**SZn*Mn*Fe*Cu*B
8
SELECTION OF MATERIALS:
NITROGEN MATERIALS; ANHYDROUS AMMONIA:
Anhydrous ammonia can be injected into the irrigation ditch, gated pipe or even sprinkler irrigationsystems only if a water softening agent is injected ahead of the ammonia. Scalings fromaccumulations of calcium carbonate on the inside of siphon tubes, walls of pipes, and sprinklernozzles will readily form without additions of a sodium polyphosphate softening agent (i.e., Calgon)into the irrigation stream ahead of the ammonia.
The ratio of ammonia to water should not exceed 110 ppm ammonia for most water supplies andshould not exceed 50 ppm ammonia in some highly alkaline water (2) (15). For example, a wellproducing 1,000 gpm could be capable of carrying 55 pounds of ammonia per hour; highly alkalinewater could carry a maximum of 25 to 30 pounds per hour. To accurately determine how muchammonia and inhibitor to apply, the water quality (hardness) must be analyzed. See appendix forrelative rates of ammonia and inhibitor injection.
UREA AMMONIUM NITRATE SOLUTIONS (UAN 28, 30, 32):
These are non-pressure nitrogen solutions and are readily adaptable to fertigation with all types ofirrigation systems: ditch, gated pipe, and sprinklers (solid set, movable and center pivot). Seeappendix for examples of field calculations for UAN solution applications.
Other fertilizer materials available for nitrogen fertigation include calcium nitrate (15% N), ammo-nium nitrate solution (21% N), urea solution (19% N), combinations of ammonium nitrate and ureasolutions, aqua ammonia (which is subject to the same restrictions as injection of anhydrousammonia), ammonium thiosulfate (12-0-0-26S), and ammonium sulfate solutions (base grade: 8-0-0-9S).
PHOSPHATE MATERIALS:
Ammonium polyphosphates (APP) (10-34-0; 10-37-0, 7-21-7 etc.) and suspensions utilizing mono-ammonium phosphate (MAP) (11-55-0) can be applied through irrigation systems, but the qualityof the irrigation water must be known beforehand. APP solutions may react in hard water (highcalcium, magnesium and bicarbonate content) forming a precipitant (calcium ammonium pyrophos-phate) (7) which collects on the walls of the pipes and nozzles and eventually causes plugging. Asimple test for APP compatibility with the irrigation water follows (11):
(1) Measure an amount of irrigation water in milliliters (ml.) equal to the gpm pumping rate,i.e., 950 gpm = 950 ml.
(2) Add the number of ml. of APP equal to the desired APP pumping rate to the measuredamount of irrigation water.
(3) If a cloudy precipitate forms, the addition of APP to this irrigation water is notadvisable.1/
Urea-phosphate solutions (UP) are acid-based phosphate fertilizer formulations that have shownpromise for use in irrigation systems with hard water. These formulations will sequester calcium and1/The Tennessee Valley Authority (TVA) has conducted studies showing that formation of insoluble calcium and magnesiumpyrophosphates upon additions of APP into hard irrigation water could be avoided by adding phosphoric acid to decrease the pH of theAPP base solution to 4 or lower (1).
9
magnesium preventing formation of precipitate in the irrigation water (1). Base solutions made fromUP and water resulting in an 8-20-0 grade have a pH of 1.5, made by dissolving crystalline UP inwater with added head (125½ F: dissolution time of five minutes; heat of 150½ F allows dissolutionin one minute). Studies conducted by TVA with two relatively hard irrigation waters (the RepublicanRiver near Culbertson, Nebraska, and the Colorado River in Colorado) using a UP 8-20-0 solutionshowed no precipitation difficulties (1). Resulting pH of the applied irrigation water was 7.0 and 6.8,respectively. For practical use in irrigation systems, about 800 gallons of water per pound of P
2O
5
per acre should be applied. This rate of application in hard water is possible using UP 8-20-0 basesolution, while in the same waters only 25 gallons of water per pound of P
2O
5 can be applied without
precipitation problems using APP 10-34-0 (1).
See appendix for information on fertigation worksheets for application of N, P and K solutions andsuspensions through center pivot systems.
POTASSIUM AND MAGNESIUM MATERIALS:
Potassium is available in some clear solutions (i.e., 3-18-18, 9-18-9, 7-21-7, etc.). However, whenpotassium is generally applied through irrigation systems (center pivot units), it is needed withoutaccompanying phosphorus. So applying potassium, as KCl (0-0-62) through irrigation watergenerally requires premixing solutions or suspensions of potassium fertilizer materials. Develop-ment of potassium thiosulfate (KTS: 0-0-25-17S), a clear solution, has lent considerable flexibilityin formulating solutions of soluble potassium with a variety of fertilizer materials with minimal mixing.Potassium nitrate is also another highly soluble, flexible-use potassium material available forfertigation purposes.
Additions of KCl, water and UAN 28/32 solution can be easily made with a minimum of mixing timerequired. A typical analysis of this solution would be a 20-0-3. Where higher analysis potash mixesare needed, suspensions requiring clay must be made. A 60 percent KCl suspension made fromwater, clay, UAN 32 and KCL making a final analysis of 12-0-25 is possible. See appendix onsuspension formulations and conditions.
Magnesium applications through irrigation water have been generally restricted due to mixing andsolubility problems of magnesium, either as a sulfate of potash magnesia or as magnesium oxide.One of the problems is that successfully suspending magnesium materials requires a strict mixingorder to first get a good gel strength with clay, or using a special liquid clay for gelling strength, inaddition to properly adding the magnesium and other fertilizer materials in the correct order.Improper suspension formulation utilizing magnesium fertilizer materials such as sulfate of potashmagnesia or magnesium oxide can turn extremely viscous and, in effect, nonflowable, due tomagnesium hydration of the suspension (loss of water in the mix) (6, 20). Higher quality MgOmaterials are currently available which enable flowable suspension formulations of magnesiumwithout associated hydration problems in the mix (16), only if proper procedures are followed in thesuspension formulation process. See appendix (Table A-20) for example suspension formulationsinvolving MgO. MgSO
4 can also be utilized as a magnesium source, but because of its hygroscopic
properties (takes on water from the air) and high cost, use on a wide basis is restricted. Magnesiumhas been applied through sprinkler systems as a chelate solution containing 2 1/2 percent Mg (23).However, meeting total magnesium requirements via sprinkler irrigation using magnesium chelatesolutions may not be economically feasible, especially on sandy soils.
SULFUR MATERIALS:
Suitable sulfur sources include ammonium thiosulfate (12-0-0-26S: fluid), potassium thiosulfate (0-0-25-17S: fluid) ammonium sulfate (21-0-0-24S: dry), ammonium sulfate solution (8-0-0-9S), andfinely divided elemental sulfur (92% S).

10
Ammonium thiosulfate (ATS: 12-0-0-26S) and potassium thiosulfate (KTS: 0-0-25-17S) are highlycompatible fluid nitrogen-sulfur, potassium-sulfur materials having both elemental and sulfatesulfur in the formulation. ATS-UAN and KTS-UAN combinations will do better yield-wise than UANalone, due to the ATS/KTS effect of reducing free ammonia loss from the UAN (10). As little as 2percent ATS/KTS in UAN (by volume) gives the effect; however, through irrigation water 10 percentATS/KTS in UAN (by volume) would be recommended as a minimum.
Ammonium sulfate (21-0-0-24S) is a dry, granular material, but will readily dissolve in water or UANmixtures to yield an 8-0-0-9S solution. UAN-ammonium sulfate combinations are highly compatibleand premixing and storage have proven to be an effective method of handling ammonium sulfatefor fluid applications. Ammonium sulfate is also available in solution form as an 8-0-0-9S. Seeappendix table A-25 for liquid nitrogen: sulfur grades utilizing both dry and fluid forms of ammoniumsulfate.
Finely divided elemental sulfur (92 percent S) can be utilized in fluid suspension mixtures. However,a very fine sulfur material must be utilized (-200 mesh or 2 or 44 micron size). As with anysuspension, correct formulation is critical in attaining a good, flowable material. Refer to page 80in the appendix: suspension formulation considerations, and specifically table A-22 page 81 of theappendix for guidelines in using elemental sulfur in suspension formulations.
ZINC AND OTHER MICRONUTRIENT MATERIALS:
If these nutrient are to be applied through a sprinkler-type system, formulations should be appliedso that the element can move through the soil (anion form) (10). Chelated micronutrients wouldserve this purpose: ZnEDTA, FeEDHA, CuEDTA. Zinc ammonia complex can be used also, as wellas lignosulfonates and amino acid chelates. Urea-sulfuric and/or urea-phosphoric solutions haveshown effective sequestering capabilities for micronutrient materials. The acidic properties of thesesolutions combined with micronutrients allow less expensive micronutrient materials to be used aswell as enhancing micronutrient availability once applied. Again, other than for zinc applications,little documented work citing crop responses to micronutrients applied via sprinkler-type irrigationsystems has been done (13).
CHEMIGATION:
Herbicides, insecticides, fungicides, and a variety of other pesticides used in control of weeds,insects and disease in crop management are being utilized in sprinkler irrigation systems.Considerations as to EPA approved labels on specific products and State Department of Agriculturerulings on sprinkler-applied chemicals must be assessed before use is legal. Where use isapproved, prime consideration must be given to soil type, the amount of active ingredient per gallonof liquid product, time of day and even time of growing season.
Advantages of applying herbicides and pesticides through center pivot or well-designed solid setirrigation systems include uniformity of a prescription application, timeliness, and chemical incorpo-ration and activation. Research has proven that herbicides and fertilizers can be applied togetherwithout sacrificing efficacy or utilization of materials (7). Combining materials in this manner in oneapplication results in considerable reduction in application cost (Table 5).

11
Table 5.1/
Costs of Conventional and Chemigation Application of Chemicals
Type of Conventionala Chemigateb Water AppliedChemical ($/A) ($/A) (in.)
Fertilizer 2.25 2.25 0.5Herbicide 5.60c 1.80 0.4Insecticide 2.25 0.70 0.15Fungicide 2.25 0.70 0.15Nematicide 5.60c 2.25 0.5
aCost of aircraft or tractor sprayer assumed to be equal.bBased upon operating costs of a 150-acre center pivot (fixed costs charged against irrigation).cIncludes cost of mechanical incorporation.
HERBIGATION (14):
Many herbicides have been demonstrated to selectively control weeds in crops when appliedthrough a well designed and properly functioning sprinkler irrigation system. These includepreemergence agents like alachlor, atrazine, benefin, bensulide, butylate, chloramben, cyanazine,dimethazone, diphenamid, trifluralin, and vernolate. Postemergence herbicides used successfullyvia herbigation include acifloren, bromoxynil, chloramben, fluazifop, halaxyfop, lactofin,naptalam+dinoseb, tridiphane, and xylafop. Trifluralin has also been used successfully as apostemergence treatment in corn for suppression of shattercane and control fo sandbur (appliedprior to 4-leaf stage of corn) (3). Bentazon, glyphosate, imazaquin, MSMA, paraquat, andsethoxydim have also been used, but have shown poor or variable activity.
Crop tolerance to preemergence herbigation has been good to excellent, and crop tolerance topostemergence herbigation has been good also.
Postemergence herbigation results have been encouraging but somewhat variable, most likely dueto herbicide runoff from plant foliage. Currently, postemergence application of herbicides throughsprinkler irrigation is not feasible in less than 0.1 inch or 2,715 gallons/acre of water, exceeding thevolume of water necessary to cause foliage runoff by approximately 28 times. All water soluble orwater-miscible herbicide formulations have generally shown poor activity when appliedpostemergence via herbigation, with the exception of sethoxydim. However, additions ofnonemulsifiable vegetable or petroleum-based oil have been shown to aid in the improvement ofmore consistent postemergence efficacy via herbigation (tridifane activity was not positivelyinfluenced by an oil carrier).
INSECTIGATION (14):
Insectigation was first done in the mid-1970’s using methomyl, a water soluble compound, butcontrol was highly variable. Water soluble oil formulations have since proved to be the most effectivefor use in sprinkler irrigation systems, however, dimethoate, methomyl, and monocrotophos haveproven unsuccessful.
Successful compounds, used as either oil additives or as technical plus oil formulations haveincluded Orthene 75S, Sevin 4-Oil 80S, Furadan 4F, Lorsban 4E technical, cypermethrin technical,diazinon 4E, Kelthane 1.6 EC, Disyston 8E, Thiodan 2E, Pydrin 2.4 EC technical, malathion 4Etechnical, permithrin technical, Comite 6EC, Bolstar 6EC, Larvin 4F oil, and toxaphene 8EC1/Co-chemigation Showing Promise. Dowler, C.C. Solutions Magazine, January, 1985 pp. 36-43.
12
technical. EPA, state, and local regulations will ultimately determine insecticide use throughsprinkler irrigation systems. Table 6 lists the crops treated and insects controlled by insectigationusing oil formulations.
Table 6.Crops Treated and Insects Controlled by Chemigation
Crop Insects ControlledBroccoli, cabbage, cauliflower, collards Cabbage looper, imported cabbage wormCorn, field and sweet Corn earworm, fall armyworm, stink bugs, spider mites, aphidsCotton Boll weevil, caterpillar groupCucumbers, squash Spotted cucumber beetle, picklewormLima beams Stink bugs, corn earwormPeanuts Thrips, leafhoppers, corn earworm, fall armywormSnap beans ThripsSorghum Corn earworm, fall armyworm, stink bugsSouthern peas Pea weevil, lesser cornstalk borerSoybeans Corn earworm, soybean looper, velvetbean caterpillar, stink bugsSpinach Vegetable weevil, leafminer, tarnished plant bugTobacco Caterpillar, aphidsTomatoes Tomato fruitworm, corn earworm, Colorado potato beetleTurnips Diamondback moth, aphids
FUNGIGATION (14):
Fungicides have been applied through overhead sprinkler systems for more than ten years.Successful control of foliar diseases via fungigation include early blight, late blight, and Botrytis vinerot of Irish potato; Cercospora leaf spot and Rhizoctonia crown rot of sugar beet; early and late leafspots of peanut; and white mold of dry beans. However, no studies to date have been conductedusing water-insoluble formulations for foliar disease control.
Several soilborne pathogens have successfully been controlled with metam-sodium appliedthrough overhead irrigation systems. These pathogens include Verticillium wilt of Irish potato;Pythium and Rhizoctonia root rot of collard, spinach and cucumber; pod rot and Verticillium wilt ofpeanut; white rot of onion; and lettuce drop. Fusarium sp. are not controlled by metam-sodium.PCNB and carboxin have been applied through sprinkler irrigation and provided good control ofsouthern stem rot of peanut in Alabama. However, other broad spectrum fungicides, such as methylbromide, have not been applied through sprinkler irrigation.
Fungigation can be an effective means of application especially if treatment on a broadcast basisis called for. However, soil fungicides are usually applied in-furrow or banded over the row andobtaining equivalent concentrations via irrigation water would require three to six times as muchchemical. Therefore, fungigation of soil fungicides on crops in rows of 3 feet or more apart may notbe economically or environmentally advantageous. Fungigation is effective, however, when rowsare close, or if the entire soil surface requires treatment, allowing more uniform distribution andefficacy when applied through overhead irrigation water.
CONSIDERATIONS IN REVIEWING AGENTS PRIOR TO CHEMIGATION (18):
Effective and economically sound benefits from use of some chemicals via chemigation have beendemonstrated for quite some time. However, some crop protection mixtures are not appropriate forchemigation: use of caution and common sense is a foremost consideration. Chemigation can onlybe an acceptable application alternative if it is performed in strict adherence to requirements appliedto other types of crop protection applications. Recommendations follow regarding chemical agenttoxicity ratings and corresponding suitability of their use for chemigation purposes. Economics ofuse or efficacy of application is not the issue in these recommendations but rather safety for humanconsiderations.
13
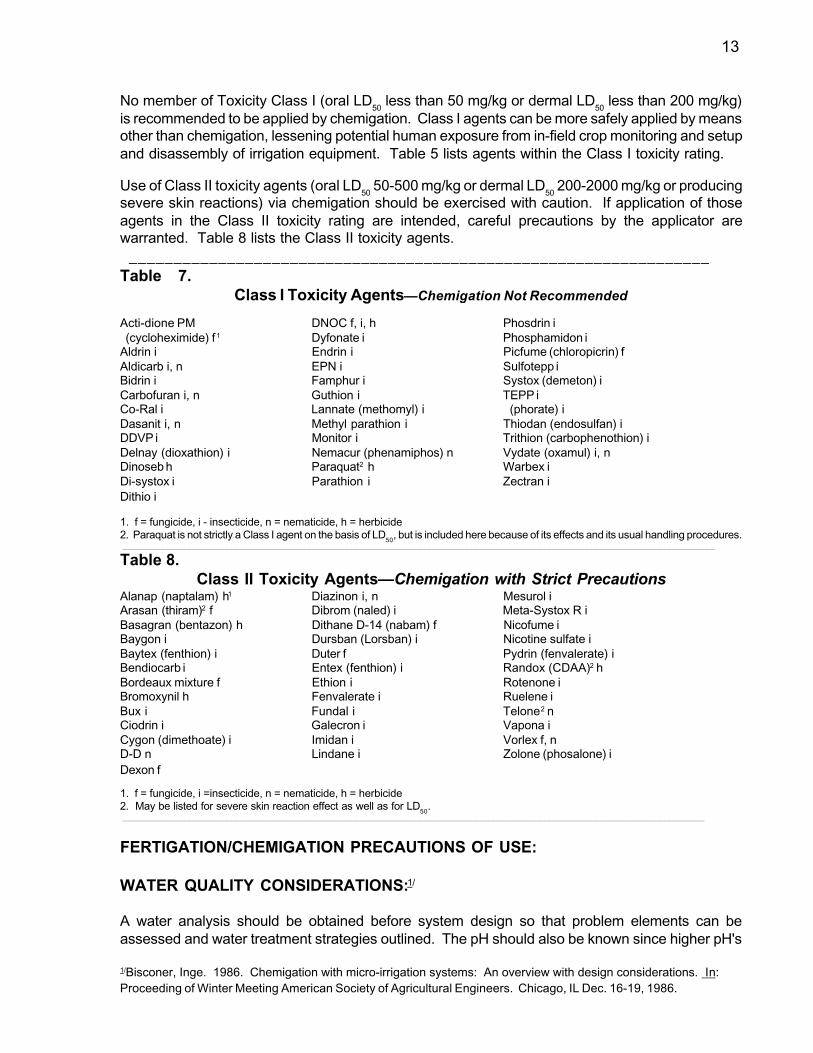
No member of Toxicity Class I (oral LD50
less than 50 mg/kg or dermal LD50
less than 200 mg/kg)is recommended to be applied by chemigation. Class I agents can be more safely applied by meansother than chemigation, lessening potential human exposure from in-field crop monitoring and setupand disassembly of irrigation equipment. Table 5 lists agents within the Class I toxicity rating.
Use of Class II toxicity agents (oral LD50
50-500 mg/kg or dermal LD50
200-2000 mg/kg or producingsevere skin reactions) via chemigation should be exercised with caution. If application of thoseagents in the Class II toxicity rating are intended, careful precautions by the applicator arewarranted. Table 8 lists the Class II toxicity agents.
_________________________________________________________________Table 7.
Class I Toxicity Agents—Chemigation Not Recommended
Acti-dione PM DNOC f, i, h Phosdrin i (cycloheximide) f 1 Dyfonate i Phosphamidon iAldrin i Endrin i Picfume (chloropicrin) fAldicarb i, n EPN i Sulfotepp iBidrin i Famphur i Systox (demeton) iCarbofuran i, n Guthion i TEPP iCo-Ral i Lannate (methomyl) i (phorate) iDasanit i, n Methyl parathion i Thiodan (endosulfan) iDDVP i Monitor i Trithion (carbophenothion) iDelnay (dioxathion) i Nemacur (phenamiphos) n Vydate (oxamul) i, nDinoseb h Paraquat2 h Warbex iDi-systox i Parathion i Zectran iDithio i
1. f = fungicide, i - insecticide, n = nematicide, h = herbicide2. Paraquat is not strictly a Class I agent on the basis of LD
50, but is included here because of its effects and its usual handling procedures.
________________________________________________________________________________________________________________________________________________________________________________________________________________________________________
Table 8.Class II Toxicity Agents—Chemigation with Strict Precautions
Alanap (naptalam) h1 Diazinon i, n Mesurol iArasan (thiram)2 f Dibrom (naled) i Meta-Systox R iBasagran (bentazon) h Dithane D-14 (nabam) f Nicofume iBaygon i Dursban (Lorsban) i Nicotine sulfate iBaytex (fenthion) i Duter f Pydrin (fenvalerate) iBendiocarb i Entex (fenthion) i Randox (CDAA)2 hBordeaux mixture f Ethion i Rotenone iBromoxynil h Fenvalerate i Ruelene iBux i Fundal i Telone2 nCiodrin i Galecron i Vapona iCygon (dimethoate) i Imidan i Vorlex f, nD-D n Lindane i Zolone (phosalone) iDexon f
1. f = fungicide, i =insecticide, n = nematicide, h = herbicide2. May be listed for severe skin reaction effect as well as for LD
50.
____________________________________________________________________________________________________________________________________________________________________________________________________________________________________
FERTIGATION/CHEMIGATION PRECAUTIONS OF USE:
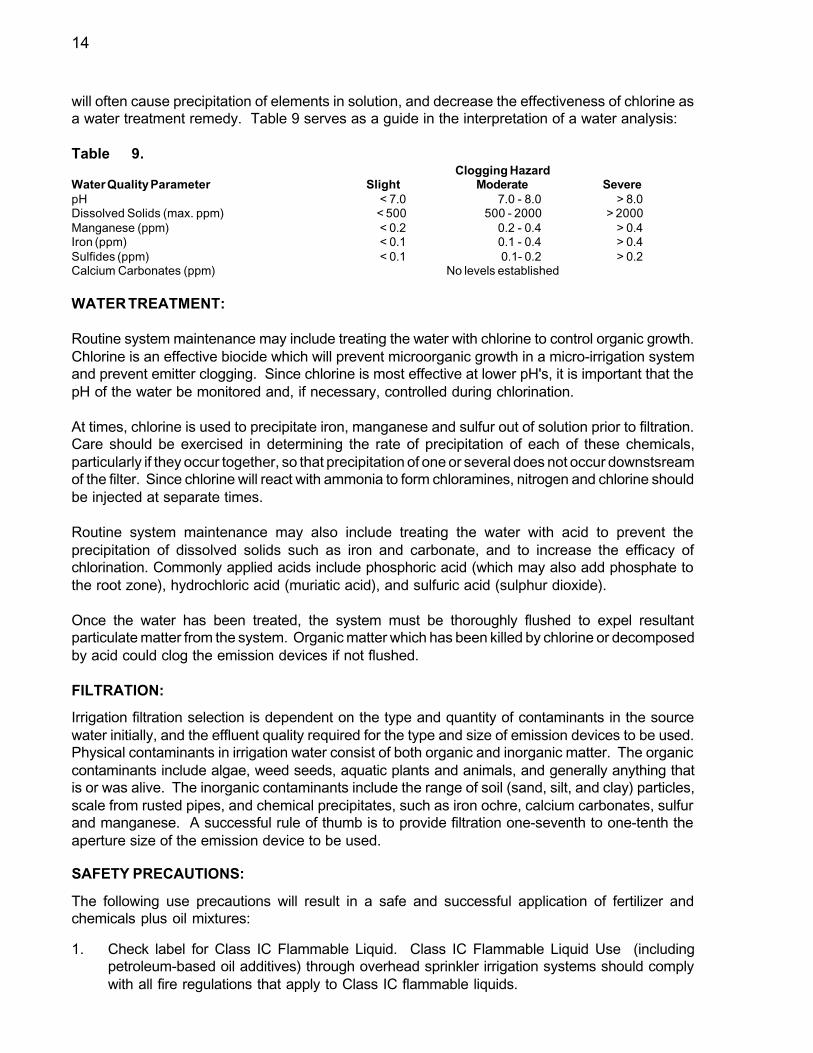
WATER QUALITY CONSIDERATIONS:1/
A water analysis should be obtained before system design so that problem elements can beassessed and water treatment strategies outlined. The pH should also be known since higher pH's
1/Bisconer, Inge. 1986. Chemigation with micro-irrigation systems: An overview with design considerations. In:Proceeding of Winter Meeting American Society of Agricultural Engineers. Chicago, IL Dec. 16-19, 1986.
14
will often cause precipitation of elements in solution, and decrease the effectiveness of chlorine asa water treatment remedy. Table 9 serves as a guide in the interpretation of a water analysis:
Table 9.Clogging Hazard
Water Quality Parameter Slight Moderate SeverepH < 7.0 7.0 - 8.0 > 8.0Dissolved Solids (max. ppm) < 500 500 - 2000 > 2000Manganese (ppm) < 0.2 0.2 - 0.4 > 0.4Iron (ppm) < 0.1 0.1 - 0.4 > 0.4Sulfides (ppm) < 0.1 0.1- 0.2 > 0.2Calcium Carbonates (ppm) No levels established
WATER TREATMENT:
Routine system maintenance may include treating the water with chlorine to control organic growth.Chlorine is an effective biocide which will prevent microorganic growth in a micro-irrigation systemand prevent emitter clogging. Since chlorine is most effective at lower pH's, it is important that thepH of the water be monitored and, if necessary, controlled during chlorination.
At times, chlorine is used to precipitate iron, manganese and sulfur out of solution prior to filtration.Care should be exercised in determining the rate of precipitation of each of these chemicals,particularly if they occur together, so that precipitation of one or several does not occur downstsreamof the filter. Since chlorine will react with ammonia to form chloramines, nitrogen and chlorine shouldbe injected at separate times.
Routine system maintenance may also include treating the water with acid to prevent theprecipitation of dissolved solids such as iron and carbonate, and to increase the efficacy ofchlorination. Commonly applied acids include phosphoric acid (which may also add phosphate tothe root zone), hydrochloric acid (muriatic acid), and sulfuric acid (sulphur dioxide).
Once the water has been treated, the system must be thoroughly flushed to expel resultantparticulate matter from the system. Organic matter which has been killed by chlorine or decomposedby acid could clog the emission devices if not flushed.
FILTRATION:
Irrigation filtration selection is dependent on the type and quantity of contaminants in the sourcewater initially, and the effluent quality required for the type and size of emission devices to be used.Physical contaminants in irrigation water consist of both organic and inorganic matter. The organiccontaminants include algae, weed seeds, aquatic plants and animals, and generally anything thatis or was alive. The inorganic contaminants include the range of soil (sand, silt, and clay) particles,scale from rusted pipes, and chemical precipitates, such as iron ochre, calcium carbonates, sulfurand manganese. A successful rule of thumb is to provide filtration one-seventh to one-tenth theaperture size of the emission device to be used.
SAFETY PRECAUTIONS:
The following use precautions will result in a safe and successful application of fertilizer andchemicals plus oil mixtures:
1. Check label for Class IC Flammable Liquid. Class IC Flammable Liquid Use (includingpetroleum-based oil additives) through overhead sprinkler irrigation systems should complywith all fire regulations that apply to Class IC flammable liquids.
15
2. Minimum distances between injection equipment, tanks and electrical ignition sources,proper electrical construction are essential to safely handle any pesticide formulationcontaining petroleum-based oil (non-emulsifiable) through center pivots. Electrical installa-tions must meet Class I, Group D, Division 1 or 2 requirements as specified in the NationalElectrical Code 70 (NEC 70). This type of wiring is generally referred to as explosion proof.Consult with a certified electrician to correctly wire the injection system as defined by NEC 70for hazardous area applications.
If insecticide is diluted with at least 2 parts water, the chemical injector motor and wiring need notbe explosion proof. Non-explosion proof electrical equipment must either be outside the hazardzone or disconnected from the power source while making the dilution.
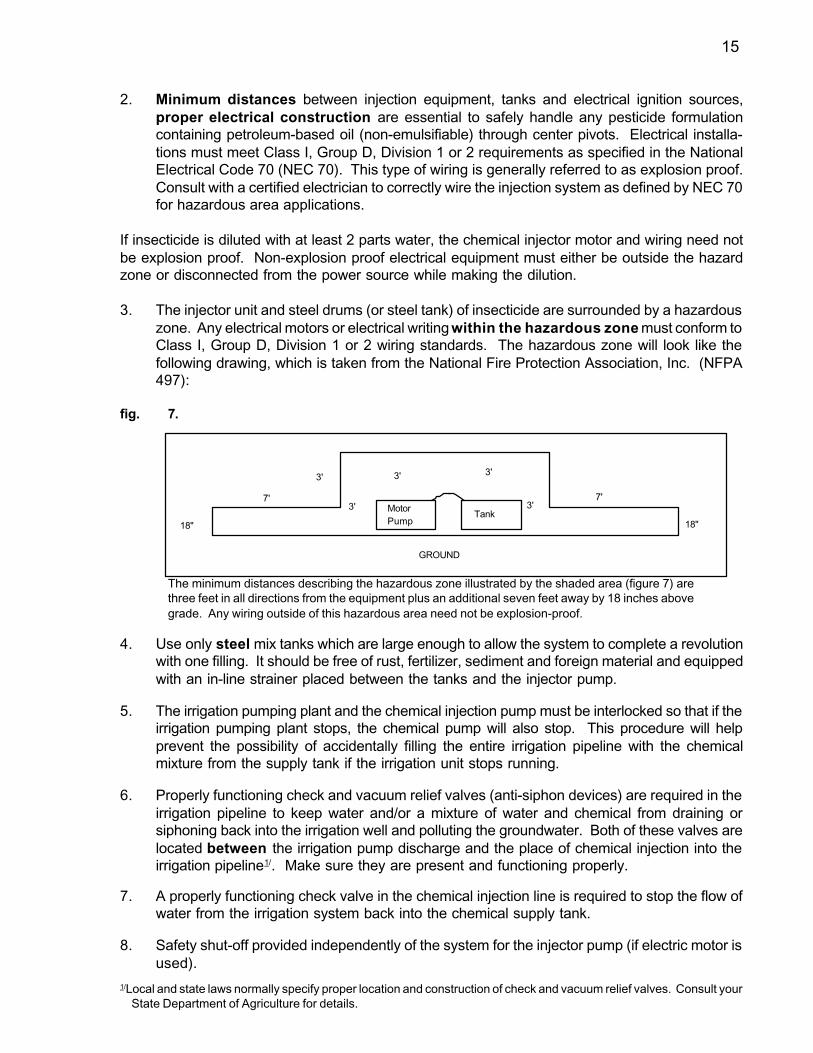
3. The injector unit and steel drums (or steel tank) of insecticide are surrounded by a hazardouszone. Any electrical motors or electrical writing within the hazardous zone must conform toClass I, Group D, Division 1 or 2 wiring standards. The hazardous zone will look like thefollowing drawing, which is taken from the National Fire Protection Association, Inc. (NFPA497):
fig. 7.
The minimum distances describing the hazardous zone illustrated by the shaded area (figure 7) arethree feet in all directions from the equipment plus an additional seven feet away by 18 inches abovegrade. Any wiring outside of this hazardous area need not be explosion-proof.
4. Use only steel mix tanks which are large enough to allow the system to complete a revolutionwith one filling. It should be free of rust, fertilizer, sediment and foreign material and equippedwith an in-line strainer placed between the tanks and the injector pump.
5. The irrigation pumping plant and the chemical injection pump must be interlocked so that if theirrigation pumping plant stops, the chemical pump will also stop. This procedure will helpprevent the possibility of accidentally filling the entire irrigation pipeline with the chemicalmixture from the supply tank if the irrigation unit stops running.
6. Properly functioning check and vacuum relief valves (anti-siphon devices) are required in theirrigation pipeline to keep water and/or a mixture of water and chemical from draining orsiphoning back into the irrigation well and polluting the groundwater. Both of these valves arelocated between the irrigation pump discharge and the place of chemical injection into theirrigation pipeline1/. Make sure they are present and functioning properly.
7. A properly functioning check valve in the chemical injection line is required to stop the flow ofwater from the irrigation system back into the chemical supply tank.
8. Safety shut-off provided independently of the system for the injector pump (if electric motor isused).
1/Local and state laws normally specify proper location and construction of check and vacuum relief valves. Consult yourState Department of Agriculture for details.
MotorPump
Tank
GROUND
18"
7'
3'
3'
3' 3'
3'7'
18"

16
9. A positive displacement pump is required to provide uniform injection into the water line. Theinjection pump must provide a greater pressure than that of the irrigation system at the pointof injection. The pump must contain Viton seals and all electrical service must meet NationalFire Protection Association 30 (NFPA 30) and NEC 70.
10. To ensure uniform mixing of the pesticide into the water line, inject the mixture into the fertilizerinjection port of just ahead of an elbow or tee in the irrigation line so that the turbulence createdat those points will assist in mixing. It is suggested that the injection port be higher than thepesticide tank to prevent siphoning.
11. Do not apply a pesticide solution when wind speed or direction results in unacceptable driftfrom the application area.
12. Do not allow irrigation runoff to collect or runoff and pose a hazard to livestock, wells, oradjoining crops.
13. Allow foliage to dry before reentering fields.
14. When transferring pesticide formulations from the container to the steel tank, be sure todisconnect the pump and injector from the electrical source and be sure that the electricalsource is at least ten feet away and 18 inches off the ground in any direction from the injectionunit and tank.
15. Use nylon or xylene resistant hoses.
16. Apply through systems with uniform water distribution.
CHEMIGATION SYSTEM DESIGN:1/
Chemigation systems must incorporate proper safety and injection equipment. The followingpresents some guidelines in equipment selection and system design.
SAFETY EQUIPMENT:
The importance of incorporating proper safety equipment in a chemigation system design cannotbe over-stressed. Two specific hazards are: (1) the irrigation pumping plant may shut down frommechanical or electrical failure while the injection equipment continues to operate, causing a mixtureof water and chemicals to backflow into the irrigation well or other water source, or possibly causingchemicals to empty unnecessarily into the irrigation system, and (2) the chemical injection systemmay stop while the irrigation pump continues to operate, causing water to backflow through thechemical supply tank and overflow onto the ground. Two strategies used to prevent these hazardsare backflow prevention devices and interlock injection devices. Figures 8 and 9 illustrate safechemigation system design.
Although chemigation poses some inherent dangers, it should be noted that proper chemigation ina micro-irrigation system has the potential of enhancing safety conditions. First, the risk ofgroundwater pollution and environmental contamination are reduced by virtue of its precision.Second, lesser amounts of less toxic chemicals are often applied through a system which decreasesthe exposure and number of individuals involved with conventional pesticide application.
1/ Bisconer, Inge. 1986. Chemigation with micro-irrigation systems: An overview with design considerations. In:Proceedings of Winter Meeting American Society of Agricultural Engineers. Chicago, IL Dec 16-19, 1986.
17
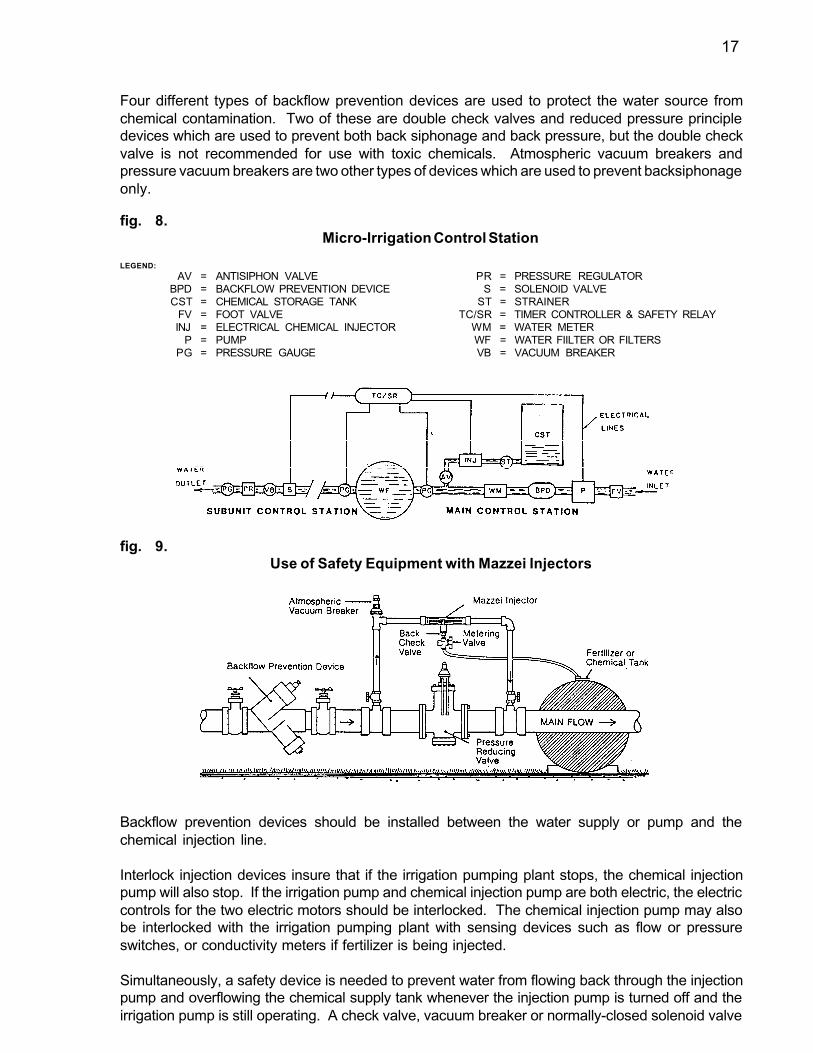
Four different types of backflow prevention devices are used to protect the water source fromchemical contamination. Two of these are double check valves and reduced pressure principledevices which are used to prevent both back siphonage and back pressure, but the double checkvalve is not recommended for use with toxic chemicals. Atmospheric vacuum breakers andpressure vacuum breakers are two other types of devices which are used to prevent backsiphonageonly.
fig. 8.Micro-Irrigation Control Station
LEGEND:
AV = ANTISIPHON VALVE PR = PRESSURE REGULATORBPD = BACKFLOW PREVENTION DEVICE S = SOLENOID VALVECST = CHEMICAL STORAGE TANK ST = STRAINER
FV = FOOT VALVE TC/SR = TIMER CONTROLLER & SAFETY RELAYINJ = ELECTRICAL CHEMICAL INJECTOR WM = WATER METER
P = PUMP WF = WATER FIILTER OR FILTERSPG = PRESSURE GAUGE VB = VACUUM BREAKER
fig. 9.Use of Safety Equipment with Mazzei Injectors
Backflow prevention devices should be installed between the water supply or pump and thechemical injection line.
Interlock injection devices insure that if the irrigation pumping plant stops, the chemical injectionpump will also stop. If the irrigation pump and chemical injection pump are both electric, the electriccontrols for the two electric motors should be interlocked. The chemical injection pump may alsobe interlocked with the irrigation pumping plant with sensing devices such as flow or pressureswitches, or conductivity meters if fertilizer is being injected.
Simultaneously, a safety device is needed to prevent water from flowing back through the injectionpump and overflowing the chemical supply tank whenever the injection pump is turned off and theirrigation pump is still operating. A check valve, vacuum breaker or normally-closed solenoid valve
18
can be placed in the injection line after the injection pump. A solenoid valve will provide a positiveshutoff on the chemical injection line so that neither the chemical nor the water can flow in eitherdirection if the chemical injection pump stops. An electric solenoid valve must be electricallyconnected with the motor driving the electrical injection pump and electrically interlocked with theirrigation pump.
INJECTION EQUIPMENT:
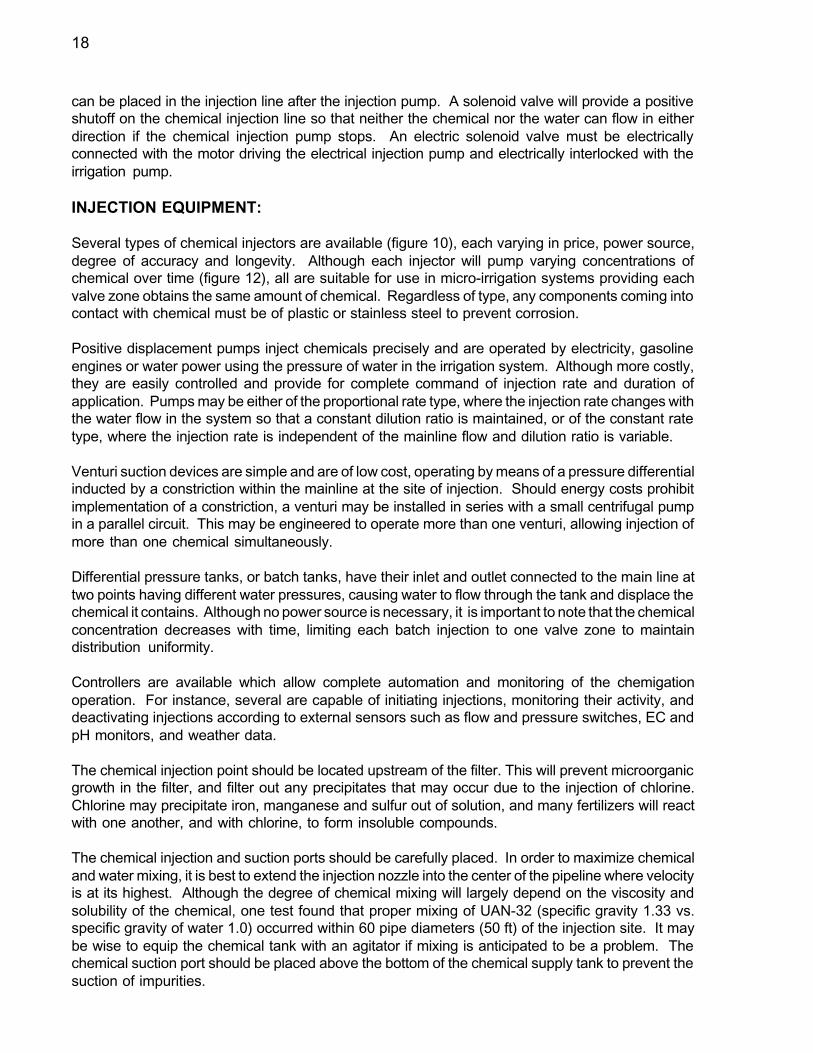
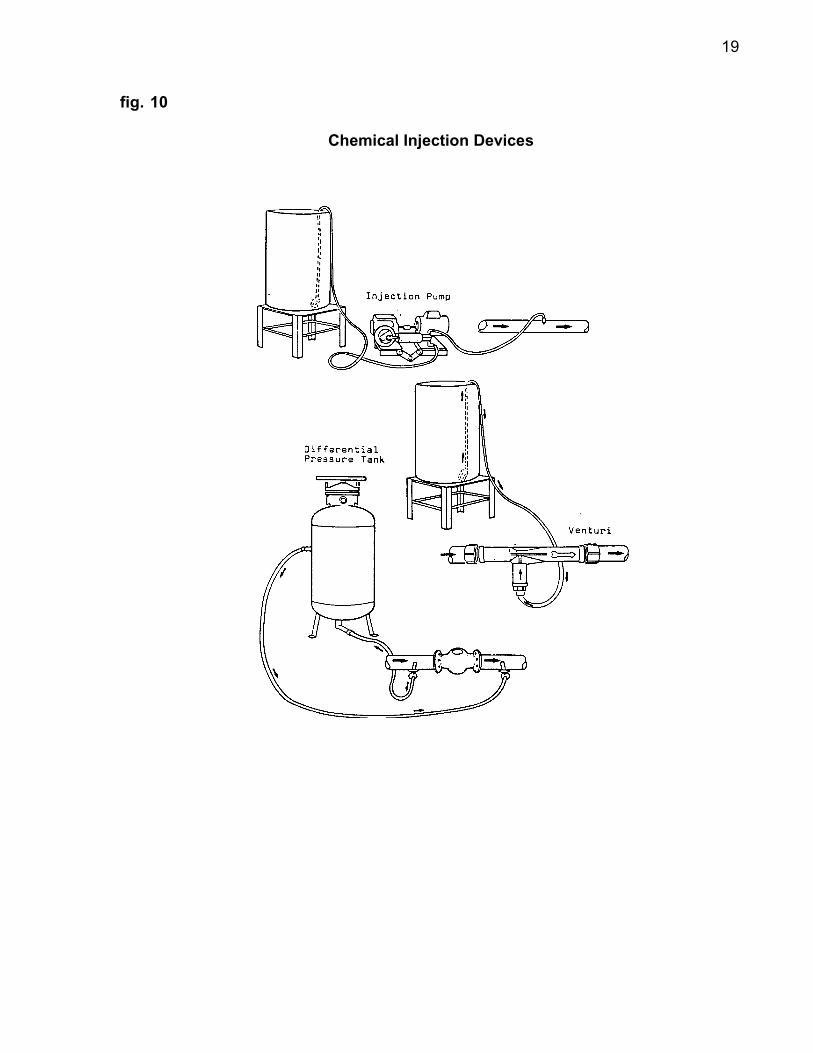
Several types of chemical injectors are available (figure 10), each varying in price, power source,degree of accuracy and longevity. Although each injector will pump varying concentrations ofchemical over time (figure 12), all are suitable for use in micro-irrigation systems providing eachvalve zone obtains the same amount of chemical. Regardless of type, any components coming intocontact with chemical must be of plastic or stainless steel to prevent corrosion.
Positive displacement pumps inject chemicals precisely and are operated by electricity, gasolineengines or water power using the pressure of water in the irrigation system. Although more costly,they are easily controlled and provide for complete command of injection rate and duration ofapplication. Pumps may be either of the proportional rate type, where the injection rate changes withthe water flow in the system so that a constant dilution ratio is maintained, or of the constant ratetype, where the injection rate is independent of the mainline flow and dilution ratio is variable.
Venturi suction devices are simple and are of low cost, operating by means of a pressure differentialinducted by a constriction within the mainline at the site of injection. Should energy costs prohibitimplementation of a constriction, a venturi may be installed in series with a small centrifugal pumpin a parallel circuit. This may be engineered to operate more than one venturi, allowing injection ofmore than one chemical simultaneously.
Differential pressure tanks, or batch tanks, have their inlet and outlet connected to the main line attwo points having different water pressures, causing water to flow through the tank and displace thechemical it contains. Although no power source is necessary, it is important to note that the chemicalconcentration decreases with time, limiting each batch injection to one valve zone to maintaindistribution uniformity.
Controllers are available which allow complete automation and monitoring of the chemigationoperation. For instance, several are capable of initiating injections, monitoring their activity, anddeactivating injections according to external sensors such as flow and pressure switches, EC andpH monitors, and weather data.
The chemical injection point should be located upstream of the filter. This will prevent microorganicgrowth in the filter, and filter out any precipitates that may occur due to the injection of chlorine.Chlorine may precipitate iron, manganese and sulfur out of solution, and many fertilizers will reactwith one another, and with chlorine, to form insoluble compounds.
The chemical injection and suction ports should be carefully placed. In order to maximize chemicaland water mixing, it is best to extend the injection nozzle into the center of the pipeline where velocityis at its highest. Although the degree of chemical mixing will largely depend on the viscosity andsolubility of the chemical, one test found that proper mixing of UAN-32 (specific gravity 1.33 vs.specific gravity of water 1.0) occurred within 60 pipe diameters (50 ft) of the injection site. It maybe wise to equip the chemical tank with an agitator if mixing is anticipated to be a problem. Thechemical suction port should be placed above the bottom of the chemical supply tank to prevent thesuction of impurities.
19
fig. 10
Chemical Injection Devices

20
fig.11.
Diagram of Metering and Injection Equipment for ApplyingFertilizer in Irrigation Water (4)
21
fig.12.
Chemical Injection Equipment Performance
d) Hydraulic pump
c) Bladder tank
b) Venturi
a) Batch tank

22
If acid is being injected to increase the efficacy of chlorine, note that acid and chlorine should neverbe mixed together in the same tank. Individual tanks and injection heads should be provided for eachchemical, the acid injection site normally being placed upstream of the chlorine.
One possible physical layout for fertigation/chemigation via pivot injection could look like figures 13,14 or 15.
fig. 13.
Anti-Pollution Devices and Arrangement of Valves (Motor Drive)1/ 2/
1/Center-pivot irrigation guidelines. Dow Chemical Company. 134-1048-84.2/Fertigation and the Importance of Anti-Pollution Devices (Part 1). Fischbach, F.E. Solutions Magazine, March-April,1977, pp 8-12.
23
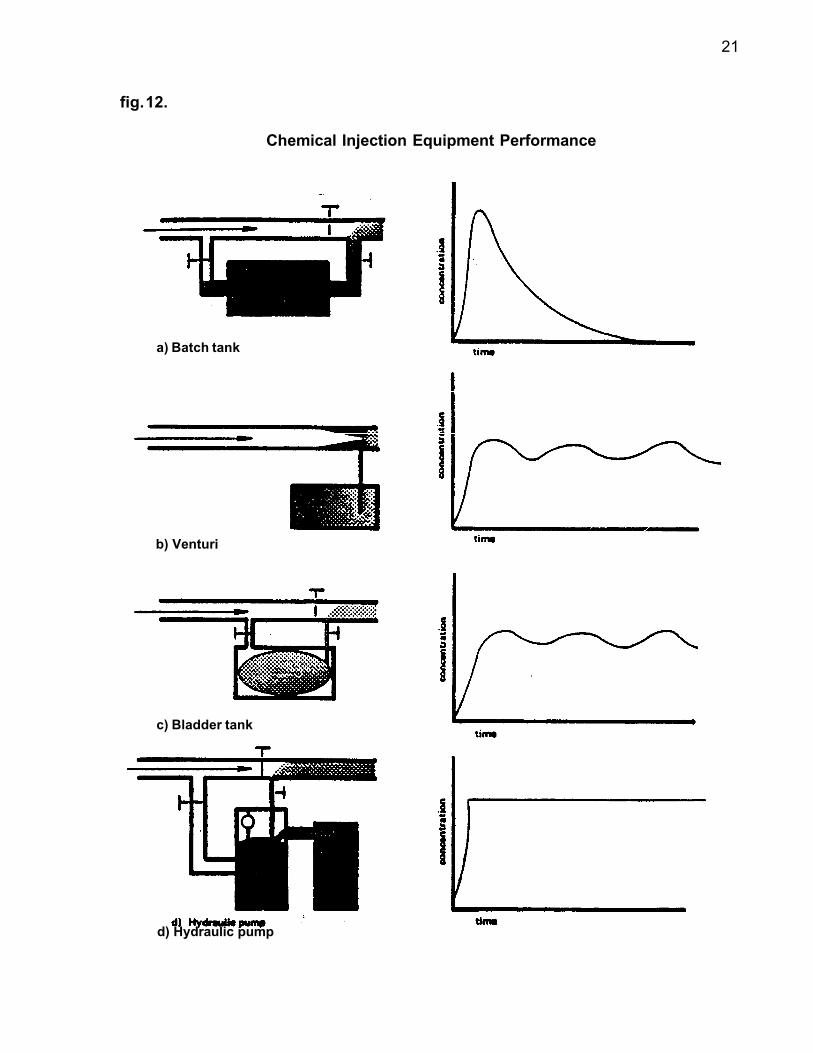
fig. 14. Anti-Pollution Devices and Arrangement of Valves (Engine Drive)1/
fig. 15. Basic Equipment Requirements for Insecticide Injection2/
1/Fertigation and the Importance of Anti-Pollution devices (Part 1). Fischbach, F. E. Solutions Magazine, March-April, 1977,pp 8-12.2/Center-pivot irrigation guidelines. Dow Chemical Company. 134-1048-84.
1. Nurse Tank
The nurse, or holding, tank containing theinsecticide solution should be constructed of acorrosion-resistant steel. Adequate agitationmust be provided by either a mechanical orhydraulic pump to keep the solution suspendedduring the entire period of application.
2. Calibration Tube
Calibration is vital in order to adjust injectionflow rates to conform with recommended pes-ticide application rates. The calibration tubeshould be installed in-line midway between aquarter-turn ball valve and a 50-mesh strainer.
3. Explosion-Proof Motor and Wiring
When insecticide and non-emulsifiable oil areused, all wiring and motors must conform toClass I, Group D, Division 1 or 2 (NEC 70)electrical wiring codes. The equipment unitmust also be at least 10 feet away in anydirection and 18 inches above grade from anelectrical source.
24
When insecticide, oil, and at least 2 parts of water per part of insecticide are “premixed,”the motor and wiring need not be explosion proof, if the unit is outside the hazardous zone orproper disconnect and lock out provisions are made during pesticide concentrate transfer.
4. Injection Pump
A positive-displacement injection pump must be located between the nurse tank and theirrigation pipe. This is necessary to inject the pesticide solution into the pressurized mainlineleading to a center-pivot sprinkler system.
5. Injector Assembly
This assembly is placed at the junction of the pesticide injection line and the water mainline.It is comprised of a ball check valve and a vacuum relief valve. The vacuum brake will preventback-flow contamination of the water source in the event of a system breakdown or a powerfailure. It is suggested that the injection port be higher than the nurse tank to prevent siphoning.
CHEMICAL EFFECTS ON IRRIGATION SYSTEM COMPONENTS
Chemical effects on system components from field experience has indicated that the commonlyused materials such as 28-32 percent UAN solutions, APP and UP solutions and most approvedherbicides, insecticides and fungicides generally do not adversely affect system components.Recommended concentrations of fertilizer materials, although salty, will not damage galvanizedsurfaces, although painted surfaces are more susceptible to fertilizer corrosiveness. Caution shouldbe used in adding solutions that will cause reduction of water pH to 6.5 or lower, as some componentdamage may occur due to increased reactivity/corrosivity of some solutions. Care should be takento flush irrigation systems after chemical applications, and clean out injection pumps and solutiontanks with clean water.
IRRIGATION SYSTEMS FOR DAIRY MANURE1/
The fluid consistency of a particular waste determines the best combination of equipment, energyand labor required for transporting and applying that waste to the land. As dairy manure becomesmore liquid, manure pumps and tank wagons become more effective than bucket loaders and boxspreaders. In many situations, through the addition of process water and runoff or the removal ofsolids, the tanker contains mostly water on its trip to the field. Perhaps it is time to consider a changefrom tanks and tractors to pumps and pipes.
The use of irrigation equipment can save operating time, energy and related costs when movinghighly liquid wastes. For example, the removal of 2 feet of water from a half acre manure storagebasin would require 60 hours and about 250 gallons of fuel utilizing a 30 horsepower manure pumpand 100 horsepower tractor on a 3,000 gallon tank spreader with field trips completed every 30minutes. The same task could be accomplished in 23 hours with 7 man hours and 75 gallons of fuelutilizing traveling gun irrigation equipment with about 30 horsepower on the pump and 14horsepower on the traveler.
Irrigation equipment can provide additional advantages. Soil compacting produced by travelingover the fields with heavy manure spreading equipment is lessened. Irrigation can occur on growingcrops and when soils are wet allowing more available days for waste application which can result
1/Herbert Brodie, P.E., Extension Agricultural Engineer, Department of Agricultural Engineering, University of Maryland.In: Proceedings of the Dairy Manure Management Symposium. Syracuse, New York. February 22-24, 1988. pp. 195-203.
25
in a reduced waste storage requirement than with tank spreaders. Irrigation can be managed toprovide a uniform application of manure nutrients across a field. Soluble nutrients applied throughirrigation are carried into the upper soil layer with the water which reduces the soil surface loss ofammonium nitrogen and lessens the need for covering the waste with soil after spreading. Inaddition to spreading wastes, irrigation equipment can be used to supply water to crops duringdrought.
Irrigation has some disadvantages that must be considered. Spraying liquid manure from storageinto the air may cause considerable odor release. Although the ammonium nitrogen that reachesthe soil infiltrates with little loss, 20 to 30 percent of the ammonium nitrogen can be lost to the airin the spray before it reaches the soil surface. The field is connected to the waste source with amainline pipe which must be moved or duplicated if other fields are to receive irrigated waste.Irrigation cannot occur during freezing weather and equipment must be cleaned, winterized andproperly stored to be ready for the next season. Irrigation must be managed to prevent runoff fromexcessive application rates and to prevent excessive nutrient application. Irrigation equipment cancost as much or more than conventional liquid manure equipment.
WHAT TYPES OF WASTE CAN BE APPLIED THROUGH IRRIGATION EQUIPMENT?
The solids content is the major factor in determining if irrigation can be used to apply the waste.Solids content varies with the animal housing and manure collection system. Waste water frommilking parlors, flushing waste systems, treatment lagoons, runoff holding ponds and unmixedsurface water on open manure storage tanks or pits can be easily pumped through irrigationequipment. Liquid manure less than 15 percent solids content can be pumped through irrigationequipment using special pumps and gun type nozzles. Wastes containing trash, abrasive andstringy material are not suitable for pumping unless preconditioned by separation and/or grinding.
WHAT TYPES OF IRRIGATION EQUIPMENT CAN BE USED?
The type of irrigation equipment to use is dependent on the solids content of the waste, the quantityof waste to move and the size of the area to which the waste is to be applied. The irrigation equipmentmust be matched with the topography of the farm, the infiltration and water storage capacity of thesoils and the cropping patterns.
SURFACE IRRIGATION
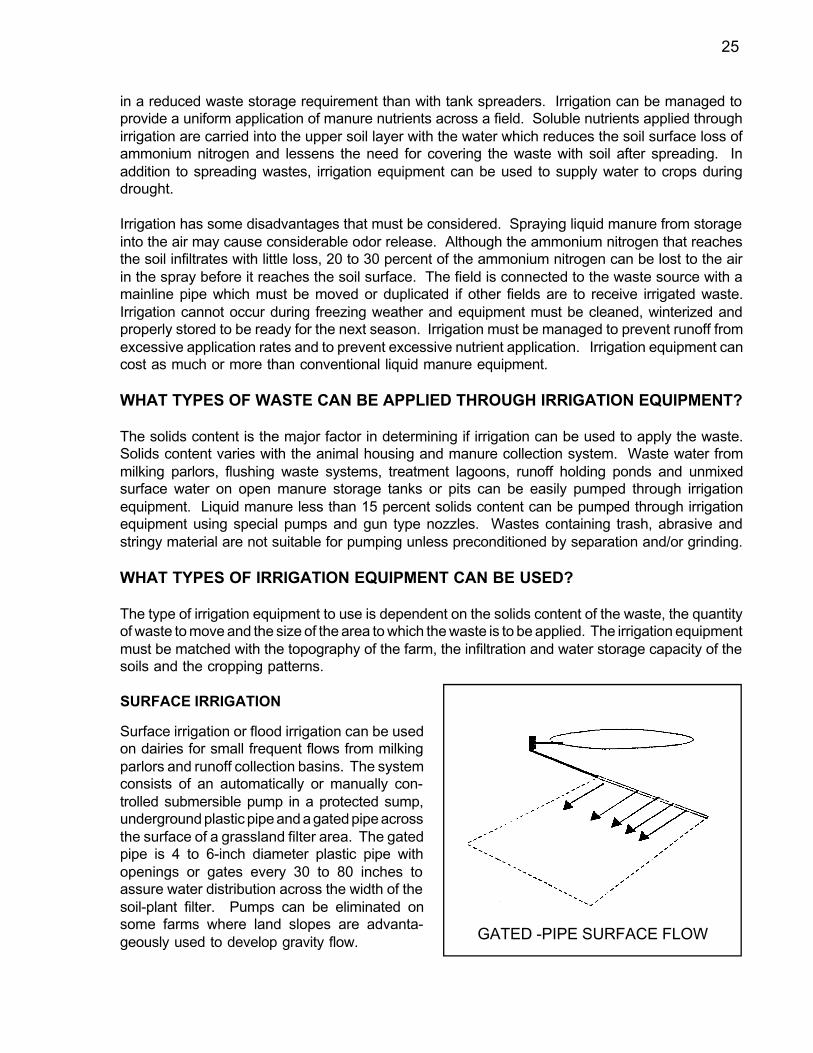
Surface irrigation or flood irrigation can be usedon dairies for small frequent flows from milkingparlors and runoff collection basins. The systemconsists of an automatically or manually con-trolled submersible pump in a protected sump,underground plastic pipe and a gated pipe acrossthe surface of a grassland filter area. The gatedpipe is 4 to 6-inch diameter plastic pipe withopenings or gates every 30 to 80 inches toassure water distribution across the width of thesoil-plant filter. Pumps can be eliminated onsome farms where land slopes are advanta-geously used to develop gravity flow. GATED -PIPE SURFACE FLOW
26
In regions where surface irrigation is a normal cropland practice large volumes of waste can beincluded with the irrigation water. However, waste with high nutrient or solids content will not beuniformly applied to the field, which will prevent optimum nutrient management.
SOLID-SET SPRINKLER IRRIGATION
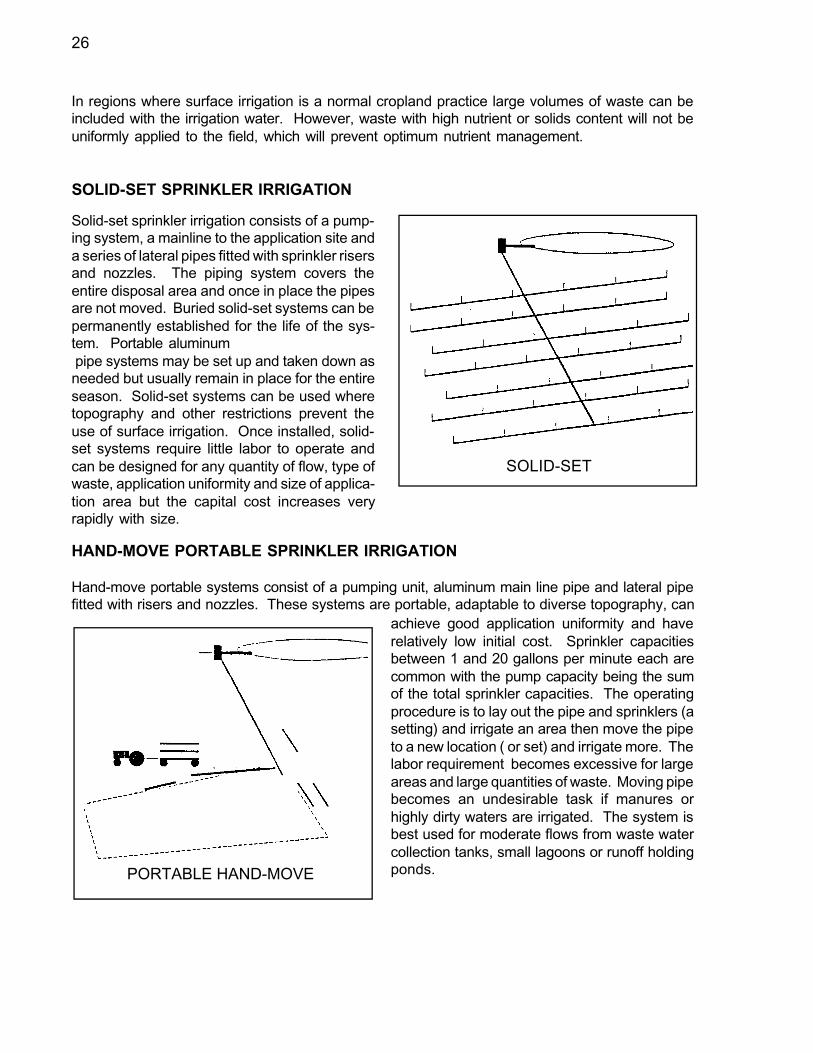
Solid-set sprinkler irrigation consists of a pump-ing system, a mainline to the application site anda series of lateral pipes fitted with sprinkler risersand nozzles. The piping system covers theentire disposal area and once in place the pipesare not moved. Buried solid-set systems can bepermanently established for the life of the sys-tem. Portable aluminum pipe systems may be set up and taken down asneeded but usually remain in place for the entireseason. Solid-set systems can be used wheretopography and other restrictions prevent theuse of surface irrigation. Once installed, solid-set systems require little labor to operate andcan be designed for any quantity of flow, type ofwaste, application uniformity and size of applica-tion area but the capital cost increases veryrapidly with size.
HAND-MOVE PORTABLE SPRINKLER IRRIGATION
Hand-move portable systems consist of a pumping unit, aluminum main line pipe and lateral pipefitted with risers and nozzles. These systems are portable, adaptable to diverse topography, can
achieve good application uniformity and haverelatively low initial cost. Sprinkler capacitiesbetween 1 and 20 gallons per minute each arecommon with the pump capacity being the sumof the total sprinkler capacities. The operatingprocedure is to lay out the pipe and sprinklers (asetting) and irrigate an area then move the pipeto a new location ( or set) and irrigate more. Thelabor requirement becomes excessive for largeareas and large quantities of waste. Moving pipebecomes an undesirable task if manures orhighly dirty waters are irrigated. The system isbest used for moderate flows from waste watercollection tanks, small lagoons or runoff holdingponds.PORTABLE HAND-MOVE
SOLID-SET
27
TOWLINE SPRINKLER IRRIGATION
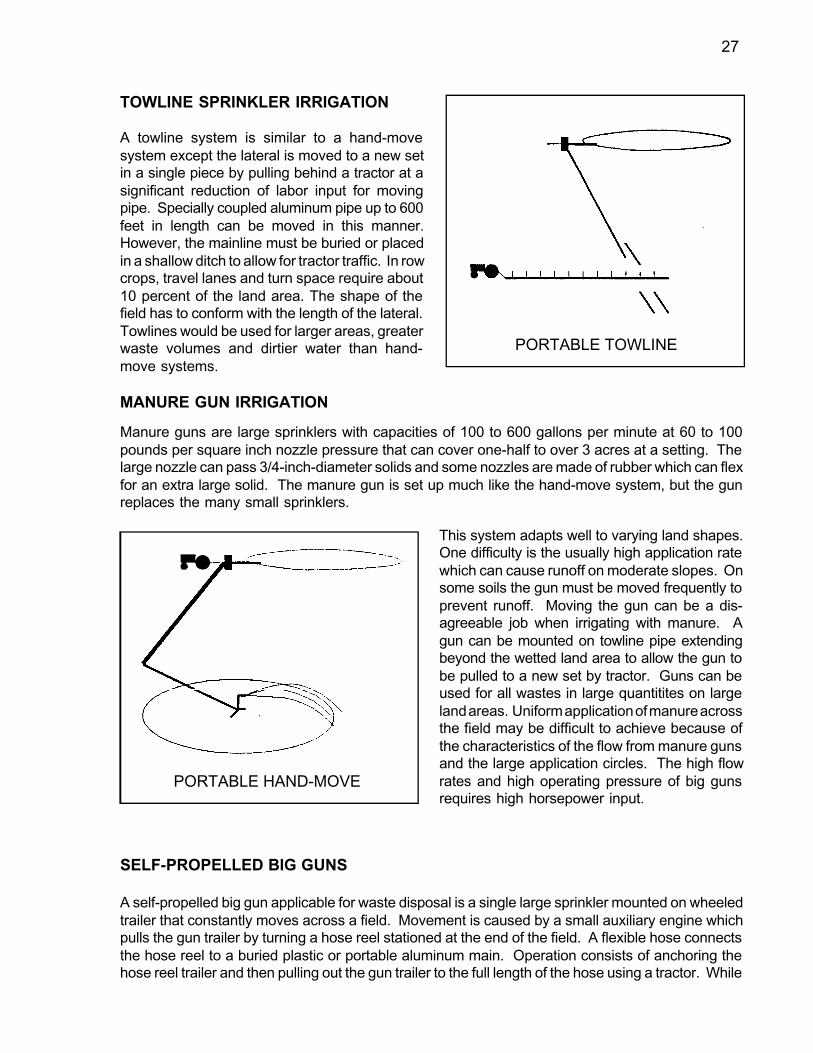
A towline system is similar to a hand-movesystem except the lateral is moved to a new setin a single piece by pulling behind a tractor at asignificant reduction of labor input for movingpipe. Specially coupled aluminum pipe up to 600feet in length can be moved in this manner.However, the mainline must be buried or placedin a shallow ditch to allow for tractor traffic. In rowcrops, travel lanes and turn space require about10 percent of the land area. The shape of thefield has to conform with the length of the lateral.Towlines would be used for larger areas, greaterwaste volumes and dirtier water than hand-move systems.
MANURE GUN IRRIGATION
Manure guns are large sprinklers with capacities of 100 to 600 gallons per minute at 60 to 100pounds per square inch nozzle pressure that can cover one-half to over 3 acres at a setting. Thelarge nozzle can pass 3/4-inch-diameter solids and some nozzles are made of rubber which can flexfor an extra large solid. The manure gun is set up much like the hand-move system, but the gunreplaces the many small sprinklers.
This system adapts well to varying land shapes.One difficulty is the usually high application ratewhich can cause runoff on moderate slopes. Onsome soils the gun must be moved frequently toprevent runoff. Moving the gun can be a dis-agreeable job when irrigating with manure. Agun can be mounted on towline pipe extendingbeyond the wetted land area to allow the gun tobe pulled to a new set by tractor. Guns can beused for all wastes in large quantitites on largeland areas. Uniform application of manure acrossthe field may be difficult to achieve because ofthe characteristics of the flow from manure gunsand the large application circles. The high flowrates and high operating pressure of big gunsrequires high horsepower input.
SELF-PROPELLED BIG GUNS
A self-propelled big gun applicable for waste disposal is a single large sprinkler mounted on wheeledtrailer that constantly moves across a field. Movement is caused by a small auxiliary engine whichpulls the gun trailer by turning a hose reel stationed at the end of the field. A flexible hose connectsthe hose reel to a buried plastic or portable aluminum main. Operation consists of anchoring thehose reel trailer and then pulling out the gun trailer to the full length of the hose using a tractor. While
PORTABLE HAND-MOVE
PORTABLE TOWLINE
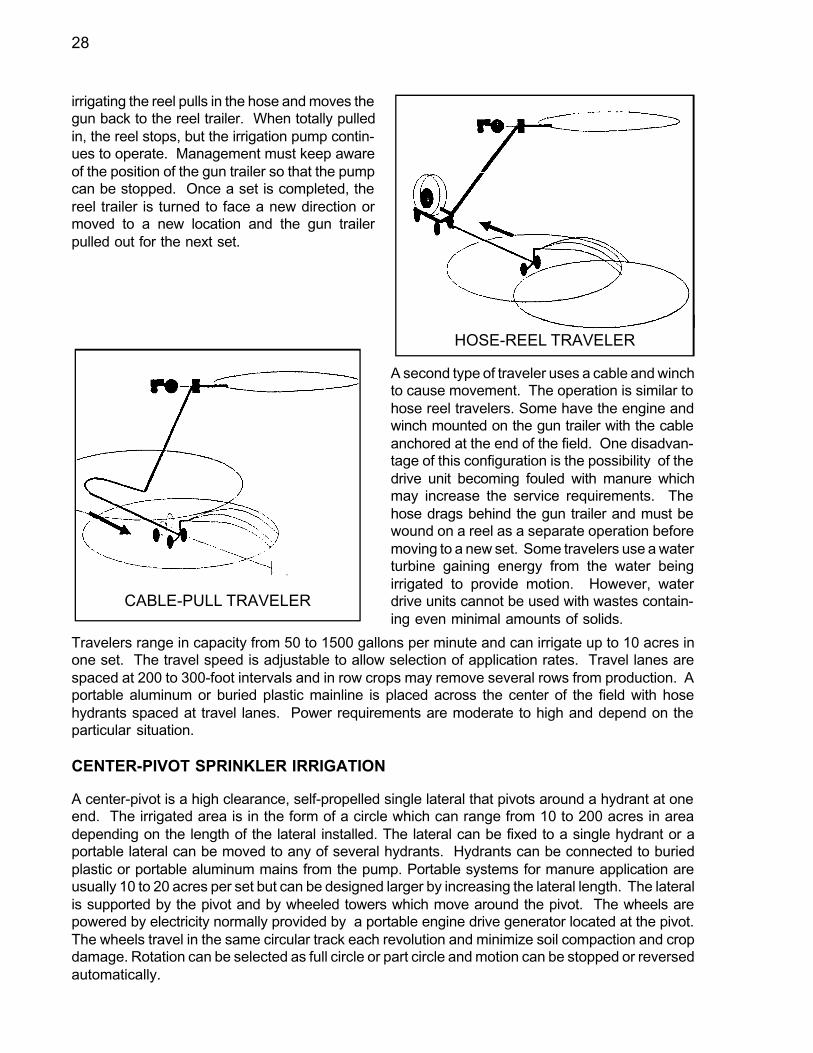
28
irrigating the reel pulls in the hose and moves thegun back to the reel trailer. When totally pulledin, the reel stops, but the irrigation pump contin-ues to operate. Management must keep awareof the position of the gun trailer so that the pumpcan be stopped. Once a set is completed, thereel trailer is turned to face a new direction ormoved to a new location and the gun trailerpulled out for the next set.
Travelers range in capacity from 50 to 1500 gallons per minute and can irrigate up to 10 acres inone set. The travel speed is adjustable to allow selection of application rates. Travel lanes arespaced at 200 to 300-foot intervals and in row crops may remove several rows from production. Aportable aluminum or buried plastic mainline is placed across the center of the field with hosehydrants spaced at travel lanes. Power requirements are moderate to high and depend on theparticular situation.
CENTER-PIVOT SPRINKLER IRRIGATION
A center-pivot is a high clearance, self-propelled single lateral that pivots around a hydrant at oneend. The irrigated area is in the form of a circle which can range from 10 to 200 acres in areadepending on the length of the lateral installed. The lateral can be fixed to a single hydrant or aportable lateral can be moved to any of several hydrants. Hydrants can be connected to buriedplastic or portable aluminum mains from the pump. Portable systems for manure application areusually 10 to 20 acres per set but can be designed larger by increasing the lateral length. The lateralis supported by the pivot and by wheeled towers which move around the pivot. The wheels arepowered by electricity normally provided by a portable engine drive generator located at the pivot.The wheels travel in the same circular track each revolution and minimize soil compaction and cropdamage. Rotation can be selected as full circle or part circle and motion can be stopped or reversedautomatically.
A second type of traveler uses a cable and winchto cause movement. The operation is similar tohose reel travelers. Some have the engine andwinch mounted on the gun trailer with the cableanchored at the end of the field. One disadvan-tage of this configuration is the possibility of thedrive unit becoming fouled with manure whichmay increase the service requirements. Thehose drags behind the gun trailer and must bewound on a reel as a separate operation beforemoving to a new set. Some travelers use a waterturbine gaining energy from the water beingirrigated to provide motion. However, waterdrive units cannot be used with wastes contain-ing even minimal amounts of solids.
CABLE-PULL TRAVELER
HOSE-REEL TRAVELER

29
The lateral can be fitted with impact sprinklers orbig guns arranged to provide a uniform wasteapplication on the irrigated area. The combina-tion of sprinkler or gun design and the variabilityof travel speed provides the ability to select awide range of application rates. The powerrequirement is highly dependent on the systemsize and can be low to moderate for waste waterbut increases rapidly as the solids content of thewaste increases.
Center-pivots require an unobstructed area withinthe arc of travel. Rolling terrain can be irrigatedif the slopes do not exceed 12 percent. Thewheel paths may become deeply rutted in wetareas and require stabilizing fill.
WHAT TYPES OF PUMPS CAN BE USED?
The pump must move the waste at a rate and pressure required of the irrigation system. Solidscontent of the waste is a major consideration in selecting the pump. Generally, the cost and powerrequirements increase as the solids handling capability, flow rate or pressure needs increase. Pumpselection should be at the advice of a professional with knowledge of the particular installationrequirements.
Submersible, low pressure centrifugal pumps are suitable for most surface irrigation systemsreceiving waste water containing occasional solids. Solids handling electric submersible pumpscapable of developing the pressure required of sprinkler irrigation systems usually require more than10 horsepower. Submersible pumps in sumps or tanks are usually provided with a continuous by-pass nozzle to divert some of the flow back to the pump inlet as a method of keeping settled wastesolids in suspension.
Centrifugal closed impeller pumps used for sprinkler irrigation can be applied to wastes that containlimited solids. Accessory equipment is available which grinds solids to fine enough particles to passthrough the pump without clogging. As the solids pumping capability increases, the pump efficiencydeclines requiring increased power input to provide the desired performance.
Progressing cavity pumps (rotary or helical screw) can move manure slurries at the high heads andhigh flows required of big gun systems. These pumps can accept a wide range of solids. However,the pump cannot be operated in a dry condition and abrasive or sharp solid objects should not beallowed to enter the intake because the internal boot of the pump is a rubber material that can bedestroyed. The inlet should be screened to prevent the entrance of solids of greater size than thesprinkler nozzle. Because the pump is positive displacement, a clogged nozzle could result in burstpipes.
The choice of suction inlet screens is dependent on the application. However, the screen shouldonly allow passage of solids that can go through the irrigation system without causing problems. Thescreen should be of the largest total surface area practical to maintain adequate flow to the pump.In some installations it may be advisable to make a mesh fence or trash rack surrounding the suctionsite. Also, a floating square formed from wood lumber will prevent floating objects from moving intothe suction site.
CENTER-PIVOT

30
WHAT KINDS OF POWER UNITS CAN BE USED?
Pumps can be powered with electric motors, stationary internal combustion engines or pto-drivenfrom farm tractors. Electric motors are the most efficient and require the least maintenance, butrequire a source of electricity. Motors over 10 horsepower require 3-phase electric service andspecial demand rates may be established by the power company.
Tractors and stationary engines can be of any fuel type but for long pumping periods diesel unitsare most efficient. The horsepower of the unit must be matched to the pump requirements. Safetycut-off switches that monitor engine and pump operating conditions should be installed to protectthe unit.
WHAT ARE THE MANAGEMENT REQUIREMENTS?
The major management concerns are to apply waste to the soil-plant filter in a manner that preventsrunoff or excessive deep percolation of the waste water and to apply waste nutrients in amounts thatdo not exceed the needs of the crop. These concerns should be addressed in the selection anddesign of the irrigation system as well as during actual operation.
Odors from wastes being applied through sprinkler irrigation can be a major problem. Selectlocations away from neighbors and do not irrigate on days that are hot and humid or when the winddirection is toward neighbors. Do not irrigate on weekends or holidays or near heavily traveled publicroads.
Irrigating with manure slurries should be followed with a 10 to 15-minute flush of clean water to clearmanure solids from the pipes. Deposited solids can corrode metal pipe, cause clogging at the nextirrigation and make moving portable systems difficult because of the added weight and slop. Theflush water will also wash solids off plant leaves and help prevent ammonia burn during hot weather.
Other management items include timely and correct maintenance of equipment as advised by theequipment manufacturer. Winter storage and maintenance are crucial factors in assuring that thesystem will function throughout the next season. Rodent nesting in open pipes or control boxes andundrained pipes that have frozen and burst are common problems associated with lax management.
WHAT WILL AN IRRIGATION SYSTEM COST?
An irrigation system is designed to meet a specific objective based on the soils, topography, distanceto fields, available application time and solids content of the waste to be irrigated. Because of thesefactors and the variety of equipment available, the development of a capital cost for these systems(Table 10) is provided here to understand the relative cost for adoption and may not be represen-tative of the investment required of any particular installation.
SUMMARY
Irrigation equipment can be used to transport and apply highly liquid dairy waste to farm fields withgreater efficiency than liquid tank spreaders. Care must be used in the selection of components tomost favorably match the system capabilities with the farm needs while minimizing the capital andoperating costs. Design should involve consultants, equipment dealers and/or extension agricul-tural engineers with knowledge of utilizing irrigation for waste and nutrient management.

31
Table 10.
Cost of Irrigation Systems for Dairy Waste Management
acres investment labor notestype of system per set cost $ hrs/10 acres
gated-pipegravity 1 2,000 - a, c, jpumped 1 3,000 - a, c, d, j
solid set 1 4,000 - a, c, d, j5 23,000 - a, c, d, j
hand-move 0.5 2,500 7 b, c, d, jtow-line 0.5 3,400 3 b, d, jbig gun 3 8,000 5 b, e, h, jtraveler 10 26,000 1 b, e, g, jcenter-pivot 10 20,000 1 b, e, f, h, j
150 70,000 - a, e, f, i , j
NOTES:a. fixed locationb. can be moved at each irrigation to cover many locations depending on labor and with
increased investment for main pipe.c. not recommended for manure slurriesd. includes separate pump power unite. pto pump included, tractor or stationary power unit not includedf. diesel electric generator set includedg. 200 gpmh. 500 gpmi. 900 gpmj. labor for normal field operation - does not include major repair or initial setup

32
APPENDIX
Subject Page
Fertigation Injection Worksheet for Application of Anhydrous Ammonia ................................................. 34
Injection Procedures for Anhydrous Ammonia and Inhibitor: Gated Pipe and OpenDitch ............................................................................................................................................... 35
Example Calculation of Anhydrous Ammonia Injection .......................................................................... 36
Injection Rates of Anhydrous Ammonia and Inhibitor ............................................................................. 36
Fertigation Injection Worksheet (Fertilizer Solutions/Suspensions) ................................................... 37-38
Example - Calculations of Fertigation Injection Worksheet ..................................................................... 39
Quick Reference Table for Area (Acres) Under Center Pivot Systems of Different
Lengths .......................................................................................................................................... 40Computing Number of Acres Irrigated Per Revolution of Center-Pivot Sprinklers with
Various Length Systems ................................................................................................................. 41
Calibration of Fertilizer Rate Through Sprinkler Irrigation Systems ......................................................... 41
Flow in Gallons Per Minute, Using Orifices of Different Sizes at Various Net Pressures ......................... 42
Variation in Percent of System GPM Due to Change in Pressure ........................................................... 42
Weights of Various Liquid Fertilizer Materials ........................................................................................ 42
Amount of Various Nitrogen Fertilizers Required to Give 20, 30 and 40 Pounds ofAvailable Nitrogen Per Acre ............................................................................................................ 43
Example of Solution Formulations Using Ammonium Thiosulfate ........................................................... 44
Liquid Fertilizer Blend Chart Using Ammonium Thiosulfate as a Sulfur Source ...................................... 45Clear Liquid Nitrogen: Sulfur Formulations Using Ammonium Sulfate (21-0-0-24S)
and Ammonium Sulfate Solution (8-0-0-9S) .................................................................................... 46
Irrigation Water Management Strategies for Selected Field Crops ......................................................... 47
Irrigation Scheduling ....................................................................................................................... 48Guide for Judging How Much Moisture is Available for Crops .......................................................... 49Available Water Capacity and Minimum Moisture Level for Soil Textural Class ................................ 50Alfalfa ........................................................................................................................................ 51-53Corn .......................................................................................................................................... 54-55Cotton........................................................................................................................................ 56-58Grain Sorghum .......................................................................................................................... 59-60Soybeans ....................................................................................................................................... 61Wheat ........................................................................................................................................ 62-63
Calculating Evapotranspiration (ET) ................................................................................................. 64-69
Materials and Agronomics of Secondary and Micronutrients ............................................................. 70-79
Suspension Formulation Considerations .......................................................................................... 80-84
Suspension Formulations Using 3-10-30 Base ................................................................................. 85-86
Suspension Formulations Using 4-12-27 Base ................................................................................. 87-88
Suspension Formulations Using 5-15-30 Base ................................................................................ 89-90

33
Liquid Formulations Using 10-34-0 as the Only P2O5 Source ............................................................ 91-93
Recommended Grades and RatiosUAN 32/10-34-0/4-10-10 ................................................................................................................. 94UAN 28/10-34-0/4-10-10 ................................................................................................................. 94UAN 32/10-34-0/2-6-12 ................................................................................................................... 95UAN 28/10-34-0/2-6-12 ................................................................................................................... 95UAN 32/11-37-0/4-10-10 ................................................................................................................. 96UAN 28/11-37-0/4-10-10 ................................................................................................................. 96UAN 32/11-37-0/2-6-12 ................................................................................................................... 97UAN 28/11-37-0/2-6-12 ................................................................................................................... 97
Typical Formulations that Include 11-37-0 ............................................................................................. 98
Typical Formulations for Liquid Cold Mix Fertilizer Plants................................................................ 99-103
Fertigation/Chemigation Worksheet Schedule ..................................................................................... 104
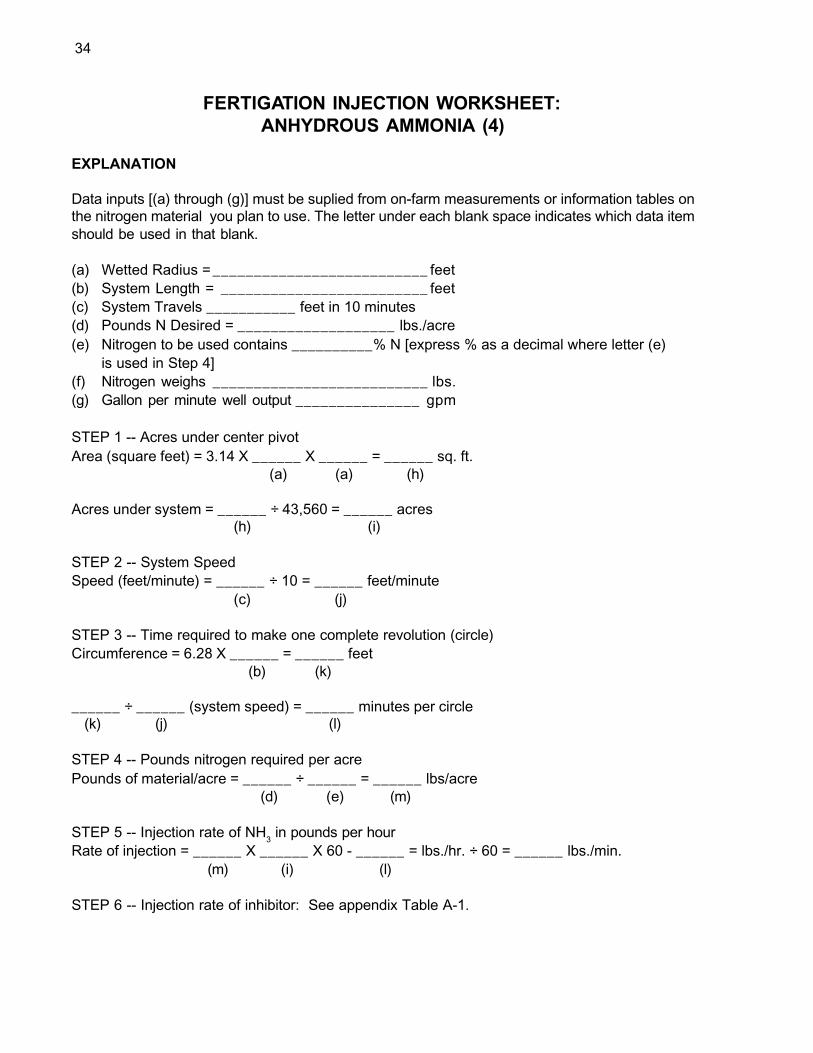
34
FERTIGATION INJECTION WORKSHEET:ANHYDROUS AMMONIA (4)
EXPLANATION
Data inputs [(a) through (g)] must be suplied from on-farm measurements or information tables onthe nitrogen material you plan to use. The letter under each blank space indicates which data itemshould be used in that blank.
(a) Wetted Radius =__________________________ feet(b) System Length = _________________________ feet(c) System Travels ___________ feet in 10 minutes(d) Pounds N Desired = ___________________ lbs./acre(e) Nitrogen to be used contains __________% N [express % as a decimal where letter (e)
is used in Step 4](f) Nitrogen weighs __________________________ lbs.(g) Gallon per minute well output _______________ gpm
STEP 1 -- Acres under center pivotArea (square feet) = 3.14 X ______ X ______ = ______ sq. ft.
(a) (a) (h)
Acres under system = ______ ÷ 43,560 = ______ acres(h) (i)
STEP 2 -- System SpeedSpeed (feet/minute) = ______ ÷ 10 = ______ feet/minute
(c) (j)
STEP 3 -- Time required to make one complete revolution (circle)Circumference = 6.28 X ______ = ______ feet
(b) (k)
______ ÷ ______ (system speed) = ______ minutes per circle(k) (j) (l)
STEP 4 -- Pounds nitrogen required per acrePounds of material/acre = ______ ÷ ______ = ______ lbs/acre
(d) (e) (m)
STEP 5 -- Injection rate of NH3 in pounds per hour
Rate of injection = ______ X ______ X 60 - ______ = lbs./hr. ÷ 60 = ______ lbs./min.(m) (i) (l)
STEP 6 -- Injection rate of inhibitor: See appendix Table A-1.

35
INJECTION PROCEDURES
1. Anhydrous Ammonia
A. Gated Pipe
Install a manifold inside the last 2 feet of the first section of irrigation pipe. Themanifold should be extra heavy pipe, 3/8" diameter, 2 feet long with drilled holesevery 2 inches.
B. Open Ditch
Install a metering device in the irrigation ditch.
2. Water Conditioner
A. Gated Pipe
Use standard connections with the injection metering pump. Install the connectionin the pipe ahead of the anhydrous ammonia manifold (upstream).
B. Open Ditch
Install a metering pump as described for gated pipe or a gravity feed containerequipped to provide a constant head. Any barrel can be modified for constant headby installing a 3/8" pipe vertically through the airtight lid to within an inch of thebottom of the barrel.

36
EXAMPLE OF ANHYDROUS AMMONIA APPLICATION
Field Calculations
Information Required:1. Time of irrigation, in hours
2. Acres covered by one set
3. Quantity of nitrogen needed per acre
4. Water hardness
5. Flow rate of irrigation waterA. N injection rate/hr.B. Inhibitor injection rate/hr.
Example Calculation:Known: 1. Irrigation time--6 hours
2. Area covered per set--5 acres3. Nitrogen rate--3 lbs./acre4. Water hardness--35 ppm5. Water flow rate--1000 gpm
Calculations:1. Multiply acres per set by N rate/acre: 5 X 30 = 150 lbs. N required
2. Divide lbs. of N required for 5 acres by 0.82 to determine lbs. of ammonia needed: 150- 0.82 = 183 lbs. of ammonia
3. Rate of ammonia injection183 lbs. ÷ 6 hrs. = 30.5 lbs. of ammonia per hours
4. Rate of inhibitor injection
A. Go to Table A-1 and read 0.25 lbs. of inhibitor per hour required per 1000 gpm waterflow rate at a water hardness of 35 ppm.
B. Multiply 0.25 lbs. Inhibitor X 6 hours = 1.5 lbs. inhibitor
Table A-1.Rates of Anhydrous Ammonia and Inhibitor Injection1/
Irrigation Water Max. Ammonia Application InhibitorHardness Per 1000 gpm water Per 1000 gpm water
ppm Grains/gal.35-120 2-7 37 lbs./hr. 0.25 lbs./hr.
120-170 7-10 37 lbs./hr. 0.38 lbs./hr.170-425 10-25 37 lbs./hr. 0.63 lbs./hr.425-850 25-50 28 lbs./hr. 0.75 lbs./hr.
1/From M-4 1961, "Ammonia Application in Irrigation Water," by Agricultural Ammonia Institute

37
FERTIGATION INJECTION WORKSHEET:FERTILIZER SOLUTIONS/SUSPENSIONS (5)
EXPLANATION
Data inputs [(a) through (f)] must be supplied from on-farm measurements or information tables onthe fertilizer solution you plan to use. The letter under each blank space indicates which data itemshould be used in that blank.
(a) Wetted Radius = __________________________feet(b) System Length = _________________________feet(c) System Travels ___________ feet in 10 minutes(d) Pounds Nutrient Desired = ______________ lbs./acre(e) Fertilizer Solution to be used contains __________% N, P or K [express % as a
decimal where letter (e) is used in Step 5](f) Fertilizer solution weighs ______________lbs./gallon
STEP 1 -- Polyphosphate and Water Compatibility Test
STEP 2 -- Acres under center pivotArea (square feet) = 3.14 X ______ X ______ = ______ sq. ft.
(a) (a) (g)
Acres under system = ______ ÷ 43,560 = ______ acres(g) (h)
STEP 3 -- System SpeedSpeed (feet/minute) = ______ ÷ 10 = ______ feet/minute
(c) (i)
STEP 4 -- Time required to make one complete revolution (circle)
Circumference = 6.28 X ______ = ______ feet(b) (j)
______ ÷ ______ (system speed) = ______ minutes per circle(j) (i) (k)
STEP 5 -- Gallons nitrogen solution required per acre
Pounds of solution/acre = ______ ÷ ______ = ______ lbs/acre(d) (e) (m)
Gallons /acre = ______ ÷ ______ = ______ gal./acre(m) (f) (n)
STEP 6 -- Injection rate of solution in gallons per hour
Rate of injection = ______ X ______ X 60 ÷ ______ = ______ gal./hr.(n) (h) (k)
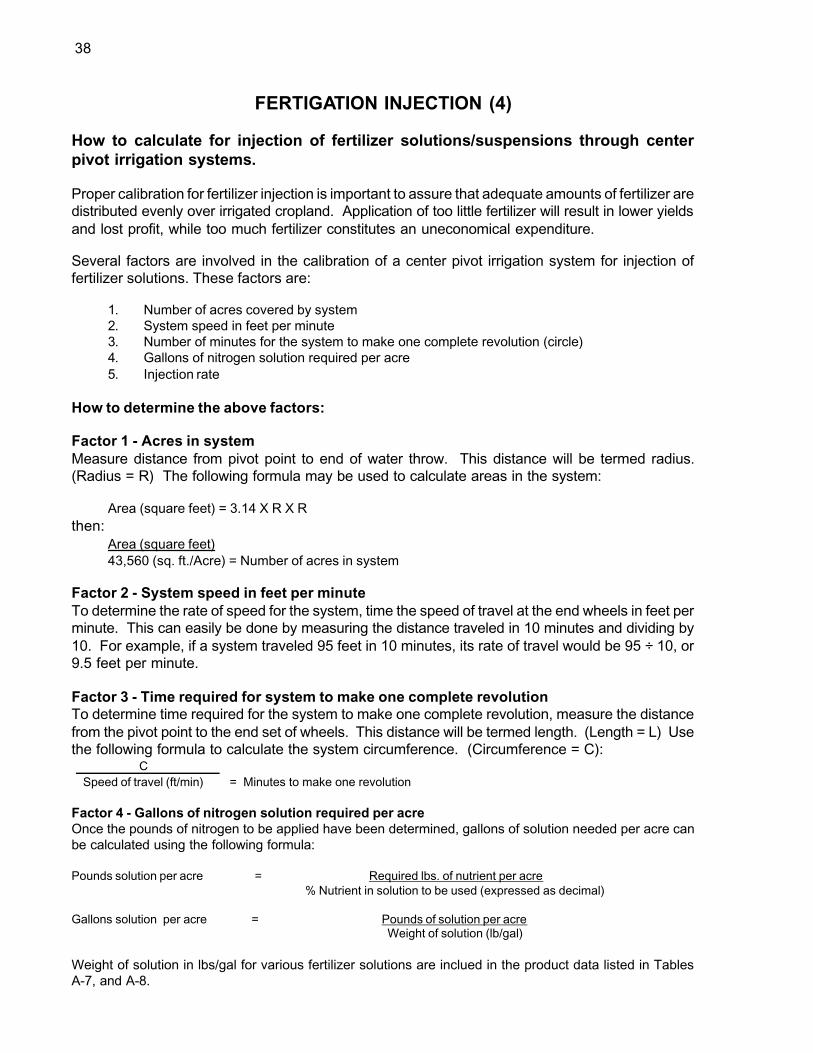
38
FERTIGATION INJECTION (4)
How to calculate for injection of fertilizer solutions/suspensions through centerpivot irrigation systems.
Proper calibration for fertilizer injection is important to assure that adequate amounts of fertilizer aredistributed evenly over irrigated cropland. Application of too little fertilizer will result in lower yieldsand lost profit, while too much fertilizer constitutes an uneconomical expenditure.
Several factors are involved in the calibration of a center pivot irrigation system for injection offertilizer solutions. These factors are:
1. Number of acres covered by system2. System speed in feet per minute3. Number of minutes for the system to make one complete revolution (circle)4. Gallons of nitrogen solution required per acre5. Injection rate
How to determine the above factors:
Factor 1 - Acres in systemMeasure distance from pivot point to end of water throw. This distance will be termed radius.(Radius = R) The following formula may be used to calculate areas in the system:
Area (square feet) = 3.14 X R X Rthen:
Area (square feet)43,560 (sq. ft./Acre) = Number of acres in system
Factor 2 - System speed in feet per minuteTo determine the rate of speed for the system, time the speed of travel at the end wheels in feet perminute. This can easily be done by measuring the distance traveled in 10 minutes and dividing by10. For example, if a system traveled 95 feet in 10 minutes, its rate of travel would be 95 ÷ 10, or9.5 feet per minute.
Factor 3 - Time required for system to make one complete revolutionTo determine time required for the system to make one complete revolution, measure the distancefrom the pivot point to the end set of wheels. This distance will be termed length. (Length = L) Usethe following formula to calculate the system circumference. (Circumference = C):
CSpeed of travel (ft/min) = Minutes to make one revolution
Factor 4 - Gallons of nitrogen solution required per acreOnce the pounds of nitrogen to be applied have been determined, gallons of solution needed per acre canbe calculated using the following formula:
Pounds solution per acre = Required lbs. of nutrient per acre% Nutrient in solution to be used (expressed as decimal)
Gallons solution per acre = Pounds of solution per acreWeight of solution (lb/gal)
Weight of solution in lbs/gal for various fertilizer solutions are inclued in the product data listed in TablesA-7, and A-8.

39
Factor 5 - Determination of Injection rate of solution (gallons/hours)Using the factors calculated above, we can now calculate the rate of injection required to apply the correct
amount of fertilizer solution through your center pivot system. This can be done using the following formula:
Rate of injection (gallons/hour) = Gallons solution per acre X Total number acres X 60minutes per complete revolution
FERTIGATION INJECTION WORKSHEET
Example:
Farmer Smith has a center pivot system with a wetted radius (distance from pivot point toend of water throw) of 1490 feet. The distance from pivot point to end set of wheels is 1390feet. The systems travels 80 feet in 10 minutes as measured from the end set of wheels.His corn is 10" tall and Mr. Smith wishes to apply 50 lbs. of nitrogen per acre in the formof UAN 28%. UAN 28% contains 28% nitrogen and weighs 10.67 lbs/gal. (This informationis listed in Table A-7, page 43, in this brochure). Mr. Smith will use the following steps tocalculate the rate of injection at which he must set his injection pump.
STEP 1 Acres under center pivotarea (square feet) = 3.14 X 1,490 X 1,490 = 6,971,114 sq ft
Acres under system = 6,971,114 ÷ 43,560 = 160.03 acres
STEP 2 System SpeedSpeed (ft/min) = 80 ÷ 10 = 8 ft/min
STEP 3 Time required to make one complete revolution (circle)Circumference = 6.28 X 1,390 = 8,729.2 feet
8,729.2 ÷ 8 (system speed) = 1091.15 minutes to make one circle
STEP 4 Gallons nitrogen solution required per acrePounds of solution per acre = 50 ÷ 0.25 = 200 lbs/acre
Gallons solution per acre = 200 ÷ 10.62 = 18.8 gal/acre
STEP 5 Injection rate of solution in gallons per hourRate of injection = 18.8 X 160.03 X 60 ÷ 1091.15 = 165.4 gal/hr.

40
Table A-2.
Quick Reference Table for Area (Acres) Under Center Pivot Systems of Different Lengths
Wetted* Wetted Wetted WettedRadius Area Radius Area Radius Area Radius Area(Feet) (Acres) (Feet) (Acres) (Feet) (Acres) (Feet) (Acres)
400 11.53 950 65.06 1500 162.19 2050 302.94410 12.12 960 66.43 1510 164.36 2060 305.90420 12.72 970 67.82 1520 166.54 2070 308.87430 13.33 980 69.23 1530 168.74 2080 311.87440 13.96 990 70.65 1540 170.96 2090 314.87450 14.60 1000 72.08 1550 173.18 2100 317.89460 15.25 1010 73.53 1560 175.42 2110 320.93470 15.92 1020 75.00 1570 177.68 2120 323.96480 16.61 1030 76.47 1580 179.95 2130 327.04490 17.31 1040 77.97 1590 182.24 2140 330.12500 18.02 1050 79.47 1600 184.54 2150 333.21510 18.75 1060 80.99 1610 186.85 2160 336.32520 19.49 1070 82.53 1620 189.18 2170 339.44530 20.25 1080 84.08 1630 191.52 2180 342.57540 21.02 1090 85.84 1640 193.88 2190 345.72550 21.81 1100 87.22 1650 196.25 2200 348.89560 22.61 1110 88.82 1660 198.64 2210 352.07570 23.42 1120 90.42 1670 201.04 2220 355.26580 24.25 1130 92.04 1680 203.45 2230 358.47590 25.09 1140 93.68 1690 205.88 2240 361.69600 25.95 1150 95.33 1700 208.32 2250 364.93610 26.82 1160 97.00 1710 210.78 2260 368.18620 27.71 1170 98.68 1720 213.25 2270 371.44630 28.61 1180 100.37 1730 215.74 2280 374.72640 29.53 1190 102.08 1740 218.24 2290 378.02650 30.46 1200 103.80 1750 220.76 2300 381.33660 31.40 1210 105.54 1760 223.29 2310 384.65670 32.36 1220 107.29 1770 225.83 2320 378.99680 33.33 1230 109.06 1780 228.39 2330 391.34690 34.32 1240 110.84 1790 230.97 2340 394.71700 35.32 1250 112.63 1800 233.55 2350 398.09710 36.34 1260 114.44 1810 236.16 2360 401.48720 37.37 1270 116.27 1820 238.77 2370 404.89730 38.41 1280 116.10 1830 241.40 2380 408.32740 39.47 1290 119.96 1840 244.05 2390 411.75750 40.55 1300 121.82 1850 246.71 2400 415.21760 41.64 1310 123.70 1860 249.38 2410 418.67770 42.74 1320 125.60 1870 252.07 2420 422.16780 43.86 1330 127.51 1880 254.78 2430 425.65790 44.99 1340 129.43 1890 257.49 2440 429.16800 46.13 1350 131.37 1900 260.22 2450 432.69810 47.29 1360 133.33 1910 262.97 2460 436.23820 48.47 1370 135.30 1920 265.73 2470 439.78830 49.66 1380 137.28 1930 268.51 2480 443.35840 50.86 1390 139.27 1940 271.30 2490 446.93850 52.08 1400 141.29 1950 274.10 2500 450.53860 53.31 1410 143.31 1960 276.92 2510 454.14870 54.56 1420 145.35 1970 279.75 2520 457.77880 55.82 1430 147.41 1980 282.60 2530 461.41890 57.10 1440 149.47 1990 285.46 2540 465.06900 58.39 1450 151.56 2000 288.34 2550 468.73910 59.69 1460 153.66 2010 291.23 2560 472.41920 61.01 1470 155.77 2020 294.13 2570 476.11930 62.35 1480 157.89 2030 297.05 2580 479.82940 63.69 1490 160.03 2040 299.99 2590 483.55
*Wetted radius is the distance (in feet) from the pivot point of the system to the farthest reach of the end gun.
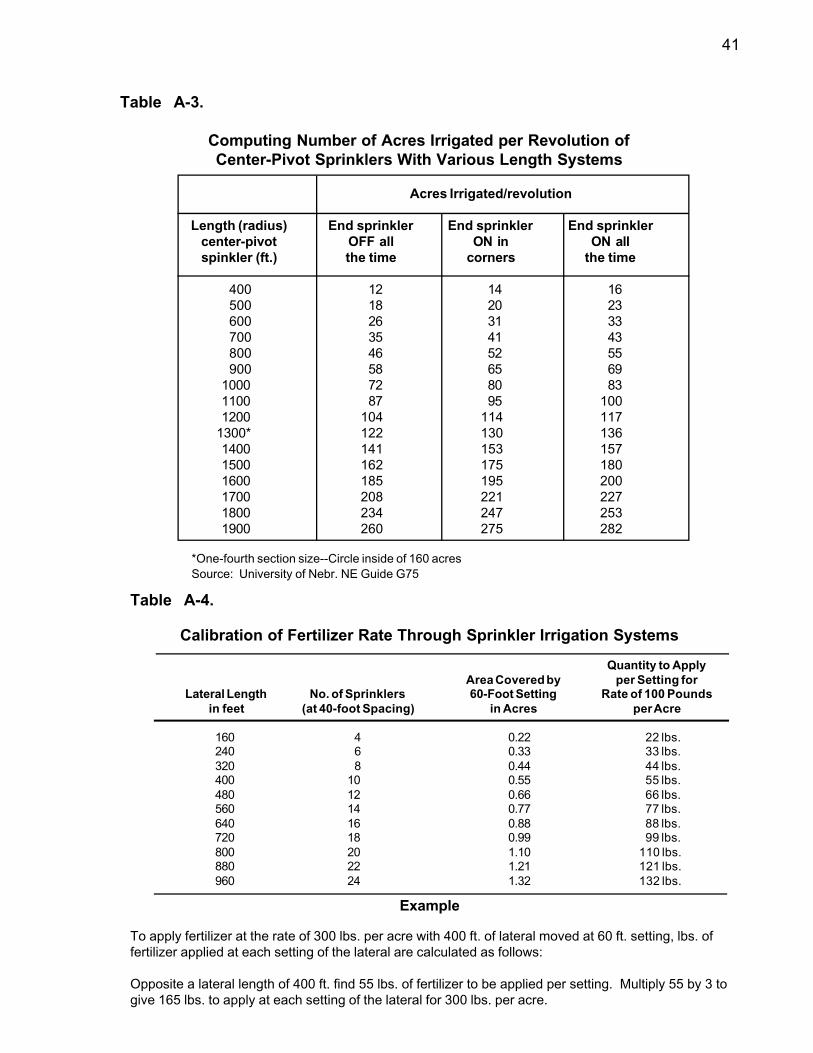
41
Table A-3.
Computing Number of Acres Irrigated per Revolution ofCenter-Pivot Sprinklers With Various Length Systems
Acres Irrigated/revolution
Length (radius) End sprinkler End sprinkler End sprinklercenter-pivot OFF all ON in ON allspinkler (ft.) the time corners the time
400 12 14 16500 18 20 23600 26 31 33700 35 41 43800 46 52 55900 58 65 69
1000 72 80 831100 87 95 1001200 104 114 117
1300* 122 130 1361400 141 153 1571500 162 175 1801600 185 195 2001700 208 221 2271800 234 247 2531900 260 275 282
*One-fourth section size--Circle inside of 160 acresSource: University of Nebr. NE Guide G75
Table A-4.
Calibration of Fertilizer Rate Through Sprinkler Irrigation Systems
Quantity to ApplyArea Covered by per Setting for
Lateral Length No. of Sprinklers 60-Foot Setting Rate of 100 Poundsin feet (at 40-foot Spacing) in Acres per Acre
160 4 0.22 22 lbs.240 6 0.33 33 lbs.320 8 0.44 44 lbs.400 10 0.55 55 lbs.480 12 0.66 66 lbs.560 14 0.77 77 lbs.640 16 0.88 88 lbs.720 18 0.99 99 lbs.800 20 1.10 110 lbs.880 22 1.21 121 lbs.960 24 1.32 132 lbs.
Example
To apply fertilizer at the rate of 300 lbs. per acre with 400 ft. of lateral moved at 60 ft. setting, lbs. offertilizer applied at each setting of the lateral are calculated as follows:
Opposite a lateral length of 400 ft. find 55 lbs. of fertilizer to be applied per setting. Multiply 55 by 3 togive 165 lbs. to apply at each setting of the lateral for 300 lbs. per acre.

42
Table A-5.
Flow in Gallons Per Minute, Using Orifices of Different Sizesat Various Net Pressures*
Diameter of Orifice**Net pounds per 1/16" 3/32" 1/8"
square inch approx. g.p.m. approx. g.p.m. approx. g.p.m.
10 0.20 0.54 1.0220 0.31 0.79 1.5230 0.41 1.10 2.00
* Net pressure is the difference between the pressure exerted against the orifice and the pressure in the irrigationsystem. Example: If the pressure in the fertilizer injector is 15 pounds per square inch and the pressure in thegated pipe is 5 pounds per square inch, the net pressure is 10 pounds per square inch.
** Orifice is made by drilling a hole in the center of a knock-out from an electric connection box. The flow of fertilizerwill vary depending on how the orifice is shaped. Check the rate of flow before using the fertilizer injector.
Elevationin ft.
Equiva-lent
in PSI
=
=
=
=
=
=
=
=
=
=
=
=
=
70'
58'
46'
35'
23'
12'
Level
-12'
-23'
-35'
-46'
-58'
-70'
Table A-6.
Variation in Percent of System GPM Due to Change in Pressure
System End Pressure
When pressure variation exceeds = or -10%, then flow control nozzles, pressure regulators or changes in designpressure are recommended to reduce the variation to a + or -5% in flow.
-30#
-25#
-20#
-15#
-10#
-5#
0
5#
10#
15#
20#
25#
30#
60
-29
-24
-18
-13
-8.7
-4.3
0
4.1
8.0
12
16
19
23
55
-33
-26
-20
-15
-9.5
-4.7
0
4.4
8.7
13
17
21
25
50
-37
-29
-23
-16
-11
-5.1
0
4.9
9.5
14
18
23
27
45
-42
-33
-26
-18
-12
-5.7
0
5.4
11
16
20
25
29
40
-50
-39
-29
-21
-13
-6.5
0
6.1
12
17
23
28
32
35
-62
-47
-35
-24
-16
-7.4
0
6.9
14
20
25
31
36
30
-100
-59
-42
-29
-18
-8.7
0
8.0
16
23
29
35
41
25
--
-100
-55
-37
-23
-11
0
9.5
18
27
34
41
48
20
--
--
-100
-50
-29
-13
0
12
23
32
41
50
58
15
--
--
--
-100
-42
-18
0
16
29
41
53
63
73
10
--
--
--
--
-100
-29
0
23
41
58
73
87
100
5
--
--
--
--
--
-100
0
41
73
100
124
145
165

43
Table A-8.
Amount of Various Nitrogen Fertilizers Required to Give 20, 30 and 40 Poundsof Available Nitrogen Per Acre1/
Kind of fertilizer % Wt. per Rate of N per acre, lb.solutions N gal. 20 30 40
at 60½ F. gal/ac gal/ac gal/ac(lb.)
Urea-Ammonium Nitrate 28 10.65 6.7 10.0 13.4Urea-Ammonium Nitrate 32 11.06 5.7 8.6 11.4Ammonium Nitrate 21 10.73 8.9 12.4 17.8
1/Fertigation and the Importance of Anti-pollution Devices (Part 1) Fischbach, F. E. SolutionsMagazine. March-April, 1977, pp 8-12.
Table A-7.
Weights of Various Liquid Fertilizer Materials
ApproximatePounds Per
Material Gallon
Ammonium Thio-sulfate 12-0-0-26S.................................................................................... 11.047-21-0 (From electric furnace acid) ...................................................................................... 10.27-21-0 (From wet process acid) ........................................................................................... 10.518-24-0 (From electric furnace acid) ...................................................................................... 10.58-24-0 (From wet process acid) ........................................................................................... 10.8110-34-0 (From electric furnace acid) ................................................................................... 11.410-34-0 (From wet process acid) ......................................................................................... 11.7411-37-0 (From electric furnace acid) ................................................................................... 11.711-37-0 (From wet process acid) ......................................................................................... 12.0512-40-0 (From electric furnace acid only) ........................................................................... 12.020.5-0-0 (Aqua Ammonia) ...................................................................................................... 7.5228-0-0 (UAN Solution) ........................................................................................................... 10.6730-0-0 (UAN Solution) ........................................................................................................... 10.8632-0-0 (UAN Solution) ........................................................................................................... 11.05Water ........................................................................................................................................ 8.34
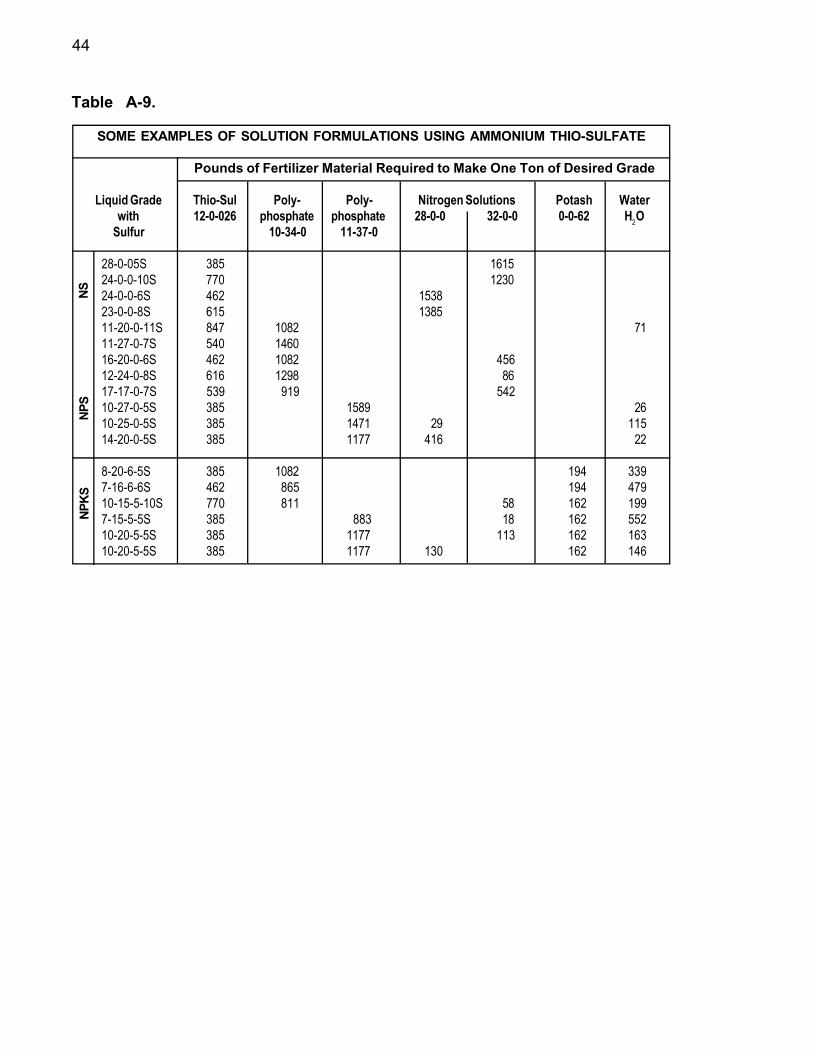
44
Table A-9.
SOME EXAMPLES OF SOLUTION FORMULATIONS USING AMMONIUM THIO-SULFATE
Pounds of Fertilizer Material Required to Make One Ton of Desired Grade
Liquid Grade Thio-Sul Poly- Poly- Nitrogen Solutions Potash Waterwith 12-0-026 phosphate phosphate 28-0-0 32-0-0 0-0-62 H2O
Sulfur 10-34-0 11-37-0
28-0-05S 385 161524-0-0-10S 770 123024-0-0-6S 462 153823-0-0-8S 615 138511-20-0-11S 847 1082 7111-27-0-7S 540 146016-20-0-6S 462 1082 45612-24-0-8S 616 1298 8617-17-0-7S 539 919 54210-27-0-5S 385 1589 2610-25-0-5S 385 1471 29 11514-20-0-5S 385 1177 416 22
8-20-6-5S 385 1082 194 3397-16-6-6S 462 865 194 47910-15-5-10S 770 811 58 162 1997-15-5-5S 385 883 18 162 55210-20-5-5S 385 1177 113 162 16310-20-5-5S 385 1177 130 162 146
NS
NP
SN
PK
S
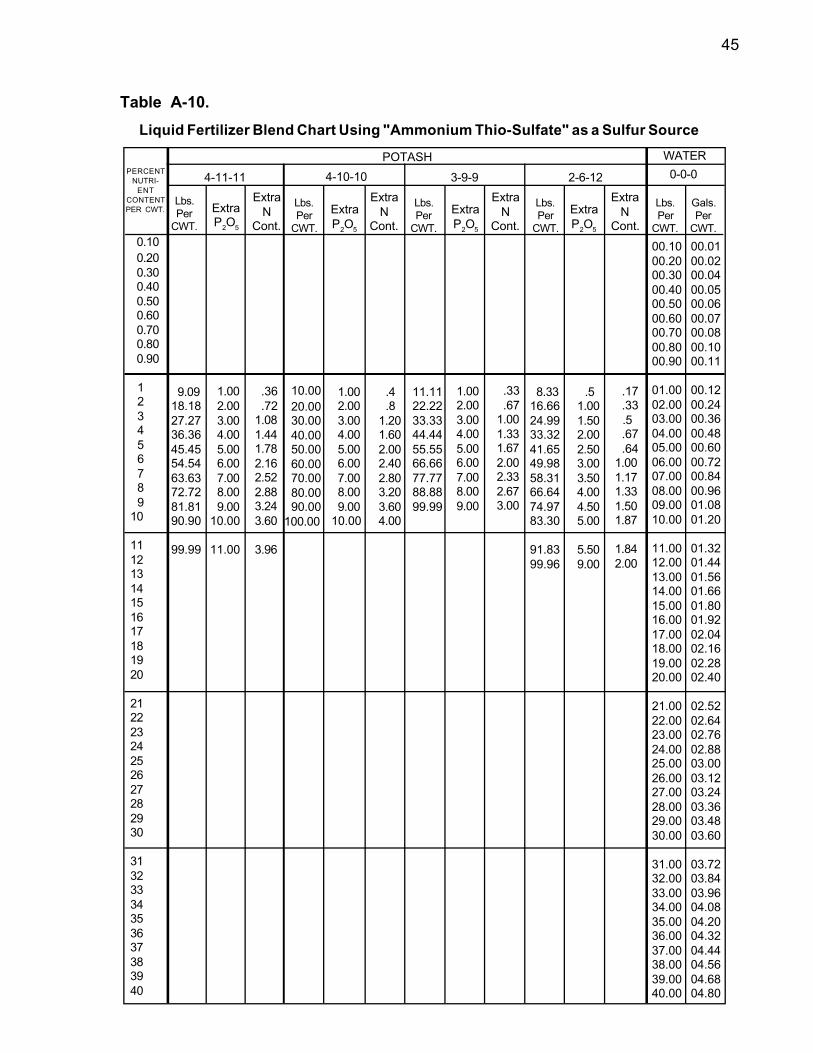
45
00.1000.2000.3000.4000.5000.6000.7000.8000.90
01.0002.0003.0004.0005.0006.0007.0008.0009.0010.00
11.0012.0013.0014.0015.0016.0017.0018.0019.0020.00
21.0022.0023.0024.0025.0026.0027.0028.0029.0030.00
31.0032.0033.0034.0035.0036.0037.0038.0039.0040.00
00.0100.0200.0400.0500.0600.0700.0800.1000.11
00.1200.2400.3600.4800.6000.7200.8400.9601.0801.20
01.3201.4401.5601.6601.8001.9202.0402.1602.2802.40
02.5202.6402.7602.8803.0003.1203.2403.3603.4803.60
03.7203.8403.9604.0804.2004.3204.4404.5604.6804.80
9.0918.1827.2736.3645.4554.5463.6372.7281.8190.90
99.99
1.002.003.004.005.006.007.008.009.00
10.00
11.00
.36
.721.081.441.782.162.522.883.243.60
3.96
10.0020.0030.0040.0050.0060.0070.0080.0090.00
100.00
1.002.003.004.005.006.007.008.009.00
10.00
11.1122.2233.3344.4455.5566.6677.7788.8899.99
1.002.003.004.005.006.007.008.009.00
.33
.671.001.331.672.002.332.673.00
.51.001.502.002.503.003.504.004.505.00
5.509.00
8.3316.6624.9933.3241.6549.9858.3166.6474.9783.30
91.8399.96
.17
.33
.5
.67
.641.001.171.331.501.87
1.842.00
Gals.Per
CWT.
Lbs.Per
CWT.
ExtraN
Cont.ExtraP2O5
Lbs.Per
CWT.
ExtraN
Cont.ExtraP2O5
Lbs.Per
CWT.
ExtraN
Cont.ExtraP2O5
Lbs.Per
CWT.
ExtraN
Cont.
ExtraP2O5
Lbs.Per
CWT.
0-0-04-11-11 4-10-10 3-9-9 2-6-12PERCENT
NUTRI-ENT
CONTENTPER CWT.
POTASH WATER
0.100.200.300.400.500.600.700.800.90
123456789
10
11121314151617181920
21222324252627282930
31323334353637383940
.4
.81.201.602.002.402.803.203.604.00
Table A-10.
Liquid Fertilizer Blend Chart Using "Ammonium Thio-Sulfate" as a Sulfur Source
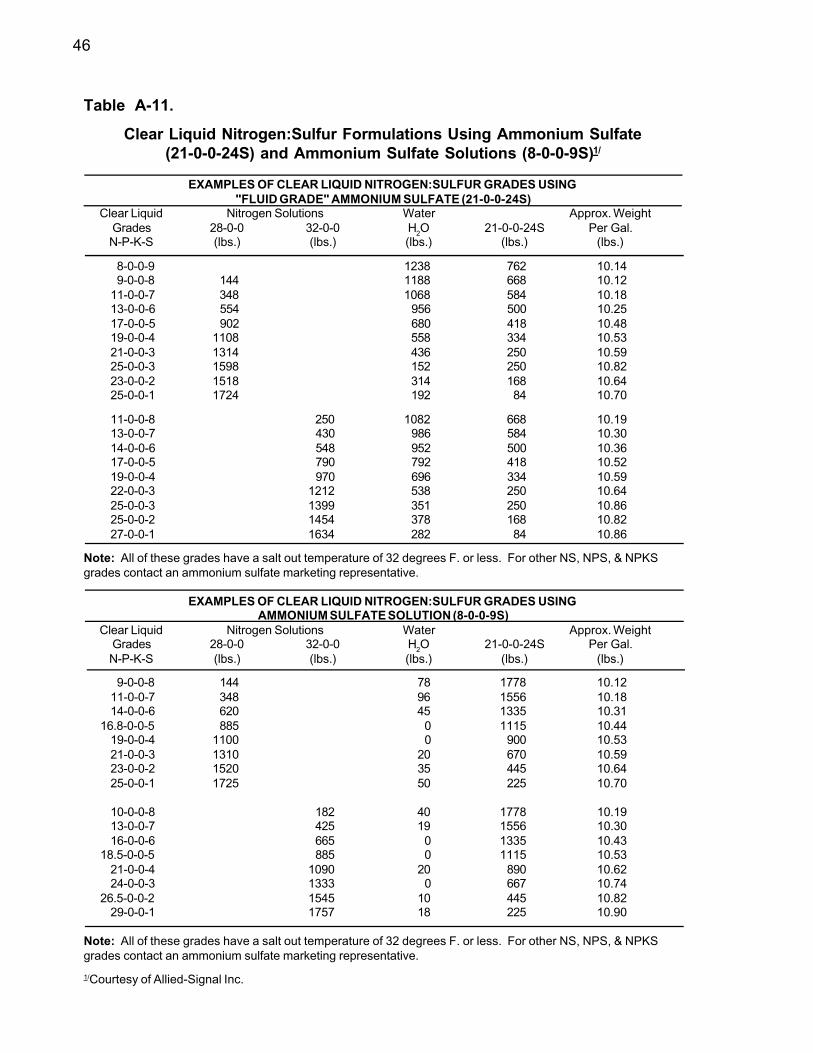
46
Table A-11.
Clear Liquid Nitrogen:Sulfur Formulations Using Ammonium Sulfate(21-0-0-24S) and Ammonium Sulfate Solutions (8-0-0-9S)1/
EXAMPLES OF CLEAR LIQUID NITROGEN:SULFUR GRADES USING"FLUID GRADE" AMMONIUM SULFATE (21-0-0-24S)
Clear Liquid Nitrogen Solutions Water Approx. WeightGrades 28-0-0 32-0-0 H2O 21-0-0-24S Per Gal.N-P-K-S (lbs.) (lbs.) (lbs.) (lbs.) (lbs.)
8-0-0-9 1238 762 10.149-0-0-8 144 1188 668 10.12
11-0-0-7 348 1068 584 10.1813-0-0-6 554 956 500 10.2517-0-0-5 902 680 418 10.4819-0-0-4 1108 558 334 10.5321-0-0-3 1314 436 250 10.5925-0-0-3 1598 152 250 10.8223-0-0-2 1518 314 168 10.6425-0-0-1 1724 192 84 10.70
11-0-0-8 250 1082 668 10.1913-0-0-7 430 986 584 10.3014-0-0-6 548 952 500 10.3617-0-0-5 790 792 418 10.5219-0-0-4 970 696 334 10.5922-0-0-3 1212 538 250 10.6425-0-0-3 1399 351 250 10.8625-0-0-2 1454 378 168 10.8227-0-0-1 1634 282 84 10.86
Note: All of these grades have a salt out temperature of 32 degrees F. or less. For other NS, NPS, & NPKSgrades contact an ammonium sulfate marketing representative.
EXAMPLES OF CLEAR LIQUID NITROGEN:SULFUR GRADES USINGAMMONIUM SULFATE SOLUTION (8-0-0-9S)
Clear Liquid Nitrogen Solutions Water Approx. WeightGrades 28-0-0 32-0-0 H2O 21-0-0-24S Per Gal.N-P-K-S (lbs.) (lbs.) (lbs.) (lbs.) (lbs.)
9-0-0-8 144 78 1778 10.1211-0-0-7 348 96 1556 10.1814-0-0-6 620 45 1335 10.31
16.8-0-0-5 885 0 1115 10.4419-0-0-4 1100 0 900 10.5321-0-0-3 1310 20 670 10.5923-0-0-2 1520 35 445 10.6425-0-0-1 1725 50 225 10.70
10-0-0-8 182 40 1778 10.1913-0-0-7 425 19 1556 10.3016-0-0-6 665 0 1335 10.43
18.5-0-0-5 885 0 1115 10.5321-0-0-4 1090 20 890 10.6224-0-0-3 1333 0 667 10.74
26.5-0-0-2 1545 10 445 10.8229-0-0-1 1757 18 225 10.90
Note: All of these grades have a salt out temperature of 32 degrees F. or less. For other NS, NPS, & NPKSgrades contact an ammonium sulfate marketing representative.
1/Courtesy of Allied-Signal Inc.
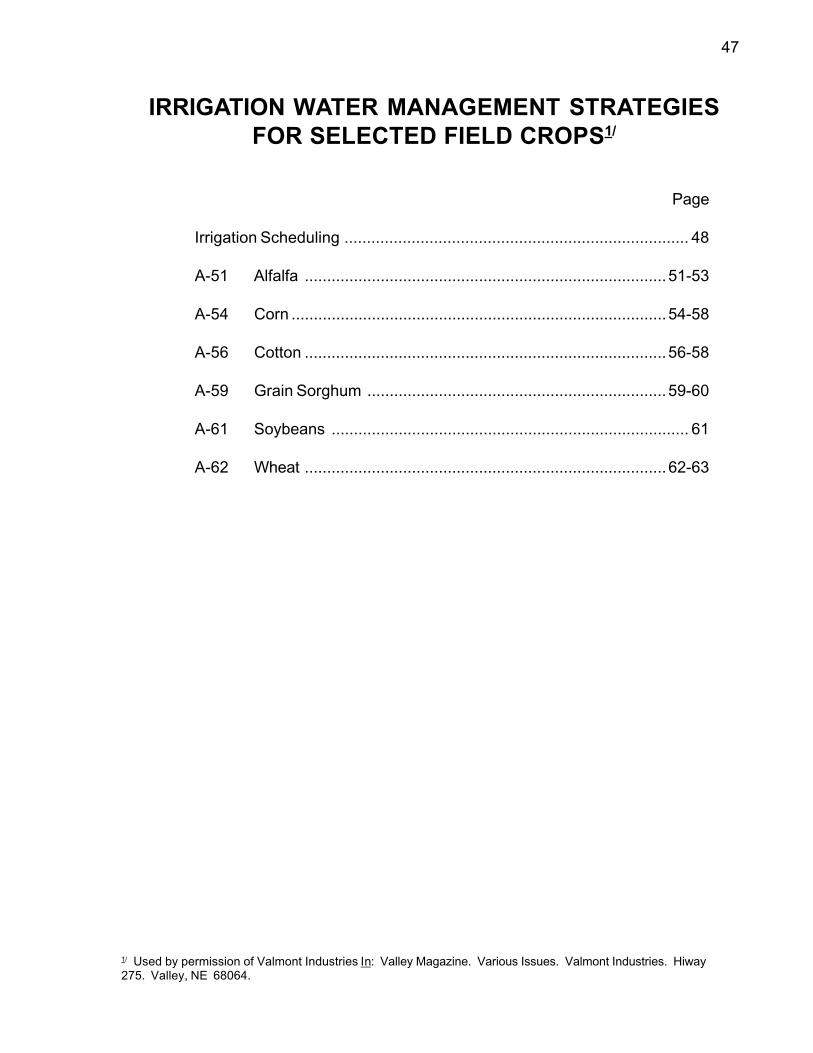
47
IRRIGATION WATER MANAGEMENT STRATEGIESFOR SELECTED FIELD CROPS1/
Page
Irrigation Scheduling ............................................................................. 48
A-51 Alfalfa .................................................................................51-53
A-54 Corn ....................................................................................54-58
A-56 Cotton .................................................................................56-58
A-59 Grain Sorghum ...................................................................59-60
A-61 Soybeans ................................................................................ 61
A-62 Wheat .................................................................................62-63
1/ Used by permission of Valmont Industries In: Valley Magazine. Various Issues. Valmont Industries. Hiway275. Valley, NE 68064.

48
IRRIGATION SCHEDULING
Too little moisture can stress the plant, too much wastes water, energy, and can washimportant nutrients past the root zone.
If the combination of available rain and irrigation water provided your crops the preciseamount of water they needed at all times--it would help to maximize crop yields. You wouldavoid wasting water, energy and nutrients by applying water only when needed by the crop.If you were able to create that kind of moisture balance, you would have mastered theskill--some call it the art--of irrigation scheduling.
In one study, Nebraska researchers concluded that even elementary irrigation schedulingprocedures would save water and energy compared to pilot projects which showed 7.3" ofexcess water was applied each season where irrigation scheduling was not used.
Subsequent studies have indicated that a combination of irrigation scheduling with the kindof uniform, low-volume water application possible with center pivot and linear-moveirrigation systems can achieve 35-50% savings in total water application without sacrificingcrop yields.
To really understand scheduling, it is necessary to know the characteristics of your soils andcrops. Perhaps the key point is that any water used (allowable soil moisture depletion) mustbe replenished. This means irrigating before soil moisture has been depleted below a setlimit. The limit varies with each crop, stage of growth, soil type, and climate. The net amountto be applied at the next irrigation is the amount that has been depleted, except for retaininga certain capacity for rainfall that may occur after the irrigation.
It is absolutely essential to monitor the soil moisture status when you schedule irrigations.Several methods are available to allow the irrigator to physically monitor soil moisture. Allmethods require taking a soil sample or using some sort of instrument to determine soilmoisture based on the calibration of that instrument to a particular soil.
Some of the principal methods are identified in the following paragraphs: Tensiometersmeasure soil moisture tension. The electrical resistance block system uses small gypsumblocks and a portable alternating current resistance meter to measure electrical resistancein the soil and convert to a soil moisture content. The neuron probe procedure involvesusing an instrument which measures soil moisture by counting neutrons; a higher count willindicate a wetter soil, a lower count means the soil is drier.
The "appearance and feel" method requires only a soil probe or shovel and is relatively easyto use and accurate once the irrigator has gained some experience. Plus, the irrigator canspot check problem areas in the field such as hard pan areas or different soil conditions.
Irrigation Scheduling Utilizing the "Feel" Method--The following example is a corn cropon silty clay loam soil. Utilizing the feel method of judging available moisture in this field(Table A-12) the soil ribbons out between fingers easily indicating 75% available moisture.
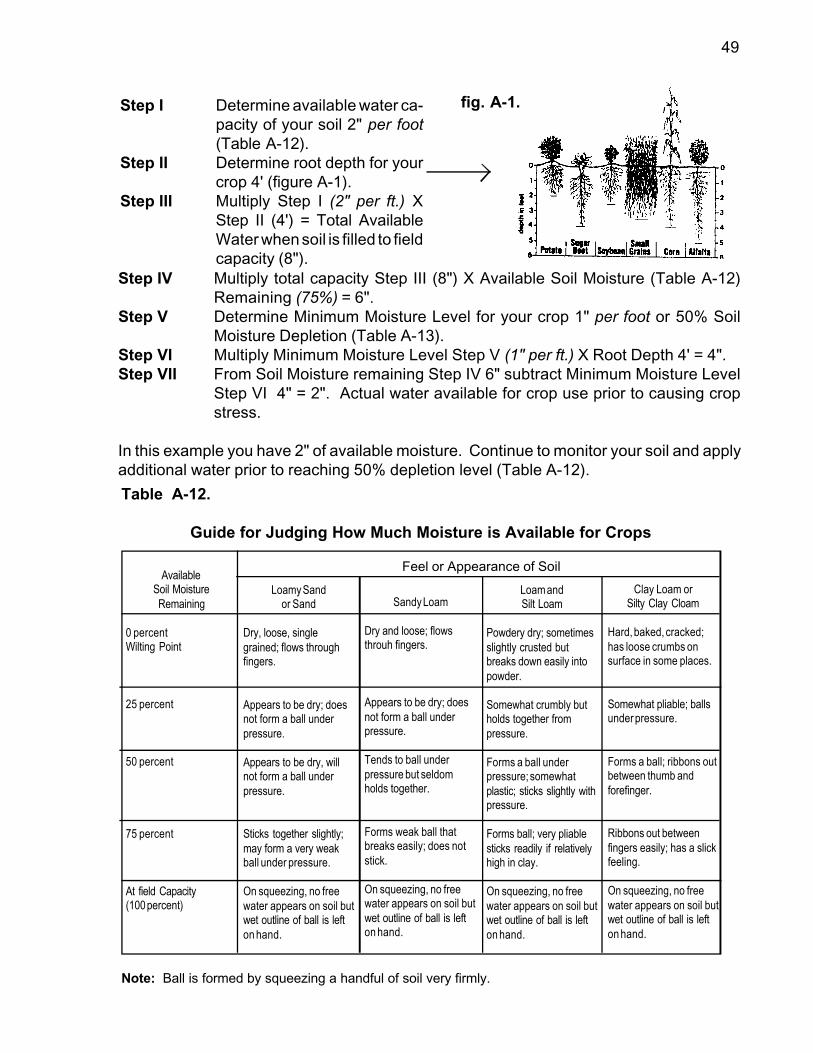
49
Step I Determine available water ca-pacity of your soil 2" per foot(Table A-12).
Step II Determine root depth for yourcrop 4' (figure A-1).
Step III Multiply Step I (2" per ft.) XStep II (4') = Total AvailableWater when soil is filled to fieldcapacity (8").
Step IV Multiply total capacity Step III (8") X Available Soil Moisture (Table A-12)Remaining (75%) = 6".
Step V Determine Minimum Moisture Level for your crop 1" per foot or 50% SoilMoisture Depletion (Table A-13).
Step VI Multiply Minimum Moisture Level Step V (1" per ft.) X Root Depth 4' = 4".Step VII From Soil Moisture remaining Step IV 6" subtract Minimum Moisture Level
Step VI 4" = 2". Actual water available for crop use prior to causing cropstress.
In this example you have 2" of available moisture. Continue to monitor your soil and applyadditional water prior to reaching 50% depletion level (Table A-12).
Table A-12.
Guide for Judging How Much Moisture is Available for Crops
Feel or Appearance of Soil
Sandy Loam
Dry and loose; flowsthrouh fingers.
Appears to be dry; doesnot form a ball underpressure.
Tends to ball underpressure but seldomholds together.
Forms weak ball thatbreaks easily; does notstick.
On squeezing, no freewater appears on soil butwet outline of ball is lefton hand.
Loamy Sandor Sand
Dry, loose, singlegrained; flows throughfingers.
Appears to be dry; doesnot form a ball underpressure.
Appears to be dry, willnot form a ball underpressure.
Sticks together slightly;may form a very weakball under pressure.
On squeezing, no freewater appears on soil butwet outline of ball is lefton hand.
Loam andSilt Loam
Powdery dry; sometimesslightly crusted butbreaks down easily intopowder.
Somewhat crumbly butholds together frompressure.
Forms a ball underpressure; somewhatplastic; sticks slightly withpressure.
Forms ball; very pliablesticks readily if relativelyhigh in clay.
On squeezing, no freewater appears on soil butwet outline of ball is lefton hand.
Clay Loam orSilty Clay Cloam
Hard, baked, cracked;has loose crumbs onsurface in some places.
Somewhat pliable; ballsunder pressure.
Forms a ball; ribbons outbetween thumb andforefinger.
Ribbons out betweenfingers easily; has a slickfeeling.
On squeezing, no freewater appears on soil butwet outline of ball is lefton hand.
AvailableSoil MoistureRemaining
0 percentWilting Point
25 percent
50 percent
75 percent
At field Capacity(100 percent)
Note: Ball is formed by squeezing a handful of soil very firmly.
fig. A-1.
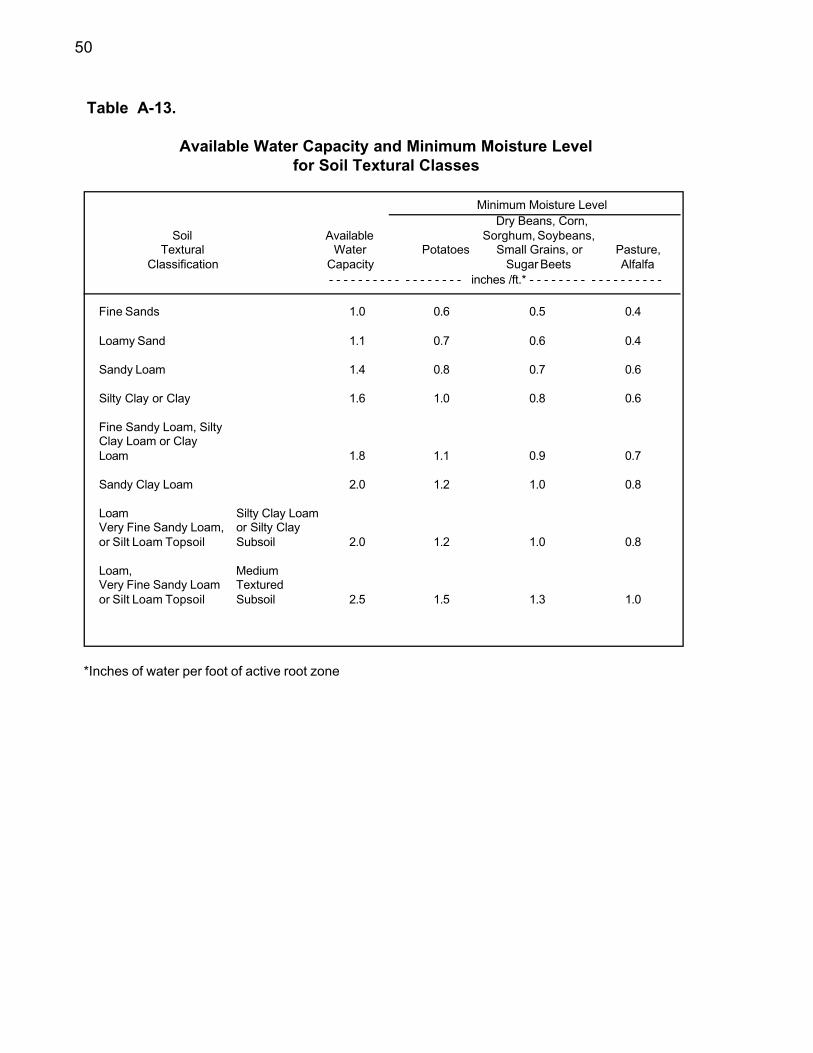
50
Table A-13.
Available Water Capacity and Minimum Moisture Levelfor Soil Textural Classes
Minimum Moisture LevelDry Beans, Corn,
Soil Available Sorghum, Soybeans,Textural Water Potatoes Small Grains, or Pasture,
Classification Capacity Sugar Beets Alfalfa - - - - - - - - - - - - - - - - - - inches /ft.* - - - - - - - - - - - - - - - - - -
Fine Sands 1.0 0.6 0.5 0.4
Loamy Sand 1.1 0.7 0.6 0.4
Sandy Loam 1.4 0.8 0.7 0.6
Silty Clay or Clay 1.6 1.0 0.8 0.6
Fine Sandy Loam, SiltyClay Loam or ClayLoam 1.8 1.1 0.9 0.7
Sandy Clay Loam 2.0 1.2 1.0 0.8
Loam Silty Clay LoamVery Fine Sandy Loam, or Silty Clayor Silt Loam Topsoil Subsoil 2.0 1.2 1.0 0.8
Loam, MediumVery Fine Sandy Loam Texturedor Silt Loam Topsoil Subsoil 2.5 1.5 1.3 1.0
*Inches of water per foot of active root zone
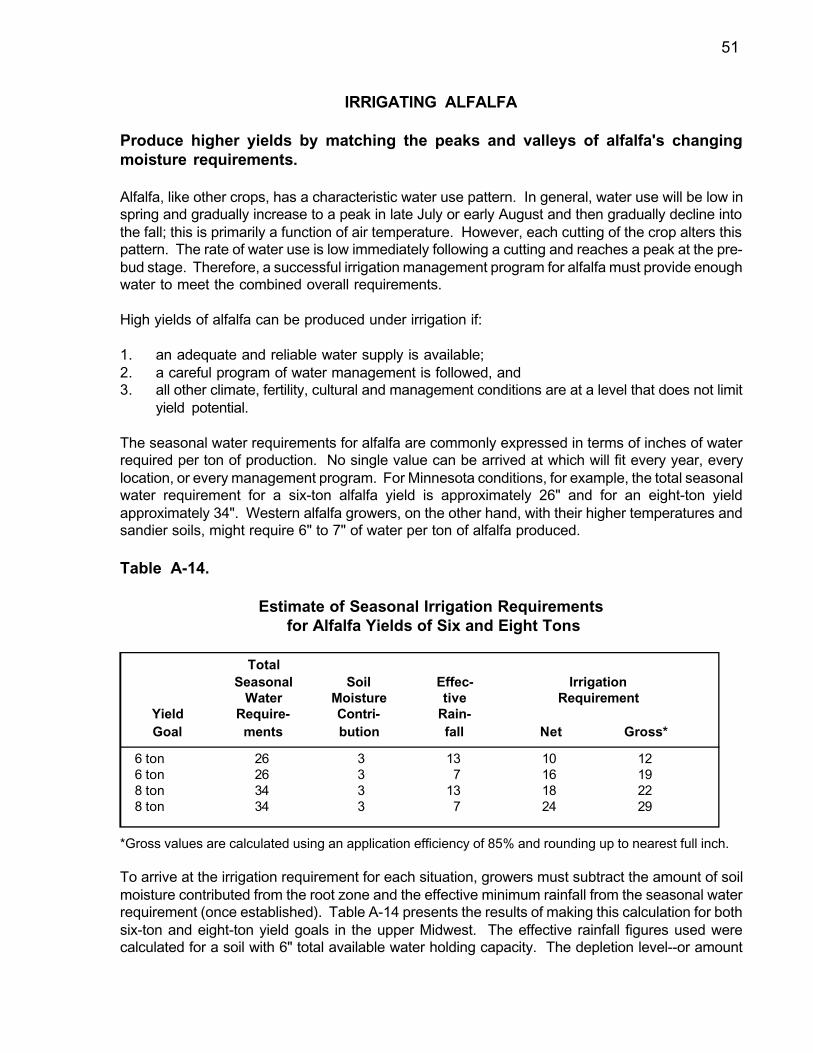
51
IRRIGATING ALFALFA
Produce higher yields by matching the peaks and valleys of alfalfa's changingmoisture requirements.
Alfalfa, like other crops, has a characteristic water use pattern. In general, water use will be low inspring and gradually increase to a peak in late July or early August and then gradually decline intothe fall; this is primarily a function of air temperature. However, each cutting of the crop alters thispattern. The rate of water use is low immediately following a cutting and reaches a peak at the pre-bud stage. Therefore, a successful irrigation management program for alfalfa must provide enoughwater to meet the combined overall requirements.
High yields of alfalfa can be produced under irrigation if:
1. an adequate and reliable water supply is available;2. a careful program of water management is followed, and3. all other climate, fertility, cultural and management conditions are at a level that does not limit
yield potential.
The seasonal water requirements for alfalfa are commonly expressed in terms of inches of waterrequired per ton of production. No single value can be arrived at which will fit every year, everylocation, or every management program. For Minnesota conditions, for example, the total seasonalwater requirement for a six-ton alfalfa yield is approximately 26" and for an eight-ton yieldapproximately 34". Western alfalfa growers, on the other hand, with their higher temperatures andsandier soils, might require 6" to 7" of water per ton of alfalfa produced.
Table A-14.
Estimate of Seasonal Irrigation Requirements for Alfalfa Yields of Six and Eight Tons
TotalSeasonal Soil Effec- Irrigation
Water Moisture tive RequirementYield Require- Contri- Rain-Goal ments bution fall Net Gross*
6 ton 26 3 13 10 126 ton 26 3 7 16 198 ton 34 3 13 18 228 ton 34 3 7 24 29
*Gross values are calculated using an application efficiency of 85% and rounding up to nearest full inch.
To arrive at the irrigation requirement for each situation, growers must subtract the amount of soilmoisture contributed from the root zone and the effective minimum rainfall from the seasonal waterrequirement (once established). Table A-14 presents the results of making this calculation for bothsix-ton and eight-ton yield goals in the upper Midwest. The effective rainfall figures used werecalculated for a soil with 6" total available water holding capacity. The depletion level--or amount
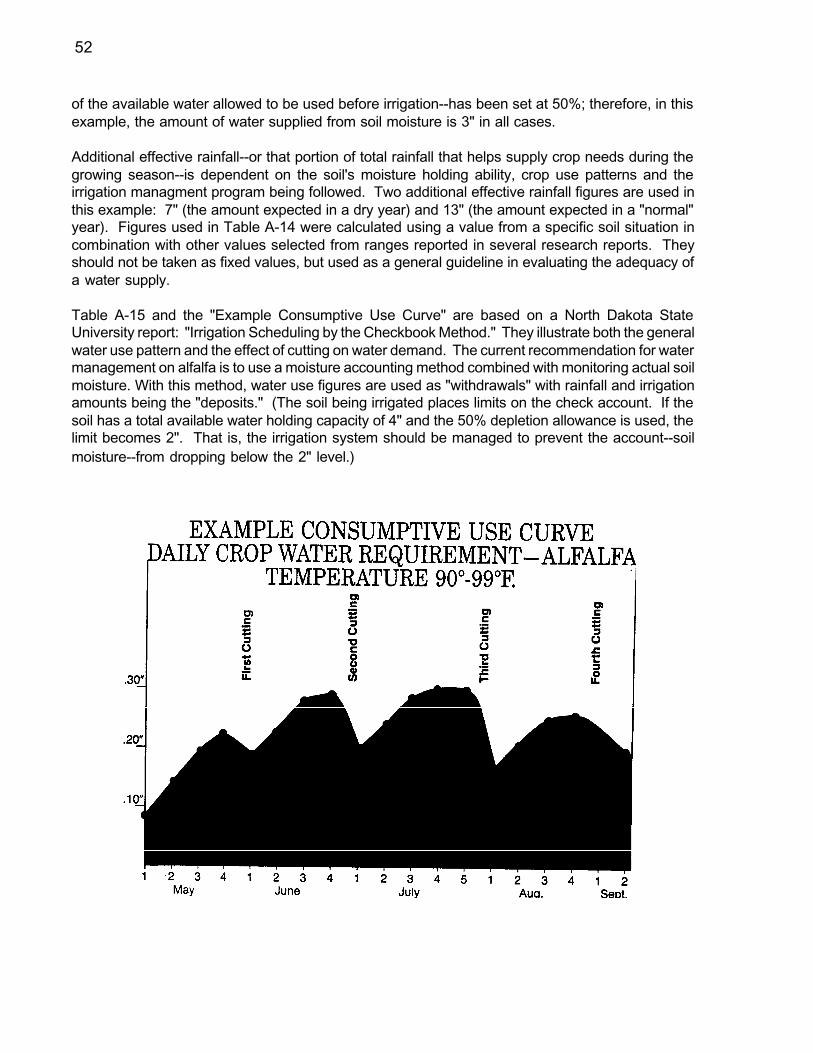
52
of the available water allowed to be used before irrigation--has been set at 50%; therefore, in thisexample, the amount of water supplied from soil moisture is 3" in all cases.
Additional effective rainfall--or that portion of total rainfall that helps supply crop needs during thegrowing season--is dependent on the soil's moisture holding ability, crop use patterns and theirrigation managment program being followed. Two additional effective rainfall figures are used inthis example: 7" (the amount expected in a dry year) and 13" (the amount expected in a "normal"year). Figures used in Table A-14 were calculated using a value from a specific soil situation incombination with other values selected from ranges reported in several research reports. Theyshould not be taken as fixed values, but used as a general guideline in evaluating the adequacy ofa water supply.
Table A-15 and the "Example Consumptive Use Curve" are based on a North Dakota StateUniversity report: "Irrigation Scheduling by the Checkbook Method." They illustrate both the generalwater use pattern and the effect of cutting on water demand. The current recommendation for watermanagement on alfalfa is to use a moisture accounting method combined with monitoring actual soilmoisture. With this method, water use figures are used as "withdrawals" with rainfall and irrigationamounts being the "deposits." (The soil being irrigated places limits on the check account. If thesoil has a total available water holding capacity of 4" and the 50% depletion allowance is used, thelimit becomes 2". That is, the irrigation system should be managed to prevent the account--soilmoisture--from dropping below the 2" level.)
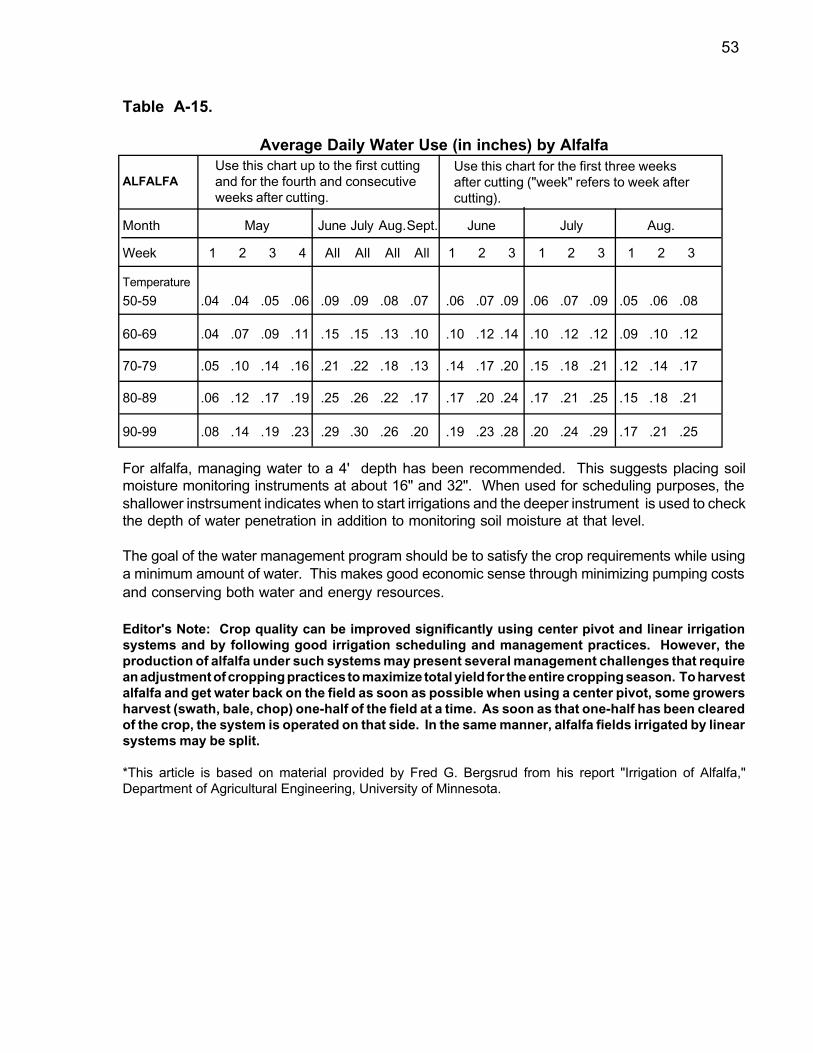
53
Use this chart for the first three weeksafter cutting ("week" refers to week aftercutting).
Use this chart up to the first cuttingand for the fourth and consecutiveweeks after cutting.
Table A-15.
Average Daily Water Use (in inches) by Alfalfa
ALFALFA
Month May June July Aug.Sept. June July Aug.
Week 1 2 3 4 All All All All 1 2 3 1 2 3 1 2 3
Temperature
50-59 .04 .04 .05 .06 .09 .09 .08 .07 .06 .07 .09 .06 .07 .09 .05 .06 .08
60-69 .04 .07 .09 .11 .15 .15 .13 .10 .10 .12 .14 .10 .12 .12 .09 .10 .12
70-79 .05 .10 .14 .16 .21 .22 .18 .13 .14 .17 .20 .15 .18 .21 .12 .14 .17
80-89 .06 .12 .17 .19 .25 .26 .22 .17 .17 .20 .24 .17 .21 .25 .15 .18 .21
90-99 .08 .14 .19 .23 .29 .30 .26 .20 .19 .23 .28 .20 .24 .29 .17 .21 .25
For alfalfa, managing water to a 4' depth has been recommended. This suggests placing soilmoisture monitoring instruments at about 16" and 32". When used for scheduling purposes, theshallower instrsument indicates when to start irrigations and the deeper instrument is used to checkthe depth of water penetration in addition to monitoring soil moisture at that level.
The goal of the water management program should be to satisfy the crop requirements while usinga minimum amount of water. This makes good economic sense through minimizing pumping costsand conserving both water and energy resources.
Editor's Note: Crop quality can be improved significantly using center pivot and linear irrigationsystems and by following good irrigation scheduling and management practices. However, theproduction of alfalfa under such systems may present several management challenges that requirean adjustment of cropping practices to maximize total yield for the entire cropping season. To harvestalfalfa and get water back on the field as soon as possible when using a center pivot, some growersharvest (swath, bale, chop) one-half of the field at a time. As soon as that one-half has been clearedof the crop, the system is operated on that side. In the same manner, alfalfa fields irrigated by linearsystems may be split.
*This article is based on material provided by Fred G. Bergsrud from his report "Irrigation of Alfalfa,"Department of Agricultural Engineering, University of Minnesota.

54
CORN IRRIGATION WATER MANAGEMENT
Timely irrigations on corn can mean extra bushels at harvest and can limit total waterapplication and pumping costs. By Leon New
Corn irrigations that are applied according to the plant's seasonal water-use pattern (figure A-2) areoften more productive and lead to good irrigation water use efficiency. Irrigation during stages ofgrowth with high water requirements normally gives corn yields a good boost, while only limitedincreases are obtained from irrigations during growth stages that require less water.
fig. A-2.
Typical Corn Daily Water Use in the Texas High Plains
Irrigation Quantity and Frequency
Corn typically can respond efficiently to 22 to 26 inches of seasonal irrigation. A preplant applicationis often beneficial in addition to this, especially where the acreage planted stretches the quantity ofirrigation water available. Prewater can contribute to timely planting, enhance seed germination andstore water in the soil root zone for use by the plants during high water use growth stages whenirrigation capacity may be less than daily plant use.
First irrigation of corn is one of the few opportunities to limit seasonal irrigation without also limitingyield. Dates to achieve best response to the initial summer irrigation are not the same each yearbecause of variations in rainfall, planting dates and hybrids. The irrigation rate is also a major factorinfluencing when to begin irrigating each year. Soil moisture sensors can aid in identifying the timeto begin. Soil moisture can be significantly depleted in the first foot of soil, if good moisture remainsin the second and third foot.
Corn water requirements increase rapidly after the plants have 8 to 10 leaves. During the following3 to 4 weeks, which is the major vegetative growth stage, plants are likely to grow 4 to 5 feet in height.
-
.4 -
-
.3 -
-
-
-
.1 -
-
| | | | | | | | | | | | | | | | | | | | | | | | | | |
25 30 5 10 15 20 25 30 5 10 15 20 25 30 5 10 15 20 25 30 5 10 15 20 25 30 5
4-5Leaves
6-7Leaves
9-10Leaves
TasselsEmerging
Silking
Blister
EarlyDough
Mat. Line1/2 Way
8" - Height
100"
66"
30"
12"
Inch
es P
er D
ay
MayApril August Sept.JulyJune

55
At the same time, adequate soil moisture is important for proper tassel and ear development insidethe plant. Demand for water is particularly high just prior to tasseling.
Silking and Pollination
Highest plant water needs of the season usually occur during silking and pollination and remain highfor about 10 days when grain filling begins. During the following 6 to 7 weeks, the primary plantfunction is to produce grain. Moisture stress during tasseling, silking and pollination periods isnormally quite costly due to delayed silking and poor pollination. Adequate soil moisture isespecially important for complete pollination and for the following 10 to 14 days to achieve maximumseed per ear. Water requirements are likely to be 4 to 5 inches in 10 days, and even more whentemperatures are high, relative humidity is low and wind speed is up.
Blister and Milk Stages
Water requirements remain high during the early stages of grain development, often described asthe blister and milk stages. During this time, grain develops and rapidly increases in weight.Adequate soil moisture must be available during the first 4 weeks of grain filling for high volume grainproduction. Afterward, high soil moisture levels are not as important.
By early dough stage, water requirements normally begin to decrease. However, moistue stresswhile the dough is soft will limit grain fill. As grain matures, corn water needs decrease rapidly (seefigure A-2).
The grain maturity line can be a guide for continuing or terminating irrigation. Corn kernels maturefrom the outward tip inward toward the cob. As kernel maturity progresses, a distinct yellow-whitecolor separation is visible on each kernel and moves inward form the tip of each kernel. It is alsoknown as the maturity line or starch line.
Measuring Grain Maturity
To identify the maturity line, break a corn ear in half and closely inspect the exposed full kernels.Kernels exposed by the external portion of the broken ear show the maturity line more clearly.
On heavier clay and clay loam soils, irrigate until the maturity line has progressed one-third to one-half the inward distance down the kernel. Try to have a full profile of soil moisture at this stage ofgrain maturity. This level of soil moisture is usually adequate for the immature portion of the kernelto maure and to maintain plant quality until harvest.
On sandy soils and on fields where individual irrigations have been consistently light during theseason... corn may need to be irrigated until the maturity line has moved one-half to two-thirds thedistance down the kernel.
Black Layer Formation
Formation of the black layer is a signal of full kernel maturity. The black layer becomes visible afterthe maturity line reaches the inward tip of the kernel, where the kernel attaches to the cob. A darkbrown line first appears and later turns black. It can be located by cutting into the tip of the kernel.
Corn can no longer increase in weight after the black layer appears and reduces in moisture contentduring the drying period before harvest. The only benefit from irrigation after this stage is to maintainplant quality until harvest.
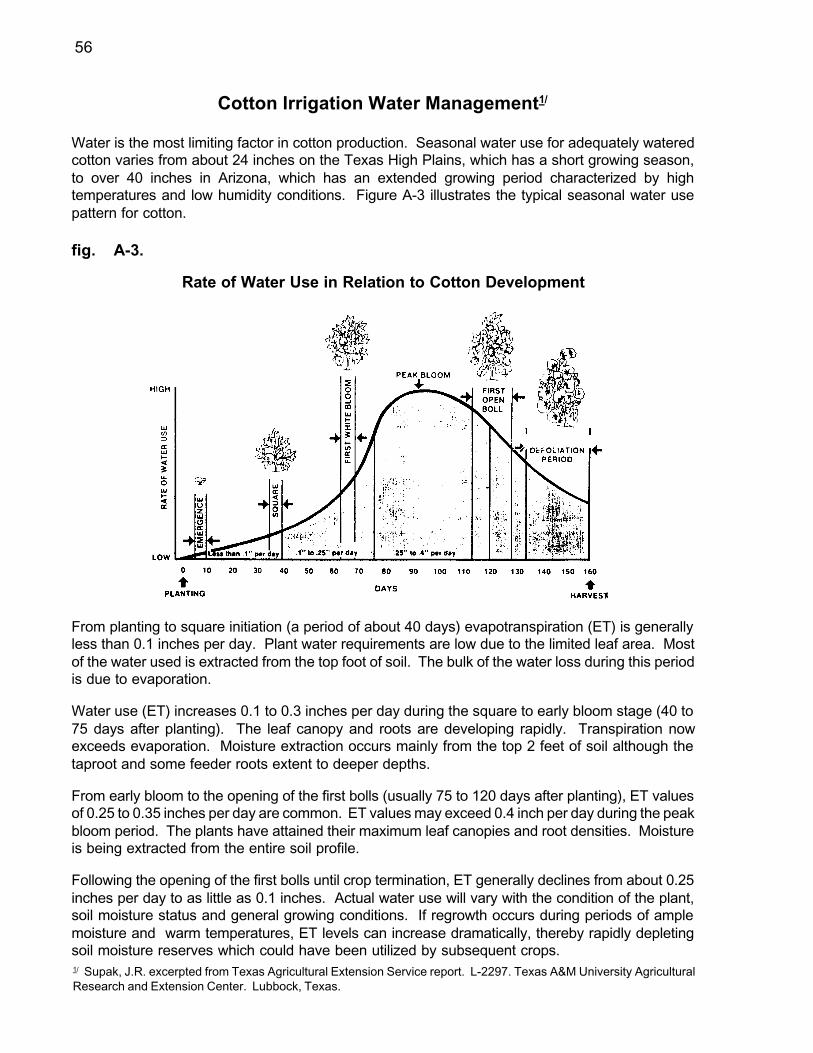
56
Cotton Irrigation Water Management1/
Water is the most limiting factor in cotton production. Seasonal water use for adequately wateredcotton varies from about 24 inches on the Texas High Plains, which has a short growing season,to over 40 inches in Arizona, which has an extended growing period characterized by hightemperatures and low humidity conditions. Figure A-3 illustrates the typical seasonal water usepattern for cotton.
fig. A-3.
Rate of Water Use in Relation to Cotton Development
From planting to square initiation (a period of about 40 days) evapotranspiration (ET) is generallyless than 0.1 inches per day. Plant water requirements are low due to the limited leaf area. Mostof the water used is extracted from the top foot of soil. The bulk of the water loss during this periodis due to evaporation.
Water use (ET) increases 0.1 to 0.3 inches per day during the square to early bloom stage (40 to75 days after planting). The leaf canopy and roots are developing rapidly. Transpiration nowexceeds evaporation. Moisture extraction occurs mainly from the top 2 feet of soil although thetaproot and some feeder roots extent to deeper depths.
From early bloom to the opening of the first bolls (usually 75 to 120 days after planting), ET valuesof 0.25 to 0.35 inches per day are common. ET values may exceed 0.4 inch per day during the peakbloom period. The plants have attained their maximum leaf canopies and root densities. Moistureis being extracted from the entire soil profile.
Following the opening of the first bolls until crop termination, ET generally declines from about 0.25inches per day to as little as 0.1 inches. Actual water use will vary with the condition of the plant,soil moisture status and general growing conditions. If regrowth occurs during periods of amplemoisture and warm temperatures, ET levels can increase dramatically, thereby rapidly depletingsoil moisture reserves which could have been utilized by subsequent crops.1/ Supak, J.R. excerpted from Texas Agricultural Extension Service report. L-2297. Texas A&M University AgriculturalResearch and Extension Center. Lubbock, Texas.
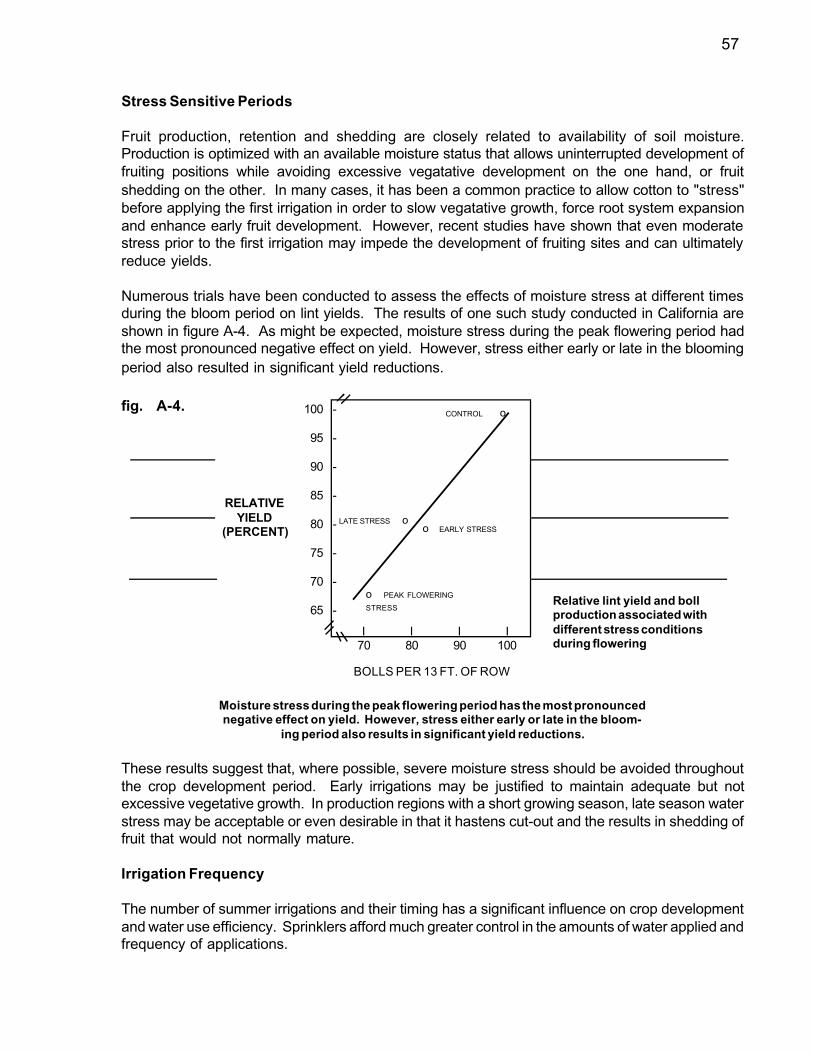
57
100 -
95 -
90 -
85 -
80 -
75 -
70 -
65 -
CONTROL o
LATE STRESS oo EARLY STRESS
o PEAK FLOWERING
STRESS
I I I I70 80 90 100
RELATIVEYIELD
(PERCENT)
Relative lint yield and bollproduction associated withdifferent stress conditionsduring flowering
Stress Sensitive Periods
Fruit production, retention and shedding are closely related to availability of soil moisture.Production is optimized with an available moisture status that allows uninterrupted development offruiting positions while avoiding excessive vegatative development on the one hand, or fruitshedding on the other. In many cases, it has been a common practice to allow cotton to "stress"before applying the first irrigation in order to slow vegatative growth, force root system expansionand enhance early fruit development. However, recent studies have shown that even moderatestress prior to the first irrigation may impede the development of fruiting sites and can ultimatelyreduce yields.
Numerous trials have been conducted to assess the effects of moisture stress at different timesduring the bloom period on lint yields. The results of one such study conducted in California areshown in figure A-4. As might be expected, moisture stress during the peak flowering period hadthe most pronounced negative effect on yield. However, stress either early or late in the bloomingperiod also resulted in significant yield reductions.
fig. A-4.
BOLLS PER 13 FT. OF ROW
Moisture stress during the peak flowering period has the most pronouncednegative effect on yield. However, stress either early or late in the bloom-
ing period also results in significant yield reductions.
These results suggest that, where possible, severe moisture stress should be avoided throughoutthe crop development period. Early irrigations may be justified to maintain adequate but notexcessive vegetative growth. In production regions with a short growing season, late season waterstress may be acceptable or even desirable in that it hastens cut-out and the results in shedding offruit that would not normally mature.
Irrigation Frequency
The number of summer irrigations and their timing has a significant influence on crop developmentand water use efficiency. Sprinklers afford much greater control in the amounts of water applied andfrequency of applications.

58
Frequent light irrigations provide a suitable environment for root development in the upper foot ofsoil where nutrients and water are concentrated and oxygen is most abundant. Gradual depletionof soil moisture reserves through deficit irrigation provides for control of plant growth anddevelopment even if rainfall amounts exceed normal expectations.
Irrigation Termination
Ideally, the last irrigation should provide just enough plant available moisture to retain and matureall the bolls that have a reasonable chance of producing lint of acceptable quality under normalgrowing conditions. Based on long term seasonal conditions at Lubbock, blooms se on August 10have a 100 percent probability of producing a mature boll of cotton whereas blooms set on August15 and 25 and September 1, respectively, have only a 71, 29 and 14 percent, respectively, chanceof reaching maturity. Consequently, in the Lubbock area, irrigations that bring soil moisture levelsto near field capacity should be terminated by mid-August. Deficit irrigations with sprinklers couldfeasibly be extended until early September to minimize fruit shed.
In any given locale, the last irrigation will be dependent on seasonal conditions, soil type and the typeof irrigation system being utilized.

59
This graph represents grain sorghumevapotranspiration measured in 1988 atBushland, Texas. The data is represen-tative of fully-irrigated grain sorghum inthe Southern High Plains with good yields(actual yield was 134 bu./acre or 7500lbs./acre). Graph provided by Dr. TerryHowell, USDA-ARS, Bushland, Texas.
GRAIN SORGHUM IRRIGATION WATER MANAGEMENT
A 3-Year Performance Test By the University of Nebraska Resulted in a 50% Increase inYield for Irrigated vs. Dryland Production.
With irrigation, corn has traditionally been grown rather than grain sorghum because of a higher yieldpotential. However, there is increasing interest in irrigating grain sorghum because less water andlower inputs of fertilizer, labor and energy are required. In a 3-year grain sorghum varietyperformance test in south central Nebraska, yields were 122 bu./acre (6,832 lbs.) under irrigationand 82 bu./acre (4,592 lbs.) with dryland production, or a 40 bu. (2,240 lbs.) increase due toirrigation.
Grain sorghum production may be an attractive alternative when limited irrigation water is available.Although grain sorghum exhibits drought resistance characteristics, good irrigation water manage-ment and adequate soil moisture are essential for optimum yields. This means maintaining the soilmoisture supply between field capacity and 50% depletion. By not completely refilling the soil profile,any rainfall received can be more efficiently used.
The daily water use of a grain sorghum plant will be low (less than 0.1" per day) as a seeding andincrease to a peak (as much as 0.3" per day or more) during mid-summer when the plant is in theflower-dough stages of growth. (Actual daily water use can vary considerably from day to daydepending on temperature, solar radiation, humidity and wind conditions--see figure A-5).
fig. A-5.
Consumptive Water Use Curve/Grain Sorghum
Germination, Emergence and Rapid Growth
An adequate supply of soil moisture immediately adjacent to the seed is essential for the seed togerminate, emerge and rapidly develop its early root system. If the soil moisture reservoir of mediumtextured soils in western Nebraska and Kansas is not filled prior to planting, a pre-plant irrigation canbe used to fill the profile. This supply of soil moisture will be sufficient to meet the moisture needsof the crop for approximately 30-40 days during the rapid growth stage without additionalprecipitation or irrigation during this period. Normal moisture needs of the crop throughout thisperiod in Nebraska will be 5-7" (6-8 1/2" in Texas), or approximately one-third of the total annualneeds.

60
Reproduction Through Maturity
The most beneficial periods for applying irrigation water are at the boot stage (approximately 7weeks after emergence) and half-bloom stage (approximately 8 1/2 weeks after emergence).Severe moisture stress during the boot stage may prevent the head from extending completely fromthe flag leaf sheath, preventing complete pollination at flowering time. Severe moisture stress athalf-bloom stage can result in "blasting" and poor grain filling. This condition will cause yields todecrease, and may be further impacted by hot, windy and low humidity weather conditions.
The reproductive stages for grain sorghum take place during a period (about 60 days afteremergence) when climatic conditions are not as favorable for plant development. The evapotrans-piration demands are at a high level during this period--typically 25 to 40 days long. About 8-10" ofwater--nearly half the total moisture needs of the plant--are consumed. Some growers plant earlier,others later in order to avoid the hottest period of the summer at this stage of growth.
Adequate water is required by the plant for the maturity process to continue past this point at anoptimum rate. By the hard dough stage, about 3/4 of the grain dry weight has accumulated. Atphysiological maturity, the maximum total dry weight of the plant has occurred. The time fromflowering to physiological maturity varies with the hybrid and environmental conditions; however, itrepresents about 1/3 of the total time from planting.
The total water requirements of the plant during this period are relatively small. However, it isessential that adequate moisture be available to permit the development of full, plump seed and toprevent lodging of the seed.
Optimum Irrigation Management
The management procedure for maintaining the soil moisture supply in the crop root zone betweenfield capacity and 50% depletion will vary by type of soil and irrigation system. For center pivotsystems, irrigators will usually make frequent applications of about 1", while continuing to maintaina soil-water deficit to allow room for rainfall. Those irrigating with gravity systems will make larger,less frequent applications.
To ensure a satisfactory soil moisture supply for the grain sorghum crop, particular attention shouldbe given to soil moisture status at these critical stages in the plant's life cycle: germination andseedling stage; boot stage; half-bloom stage; grainfill stage (see Table A-16).
Table A-16.
Identifying Characteristics and Approximate Time Intervals Between Growth Stages of Sorghum
Growth Approx. days afterstage emergence Identifying Characteristic
0 0 Emergence. Coleoptile visible at soil surface.1 10 Collar of 3rd leaf visible.2 20 Collar of 5th leaf visible.3 30 Growing point differentiation. Approximately 8-leaf stage by previous criteria.4 40 Final leaf visible in whorl.5 50 Boot. Head extended into flag leaf sheath.6 60 Half-bloom. Half of plants at some stage of bloom.7 70 Soft dough.8 85 Hard dough.9 95 Physiological maturity. Maximum dry matter accumulation.
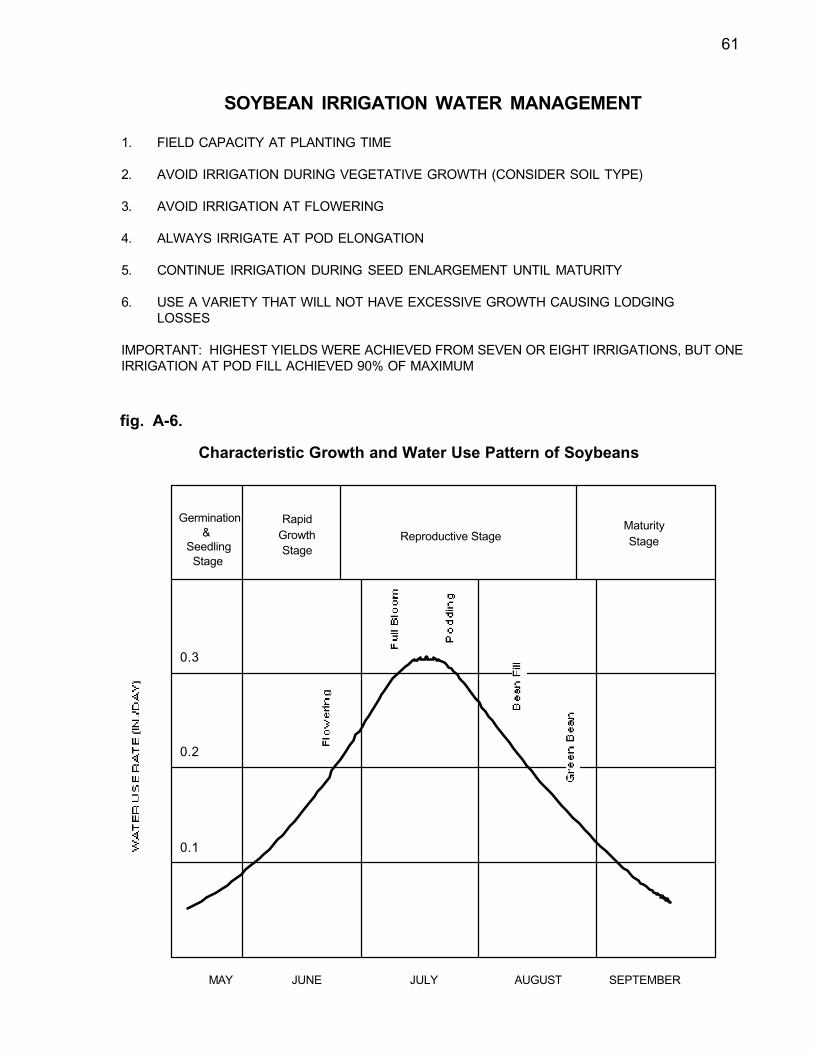
61
Germination&
SeedlingStage
RapidGrowthStage
Reproductive StageMaturityStage
0.3
0.2
0.1
MAY JUNE JULY AUGUST SEPTEMBER
fig. A-6.
Characteristic Growth and Water Use Pattern of Soybeans
SOYBEAN IRRIGATION WATER MANAGEMENT
1. FIELD CAPACITY AT PLANTING TIME
2. AVOID IRRIGATION DURING VEGETATIVE GROWTH (CONSIDER SOIL TYPE)
3. AVOID IRRIGATION AT FLOWERING
4. ALWAYS IRRIGATE AT POD ELONGATION
5. CONTINUE IRRIGATION DURING SEED ENLARGEMENT UNTIL MATURITY
6. USE A VARIETY THAT WILL NOT HAVE EXCESSIVE GROWTH CAUSING LODGINGLOSSES
IMPORTANT: HIGHEST YIELDS WERE ACHIEVED FROM SEVEN OR EIGHT IRRIGATIONS, BUT ONEIRRIGATION AT POD FILL ACHIEVED 90% OF MAXIMUM

62
WHEAT IRRIGATION WATER MANAGEMENT 1/
Irrigation requirements for winter wheat include fall application to establish the crop and torecharge soil moisture.
Wheat ranks third in irrigated crop area inthe United States behind corn and alfalfa, and wheatgrowers have increased yields by 32% during a 20-year period through the 1980s. About half of theincrease in wheat yields is due to improved plant breeding, but increased yields can also beattributed to better crop management, increased fertilizer use and improved irrigation practices andequipment. Studies in the semiarid climate of the Southern High Plains by Jack Musick, USDAAgricultural Engineer, Bushland, Texas, found the annual yield increase for irrigated wheat duringa 17-year period through 1984 was double that of dryland wheat.
In the Texas High Plains, thousands of acres of wheat are irrigated by furrow irrigation whereapplication efficiencies are estimated in the range of 50% to 80%. Sprinkler application efficiencies,however--measured from 223 field evaluations of center pivot systems--were in the 80% to 90%range...and were even higher with lower windspeeds.
Irrigation water requirements for winter wheat consist of initial fall application--for crop establish-ment and to recharge the soil moisture profile--and seasonal irrigations to meet evapotransportationdemands. Winter wheat's response to spring irrigation illustrates the importance of early seasonirrigation--such as application during jointing-which encourages the plant to retain tillers, producemore heads and increase seed numbers for maximum yield. In one study, a stress period duringjointing reduced seed numbers by 45%.
The number of mid-season irrigations required for wheat range from only one to as many as six orseven, depending on the region, seasonal ET requirements, initial soil water storage, seasonalrainfall, application amounts, yield goals and irrigation application efficiency.
Average Daily Rate of Water Use by Phenological Periods for Irrigated Winter WheatGrown under Optimum Soil Moisture, Garden City, KS '57-'59
Water UsePeriod Inch per DayFall (October ..................................................................................... 0.07Winter (November-February) ............................................................ 0.03Beginning of spring growth to the jointing stage (March-April) ............ 0.09Jointing-to-boot stage (May 1-15) ...................................................... 0.16Boot-to-flower stage (May 15-28) ...................................................... 0.25Flower-to-milk stage of grain (May 28-June 6) ................................... 0.35Milk-to-dough stage of grain (June 6-13) ........................................... 0.30Dough stage to maturity (June 13-28) ............................................... 0.15
A successful irrigation water management practice on Pullman clay loam at Bushland, Texas, hasbeen to apply an irrigation (if needed) for soil profile water storage during fall growth, delay the firstspring irrigation to jointing stage in April, and then apply a second spring irrigation during boot stageto flowering. In field trials, yield response has been excellent to one and two well- timed springirrigations.
1/ Information in this article provided by J. T. Musick, Agricultural Engineer, USDA-Agricultural Research Service,Conservation and Production Research Laboratory. Bushland, TX, and K. B. Porter, Professor of Agronomy, TAES-TAMU, Amarillo, TX.
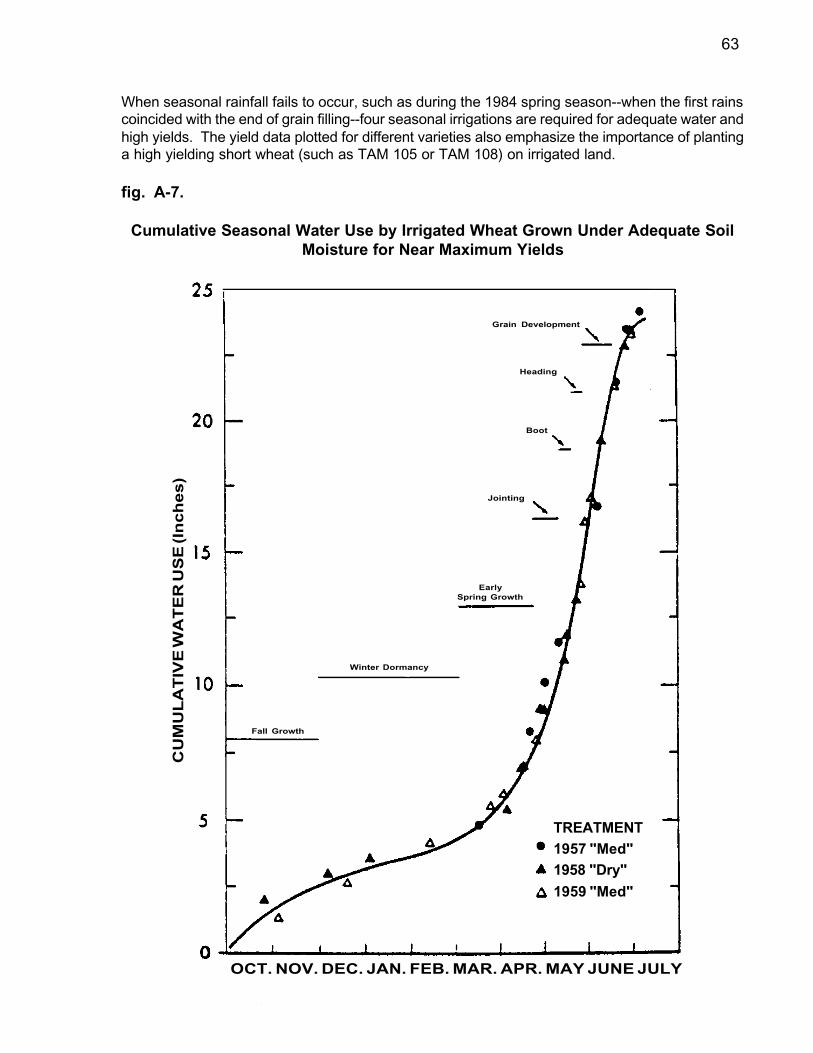
63
When seasonal rainfall fails to occur, such as during the 1984 spring season--when the first rainscoincided with the end of grain filling--four seasonal irrigations are required for adequate water andhigh yields. The yield data plotted for different varieties also emphasize the importance of plantinga high yielding short wheat (such as TAM 105 or TAM 108) on irrigated land.
fig. A-7.
Cumulative Seasonal Water Use by Irrigated Wheat Grown Under Adequate SoilMoisture for Near Maximum Yields
Grain Development
Heading
Boot
Jointing
Fall Growth
EarlySpring Growth
Winter Dormancy
OCT. NOV. DEC. JAN. FEB. MAR. APR. MAY JUNE JULY
CU
MU
LA
TIV
E W
AT
ER
US
E (I
nch
es)
TREATMENT1957 "Med"1958 "Dry"1959 "Med"

64
CALCULATING EVAPOTRANSPIRATION (ET)
Irrigation management strategies continually require evaluation of water and energy efficiencies. Inorder to evaluate correlation of irrigation water and energy requirements, a reference ET [obtainedfrom local weather station data or calculated herein by equations (A4) - (A8)] plus crop ETcalculations need to be combined to reliably estimate crop water use during the growing season.
Calculation of crop ET requires determining several component factors: (i) a ratio of actual crop ETvs. a reference crop ET; (ii) a measure of a basal crop coefficient based off a given crop’sphotothermal units required for growth from emergence to physiological maturity, with a breakdownof those photothermal units expressed as a fraction of the growing season related to specific cropgrowth stages; (iii) soil moisture holding capacity and daily soil moisture levels; and (iv) radiant solarenergy measurements, measured directly with a pyronometer or obtained from local weather stationdata.
Calculation of crop ET for any given crop has several component sub-calculations1/:
A B C D CCROP ET = (Kcb X Ka X ETr) + (Ks X ETr)
Explanation of terms A , B , C , and D follow:
A Kcb = basal crop coefficient
(A1) =KaETET
r
m
(A2) ETm = measured ET= soil water depletion (in.) during a given measurement time interval (days).
(A3) ETr = reference ET by the Jensen-Haise method, with an advection term (A) added.
=
In equation (A3), the conversion factor 0.0394 should not be used if ET has been obtained alreadycalculated and is expressed in inches of water per day. The conversion factor should be used if ET figuresare expressed in milliliters of water per day. If the desired units in the calculation are to be in milliliters,do not use the conversion factor.
(A4) ETJH =
(A5) T = average daily air temperature (Cº)
=
(A6) R = daily solar radiation in MJM-2:measured directly with a pyronometer (Eppley ModelPSP:Eppley Laboratory, Newport, RI; LI-COR Model LI-200S:LI-COR Inc., Lincoln,NE), or obtained from local weather station data.
(A7) L = 2.493 - 0.00214TT = equation from (A5)
(A8) A = 0.05 X (Tmax - 33)Tmax = maximum daily temp. Cº
1/Amos, B., L. R. Stone, and L. D. Bark. 1989. Fraction of thermal units as the base for an evapotranspiration cropcoefficient curve for corn. Agron. J. 81:713-717.
0.0394)] A ET([ET JHJH ××+
L
]R)0.0252T0.078[( ×+
2min.Tmax.T +
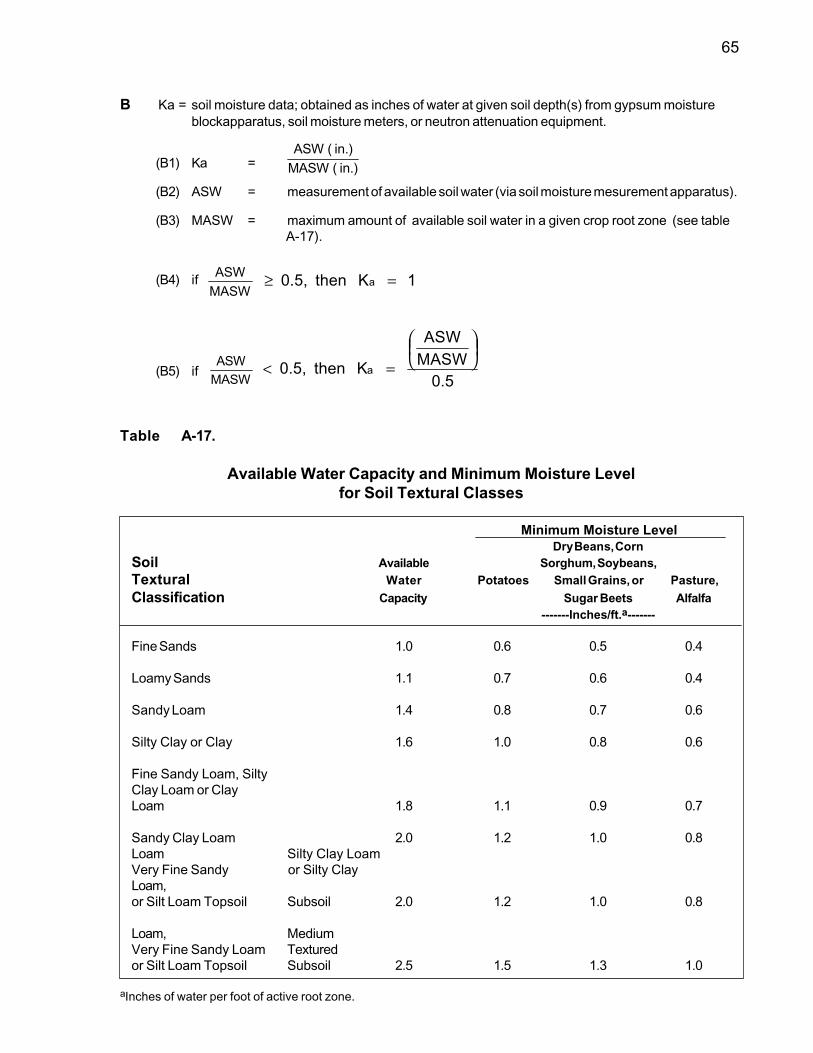
65
B Ka = soil moisture data; obtained as inches of water at given soil depth(s) from gypsum moistureblockapparatus, soil moisture meters, or neutron attenuation equipment.
(B1) Ka =
(B2) ASW = measurement of available soil water (via soil moisture mesurement apparatus).
(B3) MASW = maximum amount of available soil water in a given crop root zone (see table A-17).
(B4) ifMASWASW 1Kthen0.5, a =≥
(B5) if0.5
MASWASW
Kthen0.5, a
=<
Table A-17.
Available Water Capacity and Minimum Moisture Levelfor Soil Textural Classes
Minimum Moisture LevelDry Beans, Corn
Soil Available Sorghum, Soybeans,Textural Water Potatoes Small Grains, or Pasture,Classification Capacity Sugar Beets Alfalfa
-------Inches/ft.a-------
Fine Sands 1.0 0.6 0.5 0.4
Loamy Sands 1.1 0.7 0.6 0.4
Sandy Loam 1.4 0.8 0.7 0.6
Silty Clay or Clay 1.6 1.0 0.8 0.6
Fine Sandy Loam, SiltyClay Loam or ClayLoam 1.8 1.1 0.9 0.7
Sandy Clay Loam 2.0 1.2 1.0 0.8Loam Silty Clay LoamVery Fine Sandy or Silty ClayLoam,or Silt Loam Topsoil Subsoil 2.0 1.2 1.0 0.8
Loam, MediumVery Fine Sandy Loam Texturedor Silt Loam Topsoil Subsoil 2.5 1.5 1.3 1.0
aInches of water per foot of active root zone.
in.)(MASWin.)(ASW
MASWASW
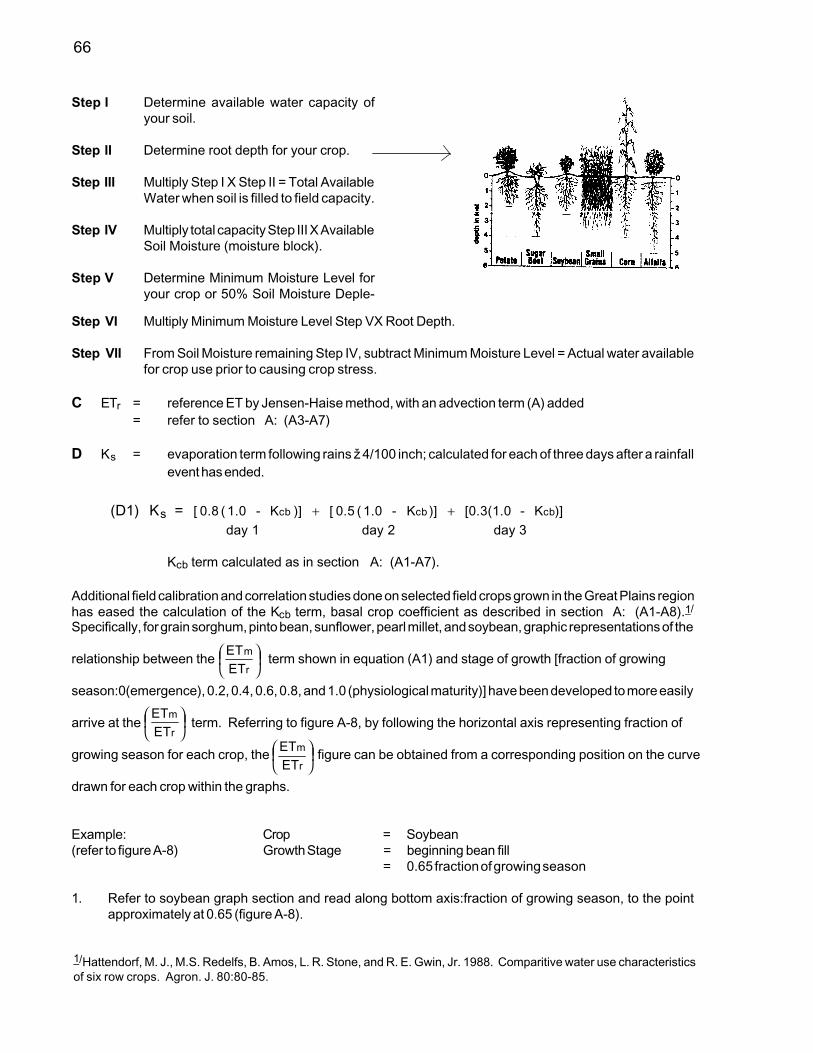
66
Step I Determine available water capacity ofyour soil.
Step II Determine root depth for your crop.
Step III Multiply Step I X Step II = Total AvailableWater when soil is filled to field capacity.
Step IV Multiply total capacity Step III X AvailableSoil Moisture (moisture block).
Step V Determine Minimum Moisture Level foryour crop or 50% Soil Moisture Deple-
Step VI Multiply Minimum Moisture Level Step VX Root Depth.
Step VII From Soil Moisture remaining Step IV, subtract Minimum Moisture Level = Actual water availablefor crop use prior to causing crop stress.
C ETr = reference ET by Jensen-Haise method, with an advection term (A) added= refer to section A: (A3-A7)
D Ks = evaporation term following rains ž 4/100 inch; calculated for each of three days after a rainfallevent has ended.
(D1) Ks = )]K-[0.3(1.0)]K-1.0(0.5[)]K-1.0(0.8[ cbcbcb ++ day 1 day 2 day 3
Kcb term calculated as in section A: (A1-A7).
Additional field calibration and correlation studies done on selected field crops grown in the Great Plains regionhas eased the calculation of the Kcb term, basal crop coefficient as described in section A: (A1-A8).1/
Specifically, for grain sorghum, pinto bean, sunflower, pearl millet, and soybean, graphic representations of the
relationship between the term shown in equation (A1) and stage of growth [fraction of growing
season:0(emergence), 0.2, 0.4, 0.6, 0.8, and 1.0 (physiological maturity)] have been developed to more easily
arrive at the term. Referring to figure A-8, by following the horizontal axis representing fraction of
growing season for each crop, the figure can be obtained from a corresponding position on the curve
drawn for each crop within the graphs.
Example: Crop = Soybean(refer to figure A-8) Growth Stage = beginning bean fill
= 0.65 fraction of growing season
1. Refer to soybean graph section and read along bottom axis:fraction of growing season, to the pointapproximately at 0.65 (figure A-8).
1/Hattendorf, M. J., M.S. Redelfs, B. Amos, L. R. Stone, and R. E. Gwin, Jr. 1988. Comparitive water use characteristicsof six row crops. Agron. J. 80:80-85.
r
m
ETET
r
m
ETET
r
m
ETET

67
2. From the 0.65 point, draw a vertical line upward that intersects the curve-line drawn within the graph.
3. Where the vertical line from the 0.65 point intersects the curve-line, draw a horizontal line to the left so
as to intersect the vertical axis representing measured ET/reference ET by J-H, the term in
equation (A1).
4. For soybean, then, the = 1.09 when at growth stage beginning bean fill, as expressed by
fraction of growing season = 0.65.
fig. A-8.
Measured ET/Reference ET by the Jensen-Haise Equation vs. Fraction of growingSeason for the Six Row Crops. Arrows Indicated Growth Stages; Silk Emergencein Corn, 50%Bloom in Grain Sorghum and Pearl Millet, Beginning Pod Set in Pinto
Bean and Soybean, and 50% Flowering of Disk in Sunflower.
Table A-18.
ME
AS
UR
ED
ET
/RE
FE
RE
NC
E E
T B
Y J
-H
r
m
ETET
r
m
ETET

68
Summary of Thermal or Photothermal Units from Emergence to PhysiologicalMaturity and the Fraction of Total Growing Season Units Accumulated from
Emergence to Selected Growth Stages of the Six Crops_________________________________________________________________
Sum of ther-mal or photo- fraction of
Crop Growth Stage thermal units growing season____________________________________________________________________________________________________________________
Corn Emerg. to physiol. mat. 1558 (6)†
Tassel emergence 0.47 (0.03)Silk emergence 0.52 (0.03)Blister kernel 0.63 (0.04)
Grain Emerg. to physiol. mat. 1405 (23)Sorghum Boot 0.47 (0.02)
50% bloom 0.57 (0.01)Soft dough 0.72 (0.02)
Pearl Emerg. to physiol. mat. 1357 (15)Millet Boot 0.42 (0.03)
50% bloom 0.52 (0.02)Soft dough 0.69 (0.02)
Pinto Emerg. to physiol. mat. 1246 (66)Bean Beginning bloom 0.34 (0.04)
Beginning pod set 0.44 (0.03)Beginning bean fill 0.52 (0.02)
Soybean Emerg. to physiol. mat. 2.39 (0.07)Beginning bloom 0.45 (0.01)Beginning pod set 0.55 (0.01)Beginning bean fill 0.65 (0.01)
Sunflower Emerg. to physiol. mat. 1522 (17)Bud formation of head 0.31 (0.02)50% flowering of disk 0.59 (0.01)
____________________________________________________________________________________†The value in parentheses is the standard error of the mean, where n = 3 for sunflower and n = 4 for all other crops.
For corn the entire Kcb calculation as shown in section A: (A1-A8) and supported in section B: (B1-B5) canbe attained by referring to a graphic representation relating K cb (basal crop coefficient) to fraction of thermal units(figure A-9), supported by Table A-19, which summarizes corn total thermal units from crop emergence tophysiological maturity and the fraction of total growing season thermal units accumulated from crop emergenceto selected growth stages.1/
Example: Growth Stage = blister kernel(refer to figure A-9, = 0.62 fraction of thermal units (FTU)and Table A-19)
1. Refer to the bottom, horizontal axis labeled fraction of thermal unit (FTU) and find the point correspondingto 0.62 (figure A-9).
1/Amos, B., L. R. Stone, and L. D. Bark. 1989. Fraction of thermal units as the base for an evapotranspiration cropcoefficient curve for corn. Agron. J. 81:713-717.
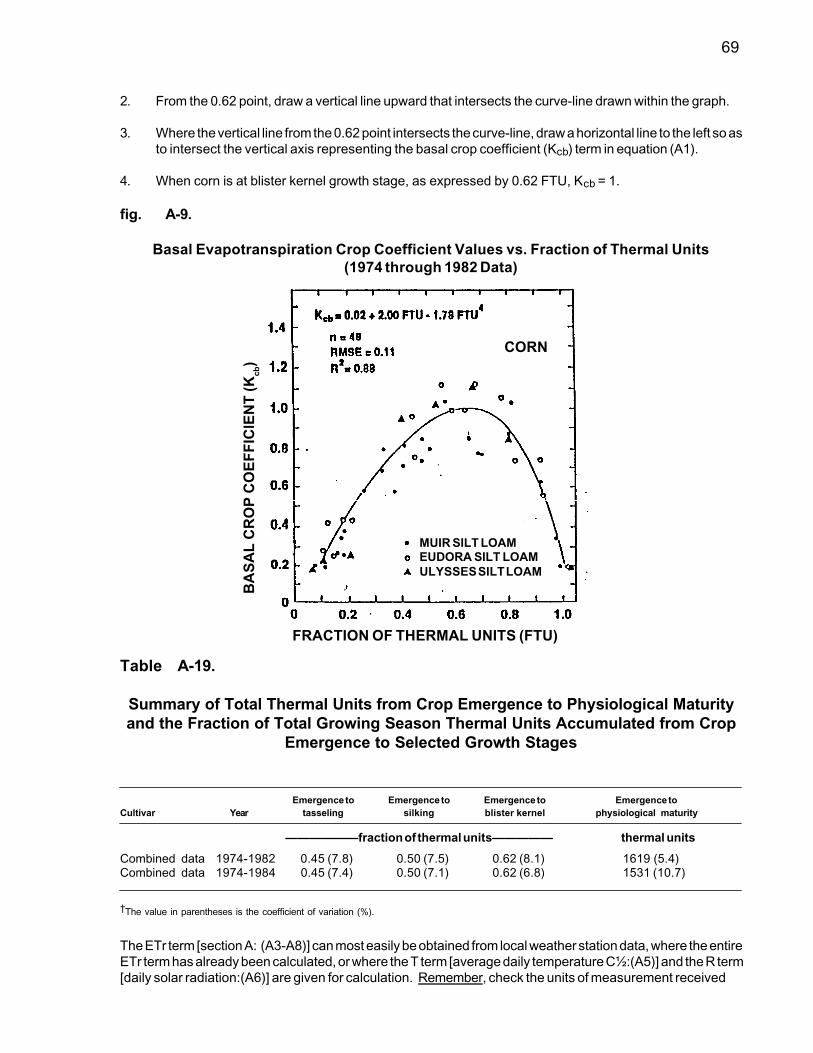
69
2. From the 0.62 point, draw a vertical line upward that intersects the curve-line drawn within the graph.
3. Where the vertical line from the 0.62 point intersects the curve-line, draw a horizontal line to the left so asto intersect the vertical axis representing the basal crop coefficient (Kcb) term in equation (A1).
4. When corn is at blister kernel growth stage, as expressed by 0.62 FTU, Kcb = 1.
fig. A-9.
Basal Evapotranspiration Crop Coefficient Values vs. Fraction of Thermal Units(1974 through 1982 Data)
Table A-19.
Summary of Total Thermal Units from Crop Emergence to Physiological Maturityand the Fraction of Total Growing Season Thermal Units Accumulated from Crop
Emergence to Selected Growth Stages
Emergence to Emergence to Emergence to Emergence toCultivar Year tasseling silking blister kernel physiological maturity
——————fraction of thermal units————— thermal units
Combined data 1974-1982 0.45 (7.8) 0.50 (7.5) 0.62 (8.1) 1619 (5.4)Combined data 1974-1984 0.45 (7.4) 0.50 (7.1) 0.62 (6.8) 1531 (10.7)
†The value in parentheses is the coefficient of variation (%).
The ETr term [section A: (A3-A8)] can most easily be obtained from local weather station data, where the entireETr term has already been calculated, or where the T term [average daily temperature C½:(A5)] and the R term[daily solar radiation:(A6)] are given for calculation. Remember, check the units of measurement received
MUIR SILT LOAMEUDORA SILT LOAMULYSSES SILT LOAM
FRACTION OF THERMAL UNITS (FTU)
BA
SA
L C
RO
P C
OE
FF
ICIE
NT
(Kcb
)
CORN

70
from weather station and apply the comment following equation (A3) to insure ET calculations are in the desiredunits (inches or millimeters).
When all necessary crop ET calculations have been made, add the resulting crop ET results to the referenceET figure [obtained from local weather station data or by calculation contained herein by equations (A4) - A8)].The crop ET values will add consierable consumptive water use to the overall ET figure for any given crop,especially as crops (such as corn, grain soghum or soybeans) attain reproductive stages of growth.

71
MATERIALS AND AGRONOMICS
OF
SECONDARY AND MICRONUTRIENT ELEMENTS1/
1/ Guidelines supplied by R. D. Curley, C.P.Ag., Soils and Fertilizer Consultant

72
SOURCE % Ca
LIMESTONE:CALCITIC (CaCO
3) 40
DOLOMITIC (CaCO3+MgCO
3) 30-32
GYPSUM (CaSO4) 23
CHELATES & LIQUIDSPROMESOL 30 8
CHELATE 3-5
CALCIUM NITRATE 19
REMARKS
Very fine material (-325 mesh); dusty, should behandled in a closed system; hydrates; formsinsoluble precipitate with phosphorus.
15-18% S, Sulfate sulfur source primarily but forpeanuts also supplies soluble Ca essential atpegging time; neutral salt, normally used as anammendment on sodium alkali soils to replacethe sodium on the exchange complex with cal-cium to improve internal drainage and aeration.
A liquid calcium "chelated" with tri-hydroxy-glutaric acid; soluble source of calcium in liquidfertilizers and for foliar treatments.
Soluble source of calcium for liquid fertilizersand foliar application.
Highly soluble in water; cannot be used withphosphate formulations; also good source ofnitrogen.
AGRONOMIC CONSIDERATIONS
1. Limestone is used to increase soil pH of acidsoils, supplying needed calcium for plant nutri-tion. Lime also increases soil microbial activity,availability of Mo and phosphate and generallyimproves soil tilth.
2. High rates of acidifying fertilizers over time in-crease the need for lime applications.
3. The finer the lime, the quicker the change in soilpH.
4. Low organic matter, sandy soils required rela-tively low rates of lime to change pH--follow a soiltest to determine amount and time of application.
MIXING INSTRUCTIONS
1. Add fine materials to the mixer over the top afterthe water addition, slowly.
2. Add TSPP (tetra sodium phyrophosphate) as adispersant to the water (1-2%).
3. Use liquid clay, preferably added to the mix last;permitting addition of the lime to pure water.Usually 1% dry clay is sufficient.
4. A practical limit of 60% fine lime in the mix shouldbe observed.
5. Urea added to a lime mix will hydrolize NH3,creating potential loss of N from the mix and thesoil surface if left unincorporated after applica-tion. Other ammonium sources of nitrogen (am-monium sulfate) may also volatize to NH3.
6. Improve calcitic lime mix by added 10% by weightK-Mag at beginning of mix cycle.
CALCIUM
CALCIUM

73
MAGNESIUMSOURCE % Mg
MAGNESIUM SULFATE (MgSO4) 10
(Epsom Salts)(Kieserite)
MAGNESIUM OXIDE (MgO) 58(Flo-Mag) Brand Names
MAGNESIUM CHLORIDE (MgCl2) 8
SULFATE OF POTASH-MAGNESIA 10-11(Langbeinite)
Suspension Grade K-Mag (10) (16 MgO)Fine Sul-Po-Mag (11) (18 MgO)
MAGNESIUM NITRATE 6.31(Mg(NO
3)
2)
AGRONOMIC CONSIDERATIONS
1. Deficiencies or insufficiencies found mostly inlow pH soils (acid).
2. Low organic matter, sand soils and highly leachedsoils generally contain lower levels of exchange-able Mg.
3. Mg is a constituent of chlorophyll necessary forcarbohydrate synthesis by green plants.
4. Deficiency symptoms show up as yellow to whitestriping on lower leaves first due to translocationfrom older to newer plant parts (meristematictissue).
5. Essential for starch, oils and fats, and sugarformation in plants.
6. Forage plants containing less than .2% Mg pro-duce high incidence of grass tetany in ruminantanimals (Hypomagnesemia)
MIXING INSTRUCTIONS
1. Fine dry products--a. MgSO4 and Mg Oxide--slowly add to the
mixer over the top or through an eductorbefore addition of phosphate.
b. Suspension Grade K-Mag--add to the mixerover the top, at medium rate, to the waterprior to addition of any fertilizer salts anddisperse for 3-5 minutes.
c. Fine Sul-Po-Mag--add as the last ingredientto the mix.
2. Liquid products--add at any time during the mixcycle, preerably ahead of phosphate.
3. Do not exceed ratio of 1.5 parts K-Mag: 1 partformulation water. For desirable fluidity, addUAN solution to the dispersed K-Mag to blockthe hydration process; flush mix tank and applica-tor with 50-100 gallons of UAN solution or liquidclay (8%).
4. Practical limit to 2-2.5% Mg in phosphate mixeswhich cannot be stored.
REMARKS
13% S: highly soluble; fine crystalline material;hygroscopic (takes on water from air); high cost.
Particle size is -200 mesh; forms Mg(OH2) in
water importing alkaline reaction (pH) to mix;relatively insoluble in water.
Liquid; acid pH; corrosive to mild steel; Cl2 con-
tent.
PROPERTIES K-MAG SUL-PO-MAG
Analysis 0-0-20-10Mg-20S 0-0-22-11Mg-22SParticle Size -10 to 100 mesh -20 meshDensity 63-66 lbs/ft3 94-96 lbs/ft3
Dispersion Complete in Water None, remain asto -200 mesh -20 mesh
Liquid for foliar and clear liquids; relatively ex-pensive.
MAGNESIUM

74
SULFUR
SOURCE % S
AMMONIUM SULFATE 24
SULFATE OF POTASH-MAGNESIA 20-22
POTASSIUM SULFATE -17-18
MAGNESIUM SULFATE 12-13
CALCIUM SULFATE (GYPSUM) 15-18
ELEMENTAL (WETTABLE) SULFUR 90
AMMONIUM THIOSULFATE 26
POTASSIUM THIOSULFATE 17
AMMONIUM BISULFITE 17
SULFATES OF MICRONUTRIENTS Zn - 18% S
Mn - 13-18% SFe - 19% SCu - 13% S
SULFUR
AGRONOMIC CONSIDERATIONS
1. Deficiency or insufficiency is most likely in acid,sandy soils and medium-textured soils of loworganic matter.
2. Release as available sulfur from decompositionof organic matter; therefore, cool, wet soils maynot supply sufficient sulfur during early growthstages of young seedlings. May leach out of rootzone with water.
3. Essential for protein synthesis (nitrate reduction;a constituent of cysteine and methionine (aminoacids).
4. N:S ratio of 10:1 in plants necessary for normalfunctioning and digestibility.
5. Elemental S must be oxidized to SO4= (Sulfate)
before plants can utilize it. Formation of sulfuricacid occurs with oxidation.
MIXING INSTRUCTIONS
1. All fine dry materials except wettable S andAN--add to the mixer over the top, with restraint,after adding phosphate.
2. Do not recommend gypsum (calcium sulfate) tobe added to phosphate mixes. Best system is inwater suspension alone.
3. WETTABLE SULFUR--best added to mixes as apre-mixed N-S base containing 1.5% clay.
4. AMMONIUM SULFATE--best added as a pre-mix solution (8-0-0-9S) or suspension (10.5-0-0-12S) at end of mix cycle.
5. Add liquid Ammonium Thiosulfate and Ammo-nium Bisulfite at any point in the mix--preferablyahead of phosphate.
REMARKS
21% N; sulfate sulfur source, low solubility; fine crys-talline material.
Suspension grade K-Mag or fine Sul-Po-Mag; some-what abrasive (K-Mag) to extremely abrasiave (Sul-Po-Mag); contains 20-22% K2O and 10-11% Mg (16-18% MgO).
50-52% K2O; fine crystalline material.
10% Mg; epsom salts (MgSO4); fine crystalline-material; somewhat expensive.
Fine powdered by-product of coal fired power plantsand phosphoric acid production; economical close tosource of production; high impurity content.
Very fine powder; dusty, irritates skin; insoluble; acidforming (good for Fe and Mn mixes).
12% N; liquid form, non-pressure, no free ammonia;reducing agent.
25% K; liquid form, non-pressure, no free ammonia,reducing agent.
8.5% N; liquid form, non-pressure, no free ammonia.
All sulfate sulfur sources which should be credited informulations.

75
AGRONOMIC CONSIDERATIONS
1. Deficiency in high pH soils due to low zinc solu-bility (Far West & Great Plains).
2. Leachable in sandy soils, creating deficiencyunder high rainfall or irrigation practices ofoverwatering.
3. Essential for chlorophyll formation; reactions inplants.
4. Sensitive plants--corn and sorghum acreages inU.S.:
Corn--80 million (36 million west of Missis-sippi River)Sorghum--15 million (13 million west of Mis-sissippi River)
5. Zn(NH3)++ complex not very effective in alkaline(high pH) soils.
SOURCE % Zn
ZINC SULFATE36
ZINC OXIDE 78-80
ZINC CHLORIDE 50
ZINC CARBONATE 52-56
ZINCITE 25
SYNTHETIC CHELATE 6-14.5
AMMONIA COMPLEX 10
LIGNOSULFONATES 7
MIXING INSTRUCTIONS
1. All fine dry materials--must be wetted thor-oughly to prevent "balling" and floating to the topof the mix. Add the fine material over the top withrestraint while agitating and recirculating the waterand nitrogen solution only. DO NOT ADDPHOSPHATES BEFORE ADDING THESE FINEZINC MATERIALS!
2. Using an eductor may create a partially wetted,crusty material that plugs up the eductor and putsballs in the mix that are difficult to disperse.
3. LIQUID CHELATES MAY BE ADDED AT ENDOF MIX CYCLE IF DESIRED.
4. FREE NH3 from Zn(NH3)++ complex mayoverammoniate the phosphate causing insolubleglobules to form. Zn(NH3)++ reacts with thephosphate, reducing the complex to a commoninorganic Zn-NH4-PO4.
REMARKS
Fine ZnSO4H2O (monhydrate); contains 18% S; mostwidely used; economical source; pure form.
High grade; pure form; economical; fine.
ZnCl2; mostly used in chelate manufacture; corrosive.
ZnCO3; foams badly, more expensive; flakes.
Mixture of Zinc Oxide and Zinc Sulfate; granular.
Liquid most common form, lower analysis; EDTAmost effective chelating agent in general.
Zn(NH3)++--may contain 5% S if made from ZnSO4.
Ke-Min powder or liquid--7% Zn maximum.
ZINC
ZINC

76
SOURCE % Mn
MANGANESE SULFATE 23-28
MANGANESE OXIDE 40-68
GRANUSOL 40
MANGANOUS-MANGANIC OXIDE 28
TECH-MAN-GAM 27
SYNTHETIC CHELATES 5-12
LIGNOSULFONATES 10
REMARKS
Fine, dusty, hazardous to breathe dust; MnSO4H2O(monohydrate); contains about 13% S.
MnO (manganous oxide which is soluble); MnO2 isnot a soluble source for plants.
Porous granules which disperse in water with agita-tion (from American Minerals, Inc.)
Fine powder; may be too insoluble.
Manganese ammonium sulfate--contains 2.5% N and17% S; fine powder, dusty.
EDTA source not desirable in high Fe soils but otherchelates may be satisfactory.
Fine powder, reactive with phosphate, 10% Mn ismaximum content possible.
MANGANESE
MANGANESE
AGRONOMIC CONSIDERATIONS
1. Deficiency or insufficiency most likely in high pHsoils due to low Mn solubility (Far West and GreatPlains).
2. Legume crops (Soybeans, Lentils, Guar, Alfalfa)most sensitive to manganese insufficiency.
3. Manganese is essential for chlorophyll formationin plants.
4. Acid forming non-phosphate fertilizers are thebest carriers of manganese, Ex. 5-0-0-30S-5Mnmade with wettable sulfur, UAN and manganese,ammonium sulfate.
5. Manganese-EDTA may be rendered ineffectivein high iron soils due to Fe substitution for Mn inthe chelate.
6. Soybean Acreage - U.S. 70 million acresIowa - 7 millionNebraska - 2 millionKansas - 1.6 millionIllinois - 7 million
MIXING INSTRUCTIONS
1. All fine dry materials--add to the mixer, over thetop, before adding the phosphate to preventballing and floating. Dispersion and wetting willoccur satisfactorily in water and nitrogen solu-tion; except Granusol which should b dispersedin water only.
2. Liquid or chelated material may be added at anytime during the mix cycle. preferably last.
3. Adding dry materials through an eductor maycreate partial wetting, forming a crust which plugsup the eductor.
4. Thickening of phosphate mixes will occur due toreaction of the Mn with phosphate, reducing thepractical Mn content to about 2% Mn. Viscositywith orthophosphates is less than withpolyphosphates
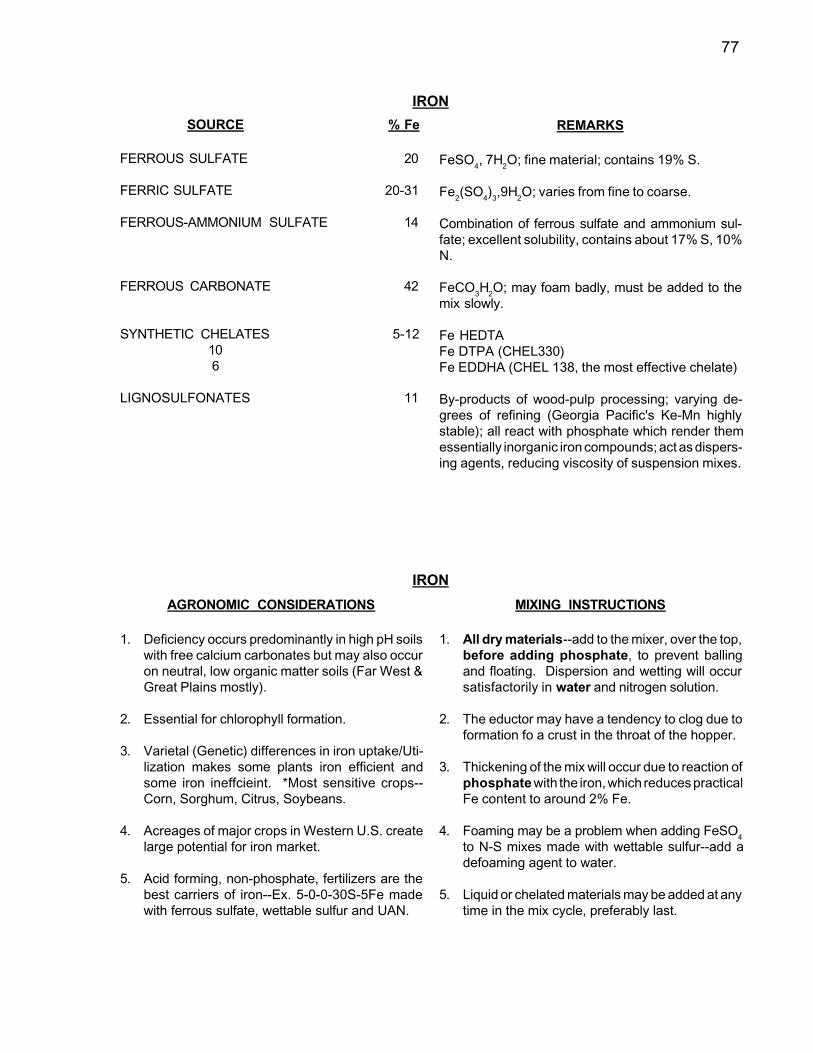
77
SOURCE % Fe
FERROUS SULFATE 20
FERRIC SULFATE 20-31
FERROUS-AMMONIUM SULFATE 14
FERROUS CARBONATE 42
SYNTHETIC CHELATES 5-12106
LIGNOSULFONATES 11
AGRONOMIC CONSIDERATIONS
1. Deficiency occurs predominantly in high pH soilswith free calcium carbonates but may also occuron neutral, low organic matter soils (Far West &Great Plains mostly).
2. Essential for chlorophyll formation.
3. Varietal (Genetic) differences in iron uptake/Uti-lization makes some plants iron efficient andsome iron ineffcieint. *Most sensitive crops--Corn, Sorghum, Citrus, Soybeans.
4. Acreages of major crops in Western U.S. createlarge potential for iron market.
5. Acid forming, non-phosphate, fertilizers are thebest carriers of iron--Ex. 5-0-0-30S-5Fe madewith ferrous sulfate, wettable sulfur and UAN.
REMARKS
FeSO4, 7H2O; fine material; contains 19% S.
Fe2(SO4)3,9H2O; varies from fine to coarse.
Combination of ferrous sulfate and ammonium sul-fate; excellent solubility, contains about 17% S, 10%N.
FeCO3H2O; may foam badly, must be added to themix slowly.
Fe HEDTAFe DTPA (CHEL330)Fe EDDHA (CHEL 138, the most effective chelate)
By-products of wood-pulp processing; varying de-grees of refining (Georgia Pacific's Ke-Mn highlystable); all react with phosphate which render themessentially inorganic iron compounds; act as dispers-ing agents, reducing viscosity of suspension mixes.
MIXING INSTRUCTIONS
1. All dry materials--add to the mixer, over the top,before adding phosphate, to prevent ballingand floating. Dispersion and wetting will occursatisfactorily in water and nitrogen solution.
2. The eductor may have a tendency to clog due toformation fo a crust in the throat of the hopper.
3. Thickening of the mix will occur due to reaction ofphosphate with the iron, which reduces practicalFe content to around 2% Fe.
4. Foaming may be a problem when adding FeSO4
to N-S mixes made with wettable sulfur--add adefoaming agent to water.
5. Liquid or chelated materials may be added at anytime in the mix cycle, preferably last.
IRON
IRON

78
SOURCE % Cu
COPPER SULFATE 35(Monohydrate)
COPPER SULFATE 25(Pentahydrate)
CUPROUS OXIDE 89
CUPRIC OXIDE 75
COPPER CHLORIDE 17
SYNTHETIC CHELATES 8-139
LIGNOSULFONATES 7
AGRONOMIC CONSIDERATIONS
1. All inorganic sources are considered equally ef-fective agronomically.
2. Very narrow range between deficiency and toxic-ity in crop plants with long term persistence in thesoil.
3. Broadcast applications only safe method of ap-plying.
4. Viscosity problems due to copper reactions withphosphate but no apparent effect agronomically.
5. Lignosulfonate reactivity with phosphates makesthem of questionable value in suspensions con-taining P.
6. Chelate effectiveness questionable for soil treat-ments.
MIXING INSTRUCTIONS
1. All dry materials--add to the mixer, over the top,before adding phosphate, to prevent balling andfloating. Dispersion and wetting will occur satis-factorily in water and nitrogen solution.
2. Adding dry materials sthrough an eductor maycreate partial wetting, forming a crust which mayplug up the eductor.
3. Liquid chelate materials may be added at anytime during the mix cycle, preferably last.
4. Thickening of phosphate mixes will occur due toreaction reducing the practical Cu content to 2%or less. Viscosity with orthophosphates is lowerthan with polyphosphates.
REMARKS
CuSO4,H2O; fine crystalline product; blue; containsabout 12% S.
CuSO45H2O; fine crystalline product.
Cu2O; fine powder.
CuO; fine powder.
CuCl2; crystal.
Cu-EDTACu-HEDTA
Fine powder; reactive with phosphates, 7% Cu ismaximum content possible.
COPPER
COPPER
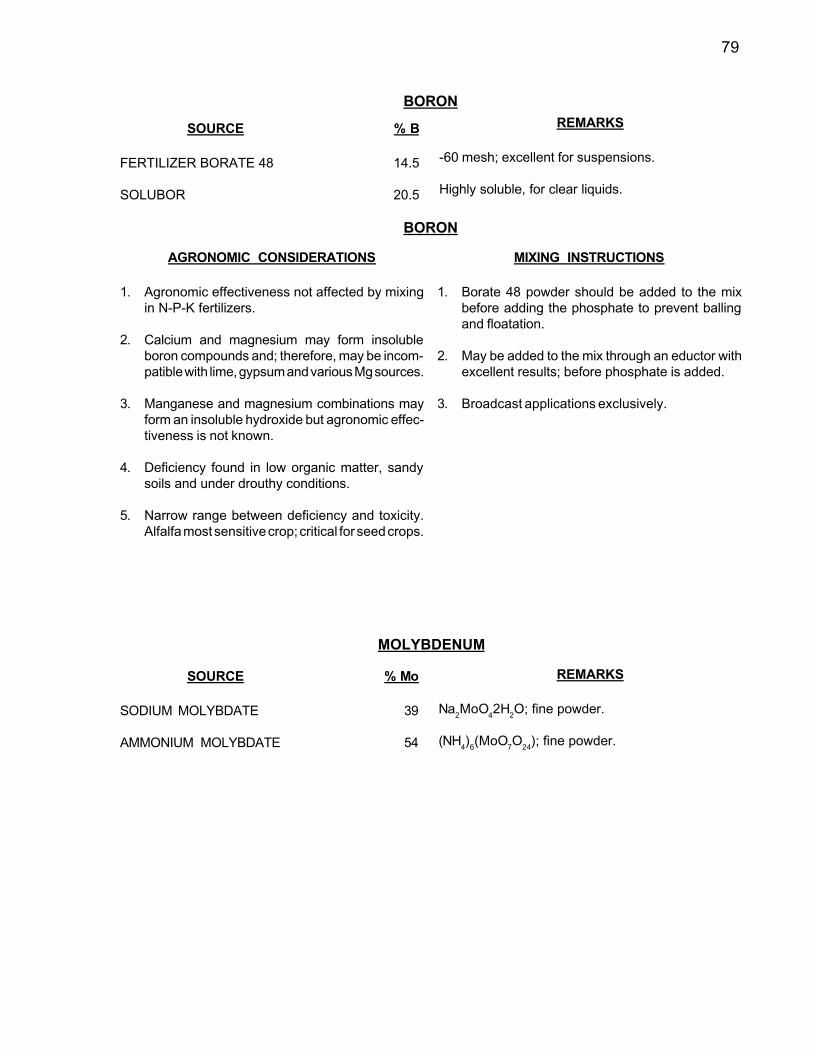
79
SOURCE % B
FERTILIZER BORATE 48 14.5
SOLUBOR 20.5
SOURCE % Mo
SODIUM MOLYBDATE 39
AMMONIUM MOLYBDATE 54
REMARKS
-60 mesh; excellent for suspensions.
Highly soluble, for clear liquids.
REMARKS
Na2MoO42H2O; fine powder.
(NH4)6(MoO7O24); fine powder.
MOLYBDENUM
BORON
AGRONOMIC CONSIDERATIONS
1. Agronomic effectiveness not affected by mixingin N-P-K fertilizers.
2. Calcium and magnesium may form insolubleboron compounds and; therefore, may be incom-patible with lime, gypsum and various Mg sources.
3. Manganese and magnesium combinations mayform an insoluble hydroxide but agronomic effec-tiveness is not known.
4. Deficiency found in low organic matter, sandysoils and under drouthy conditions.
5. Narrow range between deficiency and toxicity.Alfalfa most sensitive crop; critical for seed crops.
MIXING INSTRUCTIONS
1. Borate 48 powder should be added to the mixbefore adding the phosphate to prevent ballingand floatation.
2. May be added to the mix through an eductor withexcellent results; before phosphate is added.
3. Broadcast applications exclusively.
BORON

80
SUSPENSION FORMULATION CONSIDERATIONS
In order to adequately supply some formulations containing potash, magnesium and sulfur throughsprinkler irrigation systems, clay suspensions have to be made with correct ratios of water, clay andsuspended fertilizer material. Properly suspending fertilizer material in solution demands good claygel strength (i.e., complete dispersion of clay in a 7:1 ratio of water to clay) before the rest of the waterand fertilizer material can be added. Fertilizer material used in suspensions has to be either ableto completely dissolve in water with slight mixing, or be of a fine mesh (at least -200 mesh size) state.Fine mesh suspended fertilizer material can be successfully injected through center pivot systemsbut a separate storage tank fitting with agitation via recirculation bypass to the storage tank isrequired. Also, all screens in the conventional system must be removed to prevent "screen blinding"and resulting system shutdown.
Example fertilizer formulation sheets follow (Tables A-20 through A-27), giving correct amounts andorders of addition of formulations successfully applied through sprinkler systems as suspensions.
Table A-20.
Worksheet: KCl and Water
GRADE/NUTRIENT RATE
N
0
K
36
Mg
0
S
0
Zn
0
P
0
Materialsand
Order ofAddition
PoundsPerTon
280
40
518
1162
2000
Water
Clay1/
Water
KCl2/
TOTALS
NOTES & COMMENTS:
1. 2% clay as dry clay; fluid clay would be the preferred clay source.
2. KCl as 0-0-62
Guidelines supplied by R. D. Curley, C.P.Ag., Consultant
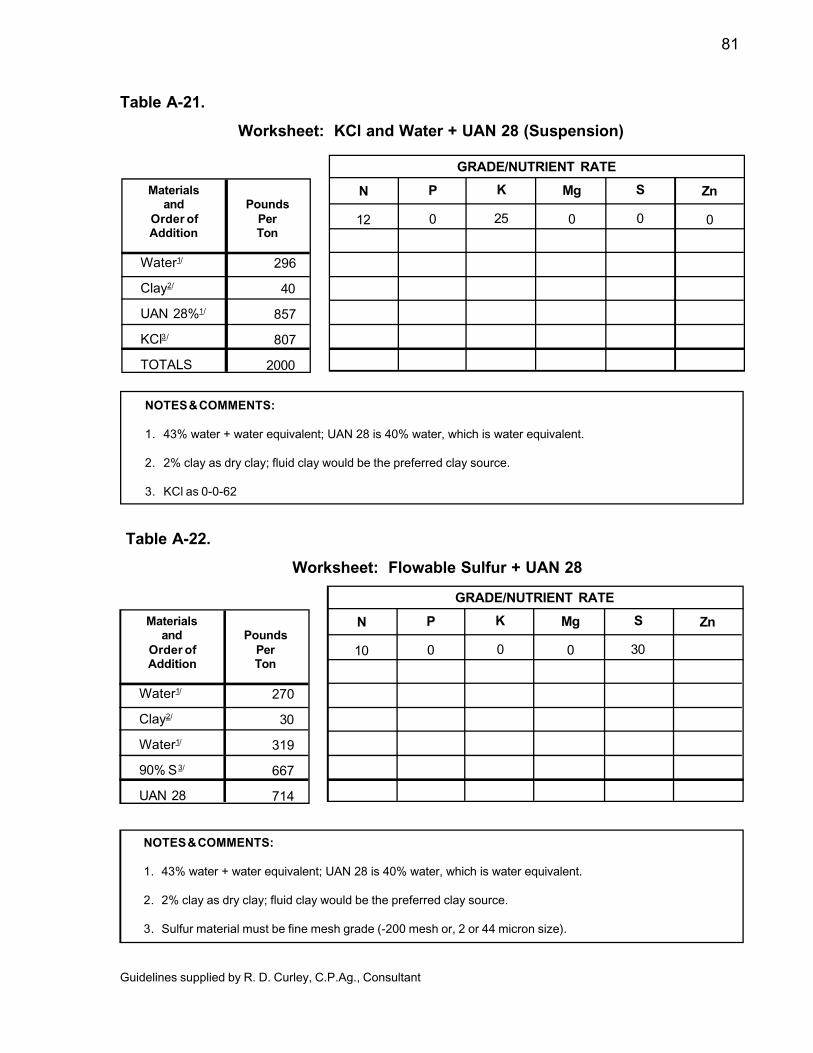
81
Table A-21.
Worksheet: KCl and Water + UAN 28 (Suspension)
GRADE/NUTRIENT RATE
N
12
K
25
Mg
0
S
0
Zn
0
P
0
Materialsand
Order ofAddition
PoundsPerTon
296
40
857
807
2000
Water1/
Clay2/
UAN 28%1/
KCl3/
TOTALS
GRADE/NUTRIENT RATE
N
10
K
0
Mg
0
S
30
ZnP
0
Materialsand
Order ofAddition
PoundsPerTon
270
30
319
667
714
Water1/
Clay2/
Water1/
90% S3/
UAN 28
Guidelines supplied by R. D. Curley, C.P.Ag., Consultant
Table A-22.
Worksheet: Flowable Sulfur + UAN 28
NOTES & COMMENTS:
1. 43% water + water equivalent; UAN 28 is 40% water, which is water equivalent.
2. 2% clay as dry clay; fluid clay would be the preferred clay source.
3. KCl as 0-0-62
NOTES & COMMENTS:
1. 43% water + water equivalent; UAN 28 is 40% water, which is water equivalent.
2. 2% clay as dry clay; fluid clay would be the preferred clay source.
3. Sulfur material must be fine mesh grade (-200 mesh or, 2 or 44 micron size).
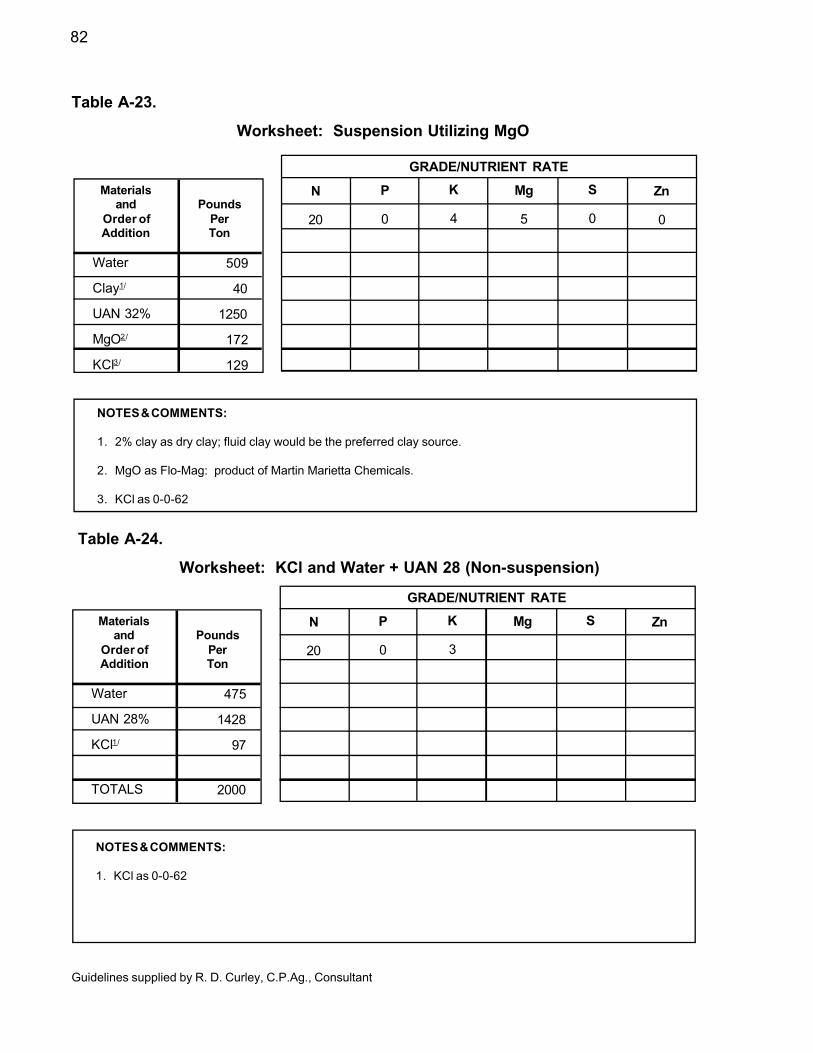
82
Table A-23.
Worksheet: Suspension Utilizing MgO
GRADE/NUTRIENT RATE
N
20
K
4
Mg
5
S
0
Zn
0
P
0
Materialsand
Order ofAddition
PoundsPerTon
509
40
1250
172
129
Water
Clay1/
UAN 32%
MgO2/
KCl3/
GRADE/NUTRIENT RATE
N
20
K
3
Mg S ZnP
0
Materialsand
Order ofAddition
PoundsPerTon
475
1428
97
2000
Water
UAN 28%
KCl1/
TOTALS
NOTES & COMMENTS:
1. KCl as 0-0-62
Guidelines supplied by R. D. Curley, C.P.Ag., Consultant
Table A-24.
Worksheet: KCl and Water + UAN 28 (Non-suspension)
NOTES & COMMENTS:
1. 2% clay as dry clay; fluid clay would be the preferred clay source.
2. MgO as Flo-Mag: product of Martin Marietta Chemicals.
3. KCl as 0-0-62
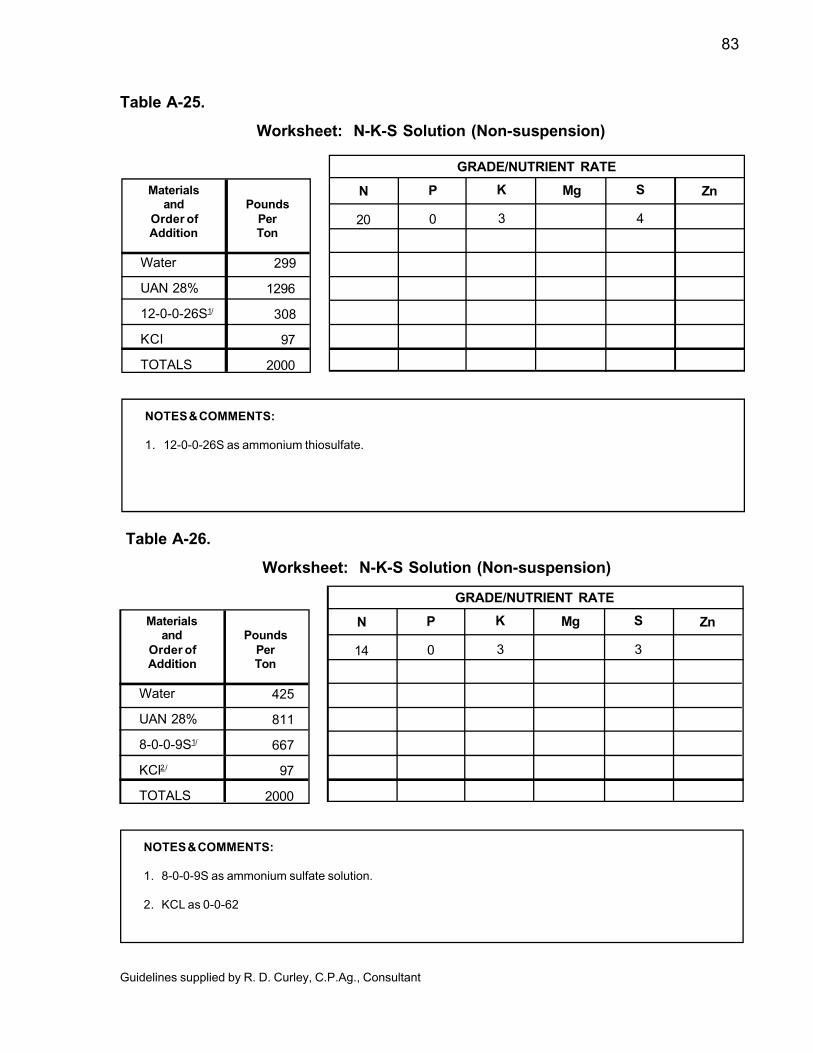
83
Table A-25.
Worksheet: N-K-S Solution (Non-suspension)
GRADE/NUTRIENT RATE
N
20
K
3
Mg S
4
ZnP
0
Materialsand
Order ofAddition
PoundsPerTon
299
1296
308
97
2000
Water
UAN 28%
12-0-0-26S1/
KCl
TOTALS
NOTES & COMMENTS:
1. 12-0-0-26S as ammonium thiosulfate.
GRADE/NUTRIENT RATE
N
14
K
3
Mg S
3
ZnP
0
Materialsand
Order ofAddition
PoundsPerTon
425
811
667
97
2000
Water
UAN 28%
8-0-0-9S1/
KCl2/
TOTALS
NOTES & COMMENTS:
1. 8-0-0-9S as ammonium sulfate solution.
2. KCL as 0-0-62
Guidelines supplied by R. D. Curley, C.P.Ag., Consultant
Table A-26.
Worksheet: N-K-S Solution (Non-suspension)
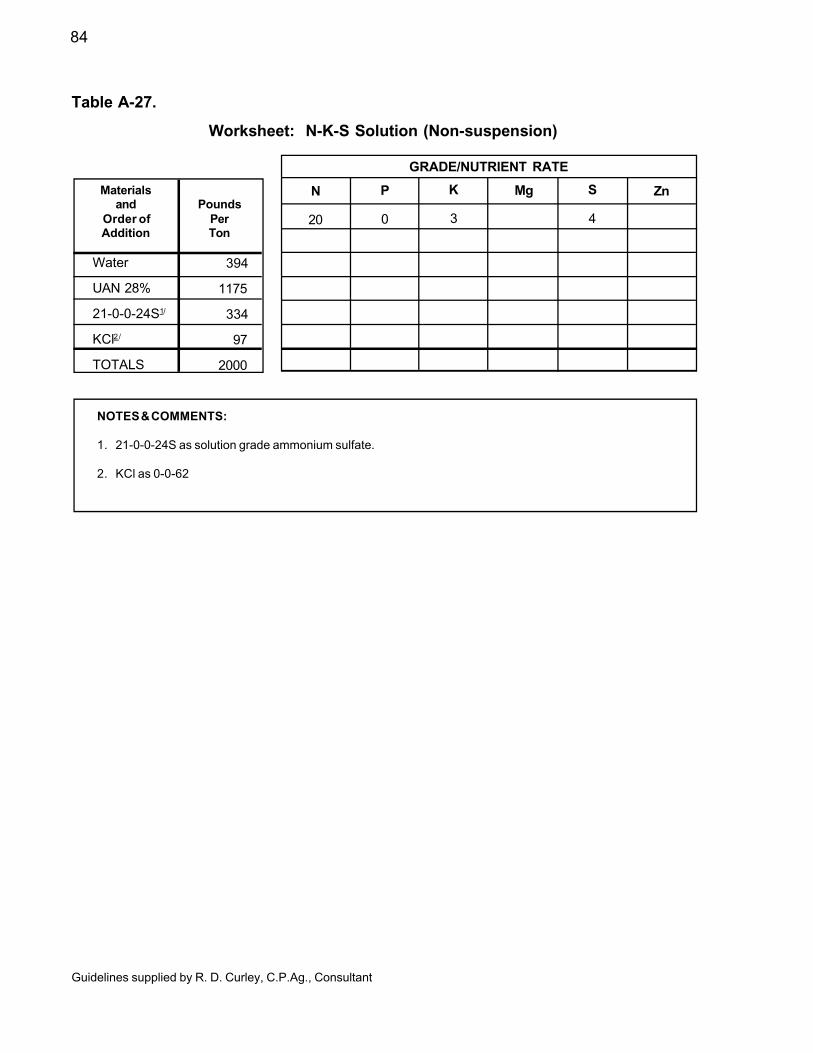
84
Table A-27.
Worksheet: N-K-S Solution (Non-suspension)
GRADE/NUTRIENT RATE
N
20
K
3
Mg S
4
ZnP
0
Materialsand
Order ofAddition
PoundsPerTon
394
1175
334
97
2000
Water
UAN 28%
21-0-0-24S1/
KCl2/
TOTALS
NOTES & COMMENTS:
1. 21-0-0-24S as solution grade ammonium sulfate.
2. KCl as 0-0-62
Guidelines supplied by R. D. Curley, C.P.Ag., Consultant

85
Table A-28.
Suspension Formulations Using 3-10-30 Base
POUNDSRATIO GRADE RAW MATERIALS 1 TON 3 TONS 5 TONS1:3:3 6-18-18 3-10-30 1200 3600 6000
12-40-0 600 1800 300028-0-0 43 129 215Water 157 471 785
4-12-27 3-10-30 1800 5400 900012-40-0 150 450 75028-0-0 29 87 145Water 21 63 105
1:3:6 4-12-24 3-10-30 1600 4800 800012-40-0 200 600 100028-0-0 29 87 145Water 171 513 855
1:2:2 8-16-16 3-10-30 1067 3201 533512-40-0 535 1605 267528-0-0 229 687 1145Water 169 507 845
1:2:4 6-12-24 3-10-30 1600 4800 800012-40-0 200 600 100028-0-0 171 513 855Water 29 87 145
1:2:3 7-14-21 3-10-30 1400 4200 700012-40-0 350 1050 125028-0-0 200 600 1000Water 50 150 250
1:3:2 7-21-14 3-10-30 933 2799 466512-40-0 817 2451 408528-0-0 50 150 250Water 200 600 1000
1:3:2 7-23-15 3-10-30 1000 3000 500012-40-0 900 2700 450028-0-0 7 21 35Water 93 279 465
9-30-10 3-10-30 667 2001 333512-40-0 1333 3999 6665
1:3:1 9-27-9 3-10-30 600 1800 300012-40-0 1200 3600 600028-0-0 64 192 320Water 136 408 680
1:1:2 10-10-20 3-10-30 1333 3999 666512-40-0 167 501 83528-0-0 500 1500 2500
1:1:1 13-13-13 3-10-30 867 2601 433512-40-0 433 1299 216528-0-0 650 1950 3250Water 50 150 250
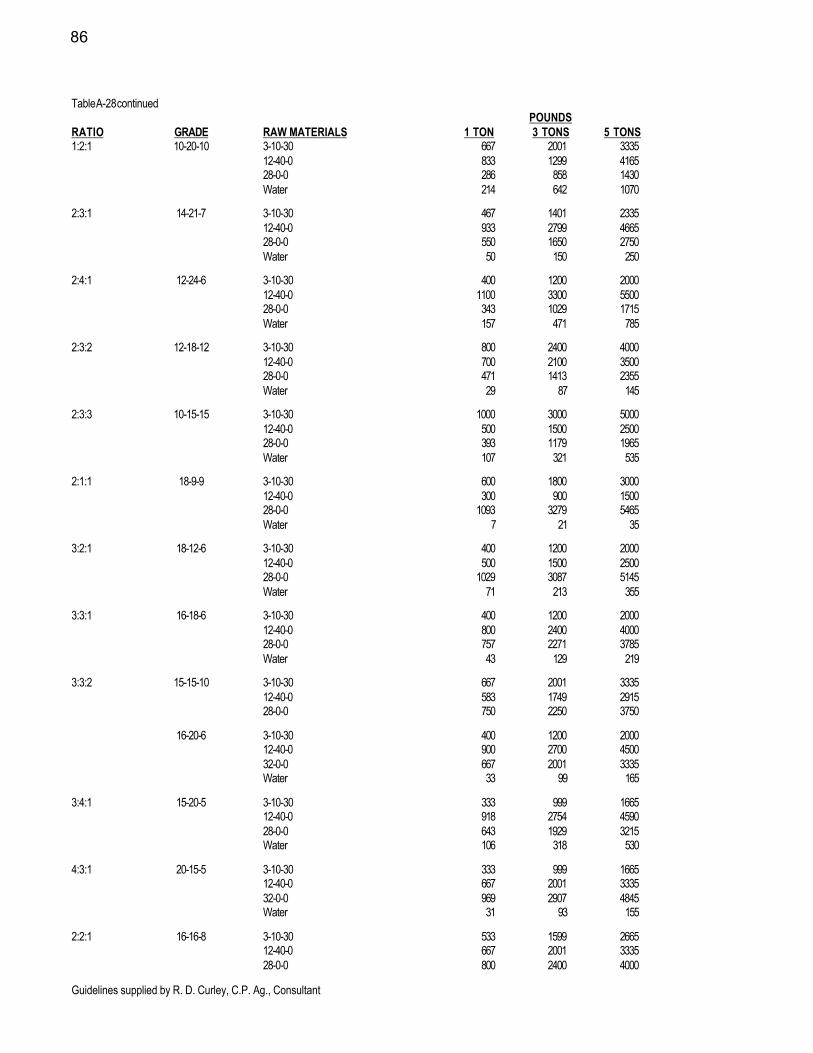
86
Table A-28 continuedPOUNDS
RATIO GRADE RAW MATERIALS 1 TON 3 TONS 5 TONS1:2:1 10-20-10 3-10-30 667 2001 3335
12-40-0 833 1299 416528-0-0 286 858 1430Water 214 642 1070
2:3:1 14-21-7 3-10-30 467 1401 233512-40-0 933 2799 466528-0-0 550 1650 2750Water 50 150 250
2:4:1 12-24-6 3-10-30 400 1200 200012-40-0 1100 3300 550028-0-0 343 1029 1715Water 157 471 785
2:3:2 12-18-12 3-10-30 800 2400 400012-40-0 700 2100 350028-0-0 471 1413 2355Water 29 87 145
2:3:3 10-15-15 3-10-30 1000 3000 500012-40-0 500 1500 250028-0-0 393 1179 1965Water 107 321 535
2:1:1 18-9-9 3-10-30 600 1800 300012-40-0 300 900 150028-0-0 1093 3279 5465Water 7 21 35
3:2:1 18-12-6 3-10-30 400 1200 200012-40-0 500 1500 250028-0-0 1029 3087 5145Water 71 213 355
3:3:1 16-18-6 3-10-30 400 1200 200012-40-0 800 2400 400028-0-0 757 2271 3785Water 43 129 219
3:3:2 15-15-10 3-10-30 667 2001 333512-40-0 583 1749 291528-0-0 750 2250 3750
16-20-6 3-10-30 400 1200 200012-40-0 900 2700 450032-0-0 667 2001 3335Water 33 99 165
3:4:1 15-20-5 3-10-30 333 999 166512-40-0 918 2754 459028-0-0 643 1929 3215Water 106 318 530
4:3:1 20-15-5 3-10-30 333 999 166512-40-0 667 2001 333532-0-0 969 2907 4845Water 31 93 155
2:2:1 16-16-8 3-10-30 533 1599 266512-40-0 667 2001 333528-0-0 800 2400 4000
Guidelines supplied by R. D. Curley, C.P. Ag., Consultant

87
Table A-29.
Suspension Formulations Using 4-12-27 Base
POUNDSRATIO GRADE RAW MATERIALS 1 TON 3 TONS 5 TONS1:3:3 6-18-18 4-12-27 1333 3999 6665
12-40-0 500 1500 250028-0-0 25 75 125Water 142 426 710
1:3:6 4-12-24 4-12-27 1780 5340 890012-40-0 70 210 350Water 150 450 750
1:2:2 8-16-16 4-12-27 1185 3555 592512-40-0 445 1335 222528-0-0 214 642 1070Water 156 468 780
1:2:4 6-12-24 4-12-27 1780 5340 890012-40-0 70 210 35028-0-0 146 438 730Water 4 12 20
1:2:3 7-14-21 4-12-27 1556 4668 778012-40-0 233 699 116528-0-0 179 537 895Water 32 96 160
1:3:2 7-23-15 4-12-27 1111 3333 555512-40-0 818 2454 4090Water 71 213 355
1:3:1 9-29-10 4-12-27 741 2223 370512-40-0 1229 3687 614528-0-0 11 33 55Water 19 57 95
1:3:1 9-27-9 4-12-27 667 2001 333512-40-0 1150 3450 575028-0-0 54 162 270Water 129 387 645
1:1:2 9-10-20 4-12-27 1482 4446 741012-40-0 55 165 27528-0-0 407 1221 2035Water 56 168 280
1:1:2 10-10-20 4-12-27 1482 4446 741012-40-0 55 165 27532-0-0 422 1266 2110Water 41 123 205
1:1:1 13-13-13 4-12-27 963 2889 481512-40-0 363 1089 181528-0-0 636 1908 3180Water 38 144 190
1:2:1 10-20-10 4-12-27 741 2223 370512-40-0 778 2334 389028-0-0 279 837 1395Water 202 606 1010

88
Table A-29 continued
POUNDSRATIO GRADE RAW MATERIALS 1 TON 3 TONS 5 TONS2:3:1 14-21-7 4-12-27 519 1557 2595
12-40-0 895 2685 447528-0-0 546 1638 2730Water 40 120 200
2:4:1 12-24-6 4-12-27 444 1332 222012-40-0 1068 3204 534028-0-0 336 1008 1680Water 152 456 760
2:3:2 12-18-12 4-12-27 889 2667 444512-40-0 635 1905 317528-0-0 457 1371 2285Water 21 63 105
2:3:3 10-15-15 4-12-27 1112 3336 556012-40-0 418 1254 209028-0-0 379 1137 1895Water 91 273 455
2:1:1 18-9-9 4-12-27 667 2001 333512-40-0 250 750 125028-0-0 1083 3249 5415
3:2:1 18-12-6 4-12-27 444 1332 222012-40-0 468 1404 234028-0-0 1025 3075 5125Water 63 189 315
16-18-6 4-12-27 444 1332 222012-40-0 768 2304 384028-0-0 754 2262 3770Water 34 102 170
3:3:2 15-15-10 4-12-27 741 2223 370512-40-0 528 1584 264032-0-0 650 1950 3250Water 81 243 405
2:3:1 16-20-6 4-12-27 444 1332 222012-40-0 868 2604 434032-0-0 622 1866 3110Water 66 198 330
3:4:1 15-20-5 4-12-27 371 1113 185512-40-0 890 2670 445028-0-0 639 1917 3195Water 100 300 500
4:3:1 20-15-5 4-12-27 370 1110 185012-40-0 640 1920 320032-0-0 963 2889 4815Water 27 81 135
2:2:1 16-16-8 4-12-27 588 1764 294012-40-0 623 1869 311528-0-0 789 2367 3945
Guidelines supplied by R. D. Curley, C.P. Ag., Consultant

89
Table A-30.
Suspension Formulations Using 5-15-30 Base
POUNDSRATIO GRADE RAW MATERIALS 1 TON 3 TONS 5 TONS1:3:3 6-18-18 5-15-30 1200 3600 6000
12-40-0 4 5 0 1350 225028-0-0 2 2 6 6 1 1 0Water 3 2 8 9 8 4 1640
1:3:3 7-21-21 5-15-30 1400 4200 700012-40-0 5 2 5 1575 262528-0-0 2 5 7 5 1 2 5Water 5 0 1 5 0 2 5 0
1:2:2 9-18-18 5-15-30 1200 3600 600012-40-0 4 5 0 1350 225028-0-0 2 3 6 7 0 8 1180Water 1 1 4 3 4 2 5 7 0
1:2:2 8-16-16 5-15-30 1067 3201 533512-40-0 4 0 0 1200 200028-0-0 2 1 1 6 3 3 1055Water 3 2 2 9 6 6 1610
1:2:4 6-12-24 5-15-30 1600 4800 800012-40-0 — — —28-0-0 1 4 3 4 2 9 7 1 5Water 2 5 7 7 7 1 1285
1:2:3 7-14-21 5-15-30 1400 4200 700012-40-0 1 7 5 5 2 5 8 7 528-0-0 1 7 5 5 2 5 8 7 5Water 2 5 0 7 5 0 1250
1:2:3 8-16-24 5-15-30 1600 4800 800012-40-0 2 0 0 6 0 0 100028-0-0 2 0 0 6 0 0 1000
1:3:2 8-24-16 5-15-30 1067 3201 533512-40-0 8 0 0 2400 400028-0-0 3 8 1 1 4 1 9 0Water 9 5 2 8 5 4 7 5
1:3:2 8-26-16 5-15-30 1067 3201 533512-40-0 9 0 0 2700 450028-0-0 — — —Water 3 3 9 9 1 6 5
1:3:2 7-21-14 5-15-30 9 3 4 2802 467012-40-0 7 0 0 2100 350028-0-0 3 2 9 6 1 6 0Water 3 3 4 1002 1670
1:3:2 7-23-15 5-15-30 1000 3000 500012-40-0 7 7 5 2325 387528-0-0 — — —Water 2 2 5 6 7 5 1125
1:3:1 10-30-10 5-15-30 6 6 7 2001 333512-40-0 1250 3750 625028-0-0 6 1 1 8 3 3 0 5Water 2 2 6 6 1 1 0
1:1:2 10-10-20 5-15-30 1334 4002 667012-40-0 — — —28-0-0 4 7 5 1425 2375Water 1 9 1 5 7 3 9 5 5
1:1:1 13-13-13 5-15-30 8 6 7 2601 433512-40-0 3 2 5 9 7 5 162528-0-0 6 3 6 1908 3180Water 1 7 2 5 1 6 8 6 0
1:1:1 14-14-14 5-15-30 9 3 4 2802 467012-40-0 3 5 0 1050 175028-0-0 6 8 6 2058 3430Water 3 0 9 0 1 5 0
1:2:1 12-24-12 5-15-30 8 0 0 2400 400012-40-0 9 0 0 2700 450032-0-0 2 8 8 8 6 4 1440Water 1 2 3 6 6 0
1:2:1 11-22-11 5-15-30 7 3 4 2202 367012-40-0 8 2 5 2475 412528-0-0 3 0 0 9 0 0 1500Water 1 4 1 4 2 3 7 0 5
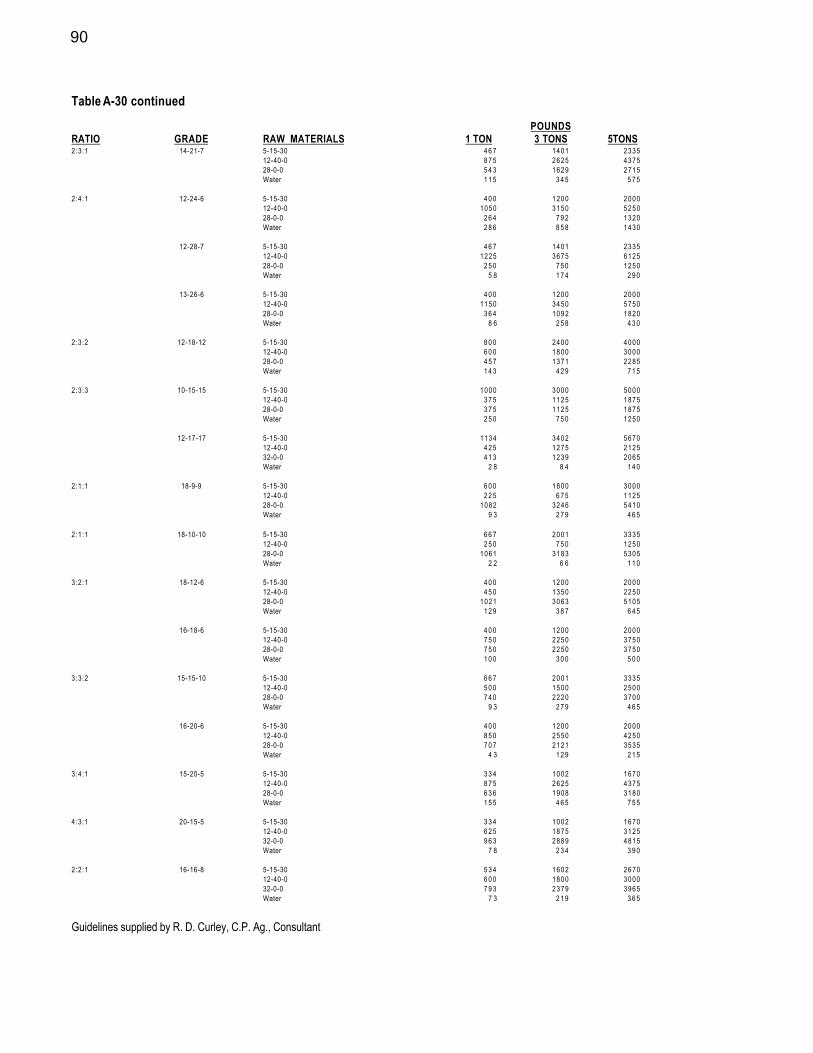
90
Table A-30 continued
POUNDSRATIO GRADE RAW MATERIALS 1 TON 3 TONS 5TONS2:3:1 14-21-7 5-15-30 4 6 7 1401 2335
12-40-0 8 7 5 2625 437528-0-0 5 4 3 1629 2715Water 1 1 5 3 4 5 5 7 5
2:4:1 12-24-6 5-15-30 4 0 0 1200 200012-40-0 1050 3150 525028-0-0 2 6 4 7 9 2 1320Water 2 8 6 8 5 8 1430
12-28-7 5-15-30 4 6 7 1401 233512-40-0 1225 3675 612528-0-0 2 5 0 7 5 0 1250Water 5 8 1 7 4 2 9 0
13-26-6 5-15-30 4 0 0 1200 200012-40-0 1150 3450 575028-0-0 3 6 4 1092 1820Water 8 6 2 5 8 4 3 0
2:3:2 12-18-12 5-15-30 8 0 0 2400 400012-40-0 6 0 0 1800 300028-0-0 4 5 7 1371 2285Water 1 4 3 4 2 9 7 1 5
2:3:3 10-15-15 5-15-30 1000 3000 500012-40-0 3 7 5 1125 187528-0-0 3 7 5 1125 1875Water 2 5 0 7 5 0 1250
12-17-17 5-15-30 1134 3402 567012-40-0 4 2 5 1275 212532-0-0 4 1 3 1239 2065Water 2 8 8 4 1 4 0
2:1:1 18-9-9 5-15-30 6 0 0 1800 300012-40-0 2 2 5 6 7 5 112528-0-0 1082 3246 5410Water 9 3 2 7 9 4 6 5
2:1:1 18-10-10 5-15-30 6 6 7 2001 333512-40-0 2 5 0 7 5 0 125028-0-0 1061 3183 5305Water 2 2 6 6 1 1 0
3:2:1 18-12-6 5-15-30 4 0 0 1200 200012-40-0 4 5 0 1350 225028-0-0 1021 3063 5105Water 1 2 9 3 8 7 6 4 5
16-18-6 5-15-30 4 0 0 1200 200012-40-0 7 5 0 2250 375028-0-0 7 5 0 2250 3750Water 1 0 0 3 0 0 5 0 0
3:3:2 15-15-10 5-15-30 6 6 7 2001 333512-40-0 5 0 0 1500 250028-0-0 7 4 0 2220 3700Water 9 3 2 7 9 4 6 5
16-20-6 5-15-30 4 0 0 1200 200012-40-0 8 5 0 2550 425028-0-0 7 0 7 2121 3535Water 4 3 1 2 9 2 1 5
3:4:1 15-20-5 5-15-30 3 3 4 1002 167012-40-0 8 7 5 2625 437528-0-0 6 3 6 1908 3180Water 1 5 5 4 6 5 7 5 5
4:3:1 20-15-5 5-15-30 3 3 4 1002 167012-40-0 6 2 5 1875 312532-0-0 9 6 3 2889 4815Water 7 8 2 3 4 3 9 0
2:2:1 16-16-8 5-15-30 5 3 4 1602 267012-40-0 6 0 0 1800 300032-0-0 7 9 3 2379 3965Water 7 3 2 1 9 3 6 5
Guidelines supplied by R. D. Curley, C.P. Ag., Consultant
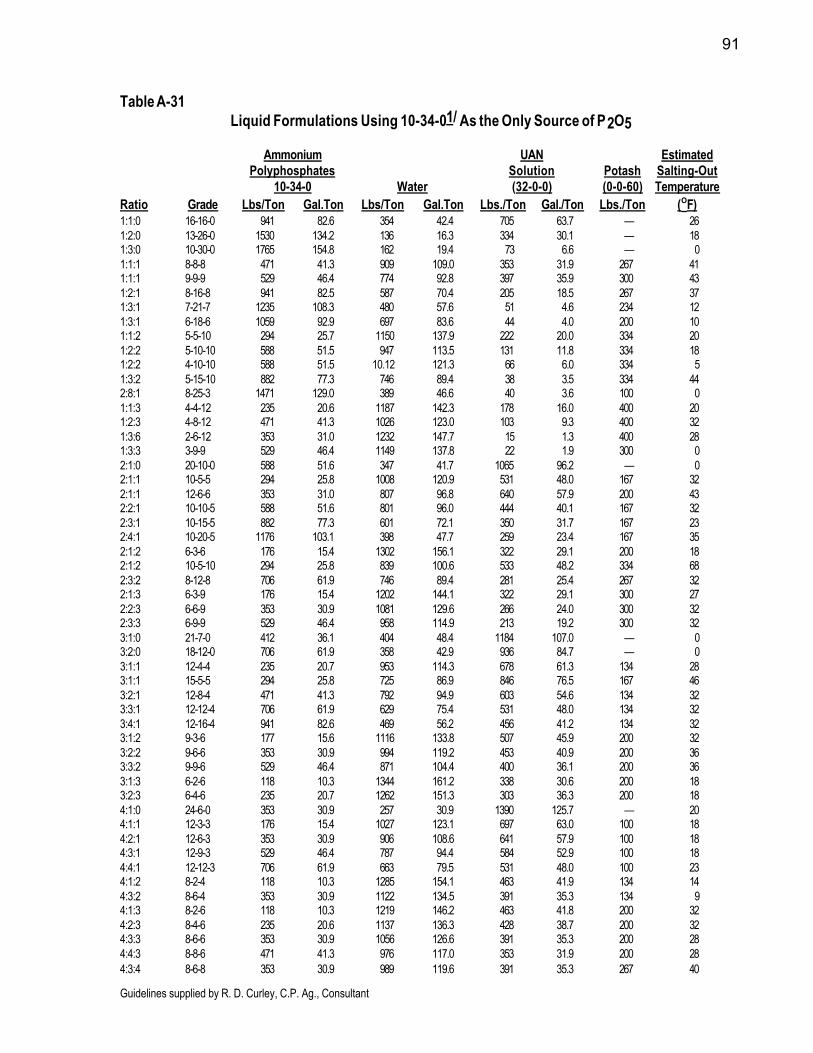
91
Table A-31Liquid Formulations Using 10-34-01/ As the Only Source of P2O5
Ammonium UAN EstimatedPolyphosphates Solution Potash Salting-Out
10-34-0 Water (32-0-0) (0-0-60) TemperatureRatio Grade Lbs/Ton Gal.Ton Lbs/Ton Gal.Ton Lbs./Ton Gal./Ton Lbs./Ton (ºF)1:1:0 16-16-0 941 82.6 354 42.4 705 63.7 — 261:2:0 13-26-0 1530 134.2 136 16.3 334 30.1 — 181:3:0 10-30-0 1765 154.8 162 19.4 73 6.6 — 01:1:1 8-8-8 471 41.3 909 109.0 353 31.9 267 411:1:1 9-9-9 529 46.4 774 92.8 397 35.9 300 431:2:1 8-16-8 941 82.5 587 70.4 205 18.5 267 371:3:1 7-21-7 1235 108.3 480 57.6 51 4.6 234 121:3:1 6-18-6 1059 92.9 697 83.6 44 4.0 200 101:1:2 5-5-10 294 25.7 1150 137.9 222 20.0 334 201:2:2 5-10-10 588 51.5 947 113.5 131 11.8 334 181:2:2 4-10-10 588 51.5 10.12 121.3 66 6.0 334 51:3:2 5-15-10 882 77.3 746 89.4 38 3.5 334 442:8:1 8-25-3 1471 129.0 389 46.6 40 3.6 100 01:1:3 4-4-12 235 20.6 1187 142.3 178 16.0 400 201:2:3 4-8-12 471 41.3 1026 123.0 103 9.3 400 321:3:6 2-6-12 353 31.0 1232 147.7 15 1.3 400 281:3:3 3-9-9 529 46.4 1149 137.8 22 1.9 300 02:1:0 20-10-0 588 51.6 347 41.7 1065 96.2 — 02:1:1 10-5-5 294 25.8 1008 120.9 531 48.0 167 322:1:1 12-6-6 353 31.0 807 96.8 640 57.9 200 432:2:1 10-10-5 588 51.6 801 96.0 444 40.1 167 322:3:1 10-15-5 882 77.3 601 72.1 350 31.7 167 232:4:1 10-20-5 1176 103.1 398 47.7 259 23.4 167 352:1:2 6-3-6 176 15.4 1302 156.1 322 29.1 200 182:1:2 10-5-10 294 25.8 839 100.6 533 48.2 334 682:3:2 8-12-8 706 61.9 746 89.4 281 25.4 267 322:1:3 6-3-9 176 15.4 1202 144.1 322 29.1 300 272:2:3 6-6-9 353 30.9 1081 129.6 266 24.0 300 322:3:3 6-9-9 529 46.4 958 114.9 213 19.2 300 323:1:0 21-7-0 412 36.1 404 48.4 1184 107.0 — 03:2:0 18-12-0 706 61.9 358 42.9 936 84.7 — 03:1:1 12-4-4 235 20.7 953 114.3 678 61.3 134 283:1:1 15-5-5 294 25.8 725 86.9 846 76.5 167 463:2:1 12-8-4 471 41.3 792 94.9 603 54.6 134 323:3:1 12-12-4 706 61.9 629 75.4 531 48.0 134 323:4:1 12-16-4 941 82.6 469 56.2 456 41.2 134 323:1:2 9-3-6 177 15.6 1116 133.8 507 45.9 200 323:2:2 9-6-6 353 30.9 994 119.2 453 40.9 200 363:3:2 9-9-6 529 46.4 871 104.4 400 36.1 200 363:1:3 6-2-6 118 10.3 1344 161.2 338 30.6 200 183:2:3 6-4-6 235 20.7 1262 151.3 303 36.3 200 184:1:0 24-6-0 353 30.9 257 30.9 1390 125.7 — 204:1:1 12-3-3 176 15.4 1027 123.1 697 63.0 100 184:2:1 12-6-3 353 30.9 906 108.6 641 57.9 100 184:3:1 12-9-3 529 46.4 787 94.4 584 52.9 100 184:4:1 12-12-3 706 61.9 663 79.5 531 48.0 100 234:1:2 8-2-4 118 10.3 1285 154.1 463 41.9 134 144:3:2 8-6-4 353 30.9 1122 134.5 391 35.3 134 94:1:3 8-2-6 118 10.3 1219 146.2 463 41.8 200 324:2:3 8-4-6 235 20.6 1137 136.3 428 38.7 200 324:3:3 8-6-6 353 30.9 1056 126.6 391 35.3 200 284:4:3 8-8-6 471 41.3 976 117.0 353 31.9 200 284:3:4 8-6-8 353 30.9 989 119.6 391 35.3 267 40
Guidelines supplied by R. D. Curley, C.P. Ag., Consultant

92
Table A-32.Liquid Formulations Using 10-34-01/ As the Only Source of P2O5
Ammonium UAN EstimatedPolyphosphates Solution Potash Salting-Out
10-34-0 Water (30-0-0) (0-0-60) TemperatureRatio Grade Lbs/Ton Gal.Ton Lbs/Ton Gal.Ton Lbs./Ton Gal./Ton Lbs./Ton (ºF)1:1:0 16-16-0 941 82.6 307 36.8 752 69.3 — 261:2:0 13-26-0 1530 134.2 114 13.7 356 32.8 — 181:3:0 10-30-0 1765 154.8 157 18.8 78 7.2 — 01:1:1 8-8-8 471 41.3 894 107.2 377 34.7 258 411:1:1 9-9-9 529 46.4 758 90.9 423 39.0 290 431:2:1 8-16-8 941 82.5 582 69.8 219 20.2 258 371:3:1 7-21-7 1235 108.3 485 58.2 54 5.0 226 121:3:1 6-18-6 1059 92.9 700 83.9 47 4.3 194 101:1:2 5-5-10 294 25.7 1146 137.4 237 21.8 323 201:2:2 5-10-10 588 51.5 948 113.8 140 12.9 323 181:2:2 4-10-10 588 51.5 1019 122.2 70 6.5 323 51:3:2 5-15-10 882 77.3 754 90.4 41 3.8 323 442:8:1 8-25-3 1471 129.0 389 46.6 43 4.0 97 01:1:3 4-4-12 235 20.6 1188 142.4 190 17.5 387 201:2:3 4-8-12 471 41.3 1032 123.7 110 10.1 387 321:3:6 2-6-12 353 31.0 1244 149.2 16 1.5 387 281:3:3 3-9-9 529 46.4 1157 138.8 24 2.2 290 02:1:0 20-10-0 588 51.6 276 33.1 1136 104.7 — 02:1:1 10-5-5 294 25.8 979 117.4 566 52.2 161 322:1:1 12-6-6 353 31.0 770 92.4 683 62.9 194 432:2:1 10-10-5 588 51.6 777 93.3 474 43.6 161 322:2:1 10-12-6 706 61.9 667 80.1 433 39.9 194 —2:3:1 10-15-5 882 77.3 584 70.0 373 34.4 161 232:4:1 10-20-5 1176 103.1 387 46.4 276 25.5 161 352:1:2 6-3-6 176 15.4 1287 154.3 343 31.7 194 182:1:2 10-5-10 294 25.8 814 97.7 569 52.3 323 682:3:2 8-12-8 706 61.9 736 88.4 300 27.6 258 322:1:3 6-3-9 176 15.4 1191 142.8 343 31.7 290 272:2:3 6-6-9 353 30.0 1073 128.8 284 26.1 290 322:3:3 6-9-9 529 46.4 954 114.4 227 20.9 290 323:1:0 21-7-0 412 36.1 325 39.0 1263 116.4 — 03:2:0 18-12-0 706 61.9 296 35.5 998 92.0 — 03:1:1 12-4-4 235 20.7 913 109.5 723 66.7 129 283:1:1 15-5-5 294 25.8 643 77.1 902 83.2 161 463:2:1 12-8-4 471 41.3 757 90.8 643 59.3 129 323:3:1 12-12-4 706 61.9 599 71.8 566 52.2 129 323:4:1 12-16-4 941 82.6 444 53.2 486 44.8 129 323:1:2 9-3-6 177 15.6 1088 131.5 541 49.8 194 323:2:2 9-6-6 353 30.9 970 116.3 483 44.5 194 363:3:2 9-9-6 529 46.4 850 102.0 427 39.3 194 363:1:3 6-2-6 118 10.3 1327 159.1 361 33.3 194 183:2:3 6-4-6 235 20.7 1248 149.6 323 29.8 194 184:1:0 24-6-0 353 30.9 164 19.7 1483 136.7 — 204:1:1 12-3-3 176 15.4 984 118.0 743 68.5 97 184:2:1 12-6-3 353 30.9 866 104.0 684 63.0 97 184:3:1 12-9-3 529 46.4 751 90.2 623 57.4 97 184:4:1 12-12-3 706 61.9 631 75.7 566 52.2 97 234:1:2 8-2-4 118 10.3 1259 151.1 494 45.5 129 144:3:2 8-6-4 353 30.9 1101 132.0 417 38.4 129 94:1:3 8-2-6 118 10.3 1194 143.3 494 45.5 194 324:2:3 8-4-6 235 20.6 1114 133.7 457 42.1 194 324:3:3 8-6-6 353 30.9 1036 124.2 417 38.4 194 284:4:3 8-8-6 471 41.3 958 115.0 377 34.7 194 284:3:4 8-6-8 353 30.0 972 116.5 417 38.4 258 40
Guidelines supplied by R. D. Curley, C.P. Ag., Consultant
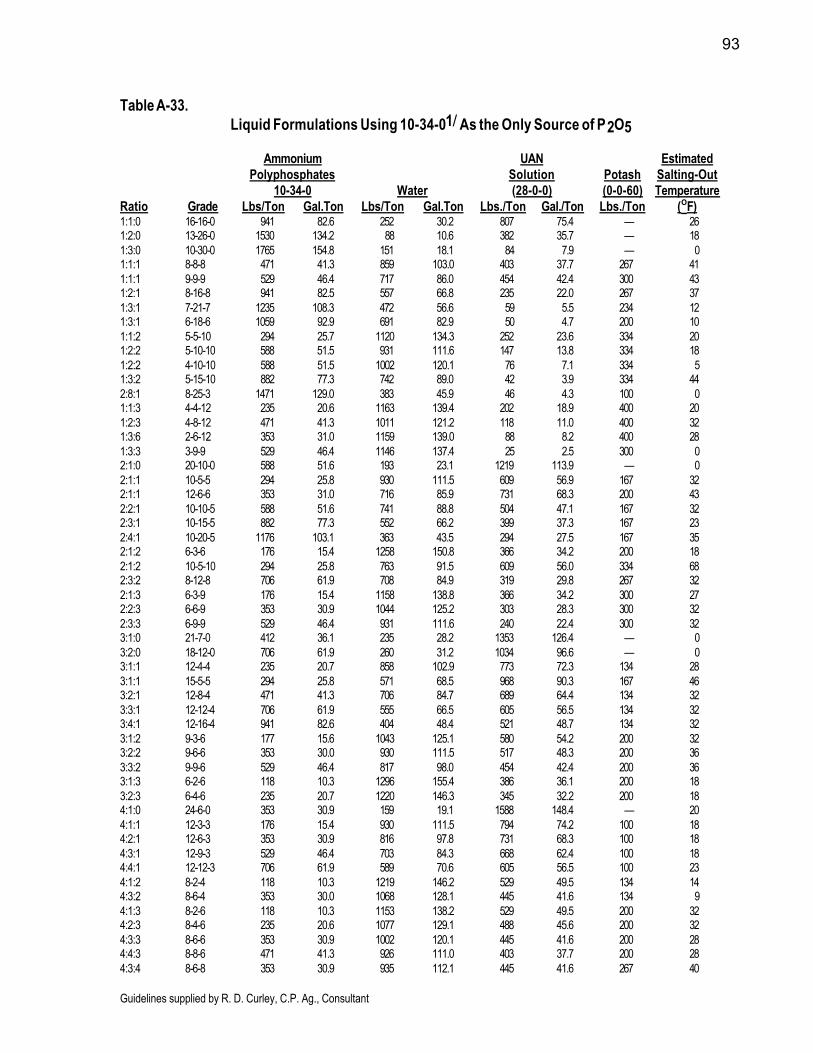
93
Table A-33.Liquid Formulations Using 10-34-01/ As the Only Source of P2O5
Ammonium UAN EstimatedPolyphosphates Solution Potash Salting-Out
10-34-0 Water (28-0-0) (0-0-60) TemperatureRatio Grade Lbs/Ton Gal.Ton Lbs/Ton Gal.Ton Lbs./Ton Gal./Ton Lbs./Ton (ºF)1:1:0 16-16-0 941 82.6 252 30.2 807 75.4 — 261:2:0 13-26-0 1530 134.2 88 10.6 382 35.7 — 181:3:0 10-30-0 1765 154.8 151 18.1 84 7.9 — 01:1:1 8-8-8 471 41.3 859 103.0 403 37.7 267 411:1:1 9-9-9 529 46.4 717 86.0 454 42.4 300 431:2:1 8-16-8 941 82.5 557 66.8 235 22.0 267 371:3:1 7-21-7 1235 108.3 472 56.6 59 5.5 234 121:3:1 6-18-6 1059 92.9 691 82.9 50 4.7 200 101:1:2 5-5-10 294 25.7 1120 134.3 252 23.6 334 201:2:2 5-10-10 588 51.5 931 111.6 147 13.8 334 181:2:2 4-10-10 588 51.5 1002 120.1 76 7.1 334 51:3:2 5-15-10 882 77.3 742 89.0 42 3.9 334 442:8:1 8-25-3 1471 129.0 383 45.9 46 4.3 100 01:1:3 4-4-12 235 20.6 1163 139.4 202 18.9 400 201:2:3 4-8-12 471 41.3 1011 121.2 118 11.0 400 321:3:6 2-6-12 353 31.0 1159 139.0 88 8.2 400 281:3:3 3-9-9 529 46.4 1146 137.4 25 2.5 300 02:1:0 20-10-0 588 51.6 193 23.1 1219 113.9 — 02:1:1 10-5-5 294 25.8 930 111.5 609 56.9 167 322:1:1 12-6-6 353 31.0 716 85.9 731 68.3 200 432:2:1 10-10-5 588 51.6 741 88.8 504 47.1 167 322:3:1 10-15-5 882 77.3 552 66.2 399 37.3 167 232:4:1 10-20-5 1176 103.1 363 43.5 294 27.5 167 352:1:2 6-3-6 176 15.4 1258 150.8 366 34.2 200 182:1:2 10-5-10 294 25.8 763 91.5 609 56.0 334 682:3:2 8-12-8 706 61.9 708 84.9 319 29.8 267 322:1:3 6-3-9 176 15.4 1158 138.8 366 34.2 300 272:2:3 6-6-9 353 30.9 1044 125.2 303 28.3 300 322:3:3 6-9-9 529 46.4 931 111.6 240 22.4 300 323:1:0 21-7-0 412 36.1 235 28.2 1353 126.4 — 03:2:0 18-12-0 706 61.9 260 31.2 1034 96.6 — 03:1:1 12-4-4 235 20.7 858 102.9 773 72.3 134 283:1:1 15-5-5 294 25.8 571 68.5 968 90.3 167 463:2:1 12-8-4 471 41.3 706 84.7 689 64.4 134 323:3:1 12-12-4 706 61.9 555 66.5 605 56.5 134 323:4:1 12-16-4 941 82.6 404 48.4 521 48.7 134 323:1:2 9-3-6 177 15.6 1043 125.1 580 54.2 200 323:2:2 9-6-6 353 30.0 930 111.5 517 48.3 200 363:3:2 9-9-6 529 46.4 817 98.0 454 42.4 200 363:1:3 6-2-6 118 10.3 1296 155.4 386 36.1 200 183:2:3 6-4-6 235 20.7 1220 146.3 345 32.2 200 184:1:0 24-6-0 353 30.9 159 19.1 1588 148.4 — 204:1:1 12-3-3 176 15.4 930 111.5 794 74.2 100 184:2:1 12-6-3 353 30.9 816 97.8 731 68.3 100 184:3:1 12-9-3 529 46.4 703 84.3 668 62.4 100 184:4:1 12-12-3 706 61.9 589 70.6 605 56.5 100 234:1:2 8-2-4 118 10.3 1219 146.2 529 49.5 134 144:3:2 8-6-4 353 30.0 1068 128.1 445 41.6 134 94:1:3 8-2-6 118 10.3 1153 138.2 529 49.5 200 324:2:3 8-4-6 235 20.6 1077 129.1 488 45.6 200 324:3:3 8-6-6 353 30.9 1002 120.1 445 41.6 200 284:4:3 8-8-6 471 41.3 926 111.0 403 37.7 200 284:3:4 8-6-8 353 30.9 935 112.1 445 41.6 267 40
Guidelines supplied by R. D. Curley, C.P. Ag., Consultant
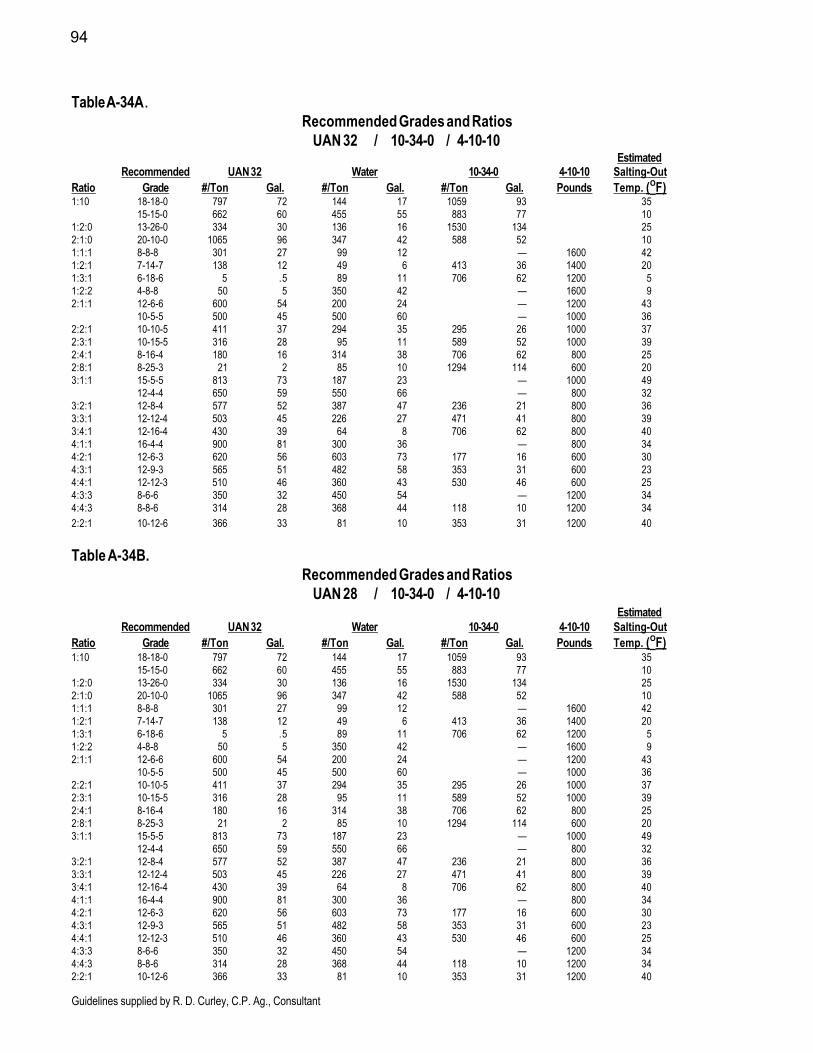
94
Table A-34A.Recommended Grades and Ratios
UAN 32 / 10-34-0 / 4-10-10Estimated
Recommended UAN 32 Water 10-34-0 4-10-10 Salting-OutRatio Grade #/Ton Gal. #/Ton Gal. #/Ton Gal. Pounds Temp. (ºF)1:10 18-18-0 797 72 144 17 1059 93 35
15-15-0 662 60 455 55 883 77 101:2:0 13-26-0 334 30 136 16 1530 134 252:1:0 20-10-0 1065 96 347 42 588 52 101:1:1 8-8-8 301 27 99 12 — 1600 421:2:1 7-14-7 138 12 49 6 413 36 1400 201:3:1 6-18-6 5 .5 89 11 706 62 1200 51:2:2 4-8-8 50 5 350 42 — 1600 92:1:1 12-6-6 600 54 200 24 — 1200 43
10-5-5 500 45 500 60 — 1000 362:2:1 10-10-5 411 37 294 35 295 26 1000 372:3:1 10-15-5 316 28 95 11 589 52 1000 392:4:1 8-16-4 180 16 314 38 706 62 800 252:8:1 8-25-3 21 2 85 10 1294 114 600 203:1:1 15-5-5 813 73 187 23 — 1000 49
12-4-4 650 59 550 66 — 800 323:2:1 12-8-4 577 52 387 47 236 21 800 363:3:1 12-12-4 503 45 226 27 471 41 800 393:4:1 12-16-4 430 39 64 8 706 62 800 404:1:1 16-4-4 900 81 300 36 — 800 344:2:1 12-6-3 620 56 603 73 177 16 600 304:3:1 12-9-3 565 51 482 58 353 31 600 234:4:1 12-12-3 510 46 360 43 530 46 600 254:3:3 8-6-6 350 32 450 54 — 1200 344:4:3 8-8-6 314 28 368 44 118 10 1200 342:2:1 10-12-6 366 33 81 10 353 31 1200 40
Table A-34B.Recommended Grades and Ratios
UAN 28 / 10-34-0 / 4-10-10Estimated
Recommended UAN 32 Water 10-34-0 4-10-10 Salting-OutRatio Grade #/Ton Gal. #/Ton Gal. #/Ton Gal. Pounds Temp. (ºF)1:10 18-18-0 797 72 144 17 1059 93 35
15-15-0 662 60 455 55 883 77 101:2:0 13-26-0 334 30 136 16 1530 134 252:1:0 20-10-0 1065 96 347 42 588 52 101:1:1 8-8-8 301 27 99 12 — 1600 421:2:1 7-14-7 138 12 49 6 413 36 1400 201:3:1 6-18-6 5 .5 89 11 706 62 1200 51:2:2 4-8-8 50 5 350 42 — 1600 92:1:1 12-6-6 600 54 200 24 — 1200 43
10-5-5 500 45 500 60 — 1000 362:2:1 10-10-5 411 37 294 35 295 26 1000 372:3:1 10-15-5 316 28 95 11 589 52 1000 392:4:1 8-16-4 180 16 314 38 706 62 800 252:8:1 8-25-3 21 2 85 10 1294 114 600 203:1:1 15-5-5 813 73 187 23 — 1000 49
12-4-4 650 59 550 66 — 800 323:2:1 12-8-4 577 52 387 47 236 21 800 363:3:1 12-12-4 503 45 226 27 471 41 800 393:4:1 12-16-4 430 39 64 8 706 62 800 404:1:1 16-4-4 900 81 300 36 — 800 344:2:1 12-6-3 620 56 603 73 177 16 600 304:3:1 12-9-3 565 51 482 58 353 31 600 234:4:1 12-12-3 510 46 360 43 530 46 600 254:3:3 8-6-6 350 32 450 54 — 1200 344:4:3 8-8-6 314 28 368 44 118 10 1200 342:2:1 10-12-6 366 33 81 10 353 31 1200 40
Guidelines supplied by R. D. Curley, C.P. Ag., Consultant
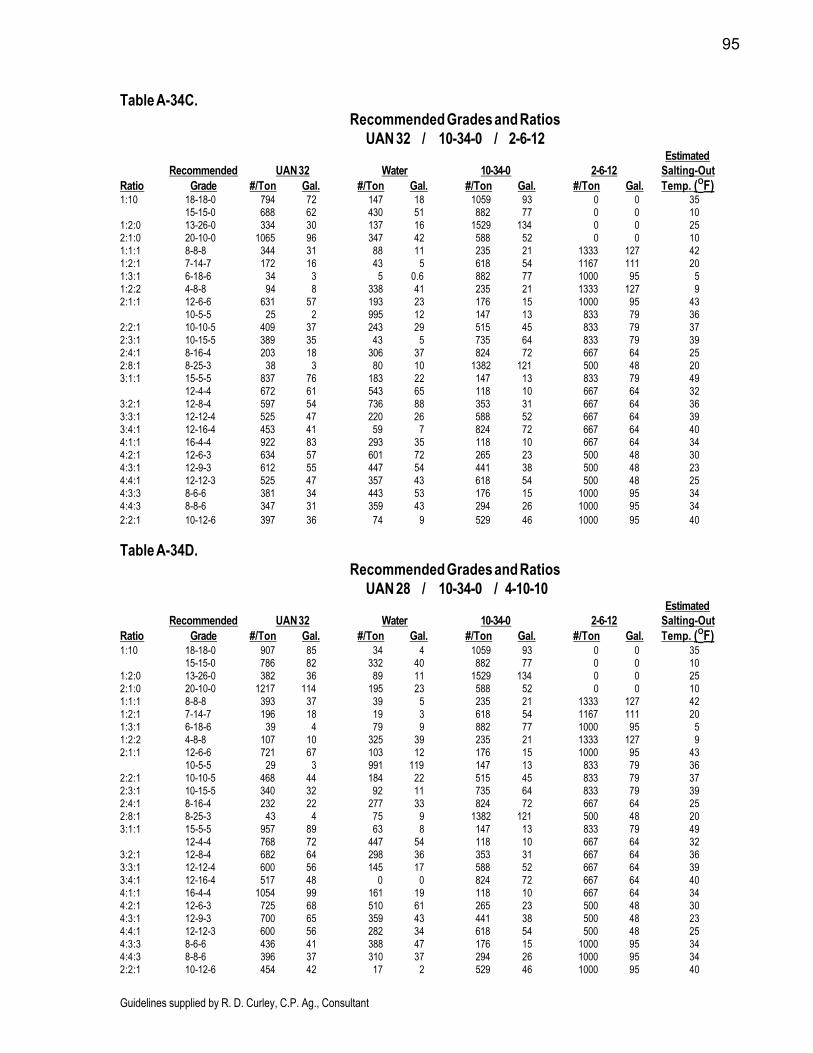
95
Table A-34C.Recommended Grades and Ratios
UAN 32 / 10-34-0 / 2-6-12Estimated
Recommended UAN 32 Water 10-34-0 2-6-12 Salting-OutRatio Grade #/Ton Gal. #/Ton Gal. #/Ton Gal. #/Ton Gal. Temp. (ºF)1:10 18-18-0 794 72 147 18 1059 93 0 0 35
15-15-0 688 62 430 51 882 77 0 0 101:2:0 13-26-0 334 30 137 16 1529 134 0 0 252:1:0 20-10-0 1065 96 347 42 588 52 0 0 101:1:1 8-8-8 344 31 88 11 235 21 1333 127 421:2:1 7-14-7 172 16 43 5 618 54 1167 111 201:3:1 6-18-6 34 3 5 0.6 882 77 1000 95 51:2:2 4-8-8 94 8 338 41 235 21 1333 127 92:1:1 12-6-6 631 57 193 23 176 15 1000 95 43
10-5-5 25 2 995 12 147 13 833 79 362:2:1 10-10-5 409 37 243 29 515 45 833 79 372:3:1 10-15-5 389 35 43 5 735 64 833 79 392:4:1 8-16-4 203 18 306 37 824 72 667 64 252:8:1 8-25-3 38 3 80 10 1382 121 500 48 203:1:1 15-5-5 837 76 183 22 147 13 833 79 49
12-4-4 672 61 543 65 118 10 667 64 323:2:1 12-8-4 597 54 736 88 353 31 667 64 363:3:1 12-12-4 525 47 220 26 588 52 667 64 393:4:1 12-16-4 453 41 59 7 824 72 667 64 404:1:1 16-4-4 922 83 293 35 118 10 667 64 344:2:1 12-6-3 634 57 601 72 265 23 500 48 304:3:1 12-9-3 612 55 447 54 441 38 500 48 234:4:1 12-12-3 525 47 357 43 618 54 500 48 254:3:3 8-6-6 381 34 443 53 176 15 1000 95 344:4:3 8-8-6 347 31 359 43 294 26 1000 95 342:2:1 10-12-6 397 36 74 9 529 46 1000 95 40
Table A-34D.Recommended Grades and Ratios
UAN 28 / 10-34-0 / 4-10-10Estimated
Recommended UAN 32 Water 10-34-0 2-6-12 Salting-OutRatio Grade #/Ton Gal. #/Ton Gal. #/Ton Gal. #/Ton Gal. Temp. (ºF)1:10 18-18-0 907 85 34 4 1059 93 0 0 35
15-15-0 786 82 332 40 882 77 0 0 101:2:0 13-26-0 382 36 89 11 1529 134 0 0 252:1:0 20-10-0 1217 114 195 23 588 52 0 0 101:1:1 8-8-8 393 37 39 5 235 21 1333 127 421:2:1 7-14-7 196 18 19 3 618 54 1167 111 201:3:1 6-18-6 39 4 79 9 882 77 1000 95 51:2:2 4-8-8 107 10 325 39 235 21 1333 127 92:1:1 12-6-6 721 67 103 12 176 15 1000 95 43
10-5-5 29 3 991 119 147 13 833 79 362:2:1 10-10-5 468 44 184 22 515 45 833 79 372:3:1 10-15-5 340 32 92 11 735 64 833 79 392:4:1 8-16-4 232 22 277 33 824 72 667 64 252:8:1 8-25-3 43 4 75 9 1382 121 500 48 203:1:1 15-5-5 957 89 63 8 147 13 833 79 49
12-4-4 768 72 447 54 118 10 667 64 323:2:1 12-8-4 682 64 298 36 353 31 667 64 363:3:1 12-12-4 600 56 145 17 588 52 667 64 393:4:1 12-16-4 517 48 0 0 824 72 667 64 404:1:1 16-4-4 1054 99 161 19 118 10 667 64 344:2:1 12-6-3 725 68 510 61 265 23 500 48 304:3:1 12-9-3 700 65 359 43 441 38 500 48 234:4:1 12-12-3 600 56 282 34 618 54 500 48 254:3:3 8-6-6 436 41 388 47 176 15 1000 95 344:4:3 8-8-6 396 37 310 37 294 26 1000 95 342:2:1 10-12-6 454 42 17 2 529 46 1000 95 40
Guidelines supplied by R. D. Curley, C.P. Ag., Consultant
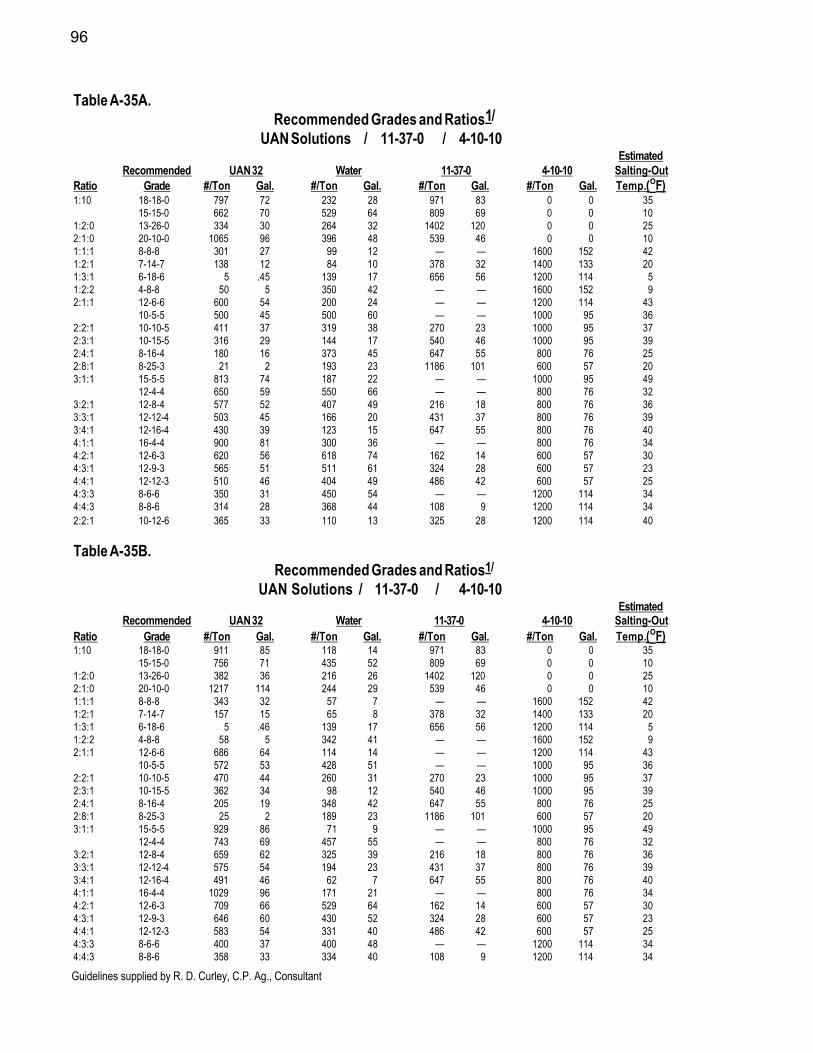
96
Table A-35A.Recommended Grades and Ratios1/
UAN Solutions / 11-37-0 / 4-10-10Estimated
Recommended UAN 32 Water 11-37-0 4-10-10 Salting-OutRatio Grade #/Ton Gal. #/Ton Gal. #/Ton Gal. #/Ton Gal. Temp.(ºF)1:10 18-18-0 797 72 232 28 971 83 0 0 35
15-15-0 662 70 529 64 809 69 0 0 101:2:0 13-26-0 334 30 264 32 1402 120 0 0 252:1:0 20-10-0 1065 96 396 48 539 46 0 0 101:1:1 8-8-8 301 27 99 12 — — 1600 152 421:2:1 7-14-7 138 12 84 10 378 32 1400 133 201:3:1 6-18-6 5 .45 139 17 656 56 1200 114 51:2:2 4-8-8 50 5 350 42 — — 1600 152 92:1:1 12-6-6 600 54 200 24 — — 1200 114 43
10-5-5 500 45 500 60 — — 1000 95 362:2:1 10-10-5 411 37 319 38 270 23 1000 95 372:3:1 10-15-5 316 29 144 17 540 46 1000 95 392:4:1 8-16-4 180 16 373 45 647 55 800 76 252:8:1 8-25-3 21 2 193 23 1186 101 600 57 203:1:1 15-5-5 813 74 187 22 — — 1000 95 49
12-4-4 650 59 550 66 — — 800 76 323:2:1 12-8-4 577 52 407 49 216 18 800 76 363:3:1 12-12-4 503 45 166 20 431 37 800 76 393:4:1 12-16-4 430 39 123 15 647 55 800 76 404:1:1 16-4-4 900 81 300 36 — — 800 76 344:2:1 12-6-3 620 56 618 74 162 14 600 57 304:3:1 12-9-3 565 51 511 61 324 28 600 57 234:4:1 12-12-3 510 46 404 49 486 42 600 57 254:3:3 8-6-6 350 31 450 54 — — 1200 114 344:4:3 8-8-6 314 28 368 44 108 9 1200 114 342:2:1 10-12-6 365 33 110 13 325 28 1200 114 40
Table A-35B.Recommended Grades and Ratios1/
UAN Solutions / 11-37-0 / 4-10-10Estimated
Recommended UAN 32 Water 11-37-0 4-10-10 Salting-OutRatio Grade #/Ton Gal. #/Ton Gal. #/Ton Gal. #/Ton Gal. Temp.(ºF)1:10 18-18-0 911 85 118 14 971 83 0 0 35
15-15-0 756 71 435 52 809 69 0 0 101:2:0 13-26-0 382 36 216 26 1402 120 0 0 252:1:0 20-10-0 1217 114 244 29 539 46 0 0 101:1:1 8-8-8 343 32 57 7 — — 1600 152 421:2:1 7-14-7 157 15 65 8 378 32 1400 133 201:3:1 6-18-6 5 .46 139 17 656 56 1200 114 51:2:2 4-8-8 58 5 342 41 — — 1600 152 92:1:1 12-6-6 686 64 114 14 — — 1200 114 43
10-5-5 572 53 428 51 — — 1000 95 362:2:1 10-10-5 470 44 260 31 270 23 1000 95 372:3:1 10-15-5 362 34 98 12 540 46 1000 95 392:4:1 8-16-4 205 19 348 42 647 55 800 76 252:8:1 8-25-3 25 2 189 23 1186 101 600 57 203:1:1 15-5-5 929 86 71 9 — — 1000 95 49
12-4-4 743 69 457 55 — — 800 76 323:2:1 12-8-4 659 62 325 39 216 18 800 76 363:3:1 12-12-4 575 54 194 23 431 37 800 76 393:4:1 12-16-4 491 46 62 7 647 55 800 76 404:1:1 16-4-4 1029 96 171 21 — — 800 76 344:2:1 12-6-3 709 66 529 64 162 14 600 57 304:3:1 12-9-3 646 60 430 52 324 28 600 57 234:4:1 12-12-3 583 54 331 40 486 42 600 57 254:3:3 8-6-6 400 37 400 48 — — 1200 114 344:4:3 8-8-6 358 33 334 40 108 9 1200 114 34
Guidelines supplied by R. D. Curley, C.P. Ag., Consultant

97
2:2:1 10-12-6 418 39 57 7 325 28 1200 114 40Table A-35C.
Recommended Grades and RatiosUAN Solutions / 11-37-0 / 2-6-12
EstimatedRecommended UAN 32 Water 11-37-0 2-6-12 Salting-Out
Ratio Grade #/Ton Gal. #/Ton Gal. #/Ton Gal. #/Ton Gal. Temp. (ºF)1:10 18-18-0 794 72 957 115 971 83 0 0 35
15-15-0 688 62 504 60 808 69 0 0 101:2:0 13-26-0 334 30 264 32 1402 120 0 0 252:1:0 20-10-0 1065 96 396 48 539 46 0 0 101:1:1 8-8-8 344 31 108 13 215 18 1333 127 421:2:1 7-14-7 172 16 95 11 566 8 1167 111 201:3:1 6-18-6 34 3 158 19 808 69 1000 95 51:2:2 4-8-8 94 8 358 43 215 18 1333 127 92:1:1 12-6-6 631 57 208 25 161 14 1000 95 43
10-5-5 25 2 1007 121 135 12 833 79 362:2:1 10-10-5 409 37 286 34 472 40 833 79 372:3:1 10-15-5 389 35 105 13 673 58 833 79 392:4:1 8-16-4 203 18 375 45 755 65 667 64 252:8:1 8-25-3 38 3 195 23 1267 108 500 48 203:1:1 15-5-5 837 76 195 23 135 12 833 79 49
12-4-4 672 61 553 66 108 9 667 64 323:2:1 12-8-4 597 54 412 61 324 28 667 64 363:3:1 12-12-4 525 47 269 32 539 46 667 64 393:4:1 12-16-4 453 41 125 15 755 65 667 64 404:1:1 16-4-4 922 83 303 36 108 9 667 64 344:2:1 12-6-3 634 57 623 75 243 21 500 48 304:3:1 12-9-3 612 55 484 58 404 35 500 48 234:4:1 12-12-3 525 47 409 50 566 48 500 48 254:3:3 8-6-6 381 34 458 55 161 14 1000 95 344:4:3 8-8-6 347 31 384 47 269 23 1000 95 342:2:1 10-12-6 397 36 118 14 485 41 1000 95 40
Table A-35D.Recommended Grades and Ratios
UAN Solutions / 11-37-0 / 2-6-1Estimated
Recommended UAN 32 Water 11-37-0 2-6-12 Salting-OutRatio Grade #/Ton Gal. #/Ton Gal. #/Ton Gal. #/Ton Gal. Temp. (ºF)1:10 18-18-0 907 85 944 113 971 83 0 0 35
15-15-0 786 82 406 48 808 69 0 0 101:2:0 13-26-0 382 36 216 26 1402 120 0 0 252:1:0 20-10-0 1217 114 244 29 539 46 0 0 101:1:1 8-8-8 393 37 59 7 215 18 1333 127 421:2:1 7-14-7 196 18 71 8 566 8 1167 111 201:3:1 6-18-6 39 4 153 18 808 69 1000 95 51:2:2 4-8-8 107 10 345 41 215 18 1333 127 92:1:1 12-6-6 721 67 118 14 161 14 1000 95 43
10-5-5 29 3 1003 120 135 12 833 79 362:2:1 10-10-5 468 44 227 27 472 40 833 79 372:3:1 10-15-5 340 32 154 18 673 58 833 79 392:4:1 8-16-4 232 22 346 41 755 65 667 64 252:8:1 8-25-3 43 4 190 23 1267 108 500 48 203:1:1 15-5-5 957 89 75 9 135 12 833 79 49
12-4-4 768 72 457 55 108 9 667 64 323:2:1 12-8-4 682 64 327 39 324 28 667 64 363:3:1 12-12-4 600 56 194 23 539 46 667 64 393:4:1 12-16-4 517 48 61 7 755 65 667 64 404:1:1 16-4-4 1054 99 171 21 108 9 667 64 344:2:1 12-6-3 725 68 532 64 243 21 500 48 304:3:1 12-9-3 700 65 396 48 404 35 500 48 234:4:1 12-12-3 600 56 334 40 566 48 500 48 254:3:3 8-6-6 436 41 403 48 161 14 1000 95 344:4:3 8-8-6 396 37 1665 200 269 23 1000 95 342:2:1 10-12-6 454 42 1939 232 485 41 1000 95 40Guidelines supplied by R. D. Curley, C.P. Ag., Consultant
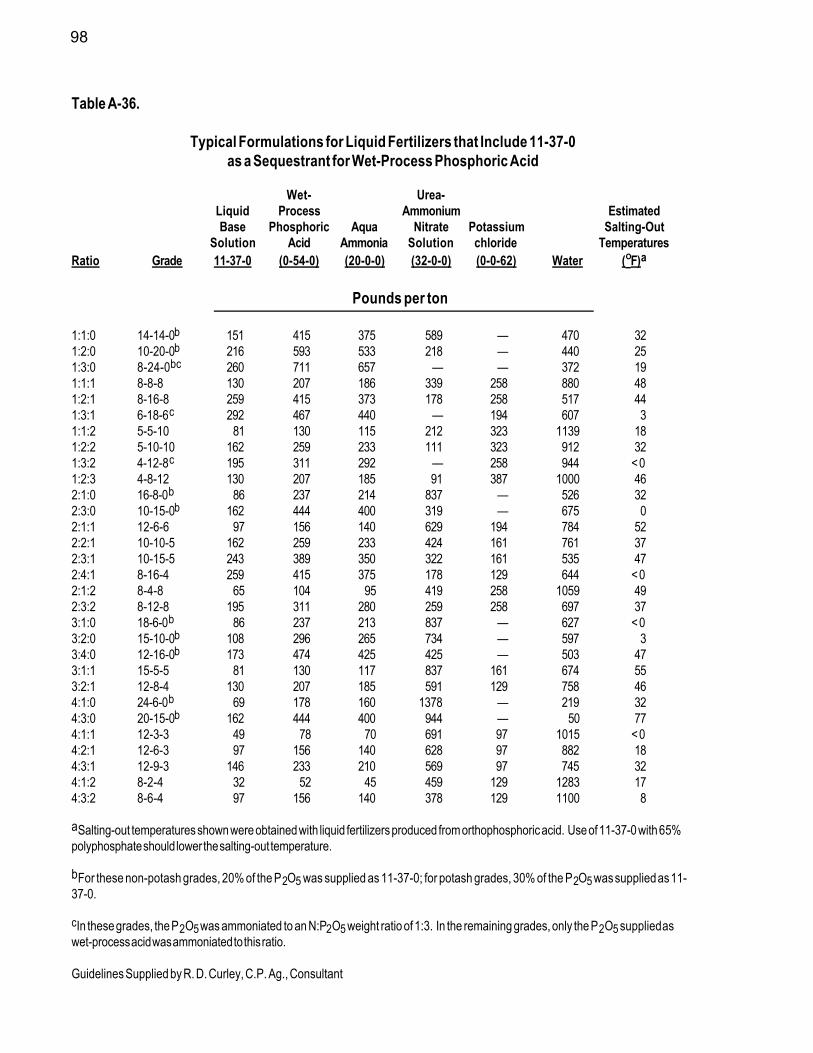
98
Table A-36.
Typical Formulations for Liquid Fertilizers that Include 11-37-0as a Sequestrant for Wet-Process Phosphoric Acid
Wet- Urea-Liquid Process Ammonium EstimatedBase Phosphoric Aqua Nitrate Potassium Salting-Out
Solution Acid Ammonia Solution chloride TemperaturesRatio Grade 11-37-0 (0-54-0) (20-0-0) (32-0-0) (0-0-62) Water (ºF)a
Pounds per ton
1:1:0 14-14-0b 151 415 375 589 — 470 321:2:0 10-20-0b 216 593 533 218 — 440 251:3:0 8-24-0b c 260 711 657 — — 372 191:1:1 8-8-8 130 207 186 339 258 880 481:2:1 8-16-8 259 415 373 178 258 517 441:3:1 6-18-6c 292 467 440 — 194 607 31:1:2 5-5-10 81 130 115 212 323 1139 181:2:2 5-10-10 162 259 233 111 323 912 321:3:2 4-12-8c 195 311 292 — 258 944 < 01:2:3 4-8-12 130 207 185 91 387 1000 462:1:0 16-8-0b 86 237 214 837 — 526 322:3:0 10-15-0b 162 444 400 319 — 675 02:1:1 12-6-6 97 156 140 629 194 784 522:2:1 10-10-5 162 259 233 424 161 761 372:3:1 10-15-5 243 389 350 322 161 535 472:4:1 8-16-4 259 415 375 178 129 644 < 02:1:2 8-4-8 65 104 95 419 258 1059 492:3:2 8-12-8 195 311 280 259 258 697 373:1:0 18-6-0b 86 237 213 837 — 627 < 03:2:0 15-10-0b 108 296 265 734 — 597 33:4:0 12-16-0b 173 474 425 425 — 503 473:1:1 15-5-5 81 130 117 837 161 674 553:2:1 12-8-4 130 207 185 591 129 758 464:1:0 24-6-0b 69 178 160 1378 — 219 324:3:0 20-15-0b 162 444 400 944 — 50 774:1:1 12-3-3 49 78 70 691 97 1015 < 04:2:1 12-6-3 97 156 140 628 97 882 184:3:1 12-9-3 146 233 210 569 97 745 324:1:2 8-2-4 32 52 45 459 129 1283 174:3:2 8-6-4 97 156 140 378 129 1100 8
aSalting-out temperatures shown were obtained with liquid fertilizers produced from orthophosphoric acid. Use of 11-37-0 with 65%polyphosphate should lower the salting-out temperature.
bFor these non-potash grades, 20% of the P2O5 was supplied as 11-37-0; for potash grades, 30% of the P2O5 was supplied as 11-37-0.
cIn these grades, the P2O5 was ammoniated to an N:P2O5 weight ratio of 1:3. In the remaining grades, only the P2O5 supplied aswet-process acid was ammoniated to this ratio.
Guidelines Supplied by R. D. Curley, C.P. Ag., Consultant

99
Table A-37A.
Typical Formulations for Liquid Cold MixFertilizer Plants
Urea-Liquid Ammonium EstimatedBase Nitrate Potassium Salting-Out
Solution Solution chloride TemperaturesRatio Grade 11-37-0 (32-0-0) (0-0-62) Water (ºF)a
Pounds per ton of Product1:1:0 19-19-0 1027 834 — 139 < 321:2:0 15-30-0 1620a 380a — — < 321:3:0 12-36-0 1940a 60a — — < 321:1:1 8-8-8 432 352 258 958 441:2:1 8-16-8 865 203 258 674 321:3:1 7-21-7 1135 47 226 592 81:1:2 5-5-10 270 220 323 1187 201:2:2 5-10-10 541 127 323 1009 201:3:2 5-15-10 811 34 323 832 441:1:3 4-4-12 216 176 387 1221 141:2:3 4-8-12 432 102 387 1079 381:3:3 3-9-9 486 20 290 1204 <02:1:0 22-11-0 595 1172 — 233 < 322:1:1 10-5-5 270 532 161 1037 322:2:1 10-10-5 541 439 161 859 342:3:1 10-15-5 811 347 161 681 312:4:1 10-20-5 1081 253 161 505 352:1:2 8-4-8 216 426 258 1100 412:3:2 8-12-8 649 277 258 816 372:1:3 6-3-9 162 319 290 1229 262:2:3 6-6-9 324 264 290 1122 322:3:3 6-9-9 486 208 290 1016 143:1:0 24-8-0 432 1352 — 216 < 323:2:0 21-14-0 757 1053 — 190 < 323:1:1 12-4-4 216 676 129 979 303:2:1 12-8-4 432 602 129 837 303:3:1 12-12-4 649 527 129 695 343:4:1 12-16-4 865 453 129 553 373:1:2 9-3-6 162 507 194 1137 323:2:2 9-6-6 324 451 194 1031 343:3:2 9-9-6 86 395 194 925 373:4:2 9-12-6 649 339 194 818 323:1:3 6-2-6 108 338 194 1360 203:2:3 6-4-6 216 301 194 1289 164:1:0 24-6-0 324 1389 — 287 < 324:1:1 12-3-3 162 694 97 1047 164:2:1 12-6-3 324 639 97 940 164:3:1 12-9-3 486 583 97 834 204:4:1 12-12-3 649 527 97 727 184:1:2 8-2-4 108 463 129 1300 134:3:2 8-6-4 324 389 129 1158 114:1:3 8-2-6 108 463 194 1235 234:2:3 8-4-6 216 426 194 1164 304:3:3 8-6-6 324 389 194 1093 304:4:3 8-8-6 432 352 194 1022 304:3:4 8-6-8 324 389 258 1029 41
aSlight overage in analysis required to make grade.
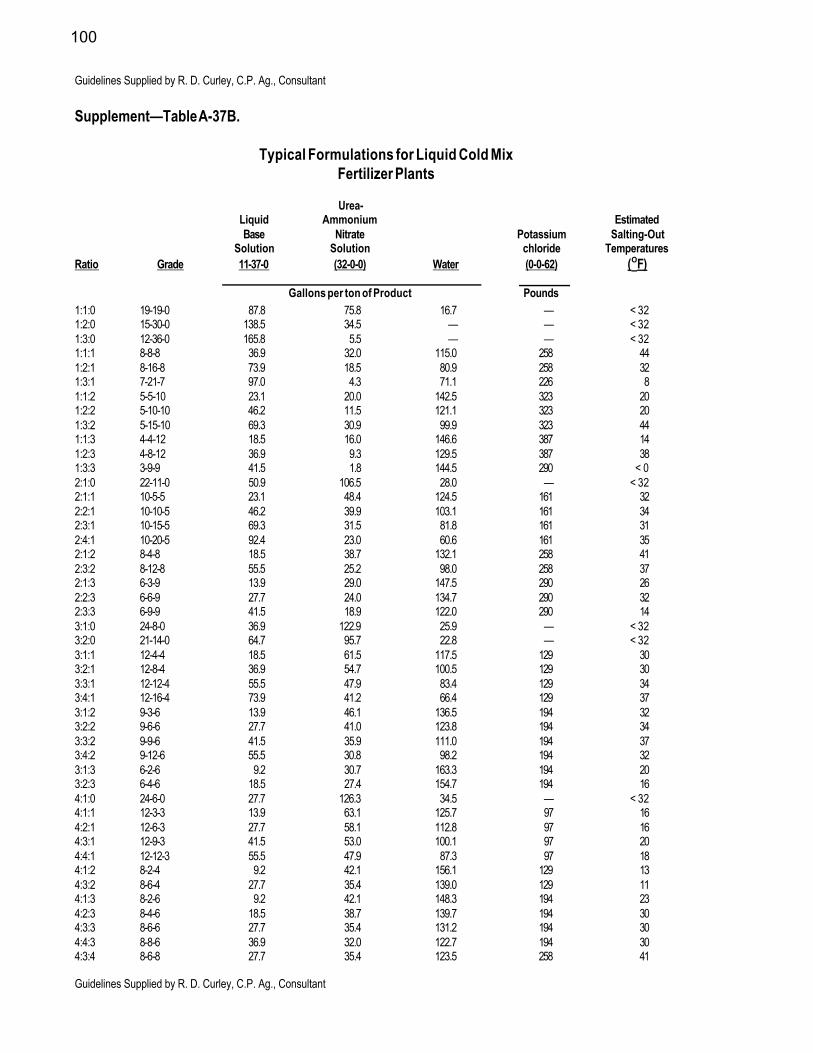
100
Guidelines Supplied by R. D. Curley, C.P. Ag., Consultant
Supplement—Table A-37B.
Typical Formulations for Liquid Cold MixFertilizer Plants
Urea-Liquid Ammonium EstimatedBase Nitrate Potassium Salting-Out
Solution Solution chloride TemperaturesRatio Grade 11-37-0 (32-0-0) Water (0-0-62) (ºF)
Gallons per ton of Product Pounds1:1:0 19-19-0 87.8 75.8 16.7 — < 321:2:0 15-30-0 138.5 34.5 — — < 321:3:0 12-36-0 165.8 5.5 — — < 321:1:1 8-8-8 36.9 32.0 115.0 258 441:2:1 8-16-8 73.9 18.5 80.9 258 321:3:1 7-21-7 97.0 4.3 71.1 226 81:1:2 5-5-10 23.1 20.0 142.5 323 201:2:2 5-10-10 46.2 11.5 121.1 323 201:3:2 5-15-10 69.3 30.9 99.9 323 441:1:3 4-4-12 18.5 16.0 146.6 387 141:2:3 4-8-12 36.9 9.3 129.5 387 381:3:3 3-9-9 41.5 1.8 144.5 290 < 02:1:0 22-11-0 50.9 106.5 28.0 — < 322:1:1 10-5-5 23.1 48.4 124.5 161 322:2:1 10-10-5 46.2 39.9 103.1 161 342:3:1 10-15-5 69.3 31.5 81.8 161 312:4:1 10-20-5 92.4 23.0 60.6 161 352:1:2 8-4-8 18.5 38.7 132.1 258 412:3:2 8-12-8 55.5 25.2 98.0 258 372:1:3 6-3-9 13.9 29.0 147.5 290 262:2:3 6-6-9 27.7 24.0 134.7 290 322:3:3 6-9-9 41.5 18.9 122.0 290 143:1:0 24-8-0 36.9 122.9 25.9 — < 323:2:0 21-14-0 64.7 95.7 22.8 — < 323:1:1 12-4-4 18.5 61.5 117.5 129 303:2:1 12-8-4 36.9 54.7 100.5 129 303:3:1 12-12-4 55.5 47.9 83.4 129 343:4:1 12-16-4 73.9 41.2 66.4 129 373:1:2 9-3-6 13.9 46.1 136.5 194 323:2:2 9-6-6 27.7 41.0 123.8 194 343:3:2 9-9-6 41.5 35.9 111.0 194 373:4:2 9-12-6 55.5 30.8 98.2 194 323:1:3 6-2-6 9.2 30.7 163.3 194 203:2:3 6-4-6 18.5 27.4 154.7 194 164:1:0 24-6-0 27.7 126.3 34.5 — < 324:1:1 12-3-3 13.9 63.1 125.7 97 164:2:1 12-6-3 27.7 58.1 112.8 97 164:3:1 12-9-3 41.5 53.0 100.1 97 204:4:1 12-12-3 55.5 47.9 87.3 97 184:1:2 8-2-4 9.2 42.1 156.1 129 134:3:2 8-6-4 27.7 35.4 139.0 129 114:1:3 8-2-6 9.2 42.1 148.3 194 234:2:3 8-4-6 18.5 38.7 139.7 194 304:3:3 8-6-6 27.7 35.4 131.2 194 304:4:3 8-8-6 36.9 32.0 122.7 194 304:3:4 8-6-8 27.7 35.4 123.5 258 41
Guidelines Supplied by R. D. Curley, C.P. Ag., Consultant
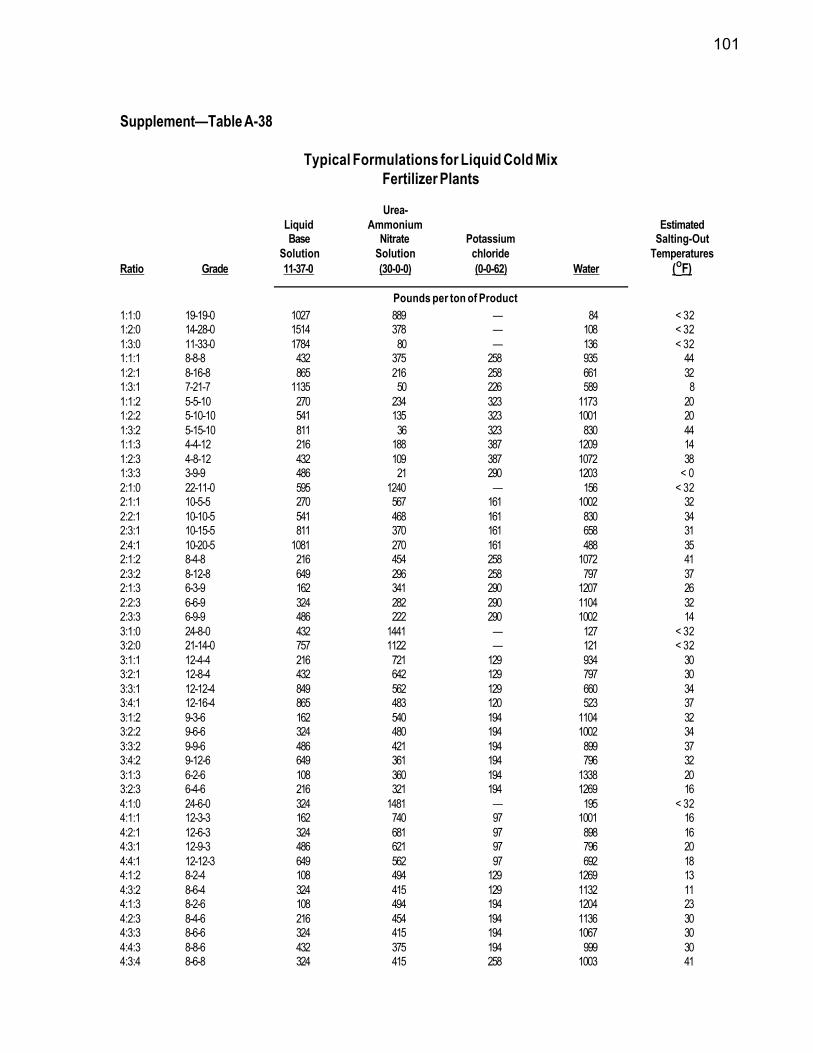
101
Supplement—Table A-38
Typical Formulations for Liquid Cold MixFertilizer Plants
Urea-Liquid Ammonium EstimatedBase Nitrate Potassium Salting-Out
Solution Solution chloride TemperaturesRatio Grade 11-37-0 (30-0-0) (0-0-62) Water (ºF)
Pounds per ton of Product1:1:0 19-19-0 1027 889 — 84 < 321:2:0 14-28-0 1514 378 — 108 < 321:3:0 11-33-0 1784 80 — 136 < 321:1:1 8-8-8 432 375 258 935 441:2:1 8-16-8 865 216 258 661 321:3:1 7-21-7 1135 50 226 589 81:1:2 5-5-10 270 234 323 1173 201:2:2 5-10-10 541 135 323 1001 201:3:2 5-15-10 811 36 323 830 441:1:3 4-4-12 216 188 387 1209 141:2:3 4-8-12 432 109 387 1072 381:3:3 3-9-9 486 21 290 1203 < 02:1:0 22-11-0 595 1240 — 156 < 322:1:1 10-5-5 270 567 161 1002 322:2:1 10-10-5 541 468 161 830 342:3:1 10-15-5 811 370 161 658 312:4:1 10-20-5 1081 270 161 488 352:1:2 8-4-8 216 454 258 1072 412:3:2 8-12-8 649 296 258 797 372:1:3 6-3-9 162 341 290 1207 262:2:3 6-6-9 324 282 290 1104 322:3:3 6-9-9 486 222 290 1002 143:1:0 24-8-0 432 1441 — 127 < 323:2:0 21-14-0 757 1122 — 121 < 323:1:1 12-4-4 216 721 129 934 303:2:1 12-8-4 432 642 129 797 303:3:1 12-12-4 849 562 129 660 343:4:1 12-16-4 865 483 120 523 373:1:2 9-3-6 162 540 194 1104 323:2:2 9-6-6 324 480 194 1002 343:3:2 9-9-6 486 421 194 899 373:4:2 9-12-6 649 361 194 796 323:1:3 6-2-6 108 360 194 1338 203:2:3 6-4-6 216 321 194 1269 164:1:0 24-6-0 324 1481 — 195 < 324:1:1 12-3-3 162 740 97 1001 164:2:1 12-6-3 324 681 97 898 164:3:1 12-9-3 486 621 97 796 204:4:1 12-12-3 649 562 97 692 184:1:2 8-2-4 108 494 129 1269 134:3:2 8-6-4 324 415 129 1132 114:1:3 8-2-6 108 494 194 1204 234:2:3 8-4-6 216 454 194 1136 304:3:3 8-6-6 324 415 194 1067 304:4:3 8-8-6 432 375 194 999 304:3:4 8-6-8 324 415 258 1003 41

102
Guidelines Supplied by R. D. Curley, C.P. Ag., Consultant
Supplement—Table A-39A
Typical Formulations for Liquid Cold MixFertilizer Plants
Urea-Liquid Ammonium EstimatedBase Nitrate Potassium Salting-Out
Solution Solution chloride TemperaturesRatio Grade 11-37-0 (28-0-0) (0-0-62) Water (ºF)
Pounds per ton of Product1:1:0 19-19-0 1027 953 — 20 321:2:0 14-28-0 1514 405 — 81 321:3:0 11-33-0 1784 86 — 130 321:1:1 8-8-8 432 402 258 908 441:2:1 8-16-8 865 232 258 645 321:3:1 7-21-7 1135 54 226 585 81:1:2 5-5-10 270 251 323 1156 201:2:2 5-10-10 541 145 323 991 201:3:2 5-15-10 811 39 323 827 441:1:3 4-4-12 216 201 387 1196 141:2:3 4-8-12 432 117 387 1064 381:3:3 3-9-9 486 23 290 1201 02:1:0 22-11-0 595 1339 — 66 322:1:1 10-5-5 270 608 161 961 322:2:1 10-10-5 541 502 161 796 342:3:1 10-15-5 811 397 161 631 312:4:1 10-20-5 1081 289 161 469 352:1:2 8-4-8 216 487 258 1039 412:3:2 8-12-8 649 317 258 776 372:1:3 6-3-9 162 365 290 1183 262:2:3 6-6-9 324 302 290 1084 322:3:3 6-9-9 486 238 290 986 143:1:0 24-8-0 432 1545 — 23 323:2:0 21-14-0 757 1203 — 40 323:1:1 12-4-4 216 773 129 882 303:2:1 12-8-4 432 688 129 751 303:3:1 12-12-4 649 602 129 620 343:4:1 12-16-4 865 518 129 488 373:1:2 9-3-6 162 579 194 1065 323:2:2 9-6-6 324 515 194 967 343:3:2 9-9-6 486 451 194 869 373:4:2 9-12-6 649 387 194 770 323:1:3 6-2-6 108 386 194 1312 203:2:3 6-4-6 216 344 194 1246 164:1:0 24-6-0 324 1587 — 89 324:1:1 12-3-3 162 793 97 948 164:2:1 12-6-3 324 760 97 849 164:3:1 12-9-3 486 666 97 751 204:4:1 12-12-3 649 602 97 652 184:1:2 8-2-4 108 529 129 1234 134:3:2 8-6-4 324 445 129 1102 114:1:3 8-2-6 108 529 194 1169 234:2:3 8-4-6 216 487 194 1103 304:3:3 8-6-6 324 445 194 1037 304:4:3 8-8-6 432 402 194 972 304:3:4 8-6-8 324 445 258 973 41
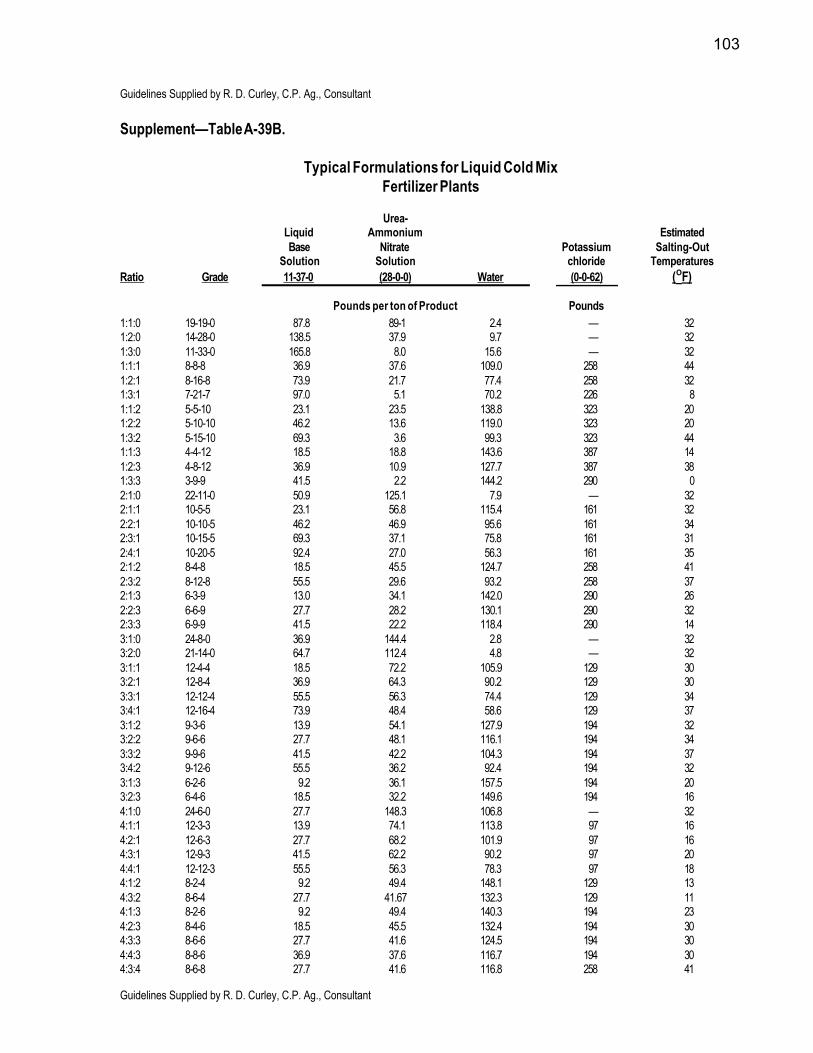
103
Guidelines Supplied by R. D. Curley, C.P. Ag., Consultant
Supplement—Table A-39B.
Typical Formulations for Liquid Cold MixFertilizer Plants
Urea-Liquid Ammonium EstimatedBase Nitrate Potassium Salting-Out
Solution Solution chloride TemperaturesRatio Grade 11-37-0 (28-0-0) Water (0-0-62) (ºF)
Pounds per ton of Product Pounds1:1:0 19-19-0 87.8 89-1 2.4 — 321:2:0 14-28-0 138.5 37.9 9.7 — 321:3:0 11-33-0 165.8 8.0 15.6 — 321:1:1 8-8-8 36.9 37.6 109.0 258 441:2:1 8-16-8 73.9 21.7 77.4 258 321:3:1 7-21-7 97.0 5.1 70.2 226 81:1:2 5-5-10 23.1 23.5 138.8 323 201:2:2 5-10-10 46.2 13.6 119.0 323 201:3:2 5-15-10 69.3 3.6 99.3 323 441:1:3 4-4-12 18.5 18.8 143.6 387 141:2:3 4-8-12 36.9 10.9 127.7 387 381:3:3 3-9-9 41.5 2.2 144.2 290 02:1:0 22-11-0 50.9 125.1 7.9 — 322:1:1 10-5-5 23.1 56.8 115.4 161 322:2:1 10-10-5 46.2 46.9 95.6 161 342:3:1 10-15-5 69.3 37.1 75.8 161 312:4:1 10-20-5 92.4 27.0 56.3 161 352:1:2 8-4-8 18.5 45.5 124.7 258 412:3:2 8-12-8 55.5 29.6 93.2 258 372:1:3 6-3-9 13.0 34.1 142.0 290 262:2:3 6-6-9 27.7 28.2 130.1 290 322:3:3 6-9-9 41.5 22.2 118.4 290 143:1:0 24-8-0 36.9 144.4 2.8 — 323:2:0 21-14-0 64.7 112.4 4.8 — 323:1:1 12-4-4 18.5 72.2 105.9 129 303:2:1 12-8-4 36.9 64.3 90.2 129 303:3:1 12-12-4 55.5 56.3 74.4 129 343:4:1 12-16-4 73.9 48.4 58.6 129 373:1:2 9-3-6 13.9 54.1 127.9 194 323:2:2 9-6-6 27.7 48.1 116.1 194 343:3:2 9-9-6 41.5 42.2 104.3 194 373:4:2 9-12-6 55.5 36.2 92.4 194 323:1:3 6-2-6 9.2 36.1 157.5 194 203:2:3 6-4-6 18.5 32.2 149.6 194 164:1:0 24-6-0 27.7 148.3 106.8 — 324:1:1 12-3-3 13.9 74.1 113.8 97 164:2:1 12-6-3 27.7 68.2 101.9 97 164:3:1 12-9-3 41.5 62.2 90.2 97 204:4:1 12-12-3 55.5 56.3 78.3 97 184:1:2 8-2-4 9.2 49.4 148.1 129 134:3:2 8-6-4 27.7 41.67 132.3 129 114:1:3 8-2-6 9.2 49.4 140.3 194 234:2:3 8-4-6 18.5 45.5 132.4 194 304:3:3 8-6-6 27.7 41.6 124.5 194 304:4:3 8-8-6 36.9 37.6 116.7 194 304:3:4 8-6-8 27.7 41.6 116.8 258 41
Guidelines Supplied by R. D. Curley, C.P. Ag., Consultant

104
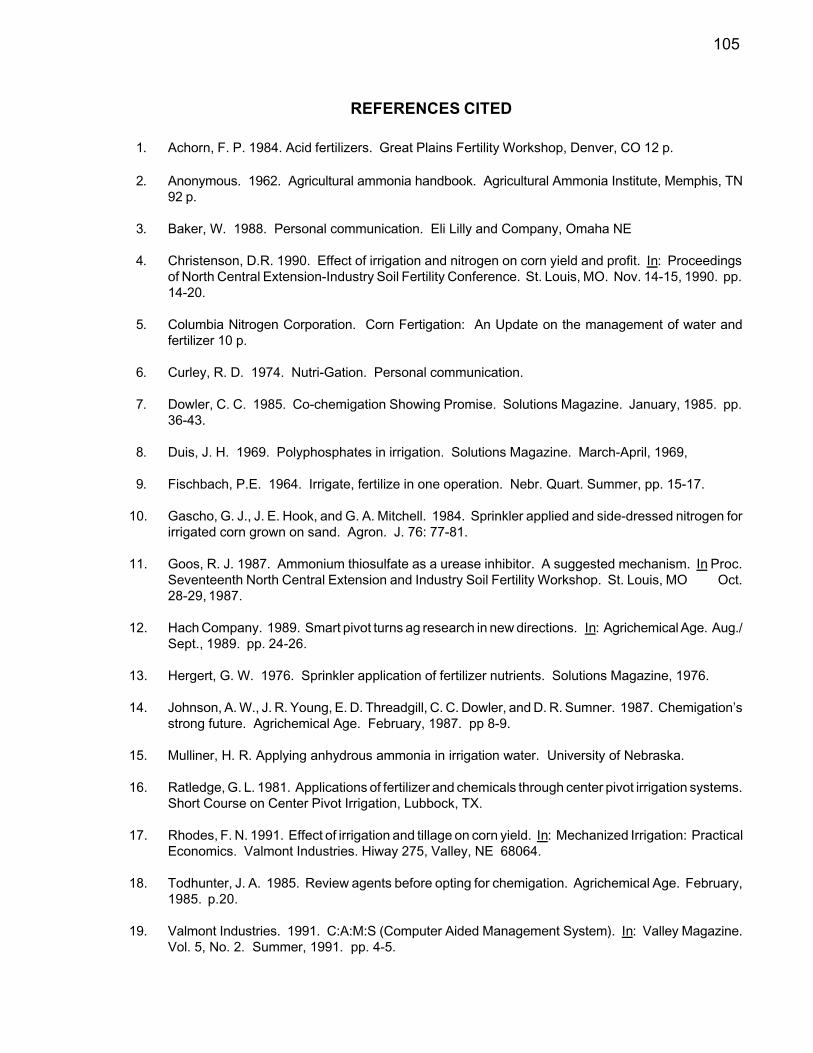
105
REFERENCES CITED
1. Achorn, F. P. 1984. Acid fertilizers. Great Plains Fertility Workshop, Denver, CO 12 p.
2. Anonymous. 1962. Agricultural ammonia handbook. Agricultural Ammonia Institute, Memphis, TN92 p.
3. Baker, W. 1988. Personal communication. Eli Lilly and Company, Omaha NE
4. Christenson, D.R. 1990. Effect of irrigation and nitrogen on corn yield and profit. In: Proceedingsof North Central Extension-Industry Soil Fertility Conference. St. Louis, MO. Nov. 14-15, 1990. pp.14-20.
5. Columbia Nitrogen Corporation. Corn Fertigation: An Update on the management of water andfertilizer 10 p.
6. Curley, R. D. 1974. Nutri-Gation. Personal communication.
7. Dowler, C. C. 1985. Co-chemigation Showing Promise. Solutions Magazine. January, 1985. pp.36-43.
8. Duis, J. H. 1969. Polyphosphates in irrigation. Solutions Magazine. March-April, 1969,
9. Fischbach, P.E. 1964. Irrigate, fertilize in one operation. Nebr. Quart. Summer, pp. 15-17.
10. Gascho, G. J., J. E. Hook, and G. A. Mitchell. 1984. Sprinkler applied and side-dressed nitrogen forirrigated corn grown on sand. Agron. J. 76: 77-81.
11. Goos, R. J. 1987. Ammonium thiosulfate as a urease inhibitor. A suggested mechanism. In Proc.Seventeenth North Central Extension and Industry Soil Fertility Workshop. St. Louis, MO Oct.28-29, 1987.
12. Hach Company. 1989. Smart pivot turns ag research in new directions. In: Agrichemical Age. Aug./Sept., 1989. pp. 24-26.
13. Hergert, G. W. 1976. Sprinkler application of fertilizer nutrients. Solutions Magazine, 1976.
14. Johnson, A. W., J. R. Young, E. D. Threadgill, C. C. Dowler, and D. R. Sumner. 1987. Chemigation’sstrong future. Agrichemical Age. February, 1987. pp 8-9.
15. Mulliner, H. R. Applying anhydrous ammonia in irrigation water. University of Nebraska.
16. Ratledge, G. L. 1981. Applications of fertilizer and chemicals through center pivot irrigation systems.Short Course on Center Pivot Irrigation, Lubbock, TX.
17. Rhodes, F. N. 1991. Effect of irrigation and tillage on corn yield. In: Mechanized Irrigation: PracticalEconomics. Valmont Industries. Hiway 275, Valley, NE 68064.
18. Todhunter, J. A. 1985. Review agents before opting for chemigation. Agrichemical Age. February,1985. p.20.
19. Valmont Industries. 1991. C:A:M:S (Computer Aided Management System). In: Valley Magazine.Vol. 5, No. 2. Summer, 1991. pp. 4-5.

106
20. Van de Walle, R. H. 1984. Personal communication. Martin Marietta, Baltimore, MD.
21. Walker, W. 1984. The importance of Boron Soil Testing and Plant Analysis for Today’s CropProduction. Presented at U.S. Borax Boron Symposium, Rochester, Minnesota 194.
22. Watson, M. E. 1984. Boron: presented at U.S. Borax Boron Symposium, Rochester, Minnesota1984.
23. Watts, R. 1984. Personal communication. Scoular Grain, Imperial, NE.
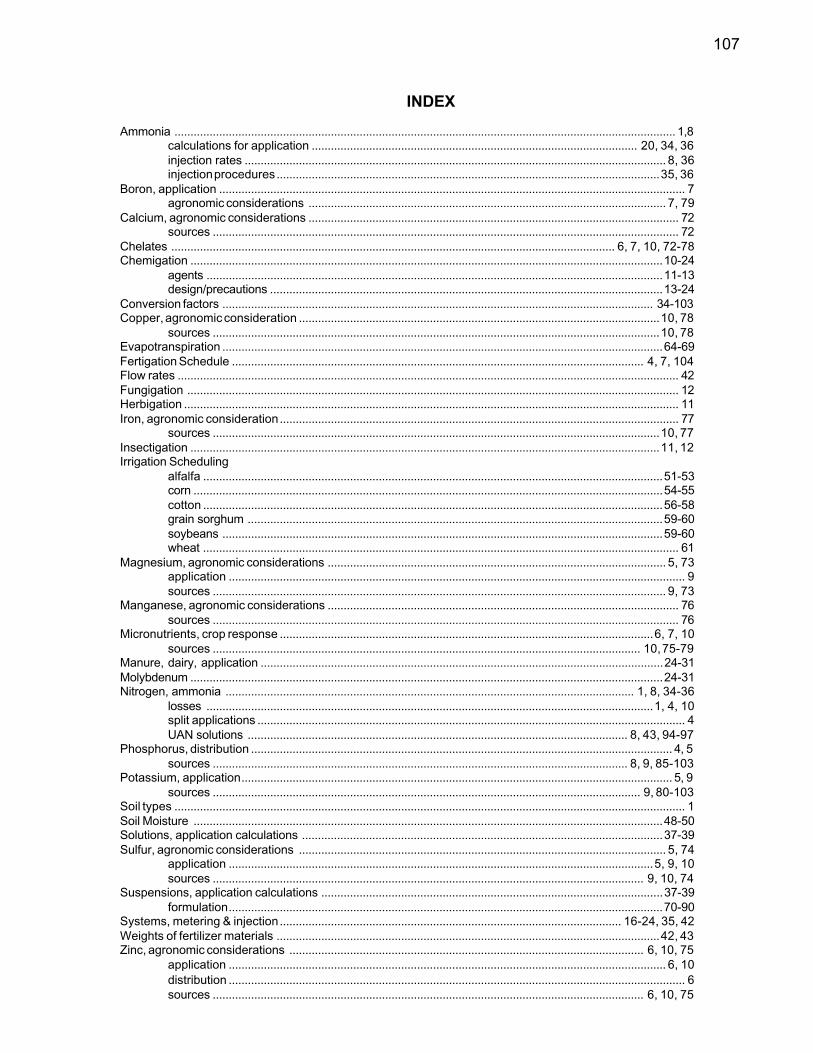
107
INDEX
Ammonia ............................................................................................................................................................. 1,8calculations for application ...................................................................................................... 20, 34, 36injection rates .................................................................................................................................... 8, 36injection procedures........................................................................................................................35, 36
Boron, application .................................................................................................................................................. 7agronomic considerations ................................................................................................................ 7, 79
Calcium, agronomic considerations .................................................................................................................... 72sources .................................................................................................................................................. 72
Chelates ........................................................................................................................................... 6, 7, 10, 72-78Chemigation ....................................................................................................................................................10-24
agents ...............................................................................................................................................11-13design/precautions ...........................................................................................................................13-24
Conversion factors ....................................................................................................................................... 34-103Copper, agronomic consideration .................................................................................................................10, 78
sources ............................................................................................................................................10, 78Evapotranspiration ..........................................................................................................................................64-69Fertigation Schedule ................................................................................................................................. 4, 7, 104Flow rates ............................................................................................................................................................. 42Fungigation .......................................................................................................................................................... 12Herbigation ........................................................................................................................................................... 11Iron, agronomic consideration............................................................................................................................. 77
sources ............................................................................................................................................10, 77Insectigation ...................................................................................................................................................11, 12Irrigation Scheduling
alfalfa ................................................................................................................................................51-53corn ...................................................................................................................................................54-55cotton ................................................................................................................................................56-58grain sorghum ..................................................................................................................................59-60soybeans ..........................................................................................................................................59-60wheat ..................................................................................................................................................... 61
Magnesium, agronomic considerations .......................................................................................................... 5, 73application ............................................................................................................................................... 9sources .............................................................................................................................................. 9, 73
Manganese, agronomic considerations .............................................................................................................. 76sources .................................................................................................................................................. 76
Micronutrients, crop response .....................................................................................................................6, 7, 10sources ...................................................................................................................................... 10, 75-79
Manure, dairy, application ..............................................................................................................................24-31Molybdenum ....................................................................................................................................................24-31Nitrogen, ammonia ................................................................................................................................ 1, 8, 34-36
losses ............................................................................................................................................1, 4, 10split applications ...................................................................................................................................... 4UAN solutions ....................................................................................................................... 8, 43, 94-97
Phosphorus, distribution .................................................................................................................................... 4, 5sources .................................................................................................................................. 8, 9, 85-103
Potassium, application....................................................................................................................................... 5, 9sources ...................................................................................................................................... 9, 80-103
Soil types ................................................................................................................................................................ 1Soil Moisture ...................................................................................................................................................48-50Solutions, application calculations .................................................................................................................37-39Sulfur, agronomic considerations ................................................................................................................... 5, 74
application .....................................................................................................................................5, 9, 10sources ....................................................................................................................................... 9, 10, 74
Suspensions, application calculations ...........................................................................................................37-39formulation........................................................................................................................................70-90
Systems, metering & injection........................................................................................................... 16-24, 35, 42Weights of fertilizer materials ........................................................................................................................42, 43Zinc, agronomic considerations ............................................................................................................... 6, 10, 75
application ......................................................................................................................................... 6, 10distribution ............................................................................................................................................... 6sources ....................................................................................................................................... 6, 10, 75
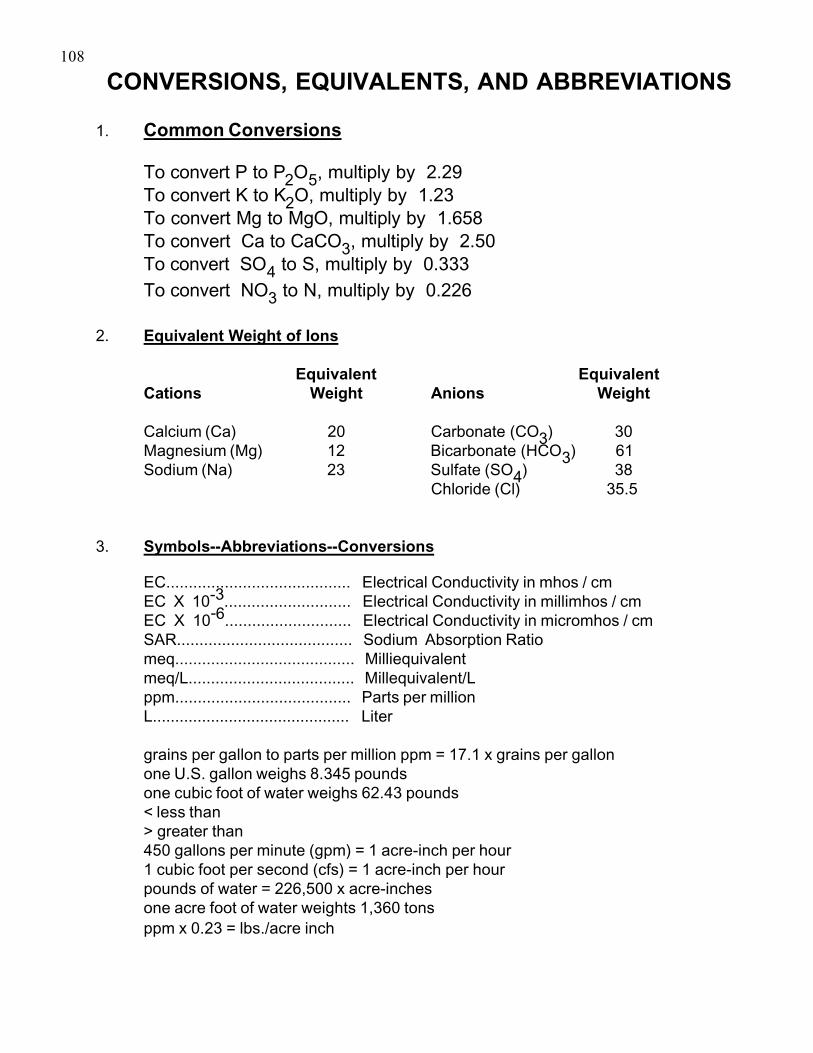
CONVERSIONS, EQUIVALENTS, AND ABBREVIATIONS
1. Common Conversions
To convert P to P2O5, multiply by 2.29To convert K to K2O, multiply by 1.23To convert Mg to MgO, multiply by 1.658To convert Ca to CaCO3, multiply by 2.50To convert SO4 to S, multiply by 0.333To convert NO3 to N, multiply by 0.226
2. Equivalent Weight of Ions
Equivalent EquivalentCations Weight Anions Weight
Calcium (Ca) 20 Carbonate (CO3) 30Magnesium (Mg) 12 Bicarbonate (HCO3) 61Sodium (Na) 23 Sulfate (SO4) 38
Chloride (Cl) 35.5
3. Symbols--Abbreviations--Conversions
EC......................................... Electrical Conductivity in mhos / cmEC X 10-3............................ Electrical Conductivity in millimhos / cmEC X 10-6............................ Electrical Conductivity in micromhos / cmSAR....................................... Sodium Absorption Ratiomeq........................................ Milliequivalentmeq/L..................................... Millequivalent/Lppm....................................... Parts per millionL............................................ Liter
grains per gallon to parts per million ppm = 17.1 x grains per gallonone U.S. gallon weighs 8.345 poundsone cubic foot of water weighs 62.43 pounds< less than> greater than450 gallons per minute (gpm) = 1 acre-inch per hour1 cubic foot per second (cfs) = 1 acre-inch per hourpounds of water = 226,500 x acre-inchesone acre foot of water weights 1,360 tonsppm x 0.23 = lbs./acre inch
108