fes 2016 stakeholder feedback document - national...
TRANSCRIPT

Stakeholder Feedback
document 2016
Future Energy Scenarios
JANUARY 2016

This publication is part of our annual scenario development process. It summarises
how we have engaged with you, what you have told us since the release of FES 2015
and our initial thoughts on the new suite of scenarios for 2016. The FES Stakeholder
Feedback document is the latest of our suite of ‘Future of Energy’ documents which
also includes: Electricity Ten Year Statement (ETYS), Gas Ten Year Statement (GTYS),
System Operability Framework (SOF), Winter Outlook Report (WOR) and Summer
Outlook Report (SOR).
I am excited to be leading the team that develops the FES. Once again we have had some
really fantastic engagement with our stakeholders, which has delivered real intelligence and
insight for us to use as we build FES 2016. There are so many uncertainties regarding the
future of energy for GB; it is your views, knowledge and insight which drive the scenarios,
allowing us to better understand these uncertainties. I would like to take this opportunity to
thank you for giving us your time and energy in this engagement.
You had a lot of good things to say about FES 2015. We continue to seek improvements in
our engagement to ensure we maintain good relationships with current stakeholders and
target new stakeholders to enhance the richness of the scenarios. We plan to do even more
of this as we move forward in 2016.
I hope you find this publication useful and look forward to sharing the outcome of our 2016
work later this year.
Marcus Stewart, Energy Policy and Supply Manager
Introduction
Welcome to the Future Energy Scenarios (FES) Stakeholder Feedback
document for 2016.

National Grid’s Electricity Transmission licence standard condition (C11) requires the
submission of our proposed future energy scenarios to Ofgem by the end of January each
year. This document represents our submission. It summarises our stakeholder
engagement, how this engagement has been, and will be, taken into account in the
development of this year’s FES, and our initial thoughts on the new suite of scenarios for
2016.
These images are from the FES 2015 conference.
What does this document represent?
Section one: Executive Summary
Section two: Why we create the Future Energy Scenarios
Section three: The role of stakeholders
Section four: Stakeholder feedback and what it means for FES 2016
Section five: Overview of FES 2016
Section six: Future improvements
Section seven: Types of organisations we engaged with in this year’s consultation
Section eight: Continuing the conversation
Contents

Consistency is critical
Overwhelmingly our stakeholders told us that they want to see consistency year on year in
the FES. This has reaffirmed our approach to FES 2015 and there will not be any big
changes to our scenarios this year. We have ensured consistency is central to our
deliberations as we begin to develop this year’s scenarios. We will be maintaining the “look
and feel” of the document and make changes only where clearly justifiable.
2020 Renewable Energy Directive target
Gone Green will not be forced to meet the 2020 Renewable Energy Directive target of 15
percent of UK energy consumption coming from renewable sources. This reflects that
although significant progress has been made towards the target, with 2020 only four years
away it is very challenging to meet. Further analysis will be undertaken through the FES
2016 cycle and we will identify what needs to happen to reach the 15 percent target.
We have enhanced our stakeholder engagement activities
We have broadened our engagement activities and increased the number of stakeholders
that we engaged with.
We introduced a series of webinars this year, made our workshops more interactive, held an
extensive programme of focused bilateral sessions and enhanced our online presence. In
doing so we increased the number of organisations we engaged with from 233 to 362.
Introducing a new structured approach
During our FES 2015 consultation 45 percent of our stakeholders told us they want us to be
clearer on how the FES assumptions and inputs are created and used. For 2016 we are
introducing a more structured approach to grouping our inputs and assumptions. This will
ensure consistency across our analysis as well as allowing stakeholders to better
understand how our scenarios are developed.
More of our insight
Our stakeholders told us that they want to hear more of our insight within the FES. For
2016, we will develop and improve our signposting to contain more insight and statements
about what developments would be required to realise the different scenarios. We will also
include ‘Spotlights’ to allow us to explore key topics in more detail and consider
developments which are not yet at a maturity to be included as an input into our analysis.
Executive Summary
Sectio
no
ne
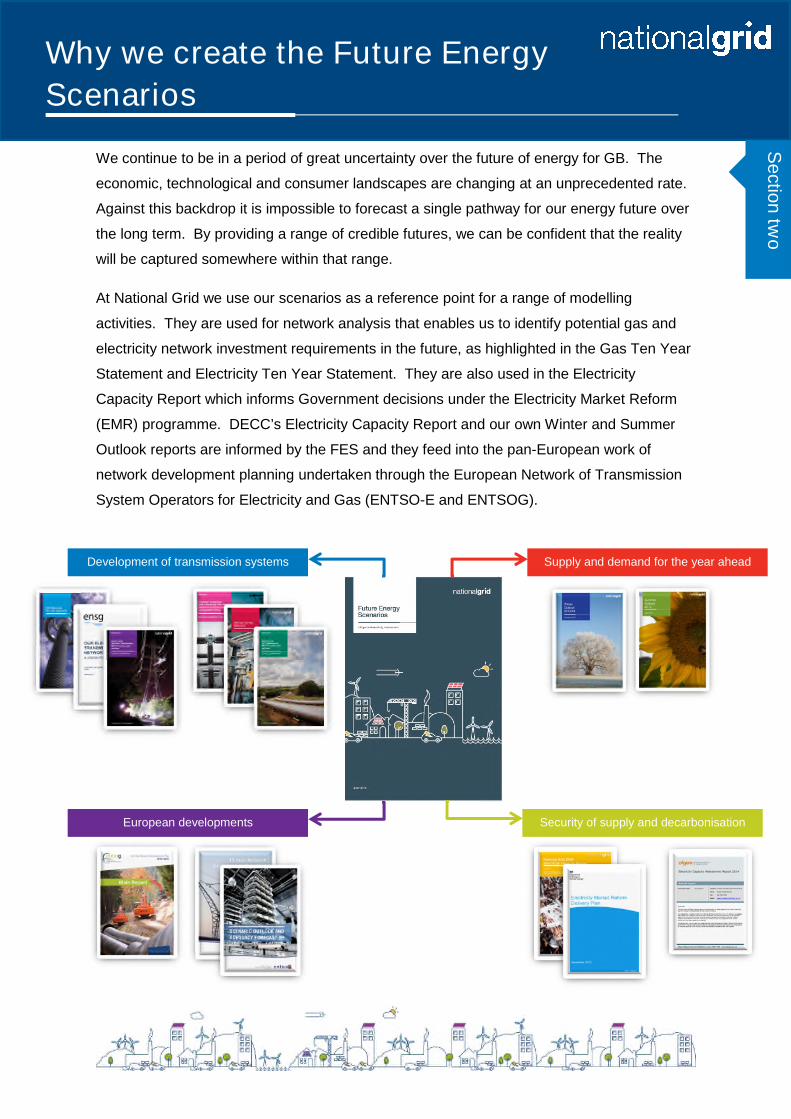
We continue to be in a period of great uncertainty over the future of energy for GB. The
economic, technological and consumer landscapes are changing at an unprecedented rate.
Against this backdrop it is impossible to forecast a single pathway for our energy future over
the long term. By providing a range of credible futures, we can be confident that the reality
will be captured somewhere within that range.
At National Grid we use our scenarios as a reference point for a range of modelling
activities. They are used for network analysis that enables us to identify potential gas and
electricity network investment requirements in the future, as highlighted in the Gas Ten Year
Statement and Electricity Ten Year Statement. They are also used in the Electricity
Capacity Report which informs Government decisions under the Electricity Market Reform
(EMR) programme. DECC’s Electricity Capacity Report and our own Winter and Summer
Outlook reports are informed by the FES and they feed into the pan-European work of
network development planning undertaken through the European Network of Transmission
System Operators for Electricity and Gas (ENTSO-E and ENTSOG).
Supply and demand for the year aheadDevelopment of transmission systems
Security of supply and decarbonisationEuropean developments
Why we create the Future Energy
Scenarios
Sectio
ntw
o

As we strive to deliver value to all of our stakeholders, it is important that we understand how
our stakeholders use the FES. We explored this question across our engagement activities
this year. Our stakeholders told us that they use the FES in a variety of ways. Over ten
percent of our stakeholders told us that they use it as a reference document throughout the
year, whilst 15 percent use it as a benchmarking tool.
PlanningInformation source for market analysis
Horizon scanning using case studies
Compare models and analysisProvides an overall market view
Future pathways for technology innovations
“Sustainability First makes use of the FES scenarios as a
key reference document, for example, to underpin the
modelling for our GB Electricity Demand project. We have a
cross-sector interest, but are particularly interested in
household load projections. We would find more robust
analysis helpful on some aspects of future household load
and its innate flexibility, for example, uptake of household
electric heat, including new generation storage heaters.
Also, likely uptake rates and impact of LED lighting on peak
load are very important.”
Judith Ward, Sustainability First
2.1 How do our stakeholders use the FES?
Sectio
ntw
o
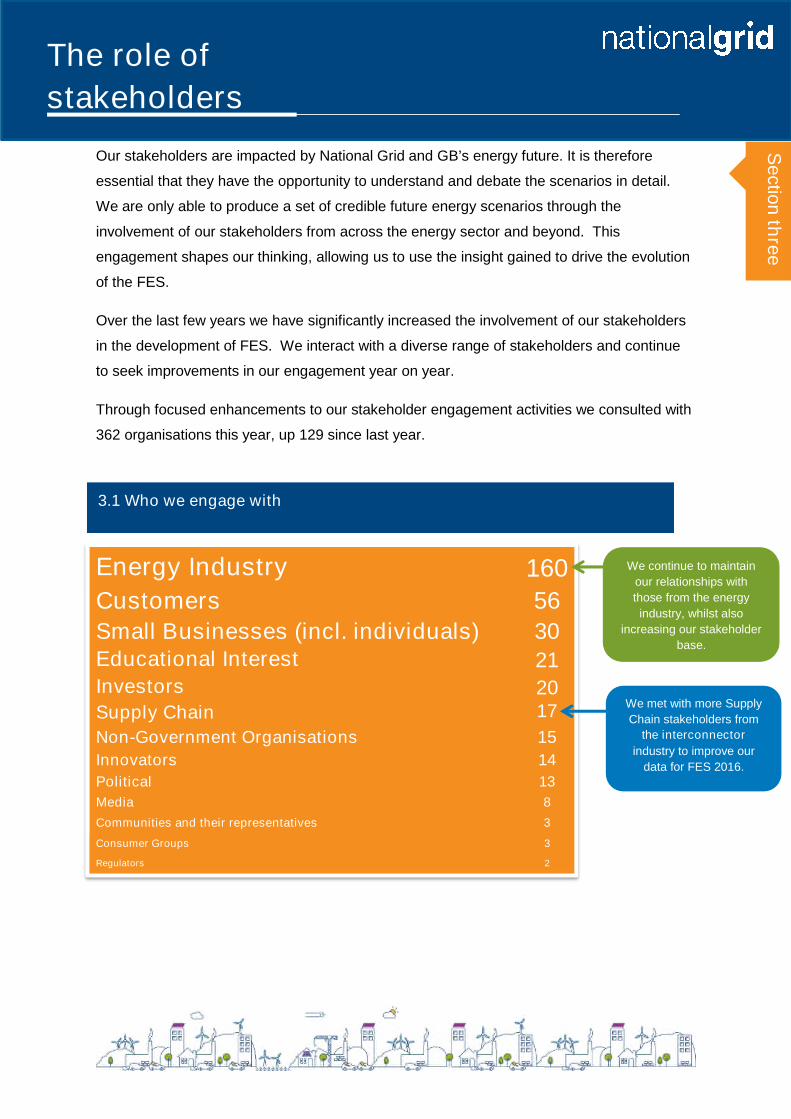
We continue to maintain
our relationships with
those from the energy
industry, whilst also
increasing our stakeholder
base.
Our stakeholders are impacted by National Grid and GB’s energy future. It is therefore
essential that they have the opportunity to understand and debate the scenarios in detail.
We are only able to produce a set of credible future energy scenarios through the
involvement of our stakeholders from across the energy sector and beyond. This
engagement shapes our thinking, allowing us to use the insight gained to drive the evolution
of the FES.
Over the last few years we have significantly increased the involvement of our stakeholders
in the development of FES. We interact with a diverse range of stakeholders and continue
to seek improvements in our engagement year on year.
Through focused enhancements to our stakeholder engagement activities we consulted with
362 organisations this year, up 129 since last year.
Energy Industry 160
Customers 56
Small Businesses (incl. individuals) 30Educational Interest 21Investors 20Supply Chain 17
Non-Government Organisations 15
Innovators 14
Political 13
Media 8
Communities and their representatives 3
Consumer Groups 3
Regulators 2
We met with more Supply
Chain stakeholders from
the interconnector
industry to improve our
data for FES 2016.
The role of
stakeholders
Sectio
nth
ree
3.1 Who we engage with

Each year we run an engagement process where we consult with our stakeholders, analyse
feedback and then create and launch the next round of scenarios. We are always looking to
improve our engagement and enhance the accessibility of FES.
We run a whole suite of engagement activities to allow our stakeholders to get involved in a
way that suits them. As well as the FES launch event and our extensive programme of
bilateral engagement, this year we enhanced our engagement activities by:
Introducing webinars.
Creating a dedicated FES website and increasing our online presence.
Tailoring the content of our workshops and making them more interactive.
Publishing the ‘FES in 5’ to complement the full FES document.
3.2 How we engage
Sectio
nth
ree

Launch event 201 stakeholder organisations
We trialled a panel approach to hear the voice of various experts.
We held a bigger exposition to allow more engagement with our team.
We were oversubscribed so this year we have chosen a larger venue.
When asked “how valuable was the conference to you”, our average score was 7.8/10 (up
from 7.4 in 2014).
Publications
‘FES in 5’ was a new publication introduced in 2015 aimed at stakeholders who use
the key messages from our analysis.
This year we will be printing more copies of our FES document as our stakeholders
have told us they find a hard copy useful.
This is a screen shot of our ‘FES in 5’ post on LinkedIn which includes the engagement
statistics:
“It is a good opportunity to get an overviewfrom specialists on where they think the‘envelope’ of possibilities is for energy
development and transmission.”
“I would like to seemore interaction withthe audience in the
auditorium e.g. Q&A”
“I find the A5 [FES] book really usefulas a reference document instead of
having to look online”
“The printedoutput [is]fantastic”
Sectio
nth
ree

Workshops 116 stakeholder organisations
We expanded our locations, holding them in Edinburgh, Nantwich, Warwick and
London as well as holding a dedicated 2050 workshop.
We tailored the content of our workshops to the subjects stakeholders told us they
wanted to discuss.
We made them more interactive, providing the opportunity to visit six focused
stations exploring the structure and content of the FES.
This year we will look to hold workshops in Cardiff and Brussels based on feedback.
When asked “how valuable was the event to you”, our average score was 7.4/10. This is our
benchmark and we will aim for a higher score for FES 2016.
Webinars 118 stakeholder organisations
We trialled a series of webinars to explore if our stakeholders would find this a useful
way to engage with us. We hosted three webinars covering topics of electricity
supply, gas supply and electricity demand.
We were clear on the specific webinar focus to allow the audience to be tailored.
This allowed us to share information and gather input into specific FES topics (e.g.
air conditioning).
We asked the webinar attendees to provide us feedback online. We have gathered
qualitative data both on FES specific topics and on how the webinars were run,
which we will take into account for FES 2016.
“It was useful to go round the sixdifferent ‘stations’ to have a chance to
feedback on those areas of the scenarioformulation. The round table discussions
were also very useful.”
“Very interesting range of peopleand opinions. Interesting to
understand how National Gridoperates. Really enjoyed talking
'energy modelling' with people whounderstood these things!”
Feedback helpful for our next round ofwebinars: “I recommend USB
microphones - happy to share bestpractice in what we have trialled for
our webinars.”
“[It was] useful to stopand hear commentary
and questions.”
Sectio
nth
ree
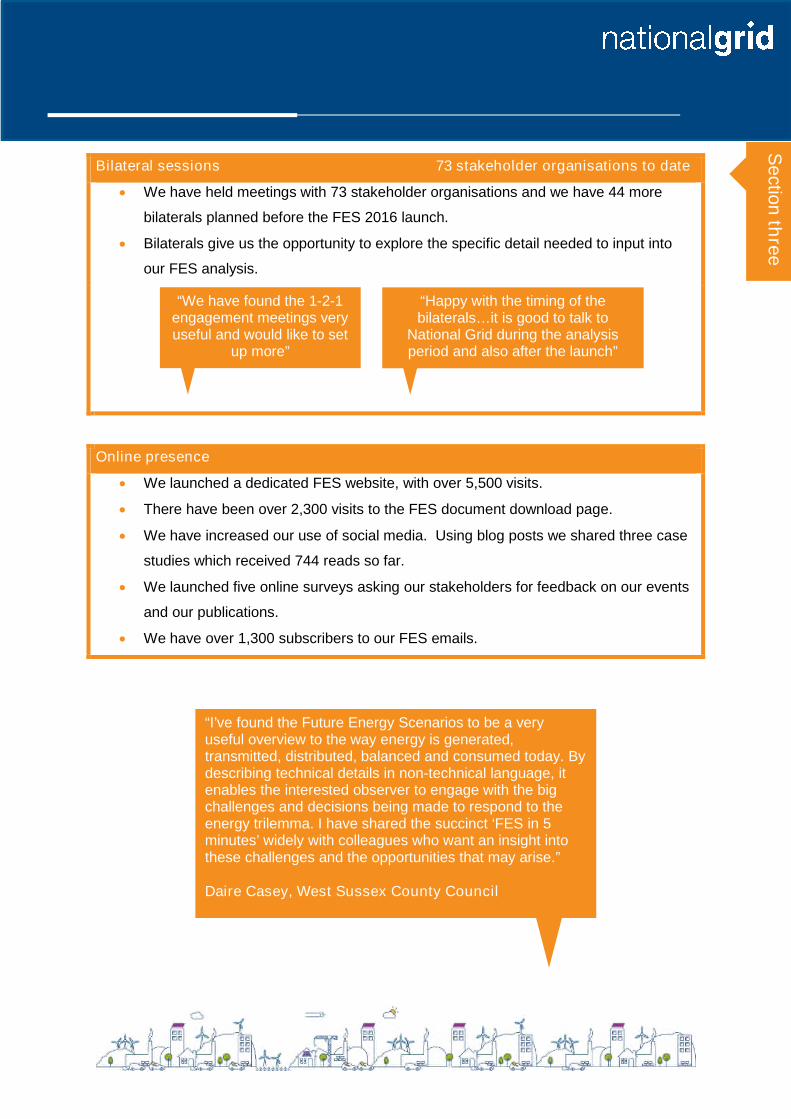
Bilateral sessions 73 stakeholder organisations to date
We have held meetings with 73 stakeholder organisations and we have 44 more
bilaterals planned before the FES 2016 launch.
Bilaterals give us the opportunity to explore the specific detail needed to input into
our FES analysis.
Online presence
We launched a dedicated FES website, with over 5,500 visits.
There have been over 2,300 visits to the FES document download page.
We have increased our use of social media. Using blog posts we shared three case
studies which received 744 reads so far.
We launched five online surveys asking our stakeholders for feedback on our events
and our publications.
We have over 1,300 subscribers to our FES emails.
“We have found the 1-2-1engagement meetings veryuseful and would like to set
up more”
“Happy with the timing of thebilaterals…it is good to talk to
National Grid during the analysisperiod and also after the launch”
“I’ve found the Future Energy Scenarios to be a veryuseful overview to the way energy is generated,transmitted, distributed, balanced and consumed today. Bydescribing technical details in non-technical language, itenables the interested observer to engage with the bigchallenges and decisions being made to respond to theenergy trilemma. I have shared the succinct ‘FES in 5minutes’ widely with colleagues who want an insight intothese challenges and the opportunities that may arise.”
Daire Casey, West Sussex County Council
Sectio
nth
ree

The feedback we receive from our stakeholders drives the development of our FES. In
considering this feedback we explore each comment and consider it against the themes we
are hearing from across our stakeholder engagement. There may be outliers that go against
the majority of what our stakeholders are saying or feedback that cannot be allocated to the
framework by which we develop our scenarios. In this section we will explore the feedback
and demonstrate what it means for FES 2016. We split the feedback into two categories:
structural and content specific.
You said…. For FES 2016 we will….
You want consistency
between iterations of the
FES.
We will maintain consistency with FES
2015. We will maintain the look and feel
of the FES and throughout development
we will keep the desire for consistency in
mind, making changes where
demonstrably required.
You like the security of
supply rules and the use of
four scenarios in a 2X2
matrix.
We will continue using the security of
supply rules and the four scenarios in a
2X2 matrix with the same axes titles.
The Levy Control Framework
(LCF) should not be a fixed
rule as it can change and is
short term.
We will make the LCF an assumption.
“It’s important to haveconsistency and track how
the scenarios havechanged overtime.”
“Isn’t the LCF just an input?”
Stakeholder feedback and what it
means for FES 2016
Sectio
nfo
ur
4.1 Structural feedback and what it means for FES 2016

You like how we used the
PESTE structure to give an
overview of the four
scenarios, but found our
secondary assumptions
unclear.
We will use a more structured approach
to FES development (the Scenario
Framework) and PEST* structure to
group and display our assumptions.
You want us to be clearer on
our use of terminology
(‘power’, ‘energy’,
‘electricity’).
We will ensure clarity and consistency in
our definitions.
You would like to hear more
of our insight in the FES.
We will develop our signposting to
contain more insight and statements
about what developments would be
required for key elements within a
scenario to be realised. We will also
include ‘Spotlights’ to allow us to
explore and offer our insight on key
topics.
You like the names ‘Gone
Green’ and ‘Slow
Progression’, but you would
like ‘Consumer Power’ and
‘No Progression’ changed.
We balanced this up against the desire
for consistency and will not change any
of the scenario names for FES 2016.
Instead we will include greater narrative
to support the names.
“You should tieup the
connectionbetween
assumptions andPESTE.”
*This year we are using the shortened PEST model as we believe environmental factors feature in all the other elements of PEST.
“[It is] interesting toknow more about
National Grid's ownthoughts on questions.”
“Which power? Electricityor gas, the word power is
confusing.”
“If the principle of thescenario fundamentallychanges then changethe name. If changesto the scenarios areevolutions then don’tchange the name.”
75% of stakeholders want to keep the names ‘Gone Green’ and 57%
want to keep ‘Slow Progression’;
59% of stakeholders said to change ‘Consumer Power’; and 66% to
change ‘No Progression’.
Sectio
nfo
ur

Theme: Technological.
Assumption: Deployment Rateof Smart Meters. Set at High in Gone Green;
Medium in Consumer Powerand Slow Progression; Low inNo Progression.
Model lever: The specificnumber of smart meters deployedeach year in each scenario.
*Th
isye
ar
we
are
usi
ng
the
sho
rte
ned
PE
ST
mo
delas
we
belie
vee
nvi
ron
me
nt
fea
ture
sin
all
the
oth
er
ele
me
nts
ofP
ES
T.
We
will
inclu
de
na
rra
tive
with
inth
eF
ES
tosu
ppo
rtth
is.
The Scenario Framework introduces a more structured approach, providing a single
reference document to group all the inputs and assumptions that we use to build our
scenarios.
We believe this approach will ensure consistency across all of our analysis. It allows us to
identify and group all the inputs into understandable and clear themes. Stakeholder
feedback is central to the discussion of each element of the framework. We hope that as well
as driving more consistency in our approach it will meet our stakeholders’ desire to
understand better how we develop our scenarios.
P E
ST
Assumptions
Fixed rules
Scenario world
Model leversThe numbers used in the analysis
Set at high/medium/low
for each scenario
The matrix,
scenario
names and
fixed rules Themes
4.2 The Scenario Framework
Scenario FrameworkExample
Central to the Scenario Framework is the scenario world. This effectively captures the core
elements which are fixed in each of our scenarios: the matrix, scenario names and fixed rules.
The next layer introduces the scenario themes: Political, Economic, Social and Technological
(PEST*). The themes were chosen as our stakeholders told us that they like and understand
the use of PEST.
Sitting beneath each theme are all the assumptions which feed into the scenarios. Each
assumption will be set at High, Medium or Low for each of the four scenarios.
The final layer of the framework is the specific model levers which are input into the analysis in
line with the level set for each assumption.
Sectio
nfo
ur
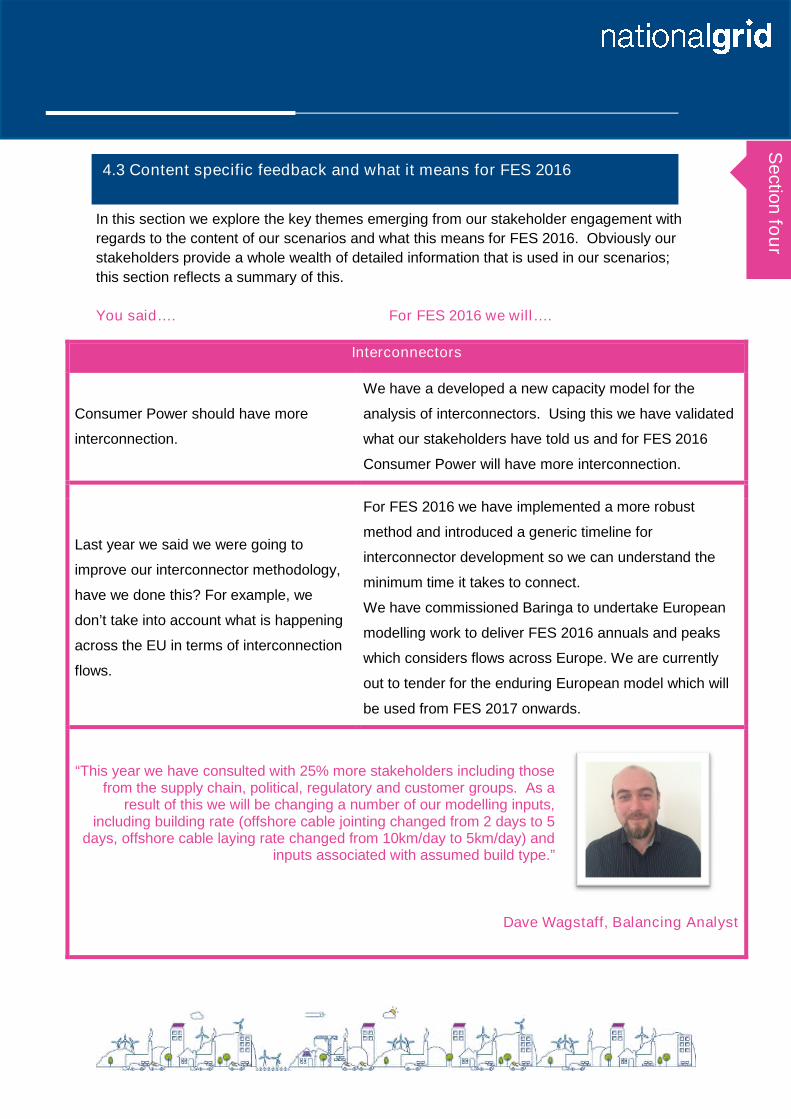
In this section we explore the key themes emerging from our stakeholder engagement with
regards to the content of our scenarios and what this means for FES 2016. Obviously our
stakeholders provide a whole wealth of detailed information that is used in our scenarios;
this section reflects a summary of this.
You said…. For FES 2016 we will….
Interconnectors
Consumer Power should have more
interconnection.
We have a developed a new capacity model for the
analysis of interconnectors. Using this we have validated
what our stakeholders have told us and for FES 2016
Consumer Power will have more interconnection.
Last year we said we were going to
improve our interconnector methodology,
have we done this? For example, we
don’t take into account what is happening
across the EU in terms of interconnection
flows.
For FES 2016 we have implemented a more robust
method and introduced a generic timeline for
interconnector development so we can understand the
minimum time it takes to connect.
We have commissioned Baringa to undertake European
modelling work to deliver FES 2016 annuals and peaks
which considers flows across Europe. We are currently
out to tender for the enduring European model which will
be used from FES 2017 onwards.
“This year we have consulted with 25% more stakeholders including thosefrom the supply chain, political, regulatory and customer groups. As a
result of this we will be changing a number of our modelling inputs,including building rate (offshore cable jointing changed from 2 days to 5
days, offshore cable laying rate changed from 10km/day to 5km/day) andinputs associated with assumed build type.”
Dave Wagstaff, Balancing Analyst
4.3 Content specific feedback and what it means for FES 2016
Sectio
nfo
ur

Electricity Supply
It would be really useful to understand
how load factors will change over the
study period.
We will consider how we might be able to show load factors
within our scenarios and aim to include this in FES 2016.
We should be more aggressive in how
deployment of new technologies is
reflected, e.g. marine.
We base our technology projections after engaging with a
variety of stakeholders and include those technologies which
demonstrate clear evidence of deployment. Within FES 2016
we will include a number of ‘Spotlights’ for technologies
where there is currently insufficient data to include as a direct
input to our analysis.
We should take into consideration the
increasing influence of small-scale
generation on the electricity supply mix.
We should consider a fully decentralised
scenario.
FES 2015 saw Consumer Power reach 40 percent small-scale
decentralised generation by 2035, doubling from today’s level.
The Government has signed multiple large-scale generation
contracts going 15-35 years out; as such none of our
scenarios will be fully decentralised. We are working on
improvements in our understanding of the volume and type of
small-scale generation and the interactions with large-scale
generation. We aim to include more on this in FES 2016.
“We will be using the results of our webinar in order to validate our 2016analysis. Stakeholders mostly agreed with our projected range for onshore
and offshore wind. Most stakeholders felt that our solar projections don’treflect current market conditions so we will revisit our solar assumptions.
Most stakeholders felt coal would close earlier than in our 2015 scenarios –we will also revisit our plant closure profile.”
Janet Coley, Electricity Supply Analyst
Sectio
nfo
ur
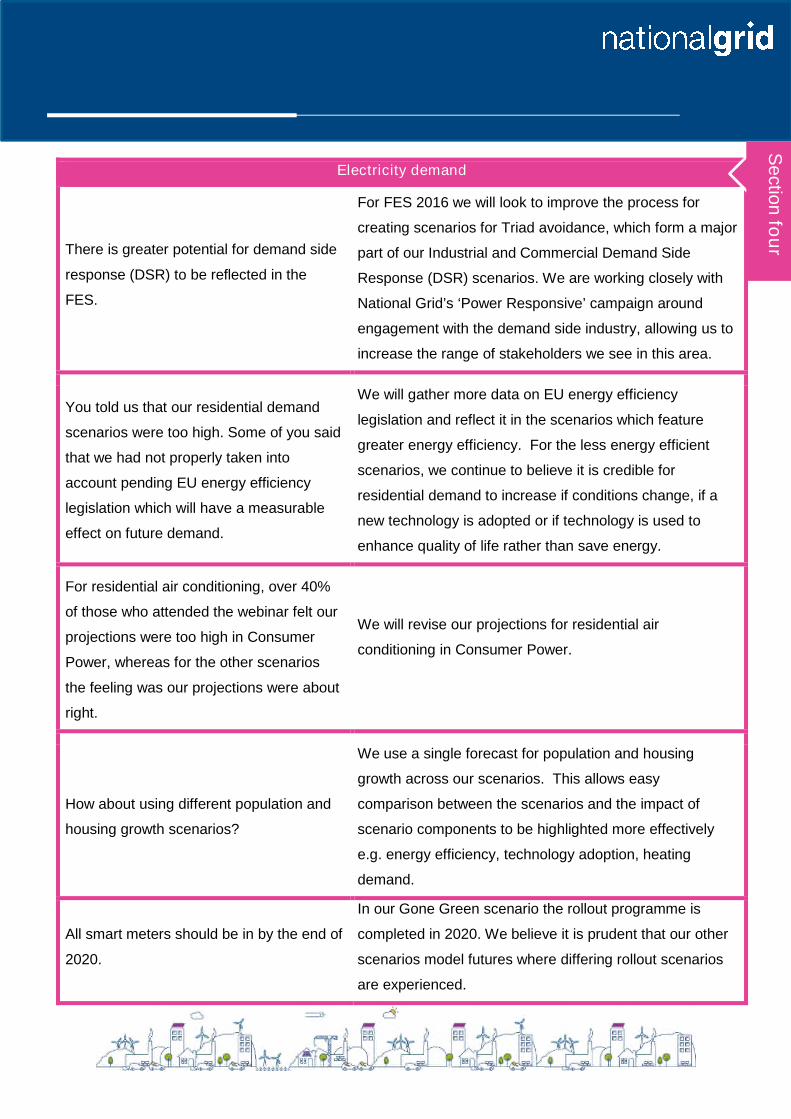
Electricity demand
There is greater potential for demand side
response (DSR) to be reflected in the
FES.
For FES 2016 we will look to improve the process for
creating scenarios for Triad avoidance, which form a major
part of our Industrial and Commercial Demand Side
Response (DSR) scenarios. We are working closely with
National Grid’s ‘Power Responsive’ campaign around
engagement with the demand side industry, allowing us to
increase the range of stakeholders we see in this area.
You told us that our residential demand
scenarios were too high. Some of you said
that we had not properly taken into
account pending EU energy efficiency
legislation which will have a measurable
effect on future demand.
We will gather more data on EU energy efficiency
legislation and reflect it in the scenarios which feature
greater energy efficiency. For the less energy efficient
scenarios, we continue to believe it is credible for
residential demand to increase if conditions change, if a
new technology is adopted or if technology is used to
enhance quality of life rather than save energy.
For residential air conditioning, over 40%
of those who attended the webinar felt our
projections were too high in Consumer
Power, whereas for the other scenarios
the feeling was our projections were about
right.
We will revise our projections for residential air
conditioning in Consumer Power.
How about using different population and
housing growth scenarios?
We use a single forecast for population and housing
growth across our scenarios. This allows easy
comparison between the scenarios and the impact of
scenario components to be highlighted more effectively
e.g. energy efficiency, technology adoption, heating
demand.
All smart meters should be in by the end of
2020.
In our Gone Green scenario the rollout programme is
completed in 2020. We believe it is prudent that our other
scenarios model futures where differing rollout scenarios
are experienced.
Sectio
nfo
ur

Gas demand
The Natural Gas Vehicle (NGV) market is
heading towards pure gas vehicles rather than
hybrids.
For FES 2016, we will review our NGV analysis to
focus on pure gas vehicles.
You would like to see more depth to our district
heat analysis.
We have a district heat model, created in
collaboration with Buro Happold, that explores
opportunities for district heat giving a richer picture of
deployment in the UK. For FES 2016, we will advance
this project to allow an extra layer of depth to be
included in our analysis.
You believe that the 20 percent reduction of gas
demand per house identified in Gone Green and
Slow Progression through a Home Energy
Management System (HEMS) is too ambitious.
We will review the gas demand reduction associated
with a HEMS for FES 2016. We will continue to
gather more data on new technologies to enhance the
inputs to our analysis.
You are surprised that low carbon heating
uptake is not more prevalent in Slow
Progression; you would expect it to be closer to
Consumer Power.
We will re-evaluate the assumptions in our heating
technology model.
“Our stakeholders told us they wanted to see more detail in our district heatinganalysis in the FES. This year we started an innovation project working with Buro
Happold to investigate suitable locations for district heating in Great Britain. Havingthis information will give us a better view on gas and electricity demand in our
scenarios. Recently we shared our findings with the Energy NetworksAssociation's Gas Futures group to get their thoughts.”
Iain Shepherd, Energy Demand Analyst
Sectio
nfo
ur

Gas supply
Locally produced shale gas should be
greener in terms of overall lifecycle carbon
emissions than liquefying gas in the Middle
East, shipping it several thousand miles to
the UK and re-gasifying it.
We do not reflect lifecycle carbon emissions as an
input to our analysis as current carbon accounting
does not include emissions incurred from activities
outside the UK. For FES 2016, we will look to explore
this further in a ‘Spotlight’.
It is unrealistic to say that no infrastructure
will close; by 2035 some of the facilities will
be quite old.
We acknowledge this can be seen as a limitation in
our analysis, however we do not assume a facility will
close when the owner of the facility has not made
such a decision public. However, for FES 2016 we will
consider whether an objective means of reducing
capacity, possibly based on age of facility, can be
developed.
We should consider alternative sources of
gas supply such as bio-synthetic natural gas
(SNG) or hydrogen from electricity to gas
schemes.
We will investigate this further in a ‘Spotlight’ for FES
2016. We already consider biomethane, principally
from anaerobic digestion, but have not so far
considered bio-SNG, gas from waste or hydrogen
from electricity to gas schemes. These are all
potential sources that are more likely to connect to the
distribution networks than the transmission network
and we are in dialogue with the gas distribution
networks to understand the maturity of these
technologies.
The balance between LNG and continental
gas is ‘unknowable’ and we should not
demonstrate any sort of split as this would
imply an unwarranted level of confidence.
Market intelligence at the moment, both from our
stakeholders and commercial sources, is that LNG
availability is likely to be high for at least the next 5
years. There may be some scope for increasing the
LNG minimum level slightly and reducing, but not
removing, the ‘generic import’ category. We will
continue to engage with our stakeholders on this and
review for FES 2016.
Sectio
nfo
ur

Electricity storage
We should include electricity storage in the
scenarios – Gone Green and Consumer
Power provide the best environments for
electricity storage to prosper.
We have engaged with developers and the value
proposition has improved for storage, therefore, we will
include electricity storage penetration in the FES 2016
analysis – focusing growth in Gone Green and Consumer
Power. This will cover transmission, distribution and
behind the meter electricity storage.
2050
We should include further analysis on
aviation and shipping as they will dominate
emissions in 2050.
For FES 2016 we will enhance our 2050 analysis regarding
shipping and aviation emissions.
There should be more than one scenario
meeting the 2050 carbon target.
Whilst Gone Green is the only scenario to meet the carbon
target, for FES 2016 we will share sensitivities that
demonstrate there are other ways of meeting them.
Simon Durk, Gas Supply Manager
“Engaging with stakeholders allows us to check our modelling against otherindustry players, experts in their field, and confirm that our assumptions are
reasonable. Stakeholders have given us useful pointers to new sources ofinformation. We believe that by engaging with stakeholders we produce gas
flow scenarios that are more credible than would otherwise be the case.”
Sectio
nfo
ur
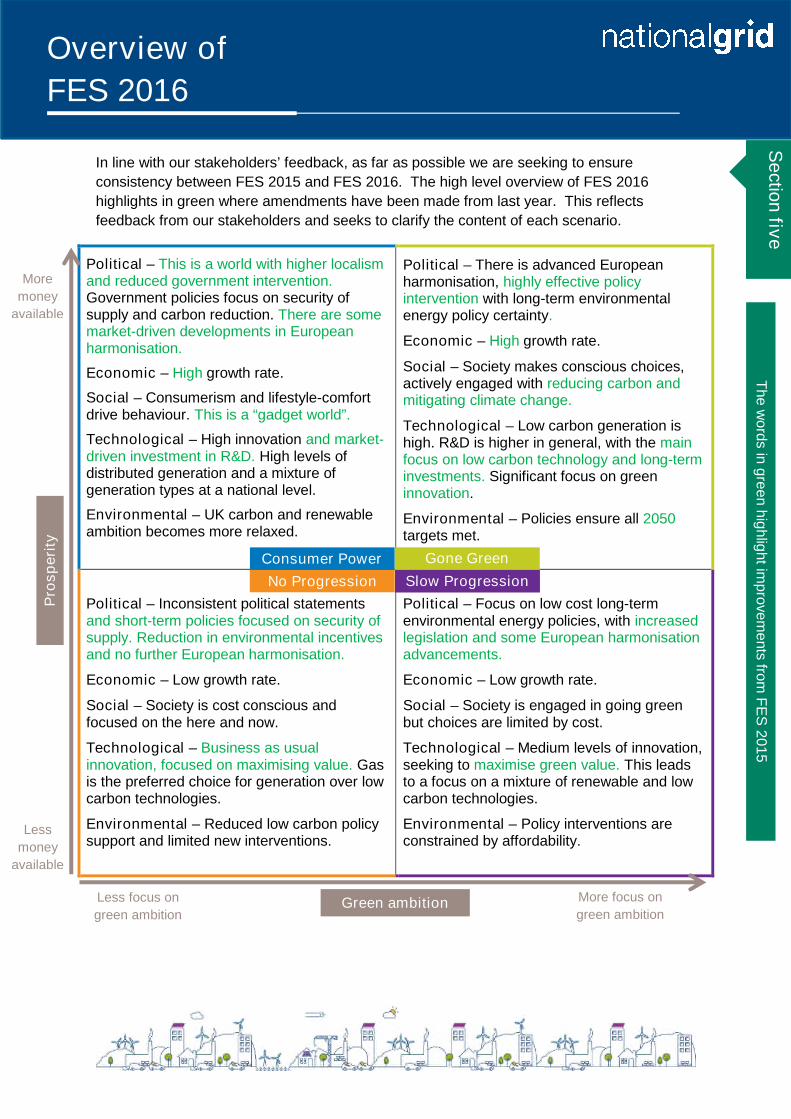
In line with our stakeholders’ feedback, as far as possible we are seeking to ensure
consistency between FES 2015 and FES 2016. The high level overview of FES 2016
highlights in green where amendments have been made from last year. This reflects
feedback from our stakeholders and seeks to clarify the content of each scenario.
Political – This is a world with higher localismand reduced government intervention.Government policies focus on security ofsupply and carbon reduction. There are somemarket-driven developments in Europeanharmonisation.
Economic – High growth rate.
Social – Consumerism and lifestyle-comfortdrive behaviour. This is a “gadget world”.
Technological – High innovation and market-driven investment in R&D. High levels ofdistributed generation and a mixture ofgeneration types at a national level.
Environmental – UK carbon and renewableambition becomes more relaxed.
Political – There is advanced Europeanharmonisation, highly effective policyintervention with long-term environmentalenergy policy certainty.
Economic – High growth rate.
Social – Society makes conscious choices,actively engaged with reducing carbon andmitigating climate change.
Technological – Low carbon generation ishigh. R&D is higher in general, with the mainfocus on low carbon technology and long-terminvestments. Significant focus on greeninnovation.
Environmental – Policies ensure all 2050targets met.
Political – Inconsistent political statementsand short-term policies focused on security ofsupply. Reduction in environmental incentivesand no further European harmonisation.
Economic – Low growth rate.
Social – Society is cost conscious andfocused on the here and now.
Technological – Business as usualinnovation, focused on maximising value. Gasis the preferred choice for generation over lowcarbon technologies.
Environmental – Reduced low carbon policysupport and limited new interventions.
Political – Focus on low cost long-termenvironmental energy policies, with increasedlegislation and some European harmonisationadvancements.
Economic – Low growth rate.
Social – Society is engaged in going greenbut choices are limited by cost.
Technological – Medium levels of innovation,seeking to maximise green value. This leadsto a focus on a mixture of renewable and lowcarbon technologies.
Environmental – Policy interventions areconstrained by affordability.
Gone Green
Slow ProgressionNo Progression
Consumer Power
Less
money
available
More
money
available
Less focus on
green ambition
More focus on
green ambitionGreen ambition
Pro
sp
eri
ty
The
word
sin
gre
en
hig
hlig
htim
pro
vem
ents
from
FE
S2015
Sectio
nfiv
e
Overview of
FES 2016

5.1 What are the key changes?
We have increased the economic growth rate in Gone Green and Consumer Power in
line with intelligence we have gathered. This was also validated by feedback from our
stakeholders.
We have highlighted the approach and drivers of innovation across the scenarios.
There is lower policy intervention in the scenarios which have less focus on green
ambition.
We have explicitly identified the level of expected European harmonisation across the
scenarios as our stakeholders felt this was an important aspect.
Gone Green will continue to meet the 2050 carbon reduction target. However, it will
not be forced to meet the 2020 Renewable Energy Directive target of 15 percent of UK
energy coming from renewable sources. This reflects that although significant
progress has been made towards the target, with 2020 only four years away it is very
challenging to meet. This is consistent with feedback from our stakeholders which
questioned the credibility of Gone Green meeting this target and is reflected in the
summary of the Gone Green scenario. Further analysis will be undertaken through the
FES 2016 cycle and we will identify what needs to happen to reach the 15 percent
target.
Comm
“It’s important to haveconsistency and track how thescenarios have changed over
time.”
“Scenarios are too GBfocused and not international.”
“A high growth economic caseis needed.”
Sectio
nfiv
e
5.1 What are the key changes in the FES 2016 overview matrix?
Comments from stakeholders at the autumn workshops:
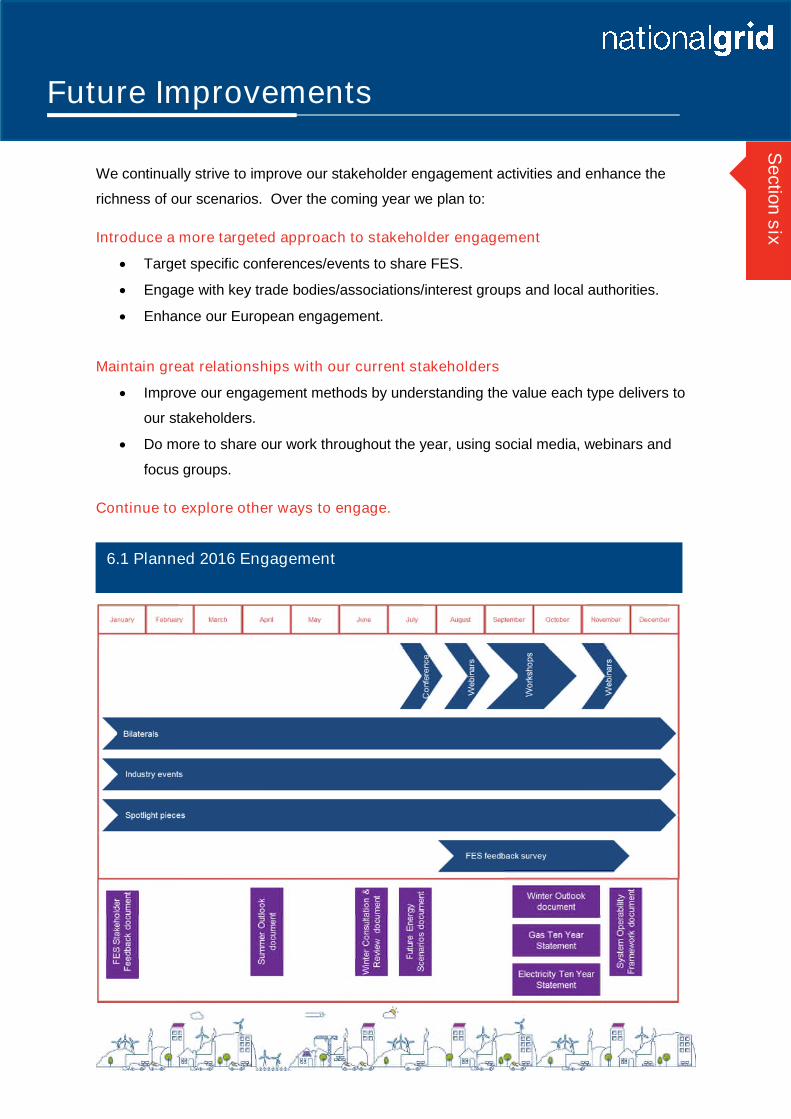
We continually strive to improve our stakeholder engagement activities and enhance the
richness of our scenarios. Over the coming year we plan to:
Introduce a more targeted approach to stakeholder engagement
Target specific conferences/events to share FES.
Engage with key trade bodies/associations/interest groups and local authorities.
Enhance our European engagement.
Maintain great relationships with our current stakeholders
Improve our engagement methods by understanding the value each type delivers to
our stakeholders.
Do more to share our work throughout the year, using social media, webinars and
focus groups.
Continue to explore other ways to engage.
Sectio
nsix
Future Improvements
6.1 Planned 2016 Engagement
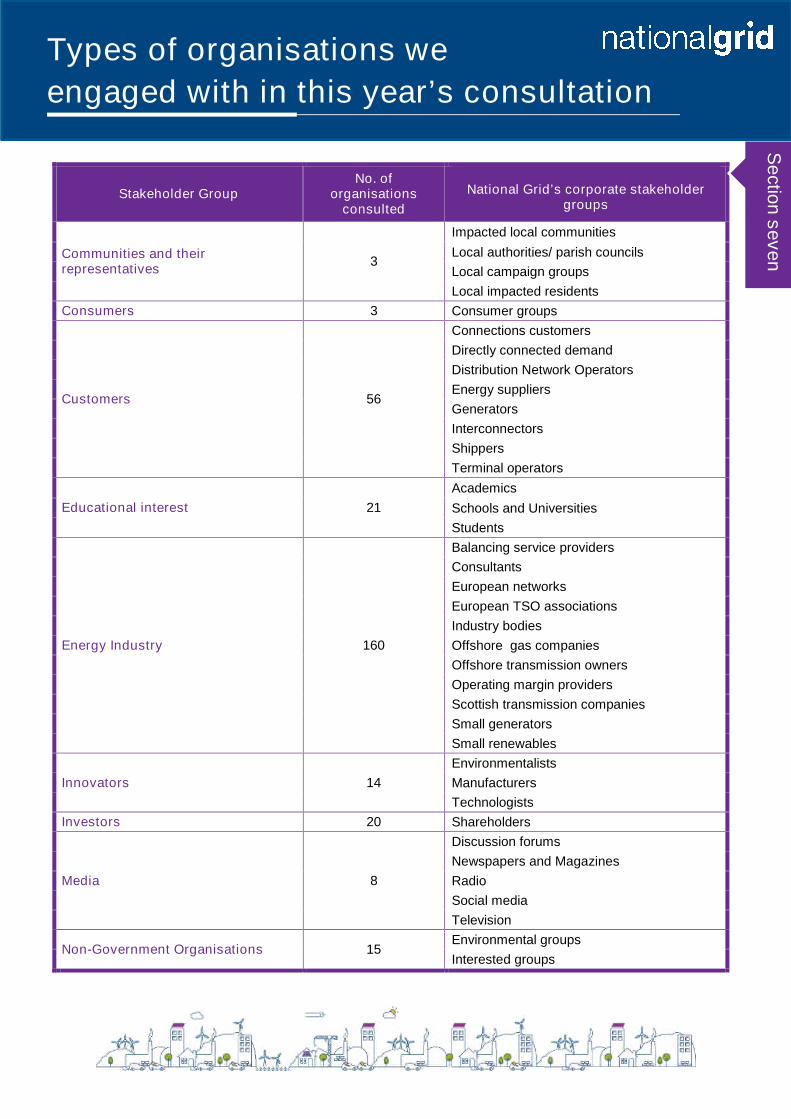
Stakeholder GroupNo. of
organisationsconsulted
National Grid’s corporate stakeholdergroups
Communities and theirrepresentatives
3
Impacted local communities
Local authorities/ parish councils
Local campaign groups
Local impacted residents
Consumers 3 Consumer groups
Customers 56
Connections customers
Directly connected demand
Distribution Network Operators
Energy suppliers
Generators
Interconnectors
Shippers
Terminal operators
Educational interest 21
Academics
Schools and Universities
Students
Energy Industry 160
Balancing service providers
Consultants
European networks
European TSO associations
Industry bodies
Offshore gas companies
Offshore transmission owners
Operating margin providers
Scottish transmission companies
Small generators
Small renewables
Innovators 14
Environmentalists
Manufacturers
Technologists
Investors 20 Shareholders
Media 8
Discussion forums
Newspapers and Magazines
Radio
Social media
Television
Non-Government Organisations 15Environmental groups
Interested groups
Sectio
nseven
Types of organisations we
engaged with in this year’s consultation

Stakeholder GroupNo. of
organisationsconsulted
National Grid’s corporate stakeholdergroups
Political 13
Devolved administrations
European administration
Members of European Parliament
Members of Parliament
UK government
UK government bodies
Regulators 2European regulatory bodies
UK regulatory bodies
Small Businesses 30Individuals
Local community businesses
Supply Chain 17Partners
Suppliers
Types of organisations we
engaged with in this year’s consultation
Sectio
nseven
“In the last two years or so, we have used the FES documents as the starting
point for our analyses of the long term GB power market. We have found that
the four scenarios provide a good range of potential demand and
generation/energy mix with their supporting stories to reinforce our message
to client that the outlook is extremely uncertain and that they should adopt a
sufficiently flexible strategy or other risk mitigation measures. We have
tended to focus most on the implications for generation capacity of various
scales and types, as well as DSR and storage, however we have also used
the FES views on heat for examining district heat and System Marginal Price
(SMP) options. Our clients seem to be reassured that the projections in FES
have been developed through a broad stakeholder consultation process and
therefore are grounded, rather than being too academic.”
Guy Doyle, Mott MacDonald

National Grid UK
@nationalgriduk
NationalGridUK
Get involved in the debate on the future
of energy on Twitter, tweeting us
@nationalgriduk and join our LinkedIn
group ‘Future of Energy by National Grid’
Email us with your views on this
document or the FES at
one of our experts will get in touch
Access our current and past FES documents,
Stakeholder Feedback documents, data and
multimedia at http://fes.nationalgrid.com
Write to us at:
SO Strategy
Energy Insights
National Grid House
Warwick Technology Park
Gallows Hill
Warwick
CV34 6DA
Continuing the
conversation
Sectio
neig
ht

Disclaimer
For the purpose of this statement, National Grid Gas plc and National Grid Electricity Transmission plc willtogether be referred to as National Grid. The information contained within the Future Energy ScenariosStakeholder Feedback document (“the Document”) is disclosed voluntarily and without charge to you in order tofacilitate and encourage discussion of the scenarios used by National Grid in its electricity and gas planningprocesses.
The Document does not replace the Gas Ten Year Statement (GTYS) or the Electricity Ten Year Statement(ETYS) (or any other document published by National Grid containing substantially the same information asthose documents) published in accordance with the relevant licence conditions.
While National Grid have not sought to mislead any party as to the content of the Document and, whilst thecontent represents National Grid’s best views as of 22 January 2016, readers should not place any reliance onthe content of the Document. The Document (including, without limitation, information as regards capacityplanning, future investment and the resulting capacity) must be considered as illustrative only and no warrantycan be or is made as to the accuracy and completeness of such Document, nor shall anything within theDocument constitute an offer capable of acceptance or form the basis of any contract. Other than in the event offraudulent misstatement or fraudulent misrepresentation, National Grid does not accept any responsibility forany use which is made of the information contained within this Document.
Copyright National Grid 2016, all rights reserved. No part of the Document may be reproduced in any materialform (including photocopying and storing in any medium or electronic means and whether or not transiently orincidentally) without the written permission of National Grid except in accordance with the provisions of theCopyright, Designs and Patents Act 1988.