プロサッカーチームにおける3年間の傷害調査プロサッカーチームにおける3年間の傷害調査...
TRANSCRIPT

Football Science Vol.11, 36-50, 2013http://www.jssf.net/home.html
36
1. 緒言
サッカーは傷害を受ける頻度が高いスポーツであると言われている(Hawkins, et al., 1999, 2001; Rahnama, et al., 2002).これまでサッカーの傷害に関する調査は数多く行われ,プロサッカー選手を対象とした傷害調査もみられる.諸外国のリーグにおける傷害発生の分析では,受傷した部位が大腿部,膝関節,足関節,下腿部の順に多く(Andersen, et al., 2004),傷害の種類は肉離れ,打撲,捻挫が多いことが報告されている(Hawkins, et al., 2001; Woods, et al., 2002 ; Waldén, et al., 2005a).また,World Cup の大会中に発生した傷害の分析を行っているものもある(Junge, et al., 2004; Dvorak, et al., 2007, 2011).一方,我が国においては J リーグ Division 1 に所属するチームを対象とした傷害調査を行った結果,肉離れ,打撲,捻挫の順に多かったことが報告されている(白石ら,2003).この他にも打撲
が多く,足関節捻挫,肉離れ,膝関節靭帯損傷の順に多かったという研究もみられる(香取ら,2002).だが,各論文によって傷害の定義や傷害発生率の算出方法などが異なり,客観的に数値などを比較することができない.これに対して,国際サッカー連盟(Fédération Internationale de Football Association,以下,FIFA)は,サッカーにおける傷害調査の方法について統一した定義を示している
(Fuller, et al., 2006).近年,プロサッカー選手を対象にこれらの定義を用いた傷害調査(Ekstrand, et al., 2006)も行われるようになってきたが,本邦においてはこの定義を用いた傷害調査に関する研究はほとんどみられない.
分析の方法として傷害の発生状況別(試合時,練習時)に分けて比較している研究(Hawkins, et al., 1999, 2001; Hägglund, et al., 2003, 2005)と傷害の内容別(外傷と障害)に分けて調査している研究(Ekstrand, et al., 1983; Waldén, et al., 2005b)がある.また,月別の傷害発生率について
プロサッカーチームにおける 3年間の傷害調査Epidemiology of Professional Soccer Team Injuries for Three Years
山本 純*
Jun Yamamoto*
*公益社団法人 山形県スポーツ振興 21 世紀協会 モンテディオ山形*Yamagata prefecture Sports promotion the 21st century Association Inc.,
Montedio Yamagata1-1, Clubhouse of Montedio Yamagata, Sannou, Tendo, Yamagata, 994-0000 Japan
[email protected][Received December 12, 2012; Accepted April 23, 2013]
AbstractThis study investigated the epidemiology of injuries in professional soccer players over a 3-year period, using definitions established by the Federation Internationale de Football Association. The studied identified 5 main results. (1) A total of 211 injuries were recorded over the 3 seasons; 144 were traumatic injuries and 67 were overuse injuries. (2) Injury rates were lower during 2011 than during 2009, especially the rates of overuse injuries. Injury rates during practice were lower in 2011 than in 2010, and overuse injury rates during games were lower in 2010 than in 2009. (3) Lower extremity injuries accounted for 87.7% of the reported injuries; the ankle was the most commonly affected site. (4) Joint and ligament as well as muscle and tendon injuries accounted for 70% of all injuries. (5) During games, injury rates were lower for goalkeepers than for other players. This study showed that measures should be taken to prevent traumatic injuries during preseason practice and during games. Similarly, preventive measures are needed to reduce overuse injuries during the season.
Keywords: professional soccer team, injury report, injury rate プロサッカーチーム,傷害調査,傷害発生率
原著論文:スポーツ医学とリハビリテーション
[Football Science Vol.11, 36-50, 2013]
Football Science Vol.11, 36-50, 2013
山本 純
http://www.jssf.net/home.html37
分析し,試合期は外傷の傷害発生率が上昇し,シーズン終盤になるにつれて減少するという報告(Waldén, et al., 2005a)など,シーズン中の傷害発生率の特徴を明らかにしている報告もみられる(Hawkins, et al., 1999).しかし,発生状況,内容および発生時期を合わせて分析している研究はあまり報告されていない.年間を通して試合が行われるプロサッカーチームにとって,これらを総合して分析することは,傷害発生のメカニズムや危険因子を抽出することにつながり,サッカーにおけるスポーツ傷害の実態をより明確に把握できる.そしてこの結果を踏まえて傷害予防策を講じれば最終的に傷害予防につなげることが可能となる.
そこで本研究では,サッカーに発生するスポーツ傷害の実態をより明確に把握し,傷害予防策を講じるための基礎資料を得るため,FIFA によって定義された方法を用いてプロサッカーチームに発生した傷害について詳細に調査し,検討した.
2. 対象と方法
2.1. 対象
対象は,2009 ~ 2011 年の 3 年間にサッカー J リーグDivision1 に所属するチームに在籍したプロサッカー選手50 名(2009 年;34 名,2010 年;31 名,2011 年;31 名,年齢 18 ~ 35 歳,平均 26.6 歳)であった.
2.2. 方法
2009 ~ 2011 年の 3 シーズンに記録されたすべての傷害について調査・検討した.調査項目はすべての傷害の「発生件数」,「傷害発生率」とし,これらの項目について「試合時」,「練習時」および「試合 + 練習時」に分け,さらに各々「外傷」と「障害」に分けて分析した.また,「重症度」,「受傷した部位」および「受傷した疾患」についても調査した.傷害の定義,傷害発生率の算出方法,重症度,受傷した部位および疾患の分類には FIFA によって推奨された定義(Fuller, et al., 2006)を用いた.すなわち,傷害の定義は「サッカーの練習および試合中に発生した傷害で 1 日以上の練習および試合を休まなければならなかったもの」とし,傷害発生率は一人の選手が練習および試合に参加した 1000 時間あたりの傷害発生件数を意味する1000player-hours の単位を用いた.各年の傷害発生率とその比(Rate ratio)については,データの統計学的な安定性を得るために 95% 信頼区間(以下,95%CI)とともにそれぞれ算出した.また,重症度は復帰までの日数が 1 ~
3 日のものを「minimal」,4 ~ 7 日 を「mild」,8 ~ 28 日を 「moderate」,29 日以上を「severe」に分類した.この他,先行研究 (Hawkins and Fuller, 1999; Woods, et al., 2002)を参考に「発生要因別」,「ポジション別」および「月別」についても検討した.「月別」の項目については,1 ~ 2月を「キャンプ期」,3 ~ 5 月を「シーズン序盤」,6 ~ 8月を「シーズン中盤」,9 ~ 12 月を「シーズン終盤」とした.「重症度」,「発生要因別」および「ポジション別」の比
較にはχ2 検定を行った.また Rate ratio の比較には z 検定を用いた.なお,統計処理には Excel(Excel 2007)とSPSS(SPSS Ver.12)を使用し,危険率 5% 未満を有意差ありとした.
3. 結果
3.1. 発生件数と発生率について
Table 1にすべての傷害の「発生件数」と「傷害発生率」の結果を示した.傷害の総発生件数は 211 件で,その内訳として外傷は 144 件,障害は 67 件であった.また,試合時における傷害発生件数は 81 件で,そのうち外傷が 72 件,障害が 9 件であった.一方,練習時は 130 件で,そのうち外傷が 72 件で,障害が 58 件であった.傷害の総傷害発生率は 4.8[4.2-5.5]([ ]内は 95%CI を示す)で,その内訳として外傷は 3.3[2.8-3.9]件,障害は 1.5[1.2-1.9]であった.また,試合時における傷害発生率は 25.3[19.8-30.7]で,そのうち外傷が 22.4[17.3-27.6],障害が 2.8[1.0-4.6]であった.一方,練習時における傷害発生率は 3.2[2.7-3.8]で,そのうち外傷が 1.8[1.4-2.2]で,障害が 1.4[1.1-1.8]であった.Table 2に Rate ratio を示した.2011 年は 2009 年と比
べると総傷害発生率が有意に低下し(p<0.05),そのうち外傷の発生率が減少傾向にあり(p=0.07),障害の発生率が有意に減少していた(p<0.05).また,試合時の傷害発生率が有意に低下し(p<0.05),そのうち障害の発生率が有意に低下していた(p<0.05).一方,2010 年と比べると練習時における傷害発生率が有意に減少し(p<0.05),そのうち外傷の発生率が減少傾向にあった(p=0.097).次に2010 年と 2009 年を比べると試合時における傷害発生率が有意に低下し(p<0.05),そのうち外傷の発生率が減少傾向にあり(p=0.09),障害の発生率が有意に減少していた
(p<0.01).
3.2. 重症度について
Table 3は「重症度」の結果を示している.すべての傷

プロサッカーチームの傷害調査
Football Science Vol.11, 36-50, 2013http://www.jssf.net/home.html
38
害の重症度は,moderate が 75 件(35.5%)で最も多く,次 い で mild が 53 件(25.1%),severe が 43 件(20.4%),minimal が 40 件(19.0%)であり,moderate は minimalと severe と比べて有意に多かった(p<0.05).しかし,試合時や練習時における外傷と障害に分類した結果ではいずれの項目においても違いは認められなかった.
3.3. 受傷した部位について
すべての傷害の「部位別」の結果を Table 4-1に示した.すべての傷害において「下肢」の発生件数が 185 件(87.7%)で最も多く,その内訳では「足関節」の 58 件(31.4%)に次いで「大腿部」の 43 件(23.3%),「膝関節」の 37 件(20.0%)
の順であった.試合時と練習時における「部位別」の結果を Table 4-2
と Table 4-3に示した.試合時や練習時の外傷の部位別傷害発生件数はすべての傷害の部位別の結果と同様であった.一方,障害については試合時では「大腿部」が最も多かったのに対して練習時では「膝関節」が最も多い結果を示し,試合時と練習時では受傷した部位が異なっていた.
3.4. 受傷した疾患について
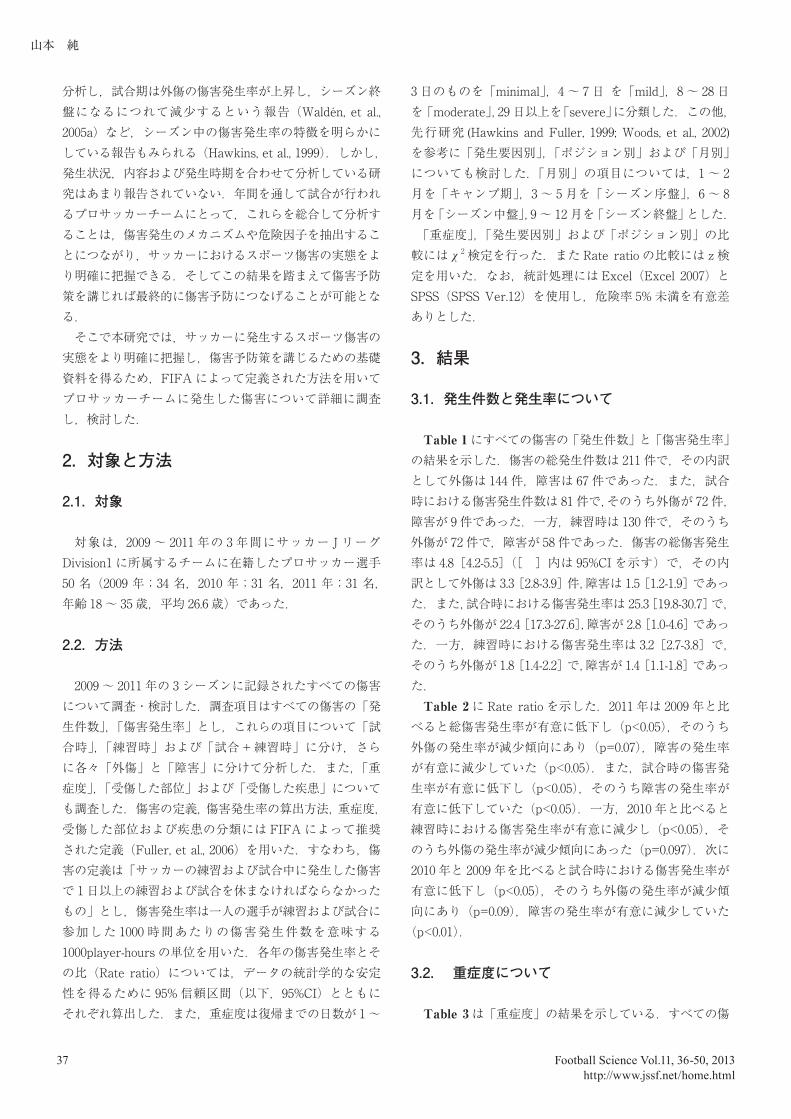
すべての傷害の「疾患別」の結果を Table 5-1に示した.すべての傷害において「筋と腱」の傷害が 75 件(35.5%)で最も多く,次いで「関節と靱帯」の傷害が 73 件(34.6%),
Table 1 The results in number of injuries and injury rates during game and practice.
Total 2009 2010 2011
No of injuries ( n ) ( n ) ( n ) ( n )All Injuries
Trauma 144 60 48 36
Overuse 67 30 23 14
Trauma+Overuse 211 90 71 50
GameTrauma 72 34 19 19
Overuse 9 8 0 1
Trauma+Overuse 81 42 19 20
PracticeTrauma 72 26 29 17
Overuse 58 22 23 13
Trauma+Overuse 130 48 52 30
Injury rates [ 95%CI ] (1000player-hours) (1000player-hours) (1000player-hours) (1000player-hours)
All InjuriesTrauma 3.3 [ 2.8-3.9 ] 3.8 [ 1.5-6.2 ] 3.4 [ 1.0-5.7 ] 2.6 [ 0.5-4.8]
Overuse 1.5 [ 1.2-1.9 ] 1.9 [ 1.2-2.6 ] 1.6 [ 1.0-2.3] 1.0[ 0.5-1.6 ]
Trauma+Overuse 4.8 [ 4.2-5.5 ] 5.8 [ 4.7-7.1 ] 5.0 [ 3.9-6.3 ] 3.7 [ 2.8-4.9 ]
GameTrauma 22.4 [ 17.3-27.6 ] 28.8 [ 19.3-38.4 ] 17.9 [ 9.9-25.8 ] 19.7 [ 10.9-28.4 ]
Overuse 2.8 [ 1.0-4.6] 6.8 [ 2.1-11.5 ] 0.0 [ 0.0-0.0 ] 1.0[ -1.0-3.1 ]
Trauma+Overuse 25.3 [ 19.8-30.7 ] 35.6 [ 25.8-47.8 ] 17.9 [ 10.8-27.8 ] 20.7 [ 12.7-31.8 ]
PracticeTrauma 1.8 [ 1.4-2.2 ] 1.8 [ 1.1-2.5 ] 2.2 [ 1.4-3.0 ] 1.3 [ 0.7-2.0 ]
Overuse 1.4 [ 1.1-1.8 ] 1.5 [ 0.9-2.2 ] 1.8 [ 1.0-2.5 ] 1.0 [ 0.5-1.6 ]
Trauma+Overuse 3.2 [ 2.7-3.8 ] 3.3 [ 2.4-4.4 ] 4.0 [ 3.0-5.2 ] 2.4 [ 1.6-3.4 ]
Notes : [ ] is 95% confidence interval.

Football Science Vol.11, 36-50, 2013
山本 純
http://www.jssf.net/home.html39
「打撲,裂傷/皮膚損傷」の傷害が 30 件(14.2%)の順であった.「筋と腱」の傷害の 3 分の 2 は筋損傷や肉離れであり,
「関節と靱帯」の傷害の 8 割が捻挫や靱帯損傷であった.試合時と練習時における「疾患別」の結果を Table 5-2
とTable 5-3に示した.試合時や練習時における外傷は「関節と靱帯」がそれぞれ 32 件(44.4%),39 件(54.2%)で最も多かったが,試合時や練習時における障害は「筋と腱」がそれぞれ約 6 ~ 7 割を占めており,外傷と障害では受傷した疾患が異なっていた.
3.5. 発生要因について
Table 6は傷害の「発生要因別」の結果を示している.すべての傷害において contact による発生件数が 81 件
(38.4%),non-contact が 130 件(61.6%)で non-contact の方が有意に高い値を示していた(p<0.05).同様に,練習時においても contact が 30 件(23.1%),non-contact が100 件(76.9%)で non-contact による傷害発生件数が有意に多かった(p<0.05).しかし,試合時においては contactが 51 件(63%),non-contact が 30 件(37%) で contactによる傷害発生件数が有意に高い値であった(p<0.05).
3.6. ポジションについて
傷害の「ポジション別」の結果を Figure 1に示した.すべての傷害におけるポジション別の結果は,Goalkeeper
(以下,GK)と比べて Defender(以下,DF),Midfi elder(以下,MF)および Forward(以下,FW)の発生件数が有意に多く(p<0.01),DF は FW と比べると有意に多かった(p<0.05).また,試合時の外傷の発生件数は GK と比べて他のすべてのポジションで発生件数が有意に多かった
(p<0.01).さらに,練習時の外傷は FW と比べて DF とMF の発生件数が有意に高い値を示していた(p<0.01).なお,障害についてはポジション別で発生件数に違いは認められなかった.
3.7. 月別について
すべての傷害の「月別」の傷害発生率を Figure 2-1に示す.総傷害発生率はシーズン中盤にかけて最も高い値を示し,キャンプ期やシーズン終盤にかけても高くなっており,3 峰性分布を示していた.
試合時における「月別」の傷害発生率を Figure 2-2に示した.試合時における障害の発生率は比較的低い値で推移していたのに対し,外傷の発生率はシーズン序盤,シー
Table 2 The results of rate ratio during game and practice in year.
2011/2009 2011/2010 2010/2009
Rate ratio (95%CI)
All InjuriesTrauma 0.78 [ 0.52-1.18 ] 0.69 [ 0.45-1.06 ] 0.88 [ 0.60-1.29 ]
Overuse 0.53 [ 0.28-1.01 ] 0.63 [ 0.33-1.23 ] 0.84 [ 0.49-1.45 ]
Trauma+Overuse 0.64 [ 0.45-0.90 ] 0.74 [ 0.52-1.06 ] 0.86 [ 0.63-1.18 ]
GameTrauma 0.68 [ 0.39-1.20 ] 0.62 [ 0.33-1.17 ] 0.62 [ 0.35-1.09 ]
Overuse 0.15 [ 0.02-1.22 ] 0.00 [ 0.00-0.00 ] 0.00 [ 0.00-0.00 ]
Trauma+Overuse 0.58 [ 0.34-0.99 ] 1.16 [ 0.62-2.17 ] 0.50 [ 0.29-0.86 ]
PracticeTrauma 0.74 [ 0.40-1.37 ] 0.61 [ 0.33-1.10 ] 1.23 [ 0.72-2.08 ]
Overuse 0.67 [ 0.34-1.33 ] 0.58 [ 0.30-1.15 ] 1.15 [ 0.64-2.06 ]
Trauma+Overuse 0.73 [ 0.46-1.15 ] 0.60 [ 0.38-0.94 ] 1.21 [ 0.82-1.79 ]
** : p<0.01,Significant difference in rate ratio. * : p<0.05,Significant difference in rate ratio.
*
*
*
*
*
***

プロサッカーチームの傷害調査
Football Science Vol.11, 36-50, 2013http://www.jssf.net/home.html
40
ズン中盤およびシーズン終盤に高く,総傷害発生率と同様に 3 峰性分布を示し,その発生率は徐々に上昇していた.
練習時における「月別」の傷害発生率を Figure 2-3に示した.練習時における外傷の発生率はキャンプ期,シーズン序盤およびシーズン終盤に高い値を示し,総傷害発生率や試合時における外傷の発生率と同様に 3 峰性分布を示していたが,試合時における外傷の発生率とは異なり,その発生率は徐々に下降していた.一方,障害の発生率は約3 か月のサイクルで発生率が高くなっており,発生率はいずれもほぼ同様の値であった.
4. 考察
4.1. 発生件数と傷害発生率について
総傷害発生件数や総傷害発生率は,J リーグ Division1のチームを対象とした報告(白石ら,2003)や諸外国のリーグの値(Hawkins, et al., 1999,; Hägglund et al., 2003; Waldén, et al., 2005a)と比べると低く,フランスのプロリーグの傷害発生率(Dauty, et al., 2011) とほぼ同様の値であった.また試合時と練習時の傷害発生率については,それぞれ
Table 3 The results of injury severity during game and practice.
Total % 2009 2010 2011
Minimal 40 19.0 15 16 9Mild 53 25.1 28 17 8
Moderate 75 ** 35.5 30 22 23Severe 43 20.4 17 16 10
Total 211 100.0 90 71 50
GameTrauma Minimal 11 15.3 4 2 5
Mild 12 16.7 8 1 3Moderate 28 38.9 14 7 7
Severe 21 29.2 8 9 4
Total 72 100.0 34 19 19
Overuse Minimal 1 11.1 0 0 1Mild 5 55.6 5 0 0
Moderate 3 33.3 3 0 0Severe 0 0.0 0 0 0
Total 9 100.0 8 0 1
PracticeTrauma Minimal 17 23.6 7 9 1
Mild 14 19.4 6 5 3Moderate 27 37.5 6 9 12
Severe 14 19.4 7 6 1
Total 72 100.0 26 29 17
Overuse Minimal 11 19.0 4 5 2Mild 22 37.9 9 11 2
Moderate 17 29.3 7 6 4Severe 8 13.8 2 1 5
Total 58 100.0 22 23 13
** : p<0.01,Significant difference of injury severity between Minimal and Moderate.: p<0.01,Significant difference of injury severity between Moderate and Severe.
All Injuries

Football Science Vol.11, 36-50, 2013
山本 純
http://www.jssf.net/home.html41
25.9 ~ 35.3 (Hawkins, et al., 1999; Morgan, et al., 2001; Hägglund, et al., 2003, 2005),2.9 ~ 11.8(Hawkins, et al., 1999; Morgan, et al., 2001; Hägglund, et al., 2003, 2005)という報告があり,本研究の結果(25.3,3.2)はこれらと比べてやや低い値であった.さらに,今回の調査ではすべての傷害発生件数のうち約 7 割が外傷で残りの約 3 割が障害であったが,過去の報告においてもこれらと同様の結果が示されている(Nielsen, et al., 1989; 香取ら,2002).以上より,我々が対象としたチームにおける総傷害発生率は先行研究と比べると比較的低かったが,外傷と障害の割合には違いが認められなかったと考えられる.我々の対象としたチームが J リーグ Division1 に初めて昇格して戦った2009 年の試合時の傷害発生率は,先行研究(白石ら,2002)より高い値を示したが,同じカテゴリーで戦った2010 年と 2011 年では先行研究(白石ら,2002)とほぼ同
様の値にまで減少した.本研究では 2011 年は 2009 年と比べて総傷害発生率が低下し,そのうち障害の発生率の減少,特に試合時における障害の発生率が低下するという結果と2010年と2009年を比べて試合時の総傷害発生率が低下し,そのうち試合時における外傷の発生率が減少傾向で,特に試合時における障害の発生率が減少するという結果を得た.競技レベルの違いが傷害に影響を及ぼす可能性があり
(Inklaar, et al., 1996)),トップリーグで戦い続けたことによりプレースピードや強度などに慣れたことが試合時における総傷害発生率の減少につながった要因と考えられた.
4.2. 重症度について
す べ て の 傷 害 の 重 症 度 は,moderate が minimal とsevere と比べて有意に多かったが,発生状況別に分析す
Table 4-1 The results of injury location in all injuries.
Total % 2009 2010 2011
Head and Neck1 20.0 1 - -4 80.0 2 1 1
Upper limbs3 42.9 2 1 -- - - - -- - - - -3 42.9 3 - -- - - - -1 14.3 - - 1
Trunk Sternum/ribs/upper back 1 7.1 - - 1 Abdomen - - - - - Lower back/pelvis/sacrum 13 92.9 7 4 2
Lower limbs Hip/groin 18 9.7 6 7 5 Thigh 43 23.2 21 12 10 Knee 37 20.0 16 13 8 Lower leg/Achilles tendon 15 8.1 6 5 4 Ankle 58 31.4 21 22 15 Foot/toe 14 7.6 5 6 3
Total 211 100.0 90 71 50
Head and Neck 5 2.4 3 1 1Upper limbs 7 3.3 5 1 1Trunk 14 6.6 7 4 3Lower limbs 185 87.7 75 65 45
Total 211 100.0 90 71 50
All Injuries
Wrist Hand/finger/thumb
Head/face Neck/cervical spine
Shoulder/clavicula Upper arm Elbow Forearm

プロサッカーチームの傷害調査
Football Science Vol.11, 36-50, 2013http://www.jssf.net/home.html
42
ると傷害の重症度に違いは認められなかった.Hawkins et al.(2001)は moderate が最も多かったことを報告し,minor の傷害発生数は練習時と試合時では異なるという結果を得ている.本研究とは異なる結果となったが,この理由として先行研究と重症度の定義が異なっていたことが考えられる.このように試合と練習では発生する傷害の重症度に違いが認められる可能性もあり,さらに検討が必要である.
4.3. 部位について
Inklaar(1994)は,レビューにおいて傷害の 61 ~ 90%が下肢に発生していたことに言及している.また,大腿部,膝関節および足関節が傷害を多く受傷した部位であるとい
う研究結果もある(Hawkins, et al., 2001).さらに,試合時と練習時の傷害の受傷部位は同じであったという報告
(Arnason, et al., 2004)もみられる.本研究では傷害の約85% が下肢に発生し,足関節,大腿部,膝関節の順に多く,試合時と練習時の外傷の部位もこれらと同様の結果であったことから,我々が対象としたチームにおける傷害は試合時と練習時に関係なく,大腿部から足関節にかけて傷害が発生していたと考えられる.
4.4. 疾患について
受傷した疾患について,本研究では「筋と腱」「関節と靱帯」「打撲,裂傷 / 皮膚損傷」の順に多く認められ,「筋と腱」の傷害のうち 3 分の 2 が筋損傷や肉離れで,「関節
Table 4-2 The results of injury location during game.
Total % 2009 2010 2011 Total % 2009 2010 2011
Head and Neck Head/face - - - - - - - - - - Neck/cervical spine 1 100.0 - - 1 1 100.0 1 - -
Upper limbs Shoulder/clavicula - - - - - - - - - - Upper arm - - - - - - - - - - Elbow - - - - - - - - - - Forearm 3 100.0 3 - - - - - - - Wrist - - - - - - - - - - Hand/finger/thumb - - - - - - - - - -
Trunk Sternum/ribs/upper back - - - - - - - - - -
----------nemodbA Lower back/pelvis/sacrum 4 100.0 2 1 1 1 100.0 1 - -
Lower limbs Hip/groin 4 6.3 2 1 1 - - - - - Thigh 16 25.0 9 2 5 3 42.9 3 - - Knee 12 18.8 5 3 4 1 14.3 1 - - Lower leg/Achilles tendon 6 9.4 3 1 2 1 14.3 1 - - Ankle 23 35.9 9 9 5 2 28.6 1 - 1 Foot/toe 3 4.7 1 2 - - - - - -
Total 72 100.0 34 19 19 9 100.0 8 - 1
Head and Neck 1 1.4 - - 1 1 11.1 1 - -Upper limbs 3 4.2 3 - - - - - - -Trunk 4 5.6 2 1 1 1 11.1 1 - -Lower limbs 64 88.9 29 18 17 7 77.8 6 - 1
Total 72 100.0 34 19 19 9 100.0 8 - 1
Trauma OveruseGame

Football Science Vol.11, 36-50, 2013
山本 純
http://www.jssf.net/home.html43
と靱帯」の傷害のうち約 8 割が捻挫や靱帯損傷であった.Arnason et al.(1996)や Hawkins et al.(2001)も同様の結果を示している.また,諸外国のプロサッカー選手を対象した傷害調査において肉離れが最も多かったという研究
(Ekstrand, et al., 2011)や足関節捻挫が多く認められたという報告(Azubuike, et al., 2009; Aoki, et al., 2012)がなされており,プロサッカー選手にとって肉離れや捻挫は受傷しやすい疾患であると思われる.また,試合時と練習時の外傷のうちの約半分が「関節と靱帯」であったのに対して,障害のうちの 6 ~ 7 割が「筋と腱」であったことは,外傷と障害では受傷する疾患が異なることを意味しており,傷害予防プログラムを作成する際に考慮すべき要素であると考えられる.
4.5. 発生要因について
今回の調査結果では,contact に起因する傷害と比べてnon-contact に 起 因 す る 傷 害 の 方 が 有 意 に 多 か っ た
(38.4%vs61.6%).また,試合時においては contact による受傷が多かった(63.0%vs37.0%)のに対して,練習時ではnon-contact による受傷が多く認められた(23.1%vs76.9%).スポーツ障害の要因にはトレーニング内容などがあり(中嶋,1993),過去の報告(白石ら,2002)と比べて年間の練習時間が多かったことが本研究の結果につながったと推察される.この他,Hawkins et al.(2001)はすべての傷害のうち 38% が contact によるもので 58% が non-contactによるものであったことを示し,Hawkins et al.(1999)や Agel et al.(2007)は,試合時は contact による受傷が
Table 4-3 The results of injury location during practice.
Total % 2009 2010 2011 Total % 2009 2010 2011
Head and Neck1 50.0 1 - - - - - - -1 50.0 - 1 - 1 100.0 1 - -
Upper limbs3 75.0 2 1 - - - - - -- - - - - - - - - -- - - - - - - - - -- - - - - - - - - -- - - - - - - - - -1 25.0 - - 1 - - - - -
Trunk Sternum/ribs/upper back 1 25.0 - - 1 - - - - -
----------nemodbA Lower back/pelvis/sacrum 3 75.0 3 - - 5 100.0 1 3 1
Lower limbs Hip/groin 7 11.3 3 3 1 7 13.5 1 3 3 Thigh 11 17.7 4 6 1 13 25.0 5 4 4 Knee 8 12.9 3 3 2 16 30.8 7 7 2 Lower leg/Achilles tendon 5 8.1 1 2 2 3 5.8 1 2 - Ankle 27 43.5 9 11 7 6 11.5 2 2 2 Foot/toe 4 6.5 - 2 2 7 13.5 4 2 1
Total 72 100.0 26 29 17 58 100.0 22 23 13
Head and Neck 2 2.8 1 1 - 1 1.7 1 - -Upper limbs 4 5.6 2 1 1 - - - - -Trunk 4 5.6 3 - 1 5 8.6 1 3 1Lower limbs 62 86.1 20 27 15 52 89.7 20 20 12
Total 72 100.0 26 29 17 58 100.0 22 23 13
Elbow Forearm Wrist Hand/finger/thumb
Trauma OverusePractice
Head/face Neck/cervical spine
Shoulder/clavicula Upper arm
プロサッカーチームの傷害調査
Football Science Vol.11, 36-50, 2013http://www.jssf.net/home.html
44
起きていたが,練習時は non-contact による受傷が起こっていたと報告している.これらのことより,試合時と練習時では傷害の発生要因が異なることが示唆された.
4.6. ポジションについて
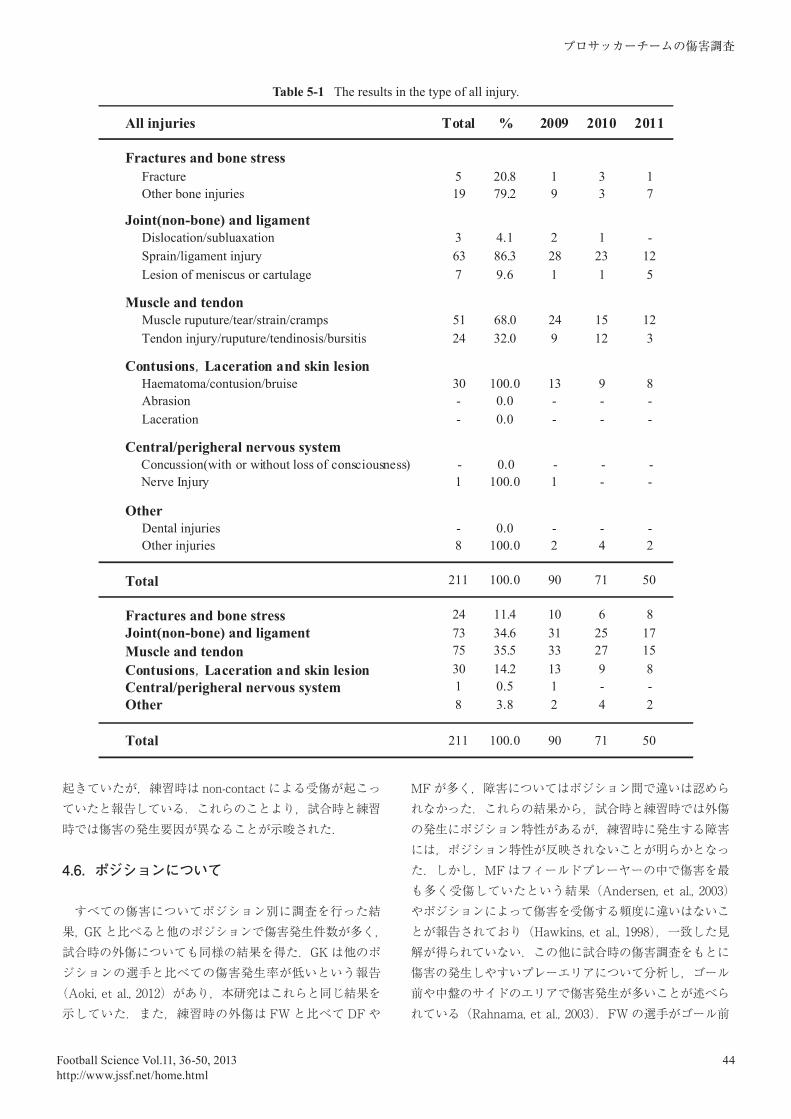
すべての傷害についてポジション別に調査を行った結果,GK と比べると他のポジションで傷害発生件数が多く,試合時の外傷についても同様の結果を得た.GK は他のポジションの選手と比べての傷害発生率が低いという報告
(Aoki, et al., 2012)があり,本研究はこれらと同じ結果を示していた.また,練習時の外傷は FW と比べて DF や
MF が多く,障害についてはポジション間で違いは認められなかった.これらの結果から,試合時と練習時では外傷の発生にポジション特性があるが,練習時に発生する障害には,ポジション特性が反映されないことが明らかとなった.しかし,MF はフィールドプレーヤーの中で傷害を最も多く受傷していたという結果(Andersen, et al., 2003)やポジションによって傷害を受傷する頻度に違いはないことが報告されており(Hawkins, et al., 1998),一致した見解が得られていない.この他に試合時の傷害調査をもとに傷害の発生しやすいプレーエリアについて分析し,ゴール前や中盤のサイドのエリアで傷害発生が多いことが述べられている(Rahnama, et al., 2003).FW の選手がゴール前
Table 5-1 The results in the type of all injury.
All injuries Total % 2009 2010 2011
Fractures and bone stress Fracture 5 20.8 1 3 1 Other bone injuries 19 79.2 9 3 7
Joint(non-bone) and ligament Dislocation/subluaxation 3 4.1 2 1 - Sprain/ligament injury 63 86.3 28 23 12 Lesion of meniscus or cartulage 7 9.6 1 1 5
Muscle and tendon Muscle ruputure/tear/strain/cramps 51 68.0 24 15 12 Tendon injury/ruputure/tendinosis/bursitis 24 32.0 9 12 3
Contusions,Laceration and skin lesion Haematoma/contusion/bruise 30 100.0 13 9 8 Abrasion - 0.0 - - - Laceration - 0.0 - - -
Central/perigheral nervous system Concussion(with or without loss of consciousness) - 0.0 - - -
--10.0011yrujnI evreN
Other Dental injuries - 0.0 - - - Other injuries 8 100.0 2 4 2
Total 211 100.0 90 71 50
Fractures and bone stress 24 11.4 10 6 8Joint(non-bone) and ligament 73 34.6 31 25 17Muscle and tendon 75 35.5 33 27 15Contusions,Laceration and skin lesion 30 14.2 13 9 8Central/perigheral nervous system 1 0.5 1 - -Other 8 3.8 2 4 2
Total 211 100.0 90 71 50

Football Science Vol.11, 36-50, 2013
山本 純
http://www.jssf.net/home.html45
で守備をする可能性はあり,サッカーにおいてはポジションによる特性を考慮することに加えてプレーエリアによる傷害の特性を明確にする必要があり,今後の更なる研究が期待される.
4.7. 月別について
傷害発生率について月別に分析した結果,総傷害発生率,試合時と練習時における外傷の発生率は 3 峰性分布を示した.外傷は試合期になると上昇し始め,試合期開始から 3か月でピークに達し,その後シーズンの終盤につれて減少するという報告(Waldén, et al., 2005a)がある.今回の調査では試合時における外傷の発生率は徐々に上昇しており,過去の研究とは異なる結果であった.この理由については本研究の分析項目からは明確にすることはできなかったが,シーズン終盤においては順位をかけて戦うため能力の限界まで発揮すること,疲労の蓄積などが傷害の増加に
関与していると考えられ,我々が対象としたチームにおいてはシーズン中盤と終盤における試合時の外傷予防の必要性が明らかとなった.一方,試合期は疲労回復や戦術練習に重点をおくため,練習強度が下がることで練習時の傷害発生率が減少傾向になるという報告(Waldén, et al., 2005b)がある.本研究においても練習時における外傷の発生率も徐々に下降しており,先行研究の結果と一致する.
本研究において,総傷害発生率はシーズン中盤が最も高く,キャンプ期およびシーズン終盤も高い値であった.5月は大型連休があるため,1 週間に複数の試合が行われることが多い時期である.週 2 回の試合は週 1 回の試合に比べて傷害発生率が高いという結果(Dupont, et al., 2010)やタイトな試合スケジュールは,傷害発生率を高める原因であるという報告(Waldén, et al., 2005)もあることから,連戦による影響でシーズン中盤にかけて傷害発生率が高くなったと考えられる.加えて,この時期は開幕から約 10試合を消化した時期に当たり,10 試合を消化したことに
Table 5-2 The results in the type of injury during game.
Total % 2009 2010 2011 Total % 2009 2010 2011
Fractures and bone stress Fracture 3 60.0 1 2 - - - - - - Other bone injuries 2 40.0 - - 2 2 100.0 1 - 1
Joint(non-bone) and ligament Dislocation/subluaxation 1 3.1 1 - - - - - - - Sprain/ligament injury 27 84.4 12 10 5 - - - - - Lesion of meniscus or cartulage 4 12.5 1 1 2 - - - - -
Muscle and tendon Muscle ruputure/tear/strain/cramps 17 100.0 9 2 6 4 66.7 4 - - Tendon injury/ruputure/tendinosis/bursitis - - - - - 2 33.3 2 - -
Contusions,Laceration and skin lesion Haematoma/contusion/bruise 18 100.0 10 4 4 - - - - - Abrasion - - - - - - - - - - Laceration - - - - - - - - - -
Central/perigheral nervous system Concussion(with or without loss of consciousness) - - - - - - - - - - Nerve Injury - - - - - 1 - 1 - -
Other Dental injuries - - - - - - - - - - Other injuries - - - - - - - - - -
Total 72 100.0 34 19 19 9 100.0 8 - 1
Fractures and bone stress 5 6.9 1 2 2 2 22.2 1 - 1Joint(non-bone) and ligament 32 44.4 14 11 7 - - - - -Muscle and tendon 17 23.6 9 2 6 6 66.7 6 - -Contusions,Laceration and skin lesion 18 25.0 10 4 4 - - - - -Central/perigheral nervous system - - - - - 1 11.1 1 - -Other - - - - - - - - - -
Total 72 100.0 34 19 19 9 100.0 8 0 1
esurevOamuarTGame

プロサッカーチームの傷害調査
Football Science Vol.11, 36-50, 2013http://www.jssf.net/home.html
46
よる疲労やコンディション不良が傷害発生率を高める要因となる可能性もある.キャンプ期はプレシーズン期にあたり練習強度が高い時期である.高強度のトレーニングや急な運動強度の増大は傷害発生率の要因となる(Ekstrand et al., 1999; Arnason et al., 1996) ことから,本研究においてもキャンプ期の総傷害発生率が高くなった要因と考えられた.シーズン終盤の総傷害発生率が高かった原因については,本研究の試合時における外傷の発生率がシーズン終盤にかけて増加しており,試合時における外傷の発生率の増加がシーズン終盤の総傷害発生率を高めたと考えた.
障害について,本研究ではキャンプ期やシーズン終盤の練習時における障害の発生率がほぼ同様で,約 3 ヶ月のサイクルで高くなっていた.シーズン序盤とシーズン終盤に障害の発生数が多かったという報告(Engström et al., 1990)があり,本研究の結果と一致する.この他にも障害はインシーズンよりもプレシーズンに多く発生する
(Hawkins et al., 2001)といった結果も示されており,キャ
ンプ期に障害の発生率が高くなることが予想される.これらの対策として,シーズンオフには休養だけでなく,適度なトレーニングを計画的に実施するなどして,次シーズンのキャンプ期に向けた準備をすることも必要と考える.その結果として,キャンプ期における障害の発生率の抑制につながる可能性がある.以上のことから我々が対象としたチームでは,シーズンを通して練習中の障害を予防する必要性が明らかとなった.
ここまで諸外国を中心にプロサッカー選手における傷害調査の結果と比較してきた.諸外国においてはリーグに所属するほぼすべてのチームを対象に分析しており,本研究の結果はこれらの報告と比べると傷害数が少なかった.そのため,試合時の障害やポジション別の項目については詳細に分析することができなかった.このような課題に対しては,症例数を増やす必要があり,データの蓄積を継続することとリーグ全体で統一した定義を用いてデータ収集を
Table 5-3 The results in the type of injury during practice.
Total % 2009 2010 2011 Total % 2009 2010 2011
Fractures and bone stress Fracture 2 50.0 - 1 1 - - - - - Other bone injuries 2 50.0 - 1 1 13 100.0 8 2 3
Joint(non-bone) and ligament Dislocation/subluaxation 2 - 1 1 - - - - - - Sprain/ligament injury 36 - 16 13 7 - - - - - Lesion of meniscus or cartulage 1 - - - 1 2 - - - 2
Muscle and tendon Muscle ruputure/tear/strain/cramps 15 88.2 6 6 3 15 42.9 5 7 3 Tendon injury/ruputure/tendinosis/bursitis 2 11.8 - 2 - 20 57.1 7 10 3
Contusions,Laceration and skin lesion Haematoma/contusion/bruise 12 - 3 5 4 - - - - - Abrasion - - - - - - - - - - Laceration - - - - - - - - - -
Central/perigheral nervous system Concussion(with or without loss of consciousness) - - - - - - - - - - Nerve Injury - - - - - - - - - -
Other Dental injuries - - - - - - - - - - Other injuries - - - - - 8 - 2 4 2
Total 72 100.0 26 29 17 58 100.0 22 23 13
Fractures and bone stress 4 5.6 - 2 2 13 22.4 8 2 3Joint(non-bone) and ligament 39 54.2 17 14 8 2 3.4 - - 2Muscle and tendon 17 23.6 6 8 3 35 60.3 12 17 6Contusions,Laceration and skin lesion 12 16.7 3 5 4 - - - - -Central/perigheral nervous system - - - - - - - - - -Other - - - - - 8 13.8 2 4 2
Total 72 100.0 26 29 17 58 100.0 22 23 13
PracticeesurevOamuarT

Football Science Vol.11, 36-50, 2013
山本 純
http://www.jssf.net/home.html47
実施することが望まれ,これによって我が国のプロサッカーチームに発生する傷害の病態をより詳細に把握することにつながると思われる.また,1 つのチームを対象に 3年間の傷害調査を行ったが,2009 年は 1 年を通して試合日程が組まれていたのに対して,2010 年や 2011 年は W杯や東日本大震災の影響でリーグ戦の中断を余儀なくされた.中断期間の存在は選手のコンディションに関与する可能性があり,結果として傷害の内容や発生時期にも影響を及ぼす可能性が考えられる.これらのことも含めて今後さらなる研究が必要である.
5. まとめ
プロサッカーチームにおいて 2009 年から 2011 年までの3 年間に発生したすべての傷害を FIFA の定義に基づいて詳細に調査・検討し,以下の結果を得た.1. 3 年間に発生したすべての傷害は 211 件(外傷 144 件,
障害 67 件)であった.2011 年は 2009 年と比べて総傷害発生率が低下し,特に試合時の障害が減少していた.また,2010 年と比べると練習時の傷害発生率が減少していた.2010 年は 2009 年と比べて試合時の障害が減少していた.
2. 傷害の重症度は,8 ~ 28 日の傷害が最も多かった. 3. 傷害を受傷した部位は下肢が多く,中でも足関節を受傷
Figure 1 The results in number of injuries during game and practice at position.
Table 6 The results of injury mechanism during game and practice in year.
Total % 2009 2010 2011
All injuries 81 38.4 34 31 16
130 61.6 56 40 34
Game 51 63.0 25 16 10
30 37.0 17 3 10
Practice 30 23.1 9 15 6
100 76.9 39 37 24
* : p<0.05,Significant difference in number of injuries between contact and non-contact.
contact
non-contact
contact
non-contact
contact
non-contact
*
*
*
0
10
20
30
40
50
60
70
80
90
100
110
120
All injuries Trauma in Game Overuse in Game Trauma in Practice Overuse in Practice
GK
DF
MF
FW**
**
***
****
**
(Num)
** : p < 0.01
* : p < 0.05
****

プロサッカーチームの傷害調査
Football Science Vol.11, 36-50, 2013http://www.jssf.net/home.html
48
する機会が多かった.また,「関節と靱帯」,「筋と腱」に関する傷害が約 7 割を占めていた.
4. GK は他のポジションと比べて傷害発生件数が少ない値を示し,特に試合時に受傷する機会が少なかった.
5. 我々が対象としたチームにおいては,シーズン中盤と終盤における試合時の外傷を予防する必要性ならびにシーズンを通して練習時の障害を予防する必要性が示唆された.
参考文献
Agel, J. , Evans, T. A. , Dick, R. , Putukian, M. , Marshall, S. W. (2007). Descriptive epidemiology of collegiate men's soccer injuries: National Collegiate Athletic Association Injury Surveillance System, 1988-1989 through 2002-2003. J. Athl. Train., 42(2):270-277.
Andersen, T. E. , Larsen, Ø. , Tenga, A. , Engebretsen, L. , Bahr, R. (2003). Football incident analysis: a new video based method to describe injury mechanisms in professional football. Br. J. Sports. Med., 37(3):226-232.
Anderson, T. E., Tenga, A., Engebretsen, L., Bahr, R. (2004). Video analysis of injuries and incidents in Norwegian professional football. Br. J. Sports. Med., 38(5):626-631.
Aoki, H. , O'Hata, N. , Kohno, T., Morikawa, T. , Seki, J. (2012). A 15-year prospective epidemiological account of acute traumatic injuries during offi cial professional soccer league matches in Japan. Am. J. Sports. Med., 40(5):1006-1014.
Arnason, A. , Gudmundsson, A. , Dahl, H. A. , Jóhannsson, E. (1996). Soccer injuries in Iceland. Scand. J. Med. Sci. Sports., 1996(1):40-45.
Arnason, A. , Sigurdsson, S. B. , Gudmundsson, A. , Holme, I. , Engebretsen, L. , Bahr, R. (2004). Risk factors for injuries in football. Am. J. Sports. Med., 32(1 Suppl):5S-16S.
Azubuike, S. O. , Okojie, O. H. (2009). An epidemiological study of football (soccer) injuries in Benin City, Nigeria. Br. J. Sports. Med., 43(5):382-386.
Dauty, M. , Collon, S. (2011). Incidence of injuries in French professional soccer players. Int. J. Sports. Med., 32(12):965-969.
Dupont, G. , Nedelec, M. , McCall, A. , McCormack, D. , Berthoin, S. , Wisløff, U. (2010). Effect of 2 soccer matches in a week on physical performance and
Figure 2-1 The results in all injury rates.
0
1
2
3
4
5
6
7
8
Jan. Feb. Mar. Apr. May Jun. Jul. Aug. Sep. Oct. Nov. Dec.
(/1000plyer-hours)
Figure 2-2 The results in injury rates of trauma and overuse during game.
0
5
10
15
20
25
30
35
40
Jan. Feb. Mar. Apr. May Jun. Jul. Aug. Sep. Oct. Nov. Dec.
Trauma
Overuse(/1000plyer-hours)
Figure 2-3 The results in injury rates of trauma and overuse during practice.
0.0
0.5
1.0
1.5
2.0
2.5
3.0
3.5
4.0
Jan. Feb. Mar. Apr. May Jun. Jul. Aug. Sep. Oct. Nov. Dec.
TraumaOveruse
(/1000player-hours)

Football Science Vol.11, 36-50, 2013
山本 純
http://www.jssf.net/home.html49
injury rate. Am. J. Sports. Med., 38(9):1752-1758.Dvorak, J. , Junge, A. , Grimm, K. , Kirkendall, D. (2007).
Medical report from the 2006 FIFA World Cup Germany. Br. J. Sports. Med. , 41(9):578-581.
Dvorak, J. , Junge, A. , Derman, W. , Schwellnus, M. (2011). Injuries and illnesses of football players during the 2010 FIFA World Cup. Br. J. Sports. Med., 45(8):626-630.
Ekstrand, J. , Gillquist, J. (1983). Soccer injuries and their mechanisms: a prospective study. Med. Sci. Sports. Exerc., 15(3):267-270.
Ekstrand, J. , Hilding, J. (1999). The incidence and diff erential diagnosis of acute groin injuries in male soccer players. Scand. J. Med. Sci. Sports., 9(2):98-103.
Ekstrand, J. , Timpka, T. , Hägglund, M. (2006). Risk of injury in elite football played on artifi cial turf versus natural grass: a prospective two-cohort study. Br. J. Sports. Med., 40(12):975-980.
Ekstrand, J. , Hägglund, M. , Waldén, M. (2011). Injury incidence and injury patterns in professional football: the UEFA injury study. Br. J. Sports. Med., 45(7):553-558.
Engström, B. , Forssblad, M. , Johansson, C. , Törnkvist, H. (1990). Does a major knee injury defi nitely sideline an elite soccer player?. Am. J. Sports. Med., 18(1):101-105.
Fuller, C. W., Ekstrand, J., Junge, A., Andersen, T. E., Bahr, R., Dvorak, J., Hägglund, M., McCrory, P., Meeuwisse, W. H. (2006). Consensus statement on injury definitions and data collection procedures in studies of football (soccer) injuries. Br. J. Sports. Med., 40(3):193-201.
Hägglund, M. , Waldén, M. , Ekstrand, J. (2003). Exposure and injury risk in Swedish elite football: a comparison between seasons 1982 and 2001. Scand. J. Med. Sci. Sports., 13(6):364-370.
Hägglund, M. , Waldén, M. , Ekstrand, J. (2005). Injury incidence and distribution in el ite football -a prospective study of the Danish and the Swedish top divisions. Scand. J. Med. Sci. Sports. , 15(1):21-28.
Hawkins, R. D. , Fuller, C. W. (1998). An examination of the frequency and severity of injuries and incidents at three levels of professional football. Br. J. Sports. Med., 32(4):326-332.
Hawkins, R. D., Fuller, C. W. (1999). A prospective epidemiological study of injuries in four English
professional football clubs. Br. J. Sports. Med., 33(3):196-203.
Hawkins, R. D. Hulse, M. A. , Wilkinson, C. , Hodson, A. , Gibson, M. (2001). The association football medical research programme: an audit of injuries in professional football. Br. J. Sports. Med., 35(1):43-47.
Inklaar, H. (1994). Soccer injuries. I: Incidence and severity. Sports. Med., 18(1):55-73.
Inklaar, H. , Bol, E. , Schmikli, S. L. , Mosterd, W. L. (1996). Injuries in male soccer players: team risk analysis. Int. J. Sports. Med., 17(3):229-234.
Junge, A. , Dvorak, J. , Graf-Baumann, T. (2004). Football injuries during the world cup 2002. Am. J. Sports. Med., 32, S23-S27.
香取庸一,山藤崇,山本謙吾,永井秀三,今給黎篤弘.(2002).プロサッカー選手における外傷・障害-J1クラブチームにおける外傷・障害の一年の動向-.日本整形外科スポーツ医学会雑誌,22(1):156.
Morgan, B. E. , Oberlander, M. A. (2001). An examination of injuries in major league soccer. The inaugural season. Am. J. Sports. Med., 29(4):426-430.
中嶋寛之.(1993).過労性スポーツ障害.体力科学,42(1):93-97.
Nielsen, A. B. , Yde, J. (1989). Epidemiology and traumatology of injuries in soccer. Am. J. Sports. Med., 17(6):803-807.
Rahnama, N. , Reilly, T. , Lees, A. (2002). Injury risk associated with playing actions during competitive soccer. Br. J. Sports. Med., 36(5):354-359.
白石稔,川崎英正,村上祐二,瀧圭介,間宮裕子,菊池忍.(2002).Jリーガーにおけるスポーツ傷害の実態.日本整形外科スポーツ医学会雑誌,22(2):233-239.
白石稔,管進吾,佐保豊,村上裕二,瀧圭介,菊池忍.(2003).プロサッカーにおけるスポーツ外傷治療の実際.日本臨床スポーツ医学会誌,11(2):196-204, 2003.
Waldén, M., Hägglund, M., Ekstrand, J. (2005a). UEFA Champions League study : a prospective study of injuries in professional football during the 2001-2002 season. Br. J. Sports. Med., 39(8):542-546.
Waldén, M., Hägglund, M., Ekstrand, J. (2005b). Injuries in Swedish elite football-a prospective study on injury defi nitions, risk for injury and injury pattern during 2001. Scand. J. Med. Sci. Sports., 15(2):118-125.
Woods, C., Hawkins, R. D., Hulse, M., Hodson, A.(2002). The Footbal l Associat ion Medical Research Programme: an audit of injuries in professional

プロサッカーチームの傷害調査
Football Science Vol.11, 36-50, 2013http://www.jssf.net/home.html
50
football-analysis of preseason injuries. Br J Sports Med, 36(6):436-441.
Name: Jun Yamamoto
Affi liation: Yamagata prefecture Sports promotion the 21st century Associat ion Inc. , Montedio Yamagata
Address:1-1, Clubhouse of Montedio Yamagata, Sannou, Tendo-shi, Yamagata, 994-0000 JapanBrief Biographical History:2004-2005 Master's Program in Sports Health & Science Graduate School of Heath & Physical Education University of Tsukuba.2006-2008 Medical course in acupuncture and moxibustion. The Japan School of Acupuncuture, Moxibust ion and Physiotherapy.2009- Athletic Trainer, Yamagata prefecture Sports promotion the 21st century Association Inc., Montedio YamagataMain Works:• The effect of cold bath on ankle instability. The journal of
Japanese Society of Clinical Sports Medicine, 15(1), 19-25, 2007.
Membership in Learned Societies:• Japanese Society of Science and Football• Japanese Society of Physical Fitness and Sports Medicine• Japanese Soceity of Clinical Sports Medicine• Japan Society of Acupuncture and Moxibustion • The Japanese Orthopaedic Society for Sports Medicine