fhwa hydraulics research program -...
TRANSCRIPT

TURNER-FAIRBANK HIGHWAY RESEARCH CENTERTURNER-FAIRBANK HIGHWAY RESEARCH CENTER
FHWA Hydraulics Research ProgramFHWA Hydraulics Research ProgramFHWA Hydraulics Research Programpresented
by
FHWA Hydraulics Research Programpresented
bybyKornel Kerenyi
for the
byKornel Kerenyi
for theUniversity at Buffalo
Monday, October 31, 2011University at Buffalo
Monday, October 31, 2011McLean, VAMcLean, VA

TURNER-FAIRBANK HIGHWAY RESEARCH CENTERTURNER-FAIRBANK HIGHWAY RESEARCH CENTER
FHWA Bridge Scour ProgramFHWA Bridge Scour Program
C d f F d l R l ti 23 CFR 650 S b t C• Code of Federal Regulations, 23 CFR 650, Subpart C• National Bridge Inspection Standards• FHWA Coding Guide for Structure Inventory • FHWA Coding Guide for Structure Inventory
• FHWA Recording and Coding Guide for Structure and Appraisal Inventory of the Nations Bridges
• ITEM 113 – Scour Critical Bridges• FHWA Technical Advisory (TA 5140.23) titled “Evaluating Scour at Bridges”
FHWA Scour ProgramFHWA Scour Program
TURNER-FAIRBANK HIGHWAY RESEARCH CENTERTURNER-FAIRBANK HIGHWAY RESEARCH CENTER
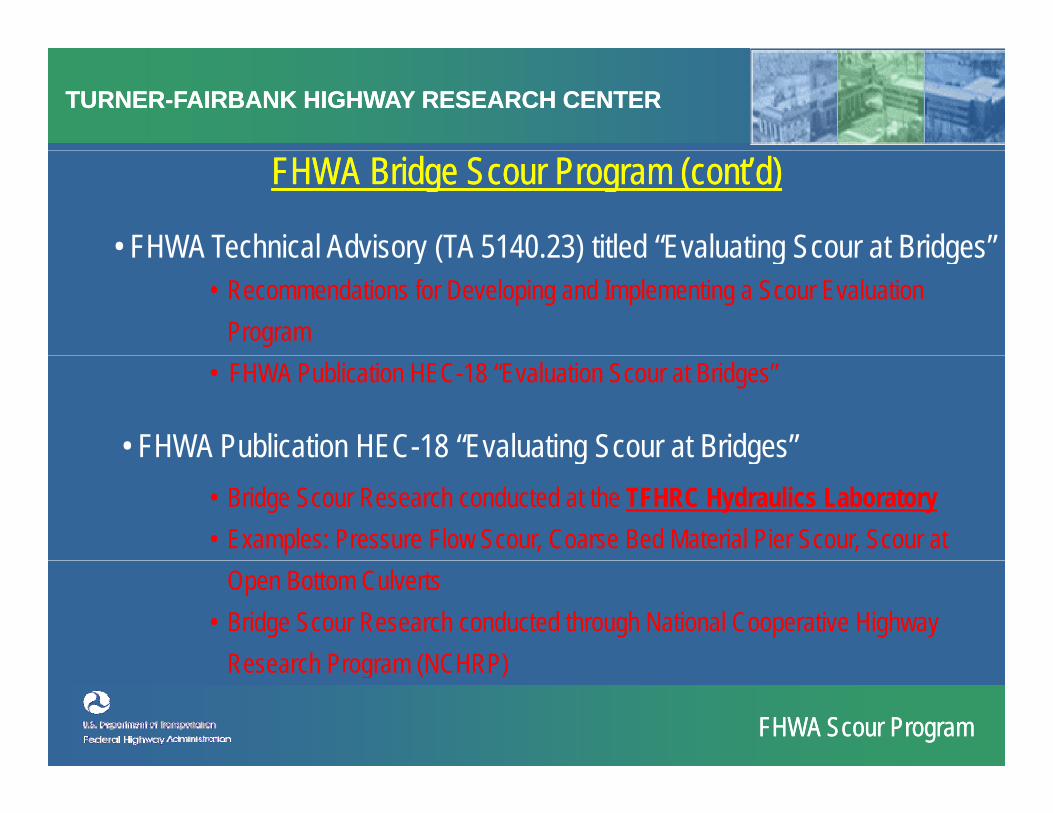
FHWA Bridge Scour Program (cont’d)FHWA Bridge Scour Program (cont’d)
• FHWA Technical Advisory (TA 5140 23) titled “Evaluating Scour at Bridges”FHWA Technical Advisory (TA 5140.23) titled Evaluating Scour at Bridges• Recommendations for Developing and Implementing a Scour Evaluation
Program • FHWA Publication HEC-18 “Evaluation Scour at Bridges”
• FHWA Publication HEC-18 “Evaluating Scour at Bridges”g g• Bridge Scour Research conducted at the TFHRC Hydraulics Laboratory • Examples: Pressure Flow Scour, Coarse Bed Material Pier Scour, Scour at
Open Bottom Culverts• Bridge Scour Research conducted through National Cooperative Highway
Research Program (NCHRP)
FHWA Scour ProgramFHWA Scour Program
Research Program (NCHRP)

TURNER-FAIRBANK HIGHWAY RESEARCH CENTERTURNER-FAIRBANK HIGHWAY RESEARCH CENTER
800
900
1000
60
600
700
800
res
from
02 T
otal
)
40
50
300
400
500
Num
ber o
f Fai
lur
966
to 2
005
(150
20
30 Perc
ent
100
200
300N 1
10
20
0
Construction
Concrete
Deterioration
EarthquakeNatural
Steel Fire
Misc.Overlo
adCollis
ionHydraulic
0
Historical Bridge FailuresHistorical Bridge Failures
Co De ECause
TURNER-FAIRBANK HIGHWAY RESEARCH CENTERTURNER-FAIRBANK HIGHWAY RESEARCH CENTER
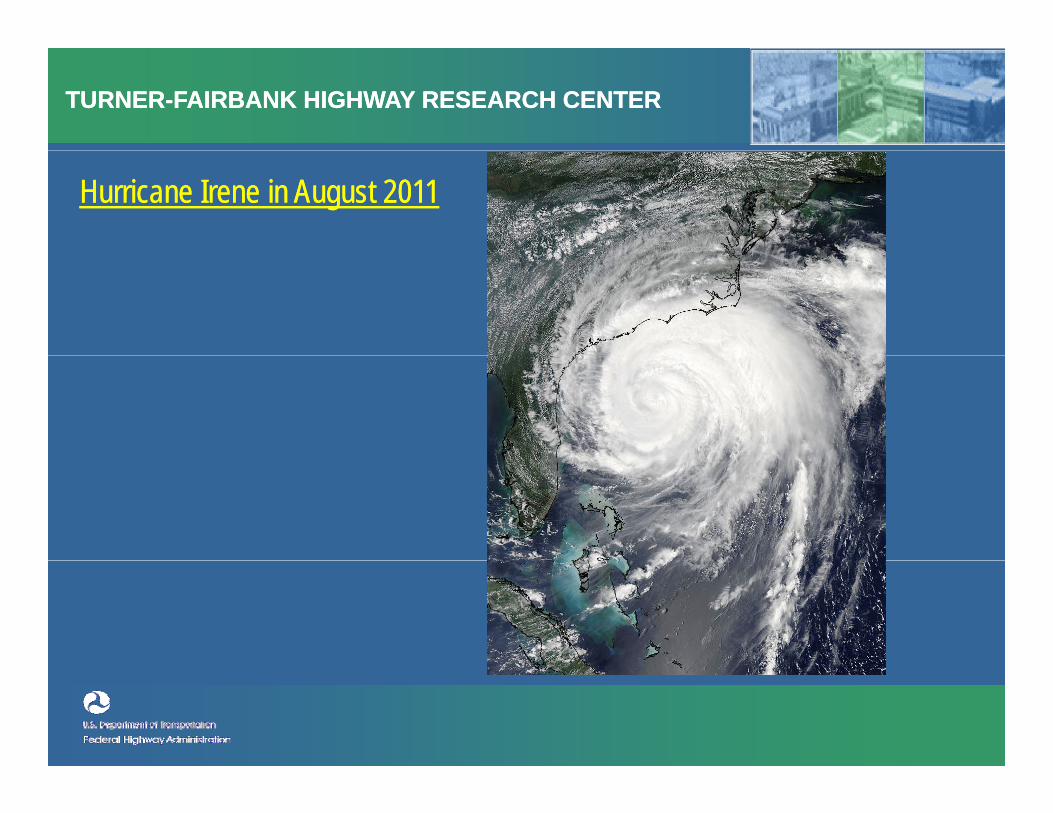
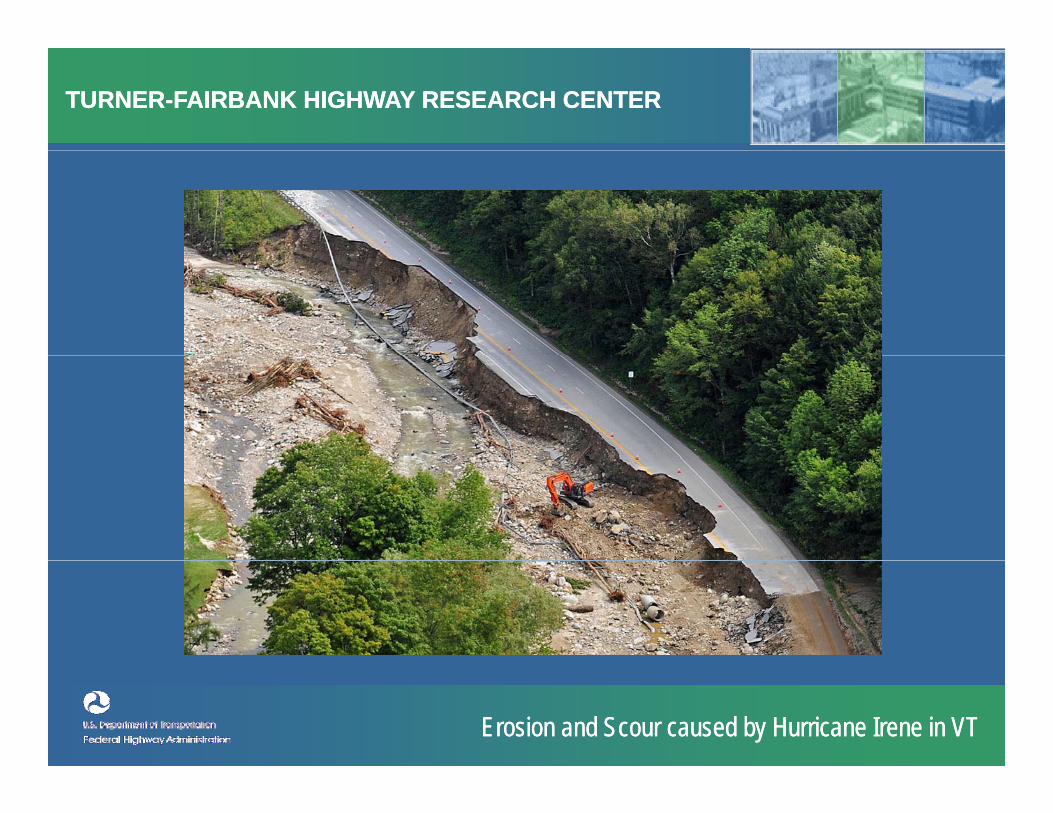
Hurricane Irene in August 2011Hurricane Irene in August 2011

TURNER-FAIRBANK HIGHWAY RESEARCH CENTERTURNER-FAIRBANK HIGHWAY RESEARCH CENTER
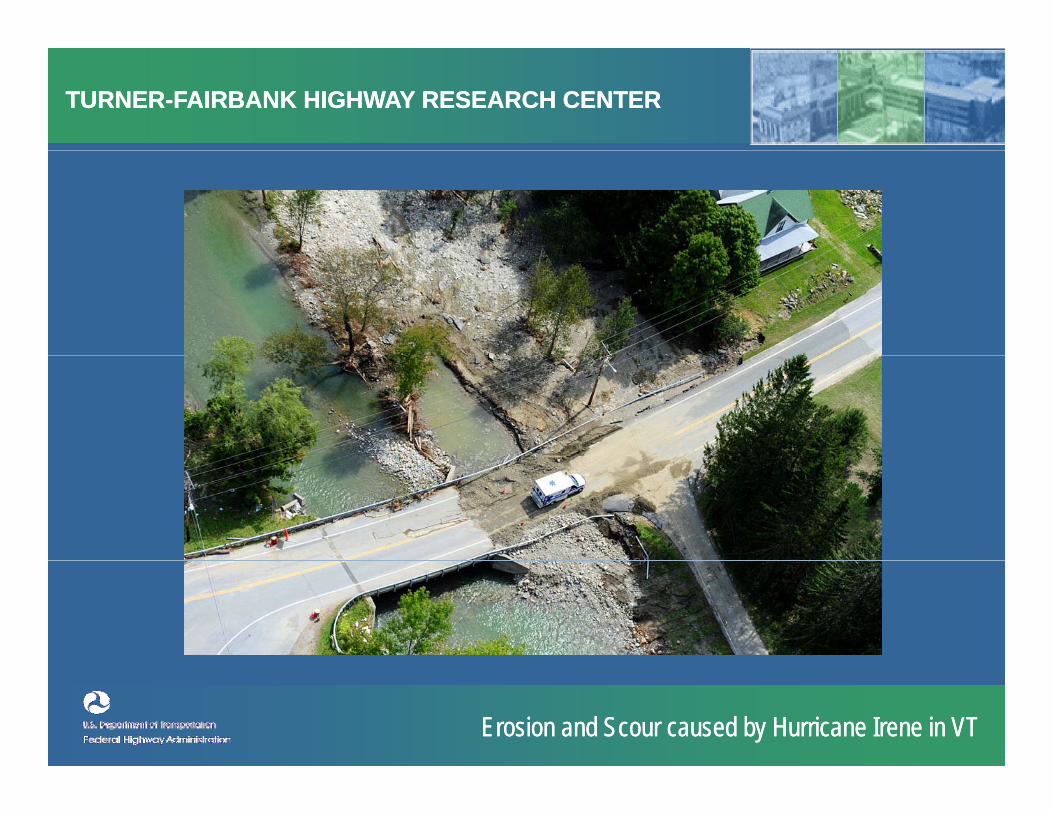
Erosion and Scour caused by Hurricane Irene in VTErosion and Scour caused by Hurricane Irene in VT

TURNER-FAIRBANK HIGHWAY RESEARCH CENTERTURNER-FAIRBANK HIGHWAY RESEARCH CENTER
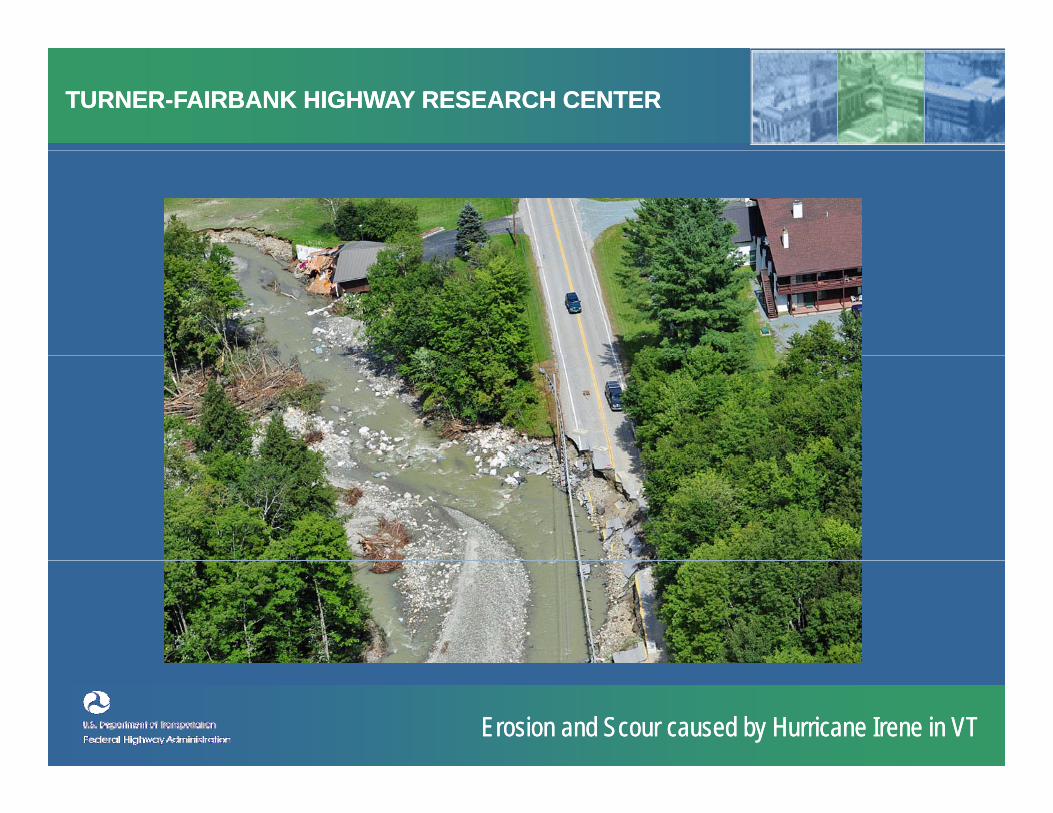
Erosion and Scour caused by Hurricane Irene in VTErosion and Scour caused by Hurricane Irene in VT
TURNER-FAIRBANK HIGHWAY RESEARCH CENTERTURNER-FAIRBANK HIGHWAY RESEARCH CENTER
Erosion and Scour caused by Hurricane Irene in VTErosion and Scour caused by Hurricane Irene in VT

TURNER-FAIRBANK HIGHWAY RESEARCH CENTERTURNER-FAIRBANK HIGHWAY RESEARCH CENTER
Erosion and Scour caused by Hurricane Irene in VTErosion and Scour caused by Hurricane Irene in VT
TURNER-FAIRBANK HIGHWAY RESEARCH CENTERTURNER-FAIRBANK HIGHWAY RESEARCH CENTER
Erosion and Scour caused by Hurricane Irene in VTErosion and Scour caused by Hurricane Irene in VT

TURNER-FAIRBANK HIGHWAY RESEARCH CENTERTURNER-FAIRBANK HIGHWAY RESEARCH CENTER
Erosion and Scour caused by Hurricane Irene in VTErosion and Scour caused by Hurricane Irene in VT
TURNER-FAIRBANK HIGHWAY RESEARCH CENTERTURNER-FAIRBANK HIGHWAY RESEARCH CENTER
Erosion and Scour caused by Hurricane Irene in VTErosion and Scour caused by Hurricane Irene in VT

TURNER-FAIRBANK HIGHWAY RESEARCH CENTERTURNER-FAIRBANK HIGHWAY RESEARCH CENTER
Super Flood in West Tennessee in May 2010 Super Flood in West Tennessee in May 2010

TURNER-FAIRBANK HIGHWAY RESEARCH CENTERTURNER-FAIRBANK HIGHWAY RESEARCH CENTER
Debris Accumulation Debris Accumulation
Super Flood in West TennesseeSuper Flood in West Tennessee

TURNER-FAIRBANK HIGHWAY RESEARCH CENTERTURNER-FAIRBANK HIGHWAY RESEARCH CENTER
Approach Roadway DamageApproach Roadway Damage
Super Flood in West TennesseeSuper Flood in West Tennessee

TURNER-FAIRBANK HIGHWAY RESEARCH CENTERTURNER-FAIRBANK HIGHWAY RESEARCH CENTER
Embankment ErosionEmbankment Erosion
Super Flood in West TennesseeSuper Flood in West Tennessee

TURNER-FAIRBANK HIGHWAY RESEARCH CENTERTURNER-FAIRBANK HIGHWAY RESEARCH CENTER
Bridge ScourBridge Scour
Super Flood in West TennesseeSuper Flood in West Tennessee

TURNER-FAIRBANK HIGHWAY RESEARCH CENTERTURNER-FAIRBANK HIGHWAY RESEARCH CENTER
Bridge ScourBridge Scour
Super Flood in West TennesseeSuper Flood in West Tennessee

TURNER-FAIRBANK HIGHWAY RESEARCH CENTERTURNER-FAIRBANK HIGHWAY RESEARCH CENTER
Structural DamageStructural Damage
Super Flood in West TennesseeSuper Flood in West Tennessee

TURNER-FAIRBANK HIGHWAY RESEARCH CENTERTURNER-FAIRBANK HIGHWAY RESEARCH CENTER
Structural DamageStructural Damage
Super Flood in West TennesseeSuper Flood in West Tennessee

TURNER-FAIRBANK HIGHWAY RESEARCH CENTERTURNER-FAIRBANK HIGHWAY RESEARCH CENTER
Summary of DamageSummary of Damage
• 504 Bridges showed debris accumulation• 415 Bridges had damage to the roadway approaches• 415 Bridges had damage to the roadway approaches• At 362 Bridge Sites, there was channel embankment erosion• 225 Bridges showed scour damage225 Bridges showed scour damage• 115 Bridges suffered some type of structural damage• 54 Bridges required closure54 Bridges required closure
Super Flood in West TennesseeSuper Flood in West Tennessee

TURNER-FAIRBANK HIGHWAY RESEARCH CENTERTURNER-FAIRBANK HIGHWAY RESEARCH CENTER
Physical Modeling Lab at TFHRC in McLean, VAPhysical Modeling Lab at TFHRC in McLean, VA
FHWA Hydraulics R&D ProgramFHWA Hydraulics R&D Program
TURNER-FAIRBANK HIGHWAY RESEARCH CENTERTURNER-FAIRBANK HIGHWAY RESEARCH CENTER
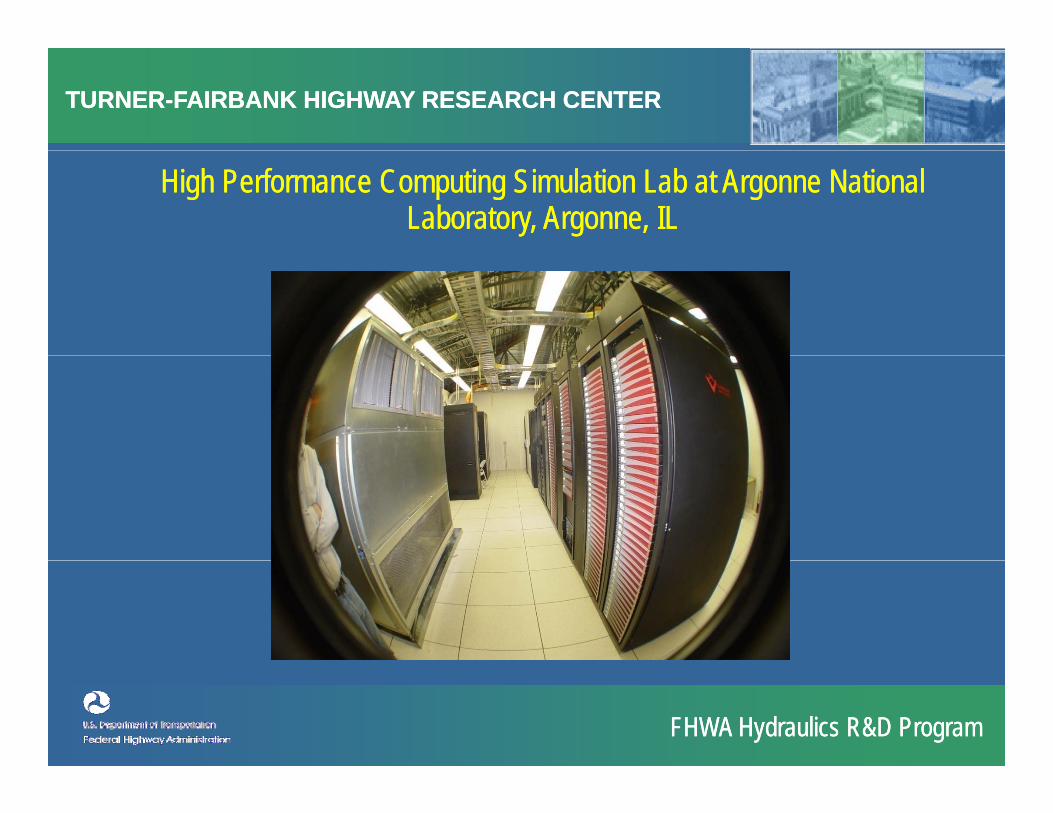
High Performance Computing Simulation Lab at Argonne National Laboratory, Argonne, IL
High Performance Computing Simulation Lab at Argonne National Laboratory, Argonne, IL
FHWA Hydraulics R&D ProgramFHWA Hydraulics R&D Program

TURNER-FAIRBANK HIGHWAY RESEARCH CENTERTURNER-FAIRBANK HIGHWAY RESEARCH CENTER
Applied Hydraulics R&D studies for FY12Applied Hydraulics R&D studies for FY12Applied Hydraulics R&D studies for FY12Applied Hydraulics R&D studies for FY12
• Scour in cohesive Soils/Incipient motion of cohesive soilsScour in cohesive Soils/Incipient motion of cohesive soils• Fish Passage in Large Culverts with Low Flows• Pressure Flow Scour RANS CFD ModelingPressure Flow Scour RANS CFD Modeling• Special LES CFD Modeling on Bridge Piers
Applied Hydraulics R&D FY12 Work PlanApplied Hydraulics R&D FY12 Work Plan

TURNER-FAIRBANK HIGHWAY RESEARCH CENTERTURNER-FAIRBANK HIGHWAY RESEARCH CENTER
ESTD - ConceptESTD - Concept

TURNER-FAIRBANK HIGHWAY RESEARCH CENTERTURNER-FAIRBANK HIGHWAY RESEARCH CENTER
Idea of superposing velocity profilesIdea of superposing velocity profiles
ESTD - ConceptESTD - Concept

TURNER-FAIRBANK HIGHWAY RESEARCH CENTERTURNER-FAIRBANK HIGHWAY RESEARCH CENTER
ESTD combines couette flow and pipe flow to produce a log-law velocity profile
ESTD combines couette flow and pipe flow to produce a log-law velocity profile
ESTD - ConceptESTD - Concept

TURNER-FAIRBANK HIGHWAY RESEARCH CENTERTURNER-FAIRBANK HIGHWAY RESEARCH CENTER
Using PIV to measure velocity profiles in the ESTD Using PIV to measure velocity profiles in the ESTD
ESTD - PIVESTD - PIV

TURNER-FAIRBANK HIGHWAY RESEARCH CENTERTURNER-FAIRBANK HIGHWAY RESEARCH CENTER
Using PIV to measure velocity profiles in the ESTD (cont’d) Using PIV to measure velocity profiles in the ESTD (cont’d)
ESTD - PIVESTD - PIV

TURNER-FAIRBANK HIGHWAY RESEARCH CENTERTURNER-FAIRBANK HIGHWAY RESEARCH CENTER
Using PIV to measure velocity profiles in the ESTD (cont’d) Using PIV to measure velocity profiles in the ESTD (cont’d)
ESTD - PIVESTD - PIV

TURNER-FAIRBANK HIGHWAY RESEARCH CENTERTURNER-FAIRBANK HIGHWAY RESEARCH CENTER
Log Log –– law velocity profile at the test sectionlaw velocity profile at the test section
ESTD – Velocity ProfilesESTD – Velocity Profiles

TURNER-FAIRBANK HIGHWAY RESEARCH CENTERTURNER-FAIRBANK HIGHWAY RESEARCH CENTER
Log Log –– law velocity profile at the test section (cont’d)law velocity profile at the test section (cont’d)
ESTD – Velocity ProfilesESTD – Velocity Profiles

TURNER-FAIRBANK HIGHWAY RESEARCH CENTERTURNER-FAIRBANK HIGHWAY RESEARCH CENTER
Velocity Profile Equations Velocity Profile Equations
Laminar Zone:Laminar Zone:
Buffer Zone (Guo 2007):Buffer Zone (Guo 2007):
Turbulent Zone:Turbulent Zone:Turbulent Zone:Turbulent Zone:
ESTD – Velocity ProfilesESTD – Velocity Profiles

TURNER-FAIRBANK HIGHWAY RESEARCH CENTERTURNER-FAIRBANK HIGHWAY RESEARCH CENTER
Shear and Normal Force SensorShear and Normal Force Sensor
ESTD - Shear and Normal Force SensorESTD - Shear and Normal Force Sensor

TURNER-FAIRBANK HIGHWAY RESEARCH CENTERTURNER-FAIRBANK HIGHWAY RESEARCH CENTER
Specimen I - D50= 0.5 [mm] Specimen II - D50= 2 [mm]
Influence of roughness on shear and lift stressInfluence of roughness on shear and lift stress
Specimen I D50 0.5 [mm] Specimen II D50 2 [mm]
Specimen IV - D50= 5.6 [mm]Specimen III - D50= 2.8 [mm]
ESTD - Shear and Normal Force MeasurementsESTD - Shear and Normal Force Measurements

TURNER-FAIRBANK HIGHWAY RESEARCH CENTERTURNER-FAIRBANK HIGHWAY RESEARCH CENTER
Influence of roughness on shear and lift stress (cont’d)Influence of roughness on shear and lift stress (cont’d)
ESTD - Shear and Normal Force MeasurementsESTD - Shear and Normal Force Measurements

TURNER-FAIRBANK HIGHWAY RESEARCH CENTERTURNER-FAIRBANK HIGHWAY RESEARCH CENTER
Influence of roughness on shear and lift stress (cont’d)Influence of roughness on shear and lift stress (cont’d)
ESTD - Shear and Normal Force MeasurementsESTD - Shear and Normal Force Measurements
TURNER-FAIRBANK HIGHWAY RESEARCH CENTERTURNER-FAIRBANK HIGHWAY RESEARCH CENTER
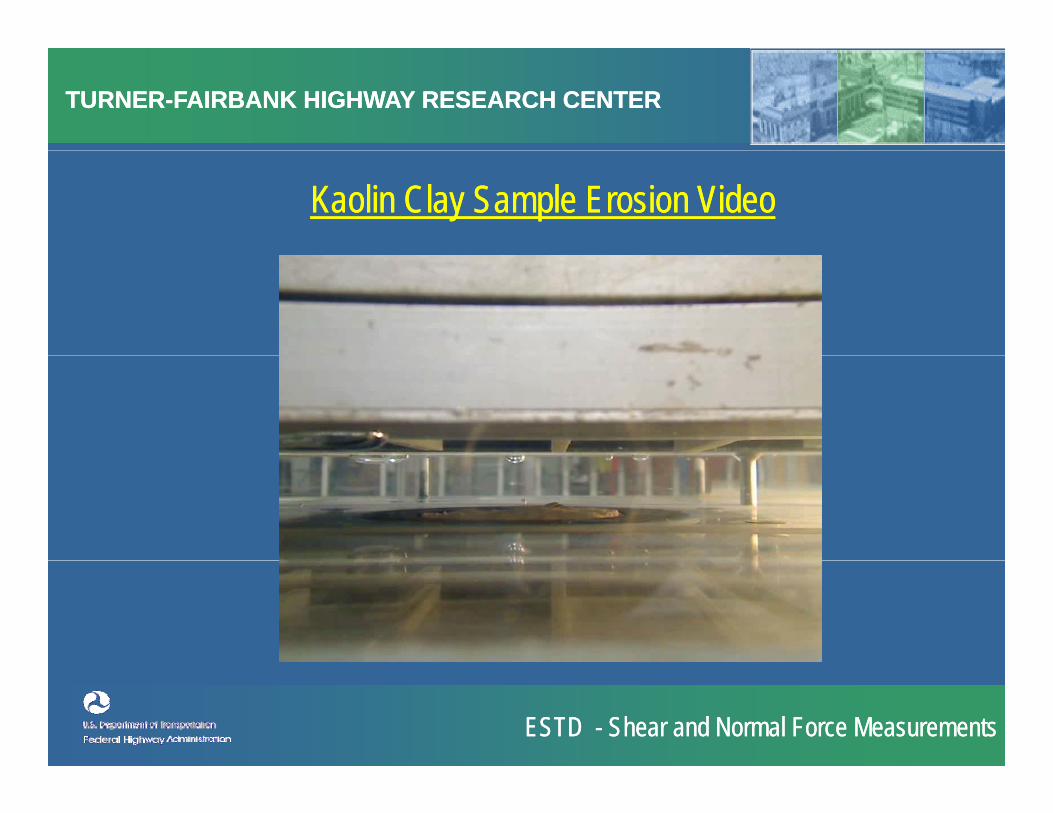
Kaolin Clay Sample Erosion VideoKaolin Clay Sample Erosion Video
ESTD - Shear and Normal Force MeasurementsESTD - Shear and Normal Force Measurements

TURNER-FAIRBANK HIGHWAY RESEARCH CENTERTURNER-FAIRBANK HIGHWAY RESEARCH CENTER
Normal stresses during the erosion of a Kaolin clay sampleNormal stresses during the erosion of a Kaolin clay sample
V 1 0 [m/s]VAVG= 1.0 [m/s]
ESTD - Shear and Normal Force MeasurementsESTD - Shear and Normal Force Measurements

TURNER-FAIRBANK HIGHWAY RESEARCH CENTERTURNER-FAIRBANK HIGHWAY RESEARCH CENTER
Weight loss during the erosion of a Kaolin clay sampleWeight loss during the erosion of a Kaolin clay sample
ESTD - Shear and Normal Force MeasurementsESTD - Shear and Normal Force Measurements

TURNER-FAIRBANK HIGHWAY RESEARCH CENTERTURNER-FAIRBANK HIGHWAY RESEARCH CENTER
Shear stresses during the erosion of a Kaolin clay sampleShear stresses during the erosion of a Kaolin clay sample
VAVG= 1.0 [m/s]
ESTD - Shear and Normal Force MeasurementsESTD - Shear and Normal Force Measurements

TURNER-FAIRBANK HIGHWAY RESEARCH CENTERTURNER-FAIRBANK HIGHWAY RESEARCH CENTER
Fish Passage in Large Culverts with Low Flows Fish Passage in Large Culverts with Low Flows
Fish Passage in Large Culverts with Low FlowsFish Passage in Large Culverts with Low Flows

TURNER-FAIRBANK HIGHWAY RESEARCH CENTERTURNER-FAIRBANK HIGHWAY RESEARCH CENTER
CFD Multi Phase Model versus Single Phase Model CFD Multi Phase Model versus Single Phase Model
Fish Passage in Large Culverts with Low FlowsFish Passage in Large Culverts with Low Flows

TURNER-FAIRBANK HIGHWAY RESEARCH CENTERTURNER-FAIRBANK HIGHWAY RESEARCH CENTER
CFD (Single Phase) CFD (Single Phase) ( g )Validationwith PIV
( g )Validationwith PIV CFD
PIV
Fish Passage in Large Culverts with Low FlowsFish Passage in Large Culverts with Low Flows

TURNER-FAIRBANK HIGHWAY RESEARCH CENTERTURNER-FAIRBANK HIGHWAY RESEARCH CENTER
Proposed Design Charts Proposed Design Charts
CFD
Fish Passage in Large Culverts with Low FlowsFish Passage in Large Culverts with Low Flows

TURNER-FAIRBANK HIGHWAY RESEARCH CENTERTURNER-FAIRBANK HIGHWAY RESEARCH CENTER
Proposed Design Charts (cont’d) Proposed Design Charts (cont’d) 1.0
0.7
0.8
0.9
0.4
0.5
0.6
Vi / VAVG
0.1
0.2
0.3
0.00.00.10.20.30.40.50.60.70.8
Distance from Center / Radius
Fish Passage in Large Culverts with Low FlowsFish Passage in Large Culverts with Low Flows
TURNER-FAIRBANK HIGHWAY RESEARCH CENTERTURNER-FAIRBANK HIGHWAY RESEARCH CENTER
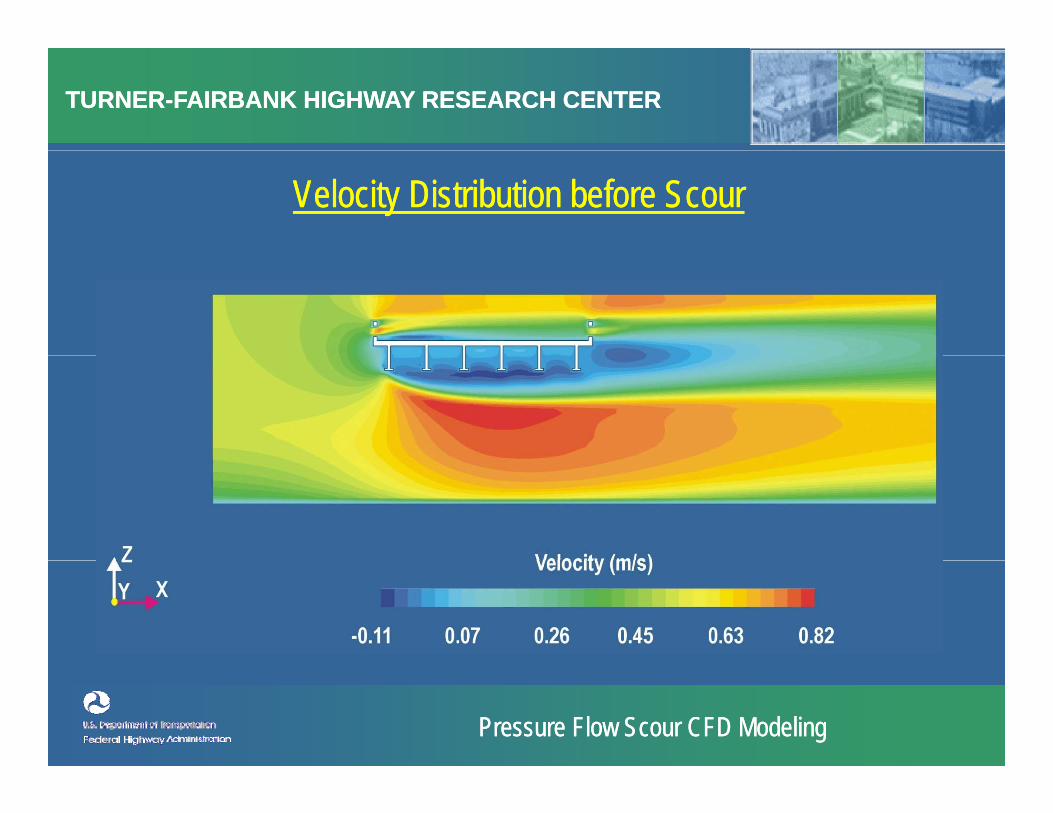
Velocity Distribution before Scour Velocity Distribution before Scour
Pressure Flow Scour CFD Modeling Pressure Flow Scour CFD Modeling

TURNER-FAIRBANK HIGHWAY RESEARCH CENTERTURNER-FAIRBANK HIGHWAY RESEARCH CENTER
Shear Stress Distribution before Scour Shear Stress Distribution before Scour
3
3.5
4
2
2.5
3
ear S
tres:
(Pa)
0 5
1
1.5
Wall
She
0
0.5
0 1 2 3 4 5 6
Position (m)Position (m)
Pressure Flow Scour CFD Modeling Pressure Flow Scour CFD Modeling

TURNER-FAIRBANK HIGHWAY RESEARCH CENTERTURNER-FAIRBANK HIGHWAY RESEARCH CENTER
Morphing with Kinetic Entrainment Rate Function used for Equilibrium Scour Profile
Morphing with Kinetic Entrainment Rate Function used for Equilibrium Scour Profile
Pressure Flow Scour CFD Modeling Pressure Flow Scour CFD Modeling

TURNER-FAIRBANK HIGHWAY RESEARCH CENTERTURNER-FAIRBANK HIGHWAY RESEARCH CENTER
Shear Stress Distribution for Equilibrium Scour Profile Shear Stress Distribution for Equilibrium Scour Profile
2.5
1.5
2
Stre
s: (P
a)
0.5
1
Wall
She
ar
00 1 2 3 4 5 6
Position (m)
Pressure Flow Scour CFD Modeling Pressure Flow Scour CFD Modeling

TURNER-FAIRBANK HIGHWAY RESEARCH CENTERTURNER-FAIRBANK HIGHWAY RESEARCH CENTER
CFD DES/LES Pier Modeling for Flat Bed Case CFD DES/LES Pier Modeling for Flat Bed Case
Physical Modeling CFD Modeling Pressure Distribution on Pier
Pier Scour LES CFD Modeling Pier Scour LES CFD Modeling
TURNER-FAIRBANK HIGHWAY RESEARCH CENTERTURNER-FAIRBANK HIGHWAY RESEARCH CENTER
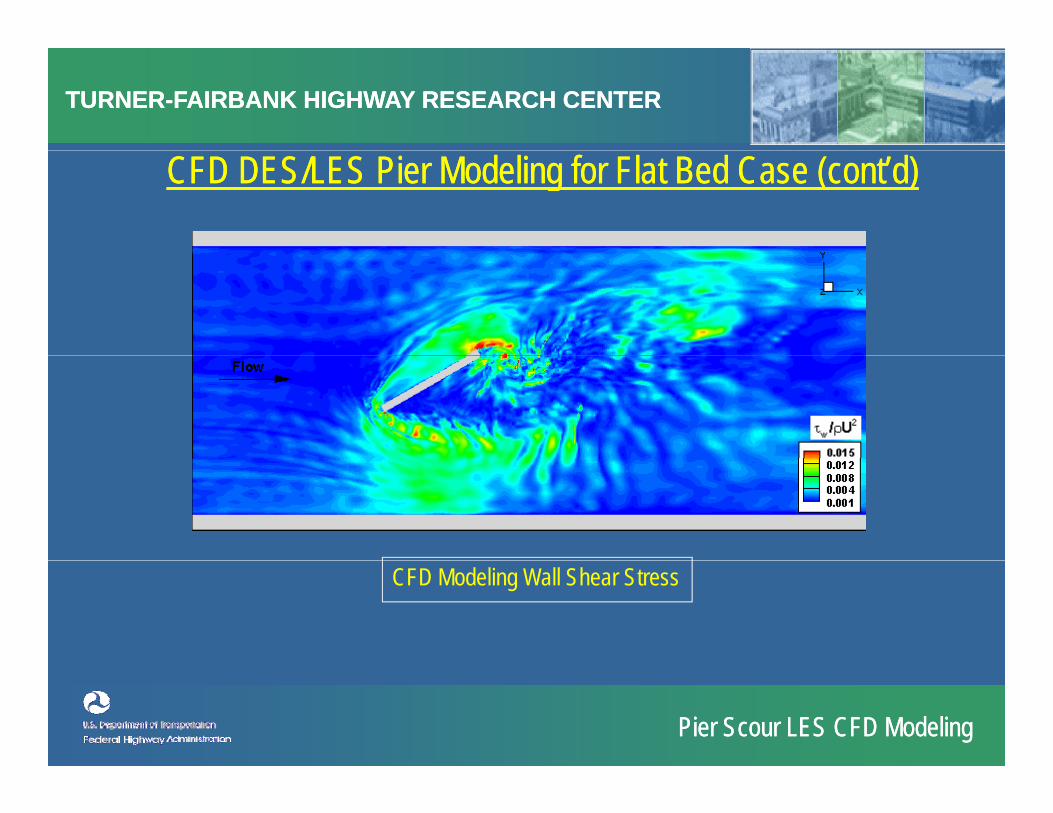
CFD DES/LES Pier Modeling for Flat Bed Case (cont’d) CFD DES/LES Pier Modeling for Flat Bed Case (cont’d)
CFD Modeling Wall Shear Stress
Pier Scour LES CFD Modeling Pier Scour LES CFD Modeling

TURNER-FAIRBANK HIGHWAY RESEARCH CENTERTURNER-FAIRBANK HIGHWAY RESEARCH CENTER
CFD DES/LES Pier Modeling for Flat Bed Case (cont’d) CFD DES/LES Pier Modeling for Flat Bed Case (cont’d)
CFD Modeling Horseshoe Vortex Vertical Plane with Streamlines
Pier Scour LES CFD Modeling Pier Scour LES CFD Modeling

TURNER-FAIRBANK HIGHWAY RESEARCH CENTERTURNER-FAIRBANK HIGHWAY RESEARCH CENTER
CFD DES/LES Pier Modeling for Maximum Scour CFD DES/LES Pier Modeling for Maximum Scour
Physical Modeling CFD Modeling Pressure Distribution on Pier
Pier Scour LES CFD Modeling Pier Scour LES CFD Modeling

TURNER-FAIRBANK HIGHWAY RESEARCH CENTERTURNER-FAIRBANK HIGHWAY RESEARCH CENTER
CFD DES/LES Pier Modeling for Maximum Scour (cont’d) CFD DES/LES Pier Modeling for Maximum Scour (cont’d)
CFD Modeling Wall Shear Stress
Pier Scour LES CFD Modeling Pier Scour LES CFD Modeling

TURNER-FAIRBANK HIGHWAY RESEARCH CENTERTURNER-FAIRBANK HIGHWAY RESEARCH CENTER
CFD DES/LES Pier Modeling for Maximum Scour (cont’d) CFD DES/LES Pier Modeling for Maximum Scour (cont’d)
CFD Modeling Horseshoe Vortex Vertical Plane with Streamlines
Pier Scour LES CFD Modeling Pier Scour LES CFD Modeling
TURNER-FAIRBANK HIGHWAY RESEARCH CENTERTURNER-FAIRBANK HIGHWAY RESEARCH CENTER
Examples of Completed Applied Hydraulics R&D studiesExamples of Completed Applied Hydraulics R&D studiesExamples of Completed Applied Hydraulics R&D studiesExamples of Completed Applied Hydraulics R&D studies
• Hydrodynamic Forces on Submerged Bridge Decks Hydrodynamic Forces on Submerged Bridge Decks • Wave Forces on Bridge Decks
Examples of Applied Hydraulics R&D ProjectsExamples of Applied Hydraulics R&D Projects

TURNER-FAIRBANK HIGHWAY RESEARCH CENTERTURNER-FAIRBANK HIGHWAY RESEARCH CENTER
Current Loads on SuperstructureCurrent Loads on Superstructure
Drag, Lift and Moments on Inundated Bridge DecksDrag, Lift and Moments on Inundated Bridge Decks

TURNER-FAIRBANK HIGHWAY RESEARCH CENTERTURNER-FAIRBANK HIGHWAY RESEARCH CENTER
Definition SketchDefinition Sketch
Drag, Lift and Moments on Inundated Bridge DecksDrag, Lift and Moments on Inundated Bridge Decks

TURNER-FAIRBANK HIGHWAY RESEARCH CENTERTURNER-FAIRBANK HIGHWAY RESEARCH CENTER
2D PIV for Pressure Flow2D PIV for Pressure Flow

TURNER-FAIRBANK HIGHWAY RESEARCH CENTERTURNER-FAIRBANK HIGHWAY RESEARCH CENTER
Velocity Flow Field using PIVVelocity Flow Field using PIV

TURNER-FAIRBANK HIGHWAY RESEARCH CENTERTURNER-FAIRBANK HIGHWAY RESEARCH CENTER
Velocity Flow Field using HP CFD ModelingVelocity Flow Field using HP CFD Modeling

TURNER-FAIRBANK HIGHWAY RESEARCH CENTERTURNER-FAIRBANK HIGHWAY RESEARCH CENTER
Definition Drag, Lift and Moment CoefficientsDefinition Drag, Lift and Moment Coefficients
1*hfor;LsV5.0
FC 2D
D
F 1*hfor;*hLsV5.0
FC 2D
D
LWV5.0FC 2
LL
LWV5.0MC 22M
Drag, Lift and Moments on Inundated Bridge DecksDrag, Lift and Moments on Inundated Bridge Decks

TURNER-FAIRBANK HIGHWAY RESEARCH CENTERTURNER-FAIRBANK HIGHWAY RESEARCH CENTER
3.5
Drag Force CoefficientsDrag Force Coefficients
2.5
3
C D
1.5
2
Coef
ficien
t C
0 5
1Drag
C
Fr=0.22 Rs=20292Fr=0.32 Rs=28965Fitting EquationSTAR-CDFl t LES
0
0.5
0 0.5 1 1.5 2 2.5 3 3.5h*
Fluent-LESFluent-K-Epsilon
h
Drag, Lift and Moments on Inundated Bridge DecksDrag, Lift and Moments on Inundated Bridge Decks

TURNER-FAIRBANK HIGHWAY RESEARCH CENTERTURNER-FAIRBANK HIGHWAY RESEARCH CENTER
0.4
Lift Force CoefficientsLift Force Coefficients
0 4-0.2
00.2
L
-1-0.8-0.6-0.4
Coef
ficien
t CL
-1.6-1.4-1.2
-1
Lift
C
Fr=0.22 Rs=20292Fr=0.32 Rs=28965Fitting EquationSTAR-CD
-2-1.8
0 0.5 1 1.5 2 2.5 3 3.5h*
Fluent-LESFluent-K-Epsilon
h*
Drag, Lift and Moments on Inundated Bridge DecksDrag, Lift and Moments on Inundated Bridge Decks

TURNER-FAIRBANK HIGHWAY RESEARCH CENTERTURNER-FAIRBANK HIGHWAY RESEARCH CENTER
0.4
Moment CoefficientsMoment Coefficients
0 2
0.3
CM
0.1
0.2
t Coe
fficie
nt
-0.1
0
Mom
ent
Fr=0.22 Rs=20292Fr=0.32 Rs=28965Fitting EquationStar-CD
-0.2
0.1
0 0.5 1 1.5 2 2.5 3 3.5h*
Star-CDFluent-LESFluent-K-Epsilon
h*
Drag, Lift and Moments on Inundated Bridge DecksDrag, Lift and Moments on Inundated Bridge Decks

TURNER-FAIRBANK HIGHWAY RESEARCH CENTERTURNER-FAIRBANK HIGHWAY RESEARCH CENTER
Summary of the Hydrodynamic Bridge Deck PerformanceSummary of the Hydrodynamic Bridge Deck Performance
Bridge Deck Shape CD CM
2.2 0.62
2.0 0.65
1.0 0.25
Drag, Lift and Moments on Inundated Bridge DecksDrag, Lift and Moments on Inundated Bridge Decks
TURNER-FAIRBANK HIGHWAY RESEARCH CENTERTURNER-FAIRBANK HIGHWAY RESEARCH CENTER
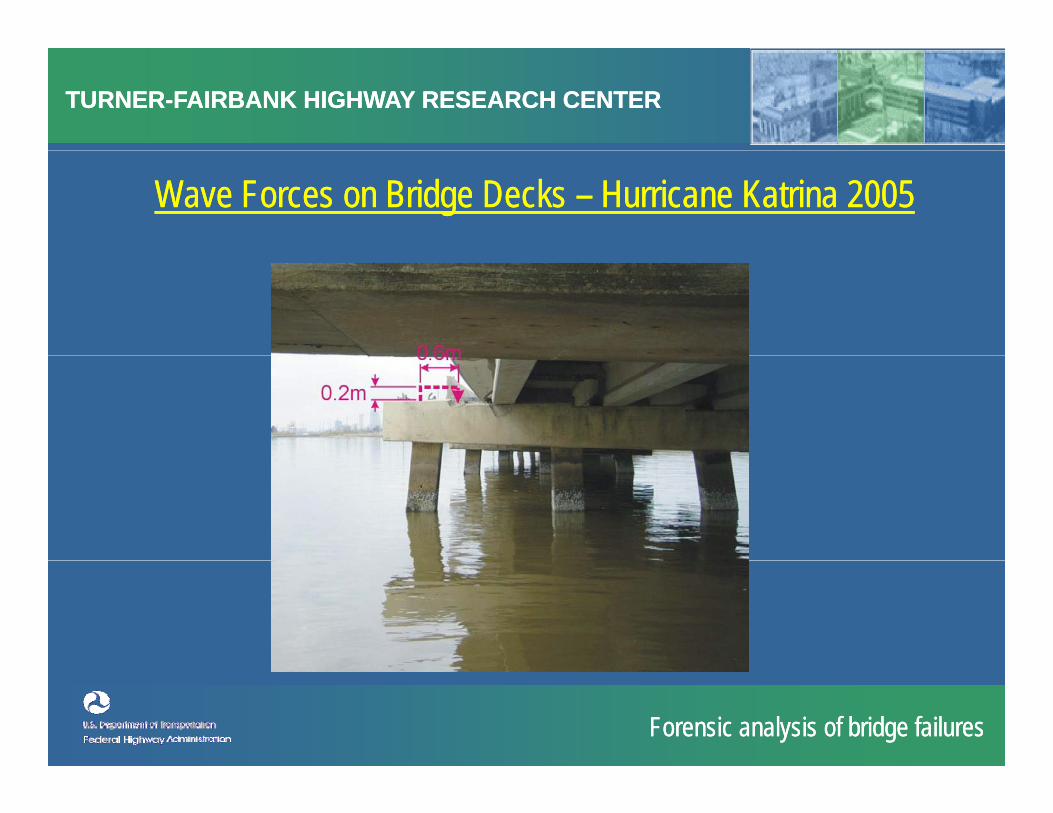
Wave Forces on Bridge Decks – Hurricane Katrina 2005 Wave Forces on Bridge Decks – Hurricane Katrina 2005
Forensic analysis of bridge failures Forensic analysis of bridge failures

TURNER-FAIRBANK HIGHWAY RESEARCH CENTERTURNER-FAIRBANK HIGHWAY RESEARCH CENTER
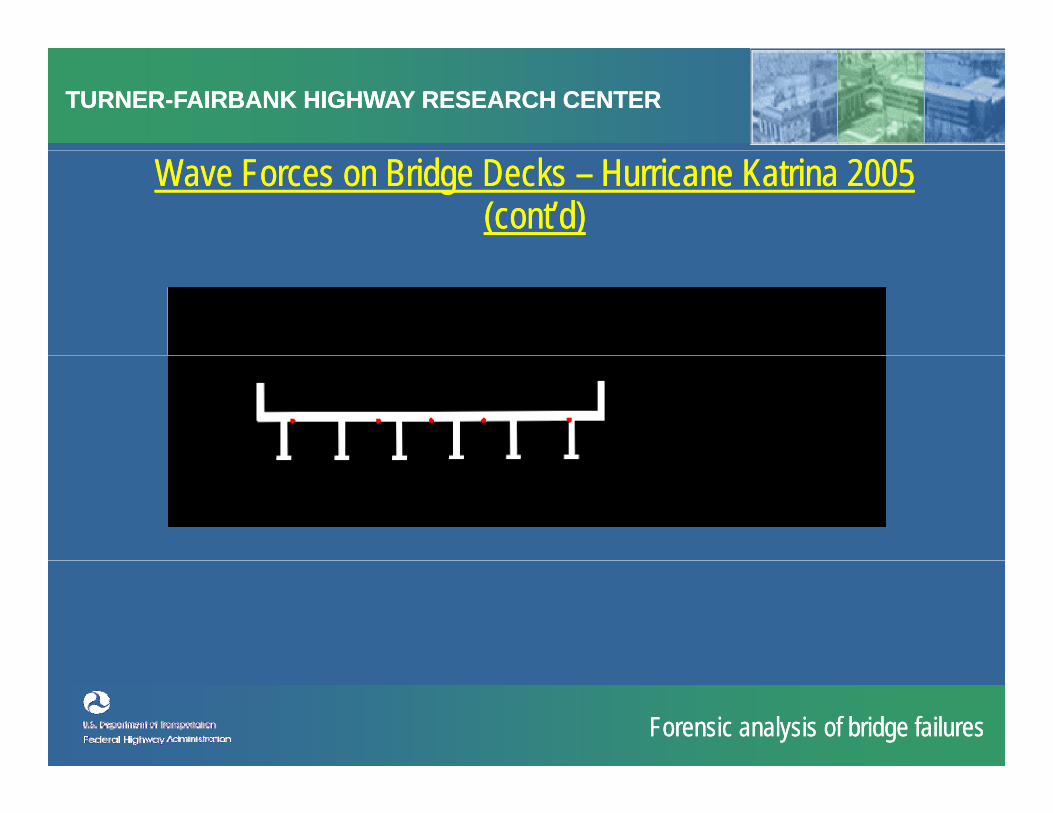
Wave Forces on Bridge Decks – Hurricane Katrina 2005 (cont’d)
Wave Forces on Bridge Decks – Hurricane Katrina 2005 (cont’d)
Forensic analysis of bridge failures Forensic analysis of bridge failures

TURNER-FAIRBANK HIGHWAY RESEARCH CENTERTURNER-FAIRBANK HIGHWAY RESEARCH CENTER
Wave Forces on Bridge Decks – Hurricane Katrina 2005 (cont’d)
Wave Forces on Bridge Decks – Hurricane Katrina 2005 (cont’d)
Forensic analysis of bridge failures Forensic analysis of bridge failures
TURNER-FAIRBANK HIGHWAY RESEARCH CENTERTURNER-FAIRBANK HIGHWAY RESEARCH CENTER
Wave Forces on Bridge Decks – Hurricane Katrina 2005 (cont’d)
Wave Forces on Bridge Decks – Hurricane Katrina 2005 (cont’d)
Forensic analysis of bridge failures Forensic analysis of bridge failures
TURNER-FAIRBANK HIGHWAY RESEARCH CENTERTURNER-FAIRBANK HIGHWAY RESEARCH CENTER
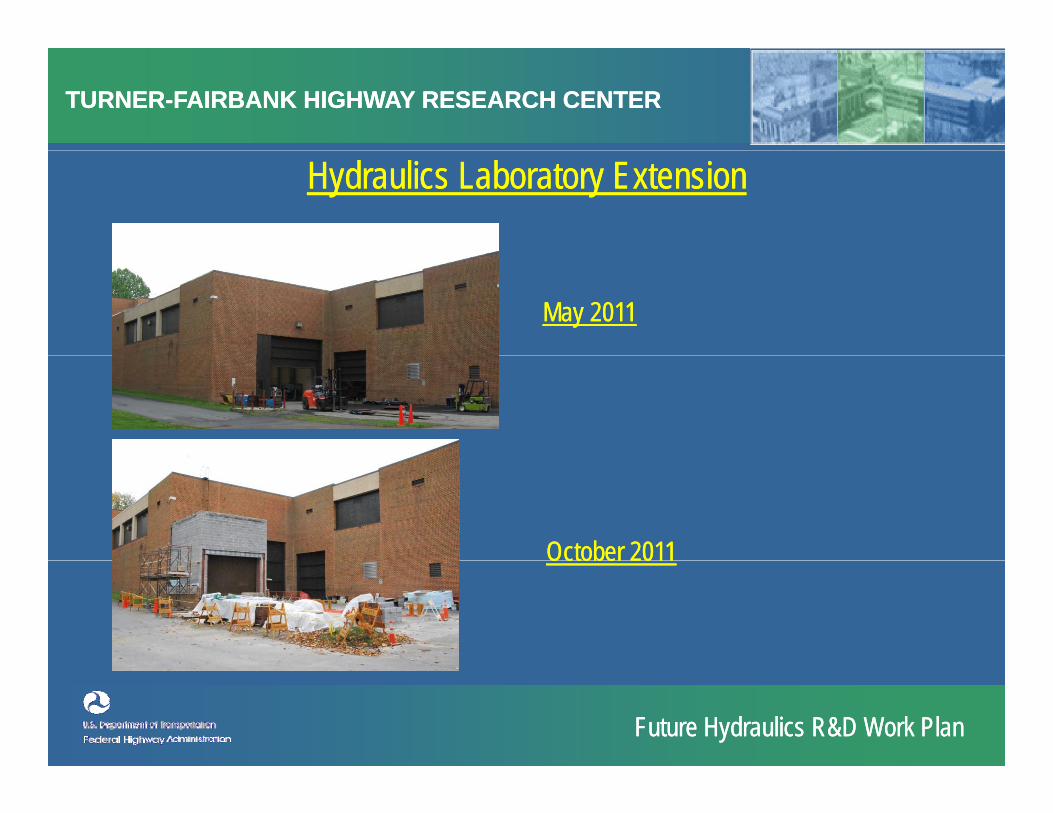
Hydraulics Laboratory ExtensionHydraulics Laboratory Extension
May 2011May 2011
October 2011October 2011October 2011October 2011
Future Hydraulics R&D Work PlanFuture Hydraulics R&D Work Plan
TURNER-FAIRBANK HIGHWAY RESEARCH CENTERTURNER-FAIRBANK HIGHWAY RESEARCH CENTER
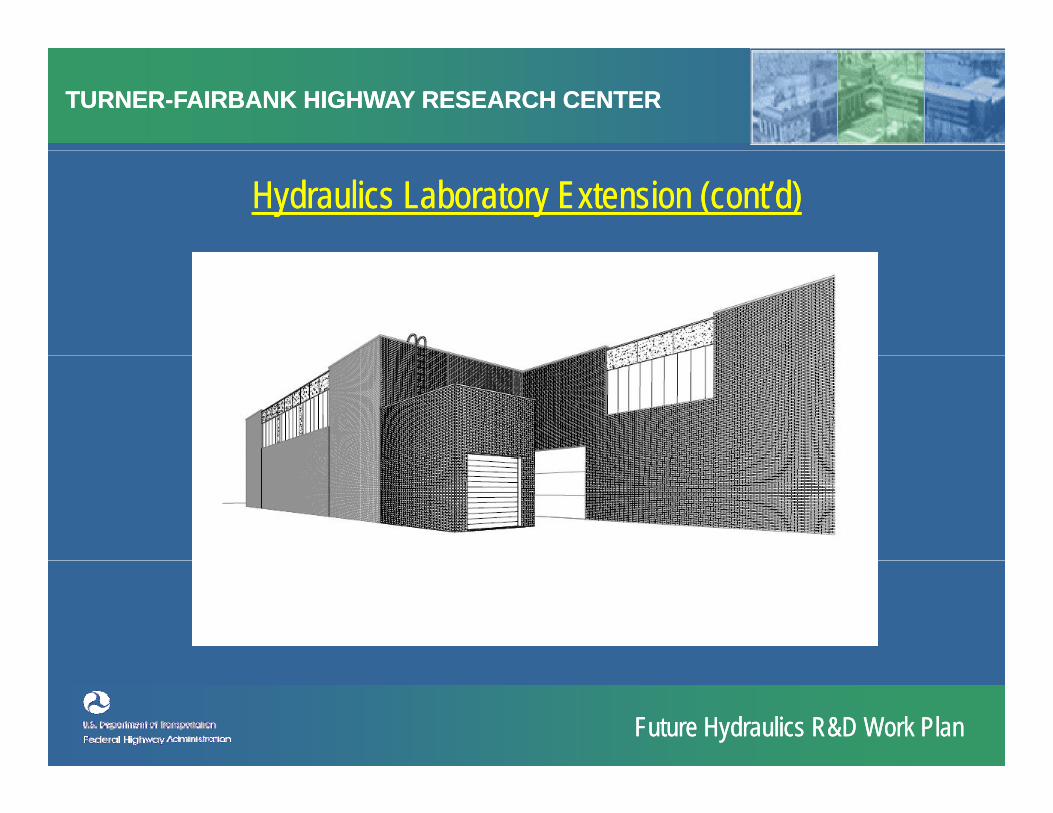
Hydraulics Laboratory Extension (cont’d)Hydraulics Laboratory Extension (cont’d)
Future Hydraulics R&D Work PlanFuture Hydraulics R&D Work Plan

TURNER-FAIRBANK HIGHWAY RESEARCH CENTERTURNER-FAIRBANK HIGHWAY RESEARCH CENTER
New Sediment Recirculation FlumeNew Sediment Recirculation Flume
Future Hydraulics R&D Work PlanFuture Hydraulics R&D Work Plan

TURNER-FAIRBANK HIGHWAY RESEARCH CENTERTURNER-FAIRBANK HIGHWAY RESEARCH CENTER
New Sediment Recirculation Flume (cont’d)New Sediment Recirculation Flume (cont’d)
Future Hydraulics R&D Work PlanFuture Hydraulics R&D Work Plan

TURNER-FAIRBANK HIGHWAY RESEARCH CENTERTURNER-FAIRBANK HIGHWAY RESEARCH CENTER
New Sediment Recirculation FlumeNew Sediment Recirculation Flume
Future Hydraulics R&D Work PlanFuture Hydraulics R&D Work Plan
TURNER-FAIRBANK HIGHWAY RESEARCH CENTERTURNER-FAIRBANK HIGHWAY RESEARCH CENTER
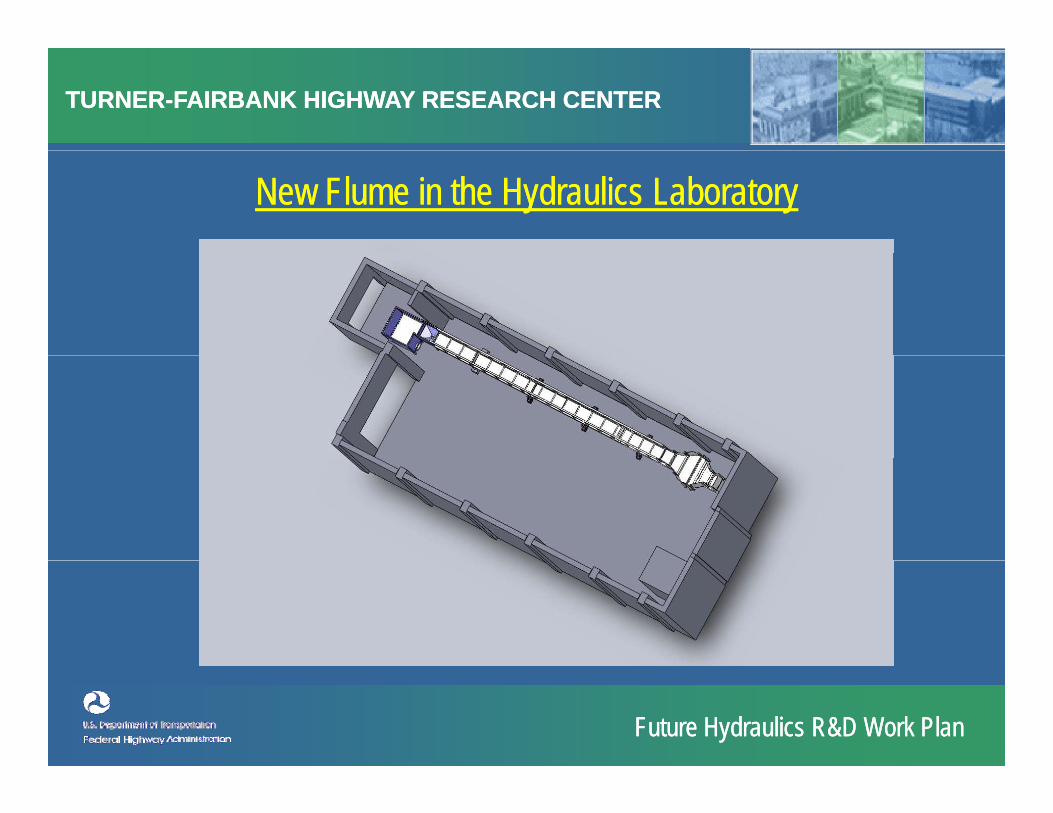
New Flume in the Hydraulics Laboratory New Flume in the Hydraulics Laboratory
Future Hydraulics R&D Work PlanFuture Hydraulics R&D Work Plan
TURNER-FAIRBANK HIGHWAY RESEARCH CENTERTURNER-FAIRBANK HIGHWAY RESEARCH CENTER
Questions?Questions?
Research that is Essential, Indispensable, and Connected to our Customers
Research that is Essential, Indispensable, and Connected to our Customers