fidelity variable insurance products - assets.nsre.com€¦ · a fund files its complete schedule...
TRANSCRIPT

Fidelity® Variable Insurance Products:
Growth Opportunities Portfolio
Annual ReportDecember 31, 2017

Annual Report
Performance 3Management’s Discussion of Fund Performance 4Investment Summary 5Investments 6Financial Statements 11Notes to Financial Statements 17Report of Independent Registered Public Accounting Firm
23
Trustees and Officers 24Shareholder Expense Example 31Distributions 32Board Approval of Investment Advisory Contracts and Management Fees
33
To view a fund’s proxy voting guidelines and proxy voting record for the 12-month period ended June 30, visit http://www.fidelity.com/proxyvotingresults or visit the Securities and Exchange Commission’s (SEC) web site at http://www.sec.gov.You may also call 1-877-208-0098 to request a free copy of the proxy voting guidelines.Fidelity® Variable Insurance Products are separate account options which are purchased through a variable insurance contract.Standard & Poor’s, S&P and S&P 500 are registered service marks of The McGraw-Hill Companies, Inc. and have been licensed for use by Fidelity Distributors Corporation.Other third-party marks appearing herein are the property of their respective owners.All other marks appearing herein are registered or unregistered trademarks or service marks of FMR LLC or an affiliated company. © 2018 FMR LLC. All rights reserved.
Contents
This report and the financial statements contained herein are submitted for the general information of the shareholders of the Fund. This report is not authorized for distribution to prospective investors in the Fund unless preceded or accompanied by an effective prospectus.A fund files its complete schedule of portfolio holdings with the SEC for the first and third quarters of each fiscal year on Form N-Q. Forms N-Q are available on the SEC’s web site at http://www.sec.gov. A fund’s Forms N-Q may be reviewed and copied at the SEC’s Public Reference Room in Washington, DC. Information regarding the operation of the SEC’s Public Reference Room may be obtained by calling 1-800-SEC-0330.For a complete list of a fund’s portfolio holdings, view the most recent holdings listing, semiannual report, or annual report on Fidelity’s web site at http://www.fidelity.com, http://www.institutional.fidelity.com, or http://www.401k.com, as applicable.NOT FDIC INSURED •MAY LOSE VALUE •NO BANK GUARANTEENeither the Fund nor Fidelity Distributors Corporation is a bank.

3 Annual Report
Performance: The Bottom Line
Average annual total return reflects the change in the value of an investment, assuming reinvestment of distributions from dividend income and capital gains (the profits earned upon the sale of securities that have grown in value, if any) and assuming a constant rate of performance each year. During periods of reimbursement by Fidelity, a fund’s total return will be greater than it would be had the reimbursement not occurred. Performance numbers are net of all underlying fund operating expenses, but do not include any insurance charges imposed by your insurance company’s separate account. If performance information included the effect of these additional charges, the total returns would have been lower. How a fund did yesterday is no guarantee of how it will do tomorrow.
Average Annual Total Returns
For the periods ended December 31, 2017 Past 1 year
Past 5 years
Past 10 years
Initial Class 34.47% 17.14% 8.16%Service Class 34.36% 17.03% 8.05%Service Class 2 34.17% 16.85% 7.89%Investor Class 34.38% 17.04% 8.06%
$10,000 Over 10 Years
Let’s say hypothetically that $10,000 was invested in VIP Growth Opportunities Portfolio – Initial Class on December 31, 2007.
The chart shows how the value of your investment would have changed, and also shows how the Russell 1000® Growth Index performed over the same period.
Period Ending Values
$21,906 VIP Growth Opportunities Portfolio – Initial Class
$25,930 Russell 1000® Growth Index

4Annual Report
Management’s Discussion of Fund Performance
Market Recap: U.S. equities gained 21.83% in 2017, as the S&P 500® index rose steadily and closed the year just shy of an all-time high after a particularly strong three-month finish. Early on, equities rallied on optimism for President Trump’s pro-business agenda but leveled off in March amid fading optimism and stalled efforts by Congress to repeal and replace the Affordable Care Act. Upward momentum soon returned and continued through year-end with consumer sentiment and other market indicators staying positive. The lone exception was a brief cooldown in August, when geopolitical tension escalated and uncertainty grew regarding the future of health care, tax reform and the debt ceiling. Sector-wise, information technology fared best by a wide margin, rising 39% amid strong earnings growth from several major index constituents. A 24% gain in materials was spurred by increased demand, especially from China. Consumer discretionary gained 23%, despite many brick-and-mortar retailers suffering from online competition, and financials edged the broader market on an uptick in bond yields. Conversely, the defensive energy and telecom services sectors returned about -1% each. Rising interest rates held back real estate (+11%), while consumer staples (+13%) and utilities (+12%) struggled due to investors’ general preference for risk assets.
Comments from Portfolio Manager Kyle Weaver: For the year, the fund’s share classes gained roughly 34%, handily topping the 30.21% advance of the benchmark Russell 1000® Growth Index. Versus the benchmark, stock picking in the consumer discretionary sector was the largest positive, fol-lowed by choices in consumer staples, real estate and financials. In information technology, my picks detracted, but this negative was more than offset by my decision to overweight this top-performing group. Overall, active management added value in eight of 11 market sectors. The biggest individual rela-tive contributor was electric-vehicle manufacturer Tesla, whose stock was lifted by growing optimism about prospects for its Model 3 sedan, launched in July. A small private investment in JUUL Labs also paid off. We saw the value of our non-benchmark position in this leading e-cigarette maker rise along with the growing popularity of tobacco-free smoking. Options-market exchange CBOE Global Markets was another contributor. Conversely, positioning in industrials hampered our relative result, and overweighting the energy sector detracted modestly. At the stock level, Allergan –removed from the fund’s benchmark in June – was our biggest relative detractor. An overweighting in Alexion Pharmaceuticals further disappointed, along with a non-benchmark stake in Spirit Airlines.
The views expressed above reflect those of the portfolio manager(s) only through the end of the period as stated on the cover of this report and do not necessarily represent the views of Fidelity or any other person in the Fidelity organization. Any such views are subject to change at any time based upon market or other conditions and Fidelity disclaims any responsibility to update such views. These views may not be relied on as investment advice and, because investment decisions for a Fidelity fund are based on numerous factors, may not be relied on as an indication of trading intent on behalf of any Fidelity fund.

5 Annual Report
Investment Summary (Unaudited)
Top Ten Stocks as of December 31, 2017
% of fund’s net assets
Apple, Inc. 6.4Microsoft Corp. 4.7Alphabet, Inc. Class C 4.5Facebook, Inc. Class A 3.8Amazon.com, Inc. 3.8American Tower Corp. 2.5Alphabet, Inc. Class A 2.4T-Mobile U.S., Inc. 2.2Salesforce.com, Inc. 2.1LyondellBasell Industries NV Class A 1.9
34.3
Top Five Market Sectors as of December 31, 2017
% of fund’s net assets
Information Technology 49.3Health Care 13.9Consumer Discretionary 12.4Consumer Staples 5.4Materials 4.4
Asset Allocation (% of fund’s net assets)
As of December 31, 2017*
Stocks 99.9%
Short-Term Investments and Net Other Assets (Liabilities) 0.1%
* Foreign investments – 13.9%

6Annual Report
See accompanying notes which are an integral part of the financial statements.
Common Stocks – 98.8%Shares Value
CONSUMER DISCRETIONARY – 12.4%Automobiles – 1.6%Tesla, Inc. (a) (b) 35,897 $ 11,176,531Hotels, Restaurants & Leisure – 1.2%Compass Group PLC 1,600 34,564Starbucks Corp. 30,064 1,726,576U.S. Foods Holding Corp. (a) 204,165 6,518,988
8,280,128Household Durables – 0.2%Roku, Inc. Class A (b) 31,400 1,625,892Internet & Direct Marketing Retail – 6.4%Amazon.com, Inc. (a) 22,773 26,632,340Blue Apron Holdings, Inc.:
Class A 1,039 4,187Class B 83,090 331,504
Groupon, Inc. (a) (b) 370,800 1,891,080Netflix, Inc. (a) 37,300 7,160,108Priceline Group, Inc. (a) 750 1,303,305Vipshop Holdings Ltd. ADR (a) 358,700 4,203,964Wayfair LLC Class A (a) 47,502 3,812,986
45,339,474Media – 1.7%Charter Communications, Inc.
Class A (a) 27,063 9,092,085Comcast Corp. Class A 36,078 1,444,924Naspers Ltd. Class N 600 167,355The Walt Disney Co. 3,000 322,530Vivendi SA 43,900 1,180,938
12,207,832Multiline Retail – 0.4%Dollar Tree, Inc. (a) 28,200 3,026,142Specialty Retail – 0.6%Home Depot, Inc. 14,010 2,655,315TJX Companies, Inc. 23,300 1,781,518
4,436,833Textiles, Apparel & Luxury Goods – 0.3%lululemon athletica, Inc. (a) 23,272 1,828,946
TOTAL CONSUMER DISCRETIONARY 87,921,778
CONSUMER STAPLES – 4.7%Beverages – 0.7%Constellation Brands, Inc. Class A (sub.
vtg.) 11,500 2,628,555Monster Beverage Corp. (a) 23,195 1,468,012The Coca-Cola Co. 21,069 966,646
5,063,213Food & Staples Retailing – 1.8%Costco Wholesale Corp. 10,900 2,028,708CVS Health Corp. 15,200 1,102,000Performance Food Group Co. (a) 292,308 9,675,395
12,806,103Food Products – 0.0%Kerry Group PLC Class A 1,100 123,405Personal Products – 0.3%Unilever NV (Certificaten Van
Aandelen) (Bearer) 30,600 1,722,872
Investments December 31, 2017Showing Percentage of Net Assets
Shares Value
Tobacco – 1.9%British American Tobacco PLC (United
Kingdom) 155,800 $ 10,555,532JUUL Labs, Inc. (c) 560 12,331Philip Morris International, Inc. 25,500 2,694,075
13,261,938
TOTAL CONSUMER STAPLES 32,977,531
ENERGY – 1.8%Oil, Gas & Consumable Fuels – 1.8%Petronet LNG Ltd. 905,861 3,614,788Reliance Industries Ltd. 493,733 7,123,320Teekay LNG Partners LP 49,100 989,365Williams Partners LP 29,200 1,132,376
12,859,849
FINANCIALS – 4.2%Banks – 0.3%HDFC Bank Ltd. sponsored ADR 23,400 2,379,078Capital Markets – 3.6%BlackRock, Inc. Class A 14,700 7,551,537CBOE Holdings, Inc. 57,400 7,151,466Charles Schwab Corp. 82,200 4,222,614MSCI, Inc. 3,000 379,620S&P Global, Inc. 2,300 389,620TD Ameritrade Holding Corp. 115,100 5,885,063
25,579,920Consumer Finance – 0.3%Synchrony Financial 46,700 1,803,087
TOTAL FINANCIALS 29,762,085
HEALTH CARE – 13.9%Biotechnology – 8.3%ACADIA Pharmaceuticals, Inc. (a) 16,818 506,390Acorda Therapeutics, Inc. (a) 14,500 311,025Agios Pharmaceuticals, Inc. (a) 16,000 914,720Alexion Pharmaceuticals, Inc. (a) 86,552 10,350,754Alkermes PLC (a) 20,700 1,132,911Alnylam Pharmaceuticals, Inc. (a) 19,103 2,427,036Amgen, Inc. 64,759 11,261,590Amicus Therapeutics, Inc. (a) 57,300 824,547AnaptysBio, Inc. 13,000 1,309,360aTyr Pharma, Inc. (a) (d) 22,036 77,126BioMarin Pharmaceutical, Inc. (a) 26,800 2,389,756bluebird bio, Inc. (a) 14,930 2,659,033Blueprint Medicines Corp. (a) 1,400 105,574Coherus BioSciences, Inc. (a) 21,800 191,840Epizyme, Inc. (a) 6,900 86,595Five Prime Therapeutics, Inc. (a) 13,600 298,112Insmed, Inc. (a) 88,142 2,748,268Intercept Pharmaceuticals, Inc. (a) 2,500 146,050Ionis Pharmaceuticals, Inc. (a) 79,406 3,994,122Neurocrine Biosciences, Inc. (a) 41,788 3,242,331Opko Health, Inc. (a) 1 5Prothena Corp. PLC (a) 25,802 967,317

7 Annual Report
See accompanying notes which are an integral part of the financial statements.
Common Stocks – continuedShares Value
HEALTH CARE – continuedBiotechnology – continuedRegeneron Pharmaceuticals, Inc. (a) 10,000 $ 3,759,600Rigel Pharmaceuticals, Inc. (a) 111,406 432,255Sage Therapeutics, Inc. (a) 6,300 1,037,673Sarepta Therapeutics, Inc. (a) 19,600 1,090,544Sienna Biopharmaceuticals, Inc. (b) 10,920 198,198Spark Therapeutics, Inc. (a) 30,500 1,568,310TESARO, Inc. (a) (b) 28,900 2,394,943Vertex Pharmaceuticals, Inc. (a) 15,500 2,322,830Xencor, Inc. (a) 15,300 335,376
59,084,191Health Care Equipment & Supplies – 1.6%Boston Scientific Corp. (a) 301,200 7,466,748Danaher Corp. 17,900 1,661,478Insulet Corp. (a) 23,800 1,642,200Intuitive Surgical, Inc. (a) 1,800 656,892
11,427,318Health Care Providers & Services – 2.3%Anthem, Inc. 25,200 5,670,252Cigna Corp. 10,500 2,132,445Humana, Inc. 9,000 2,232,630OptiNose, Inc. (b) 12,100 228,690UnitedHealth Group, Inc. 25,700 5,665,822
15,929,839Health Care Technology – 0.3%athenahealth, Inc. (a) 17,756 2,362,258Pharmaceuticals – 1.4%Akcea Therapeutics, Inc. (b) 59,200 1,027,712Allergan PLC 35,063 5,735,606Bristol-Myers Squibb Co. 20,300 1,243,984Innoviva, Inc. (a) 52,400 743,556Theravance Biopharma, Inc. (a) (b) 35,000 976,150
9,727,008
TOTAL HEALTH CARE 98,530,614
INDUSTRIALS – 3.5%Air Freight & Logistics – 0.2%FedEx Corp. 4,400 1,097,976Airlines – 1.7%JetBlue Airways Corp. (a) 15,300 341,802Spirit Airlines, Inc. (a) 254,900 11,432,265
11,774,067Commercial Services & Supplies – 0.1%Copart, Inc. (a) 9,400 405,986Electrical Equipment – 0.2%Sunrun, Inc. (a) (b) 262,100 1,546,390Machinery – 0.3%Allison Transmission Holdings, Inc. 18,700 805,409Caterpillar, Inc. 9,500 1,497,010
2,302,419Professional Services – 0.2%TransUnion Holding Co., Inc. (a) 27,500 1,511,400
Shares Value
Trading Companies & Distributors – 0.8%Bunzl PLC 208,000 $ 5,818,822
TOTAL INDUSTRIALS 24,457,060
INFORMATION TECHNOLOGY – 49.0%Communications Equipment – 0.9%Carvana Co. Class A (b) 316,400 6,049,568Internet Software & Services – 15.4%2U, Inc. (a) 4,700 303,197Alibaba Group Holding Ltd.
sponsored ADR (a) 34,500 5,948,835Alphabet, Inc.:
Class A (a) 16,202 17,067,187Class C (a) 30,263 31,667,203
CarGurus, Inc. Class A (b) 1,100 32,978Cloudera, Inc. (b) 6,366 105,166Criteo SA sponsored ADR (a) 66,200 1,723,186Facebook, Inc. Class A (a) 151,310 26,700,163GoDaddy, Inc. (a) 112,820 5,672,590IAC/InterActiveCorp (a) 11,000 1,345,080MongoDB, Inc. Class B 41,407 1,106,064NetEase, Inc. ADR 1,200 414,084The Trade Desk, Inc. (a) (b) 151,400 6,923,522Wix.com Ltd. (a) 178,807 10,290,343
109,299,598IT Services – 9.6%Accenture PLC Class A 3,000 459,270Alliance Data Systems Corp. 39,800 10,088,504Cognizant Technology Solutions Corp.
Class A 110,164 7,823,847EPAM Systems, Inc. (a) 35,600 3,824,508Euronet Worldwide, Inc. (a) 42,700 3,598,329FleetCor Technologies, Inc. (a) 5,800 1,116,094Global Payments, Inc. 61,000 6,114,640Luxoft Holding, Inc. (a) 140,200 7,809,140MasterCard, Inc. Class A 52,400 7,931,264PayPal Holdings, Inc. (a) 70,700 5,204,934Vantiv, Inc. (a) 37,900 2,787,545Visa, Inc. Class A 98,600 11,242,372
68,000,447Semiconductors & Semiconductor Equipment – 4.1%Analog Devices, Inc. 32,600 2,902,378Broadcom Ltd. 36,100 9,274,090Cavium, Inc. (a) 5,400 452,682Micron Technology, Inc. (a) 115,700 4,757,584NVIDIA Corp. 26,300 5,089,050ON Semiconductor Corp. (a) 87,100 1,823,874Qualcomm, Inc. 53,300 3,412,266SolarEdge Technologies, Inc. (a) 29,035 1,090,264
28,802,188Software – 12.6%Activision Blizzard, Inc. 100,200 6,344,664Adobe Systems, Inc. (a) 49,500 8,674,380Altair Engineering, Inc. Class A (a) 2,900 69,368Autodesk, Inc. (a) 60,100 6,300,283Citrix Systems, Inc. (a) 12,100 1,064,800

8Annual Report
See accompanying notes which are an integral part of the financial statements.
Investments – continued
Common Stocks – continuedShares Value
INFORMATION TECHNOLOGY – continuedSoftware – continuedElectronic Arts, Inc. (a) 31,100 $ 3,267,366Intuit, Inc. 11,200 1,767,136Microsoft Corp. 385,749 32,996,969Red Hat, Inc. (a) 17,400 2,089,740Salesforce.com, Inc. (a) 144,377 14,759,661ServiceNow, Inc. (a) 56,300 7,340,957Workday, Inc. Class A (a) 45,200 4,598,648
89,273,972Technology Hardware, Storage & Peripherals – 6.4%Apple, Inc. 266,743 45,140,918
TOTAL INFORMATION TECHNOLOGY 346,566,691
MATERIALS – 4.4%Chemicals – 3.7%DowDuPont, Inc. 67,305 4,793,462LG Chemical Ltd. 9,186 3,485,495LyondellBasell Industries NV Class A 122,900 13,558,328The Chemours Co. LLC 88,200 4,415,292
26,252,577Containers & Packaging – 0.7%Ball Corp. 127,700 4,833,445
TOTAL MATERIALS 31,086,022
REAL ESTATE – 2.7%Equity Real Estate Investment Trusts (REITs) – 2.5%American Tower Corp. 122,800 17,519,876Real Estate Management & Development – 0.2%Redfin Corp. (b) 1,200 37,584Redfin Corp. 50,716 1,509,004
1,546,588
TOTAL REAL ESTATE 19,066,464
TELECOMMUNICATION SERVICES – 2.2%Wireless Telecommunication Services – 2.2%T-Mobile U.S., Inc. (a) 246,100 15,629,811
TOTAL COMMON STOCKS(Cost $424,841,079) 698,857,905
Preferred Stocks – 1.1%
Convertible Preferred Stocks – 1.1%
CONSUMER STAPLES – 0.7%Tobacco – 0.7%PAX Labs, Inc. Series C (a) (c) (e) 215,881 4,753,700
FINANCIALS – 0.1%Insurance – 0.1%Clover Health Series D (c) (e) 65,670 579,866
Shares Value
INFORMATION TECHNOLOGY – 0.3%Internet Software & Services – 0.3%Uber Technologies, Inc. Series D,
8.00% (a) (c) (e) 66,008 $ 2,304,999Software – 0.0%Cloudflare, Inc. Series D 8.00% (a) (c) (e) 5,997 32,924
TOTAL INFORMATION TECHNOLOGY 2,337,923
TOTAL CONVERTIBLE PREFERRED STOCKS 7,671,489
Nonconvertible Preferred Stocks – 0.0%
CONSUMER STAPLES – 0.0%Tobacco – 0.0%PAX Labs, Inc. Series A (c) (e) 215,881 278,486
TOTAL PREFERRED STOCKS(Cost $2,507,702) 7,949,975
Money Market Funds – 3.9%
Fidelity Cash Central Fund, 1.36% (f) 468,981 469,075Fidelity Securities Lending Cash Central
Fund 1.36% (f) (g) 27,007,181 27,012,582
TOTAL MONEY MARKET FUNDS(Cost $27,478,957) 27,481,657
TOTAL INVESTMENT IN SECURITIES – 103.8%(Cost $454,827,738) 734,289,537
NET OTHER ASSETS (LIABILITIES) – (3.8)% (26,833,902)NET ASSETS – 100% $707,455,635
Legend(a) Non-income producing
(b) Security or a portion of the security is on loan at period end.
(c) Level 3 security
(d) Security exempt from registration under Rule 144A of the Securities Act of 1933. These securities may be resold in transactions exempt from registration, normally to qualified institutional buyers. At the end of the period, the value of these securities amounted to $77,126 or 0.0% of net assets.
(e) Restricted securities – Investment in securities not registered under the Securities Act of 1933 (excluding 144A issues). At the end of the period, the value of restricted securities (excluding 144A issues) amounted to $7,949,975 or 1.1% of net assets.
(f) Affiliated fund that is generally available only to investment companies and other accounts managed by Fidelity Investments. The rate quoted is the annualized seven-day yield of the fund at period end. A complete unaudited listing of the fund’s holdings as of its most recent quarter end is available upon request. In addition, each Fidelity Central Fund’s financial statements, which are not covered by the Fund’s Report of Independent

9 Annual Report
See accompanying notes which are an integral part of the financial statements.
Registered Public Accounting Firm, are available on the SEC’s website or upon request.
(g) Investment made with cash collateral received from securities on loan.
Additional information on each restricted holding is as follows:
SecurityAcquisition
Date Acquisition Cost
Cloudflare, Inc. Series D 8.00% 11/5/14 $ 36,735
Clover Health Series D 6/7/17 $ 615,840
SecurityAcquisition
Date Acquisition Cost
PAX Labs, Inc. Series A 5/22/15 $ 159,752
PAX Labs, Inc. Series C 5/22/15 $ 671,390
Uber Technologies, Inc. Series D, 8.00% 6/6/14 $ 1,023,986
Affiliated Central FundsInformation regarding fiscal year to date income earned by the Fund from investments in Fidelity Central Funds is as follows:
Fund Income earnedFidelity Cash Central Fund $ 64,934Fidelity Securities Lending Cash Central Fund 1,158,834Total $ 1,223,768
Amounts in the income column in the above table include any capital gain distributions from underlying funds, which are presented in the corresponding line-item in the Statement of Operations if applicable.
Investment ValuationThe following is a summary of the inputs used, as of December 31, 2017, involving the Fund’s assets and liabilities carried at fair value. The inputs or methodology used for valuing securities may not be an indication of the risk associated with investing in those securities. For more information on valuation inputs, and their aggregation into the levels used below, please refer to the Investment Valuation section in the accompanying Notes to Financial Statements.
Valuation Inputs at Reporting Date:Description Total Level 1 Level 2 Level 3Investments in Securities:Equities:
Consumer Discretionary $ 87,921,778 $ 87,590,274 $ 331,504 $ —Consumer Staples 38,009,717 31,242,328 1,722,872 5,044,517Energy 12,859,849 12,859,849 — —Financials 30,341,951 29,762,085 — 579,866Health Care 98,530,614 98,530,614 — —Industrials 24,457,060 24,457,060 — —Information Technology 348,904,614 345,460,627 1,106,064 2,337,923Materials 31,086,022 31,086,022 — —Real Estate 19,066,464 17,557,460 1,509,004 —Telecommunication Services 15,629,811 15,629,811 — —
Money Market Funds 27,481,657 27,481,657 — —Total Investments in Securities: $ 734,289,537 $ 721,657,787 $ 4,669,444 $ 7,962,306
The following is a reconciliation of Investments in Securities for which Level 3 inputs were used in determining value:
Investments in Securities:Beginning Balance $ 6,224,800Net Realized Gain (Loss) on Investment Securities —Net Unrealized Gain (Loss) on Investment Securities 3,699,353Cost of Purchases 777,328Proceeds of Sales (2,739,175)Amortization/Accretion —Transfers into Level 3 —Transfers out of Level 3 —Ending Balance $ 7,962,306
The change in unrealized gain (loss) for the period attributable to Level 3 securities held at December 31, 2017 $ 3,265,865

10Annual Report
See accompanying notes which are an integral part of the financial statements.
Investments – continued
The information used in the above reconciliation represents fiscal year to date activity for any Investments in Securities identified as using Level 3 inputs at either the beginning or the end of the current fiscal period. Transfers in or out of Level 3 represent the beginning value of any Security or Instrument where a change in the pricing level occurred from the beginning to the end of the period. The cost of purchases and the proceeds of sales may include securities received or delivered through corporate actions or exchanges. Realized and unrealized gains (losses) disclosed in the reconciliation are included in Net Gain (Loss) on the Fund’s Statement of Operations.
Other InformationDistribution of investments by country or territory of incorporation, as a percentage of Total Net Assets, is as follows (Unaudited):
United States of America 86.1%United Kingdom 2.3%Netherlands 2.2%India 1.8%Cayman Islands 1.6%Israel 1.4%Singapore 1.3%Ireland 1.2%British Virgin Islands 1.1%Others (Individually Less Than 1%) 1.0%
100.0%

11 Annual Report
See accompanying notes which are an integral part of the financial statements.
Financial Statements
Statement of Assets and LiabilitiesDecember 31,
2017
Assets Investment in securities, at value (including securities loaned of $25,924,074) — See accompanying schedule:
Unaffiliated issuers (cost $427,348,781) $ 706,807,880Fidelity Central Funds (cost $27,478,957) 27,481,657
Total Investment in Securities (cost $454,827,738) $ 734,289,537Receivable for investments sold 275,631Receivable for fund shares sold 442,460Dividends receivable 281,161Distributions receivable from Fidelity Central Funds 304,858Prepaid expenses 1,104Other receivables 5,097
Total assets 735,599,848Liabilities Payable to custodian bank $ 275,585Payable for fund shares redeemed 403,106Accrued management fee 318,430Distribution and service plan fees payable 48,516Other affiliated payables 76,289Other payables and accrued expenses 13,562Collateral on securities loaned 27,008,725
Total liabilities 28,144,213Net Assets $ 707,455,635
Net Assets consist of: Paid in capital $ 387,197,683Undistributed net investment income 617,177Accumulated undistributed net realized gain (loss) on investments and foreign currency transactions 40,177,584Net unrealized appreciation (depreciation) on investments and assets and liabilities in foreign currencies 279,463,191Net Assets $ 707,455,635
Initial Class: Net Asset Value, offering price and redemption price per share ($167,740,148 ÷ 4,649,364 shares) $ 36.08
Service Class: Net Asset Value, offering price and redemption price per share ($102,730,141 ÷ 2,852,332 shares) $ 36.02
Service Class 2: Net Asset Value, offering price and redemption price per share ($193,945,385 ÷ 5,448,588 shares) $ 35.60
Investor Class: Net Asset Value, offering price and redemption price per share ($243,039,961 ÷ 6,774,580 shares) $ 35.88

12Annual Report
See accompanying notes which are an integral part of the financial statements.
Financial Statements – continued
Statement of OperationsYear ended
December 31, 2017
Investment Income Dividends $ 5,435,040Income from Fidelity Central Funds (including $1,158,834 from security lending) 1,223,768
Total income 6,658,808Expenses Management fee $ 3,411,253Transfer agent fees 586,543Distribution and service plan fees 496,273Accounting and security lending fees 234,828Custodian fees and expenses 30,779Independent trustees’ fees and expenses 2,428Audit 66,444Legal 12,541Miscellaneous 5,085
Total expenses before reductions 4,846,174Expense reductions (26,241) 4,819,933
Net investment income (loss) 1,838,875Realized and Unrealized Gain (Loss) Net realized gain (loss) on:
Investment securities: Unaffiliated issuers 53,402,435Fidelity Central Funds 1,155
Foreign currency transactions 19,017Total net realized gain (loss) 53,422,607Change in net unrealized appreciation (depreciation) on:
Investment securities: Unaffiliated issuers 123,984,573Fidelity Central Funds 1,509
Assets and liabilities in foreign currencies 1,635Total change in net unrealized appreciation (depreciation) 123,987,717Net gain (loss) 177,410,324Net increase (decrease) in net assets resulting from operations $ 179,249,199
Statement of Changes in Net AssetsYear ended
December 31, 2017
Year ended December 31,
2016Increase (Decrease) in Net Assets Operations
Net investment income (loss) $ 1,838,875 $ 1,550,111Net realized gain (loss) 53,422,607 64,520,465Change in net unrealized appreciation (depreciation) 123,987,717 (70,613,183)Net increase (decrease) in net assets resulting from operations 179,249,199 (4,542,607)
Distributions to shareholders from net investment income (1,339,660) (1,170,788)Distributions to shareholders from net realized gain (76,691,219) (13,837,937)
Total distributions (78,030,879) (15,008,725)Share transactions – net increase (decrease) 87,470,716 (199,072,390)
Total increase (decrease) in net assets 188,689,036 (218,623,722)Net Assets
Beginning of period 518,766,599 737,390,321End of period $ 707,455,635 $ 518,766,599
Other Information Undistributed net investment income end of period $ 617,177 $ 347,887
13 Annual Report
See accompanying notes which are an integral part of the financial statements.
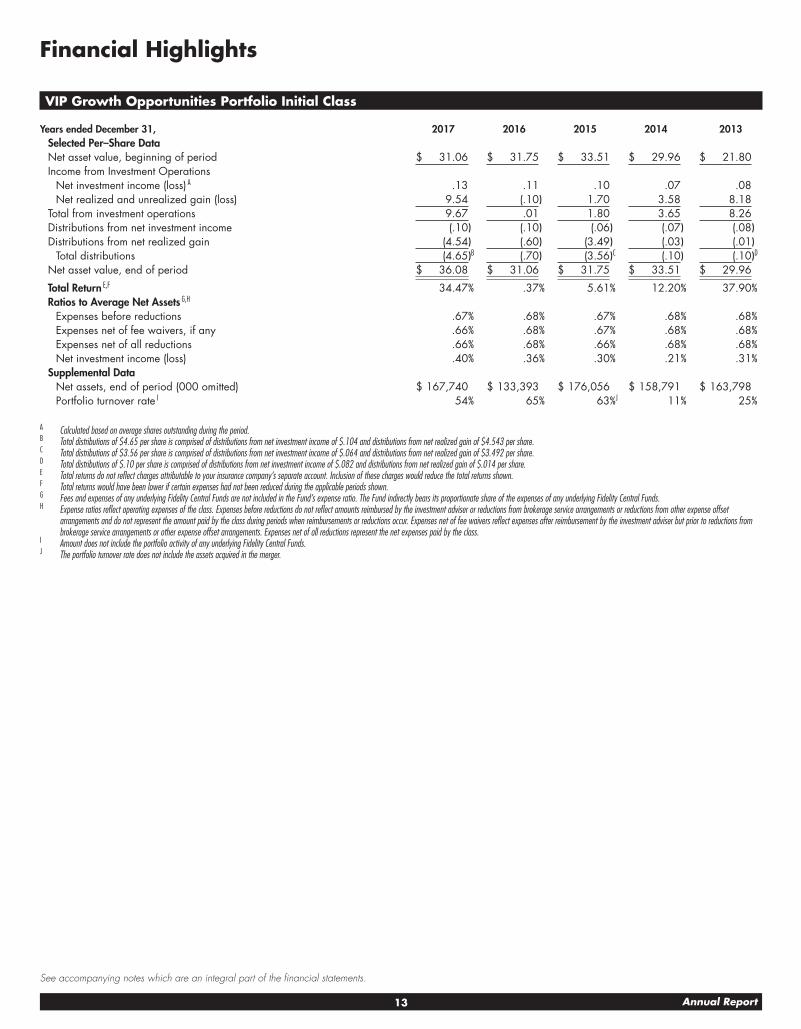
Financial Highlights
VIP Growth Opportunities Portfolio Initial Class
Years ended December 31, 2017 2016 2015 2014 2013Selected Per–Share Data Net asset value, beginning of period $ 31.06 $ 31.75 $ 33.51 $ 29.96 $ 21.80Income from Investment Operations
Net investment income (loss) A .13 .11 .10 .07 .08Net realized and unrealized gain (loss) 9.54 (.10) 1.70 3.58 8.18
Total from investment operations 9.67 .01 1.80 3.65 8.26Distributions from net investment income (.10) (.10) (.06) (.07) (.08)Distributions from net realized gain (4.54) (.60) (3.49) (.03) (.01)
Total distributions (4.65)B (.70) (3.56)C (.10) (.10)D
Net asset value, end of period $ 36.08 $ 31.06 $ 31.75 $ 33.51 $ 29.96
Total Return E,F 34.47% .37% 5.61% 12.20% 37.90%Ratios to Average Net Assets G,H
Expenses before reductions .67% .68% .67% .68% .68%Expenses net of fee waivers, if any .66% .68% .67% .68% .68%Expenses net of all reductions .66% .68% .66% .68% .68%Net investment income (loss) .40% .36% .30% .21% .31%
Supplemental Data Net assets, end of period (000 omitted) $ 167,740 $ 133,393 $ 176,056 $ 158,791 $ 163,798Portfolio turnover rate I 54% 65% 63%J 11% 25%
A Calculated based on average shares outstanding during the period.B Total distributions of $4.65 per share is comprised of distributions from net investment income of $.104 and distributions from net realized gain of $4.543 per share.C Total distributions of $3.56 per share is comprised of distributions from net investment income of $.064 and distributions from net realized gain of $3.492 per share.D Total distributions of $.10 per share is comprised of distributions from net investment income of $.082 and distributions from net realized gain of $.014 per share.E Total returns do not reflect charges attributable to your insurance company’s separate account. Inclusion of these charges would reduce the total returns shown.F Total returns would have been lower if certain expenses had not been reduced during the applicable periods shown.G Fees and expenses of any underlying Fidelity Central Funds are not included in the Fund’s expense ratio. The Fund indirectly bears its proportionate share of the expenses of any underlying Fidelity Central Funds.H Expense ratios reflect operating expenses of the class. Expenses before reductions do not reflect amounts reimbursed by the investment adviser or reductions from brokerage service arrangements or reductions from other expense offset
arrangements and do not represent the amount paid by the class during periods when reimbursements or reductions occur. Expenses net of fee waivers reflect expenses after reimbursement by the investment adviser but prior to reductions from brokerage service arrangements or other expense offset arrangements. Expenses net of all reductions represent the net expenses paid by the class.
I Amount does not include the portfolio activity of any underlying Fidelity Central Funds.J The portfolio turnover rate does not include the assets acquired in the merger.

14Annual Report
See accompanying notes which are an integral part of the financial statements.
Financial Highlights – continued
VIP Growth Opportunities Portfolio Service Class
Years ended December 31, 2017 2016 2015 2014 2013Selected Per–Share Data Net asset value, beginning of period $ 31.01 $ 31.70 $ 33.46 $ 29.91 $ 21.76Income from Investment Operations
Net investment income (loss) A .10 .08 .07 .04 .05Net realized and unrealized gain (loss) 9.52 (.09) 1.68 3.58 8.17
Total from investment operations 9.62 (.01) 1.75 3.62 8.22Distributions from net investment income (.07) (.07) (.02) (.04) (.05)Distributions from net realized gain (4.54) (.60) (3.49) (.03) (.01)
Total distributions (4.61) (.68)B (3.51) (.07) (.07)C
Net asset value, end of period $ 36.02 $ 31.01 $ 31.70 $ 33.46 $ 29.91
Total Return D,E 34.36% .28% 5.48% 12.10% 37.78%Ratios to Average Net Assets F,G
Expenses before reductions .77% .78% .77% .77% .78%Expenses net of fee waivers, if any .76% .78% .77% .77% .78%Expenses net of all reductions .76% .78% .76% .77% .78%Net investment income (loss) .30% .26% .20% .11% .21%
Supplemental Data Net assets, end of period (000 omitted) $ 102,730 $ 92,664 $ 113,812 $ 141,833 $ 160,835Portfolio turnover rate H 54% 65% 63%I 11% 25%
A Calculated based on average shares outstanding during the period.B Total distributions of $.68 per share is comprised of distributions from net investment income of $.073 and distributions from net realized gain of $.602 per share.C Total distributions of $.07 per share is comprised of distributions from net investment income of $.052 and distributions from net realized gain of $.014 per share.D Total returns do not reflect charges attributable to your insurance company’s separate account. Inclusion of these charges would reduce the total returns shown.E Total returns would have been lower if certain expenses had not been reduced during the applicable periods shown.F Fees and expenses of any underlying Fidelity Central Funds are not included in the Fund’s expense ratio. The Fund indirectly bears its proportionate share of the expenses of any underlying Fidelity Central Funds.G Expense ratios reflect operating expenses of the class. Expenses before reductions do not reflect amounts reimbursed by the investment adviser or reductions from brokerage service arrangements or reductions from other expense offset
arrangements and do not represent the amount paid by the class during periods when reimbursements or reductions occur. Expenses net of fee waivers reflect expenses after reimbursement by the investment adviser but prior to reductions from brokerage service arrangements or other expense offset arrangements. Expenses net of all reductions represent the net expenses paid by the class.
H Amount does not include the portfolio activity of any underlying Fidelity Central Funds.I The portfolio turnover rate does not include the assets acquired in the merger.

15 Annual Report
See accompanying notes which are an integral part of the financial statements.
VIP Growth Opportunities Portfolio Service Class 2
Years ended December 31, 2017 2016 2015 2014 2013Selected Per–Share Data Net asset value, beginning of period $ 30.71 $ 31.40 $ 33.20 $ 29.68 $ 21.60Income from Investment Operations
Net investment income (loss) A .05 .03 .02 (.01) .01Net realized and unrealized gain (loss) 9.42 (.10) 1.67 3.56 8.10
Total from investment operations 9.47 (.07) 1.69 3.55 8.11Distributions from net investment income (.04) (.02) –B –B (.01)Distributions from net realized gain (4.54) (.60) (3.49) (.02) (.01)
Total distributions (4.58) (.62) (3.49) (.03)C (.03)D
Net asset value, end of period $ 35.60 $ 30.71 $ 31.40 $ 33.20 $ 29.68
Total Return E,F 34.17% .10% 5.34% 11.95% 37.54%Ratios to Average Net Assets G,H
Expenses before reductions .91% .93% .92% .93% .94%Expenses net of fee waivers, if any .91% .93% .92% .93% .93%Expenses net of all reductions .91% .93% .91% .93% .93%Net investment income (loss) .15% .11% .05% (.04)% .06%
Supplemental Data Net assets, end of period (000 omitted) $ 193,945 $ 117,623 $ 177,404 $ 83,545 $ 81,360Portfolio turnover rate I 54% 65% 63%J 11% 25%
A Calculated based on average shares outstanding during the period.B Amount represents less than $.005 per share.C Total distributions of $.03 per share is comprised of distributions from net investment income of $.002 and distributions from net realized gain of $.023 per share.D Total distributions of $.03 per share is comprised of distributions from net investment income of $.012 and distributions from net realized gain of $.014 per share.E Total returns do not reflect charges attributable to your insurance company’s separate account. Inclusion of these charges would reduce the total returns shown.F Total returns would have been lower if certain expenses had not been reduced during the applicable periods shown.G Fees and expenses of any underlying Fidelity Central Funds are not included in the Fund’s expense ratio. The Fund indirectly bears its proportionate share of the expenses of any underlying Fidelity Central Funds.H Expense ratios reflect operating expenses of the class. Expenses before reductions do not reflect amounts reimbursed by the investment adviser or reductions from brokerage service arrangements or reductions from other expense offset
arrangements and do not represent the amount paid by the class during periods when reimbursements or reductions occur. Expenses net of fee waivers reflect expenses after reimbursement by the investment adviser but prior to reductions from brokerage service arrangements or other expense offset arrangements. Expenses net of all reductions represent the net expenses paid by the class.
I Amount does not include the portfolio activity of any underlying Fidelity Central Funds.J The portfolio turnover rate does not include the assets acquired in the merger.

16Annual Report
See accompanying notes which are an integral part of the financial statements.
Financial Highlights – continued
VIP Growth Opportunities Portfolio Investor Class
Years ended December 31, 2017 2016 2015 2014 2013Selected Per–Share Data Net asset value, beginning of period $ 30.91 $ 31.60 $ 33.37 $ 29.84 $ 21.72Income from Investment Operations
Net investment income (loss) A .10 .08 .07 .04 .06Net realized and unrealized gain (loss) 9.49 (.09) 1.70 3.57 8.14
Total from investment operations 9.59 (.01) 1.77 3.61 8.20Distributions from net investment income (.08) (.07) (.05) (.05) (.07)Distributions from net realized gain (4.54) (.60) (3.49) (.03) (.01)
Total distributions (4.62) (.68)B (3.54) (.08) (.08)Net asset value, end of period $ 35.88 $ 30.91 $ 31.60 $ 33.37 $ 29.84
Total Return C,D 34.38% .28% 5.54% 12.09% 37.77%Ratios to Average Net Assets E,F
Expenses before reductions .75% .76% .75% .76% .77%Expenses net of fee waivers, if any .75% .76% .75% .76% .76%Expenses net of all reductions .74% .76% .74% .76% .76%Net investment income (loss) .32% .28% .22% .13% .23%
Supplemental Data Net assets, end of period (000 omitted) $ 243,040 $ 175,086 $ 270,119 $ 136,782 $ 122,334Portfolio turnover rate G 54% 65% 63%H 11% 25%
A Calculated based on average shares outstanding during the period.B Total distributions of $.68 per share is comprised of distributions from net investment income of $.073 and distributions from net realized gain of $.602 per share.C Total returns do not reflect charges attributable to your insurance company’s separate account. Inclusion of these charges would reduce the total returns shown.D Total returns would have been lower if certain expenses had not been reduced during the applicable periods shown.E Fees and expenses of any underlying Fidelity Central Funds are not included in the Fund’s expense ratio. The Fund indirectly bears its proportionate share of the expenses of any underlying Fidelity Central Funds.F Expense ratios reflect operating expenses of the class. Expenses before reductions do not reflect amounts reimbursed by the investment adviser or reductions from brokerage service arrangements or reductions from other expense offset
arrangements and do not represent the amount paid by the class during periods when reimbursements or reductions occur. Expenses net of fee waivers reflect expenses after reimbursement by the investment adviser but prior to reductions from brokerage service arrangements or other expense offset arrangements. Expenses net of all reductions represent the net expenses paid by the class.
G Amount does not include the portfolio activity of any underlying Fidelity Central Funds.H The portfolio turnover rate does not include the assets acquired in the merger.

17 Annual Report
Notes to Financial StatementsFor the period ended December 31, 2017
1. Organization.
VIP Growth Opportunities Portfolio (the Fund) is a fund of Variable Insurance Products Fund III (the Trust) and is authorized to issue an unlim-ited number of shares. The Trust is registered under the Investment Company Act of 1940, as amended (the 1940 Act), as an open-end manage-ment investment company organized as a Massachusetts business trust. Shares of the Fund may only be purchased by insurance companies for the purpose of funding variable annuity or variable life insurance contracts. The Fund offers the following classes of shares: Initial Class shares, Service Class shares, Service Class 2 shares and Investor Class shares. All classes have equal rights and voting privileges, except for matters affecting a single class.
2. Investments in Fidelity Central Funds.
The Fund invests in Fidelity Central Funds, which are open-end investment companies generally available only to other investment companies and accounts managed by the investment adviser and its affiliates. The Fund’s Schedule of Investments lists each of the Fidelity Central Funds held as of period end, if any, as an investment of the Fund, but does not include the underlying holdings of each Fidelity Central Fund. As an Investing Fund, the Fund indirectly bears its proportionate share of the expenses of the underlying Fidelity Central Funds.
The Money Market Central Funds seek preservation of capital and current income and are managed by Fidelity Investments Money Management, Inc. (FIMM), an affiliate of the investment adviser. Annualized expenses of the Money Market Central Funds as of their most recent shareholder report date are less than .005%.
A complete unaudited list of holdings for each Fidelity Central Fund is available upon request or at the Securities and Exchange Commission (the SEC) website at www.sec.gov. In addition, the financial statements of the Fidelity Central Funds, which are not covered by the Fund’s Report of Independent Registered Public Accounting Firm, are available on the SEC website or upon request.
3. Significant Accounting Policies.
The Fund is an investment company and applies the accounting and reporting guidance of the Financial Accounting Standards Board (FASB) Accounting Standards Codification Topic 946 Financial Services – Investments Companies. The financial statements have been prepared in conformity with accounting principles generally accepted in the United States of America (GAAP), which require management to make certain estimates and assumptions at the date of the financial statements. Actual results could differ from those estimates. Subsequent events, if any, through the date that the financial statements were issued have been evaluated in the preparation of the financial statements. The following summarizes the significant accounting policies of the Fund:
Investment Valuation. Investments are valued as of 4:00 p.m. Eastern time on the last calendar day of the period. The Board of Trustees (the Board) has delegated the day to day responsibility for the valuation of the Fund’s investments to the Fair Value Committee (the Committee) established by the Fund’s investment adviser. In accordance with valuation policies and procedures approved by the Board, the Fund attempts to obtain prices from one or more third party pricing vendors or brokers to value its investments. When current market prices, quotations or currency exchange rates are not readily available or reliable, investments will be fair valued in good faith by the Committee, in accordance with procedures adopted by the Board. Factors used in determining fair value vary by investment type and may include market or investment specific events. The frequency with which these procedures are used cannot be predicted and they may be utilized to a significant extent. The Committee oversees the Fund’s valuation policies and procedures and reports to the Board on the Committee’s activities and fair value determinations. The Board monitors the appropriateness of the procedures used in valuing the Fund’s investments and ratifies the fair value determinations of the Committee.
The Fund categorizes the inputs to valuation techniques used to value its investments into a disclosure hierarchy consisting of three levels as shown below:
Level 1 – quoted prices in active markets for identical investments
Level 2 – other significant observable inputs (including quoted prices for similar investments, interest rates, prepayment speeds, etc.)
Level 3 – unobservable inputs (including the Fund’s own assumptions based on the best information available)
Valuation techniques used to value the Fund’s investments by major category are as follows:
Equity securities, including restricted securities, for which market quotations are readily available, are valued at the last reported sale price or official closing price as reported by a third party pricing vendor on the primary market or exchange on which they are traded and are categorized as Level 1 in the hierarchy. In the event there were no sales during the day or closing prices are not available, securities are valued at the last quoted bid price or may be valued using the last available price and are generally categorized as Level 2 in the hierarchy. For foreign equity secu-rities, when market or security specific events arise, comparisons to the valuation of American Depositary Receipts (ADRs), futures contracts, Exchange-Traded Funds (ETFs) and certain indexes as well as quoted prices for similar securities may be used and would be categorized as Level 2 in the hierarchy. Utilizing these techniques may result in transfers between Level 1 and Level 2. For equity securities, including restricted

18Annual Report
Notes to Financial Statements – continued
securities, where observable inputs are limited, assumptions about market activity and risk are used and these securities may be categorized as Level 3 in the hierarchy. Equity securities, including restricted securities, for which observable inputs are not available are valued using alter-nate valuation approaches, including the market approach and the income approach and are categorized as Level 3 in the hierarchy. The market approach generally consists of using comparable market transactions while the income approach generally consists of using the net present value of estimated future cash flows, adjusted as appropriate for liquidity, credit, market and/or other risk factors
Investments in open-end mutual funds, including the Fidelity Central Funds, are valued at their closing net asset value (NAV) each business day and are categorized as Level 1 in the hierarchy.
The following provides information on Level 3 securities held by the Fund that were valued at period end based on unobservable inputs. These amounts exclude valuations provided by a broker.
Asset Type Fair Value Valuation Technique(s) Unobservable InputAmount or Range/Weighted
Average
Impact to Valuation from an Increase in Input(a)
Equities $7,962,306 Market comparable Enterprise value/Sales multiple (EV/S)
1.1 – 8.2 / 4.9 Increase
Discount rate 10.0% Decrease
Discount for lack of marketability
20.0% Decrease
Premium rate 38.9% Increase
Market approach Transaction price $32.97 – $48.77 / $40.87 Increase(a) Represents the expected directional change in the fair value of the Level 3 investments that would result from an increase in the corresponding input. A decrease to the
unobservable input would have the opposite effect. Significant changes in these inputs could result in significantly higher or lower fair value measurements.
Changes in valuation techniques may result in transfers in or out of an assigned level within the disclosure hierarchy. The aggregate value of investments by input level as of December 31, 2017, as well as a roll forward of Level 3 investments, is included at the end of the Fund’s Schedule of Investments.
Foreign Currency. The Fund may use foreign currency contracts to facilitate transactions in foreign-denominated securities. Gains and losses from these transactions may arise from changes in the value of the foreign currency or if the counterparties do not perform under the contracts’ terms.
Foreign-denominated assets, including investment securities, and liabilities are translated into U.S. dollars at the exchange rates at period end. Purchases and sales of investment securities, income and dividends received and expenses denominated in foreign currencies are translated into U.S. dollars at the exchange rate in effect on the transaction date.
The effects of exchange rate fluctuations on investments are included with the net realized and unrealized gain (loss) on investment securities. Other foreign currency transactions resulting in realized and unrealized gain (loss) are disclosed separately.
Investment Transactions and Income. For financial reporting purposes, the Fund’s investment holdings and NAV include trades executed through the end of the last business day of the period. The NAV per share for processing shareholder transactions is calculated as of the close of business of the New York Stock Exchange (NYSE), normally 4:00 p.m. Eastern time and includes trades executed through the end of the prior business day. Gains and losses on securities sold are determined on the basis of identified cost and includes proceeds received from litigation. Dividend income is recorded on the ex-dividend date, except for certain dividends from foreign securities where the ex-dividend date may have passed, which are recorded as soon as the Fund is informed of the ex-dividend date. Non-cash dividends included in dividend income, if any, are recorded at the fair market value of the securities received. Income and capital gain distributions from Fidelity Central Funds, if any, are recorded on the ex-dividend date. Certain distributions received by the Fund represent a return of capital or capital gain. The Fund determines the components of these distributions subsequent to the ex-dividend date, based upon receipt of tax filings or other correspondence relating to the underlying investment. These distributions are recorded as a reduction of cost of investments and/or as a realized gain. Investment income is recorded net of foreign taxes withheld where recovery of such taxes is uncertain.
Class Allocations and Expenses. Investment income, realized and unrealized capital gains and losses, common expenses of the Fund, and certain fund-level expense reductions, if any, are allocated daily on a pro-rata basis to each class based on the relative net assets of each class to the total net assets of the Fund. Each class differs with respect to transfer agent and distribution and service plan fees incurred. Certain expense reductions may also differ by class. For the reporting period, the allocated portion of income and expenses to each class as a percent of its aver-age net assets may vary due to the timing of recording these transactions in relation to fluctuating net assets of the classes. Expenses directly attributable to a fund are charged to that fund. Expenses attributable to more than one fund are allocated among the respective funds on the

19 Annual Report
basis of relative net assets or other appropriate methods. Expense estimates are accrued in the period to which they relate and adjustments are made when actual amounts are known.
Income Tax Information and Distributions to Shareholders. Each year, the Fund intends to qualify as a regulated investment company under Subchapter M of the Internal Revenue Code, including distributing substantially all of its taxable income and realized gains. As a result, no provision for U.S. Federal income taxes is required. As of December 31, 2017, the Fund did not have any unrecognized tax benefits in the financial statements; nor is the Fund aware of any tax positions for which it is reasonably possible that the total amounts of unrecognized tax benefits will significantly change in the next twelve months. The Fund files a U.S. federal tax return, in addition to state and local tax returns as required. The Fund’s federal income tax returns are subject to examination by the Internal Revenue Service (IRS) for a period of three fiscal years after they are filed. State and local tax returns may be subject to examination for an additional fiscal year depending on the jurisdiction. Foreign taxes are provided for based on the Fund’s understanding of the tax rules and rates that exist in the foreign markets in which it invests.
Distributions are declared and recorded on the ex-dividend date. Income dividends and capital gain distributions are declared separately for each class. Income and capital gain distributions are determined in accordance with income tax regulations, which may differ from GAAP.
Capital accounts within the financial statements are adjusted for permanent book-tax differences. These adjustments have no impact on net assets or the results of operations. Capital accounts are not adjusted for temporary book-tax differences which will reverse in a subsequent period.
Book-tax differences are primarily due to foreign currency transactions, passive foreign investment companies (PFIC), partnerships, deferred trustees compensation, and losses deferred due to wash sales.
As of period end, the cost and unrealized appreciation (depreciation) in securities, and derivatives if applicable, for federal income tax purposes were as follows:
Gross unrealized appreciation $ 289,250,744Gross unrealized depreciation (10,445,748)Net unrealized appreciation (depreciation) $ 278,804,996
Tax Cost $ 455,484,541
The tax-based components of distributable earnings as of period end were as follows:
Undistributed ordinary income $ 2,672,406
Undistributed long-term capital gain $ 38,990,680
Net unrealized appreciation (depreciation) on securities and other investments $ 278,594,971
The tax character of distributions paid was as follows:
December 31, 2017 December 31, 2016Ordinary Income $ 11,798,986 $ 1,170,788Long-term Capital Gains 66,231,893 13,837,937Total $ 78,030,879 $ 15,008,725
Restricted Securities. The Fund may invest in securities that are subject to legal or contractual restrictions on resale. These securities generally may be resold in transactions exempt from registration or to the public if the securities are registered. Disposal of these securities may involve time-consuming negotiations and expense, and prompt sale at an acceptable price may be difficult. Information regarding restricted securities is included at the end of the Fund’s Schedule of Investments.
4. Purchases and Sales of Investments.
Purchases and sales of securities, other than short-term securities, aggregated $347,691,259 and $334,639,090, respectively.
5. Fees and Other Transactions with Affiliates.
Management Fee. Fidelity Management & Research Company (the investment adviser) and its affiliates provide the Fund with investment management related services for which the Fund pays a monthly management fee. The management fee is the sum of an individual fund fee rate that is based on an annual rate of .30% of the Fund’s average net assets and an annualized group fee rate that averaged .24% during the period. The group fee rate is based upon the average net assets of all the mutual funds advised by the investment adviser, including any mutual funds previously advised by the investment adviser that are currently advised by Fidelity SelectCo, LLC, an affiliate of the investment adviser. The group

20Annual Report
Notes to Financial Statements – continued
fee rate decreases as assets under management increase and increases as assets under management decrease. For the reporting period, the total annual management fee rate was .54% of the Fund’s average net assets.
Distribution and Service Plan Fees. In accordance with Rule 12b-1 of the 1940 Act, the Fund has adopted separate 12b-1 Plans for each Service Class of shares. Each Service Class pays Fidelity Distributors Corporation (FDC), an affiliate of the investment adviser, a service fee. For the period, the service fee is based on an annual rate of .10% of Service Class’ average net assets and .25% of Service Class 2’s average net assets.
For the period, total fees, all of which were re-allowed to insurance companies for the distribution of shares and providing shareholder support services, were as follows:
Service Class $ 100,403Service Class 2 395,870
$ 496,273
Transfer Agent Fees. Fidelity Investments Institutional Operations Company, Inc. (FIIOC), an affiliate of the investment adviser, is the Fund’s transfer, dividend disbursing, and shareholder servicing agent. FIIOC receives an asset-based fee with respect to each class. Each class pays a fee for transfer agent services, typesetting and printing and mailing of shareholder reports, excluding mailing of proxy statements, equal to an annual rate of class-level average net assets. The annual rate for Investor Class is .15% and the annual rate for all other classes is .07%. For the period, transfer agent fees for each class were as follows:
Initial Class $ 101,497Service Class 66,187Service Class 2 104,366Investor Class 314,493
$ 586,543
Accounting and Security Lending Fees. Fidelity Service Company, Inc. (FSC), an affiliate of the investment adviser, maintains the Fund’s accounting records. The accounting fee is based on the level of average net assets for each month. Under a separate contract, FSC administers the security lending program. The security lending fee is based on the number and duration of lending transactions.
Brokerage Commissions. The Fund placed a portion of its portfolio transactions with brokerage firms which are affiliates of the invest-ment adviser. Brokerage commissions are included in net realized gain (loss) and change in net unrealized appreciation (depreciation) in the Statement of Operations. The commissions paid to these affiliated firms were $9,211 for the period.
Interfund Trades. The Fund may purchase from or sell securities to other Fidelity Funds under procedures adopted by the Board. The pro-cedures have been designed to ensure these interfund trades are executed in accordance with Rule 17a-7 of the 1940 Act. Interfund trades are included within the respective purchases and sales amounts shown in the Purchases and Sales of Investments note.
Other. During the period, the investment adviser reimbursed the Fund for certain losses in the amount of $4,770.
6. Committed Line of Credit.
The Fund participates with other funds managed by the investment adviser or an affiliate in a $4.25 billion credit facility (the “line of credit”) to be utilized for temporary or emergency purposes to fund shareholder redemptions or for other short-term liquidity purposes. The Fund has agreed to pay commitment fees on its pro-rata portion of the line of credit, which amounted to $1,862 and is reflected in Miscellaneous expenses on the Statement of Operations. During the period, the Fund did not borrow on this line of credit.
7. Security Lending.
The Fund lends portfolio securities through a lending agent from time to time in order to earn additional income. For equity securities, a lending agent is used and may loan securities to certain qualified borrowers, including Fidelity Capital Markets (FCM), a broker-dealer affiliated with the Fund. On the settlement date of the loan, the Fund receives collateral (in the form of U.S. Treasury obligations, letters of credit and/or cash) against the loaned securities and maintains collateral in an amount not less than 100% of the market value of the loaned securities during the period of the loan. The market value of the loaned securities is determined at the close of business of the Fund and any additional required col-lateral is delivered to the Fund on the next business day. The Fund or borrower may terminate the loan at any time, and if the borrower defaults on its obligation to return the securities loaned because of insolvency or other reasons, the Fund may apply collateral received from the borrower against the obligation. The Fund may experience delays and costs in recovering the securities loaned. Any cash collateral received is invested in the Fidelity Securities Lending Cash Central Fund. The value of loaned securities and cash collateral at period end are disclosed on the Fund’s Statement of Assets and Liabilities. The value of securities loaned to FCM at period end was $256,088. Security lending income represents the income earned on investing cash collateral, less rebates paid to borrowers and any lending agent fees associated with the loan, plus any premium

21 Annual Report
payments received for lending certain types of securities. Security lending income is presented in the Statement of Operations as a component of income from Fidelity Central Funds, and includes $94,268 from securities loaned to FCM.
8. Expense Reductions.
Commissions paid to certain brokers with whom the investment adviser, or its affiliates, places trades on behalf of the Fund include an amount in addition to trade execution, which may be rebated back to the Fund to offset certain expenses. This amount totaled $21,516 for the period.
In addition, during the period the investment adviser reimbursed and/or waived a portion of fund-level operating expenses in the amount of $4,725.
9. Distributions to Shareholders.
Distributions to shareholders of each class were as follows:
Year ended December 31, 2017
Year ended December 31, 2016
From net investment incomeInitial Class $ 467,469 $ 441,232Service Class 195,674 222,177Service Class 2 167,345 71,358Investor Class 509,172 436,021Total $ 1,339,660 $ 1,170,788
From net realized gain Initial Class $ 19,304,343 $ 3,227,176Service Class 13,271,356 2,124,607Service Class 2 18,454,911 3,498,766Investor Class 25,660,609 4,987,388Total $ 76,691,219 $ 13,837,937
10. Share Transactions.
Transactions for each class of shares were as follows:
Shares Shares Dollars DollarsYear
ended December 31,
2017
Year ended
December 31, 2016
Year ended
December 31, 2017
Year ended
December 31, 2016
Initial Class Shares sold 445,185 280,329 $ 14,355,522 $ 8,217,274Reinvestment of distributions 659,000 135,711 19,771,812 3,668,408Shares redeemed (749,981) (1,666,374) (24,550,558) (50,097,985)Net increase (decrease) 354,204 (1,250,334) $ 9,576,776 $ (38,212,303)
Service Class Shares sold 102,330 68,666 $ 3,372,479 $ 2,044,301Reinvestment of distributions 451,195 87,295 13,467,030 2,346,784Shares redeemed (689,399) (757,522) (22,685,483) (22,707,390)Net increase (decrease) (135,874) (601,561) $ (5,845,974) $ (18,316,305)
Service Class 2 Shares sold 2,032,671 1,537,082 $ 66,122,296 $ 44,979,886Reinvestment of distributions 626,806 135,723 18,622,256 3,570,124Shares redeemed (1,040,672) (3,493,410) (34,075,785) (104,002,667)Net increase (decrease) 1,618,805 (1,820,605) $ 50,668,767 $ (55,452,657)
Investor Class Shares sold 1,044,502 180,117 $ 33,953,637 $ 5,259,727Reinvestment of distributions 875,462 202,876 26,169,781 5,423,409Shares redeemed (809,925) (3,267,048) (27,052,271) (97,774,261)Net increase (decrease) 1,110,039 (2,884,055) $ 33,071,147 $ (87,091,125)

22Annual Report
Notes to Financial Statements – continued
11. Other.
The Fund’s organizational documents provide former and current trustees and officers with a limited indemnification against liabilities arising in connection with the performance of their duties to the Fund. In the normal course of business, the Fund may also enter into contracts that provide general indemnifications. The Fund’s maximum exposure under these arrangements is unknown as this would be dependent on future claims that may be made against the Fund. The risk of material loss from such claims is considered remote.
At the end of the period, the investment adviser or its affiliates were the owners of record of 48% of the total outstanding shares of the Fund and two otherwise unaffiliated shareholders were the owners of record of 27% of the total outstanding shares of the Fund.

23 Annual Report
Report of Independent Registered Public Accounting Firm
To the Trustees of Variable Insurance Products Fund III and Shareholders of VIP Growth Opportunities Portfolio:
Opinion on the Financial Statements and Financial HighlightsWe have audited the accompanying statement of assets and liabilities of VIP Growth Opportunities Portfolio (the “Fund”), a fund of Variable Insurance Products Fund III, including the schedule of investments, as of December 31, 2017, and the related statement of operations for the year then ended, the statement of changes in net assets for each of the two years in the period then ended, the financial highlights for each of the five years in the period then ended, and the related notes. In our opinion, the financial statements and financial highlights present fairly, in all material respects, the financial position of the Fund as of December 31, 2017, and the results of its operations for the year then ended, the changes in its net assets for each of the two years in the period then ended, and the financial highlights for each of the five years in the period then ended, in conformity with accounting principles generally accepted in the United States of America.
Basis for OpinionThese financial statements and financial highlights are the responsibility of the Fund’s management. Our responsibility is to express an opin-ion on the Fund’s financial statements and financial highlights based on our audits. We are a public accounting firm registered with the Public Company Accounting Oversight Board (United States) (PCAOB) and are required to be independent with respect to the Fund in accordance with the U.S. federal securities laws and the applicable rules and regulations of the Securities and Exchange Commission and the PCAOB.
We conducted our audits in accordance with the standards of the PCAOB. Those standards require that we plan and perform the audit to obtain reasonable assurance about whether the financial statements and financial highlights are free of material misstatement, whether due to error or fraud. The Fund is not required to have, nor were we engaged to perform, an audit of its internal control over financial reporting. As part of our audits we are required to obtain an understanding of internal control over financial reporting but not for the purpose of expressing an opinion on the effectiveness of the Fund’s internal control over financial reporting. Accordingly, we express no such opinion.
Our audits included performing procedures to assess the risks of material misstatement of the financial statements and financial highlights, whether due to error or fraud, and performing procedures that respond to those risks. Such procedures included examining, on a test basis, evidence regarding the amounts and disclosures in the financial statements and financial highlights. Our audits also included evaluating the accounting principles used and significant estimates made by management, as well as evaluating the overall presentation of the financial state-ments and financial highlights. Our procedures included confirmation of securities owned as of December 31, 2017, by correspondence with the custodians and brokers; when replies were not received from brokers, we performed other auditing procedures. We believe that our audits provide a reasonable basis for our opinion.
DELOITTE & TOUCHE LLP Boston, Massachusetts February 14, 2018
We have served as the auditor of one or more of the Fidelity investment companies since 1999.

24Annual Report
Trustees and Officers
The Trustees, Members of the Advisory Board (if any), and officers of the trust and fund, as applicable, are listed below. The Board of Trustees governs the fund and is responsible for protecting the interests of shareholders. The Trustees are experienced executives who meet periodically throughout the year to oversee the fund’s activities, review contractual arrangements with companies that provide services to the fund, oversee management of the risks associated with such activities and contractual arrangements, and review the fund’s performance. Each of the Trustees oversees 190 funds.
The Trustees hold office without limit in time except that (a) any Trustee may resign; (b) any Trustee may be removed by written instrument, signed by at least two-thirds of the number of Trustees prior to such removal; (c) any Trustee who requests to be retired or who has become incapacitated by illness or injury may be retired by written instrument signed by a majority of the other Trustees; and (d) any Trustee may be removed at any special meeting of shareholders by a two-thirds vote of the outstanding voting securities of the trust. Each Trustee who is not an interested person (as defined in the 1940 Act) of the trust and the fund is referred to herein as an Independent Trustee. Each Independent Trustee shall retire not later than the last day of the calendar year in which his or her 75th birthday occurs. The Independent Trustees may waive this mandatory retirement age policy with respect to individual Trustees. Officers and Advisory Board Members hold office without limit in time, except that any officer or Advisory Board Member may resign or may be removed by a vote of a majority of the Trustees at any regular meeting or any special meeting of the Trustees. Except as indicated, each individual has held the office shown or other offices in the same company for the past five years.
The fund’s Statement of Additional Information (SAI) includes more information about the Trustees. To request a free copy, call Fidelity at 1-877-208-0098.
Experience, Skills, Attributes, and Qualifications of the Trustees. The Governance and Nominating Committee has adopted a statement of policy that describes the experience, qualifications, attributes, and skills that are necessary and desirable for potential Independent Trustee can-didates (Statement of Policy). The Board believes that each Trustee satisfied at the time he or she was initially elected or appointed a Trustee, and continues to satisfy, the standards contemplated by the Statement of Policy. The Governance and Nominating Committee also engages professional search firms to help identify potential Independent Trustee candidates who have the experience, qualifications, attributes, and skills consistent with the Statement of Policy. From time to time, additional criteria based on the composition and skills of the current Independent Trustees, as well as experience or skills that may be appropriate in light of future changes to board composition, business conditions, and regula-tory or other developments, have also been considered by the professional search firms and the Governance and Nominating Committee. In addition, the Board takes into account the Trustees’ commitment and participation in Board and committee meetings, as well as their leadership of standing and ad hoc committees throughout their tenure.
In determining that a particular Trustee was and continues to be qualified to serve as a Trustee, the Board has considered a variety of criteria, none of which, in isolation, was controlling. The Board believes that, collectively, the Trustees have balanced and diverse experience, qualifica-tions, attributes, and skills, which allow the Board to operate effectively in governing the fund and protecting the interests of shareholders. Information about the specific experience, skills, attributes, and qualifications of each Trustee, which in each case led to the Board’s conclusion that the Trustee should serve (or continue to serve) as a trustee of the fund, is provided below.
Board Structure and Oversight Function. James C. Curvey is an interested person and currently serves as Chairman. The Trustees have determined that an interested Chairman is appropriate and benefits shareholders because an interested Chairman has a personal and profes-sional stake in the quality and continuity of services provided to the fund. Independent Trustees exercise their informed business judgment to appoint an individual of their choosing to serve as Chairman, regardless of whether the Trustee happens to be independent or a member of management. The Independent Trustees have determined that they can act independently and effectively without having an Independent Trustee serve as Chairman and that a key structural component for assuring that they are in a position to do so is for the Independent Trustees to constitute a substantial majority for the Board. The Independent Trustees also regularly meet in executive session. Ned C. Lautenbach serves as Chairman of the Independent Trustees and as such (i) acts as a liaison between the Independent Trustees and management with respect to matters important to the Independent Trustees and (ii) with management prepares agendas for Board meetings.
Fidelity® funds are overseen by different Boards of Trustees. The fund’s Board oversees Fidelity’s high income and certain equity funds, and other Boards oversee Fidelity’s investment-grade bond, money market, asset allocation, and sector funds. The asset allocation funds may invest in Fidelity® funds overseen by the fund’s Board. The use of separate Boards, each with its own committee structure, allows the Trustees of each group of Fidelity® funds to focus on the unique issues of the funds they oversee, including common research, investment, and operational issues. On occasion, the separate Boards establish joint committees to address issues of overlapping consequences for the Fidelity® funds overseen by each Board.
The Trustees operate using a system of committees to facilitate the timely and efficient consideration of all matters of importance to the Trustees, the fund, and fund shareholders and to facilitate compliance with legal and regulatory requirements and oversight of the fund’s activities and associated risks. The Board, acting through its committees, has charged FMR and its affiliates with (i) identifying events or circumstances the occurrence of which could have demonstrably adverse effects on the fund’s business and/or reputation; (ii) implementing processes and controls to lessen the possibility that such events or circumstances occur or to mitigate the effects of such events or circumstances if they do occur; and (iii) creating and maintaining a system designed to evaluate continuously business and market conditions in order to facilitate the identification and implementation processes described in (i) and (ii) above. Because the day-to-day operations and activities of the fund are carried out by or through FMR, its affiliates, and other service providers, the fund’s exposure to risks is mitigated but not eliminated by the processes overseen

25 Annual Report
by the Trustees. While each of the Board’s committees has responsibility for overseeing different aspects of the fund’s activities, oversight is exercised primarily through the Operations, Audit, and Compliance Committees. In addition, the Independent Trustees have worked with FMR to enhance the Board’s oversight of investment and financial risks, legal and regulatory risks, technology risks, and operational risks, including the development of additional risk reporting to the Board. For example, a working group comprised of Independent Trustees and FMR has worked and continues to work to review the Fidelity®funds’ valuation-related activities, reporting and risk management. Appropriate personnel, includ-ing but not limited to the fund’s Chief Compliance Officer (CCO), FMR’s internal auditor, the independent accountants, the fund’s Treasurer and portfolio management personnel, make periodic reports to the Board’s committees, as appropriate, including an annual review of Fidelity’s risk management program for the Fidelity®funds. The responsibilities of each standing committee, including their oversight responsibilities, are described further under “Standing Committees of the Trustees.”
Interested Trustees*:
Correspondence intended for a Trustee who is an interested person may be sent to Fidelity Investments, 245 Summer Street, Boston, Massachusetts 02210.
Name, Year of Birth; Principal Occupations and Other Relevant Experience+
James C. Curvey (1935)
Year of Election or Appointment: 2007 Trustee Chairman of the Board of Trustees
Mr. Curvey also serves as Trustee of other Fidelity® funds. Mr. Curvey is a Director of Fidelity Research & Analysis Co. (invest-ment adviser firm, 2009-present), and Vice Chairman (2007-present) and Director of FMR LLC (diversified financial services company). In addition, Mr. Curvey serves as an Overseer for the Boston Symphony Orchestra and a member of the board of Artis-Naples, Naples, Florida, and as a Trustee for Brewster Academy, Wolfeboro, New Hampshire. Previously, Mr. Curvey served as a Director of Fidelity Investments Money Management, Inc. (investment adviser firm, 2009-2014) and a Director of FMR and FMR Co., Inc. (investment adviser firms, 2007-2014).
Charles S. Morrison (1960)
Year of Election or Appointment: 2014 Trustee
Mr. Morrison also serves as Trustee of other funds. He serves as President of Fidelity SelectCo, LLC (investment adviser firm, 2017-present) and Fidelity Management & Research Company (FMR) (investment adviser firm, 2016-present), a Director of Fidelity Investments Money Management, Inc. (FIMM) (investment adviser firm, 2014-present), Director of Fidelity SelectCo, LLC (investment adviser firm, 2014-present), President, Asset Management (2014-present), and is an employee of Fidelity Investments. Previously, Mr. Morrison served as Vice President of Fidelity’s Fixed Income and Asset Allocation Funds (2012-2014), President, Fixed Income (2011-2014), Vice President of Fidelity’s Money Market Funds (2005-2009), President, Money Market Group Leader of FMR (investment adviser firm, 2009), and Senior Vice President, Money Market Group of FMR (2004-2009). Mr. Morrison also served as Vice President of Fidelity’s Bond Funds (2002-2005), certain Balanced Funds (2002-2005), and certain Asset Allocation Funds (2002-2007), and as Senior Vice President (2002-2005) of Fidelity’s Bond Division.
* Determined to be an “Interested Trustee” by virtue of, among other things, his or her affiliation with the trust or various entities under common control with FMR.
+ The information includes the Trustee’s principal occupation during the last five years and other information relating to the experience, attri-butes, and skills relevant to the Trustee’s qualifications to serve as a Trustee, which led to the conclusion that the Trustee should serve as a Trustee for the fund.

26Annual Report
Trustees and Officers – continued
Independent Trustees:
Correspondence intended for an Independent Trustee may be sent to Fidelity Investments, P.O. Box 55235, Boston, Massachusetts 02205-5235.
Name, Year of Birth; Principal Occupations and Other Relevant Experience+
Dennis J. Dirks (1948)
Year of Election or Appointment: 2005 Trustee
Mr. Dirks also serves as Trustee of other Fidelity® funds. Prior to his retirement in May 2003, Mr. Dirks was Chief Operating Officer and a member of the Board of The Depository Trust & Clearing Corporation (DTCC). He also served as President, Chief Operating Officer, and Board member of The Depository Trust Company (DTC) and President and Board member of the National Securities Clearing Corporation (NSCC). In addition, Mr. Dirks served as Chief Executive Officer and Board member of the Government Securities Clearing Corporation, Chief Executive Officer and Board member of the Mortgage-Backed Securities Clearing Corporation, as a Trustee and a member of the Finance Committee of Manhattan College (2005-2008), as a Trustee and a member of the Finance Committee of AHRC of Nassau County (2006-2008), as a member of the Independent Directors Council (IDC) Governing Council (2010-2015), and as a member of the Board of Directors for The Brookville Center for Children’s Services, Inc. (2009-2017). Mr. Dirks is a member of the Finance Committee (2016-present) and Board of Directors (2017-present) of the Asolo Repertory Theatre.
Alan J. Lacy (1953)
Year of Election or Appointment: 2008 Trustee
Mr. Lacy also serves as Trustee of other Fidelity® funds. Mr. Lacy serves as a Director of Bristol-Myers Squibb Company (global pharmaceuticals, 2008-present). He is a Trustee of the California Chapter of The Nature Conservancy (2015-present) and a Director of the Center for Advanced Study in the Behavioral Sciences at Stanford University (2015-present). In addition, Mr. Lacy served as Senior Adviser (2007-2014) of Oak Hill Capital Partners, L.P. (private equity) and also served as Chief Executive Officer (2005) and Vice Chairman (2005-2006) of Sears Holdings Corporation (retail) and Chief Executive Officer and Chairman of the Board of Sears, Roebuck and Co. (retail, 2000-2005). Previously, Mr. Lacy served as Chairman (2014-2017) and a member (2010-2017) of the Board of Directors of Dave & Buster’s Entertainment, Inc. (restaurant and entertain-ment complexes), as Chairman (2008-2011) and a member (2006-2015) of the Board of Trustees of the National Parks Conservation Association, and as a member of the Board of Directors for The Hillman Companies, Inc. (hardware wholesal-ers, 2010-2014), Earth Fare, Inc. (retail grocery, 2010-2014), and The Western Union Company (global money transfer, 2006-2011).
Ned C. Lautenbach (1944)
Year of Election or Appointment: 2000 Trustee Chairman of the Independent Trustees
Mr. Lautenbach also serves as Trustee of other Fidelity® funds. Mr. Lautenbach currently serves as Vice Chair of the Board of Governors, State University System of Florida (2013-present) and is a member of the Council on Foreign Relations (1994-pres-ent). He is also a member and has most recently served as Chairman of the Board of Directors of Artis-Naples (2012-pres-ent). Previously, Mr. Lautenbach served as a member and then Lead Director of the Board of Directors of Eaton Corporation (diversified industrial, 1997-2016). He was also a Partner and Advisory Partner at Clayton, Dubilier & Rice, LLC (private equity investment, 1998-2010), as well as a Director of Sony Corporation (2006-2007). In addition, Mr. Lautenbach also had a 30-year career with IBM (technology company) during which time he served as Senior Vice President and a member of the Corporate Executive Committee (1968-1998).
Joseph Mauriello (1944)
Year of Election or Appointment: 2008 Trustee
Mr. Mauriello also serves as Trustee of other Fidelity® funds. Prior to his retirement in January 2006, Mr. Mauriello served in numerous senior management positions including Deputy Chairman and Chief Operating Officer (2004-2005), and Vice Chairman of Financial Services (2002-2004) of KPMG LLP US (professional services, 1965-2005). Mr. Mauriello currently serves as a member of the Board of Directors of XL Group plc. (global insurance and re-insurance, 2006-present) and the Independent Directors Council (IDC) Governing Council (2015-present). Previously, Mr. Mauriello served as a Director of the Hamilton Funds of the Bank of New York (2006-2007) and of Arcadia Resources Inc. (health care services and products, 2007-2012).

27 Annual Report
Cornelia M. Small (1944)
Year of Election or Appointment: 2005 Trustee
Ms. Small also serves as Trustee of other Fidelity® funds. Ms. Small is a member of the Board of Directors (2009-present) and Chair of the Investment Committee (2010-present) of the Teagle Foundation. Ms. Small also serves on the Investment Committee of the Berkshire Taconic Community Foundation (2008-present). Previously, Ms. Small served as Chairperson (2002-2008) and a member of the Investment Committee and Chairperson (2008-2012) and a member of the Board of Trustees of Smith College. In addition, Ms. Small served as Chief Investment Officer, Director of Global Equity Investments, and a member of the Board of Directors of Scudder, Stevens & Clark and Scudder Kemper Investments.
William S. Stavropoulos (1939)
Year of Election or Appointment: 2002 Trustee Vice Chairman of the Independent Trustees
Mr. Stavropoulos also serves as Trustee of other Fidelity® funds. Mr. Stavropoulos serves as President and Founder of the Michigan Baseball Foundation, the Great Lakes Loons (2007-present). Mr. Stavropoulos is Chairman Emeritus of the Board of Directors of The Dow Chemical Company, where he previously served in numerous senior management positions, includ-ing President, CEO (1995-2000; 2002-2004), Chairman of the Executive Committee (2000-2006), and as a member of the Board of Directors (1990-2006). Currently, Mr. Stavropoulos is Chairman of the Board of Directors of Univar Inc. (global distributor of commodity and specialty chemicals), a Director of Teradata Corporation (data warehousing and technology solutions), and a member of the Advisory Board for Metalmark Capital LLC (private equity investment, 2005-present). Mr. Stavropoulos is an operating advisor to Clayton, Dubilier & Rice, LLC (private equity investment). In addition, Mr. Stavropoulos is a member of the University of Notre Dame Advisory Council for the College of Science, a Trustee of the Rollin L. Gerstacker Foundation, and a Director of Artis-Naples in Naples, Florida. Previously, Mr. Stavropoulos served as a Director of Chemical Financial Corporation (bank holding company, 1993-2012) and Tyco International, Ltd. (multinational manufacturing and services, 2007-2012).
David M. Thomas (1949)
Year of Election or Appointment: 2008 Trustee
Mr. Thomas also serves as Trustee of other Fidelity® funds. Mr. Thomas serves as Non-Executive Chairman of the Board of Directors of Fortune Brands Home and Security (home and security products, 2011-present), as a member of the Board of Directors (2004-present) and Presiding Director (2013-present) of Interpublic Group of Companies, Inc. (marketing communi-cation), and as a member of the Board of Trustees of the University of Florida (2013-present). Previously, Mr. Thomas served as Executive Chairman (2005-2006) and Chairman and Chief Executive Officer (2000-2005) of IMS Health, Inc. (pharma-ceutical and healthcare information solutions), and a Director of Fortune Brands, Inc. (consumer products, 2000-2011).
+ The information includes the Trustee’s principal occupation during the last five years and other information relating to the experience, attri-butes, and skills relevant to the Trustee’s qualifications to serve as a Trustee, which led to the conclusion that the Trustee should serve as a Trustee for the fund.
Advisory Board Members and Officers:
Correspondence intended for an officer or Peter S. Lynch may be sent to Fidelity Investments, 245 Summer Street, Boston, Massachusetts 02210. Officers appear below in alphabetical order.
Name, Year of Birth; Principal Occupation
Peter S. Lynch (1944)
Year of Election or Appointment: 2003 Member of the Advisory Board
Mr. Lynch also serves as Member of the Advisory Board of other Fidelity® funds. Mr. Lynch is Vice Chairman and a Director of FMR (investment adviser firm) and FMR Co., Inc. (investment adviser firm). In addition, Mr. Lynch serves as a Trustee of Boston College and as the Chairman of the Inner-City Scholarship Fund. Previously, Mr. Lynch served on the Special Olympics International Board of Directors (1997-2006).

28Annual Report
Trustees and Officers – continued
Elizabeth Paige Baumann (1968)
Year of Election or Appointment: 2017 Anti-Money Laundering (AML) Officer
Ms. Baumann also serves as AML Officer of other funds. She is Chief AML Officer (2012-present) and Senior Vice President (2014-present) of FMR LLC (diversified financial services company) and is an employee of Fidelity Investments. Previously, Ms. Baumann served as AML Officer of the funds (2012-2016), and Vice President (2007-2014) and Deputy Anti-Money Laundering Officer (2007-2012) of FMR LLC.
Marc R. Bryant (1966)
Year of Election or Appointment: 2015 Secretary and Chief Legal Officer (CLO)
Mr. Bryant also serves as Secretary and CLO of other funds. Mr. Bryant serves as CLO, Secretary, and Senior Vice President of Fidelity Management & Research Company (investment adviser firm, 2015-present) and FMR Co., Inc. (investment adviser firm, 2015-present); Secretary of Fidelity SelectCo, LLC (investment adviser firm, 2015-present) and Fidelity Investments Money Management, Inc. (investment adviser firm, 2015-present); and CLO of Fidelity Management & Research (Hong Kong) Limited and FMR Investment Management (UK) Limited (investment adviser firms, 2015-present) and Fidelity Management & Research (Japan) Limited (investment adviser firm, 2016-present). He is Senior Vice President and Deputy General Counsel of FMR LLC (diversified financial services company). Previously, Mr. Bryant served as Secretary and CLO of Fidelity Rutland Square Trust II (2010-2014) and Assistant Secretary of Fidelity’s Fixed Income and Asset Allocation Funds (2013-2015). Prior to joining Fidelity Investments, Mr. Bryant served as a Senior Vice President and the Head of Global Retail Legal for AllianceBernstein L.P. (2006-2010), and as the General Counsel for ProFund Advisors LLC (2001-2006).
William C. Coffey (1969)
Year of Election or Appointment: 2009 Assistant Secretary
Mr. Coffey also serves as Assistant Secretary of other funds. He is Senior Vice President and Deputy General Counsel of FMR LLC (diversified financial services company, 2010-present), and is an employee of Fidelity Investments. Previously, Mr. Coffey served as Vice President and Associate General Counsel of FMR LLC (2005-2009).
Jonathan Davis (1968)
Year of Election or Appointment: 2010 Assistant Treasurer
Mr. Davis also serves as Assistant Treasurer of other funds. Mr. Davis serves as Assistant Treasurer of FMR Capital, Inc. (2017-present) and is an employee of Fidelity Investments. Previously, Mr. Davis served as Vice President and Associate General Counsel of FMR LLC (diversified financial services company, 2003-2010).
Adrien E. Deberghes (1967)
Year of Election or Appointment: 2016 Assistant Treasurer
Mr. Deberghes also serves as an officer of other funds. He serves as Assistant Treasurer of FMR Capital, Inc. (2017-present), Executive Vice President of Fidelity Investments Money Management, Inc. (FIMM) (investment adviser firm, 2016-present), and is an employee of Fidelity Investments (2008-present). Prior to joining Fidelity Investments, Mr. Deberghes was Senior Vice President of Mutual Fund Administration at State Street Corporation (2007-2008), Senior Director of Mutual Fund Administration at Investors Bank & Trust (2005-2007), and Director of Finance for Dunkin’ Brands (2000-2005). Previously, Mr. Deberghes served in other fund officer roles.
Stephanie J. Dorsey (1969)
Year of Election or Appointment: 2010 Assistant Treasurer
Ms. Dorsey also serves as an officer of other funds. Ms. Dorsey serves as Assistant Treasurer of FMR Capital, Inc. (2017-pres-ent), is an employee of Fidelity Investments (2008-present), and has served in other fund officer roles. Prior to joining Fidelity Investments, Ms. Dorsey served as Treasurer (2004-2008) of the JPMorgan Mutual Funds and Vice President (2004-2008) of JPMorgan Chase Bank.

29 Annual Report
Howard J. Galligan III (1966)
Year of Election or Appointment: 2014 Chief Financial Officer
Mr. Galligan also serves as Chief Financial Officer of other funds. Mr. Galligan serves as President of Fidelity Pricing and Cash Management Services (FPCMS) (2014-present) and as a Director of Strategic Advisers, Inc. (investment adviser firm, 2008-present). Previously, Mr. Galligan served as Chief Administrative Officer of Asset Management (2011-2014) and Chief Operating Officer and Senior Vice President of Investment Support for Strategic Advisers, Inc. (2003-2011).
Brian B. Hogan (1964)
Year of Election or Appointment: 2009 Vice President
Mr. Hogan also serves as Trustee or Vice President of other funds. Mr. Hogan serves as a Director of FMR Investment Management (UK) Limited (investment adviser firm, 2015-present) and Fidelity SelectCo, LLC (investment adviser firm, 2014-present) and President of the Equity Division of FMR (investment adviser firm, 2009-present). Previously, Mr. Hogan served as Senior Vice President, Equity Research of FMR (2006-2009) and as a portfolio manager. Mr. Brian B. Hogan is not related to Mr. Colm A. Hogan.
Colm A. Hogan (1973)
Year of Election or Appointment: 2016 Deputy Treasurer
Mr. Hogan also serves as an officer of other funds. Mr. Hogan serves as Assistant Treasurer of FMR Capital, Inc. (2017-pres-ent) and is an employee of Fidelity Investments (2005-present). Mr. Colm A. Hogan is not related to Mr. Brian B. Hogan.
Chris Maher (1972)
Year of Election or Appointment: 2013 Assistant Treasurer
Mr. Maher serves as Assistant Treasurer of other funds. Mr. Maher is Vice President of Valuation Oversight, serves as Assistant Treasurer of FMR Capital, Inc. (2017-present), and is an employee of Fidelity Investments. Previously, Mr. Maher served as Vice President of Asset Management Compliance (2013), Vice President of the Program Management Group of FMR (invest-ment adviser firm, 2010-2013), and Vice President of Valuation Oversight (2008-2010).
Rieco E. Mello (1969)
Year of Election or Appointment: 2017 Assistant Treasurer
Mr. Mello also serves as Assistant Treasurer of other funds. Mr. Mello serves as Assistant Treasurer of FMR Capital, Inc. (2017-present) and is an employee of Fidelity Investments (1995-present).
Melissa M. Reilly (1971)
Year of Election or Appointment: 2014 Vice President of certain Equity Funds
Ms. Reilly also serves as Vice President of other funds. Ms. Reilly is an employee of Fidelity Investments (2004-present).
Kenneth B. Robins (1969)
Year of Election or Appointment: 2016 Chief Compliance Officer
Mr. Robins also serves as an officer of other funds. Mr. Robins serves as Compliance Officer of Fidelity Management & Research Company and FMR Co., Inc. (investment adviser firms, 2016-present) and is an employee of Fidelity Investments (2004-present). Previously, Mr. Robins served as Executive Vice President of Fidelity Investments Money Management, Inc. (investment adviser firm, 2013-2016) and served in other fund officer roles.
Stacie M. Smith (1974)
Year of Election or Appointment: 2016 President and Treasurer
Ms. Smith also serves as an officer of other funds. Ms. Smith serves as Assistant Treasurer of FMR Capital, Inc. (2017-pres-ent), is an employee of Fidelity Investments (2009-present), and has served in other fund officer roles. Prior to joining Fidelity Investments, Ms. Smith served as Senior Audit Manager of Ernst & Young LLP (accounting firm, 1996-2009). Previously, Ms. Smith served as Deputy Treasurer of certain Fidelity® funds (2013-2016).

30Annual Report
Trustees and Officers – continued
Marc L. Spector (1972)
Year of Election or Appointment: 2016 Assistant Treasurer
Mr. Spector also serves as an officer of other funds. Mr. Spector serves as Assistant Treasurer of FMR Capital, Inc. (2017-pres-ent) and is an employee of Fidelity Investments (2016-present). Prior to joining Fidelity Investments, Mr. Spector served as Director at the Siegfried Group (accounting firm, 2013-2016), and prior to Siegfried Group as audit senior manager at Deloitte & Touche (accounting firm, 2005-2013).
Renee Stagnone (1975)
Year of Election or Appointment: 2016 Assistant Treasurer
Ms. Stagnone also serves as an officer of other funds. Ms. Stagnone serves as Assistant Treasurer of FMR Capital, Inc. (2017-present) and is an employee of Fidelity Investments (1997-present). Previously, Ms. Stagnone served as Deputy Treasurer of certain Fidelity® funds (2013-2016).

31 Annual Report
Shareholder Expense Example
As a shareholder of the Fund, you incur two types of costs: (1) transaction costs, and (2) ongoing costs, including management fees, distribution and/or service (12b-1) fees and other Fund expenses. This Example is intended to help you understand your ongoing costs (in dollars) of invest-ing in the Fund and to compare these costs with the ongoing costs of investing in other mutual funds.The Example is based on an investment of $1,000 invested at the beginning of the period and held for the entire period (July 1, 2017 to December 31, 2017).Actual ExpensesThe first line of the accompanying table for each class of the Fund provides information about actual account values and actual expenses. You may use the information in this line, together with the amount you invested, to estimate the expenses that you paid over the period. Simply divide your account value by $1,000.00 (for example, an $8,600 account value divided by $1,000.00 = 8.6), then multiply the result by the number in the first line for a class of the Fund under the heading entitled “Expenses Paid During Period” to estimate the expenses you paid on your account during this period. The estimate of expenses does not include any fees or other expenses of any variable annuity or variable life insurance prod-uct. If they were, the estimate of expenses you paid during the period would be higher, and your ending account value would be lower. In addition, the Fund, as a shareholder in the underlying Fidelity Central Funds, will indirectly bear its pro-rata share of the fees and expenses incurred by the underlying Fidelity Central Funds. These fees and expenses are not included in the Fund’s annualized expense ratio used to calculate the expense estimate in the table below.Hypothetical Example for Comparison PurposesThe second line of the accompanying table for each class of the Fund provides information about hypothetical account values and hypotheti-cal expenses based on a Class’ actual expense ratio and an assumed rate of return of 5% per year before expenses, which is not the Class’ actual return. The hypothetical account values and expenses may not be used to estimate the actual ending account balance or expenses you paid for the period. You may use this information to compare the ongoing costs of investing in the Fund and other funds. To do so, compare this 5% hypothetical example with the 5% hypothetical examples that appear in the shareholder reports of the other funds. The estimate of expenses does not include any fees or other expenses of any variable annuity or variable life insurance product. If they were, the estimate of expenses you paid during the period would be higher, and your ending account value would be lower. In addition, the Fund, as a shareholder in the underlying Fidelity Central Funds, will indirectly bear its pro-rata share of the fees and expenses incurred by the underlying Fidelity Central Funds. These fees and expenses are not included in the Fund’s annualized expense ratio used to calculate the expense estimate in the table below.Please note that the expenses shown in the table are meant to highlight your ongoing costs only and do not reflect any transaction costs. Therefore, the second line of the table is useful in comparing ongoing costs only, and will not help you determine the relative total costs of owning different funds.
Annualized Expense Ratio- A
Beginning Account Value July 1, 2017
Ending Account Value
December 31, 2017
Expenses Paid During Period- B
July 1, 2017 to December 31, 2017
Initial Class .66%Actual $1,000.00 $1,121.20 $3.53Hypothetical- C $1,000.00 $1,021.88 $3.36Service Class .76%Actual $1,000.00 $1,120.80 $4.06Hypothetical- C $1,000.00 $1,021.37 $3.87Service Class 2 .91%Actual $1,000.00 $1,120.20 $4.86Hypothetical- C $1,000.00 $1,020.62 $4.63Investor Class .74%Actual $1,000.00 $1,121.00 $3.96Hypothetical- C $1,000.00 $1,021.48 $3.77
A Annualized expense ratio reflects expenses net of applicable fee waivers.B Expenses are equal to each Class’ annualized expense ratio, multiplied by the average account value over the period, multiplied by 184/365 (to reflect the one-half year
period).C 5% return per year before expenses

32Annual Report
Distributions (Unaudited)
The Board of Trustees of VIP Growth Opportunities Portfolio voted to pay to shareholders of record at the opening of business on record date, the following distributions per share derived from capital gains realized from sales of portfolio securities, and dividends derived from net investment income:
Pay Date Record Date Dividends Capital GainsVIP Growth Opportunities Portfolio Initial Class 02/09/18 02/09/18 $ 0.048 $ 2.064Service Class 02/09/18 02/09/18 $ 0.042 $ 2.064Service Class 2 02/09/18 02/09/18 $ 0.034 $ 2.064Investor Class 02/09/18 02/09/18 $ 0.044 $ 2.064
The fund hereby designates as a capital gain dividend with respect to the taxable year ended December 31, 2017, $39,000,824, or, if subsequently determined to be different, the net capital gain of such year.
Initial Class designates 85%, and 28%; Service Class designates 100%, and 29%; Service Class 2 designates 100%, and 30%; and Investor Class designates 100%, and 29% of the dividends distributed in February and December, 2017, respectively during the fiscal year as qualifying for the dividends–received deduction for corporate shareholders.

33 Annual Report
Board Approval of Investment Advisory Contracts and Management Fees
VIP Growth Opportunities Portfolio
Each year, the Board of Trustees, including the Independent Trustees (together, the Board), votes on the renewal of the management contract with Fidelity Management & Research Company (FMR) and the sub-advisory agreements (together, the Advisory Contracts) for the fund. FMR and the sub-advisers are referred to herein as the Investment Advisers. The Board, assisted by the advice of fund counsel and Independent Trustees’ counsel, requests and considers a broad range of information relevant to the renewal of the Advisory Contracts throughout the year.
The Board meets regularly and, at each of its meetings, covers an extensive agenda of topics and materials and considers factors that are relevant to its annual consideration of the renewal of the fund’s Advisory Contracts, including the services and support provided to the fund and its share-holders. The Board has established various standing committees (Committees), each composed of and chaired by Independent Trustees with varying backgrounds, to which the Board has assigned specific subject matter responsibilities in order to enhance effective decision-making by the Board. The Board, acting directly and through its Committees, requests and receives information concerning the annual consideration of the renewal of the fund’s Advisory Contracts. The Board also meets as needed to review matters specifically related to the Board’s annual consider-ation of the renewal of the Advisory Contracts. Members of the Board may also meet with trustees of other Fidelity funds through ad hoc joint committees to discuss certain matters relevant to all of the Fidelity funds.
At its July 2017 meeting, the Board unanimously determined to renew the fund’s Advisory Contracts. In reaching its determination, the Board considered all factors it believed relevant, including (i) the nature, extent, and quality of the services to be provided to the fund and its share-holders (including the investment performance of the fund); (ii) the competitiveness of the fund’s management fee and total expense ratio relative to peer funds; (iii) the total costs of the services to be provided by and the profits to be realized by Fidelity from its relationships with the fund; and (iv) the extent to which, if any, economies of scale exist and would be realized as the fund grows, and whether any economies of scale are appropriately shared with fund shareholders.
In considering whether to renew the Advisory Contracts for the fund, the Board reached a determination, with the assistance of fund counsel and Independent Trustees’ counsel and through the exercise of its business judgment, that the renewal of the Advisory Contracts was in the best interests of the fund and its shareholders and that the compensation payable under the Advisory Contracts was fair and reasonable. The Board’s decision to renew the Advisory Contracts was not based on any single factor, but rather was based on a comprehensive consideration of all the information provided to the Board at its meetings throughout the year. The Board, in reaching its determination to renew the Advisory Contracts, was aware that shareholders of the fund have a broad range of investment choices available to them, including a wide choice among funds offered by Fidelity’s competitors, and that the fund’s shareholders, who have the opportunity to review and weigh the disclosure provided by the fund in its prospectus and other public disclosures, have chosen to invest in this fund, which is part of the Fidelity family of funds.
Amendment to Group Fee Rate. The Board also approved an amendment to the management contract for the fund to add an additional break-point to the group fee schedule, effective October 1, 2017. The Board noted that the additional breakpoint would result in lower management fee rates as Fidelity’s assets under management increase.
Nature, Extent, and Quality of Services Provided. The Board considered Fidelity’s staffing as it relates to the fund, including the back-grounds of investment personnel of Fidelity, and also considered the fund’s investment objective, strategies, and related investment philosophy. The Independent Trustees also had discussions with senior management of Fidelity’s investment operations and investment groups. The Board considered the structure of the investment personnel compensation program and whether this structure provides appropriate incentives to act in the best interests of the fund. Additionally, the Board considered the portfolio managers’ investments, if any, in the funds that they manage.
Resources Dedicated to Investment Management and Support Services. The Board and the Fund Oversight and Research Committees reviewed the general qualifications and capabilities of Fidelity’s investment staff, including its size, education, experience, and resources, as well as Fidelity’s approach to recruiting, training, managing, and compensating investment personnel. The Board noted that Fidelity has continued to increase the resources devoted to non-U.S. offices, including expansion of Fidelity’s global investment organization. The Board also noted that Fidelity’s analysts have extensive resources, tools and capabilities that allow them to conduct sophisticated quantitative and fundamental analysis, as well as credit analysis of issuers, counterparties and guarantors. Further, the Board considered that Fidelity’s investment profession-als have sufficient access to global information and data so as to provide competitive investment results over time, and that those professionals also have access to sophisticated tools that permit them to assess portfolio construction and risk and performance attribution characteristics continuously, as well as to transmit new information and research conclusions rapidly around the world. Additionally, in its deliberations, the Board considered Fidelity’s trading, risk management, compliance, and technology and operations capabilities and resources, which are integral parts of the investment management process.
Shareholder and Administrative Services. The Board considered (i) the nature, extent, quality, and cost of advisory, administrative, and share-holder services performed by the Investment Advisers and their affiliates under the Advisory Contracts and under separate agreements covering transfer agency, pricing and bookkeeping, and securities lending services for the fund; (ii) the nature and extent of the supervision of third party service providers, principally custodians, subcustodians, and pricing vendors; and (iii) the resources devoted to, and the record of compliance with, the fund’s compliance policies and procedures. The Board also reviewed the allocation of fund brokerage, including allocations to brokers

34Annual Report
Board Approval of Investment Advisory Contracts and Management Fees – continued
affiliated with the Investment Advisers, the use of brokerage commissions to pay fund expenses, and the use of “soft” commission dollars to pay for research services.
The Board noted that the growth of fund assets over time across the complex allows Fidelity to reinvest in the development of services designed to enhance the value or convenience of the Fidelity funds as investment vehicles. These services include 24-hour access to account information and market information through telephone representatives and over the Internet, investor education materials and asset allocation tools, and the expanded availability of Fidelity Investor Centers.
In 2014, the Board formed an ad hoc Committee on Transfer Agency Fees to review the variety of transfer agency fee structures throughout the industry and Fidelity’s competitive positioning with respect to industry participants.
Investment in a Large Fund Family. The Board considered the benefits to shareholders of investing in a Fidelity fund, including the benefits of investing in a fund that is part of a large family of funds offering a variety of investment disciplines and providing a large variety of mutual fund investor services. The Board noted that Fidelity had taken, or had made recommendations that resulted in the Fidelity funds taking, a number of actions over the previous year that benefited particular funds, including: (i) continuing to dedicate additional resources to Fidelity’s invest-ment research process, and to the support of the senior management team that oversees asset management; (ii) continuing efforts to enhance Fidelity’s global research capabilities; (iii) launching new funds and making other enhancements to meet client needs; (iv) launching new share classes of existing funds; (v) eliminating purchase minimums and broadening eligibility requirements for certain lower-priced share classes; (vi) reducing management fees and total expenses for certain growth equity funds and index funds; (vii) lowering expense caps for certain existing funds and classes to reduce expenses borne by shareholders; (viii) eliminating short-term redemption fees for certain funds; (ix) introducing a new pricing structure for certain funds of funds that is expected to reduce overall expenses paid by shareholders; (x) rationalizing product lines and gaining increased efficiencies through proposals for fund mergers and share class consolidations; (xi) continuing to develop, acquire and implement systems and technology to improve services to the funds and shareholders, strengthen information security, and increase efficiency; and (xii) implementing enhancements to further strengthen Fidelity’s product line to increase investors’ probability of success in achieving their investment goals, including retirement income goals.
Investment Performance. The Board considered whether the fund has operated in accordance with its investment objective, as well as its record of compliance with its investment restrictions and its performance history.
The Board took into account discussions with representatives of the Investment Advisers about fund investment performance that occur at Board meetings throughout the year. In this regard the Board noted that as part of regularly scheduled fund reviews and other reports to the Board on fund performance, the Board considers annualized return information for the fund for different time periods, measured against a securities market index (“benchmark index”) and a peer group of funds with similar objectives (“peer group”), if any. In its evaluation of fund investment performance, the Board gave particular attention to information indicating changes in performance of certain Fidelity funds for specific time periods and discussed with the Investment Advisers the reasons for any overperformance or underperformance.
In addition to reviewing absolute and relative fund performance, the Independent Trustees periodically consider the appropriateness of fund performance metrics in evaluating the results achieved. In general, the Independent Trustees believe that fund performance should be evaluated based on net performance (after fees and expenses) of both the highest performing and lowest performing fund share classes, where applicable, compared to appropriate benchmark indices, over appropriate time periods that may include full market cycles, and compared to peer groups, as applicable, over the same periods, taking into account relevant factors including the following: general market conditions; issuer-specific infor-mation; and fund cash flows and other factors.
The Independent Trustees recognize that shareholders evaluate performance on a net basis over their own holding periods, for which one-, three-, and five-year periods are often used as a proxy. For this reason, the performance information reviewed by the Board also included net cumulative calendar year total return information for the fund and an appropriate benchmark index and peer group for the most recent one-, three-, and five-year periods, as shown below. Returns are shown compared to the 25th percentile (top of box, 75% beaten) and 75th percentile (bottom of box, 25% beaten) of the peer universe.

35 Annual Report
VIP Growth Opportunities Portfolio
The Board has discussed the fund’s underperformance (based on the December 31, 2016 data presented herein) with FMR, including the fund’s investment strategy, the portfolio management team, and broader trends in the market that may have impacted the fund’s performance, and has engaged with FMR to consider what steps might be taken to remediate the fund’s underperformance. The Board noted that the fund’s perfor-mance has improved since the period shown. The Board noted that there were portfolio management changes for the fund in March 2015, July 2015, and September 2016.
Based on its review, the Board concluded that the nature, extent, and quality of services provided to the fund under the Advisory Contracts should continue to benefit the shareholders of the fund.
Competitiveness of Management Fee and Total Expense Ratio. The Board considered the fund’s management fee and total expense ratio compared to “mapped groups” of competitive funds and classes created for the purpose of facilitating the Trustees’ competitive analysis of management fees and total expenses. Fidelity creates “mapped groups” by combining similar Lipper investment objective categories that have comparable investment mandates. Combining Lipper investment objective categories aids the Board’s management fee and total expense ratio comparisons by broadening the competitive group used for comparison.
Management Fee. The Board considered two proprietary management fee comparisons for the 12-month periods shown in basis points (BP) in the chart below. The group of Lipper funds used by the Board for management fee comparisons is referred to below as the “Total Mapped Group.” The Total Mapped Group comparison focuses on a fund’s standing in terms of gross management fees before expense reimbursements or caps relative to the total universe of funds with comparable investment mandates, regardless of whether their management fee structures also are comparable. Funds with comparable investment mandates offer exposure to similar types of securities. Funds with comparable management fee structures have similar management fee contractual arrangements (e.g., flat rate charged for advisory services, all-inclusive fee rate, etc.). “TMG %” represents the percentage of funds in the Total Mapped Group that had management fees that were lower than the fund’s. For example, a hypothetical TMG % of 20% would mean that 80% of the funds in the Total Mapped Group had higher, and 20% had lower, management fees than the fund. The fund’s actual TMG %s and the number of funds in the Total Mapped Group are in the chart below. The “Asset-Size Peer Group” (ASPG) comparison focuses on a fund’s standing relative to a subset of non-Fidelity funds within the Total Mapped Group that are similar in size and management fee structure. For example, if a fund is in the first quartile of the ASPG, the fund’s management fee ranks in the least expensive or lowest 25% of funds in the ASPG. The ASPG represents at least 15% of the funds in the Total Mapped Group with comparable asset size and management fee structures, subject to a minimum of 50 funds (or all funds in the Total Mapped Group if fewer than 50). Additional information, such as the ASPG quartile in which the fund’s management fee rate ranked, is also included in the chart and considered by the Board.

36Annual Report
Board Approval of Investment Advisory Contracts and Management Fees – continued
VIP Growth Opportunities Portfolio
The Board noted that the fund’s management fee rate ranked below the median of its Total Mapped Group and below the median of its ASPG for 2016.
The Board noted that, in 2014, the Board and the boards of other Fidelity funds formed the ad hoc Committee on Group Fee to conduct an in-depth review of the “group fee” component of the management fee of funds with such management fee structures. The Committee’s focus included the mechanics of the group fee, the competitive landscape of group fee structures, Fidelity funds with no group fee component and investment products not included in group fee assets. The Board also considered that, for funds subject to the group fee, FMR agreed to vol-untarily waive fees over a specified period of time in amounts designed to account for assets converted from certain funds to certain collective investment trusts.
The Board also noted that, in 2013, the ad hoc Committee on Management Fees was formed to conduct an in-depth review of the management fee rates of Fidelity’s active equity mutual funds. The Committee focused on the following areas: (i) standard fee structures; (ii) research consump-tion and trading evolution; (iii) management fee competitiveness/profitability by category; and (iv) factors that drive institutional pricing.
Based on its review, the Board concluded that the fund’s management fee is fair and reasonable in light of the services that the fund receives and the other factors considered.
Total Expense Ratio. In its review of each class’s total expense ratio, the Board considered the fund’s management fee rate as well as other fund or class expenses, as applicable, such as transfer agent fees, pricing and bookkeeping fees, fund-paid 12b-1 fees, and custodial, legal, and audit fees. The Board also noted that Fidelity may agree to waive fees and expenses from time to time, and the extent to which, if any, it has done so for the fund. As part of its review, the Board also considered the current and historical total expense ratios of each class of the fund compared to competitive fund median expenses. Each class of the fund is compared to those funds and classes in the Total Mapped Group (used by the Board for management fee comparisons) that have a similar sales load structure.
The Board noted that the total expense ratio of each of Initial Class, Investor Class, and Service Class ranked below the competitive median for 2016 and the total expense ratio of Service Class 2 ranked above the competitive median for 2016. The Board considered that, in general, various factors can affect total expense ratios. The Board noted that the total expense ratio of Service Class 2 was above the competitive median because of its 12b-1 fees. The Board noted that the fund offers multiple classes, each of which has a different 12b-1 fee structure, and that the multiple structures are intended to offer a range of pricing options for the intermediary market. The Board also noted that the total expense ratios of the classes vary primarily by the level of their 12b-1 fees, although differences in transfer agent fees may also cause expenses to vary from class to class.
Fees Charged to Other Fidelity Clients. The Board also considered Fidelity fee structures and other information with respect to clients of Fidelity, such as other funds advised or subadvised by Fidelity, pension plan clients, and other institutional clients with similar mandates. The Board noted that an ad hoc joint committee created by it and the boards of other Fidelity funds periodically (most recently in 2013) reviews and com-pares Fidelity’s institutional investment advisory business with its business of providing services to the Fidelity funds, including the differences in services provided, fees charged, and costs incurred, as well as competition in their respective marketplaces.
Based on its review of total expense ratios and fees charged to other Fidelity clients, the Board concluded that, although Service Class 2 was above the median of the universe presented for comparison, the total expense ratio of each class of the fund was reasonable in light of the ser-vices that the fund and its shareholders receive and the other factors considered.

37 Annual Report
Costs of the Services and Profitability. The Board considered the revenues earned and the expenses incurred by Fidelity in conducting the business of developing, marketing, distributing, managing, administering and servicing the fund and servicing the fund’s shareholders. The Board also considered the level of Fidelity’s profits in respect of all the Fidelity funds.
On an annual basis, Fidelity presents to the Board information about the profitability of its relationships with the fund. Fidelity calculates profit-ability information for each fund, as well as aggregate profitability information for groups of Fidelity funds and all Fidelity funds, using a series of detailed revenue and cost allocation methodologies which originate with the books and records of Fidelity on which Fidelity’s audited financial statements are based. The Audit Committee of the Board reviews any significant changes from the prior year’s methodologies.
PricewaterhouseCoopers LLP (PwC), independent registered public accounting firm and auditor to Fidelity and certain Fidelity funds, has been engaged annually by the Board as part of the Board’s assessment of Fidelity’s profitability analysis. PwC’s engagement includes the review and assessment of the methodologies used by Fidelity in determining the revenues and expenses attributable to Fidelity’s mutual fund business, and completion of agreed-upon procedures in respect of the mathematical accuracy of the fund profitability information and its conformity to established allocation methodologies. After considering PwC’s reports issued under the engagement and information provided by Fidelity, the Board concluded that while other allocation methods may also be reasonable, Fidelity’s profitability methodologies are reasonable in all material respects.
The Board also reviewed Fidelity’s non-fund businesses and potential fall-out benefits related to the mutual fund business as well as cases where Fidelity’s affiliates may benefit from or be related to the fund’s business.
The Board considered the costs of the services provided by and the profits realized by Fidelity in connection with the operation of the fund and was satisfied that the profitability was not excessive.
Economies of Scale. The Board considered whether there have been economies of scale in respect of the management of the Fidelity funds, whether the Fidelity funds (including the fund) have appropriately benefited from any such economies of scale, and whether there is potential for realization of any further economies of scale. The Board considered the extent to which the fund will benefit from economies of scale as assets grow through increased services to the fund, through waivers or reimbursements, or through fee or expense ratio reductions. The Board also noted that a committee (the Economies of Scale Committee) created by it and the boards of other Fidelity funds periodically (most recently in 2013) analyzes whether Fidelity attains economies of scale in respect of the management and servicing of the Fidelity funds, whether the Fidelity funds have appropriately benefited from such economies of scale, and whether there is potential for realization of any further economies of scale.
The Board recognized that the fund’s management contract incorporates a “group fee” structure, which provides for lower group fee rates as total group assets increase, and for higher group fee rates as total group assets decrease (with “group assets” defined to include fund assets under FMR’s management plus the assets of sector funds previously under FMR’s management). FMR calculates the group fee rates based on a tiered asset “breakpoint” schedule that varies based on asset class. The Board considered that the group fee is designed to deliver the benefits of economies of scale to fund shareholders when total Fidelity fund assets increase, even if assets of any particular fund are unchanged or have declined, because some portion of Fidelity’s costs are attributable to services provided to all Fidelity funds, and all funds benefit if those costs can be allocated among more assets. The Board concluded that, given the group fee structure, fund shareholders will benefit from lower management fees as group assets increase at the fund complex level, regardless of whether Fidelity achieves any such economies of scale.
The Board concluded, taking into account the analysis of the Economies of Scale Committee, that economies of scale, if any, are being appropri-ately shared between fund shareholders and Fidelity.
Additional Information Requested by the Board. In order to develop fully the factual basis for consideration of the Fidelity funds’ advisory contracts, the Board requested and received additional information on certain topics, including: (i) fund performance trends, in particular the underperformance of certain funds, and Fidelity’s long-term strategies for certain funds; (ii) Fidelity’s fund profitability methodology, profitability trends for certain funds, and the impact of certain factors on fund profitability results, including the impact of market trends on actively managed funds; (iii) the use of performance fees and the calculation of performance adjustments, including the impact of underperformance and fund outflows on performance adjustments; (iv) metrics for evaluating index fund performance; (v) Fidelity’s group fee structure, including the group fee breakpoint schedules; (vi) the terms of Fidelity’s contractual and voluntary expense cap arrangements with the funds; (vii) the methodology with respect to evaluating competitive fund data and peer group classifications and fee comparisons; (viii) the expense structures for different funds and classes; (ix) Fidelity’s arrangements with affiliated sub-advisers on behalf of the funds; (x) information regarding other accounts man-aged by Fidelity, including institutional accounts and collective investment trusts; (xi) recent changes to the fee structure for certain funds of funds; and (xii) the impact of the Department of Labor’s new fiduciary rule on the funds’ comparative expense information.
Based on its evaluation of all of the conclusions noted above, and after considering all factors it believed relevant, the Board concluded that the advisory fee structures are fair and reasonable, and that the fund’s Advisory Contracts should be renewed.

VIPGRO-ANN-0218 1.540209.120