field crops usual planting and harvesting dates...
TRANSCRIPT

United States Department of Agriculture National Agricultural Statistics Service
Agricultural Handbook Number 628
Field Crops Usual Planting and Harvesting Dates October 2010

Field Crops Usual Planting and Harvesting Dates (October 2010) 3 USDA, National Agricultural Statistics Service
Contents
Introduction ............................................................................................................................................................................. 5
Barley ...................................................................................................................................................................................... 6
Barley for Grain, Harvested Acres: 2007 ................................................................................................................................ 6
Fall Barley Usual Planting and Harvesting Dates – States ..................................................................................................... 7
Spring Barley Usual Planting and Harvesting Dates – States ................................................................................................. 7
Corn......................................................................................................................................................................................... 8
Corn for Grain, Harvested Acres: 2007 .................................................................................................................................. 8
Corn for Grain Usual Planting and Harvesting Dates – States ............................................................................................... 9
All Cotton.............................................................................................................................................................................. 10
All Cotton, Harvested Acres: 2007 ....................................................................................................................................... 10
All Cotton Usual Planting and Harvesting Dates – States .................................................................................................... 11
Alfalfa Hay ............................................................................................................................................................................ 12
Alfalfa Hay, Harvested Acres: 2007 ..................................................................................................................................... 12
Alfalfa Hay Usual Planting and Harvesting Dates – States .................................................................................................. 13
Other Hay .............................................................................................................................................................................. 14
Other Tame Hay, Harvested Acres: 2007 ............................................................................................................................. 14
Other Hay Usual Planting and Harvesting Dates – States .................................................................................................... 15
Oats ....................................................................................................................................................................................... 16
Oats for Grain, Harvested Acres: 2007 ................................................................................................................................. 16
Fall Oat Usual Planting and Harvesting Dates – States ........................................................................................................ 17
Spring Oat Usual Planting and Harvesting Dates – States .................................................................................................... 17
Peanuts .................................................................................................................................................................................. 18
Peanuts for Nuts, Harvested Acres: 2007 ............................................................................................................................. 18
Peanut Usual Planting and Harvesting Dates – States .......................................................................................................... 19
All Rice ................................................................................................................................................................................. 20
Rice, Harvested Acres: 2007 ................................................................................................................................................. 20
All Rice Usual Planting and Harvesting Dates – States ........................................................................................................ 21
Sorghum ................................................................................................................................................................................ 22
Sorghum for Grain, Harvested Acres: 2007 .......................................................................................................................... 22
Sorghum for Grain Usual Planting and Harvesting Dates – States ....................................................................................... 23
Soybeans ............................................................................................................................................................................... 24
Soybeans for Beans, Harvested Acres: 2007 ........................................................................................................................ 24
Soybean Usual Planting and Harvesting Dates – States ....................................................................................................... 25
Sugarbeets ............................................................................................................................................................................. 26
Sugarbeets for Sugar, Harvested Acres: 2007....................................................................................................................... 26
Sugarbeet Usual Planting and Harvesting Dates – States ..................................................................................................... 27
All Sunflowers ...................................................................................................................................................................... 28
Sunflower Seed (Non-Oil Varieties), Harvested Acres: 2007 .............................................................................................. 28
Sunflower Seed (Oil Varieties), Harvested Acres: 2007 ...................................................................................................... 29
All Sunflower Usual Planting and Harvesting Dates – States .............................................................................................. 29
Tobacco ................................................................................................................................................................................. 30
Tobacco, Harvested Acres: 2007 .......................................................................................................................................... 30
Tobacco Usual Planting and Harvesting Dates by Class – States ......................................................................................... 31
Durum Wheat ........................................................................................................................................................................ 32
Spring Wheat ........................................................................................................................................................................ 32
Winter Wheat ........................................................................................................................................................................ 32
All Wheat for Grain, Harvested Acres: 2007 ........................................................................................................................ 33
Durum Wheat Usual Planting and Harvesting Dates – States .............................................................................................. 33
Spring Wheat Usual Planting and Harvesting Dates – States ............................................................................................... 33
Winter Wheat Usual Planting and Harvesting Dates – States ............................................................................................... 34
Usual Planting and Harvesting Dates by Crop – Alabama ................................................................................................... 35
Usual Planting and Harvesting Dates by Crop – Alaska ....................................................................................................... 35
4 Field Crops Usual Planting and Harvesting Dates (October 2010) USDA, National Agricultural Statistics Service
Usual Planting and Harvesting Dates by Crop – Arizona ..................................................................................................... 35
Usual Planting and Harvesting Dates by Crop – Arkansas ................................................................................................... 36
Usual Planting and Harvesting Dates by Crop – California .................................................................................................. 36
Usual Planting and Harvesting Dates by Crop – Colorado ................................................................................................... 36
Usual Planting and Harvesting Dates by Crop – Delaware ................................................................................................... 37
Usual Planting and Harvesting Dates by Crop – Florida ...................................................................................................... 37
Usual Planting and Harvesting Dates by Crop – Georgia ..................................................................................................... 37
Usual Planting and Harvesting Dates by Crop – Idaho ......................................................................................................... 38
Usual Planting and Harvesting Dates by Crop – Illinois ....................................................................................................... 38
Usual Planting and Harvesting Dates by Crop – Indiana ...................................................................................................... 38
Usual Planting and Harvesting Dates by Crop – Iowa .......................................................................................................... 39
Usual Planting and Harvesting Dates by Crop – Kansas ...................................................................................................... 39
Usual Planting and Harvesting Dates by Crop – Kentucky .................................................................................................. 39
Usual Planting and Harvesting Dates by Crop – Louisiana .................................................................................................. 40
Usual Planting and Harvesting Dates by Crop – Maryland .................................................................................................. 40
Usual Planting and Harvesting Dates by Crop – Michigan ................................................................................................... 40
Usual Planting and Harvesting Dates by Crop – Minnesota ................................................................................................. 41
Usual Planting and Harvesting Dates by Crop – Mississippi ................................................................................................ 41
Usual Planting and Harvesting Dates by Crop – Missouri .................................................................................................... 41
Usual Planting and Harvesting Dates by Crop – Montana .................................................................................................... 42
Usual Planting and Harvesting Dates by Crop – Nebraska ................................................................................................... 42
Usual Planting and Harvesting Dates by Crop – Nevada ...................................................................................................... 42
Usual Planting and Harvesting Dates by Crop – New England ............................................................................................ 43
Usual Planting and Harvesting Dates by Crop – New Jersey ............................................................................................... 43
Usual Planting and Harvesting Dates by Crop – New Mexico ............................................................................................. 43
Usual Planting and Harvesting Dates by Crop – New York ................................................................................................. 44
Usual Planting and Harvesting Dates by Crop – North Carolina .......................................................................................... 44
Usual Planting and Harvesting Dates by Crop – North Dakota ............................................................................................ 44
Usual Planting and Harvesting Dates by Crop – Ohio .......................................................................................................... 45
Usual Planting and Harvesting Dates by Crop – Oklahoma ................................................................................................. 45
Usual Planting and Harvesting Dates by Crop – Oregon ...................................................................................................... 45
Usual Planting and Harvesting Dates by Crop – Pennsylvania ............................................................................................. 46
Usual Planting and Harvesting Dates by Crop – South Carolina .......................................................................................... 46
Usual Planting and Harvesting Dates by Crop – South Dakota ............................................................................................ 46
Usual Planting and Harvesting Dates by Crop – Tennessee ................................................................................................. 47
Usual Planting and Harvesting Dates by Crop – Texas ........................................................................................................ 47
Usual Planting and Harvesting Dates by Crop – Utah .......................................................................................................... 47
Usual Planting and Harvesting Dates by Crop – Virginia ..................................................................................................... 48
Usual Planting and Harvesting Dates by Crop – Washington ............................................................................................... 48
Usual Planting and Harvesting Dates by Crop – West Virginia ........................................................................................... 48
Usual Planting and Harvesting Dates by Crop – Wisconsin ................................................................................................. 49
Usual Planting and Harvesting Dates by Crop – Wyoming .................................................................................................. 49
Information Contacts ............................................................................................................................................................. 50

Field Crops Usual Planting and Harvesting Dates (October 2010) 5 USDA, National Agricultural Statistics Service
Introduction State-level usual planting and harvesting dates for major field crops appear in this report. In addition, dot maps show
major areas of production based on 2007 Census of Agriculture data. The information was assembled by the National
Agricultural Statistics Service, based on the best and latest information available. The same data for vegetables may be
found in Usual Planting and Harvesting Dates for Fresh Market and Processing Vegetables Agriculture Handbook
Number 507, issued May 2007.
The dates shown indicate the periods in which the crops are planted and harvested in most years based on 20 years of
historical crop progress estimates, as well as the knowledge of industry specialists. Beginning dates indicate when
planting or harvesting is about 5 percent complete and ending dates when operations are about 95 percent complete. The
“most active” range indicates when between 15 and 85 percent of the crop is planted or harvested.
The “usual planting dates” are the times when crops are usually planted in the fields. For transplanted crops, such as
tobacco, the planting period refers to the time of setting plants in the field.
The “harvest dates” refer to the periods during which harvest of the crop actually occurs. Dates do not extend through the
subsequent period in which some commodities are stored in the field after harvest.

6 Field Crops Usual Planting and Harvesting Dates (October 2010) USDA, National Agricultural Statistics Service
Barley
Producers harvested 3.11 million acres of barley in the United States during 2009. After reaching a peak of nearly
17 million acres in 1942, harvested acreage has declined in recent years to levels reminiscent of the early 1880s. Yields,
however, have been steadily increasing, with a record high average yield of 73.0 bushels per acre recorded in 2009.
North Dakota continues to be the largest barley-producing State, harvesting 35 percent of the total United States
production in 2009. North Dakota, along with Idaho and Montana, the second and third ranking States, accounted for
nearly three-quarters of the 2009 barley production. Only minor acreages are grown in the eastern and southern States.
Most barley is fed to livestock, with the remainder of the crop used for malting purposes.

Field Crops Usual Planting and Harvesting Dates (October 2010) 7 USDA, National Agricultural Statistics Service
Fall Barley Usual Planting and Harvesting Dates – States
State 2009
Harvested acres
Usual planting dates Usual harvesting dates
Begin Most active End Begin Most active End
(1,000 acres)
Arizona ........................... California ........................ Delaware ........................ Kansas ........................... Maryland ......................... North Carolina ................ Pennsylvania .................. Virginia ...........................
45 55 26 9
48 19 45 43
Nov 10 Sep 15 Sep 27 Sep 15 Sep 17 Sep 25 Aug 25 Sep 18
Dec 1 - Dec 30 Oct 1 - Apr 15 Oct 9 - Oct 27 Oct 1 - Oct 15 Oct 1 - Oct 21 Oct 15 - Nov 10 Sep 15 - Oct 15 Sep 26 - Oct 29
Feb 10 Apr 30 Nov 10 Nov 1 Nov 7 Dec 1 Oct 25 Nov 8
May 10 May 15 Jun 5 Jun 20 Jun 12 May 25 Jun 20 May 28
May 30 - Jun 20 Jun 1 - Jul 15 Jun 12 - Jun 28 Jun 15 - Jul 1 Jun 16 - Jun 28 Jun 10 - Jun 30 Jun 25 - Jul 20 Jun 6 - Jun 25
Jul 10 Aug 15 Jul 3 Jul 5 Jul 8 Jul 25 Aug 10 Jul 1
Spring Barley Usual Planting and Harvesting Dates – States
State 2009
Harvested acres
Usual planting dates Usual harvesting dates
Begin Most active End Begin Most active End
(1,000 acres)
Alaska ............................ California ........................ Colorado ......................... Idaho .............................. Kansas ........................... Maine ............................. Michigan ......................... Minnesota ....................... Montana ......................... New York ........................ North Dakota .................. Oregon ........................... South Dakota .................. Utah ................................ Washington .................... Wisconsin ....................... Wyoming ........................
4.4 ( 1 ) 77
510 ( 1 ) 15 11 80
720 10
1,130
32 22 30 97 25 64
May 5 Feb 20 Mar 14 Mar 24 Mar 1 May 4 Apr 10 Apr 15 Apr 3 Apr 1 Apr 19 Mar 1 Apr 6 Mar 20 Mar 20 Apr 5 Mar 18
May 10 - May 30 Mar 1 - May 1 Mar 26 - May 5 Apr 7 - May 5 Mar 5 - Apr 1 May 9 - May 30 Apr 13 - May 20 Apr 23 - May 25 Apr 13 - May 11 Apr 7 - Apr 29 Apr 26 - May 25 Mar 30 - May 15 Apr 14 - May 17 Apr 1 - Apr 20 Mar 30 - May 5 Apr 10 - Apr 20 Mar 26 - May 2
Jun 5 May 15 May 16 May 26 May 1 Jun 6 May 27 Jun 3 May 20 May 29 Jun 3 May 25 May 24 May 10 May 10 Apr 30 Jun 2
Aug 15 Aug 15 Jul 20 Jul 28 Jun 20 Aug 9 Jul 26 Jul 26 Jul 27 Aug 1 Jul 28 Jul 10 Jul 20 Jul 15 Jul 25 Aug 1 Jul 24
Aug 25 - Sep 25 Sep 1 - Sep 20 Jul 29 - Sep 6 Aug 11 - Sep 8 Jun 25 - Jul 1 Aug 18 - Sep 18 Aug 3 - Aug 19 Aug 1 - Sep 3 Aug 3 - Sep 2 Aug 7 - Aug 27 Aug 4 - Sep 3 Jul 21 - Sep 1 Jul 27 - Aug 19 Jul 25 - Aug 15 Aug 1 - Aug 30 Aug 5 - Aug 15 Aug 5 - Aug 26
Oct 1 Oct 1 Sep 14 Sep 29 Jul 10 Sep 30 Aug 31 Sep 18 Sep 10 Sep 12 Sep 16 Sep 8 Aug 27 Sep 1 Sep 5 Aug 20 Sep 17
1 Harvested acreage not published by planting season. An "All Barley" harvested acreage estimate is published in the Fall Barley table.

8 Field Crops Usual Planting and Harvesting Dates (October 2010) USDA, National Agricultural Statistics Service
Corn
Corn was the leading United States crop in 2009, both in terms of value of production and acreage grown. Nearly
79.6 million acres of corn were harvested for grain in 2009 with acreage for grain comprising 92 percent of all corn
planted. More than 80 percent of the corn for grain acreage lies in the Corn Belt, with Iowa leading all States and Illinois
ranking second. The largest acreage of record, 111 million acres was harvested in 1917. From 1950 to 2006, harvested
acreage levels generally ranged between 60 and 75 million acres. Beginning in 2007, favorable prices, driven by growing
demand from ethanol producers and strong export sales, encouraged farmers to plant more acres to corn.
Yields have generally increased since the turn of the twentieth century, with more rapid increases occurring in more recent
years. The 2009 National grain yield was a record high 164.7 bushels per acre. The previous record corn yield of
160.3 bushels per acre occurred in 2004. The rise in yield has led to a steady increase in corn production beginning in the
late1980s. A record production of 13.1 billion bushels was recorded in 2009, with the second highest production of
13.0 billion bushels recorded just two years earlier in 2007.

Field Crops Usual Planting and Harvesting Dates (October 2010) 9 USDA, National Agricultural Statistics Service
Corn for Grain Usual Planting and Harvesting Dates – States
State 2009
Harvested acres
Usual planting dates Usual harvesting dates
Begin Most active End Begin Most active End
(1,000 acres)
Alabama ......................... Arizona ........................... Arkansas ........................ California ........................ Colorado ......................... Delaware ........................ Florida ............................ Georgia .......................... Idaho .............................. Illinois ............................. Indiana ........................... Iowa ................................ Kansas ........................... Kentucky ......................... Louisiana ........................ Maryland ......................... Michigan ......................... Minnesota ....................... Mississippi ...................... Missouri .......................... Montana ......................... Nebraska ........................ New Jersey ..................... New Mexico .................... New York ........................ North Carolina ................ North Dakota .................. Ohio ................................ Oklahoma ....................... Oregon ........................... Pennsylvania .................. South Carolina ................ South Dakota .................. Tennessee ...................... Texas ............................. Utah ................................ Virginia ........................... Washington .................... West Virginia .................. Wisconsin ....................... Wyoming ........................
250 20
410 160 990 163 37
370 80
11,800
5,460 13,400 3,860 1,150
610 425
2,090 7,150
695 2,920
26
8,850 70 50
595 800
1,740 3,140
320 32
920 320
4,680 590
1,960 17
330 105 30
2,930 45
Mar 15 Mar 10 Mar 26 Mar 15 Apr 19 Apr 12 Mar 1 Mar 14 Apr 21 Apr 14 Apr 20 Apr 19 Apr 5 Apr 6 Mar 13 Apr 20 Apr 21 Apr 22 Mar 17 Apr 3 Apr 26 Apr 19 Apr 15 Apr 15 Apr 20 Apr 1 Apr 26 Apr 18 Mar 21 Mar 25 Apr 30 Mar 10 Apr 26 Apr 1 Mar 1 Apr 15 Apr 5 Apr 10 Apr 20 Apr 26 Apr 24
Mar 25 - Apr 25 Apr 1 - May 15 Apr 1 - Apr 26 Apr 1 - Jul 1 Apr 28 - May 20 Apr 30 - May 16 Mar 15 - Apr 25 Mar 22 - Apr 21 May 5 - May 26 Apr 21 - May 23 May 1 - Jun 1 Apr 25 - May 18 Apr 15 - May 15 Apr 14 - May 24 Mar 19 - Apr 8 Apr 30 - May 20 May 1 - May 27 Apr 26 - May 19 Mar 24 - Apr 27 Apr 11 - May 27 May 4 - May 28 Apr 27 - May 15 May 1 - May 20 Apr 20 - May 10 May 4 - Jun 13 Apr 10 - Apr 25 May 2 - May 28 Apr 24 - May 24 Apr 2 - May 8 Apr 25 - Jun 5 May 10 - May 25 Mar 20 - Apr 20 May 2 - May 27 Apr 5 - May 10 Mar 8 - May 7 Apr 30 - May 20 Apr 11 - May 20 Apr 20 - May 20 May 1 - Jun 5 May 2 - May 27 May 3 - May 21
May 18 Jun 1 May 9 Jul 15 May 29 May 28 May 5 May 4 Jun 9 Jun 5 Jun 10 May 26 May 25 Jun 8 Apr 16 Jun 7 Jun 6 May 29 May 4 Jun 12 Jun 4 May 21 Jun 15 May 20 Jun 20 May 15 Jun 4 May 30 May 17 Jun 15 Jun 15 May 15 Jun 10 May 25 May 17 Jun 5 May 29 Jun 1 Jun 20 Jun 4 Jun 6
Aug 2 Sep 1 Aug 16 Sep 1 Sep 28 Sep 10 Jul 15 Aug 6 Sep 29 Sep 14 Sep 15 Sep 21 Sep 1 Sep 1 Jul 31 Sep 9 Sep 5 Sep 27 Aug 11 Aug 29 Oct 4 Sep 18 Sep 25 Sep 25 Oct 7 Aug 25 Sep 28 Sep 27 Aug 20 Oct 10 Sep 25 Jul 25 Sep 24 Aug 25 Jul 18 Sep 25 Aug 31 Sep 25 Sep 15 Oct 2 Oct 5
Aug 11 - Sep 20 Oct 1 - Nov 1 Aug 23 - Sep 23 Oct 1 - Nov 1 Oct 8 - Nov 13 Sep 20 - Oct 15 Aug 1 - Sept 10 Aug 16 - Sep 22 Oct 20 - Nov 10 Sep 23 - Nov 5 Oct 1 - Nov 10 Oct 5 - Nov 9 Sep 10 - Oct 25 Sep 9 - Oct 24 Aug 9 - Sep 5 Sep 22 - Oct 22 Oct 10 - Nov 25 Oct 8 - Nov 8 Aug 23 - Sep 23 Sep 8 - Nov 3 Oct 25 - Dec 3 Oct 4 - Nov 10 Oct 10 - Nov 1 Oct 1 - Oct 30 Oct 14 - Nov 14 Sep 10 - Oct 10 Oct 8 - Nov 19 Oct 11 - Nov 20 Aug 29 - Oct 9 Oct 20 - Nov 20 Oct 15 - Nov 20 Aug 20 - Sep 25 Oct 6 - Nov 16 Sep 1 - Oct 10 Aug 1 - Oct 11 Oct 10 - Oct 30 Sep 6 - Oct 28 Oct 5 - Nov 15 Sep 30 - Nov 20 Oct 14 - Nov 17 Oct 18 - Nov 24
Oct 15 Dec 1 Oct 6 Nov 15 Nov 22 Nov 5 Oct 1 Oct 7 Nov 24 Nov 20 Nov 25 Nov 21 Nov 10 Nov 10 Sep 12 Nov 17 Dec 10 Nov 23 Oct 7 Dec 22 Dec 8 Nov 20 Nov 15 Nov 20 Nov 25 Nov 1 Dec 6 Dec 1 Oct 20 Dec 5 Dec 10 Oct 10 Dec 3 Oct 30 Nov 8 Dec 10 Nov 9 Nov 25 Dec 1 Nov 28 Dec 10

10 Field Crops Usual Planting and Harvesting Dates (October 2010) USDA, National Agricultural Statistics Service
All Cotton
Cotton is grown in the southern United States, mostly south of the 36th parallel, with concentrations in the Texas High
Plains, the Delta region, and Georgia. Unlike in the tropics where cotton is grown as a perennial, United States cotton is
grown as an annual from seed planted each year. Most United States cotton is Upland cotton, which usually has a staple
length of 1 to 1¼ inches. Extra-long staple American Pima cotton, which has a staple length of 1¼ inches or longer, is
grown in California, Arizona, New Mexico, and Texas.
Cotton acreage increased until 1925, when nearly 46 million acres were planted, then generally declined until the 1960s.
Since then, acreage has ranged between 9 and 15 million acres. Producers planted just over 9 million acres in 2009, the
lowest area since 1983. Cotton yields have trended upward since the mid 1960s, with a record high yield of 879 pounds
per acre of cotton harvested in 2007. With the increases in yield, cotton production in recent years has reached the same
levels that were produced in the 1920s and 1930s when acreage was at its peak. In 2009, producers harvested nearly
8 million acres of cotton, accounting for just over 12 million bales.

Field Crops Usual Planting and Harvesting Dates (October 2010) 11 USDA, National Agricultural Statistics Service
All Cotton Usual Planting and Harvesting Dates – States
State 2009
Harvested acres
Usual planting dates Usual harvesting dates
Begin Most active End Begin Most active End
(1,000 acres)
Alabama ......................... Arizona ........................... Arkansas ........................ California ........................ Florida ............................ Georgia .......................... Kansas ........................... Louisiana ........................ Mississippi ...................... Missouri .......................... New Mexico .................... North Carolina ................ Oklahoma ....................... South Carolina ................ Tennessee ...................... Texas ............................. Virginia ...........................
248.0 145.6 500.0 186.0 78.0
990.0 34.0
225.0 290.0 260.0
32.3
370.0 195.0 114.0 280.0
3,517.8 63.0
Apr 5 Mar 15 Apr 23 Apr 1 Apr 15 Apr 23 May 10 Apr 17 Apr 20 Apr 22 Apr 10 Apr 20 May 2 Apr 24 Apr 25 Mar 22 Apr 23
Apr 24 - May 24 Apr 1 - Apr 30 Apr 30 - May 23 Apr 10 - May 5 Apr 25 - May 25 May 2 - May 31 May 20 - Jun 15 Apr 24 - May 17 Apr 27 - May 19 Apr 29 - May 23 Apr 20 - May 10 May 1 - May 20 May 11 - Jun 10 May 1 - May 20 May 1 - May 25 Apr 8 - Jun 7 Apr 25 - May 11
Jun 6 May 15 May 31 May 15 Jun 15 Jun 11 Jun 25 May 26 May 29 May 29 May 20 Jun 1 Jun 18 Jun 1 Jun 5 Jun 20 May 16
Sep 5 Sep 15 Sep 20 Oct 5 Sep 20 Sep 23 Oct 15 Sep 14 Sep 15 Sep 17 Oct 10 Sep 30 Oct 4 Sep 23 Sep 20 Aug 10 Sep 30
Sep 20 - Oct 20 Oct 10 - Nov 10 Sep 29 - Nov 6 Oct 10 - Nov 1 Oct 1 - Nov 20 Oct 10 - Dec 2 Oct 25 - Dec 15 Sep 23 - Oct 23 Sep 27 - Oct 29 Sep 27 - Nov 9 Oct 25 - Nov 30 Oct 10 - Nov 15 Oct 15 - Dec 9 Oct 15 - Nov 13 Sep 30 - Nov 10 Sep 13 - Dec 21 Oct 8 - Nov 20
Dec 1 Dec 25 Nov 20 Nov 20 Dec 15 Dec 18 Dec 30 Nov 6 Nov 12 Nov 24 Dec 20 Dec 15 Dec 24 Dec 5 Nov 25 Jan 11 Nov 27

12 Field Crops Usual Planting and Harvesting Dates (October 2010) USDA, National Agricultural Statistics Service
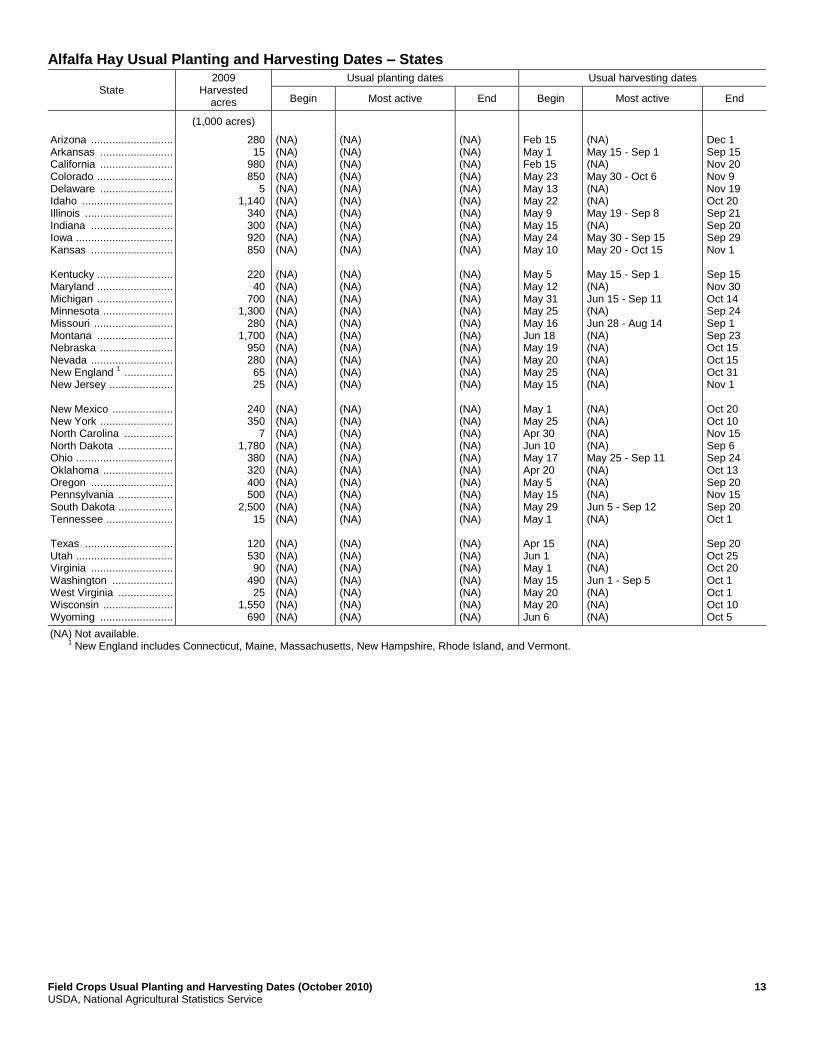
Alfalfa Hay Alfalfa hay, which includes alfalfa and alfalfa mixtures, comprised 36 percent of the total acreage harvested for hay in
2009. Alfalfa is common in all regions except the Southeast, where the humid climate and sandy soils do not favor
production. In most areas, the crop is harvested at least two or three times a year.
There were over 21 million acres of alfalfa hay harvested in the United States during 2009. California was the leading
alfalfa hay-producing State, harvesting 7.0 million tons from nearly one million acres in 2009. Alfalfa hay production
increased steadily until the mid 1980s, when a record production of 92 million tons was harvested in 1986. Production has
since gradually declined. Growers harvested 71 million tons in 2009 with a yield of 3.35 tons per acre.
Field Crops Usual Planting and Harvesting Dates (October 2010) 13 USDA, National Agricultural Statistics Service
Alfalfa Hay Usual Planting and Harvesting Dates – States
State 2009
Harvested acres
Usual planting dates Usual harvesting dates
Begin Most active End Begin Most active End
(1,000 acres)
Arizona ........................... Arkansas ........................ California ........................ Colorado ......................... Delaware ........................ Idaho .............................. Illinois ............................. Indiana ........................... Iowa ................................ Kansas ........................... Kentucky ......................... Maryland ......................... Michigan ......................... Minnesota ....................... Missouri .......................... Montana ......................... Nebraska ........................ Nevada ........................... New England 1 ................ New Jersey ..................... New Mexico .................... New York ........................ North Carolina ................ North Dakota .................. Ohio ................................ Oklahoma ....................... Oregon ........................... Pennsylvania .................. South Dakota .................. Tennessee ...................... Texas ............................. Utah ................................ Virginia ........................... Washington .................... West Virginia .................. Wisconsin ....................... Wyoming ........................
280 15
980 850
5 1,140
340 300 920 850
220 40
700 1,300
280 1,700
950 280 65 25
240 350
7 1,780
380 320 400 500
2,500 15
120 530 90
490 25
1,550 690
(NA) (NA) (NA) (NA) (NA) (NA) (NA) (NA) (NA) (NA) (NA) (NA) (NA) (NA) (NA) (NA) (NA) (NA) (NA) (NA) (NA) (NA) (NA) (NA) (NA) (NA) (NA) (NA) (NA) (NA) (NA) (NA) (NA) (NA) (NA) (NA) (NA)
(NA) (NA) (NA) (NA) (NA) (NA) (NA) (NA) (NA) (NA) (NA) (NA) (NA) (NA) (NA) (NA) (NA) (NA) (NA) (NA) (NA) (NA) (NA) (NA) (NA) (NA) (NA) (NA) (NA) (NA) (NA) (NA) (NA) (NA) (NA) (NA) (NA)
(NA) (NA) (NA) (NA) (NA) (NA) (NA) (NA) (NA) (NA) (NA) (NA) (NA) (NA) (NA) (NA) (NA) (NA) (NA) (NA) (NA) (NA) (NA) (NA) (NA) (NA) (NA) (NA) (NA) (NA) (NA) (NA) (NA) (NA) (NA) (NA) (NA)
Feb 15 May 1 Feb 15 May 23 May 13 May 22 May 9 May 15 May 24 May 10 May 5 May 12 May 31 May 25 May 16 Jun 18 May 19 May 20 May 25 May 15 May 1 May 25 Apr 30 Jun 10 May 17 Apr 20 May 5 May 15 May 29 May 1 Apr 15 Jun 1 May 1 May 15 May 20 May 20 Jun 6
(NA) May 15 - Sep 1 (NA) May 30 - Oct 6 (NA) (NA) May 19 - Sep 8 (NA) May 30 - Sep 15 May 20 - Oct 15 May 15 - Sep 1 (NA) Jun 15 - Sep 11 (NA) Jun 28 - Aug 14 (NA) (NA) (NA) (NA) (NA) (NA) (NA) (NA) (NA) May 25 - Sep 11 (NA) (NA) (NA) Jun 5 - Sep 12 (NA) (NA) (NA) (NA) Jun 1 - Sep 5 (NA) (NA) (NA)
Dec 1 Sep 15 Nov 20 Nov 9 Nov 19 Oct 20 Sep 21 Sep 20 Sep 29 Nov 1 Sep 15 Nov 30 Oct 14 Sep 24 Sep 1 Sep 23 Oct 15 Oct 15 Oct 31 Nov 1 Oct 20 Oct 10 Nov 15 Sep 6 Sep 24 Oct 13 Sep 20 Nov 15 Sep 20 Oct 1 Sep 20 Oct 25 Oct 20 Oct 1 Oct 1 Oct 10 Oct 5
(NA) Not available. 1 New England includes Connecticut, Maine, Massachusetts, New Hampshire, Rhode Island, and Vermont.

14 Field Crops Usual Planting and Harvesting Dates (October 2010) USDA, National Agricultural Statistics Service
Other Hay In those States which estimate alfalfa hay, other hay includes all crops harvested for hay except alfalfa and alfalfa
mixtures. Other hay includes alfalfa in Alabama, Florida, Georgia, Louisiana, Mississippi, and South Carolina. Crops
grown for hay include clover-timothy mixtures, Bermuda grass, wild grasses (prairie hay), and small grains among others.
There were nearly 39 million acres of other hay harvested in the United States in 2009 with a yield of 1.98 tons per acre.
Other hay production for 2009 was 76 million tons, the fifth highest total on record. Kentucky, Missouri, Oklahoma,
Tennessee, and Texas led the Nation in other hay production in 2009. Nationally, yield has followed a gradual increasing
trend since records began in 1934.

Field Crops Usual Planting and Harvesting Dates (October 2010) 15 USDA, National Agricultural Statistics Service
Other Hay Usual Planting and Harvesting Dates – States
State 2009
Harvested acres
Usual planting dates Usual harvesting dates
Begin Most active End Begin Most active End
(1,000 acres)
Alabama ......................... Alaska ............................ Arizona ........................... Arkansas ........................ California ........................ Colorado ......................... Delaware ........................ Florida ............................ Georgia .......................... Idaho .............................. Illinois ............................. Indiana ........................... Iowa ................................ Kansas ........................... Kentucky ......................... Louisiana ........................ Maryland ......................... Michigan ......................... Minnesota ....................... Mississippi ...................... Missouri .......................... Montana ......................... Nebraska ........................ Nevada ........................... New England 1 ................ New Jersey ..................... New Mexico .................... New York ........................ North Carolina ................ North Dakota .................. Ohio ................................ Oklahoma ....................... Oregon ........................... Pennsylvania .................. South Carolina ................ South Dakota .................. Tennessee ...................... Texas ............................. Utah ................................ Virginia ........................... Washington .................... West Virginia .................. Wisconsin ....................... Wyoming ........................
800 20 30
1,400 540 750 12
300 700 370
270 320 300
1,700 2,300
380 170 290 750 700
3,600
800 1,750
210 481 85 80
1,010 840
1,180
660 2,900
630 1,050
350 1,300 1,900 4,500
160 1,090
320 600 370 580
(NA) (NA) (NA) (NA) (NA) (NA) (NA) (NA) (NA) (NA) (NA) (NA) (NA) (NA) (NA) (NA) (NA) (NA) (NA) (NA) (NA) (NA) (NA) (NA) (NA) (NA) (NA) (NA) (NA) (NA) (NA) (NA) (NA) (NA) (NA) (NA) (NA) (NA) (NA) (NA) (NA) (NA) (NA) (NA)
(NA) (NA) (NA) (NA) (NA) (NA) (NA) (NA) (NA) (NA) (NA) (NA) (NA) (NA) (NA) (NA) (NA) (NA) (NA) (NA) (NA) (NA) (NA) (NA) (NA) (NA) (NA) (NA) (NA) (NA) (NA) (NA) (NA) (NA) (NA) (NA) (NA) (NA) (NA) (NA) (NA) (NA) (NA) (NA)
(NA) (NA) (NA) (NA) (NA) (NA) (NA) (NA) (NA) (NA) (NA) (NA) (NA) (NA) (NA) (NA) (NA) (NA) (NA) (NA) (NA) (NA) (NA) (NA) (NA) (NA) (NA) (NA) (NA) (NA) (NA) (NA) (NA) (NA) (NA) (NA) (NA) (NA) (NA) (NA) (NA) (NA) (NA) (NA)
May 10 Jun 20 Feb 15 May 1 May 1 Jun 20 May 10 May 10 May 15 Jun 1 May 11 May 15 Jun 5 May 25 May 15 Apr 17 May 10 May 31 Jun 5 Apr 10 May 17 Jun 20 Jun 5 Jun 15 May 25 May 10 May 1 May 25 Apr 30 Jun 19 May 20 Apr 20 May 20 May 30 May 15 Jun 11 May 1 May 1 Jul 10 May 25 May 15 May 20 May 27 Jun 19
Jun 20 - Sep 1 Jul 1 - Sep 15 (NA) May 15 - Sep 1 (NA) Jul 5 - Aug 10 (NA) Jun 1 - Sep 15 (NA) (NA) May 20 - Jun 28 (NA) Jun 14 - Aug 17 Jun 1 - Sep 1 Jun 1 - Sep 1 (NA) (NA) Jul 28 - Sep 11 (NA) (NA) Jun 24 - Jul 14 (NA) (NA) (NA) (NA) (NA) (NA) (NA) (NA) (NA) May 27 - Oct 2 (NA) (NA) (NA) (NA) Jun 20 - Aug 14 (NA) (NA) (NA) (NA) Jun 1 - Aug 20 (NA) (NA) (NA)
Oct 15 Oct 10 Dec 1 Sep 15 Oct 1 Sep 15 Nov 8 Nov 20 Nov 1 Sep 10 Jul 17 Sep 20 Sep 3 Sep 15 Oct 10 Sep 14 Nov 19 Oct 14 Aug 30 Sep 26 Aug 5 Oct 7 Sep 20 Sep 15 Oct 31 Oct 15 Oct 20 Oct 15 Nov 15 Sep 2 Oct 13 Oct 20 Oct 15 Sep 25 Nov 13 Aug 24 Oct 1 Sep 30 Aug 25 Oct 1 Sep 15 Nov 10 Sep 15 Sep 9
(NA) Not available. 1 New England includes Connecticut, Maine, Massachusetts, New Hampshire, Rhode Island, and Vermont.
16 Field Crops Usual Planting and Harvesting Dates (October 2010) USDA, National Agricultural Statistics Service
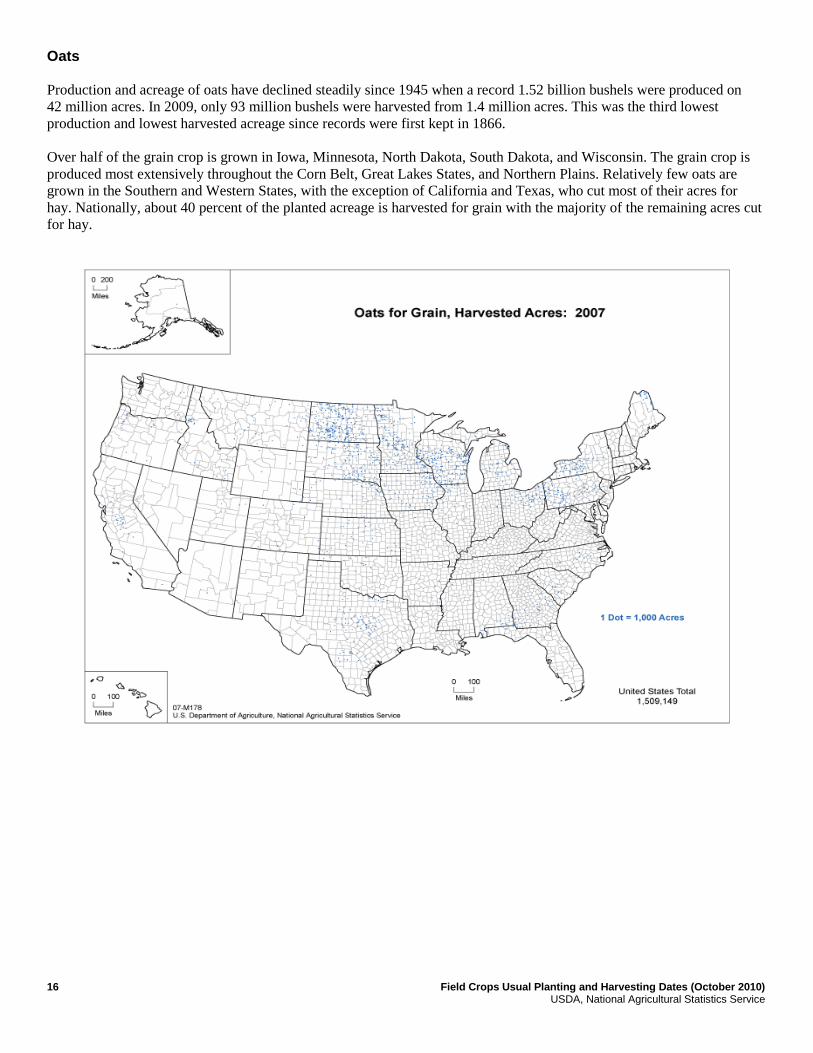
Oats Production and acreage of oats have declined steadily since 1945 when a record 1.52 billion bushels were produced on
42 million acres. In 2009, only 93 million bushels were harvested from 1.4 million acres. This was the third lowest
production and lowest harvested acreage since records were first kept in 1866.
Over half of the grain crop is grown in Iowa, Minnesota, North Dakota, South Dakota, and Wisconsin. The grain crop is
produced most extensively throughout the Corn Belt, Great Lakes States, and Northern Plains. Relatively few oats are
grown in the Southern and Western States, with the exception of California and Texas, who cut most of their acres for
hay. Nationally, about 40 percent of the planted acreage is harvested for grain with the majority of the remaining acres cut
for hay.

Field Crops Usual Planting and Harvesting Dates (October 2010) 17 USDA, National Agricultural Statistics Service
Fall Oat Usual Planting and Harvesting Dates – States
State 2009
Harvested acres
Usual planting dates Usual harvesting dates
Begin Most active End Begin Most active End
(1,000 acres)
Alabama ......................... Arkansas ........................ California ........................ Georgia .......................... North Carolina ................ Oregon ........................... South Carolina ................ Texas ............................. Virginia ...........................
11 8
30 20 15 22 15 60 4
Sep 1 Sep 15 Sep 15 Sep 27 Sep 25 Sep 15 Sep 23 Sep 7 Sep 15
Sep 15 - Oct 15 Oct 1 - Nov 15 Oct 1 - Mar 1 Oct 10 - Dec 5 Oct 15 - Nov 25 Oct 15 - Nov 15 Oct 15 - Nov 20 Sep 20 - Nov 5 Sep 27 - Oct 29
Dec 1 Dec 1 Mar 15 Dec 13 Dec 10 Dec 10 Dec 15 Nov 25 Nov 9
May 1 May 15 Jun 15 May 25 May 30 Jul 10 May 25 May 13 May 28
May 25 - Jun 25 May 25 - Jun 15 Jul 15 - Sep 1 Jun 1 - Jun 22 Jun 10 - Jun 30 Aug 10 - Aug 20 Jun 3 - Jun 20 May 23 - Jun 22 Jun 9 - Jul 3
Jul 1 Jul 1 Sep 15 Jul 3 Jul 25 Sep 1 Jul 3 Jul 4 Jul 20
Spring Oat Usual Planting and Harvesting Dates – States
State 2009
Harvested acres
Usual planting dates Usual harvesting dates
Begin Most active End Begin Most active End
(1,000 acres)
Alaska ............................ California ........................ Colorado ......................... Idaho .............................. Illinois ............................. Indiana ........................... Iowa ................................ Kansas ........................... Maine ............................. Michigan ......................... Minnesota ....................... Missouri .......................... Montana ......................... Nebraska ........................ New York ........................ North Dakota .................. Ohio ................................ Oklahoma ....................... Pennsylvania .................. South Dakota .................. Utah ................................ Washington .................... Wisconsin ....................... Wyoming ........................
0.9 ( 1 ) 9
25 25 7
95 35 31 55
170
9 32 30 60
165 45 15 80 90
5 6
195 10
May 5 Feb 20 Mar 17 Mar 31 Mar 20 Apr 1 Mar 25 Feb 20 May 5 Apr 10 Apr 11 Mar 1 Apr 18 Mar 26 Mar 25 Apr 19 Apr 4 Feb 15 Apr 15 Apr 3 Mar 20 Mar 5 Apr 11 Apr 3
May 15 - May 30 Mar 1 - May 15 Mar 28 - May 14 Apr 14 - May 19 Mar 29 - Apr 30 Apr 5 - Apr 25 Apr 2 - May 2 Mar 5 - Apr 1 May 10 - May 31 Apr 13 - May 14 Apr 19 - May 15 Mar 15 - Apr 20 Apr 26 - May 28 Apr 1 - Apr 24 Apr 1 - Apr 22 Apr 26 - May 25 Apr 9 - May 5 Feb 22 - Mar 17 Apr 15 - May 10 Apr 10 - May 15 Apr 10 - May 5 Mar 10 - Apr 10 Apr 20 - May 11 Apr 14 - May 18
Jun 5 May 30 May 23 Jun 2 May 12 May 10 May 13 May 1 Jun 7 May 22 May 26 Apr 30 Jun 5 May 3 May 29 Jun 3 May 13 Mar 26 May 25 May 23 Jun 1 Apr 20 May 18 Jun 9
Sep 1 Aug 15 Jul 13 Jul 21 Jul 4 Jul 10 Jul 9 Jul 10 Aug 11 Jul 19 Jul 21 Jun 20 Aug 8 Jul 4 Jul 30 Jul 28 Jul 13 Jun 4 Jul 20 Jul 14 Jul 25 Jul 15 Jul 22 Jul 18
Sep 5 - Sep 30 Sep 1 - Sep 20 Jul 19 - Sep 13 Aug 11 - Sep 8 Jul 14 - Aug 7 Jul 15 - Aug 5 Jul 17 - Aug 5 Jul 15 - Aug 1 Aug 21 - Sep 22 Jul 28 - Aug 24 Jul 26 - Aug 24 Jul 1 - Jul 25 Aug 15 - Sep 9 Jul 10 - Jul 30 Aug 4 - Aug 24 Aug 5 - Sep 5 Jul 20 - Aug 7 Jun 10 - Jul 4 Jul 25 - Aug 20 Jul 21 - Aug 15 Aug 15 - Sep 10 Aug 1 - Aug 30 Jul 28 - Aug 24 Jul 23 - Sep 1
Oct 10 Oct 1 Sep 25 Sep 29 Aug 13 Aug 10 Aug 11 Aug 10 Oct 4 Sep 2 Sep 4 Aug 1 Sep 22 Aug 7 Sep 9 Sep 18 Aug 11 Jul 13 Aug 30 Aug 23 Sep 30 Sep 10 Aug 30 Sep 15
1 Harvested acreage not published by planting season. An "All Oat" harvested acreage estimate is published in the Fall Oat table.

18 Field Crops Usual Planting and Harvesting Dates (October 2010) USDA, National Agricultural Statistics Service
Peanuts
Peanut production is confined mostly to the South. There are three main producing areas: the Virginia-Carolina area,
where Virginia type peanuts dominate; the Southeast, where the crop is mainly Runners and Virginia types; and the
Southwest, where the acreage is planted to Runner and Spanish types of peanuts. Valencias, a roasting type peanut,
account for less than 1 percent of United States production and are grown mainly in New Mexico.
Georgia continues to be the leading peanut-producing State, accounting for 49 percent of the total United States
production in 2009. Texas and Alabama rank second and third in peanut production, representing 14 and 13 percent,
respectively, in 2009. A total of 1.12 million acres of peanuts were planted in 2009. Planted acreage peaked at over
5 million acres during World War II, but then fell below 2 million acres in 1952. Farmers have planted between 1.5 and
2 million acres per year since the early 1950s. Yields and production improved steadily from the 1950s until 1980, but
have leveled off since.

Field Crops Usual Planting and Harvesting Dates (October 2010) 19 USDA, National Agricultural Statistics Service
Peanut Usual Planting and Harvesting Dates – States
State 2009
Harvested acres
Usual planting dates Usual harvesting dates
Begin Most active End Begin Most active End
(1,000 acres)
Alabama ......................... Florida ............................ Georgia .......................... Mississippi ...................... New Mexico .................... North Carolina ................ Oklahoma ....................... South Carolina ................ Texas ............................. Virginia ...........................
152 105 505 18 7
66 13 48
155 12
Apr 16 Apr 10 Apr 27 Apr 25 May 10 Apr 30 Apr 28 Apr 20 May 1 Apr 25
Apr 25 - May 25 Apr 25 - May 30 May 6 - May 31 May 6 - May 31 May 15 - May 25 May 10 - May 30 May 7 - Jun 6 Apr 25 - May 15 May 6 - Jun 5 Apr 30 - May 18
Jun 15 Jun 15 Jun 7 Jun 15 Jun 1 Jun 1 Jun 11 Jun 5 Jun 15 May 25
Sep 15 Aug 15 Sep 15 Sep 20 Oct 1 Sep 25 Oct 2 Sep 8 Sep 25 Sep 18
Sep 22 - Oct 22 Sep 10 - Nov 30 Sep 25 - Oct 31 Sep 29 - Oct 31 Oct 10 - Oct 30 Oct 10 - Oct 30 Oct 9 - Nov 16 Oct 2 - Nov 1 Oct 7 - Nov 16 Sep 25 - Oct 17
Nov 20 Dec 15 Nov 11 Nov 10 Nov 10 Nov 15 Nov 26 Nov 10 Nov 30 Oct 24

20 Field Crops Usual Planting and Harvesting Dates (October 2010) USDA, National Agricultural Statistics Service
All Rice
United States rice production is mainly confined to three areas: the coastal prairie region of southwestern Louisiana and
southeastern Texas; eastern Arkansas, southeastern Missouri, and northwestern Mississippi; and the Sacramento and
northern San Joaquin Valleys of California. Area planted to rice in 2009 totaled 3.14 million acres. Rice plantings have
steadily increased since the late 1800s. The peak planting year came in 1981, when over 3.8 million acres were planted.
Yield and has also steadily increased over the years. Yield per acre in 2009 averaged 7,085 pounds for a total production
of 220 million cwt. The record high yield of 7,219 pounds per acre was attained in 2007. Arkansas was the leading
rice-producing State in 2009, accounting for 45 percent of total United States production, followed by California and
Louisiana, at 22 and 13 percent, respectively.

Field Crops Usual Planting and Harvesting Dates (October 2010) 21 USDA, National Agricultural Statistics Service
All Rice Usual Planting and Harvesting Dates – States
State 2009
Harvested acres
Usual planting dates Usual harvesting dates
Begin Most active End Begin Most active End
(1,000 acres)
Arkansas ........................ California ........................ Louisiana ........................ Mississippi ...................... Missouri .......................... Texas .............................
1,470 556 464 243 200 170
Apr 6 Apr 20 Mar 20 Apr 6 Apr 10 Mar 17
Apr 14 - May 19 May 1 - May 25 Mar 28 - May 1 Apr 18 - May 16 Apr 20 - May 19 Mar 23 - Apr 26
Jun 2 Jun 10 May 15 May 24 May 26 May 10
Aug 29 Sep 5 Jul 27 Aug 29 Sep 6 Jul 29
Sep 9 - Oct 10 Sep 15 - Nov 1 Aug 4 - Sep 15 Sep 5 - Oct 6 Sep 14 - Oct 18 Aug 7 - Sep 4
Oct 24 Nov 10 Sep 28 Oct 20 Oct 30 Sep 20

22 Field Crops Usual Planting and Harvesting Dates (October 2010) USDA, National Agricultural Statistics Service
Sorghum
Most sorghum is grown in the central and southern Plains States, where it is well adapted to heat and tolerant of limited
moisture conditions. Sorghum is used primarily as a livestock feed, with the majority of the acreage not harvested for
grain harvested as silage. Of the 5.52 million acres of sorghum harvested for grain in 2009, eighty-three percent was
grown in Kansas and Texas. After reaching a peak of 19.7 million acres in 1957, harvested area held fairly steady from
the late 1950s through the mid 1980s when area began a rapid decline. Sorghum grain yields have for the most part
increased steadily from the late 1950s, with a record high average yield of 73.2 bushels per acre produced in 2007.

Field Crops Usual Planting and Harvesting Dates (October 2010) 23 USDA, National Agricultural Statistics Service
Sorghum for Grain Usual Planting and Harvesting Dates – States
State 2009
Harvested acres
Usual planting dates Usual harvesting dates
Begin Most active End Begin Most active End
(1,000 acres)
Arizona ........................... Arkansas ........................ Colorado ......................... Georgia .......................... Illinois ............................. Kansas ........................... Louisiana ........................ Mississippi ...................... Missouri .......................... Nebraska ........................ New Mexico .................... Oklahoma ....................... South Dakota .................. Texas .............................
8 37
150 40 36
2,550 65 11 43
140
50 220 120
2,050
Mar 10 Apr 5 May 9 Apr 17 May 4 May 5 Apr 6 Apr 8 Apr 23 May 9 May 15 Apr 24 May 11 Mar 1
Apr 1 - May 15 Apr 13 - May 23 May 19 - Jun 23 Apr 30 - Jun 26 May 17 - Jun 26 May 15 - Jun 20 Apr 11 - May 15 Apr 14 - May 21 May 6 - Jun 18 May 16 - Jun 9 May 20 - Jun 15 May 12 - Jun 25 May 20 - Jun 20 Mar 11 - Jun 15
Jun 1 Jun 5 Jul 1 Jul 12 Jul 6 Jul 15 May 29 Jun 3 Jun 28 Jun 16 Jul 10 Jul 6 Jun 30 Jul 5
Sep 1 Aug 22 Sep 29 Aug 21 Sep 18 Sep 10 Aug 7 Aug 19 Sep 6 Sep 26 Oct 15 Sep 9 Sep 21 Jun 25
Oct 1 - Nov 1 Aug 27 - Oct 3 Oct 11 - Nov 18 Sep 4 - Nov 19 Sep 30 - Nov 8 Sep 25 - Nov 10 Aug 16 - Sep 10 Aug 29 - Sep 27 Sep 16 - Nov 7 Oct 8 - Nov 8 Oct 20 - Nov 15 Sep 26 - Nov 21 Oct 1 - Nov 6 Jul 8 - Nov 16
Dec 1 Oct 16 Nov 29 Dec 9 Nov 20 Nov 25 Sep 24 Oct 8 Nov 22 Nov 17 Dec 15 Dec 2 Nov 17 Dec 6

24 Field Crops Usual Planting and Harvesting Dates (October 2010) USDA, National Agricultural Statistics Service
Soybeans
Soybeans are grown primarily for beans which are processed into oil and meal. The main soybean producing area is in the
Corn Belt and the lower Mississippi Valley. The three top producing States in 2009 - Illinois, Iowa, and Minnesota -
accounted for 36 percent of the total United States production.
There were 77.5 million acres of soybeans planted in 2009, the highest on record. Planted area increased rapidly during
the 1960s and 1970s until 1979, when 71.4 million acres were planted which was a record at that time. Acreage declined
during the 1980s, but rebounded in the 1990s. In 2007, planted area dropped by over 10 million acres from the previous
year, but rebounded in 2008 and 2009 to record levels. The 2009 yield, of 44.0 bushels per acre, was the highest yield
since records were first kept in 1924. Production topped 3.35 billion bushels in 2009, more than 5 percent above the
previous record high set in 2006.

Field Crops Usual Planting and Harvesting Dates (October 2010) 25 USDA, National Agricultural Statistics Service
Soybean Usual Planting and Harvesting Dates – States
State 2009
Harvested acres
Usual planting dates Usual harvesting dates
Begin Most active End Begin Most active End
(1,000 acres)
Alabama ......................... Arkansas ........................ Delaware ........................ Florida ............................ Georgia .......................... Illinois ............................. Indiana ........................... Iowa ................................ Kansas ........................... Kentucky ......................... Louisiana ........................ Maryland ......................... Michigan ......................... Minnesota ....................... Mississippi ...................... Missouri .......................... Nebraska ........................ New Jersey ..................... New York ........................ North Carolina ................ North Dakota .................. Ohio ................................ Oklahoma ....................... Pennsylvania .................. South Carolina ................ South Dakota .................. Tennessee ...................... Texas ............................. Virginia ........................... West Virginia .................. Wisconsin .......................
430 3,270
183 34
440 9,350 5,440 9,530 3,650 1,420
940 475
1,990 7,120 2,030 5,300 4,760
87 254
1,750
3,870 4,530
390 445 565
4,190 1,530
190 570 19
1,620
Apr 15 Apr 19 May 11 Apr 20 May 5 May 2 May 1 May 2 May 5 May 4 Apr 18 May 11 May 2 May 2 Apr 19 May 2 May 5 May 10 May 12 May 1 May 7 Apr 26 Apr 15 May 10 May 10 May 8 May 5 Mar 24 May 5 May 5 May 7
May 25 - Jun 25 May 5 - Jun 22 May 30 - Jun 28 May 1 - Jun 15 May 17 - Jun 26 May 8 - Jun 12 May 5 - Jun 10 May 8 - Jun 2 May 15 - Jun 20 May 16 - Jun 27 Apr 23 - Jun 4 May 28 - Jun 26 May 11 - Jun 9 May 8 - Jun 2 Apr 26 - May 31 May 13 - Jun 24 May 11 - May 31 May 20 - Jul 1 May 19 - Jun 22 May 20 - Jun 30 May 14 - Jun 3 May 3 - May 30 Apr 27 - Jun 27 May 20 - Jun 10 May 27 - Jun 27 May 15 - Jun 11 May 15 - Jun 25 Mar 30 - May 30 May 15 - Jul 3 May 10 - Jun 30 May 12 - Jun 5
Jul 3 Jul 5 Jul 11 Jul 1 Jul 5 Jun 24 Jun 25 Jun 16 Jul 1 Jul 7 Jun 16 Jul 16 Jun 18 Jun 13 Jun 17 Jul 4 Jun 8 Jul 10 Jun 29 Jul 20 Jun 11 Jun 10 Jul 9 Jul 5 Jul 11 Jun 21 Jul 5 Jun 12 Jul 9 Jul 5 Jun 14
Sep 3 Sep 10 Oct 5 Oct 1 Oct 11 Sep 19 Sep 20 Sep 21 Sep 20 Sep 25 Aug 28 Oct 5 Sep 25 Sep 20 Sep 10 Sep 25 Sep 23 Oct 1 Sep 27 Oct 10 Sep 17 Sep 23 Sep 9 Oct 5 Oct 20 Sep 22 Sep 25 Aug 18 Oct 4 Sep 25 Sep 29
Oct 28 - Nov 28 Sep 29 - Nov 13 Oct 22 - Nov 14 Oct 15 - Nov 25 Oct 25 - Dec 8 Sep 26 - Oct 26 Oct 1 - Nov 1 Sep 28 - Oct 20 Oct 1 - Nov 1 Oct 10 - Nov 14 Sep 3 - Oct 25 Oct 18 - Nov 15 Oct 3 - Nov 3 Sep 27 - Oct 20 Sep 13 - Oct 31 Oct 3 - Nov 8 Sep 29 - Oct 24 Oct 20 - Nov 10 Oct 7 - Nov 14 Nov 10 - Dec 5 Sep 24 - Oct 21 Sep 30 - Oct 31 Sep 22 - Nov 20 Oct 20 - Nov 10 Nov 10 - Dec 10 Sep 28 - Oct 24 Oct 5 - Nov 20 Aug 22 - Oct 17 Oct 16 - Nov 28 Oct 5 - Nov 30 Oct 4 - Oct 29
Dec 15 Nov 26 Nov 25 Dec 1 Dec 17 Nov 7 Nov 10 Oct 31 Nov 15 Nov 25 Oct 31 Dec 1 Nov 13 Oct 31 Nov 9 Nov 23 Nov 2 Nov 15 Nov 20 Dec 20 Nov 5 Nov 12 Dec 1 Nov 30 Dec 30 Nov 3 Nov 30 Nov 7 Dec 4 Dec 1 Nov 8

26 Field Crops Usual Planting and Harvesting Dates (October 2010) USDA, National Agricultural Statistics Service
Sugarbeets
Almost all United States sugarbeets are grown under irrigation in the western half of the country and in the more humid
areas of the north-central States. Sugarbeets require plentiful, well-distributed moisture and moderately cool temperatures
during the growing season. Most beets are planted from March to May and harvested from September to December, with
peak harvest in October. However, in California, some beets are over-wintered and harvested the following spring.
In 2009, growers harvested 1.15 million acres of sugarbeets, down from recent years and a level comparable to what was
last seen during the 1980s. During the past few growing seasons, average yields have been exceptional. In fact, growers
produced a record high 26.8 tons per acre in 2008. Minnesota continues to be the largest sugarbeet-producing State,
harvesting 36 percent of the total United States production in 2009. Minnesota, along with Idaho and North Dakota, the
second and third ranking States, accounted for 71 percent of the 2009 sugarbeet production.

Field Crops Usual Planting and Harvesting Dates (October 2010) 27 USDA, National Agricultural Statistics Service
Sugarbeet Usual Planting and Harvesting Dates – States
State 2009
Harvested acres
Usual planting dates Usual harvesting dates
Begin Most active End Begin Most active End
(1,000 acres)
California ........................ Colorado ......................... Idaho .............................. Michigan ......................... Minnesota ....................... Montana ......................... Nebraska ........................ North Dakota .................. Oregon ........................... Wyoming ........................
25.3 35.0
163.0 136.0 449.0 33.6 52.6
218.0 10.5 25.6
Aug 15 Mar 30 Mar 24 Apr 7 Apr 18 Apr 14 Apr 1 Apr 19 Apr 1 Apr 5
Sep 15 - Oct 15 Apr 7 - Apr 30 Apr 3 - Apr 21 Apr 10 - May 11 Apr 24 - May 18 Apr 20 - May 12 Apr 10 - Apr 30 Apr 24 - May 18 Apr 10 - Apr 20 Apr 13 - May 2
Oct 30 May 10 May 5 May 16 May 26 May 18 May 5 May 26 Apr 25 May 14
Apr 1 Sep 30 Sep 15 Sep 26 Sep 16 Sep 28 Oct 5 Sep 17 Oct 1 Sep 26
Apr 15 - Aug 1 Oct 10 - Nov 4 Oct 8 - Oct 30 Oct 13 - Nov 3 Sep 30 - Oct 19 Oct 9 - Oct 27 Oct 10 - Oct 30 Sep 30 - Oct 17 Oct 10 - Oct 20 Oct 10 - Oct 27
Aug 15 Nov 12 Nov 10 Nov 11 Oct 27 Nov 4 Nov 5 Oct 25 Oct 30 Nov 10

28 Field Crops Usual Planting and Harvesting Dates (October 2010) USDA, National Agricultural Statistics Service
All Sunflowers Sunflowers are primarily used by crushers, exporters, and confectioners. Crushers process sunflower seed into sunflower
oil and meal. The meal is primarily used for feed, while the oil has many uses including cooking oil, salad oil, shortening,
margarine, and confectionary coatings. Sunflowers are primarily grown in the Great Plains States, California, and
Minnesota. Estimates of sunflowers began in 1975 and the largest area planted on record occurred in 1979 at over
5.5 million acres. Acreage levels have declined since that time, and planted area in 2009 only encompassed 2.1 million
acres. The top two producing States in 2009 – North Dakota and South Dakota – accounted for 76 percent of the total
United States production. Of the total production in 2009, oil type varieties of sunflower accounted for 2.6 billion pounds
and non-oil varieties accounted for 452 million pounds. The average yield in the United States for all sunflowers
harvested during 2009 was a record high 1,554 pounds per acre, 15 pounds per acre better than the previous record high
set in 2005.

Field Crops Usual Planting and Harvesting Dates (October 2010) 29 USDA, National Agricultural Statistics Service
All Sunflower Usual Planting and Harvesting Dates – States
State 2009
Harvested acres
Usual planting dates Usual harvesting dates
Begin Most active End Begin Most active End
(1,000 acres)
California ........................ Colorado ......................... Kansas ........................... Minnesota ....................... Nebraska ........................ North Dakota .................. Oklahoma ....................... South Dakota .................. Texas .............................
41.5 87.0
155.0 64.0 47.0
868.0 15.0
558.0 118.0
Mar 21 May 19 May 15 May 7 Jun 1 May 14 May 1 May 16 Apr 5
Apr 1 - May 31 May 25 - Jun 23 May 25 - Jun 30 May 16 - Jun 7 Jun 5 - Jun 30 May 19 - Jun 8 May 15 - Jul 15 May 24 - Jun 21 May 1 - Jul 4
Aug 1 Jul 1 Jul 10 Jun 15 Jul 5 Jun 15 Jul 30 Jun 29 Jul 15
Jun 1 Sep 27 Sep 15 Sep 26 Oct 1 Oct 1 Aug 1 Sep 25 Aug 20
Jul 1 - Aug 31 Oct 6 - Nov 15 Oct 1 - Nov 15 Oct 4 - Nov 8 Oct 5 - Oct 25 Oct 9 - Nov 10 Aug 30 - Oct 30 Oct 3 - Nov 10 Sep 1 - Nov 21
Oct 1 Nov 26 Nov 30 Nov 25 Nov 5 Nov 23 Dec 10 Nov 21 Dec 3

30 Field Crops Usual Planting and Harvesting Dates (October 2010) USDA, National Agricultural Statistics Service
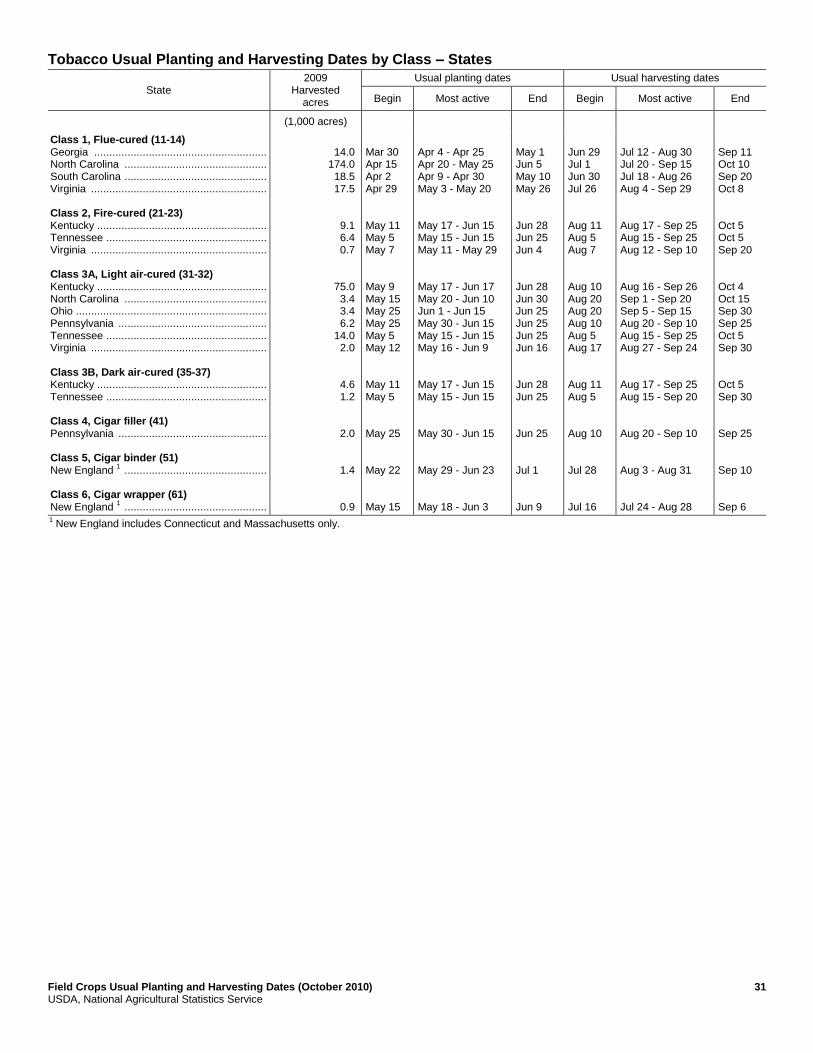
Tobacco
United States tobacco production is generally confined to areas east of the Mississippi River, with the principal exception
being the western area of Missouri. Six major classes are grown: Flue-cured, fire-cured, air-cured (light and dark),
cigar filler, cigar binder, and cigar wrapper. Although grown at various latitudes, the crop has little tolerance to frost and
freezing temperatures. Tobacco seeds are usually sown during the late winter and early spring in protected beds from
which seedlings are pulled and transplanted in the spring. Harvest dates are governed largely by latitude, elevation,
seasonal conditions, and the nature of the particular tobacco type. The flue-cured and cigar wrapper types are harvested by
priming (picking the leaves as they ripen) while other types are usually stalk cut.
In 2009, North Carolina and Kentucky accounted for 77 percent of the total United States production. Harvested area
increased from 1866, when records were first kept, until 1930 when the peak level of over 2 million acres was harvested.
Acreage leveled off until the 1950s, but has decreased steadily from that period, reaching a record low acreage of 297,080
in 2005. Tobacco growers harvested 823 million pounds of tobacco from 354,240 acres in 2009, reaching the second
highest yield on record, at 2,322 pounds per acre.
Field Crops Usual Planting and Harvesting Dates (October 2010) 31 USDA, National Agricultural Statistics Service
Tobacco Usual Planting and Harvesting Dates by Class – States
State 2009
Harvested acres
Usual planting dates Usual harvesting dates
Begin Most active End Begin Most active End
(1,000 acres)
Class 1, Flue-cured (11-14) Georgia ......................................................... North Carolina ............................................... South Carolina ............................................... Virginia .......................................................... Class 2, Fire-cured (21-23) Kentucky ........................................................ Tennessee ..................................................... Virginia .......................................................... Class 3A, Light air-cured (31-32) Kentucky ........................................................ North Carolina ............................................... Ohio ............................................................... Pennsylvania ................................................. Tennessee ..................................................... Virginia .......................................................... Class 3B, Dark air-cured (35-37) Kentucky ........................................................ Tennessee ..................................................... Class 4, Cigar filler (41) Pennsylvania ................................................. Class 5, Cigar binder (51) New England 1 ............................................... Class 6, Cigar wrapper (61) New England 1 ...............................................
14.0
174.0 18.5 17.5
9.1 6.4 0.7
75.0 3.4 3.4 6.2
14.0 2.0
4.6 1.2
2.0
1.4
0.9
Mar 30 Apr 15 Apr 2 Apr 29 May 11 May 5 May 7 May 9 May 15 May 25 May 25 May 5 May 12 May 11 May 5 May 25 May 22 May 15
Apr 4 - Apr 25 Apr 20 - May 25 Apr 9 - Apr 30 May 3 - May 20 May 17 - Jun 15 May 15 - Jun 15 May 11 - May 29 May 17 - Jun 17 May 20 - Jun 10 Jun 1 - Jun 15 May 30 - Jun 15 May 15 - Jun 15 May 16 - Jun 9 May 17 - Jun 15 May 15 - Jun 15 May 30 - Jun 15 May 29 - Jun 23 May 18 - Jun 3
May 1 Jun 5 May 10 May 26 Jun 28 Jun 25 Jun 4 Jun 28 Jun 30 Jun 25 Jun 25 Jun 25 Jun 16 Jun 28 Jun 25 Jun 25 Jul 1 Jun 9
Jun 29 Jul 1 Jun 30 Jul 26 Aug 11 Aug 5 Aug 7 Aug 10 Aug 20 Aug 20 Aug 10 Aug 5 Aug 17 Aug 11 Aug 5 Aug 10 Jul 28 Jul 16
Jul 12 - Aug 30 Jul 20 - Sep 15 Jul 18 - Aug 26 Aug 4 - Sep 29 Aug 17 - Sep 25 Aug 15 - Sep 25 Aug 12 - Sep 10 Aug 16 - Sep 26 Sep 1 - Sep 20 Sep 5 - Sep 15 Aug 20 - Sep 10 Aug 15 - Sep 25 Aug 27 - Sep 24 Aug 17 - Sep 25 Aug 15 - Sep 20 Aug 20 - Sep 10 Aug 3 - Aug 31 Jul 24 - Aug 28
Sep 11 Oct 10 Sep 20 Oct 8 Oct 5 Oct 5 Sep 20 Oct 4 Oct 15 Sep 30 Sep 25 Oct 5 Sep 30 Oct 5 Sep 30 Sep 25 Sep 10 Sep 6
1 New England includes Connecticut and Massachusetts only.

32 Field Crops Usual Planting and Harvesting Dates (October 2010) USDA, National Agricultural Statistics Service
Durum Wheat
The 2009 Durum wheat harvest accounted for 5 percent of all wheat produced in the United States. Durum wheat is
predominately grown in the northern Great Plains, Arizona, and California. Durum wheat in the northern Great Plains is
planted in the late spring and harvested late in the summer. Durum wheat grown in Arizona and California, commonly
called “Desert Durum,” is planted from December through February and harvested during the early summer. Nationwide,
109 million bushels of Durum wheat were grown in 2009, with production in North Dakota accounting for 56 percent, or
over 61 million bushels of the total.
Spring Wheat
The 2009 other spring wheat harvest accounted for 26 percent of all wheat produced in the United States. Spring wheat is
planted in the late spring and harvested late in the summer. Annual rainfall in the northern Great Plains and northwestern
States is relatively limited but well distributed during the summer, thus favoring spring wheat production. Nationwide,
584 million bushels of other spring wheat were grown in 2009. North Dakota growers produced nearly 290 million
bushels of other spring wheat in 2009, making it the top producing State for all classes of wheat. North Dakota alone
accounted for nearly 50 percent of other spring wheat production.
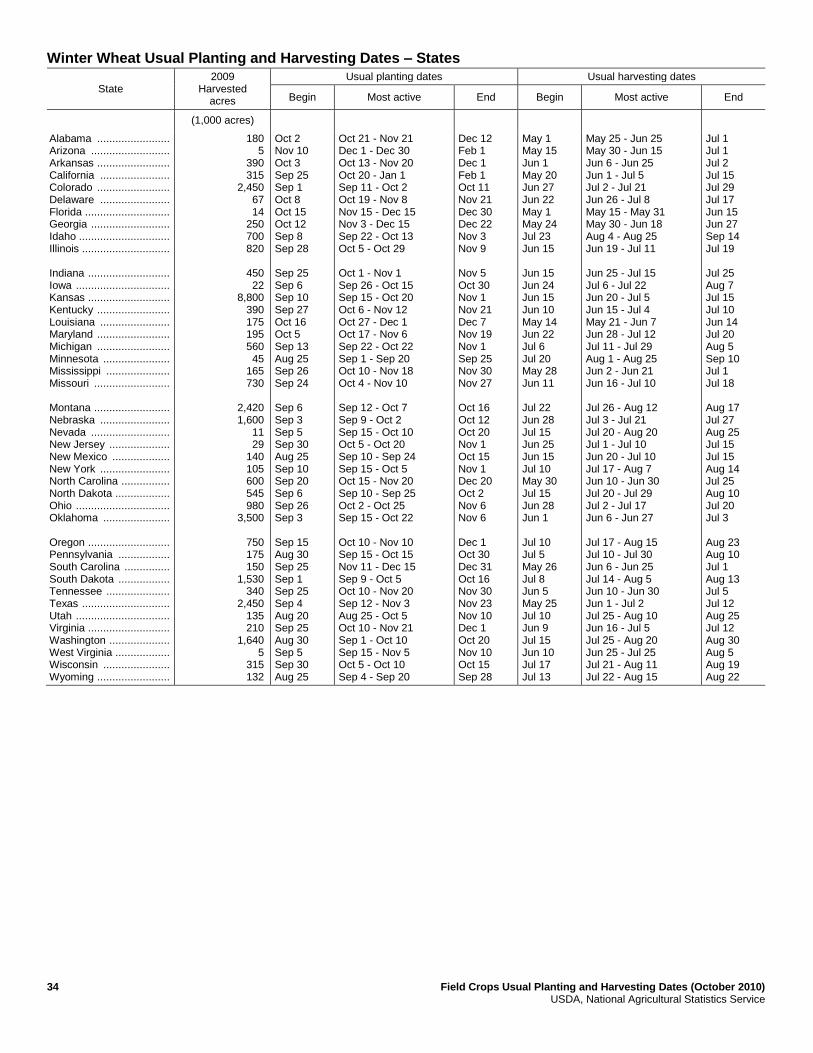
Winter Wheat
Winter wheat, widely grown throughout the United States, is heavily concentrated in the central and southern Great Plains
and the Pacific Northwest. Winter wheat is planted in the fall, goes into dormancy during the winter, and is harvested for
grain the following spring. When weather conditions are favorable for early fall growth, much of the winter wheat in the
southern Great Plains is grazed in the fall prior to going into dormancy and again in the late winter and early spring when
new growth starts.
Over 43 million acres of winter wheat were planted in 2009. With the exception of peak acreages during World War II
and the early 1980s, planted area has generally ranged between 40 and 50 million acres. Over 1.5 billion bushels of winter
wheat were produced in 2009, comprising 69 percent of all wheat produced. Kansas, Colorado, and Washington were the
three top producing winter wheat States and accounted for 37 percent of the total winter wheat production. Kansas ranked
second, behind only North Dakota, in all wheat production.

Field Crops Usual Planting and Harvesting Dates (October 2010) 33 USDA, National Agricultural Statistics Service
Durum Wheat Usual Planting and Harvesting Dates – States
State 2009
Harvested acres
Usual planting dates Usual harvesting dates
Begin Most active End Begin Most active End
(1,000 acres)
Arizona ........................... California ........................ Idaho .............................. Montana ......................... North Dakota .................. South Dakota ..................
124 170 20
535 1,570
9
Nov 10 Sep 25 Apr 1 Apr 25 Apr 23 Mar 31
Dec 1 - Dec 30 Oct 20 - Jan 1 Apr 10 - May 14 May 1 - Jun 1 May 2 - May 31 Apr 8 - May 12
Feb 1 Feb 1 May 30 Jun 15 Jun 8 May 21
May 15 May 20 Aug 8 Aug 11 Aug 7 Jul 20
May 30 - Jun 15 Jun 10 - Jul 15 Aug 13 - Sep 10 Aug 19 - Sep 22 Aug 15 - Sep 23 Jul 27 - Aug 20
Jul 1 Aug 1 Sep 29 Oct 4 Oct 5 Aug 29
Spring Wheat Usual Planting and Harvesting Dates – States
State 2009
Harvested acres
Usual planting dates Usual harvesting dates
Begin Most active End Begin Most active End
(1,000 acres)
Colorado ......................... Idaho .............................. Minnesota ....................... Montana ......................... Nevada ........................... North Dakota .................. Oregon ........................... South Dakota .................. Utah ................................ Washington ....................
29 530
1,550 2,350
2 6,300
127 1,470
12 585
Mar 28 Mar 21 Apr 14 Apr 6 Apr 5 Apr 16 Mar 1 Mar 31 Mar 20 Mar 15
Apr 9 - May 16 Apr 7 - May 3 Apr 23 - May 23 Apr 14 - May 12 Apr 15 - May 15 Apr 24 - May 25 Mar 25 - Apr 15 Apr 8 - May 12 Apr 1 - Apr 20 Mar 25 - Apr 30
May 23 May 26 Jun 1 May 18 May 20 Jun 3 May 6 May 21 May 1 May 10
Jul 23 Aug 4 Jul 30 Jul 30 Jul 20 Aug 1 Jul 20 Jul 20 Jul 15 Jul 25
Aug 3 - Sep 17 Aug 13 - Sep 8 Aug 5 - Sep 9 Aug 7 - Sep 6 Aug 1 - Aug 25 Aug 8 - Sep 13 Jul 25 - Sep 1 Jul 27 - Aug 20 Aug 5 - Aug 25 Aug 1 - Aug 30
Sep 29 Sep 29 Sep 22 Sep 13 Sep 5 Sep 25 Sep 3 Aug 29 Sep 5 Sep 5
34 Field Crops Usual Planting and Harvesting Dates (October 2010) USDA, National Agricultural Statistics Service
Winter Wheat Usual Planting and Harvesting Dates – States
State 2009
Harvested acres
Usual planting dates Usual harvesting dates
Begin Most active End Begin Most active End
(1,000 acres)
Alabama ........................ Arizona .......................... Arkansas ........................ California ....................... Colorado ........................ Delaware ....................... Florida ............................ Georgia .......................... Idaho .............................. Illinois ............................. Indiana ........................... Iowa ............................... Kansas ........................... Kentucky ........................ Louisiana ....................... Maryland ........................ Michigan ........................ Minnesota ...................... Mississippi ..................... Missouri ......................... Montana ......................... Nebraska ....................... Nevada .......................... New Jersey .................... New Mexico ................... New York ....................... North Carolina ................ North Dakota .................. Ohio ............................... Oklahoma ...................... Oregon ........................... Pennsylvania ................. South Carolina ............... South Dakota ................. Tennessee ..................... Texas ............................. Utah ............................... Virginia ........................... Washington .................... West Virginia .................. Wisconsin ...................... Wyoming ........................
180 5
390 315
2,450 67 14
250 700 820
450 22
8,800 390 175 195 560 45
165 730
2,420 1,600
11 29
140 105 600 545 980
3,500
750 175 150
1,530 340
2,450 135 210
1,640 5
315 132
Oct 2 Nov 10 Oct 3 Sep 25 Sep 1 Oct 8 Oct 15 Oct 12 Sep 8 Sep 28 Sep 25 Sep 6 Sep 10 Sep 27 Oct 16 Oct 5 Sep 13 Aug 25 Sep 26 Sep 24 Sep 6 Sep 3 Sep 5 Sep 30 Aug 25 Sep 10 Sep 20 Sep 6 Sep 26 Sep 3 Sep 15 Aug 30 Sep 25 Sep 1 Sep 25 Sep 4 Aug 20 Sep 25 Aug 30 Sep 5 Sep 30 Aug 25
Oct 21 - Nov 21 Dec 1 - Dec 30 Oct 13 - Nov 20 Oct 20 - Jan 1 Sep 11 - Oct 2 Oct 19 - Nov 8 Nov 15 - Dec 15 Nov 3 - Dec 15 Sep 22 - Oct 13 Oct 5 - Oct 29 Oct 1 - Nov 1 Sep 26 - Oct 15 Sep 15 - Oct 20 Oct 6 - Nov 12 Oct 27 - Dec 1 Oct 17 - Nov 6 Sep 22 - Oct 22 Sep 1 - Sep 20 Oct 10 - Nov 18 Oct 4 - Nov 10 Sep 12 - Oct 7 Sep 9 - Oct 2 Sep 15 - Oct 10 Oct 5 - Oct 20 Sep 10 - Sep 24 Sep 15 - Oct 5 Oct 15 - Nov 20 Sep 10 - Sep 25 Oct 2 - Oct 25 Sep 15 - Oct 22 Oct 10 - Nov 10 Sep 15 - Oct 15 Nov 11 - Dec 15 Sep 9 - Oct 5 Oct 10 - Nov 20 Sep 12 - Nov 3 Aug 25 - Oct 5 Oct 10 - Nov 21 Sep 1 - Oct 10 Sep 15 - Nov 5 Oct 5 - Oct 10 Sep 4 - Sep 20
Dec 12 Feb 1 Dec 1 Feb 1 Oct 11 Nov 21 Dec 30 Dec 22 Nov 3 Nov 9 Nov 5 Oct 30 Nov 1 Nov 21 Dec 7 Nov 19 Nov 1 Sep 25 Nov 30 Nov 27 Oct 16 Oct 12 Oct 20 Nov 1 Oct 15 Nov 1 Dec 20 Oct 2 Nov 6 Nov 6 Dec 1 Oct 30 Dec 31 Oct 16 Nov 30 Nov 23 Nov 10 Dec 1 Oct 20 Nov 10 Oct 15 Sep 28
May 1 May 15 Jun 1 May 20 Jun 27 Jun 22 May 1 May 24 Jul 23 Jun 15 Jun 15 Jun 24 Jun 15 Jun 10 May 14 Jun 22 Jul 6 Jul 20 May 28 Jun 11 Jul 22 Jun 28 Jul 15 Jun 25 Jun 15 Jul 10 May 30 Jul 15 Jun 28 Jun 1 Jul 10 Jul 5 May 26 Jul 8 Jun 5 May 25 Jul 10 Jun 9 Jul 15 Jun 10 Jul 17 Jul 13
May 25 - Jun 25 May 30 - Jun 15 Jun 6 - Jun 25 Jun 1 - Jul 5 Jul 2 - Jul 21 Jun 26 - Jul 8 May 15 - May 31 May 30 - Jun 18 Aug 4 - Aug 25 Jun 19 - Jul 11 Jun 25 - Jul 15 Jul 6 - Jul 22 Jun 20 - Jul 5 Jun 15 - Jul 4 May 21 - Jun 7 Jun 28 - Jul 12 Jul 11 - Jul 29 Aug 1 - Aug 25 Jun 2 - Jun 21 Jun 16 - Jul 10 Jul 26 - Aug 12 Jul 3 - Jul 21 Jul 20 - Aug 20 Jul 1 - Jul 10 Jun 20 - Jul 10 Jul 17 - Aug 7 Jun 10 - Jun 30 Jul 20 - Jul 29 Jul 2 - Jul 17 Jun 6 - Jun 27 Jul 17 - Aug 15 Jul 10 - Jul 30 Jun 6 - Jun 25 Jul 14 - Aug 5 Jun 10 - Jun 30 Jun 1 - Jul 2 Jul 25 - Aug 10 Jun 16 - Jul 5 Jul 25 - Aug 20 Jun 25 - Jul 25 Jul 21 - Aug 11 Jul 22 - Aug 15
Jul 1 Jul 1 Jul 2 Jul 15 Jul 29 Jul 17 Jun 15 Jun 27 Sep 14 Jul 19 Jul 25 Aug 7 Jul 15 Jul 10 Jun 14 Jul 20 Aug 5 Sep 10 Jul 1 Jul 18 Aug 17 Jul 27 Aug 25 Jul 15 Jul 15 Aug 14 Jul 25 Aug 10 Jul 20 Jul 3 Aug 23 Aug 10 Jul 1 Aug 13 Jul 5 Jul 12 Aug 25 Jul 12 Aug 30 Aug 5 Aug 19 Aug 22

Field Crops Usual Planting and Harvesting Dates (October 2010) 35 USDA, National Agricultural Statistics Service
Usual Planting and Harvesting Dates by Crop – Alabama
State 2009
Harvested acres
Usual planting dates Usual harvesting dates
Begin Most active End Begin Most active End
(1,000 acres)
Corn for grain .................................. Cotton, all ....................................... Hay, other ....................................... Oats, fall ......................................... Peanuts .......................................... Soybeans ....................................... Wheat, winter ..................................
250 248.0 800 11
152 430 180
Mar 15 Apr 5 (NA) Sep 1 Apr 16 Apr 15 Oct 2
Mar 25 - Apr 25 Apr 24 - May 24 (NA) Sep 15 - Oct 15 Apr 25 - May 25 May 25 - Jun 25 Oct 21 - Nov 21
May 18 Jun 6 (NA) Dec 1 Jun 15 Jul 3 Dec 12
Aug 2 Sep 5 May 10 May 1 Sep 15 Sep 3 May 1
Aug 11 - Sep 20 Sep 20 - Oct 20 Jun 20 - Sep 1 May 25 - Jun 25 Sep 22 - Oct 22 Oct 28 - Nov 28 May 25 - Jun 25
Oct 15 Dec 1 Oct 15 Jul 1 Nov 20 Dec 15 Jul 1
(NA) Not available.
Usual Planting and Harvesting Dates by Crop – Alaska
State 2009
Harvested acres
Usual planting dates Usual harvesting dates
Begin Most active End Begin Most active End
(1,000 acres)
Barley, spring .................................. Hay, other ....................................... Oats, spring .................................... Potatoes, all ....................................
4.4 20.0 0.9 0.7
May 5 (NA) May 5 May 10
May 10 - May 30 (NA) May 15 - May 30 May 20 - Jun 5
Jun 5 (NA) Jun 5 Jun 10
Aug 15 Jun 20 Sep 1 Aug 30
Aug 25 - Sep 25 Jul 1 - Sep 15 Sep 5 - Sep 30 Sep 5 - Sep 30
Oct 1 Oct 10 Oct 10 Oct 5
(NA) Not available.
Usual Planting and Harvesting Dates by Crop – Arizona
State 2009
Harvested acres
Usual planting dates Usual harvesting dates
Begin Most active End Begin Most active End
(1,000 acres)
Barley, fall ....................................... Corn for grain .................................. Corn for silage ................................ Cotton, all ....................................... Hay, alfalfa ..................................... Hay, other ....................................... Sorghum for grain ........................... Sorghum for silage .......................... Wheat, Durum ................................ Wheat, winter ..................................
45 20 30
145.6 280 30 8
27 124
5
Nov 10 Mar 10 Mar 15 Mar 15 (NA) (NA) Mar 10 Apr 1 Nov 10 Nov 10
Dec 1 - Dec 30 Apr 1 - May 15 Apr 1 - May 15 Apr 1 - Apr 30 (NA) (NA) Apr 1 - May 15 May 1 - May 30 Dec 1 - Dec 30 Dec 1 - Dec 30
Feb 10 Jun 1 Jun 1 May 15 (NA) (NA) Jun 1 Jul 1 Feb 1 Feb 1
May 10 Sep 1 Sep 1 Sep 15 Feb 15 Feb 15 Sep 1 Sep 1 May 15 May 15
May 30 - Jun 20 Oct 1 - Nov 1 Oct 1 - Nov 1 Oct 10 - Nov 10 (NA) (NA) Oct 1 - Nov 1 Oct 1 - Oct 30 May 30 - Jun 15 May 30 - Jun 15
Jul 10 Dec 1 Dec 1 Dec 25 Dec 1 Dec 1 Dec 1 Dec 15 Jul 1 Jul 1
(NA) Not available.

36 Field Crops Usual Planting and Harvesting Dates (October 2010) USDA, National Agricultural Statistics Service
Usual Planting and Harvesting Dates by Crop – Arkansas
State 2009
Harvested acres
Usual planting dates Usual harvesting dates
Begin Most active End Begin Most active End
(1,000 acres)
Corn for grain ................................. Cotton, all ...................................... Hay, alfalfa ..................................... Hay, other ...................................... Oats, fall ........................................ Rice, all .......................................... Sorghum for grain .......................... Soybeans ....................................... Wheat, winter .................................
410 500.0 15
1,400 8
1,470 37
3,270 390
Mar 26 Apr 23 (NA) (NA) Sep 15 Apr 6 Apr 5 Apr 19 Oct 3
Apr 1 - Apr 26 Apr 30 - May 23 (NA) (NA) Oct 1 - Nov 15 Apr 14 - May 19 Apr 13 - May 23 May 5 - Jun 22 Oct 13 - Nov 20
May 9 May 31 (NA) (NA) Dec 1 Jun 2 Jun 5 Jul 5 Dec 1
Aug 16 Sep 20 May 1 May 1 May 15 Aug 29 Aug 22 Sep 10 Jun 1
Aug 23 - Sep 23 Sep 29 - Nov 6 May 15 - Sep 1 May 15 - Sep 1 May 25 - Jun 15 Sep 9 - Oct 10 Aug 27 - Oct 3 Sep 29 - Nov 13 Jun 6 - Jun 25
Oct 6 Nov 20 Sep 15 Sep 15 Jul 1 Oct 24 Oct 16 Nov 26 Jul 2
(NA) Not available.
Usual Planting and Harvesting Dates by Crop – California
State 2009
Harvested acres
Usual planting dates Usual harvesting dates
Begin Most active End Begin Most active End
(1,000 acres)
Barley, fall ...................................... Barley, spring ................................. Corn for grain ................................. Corn for silage ............................... Cotton, all ...................................... Hay, alfalfa ..................................... Hay, other ...................................... Oats, fall ........................................ Oats, spring ................................... Rice, all .......................................... Sunflower, all ................................. Sugarbeets .................................... Wheat, Durum ................................ Wheat, winter .................................
55 ( 1 )
160 385 186.0 980 540 30 ( 1 )
556
41.5 25.3
170 315
Sep 15 Feb 20 Mar 15 Apr 1 Apr 1 (NA) (NA) Sep 15 Feb 20 Apr 20 Mar 21 Aug 15 Sep 25 Sep 25
Oct 1 - Apr 15 Mar 1 - May 1 Apr 1 - Jul 1 Apr 15 - Aug 1 Apr 10 - May 5 (NA) (NA) Oct 1 - Mar 1 Mar 1 - May 15 May 1 - May 25 Apr 1 - May 31 Sep 15 - Oct 15 Oct 20 - Jan 1 Oct 20 - Jan 1
Apr 30 May 15 Jul 15 Aug 15 May 15 (NA) (NA) Mar 15 May 30 Jun 10 Aug 1 Oct 30 Feb 1 Feb 1
May 15 Aug 15 Sep 1 Aug 1 Oct 5 Feb 15 May 1 Jun 15 Aug 15 Sep 5 Jun 1 Apr 1 May 20 May 20
Jun 1 - Jul 15 Sep 1 - Sep 20 Oct 1 - Nov 1 Aug 15 - Nov 1 Oct 10 - Nov 1 (NA) (NA) Jul 15 - Sep 1 Sep 1 - Sep 20 Sep 15 - Nov 1 Jul 1 - Aug 31 Apr 15 - Aug 1 Jun 10 - Jul 15 Jun 1 - Jul 5
Aug 15 Oct 1 Nov 15 Dec 1 Nov 20 Nov 20 Oct 1 Sep 15 Oct 1 Nov 10 Oct 1 Aug 15 Aug 1 Jul 15
(NA) Not available. 1 An "All" harvested acreage estimate is published under the "Fall" category.
Usual Planting and Harvesting Dates by Crop – Colorado
State 2009
Harvested acres
Usual planting dates Usual harvesting dates
Begin Most active End Begin Most active End
(1,000 acres)
Barley, spring ................................. Beans, dry edible ........................... Corn for grain ................................. Corn for silage ............................... Hay, alfalfa ..................................... Hay, other ...................................... Oats, spring ................................... Potatoes, fall .................................. Potatoes, summer .......................... Sorghum for grain .......................... Sorghum for silage ......................... Sugarbeets .................................... Sunflower, all ................................. Wheat, spring ................................. Wheat, winter .................................
77 53.0
990 85
850 750
9 55.2 3.9
150 7
35.0 87.0 29
2,450
Mar 14 May 20 Apr 19 Apr 19 (NA) (NA) Mar 17 May 2 Apr 8 May 9 May 9 Mar 30 May 19 Mar 28 Sep 1
Mar 26 - May 5 May 28 - Jun 18 Apr 28 - May 20 Apr 28 - May 20 (NA) (NA) Mar 28 - May 14 May 6 - May 25 Apr 14 - May 18 May 19 - Jun 23 May 19 - Jun 23 Apr 7 - Apr 30 May 25 - Jun 23 Apr 9 - May 16 Sep 11 - Oct 2
May 16 Jun 25 May 29 May 29 (NA) (NA) May 23 May 31 May 27 Jul 1 Jul 1 May 10 Jul 1 May 23 Oct 11
Jul 20 Sep 4 Sep 28 Aug 28 May 23 Jun 20 Jul 13 Sep 6 Aug 6 Sep 29 Sep 1 Sep 30 Sep 27 Jul 23 Jun 27
Jul 29 - Sep 6 Sep 9 - Oct 13 Oct 8 - Nov 13 Sep 5 - Sep 30 May 30 - Oct 6 Jul 5 - Aug 10 Jul 19 - Sep 13 Sep 15 - Oct 11 Aug 17 - Sep 25 Oct 11 - Nov 18 Sep 5 - Sep 20 Oct 10 - Nov 4 Oct 6 - Nov 15 Aug 3 - Sep 17 Jul 2 - Jul 21
Sep 14 Oct 20 Nov 22 Oct 7 Nov 9 Sep 15 Sep 25 Oct 17 Oct 4 Nov 29 Sep 30 Nov 12 Nov 26 Sep 29 Jul 29
(NA) Not available.

Field Crops Usual Planting and Harvesting Dates (October 2010) 37 USDA, National Agricultural Statistics Service
Usual Planting and Harvesting Dates by Crop – Delaware
State 2009
Harvested acres
Usual planting dates Usual harvesting dates
Begin Most active End Begin Most active End
(1,000 acres)
Barley, fall ....................................... Corn for grain .................................. Corn for silage ................................ Hay, alfalfa ..................................... Hay, other ....................................... Potatoes, summer .......................... Soybeans ....................................... Wheat, winter ..................................
26 163
5 5
12 1.6
183 67
Sep 27 Apr 12 Apr 12 (NA) (NA) Apr 5 May 11 Oct 8
Oct 9 - Oct 27 Apr 30 - May 16 Apr 30 - May 16 (NA) (NA) Apr 14 - Apr 28 May 30 - Jun 28 Oct 19 - Nov 8
Nov 10 May 28 May 28 (NA) (NA) May 5 Jul 11 Nov 21
Jun 5 Sep 10 Aug 11 May 13 May 10 Jul 4 Oct 5 Jun 22
Jun 12 - Jun 28 Sep 20 - Oct 15 Aug 25 - Sep 18 (NA) (NA) Jul 23 - Aug 23 Oct 22 - Nov 14 Jun 26 - Jul 8
Jul 3 Nov 5 Sep 30 Nov 19 Nov 8 Sep 15 Nov 25 Jul 17
(NA) Not available.
Usual Planting and Harvesting Dates by Crop – Florida
State 2009
Harvested acres
Usual planting dates Usual harvesting dates
Begin Most active End Begin Most active End
(1,000 acres)
Corn for grain .................................. Corn for silage ................................ Cotton, all ....................................... Hay, other ....................................... Peanuts .......................................... Potatoes, spring .............................. Soybeans ....................................... Sugarcane ...................................... Wheat, winter ..................................
37 30 78.0
300 105 28.9 34
387.0 14
Mar 1 Mar 1 Apr 15 (NA) Apr 10 Sep 10 Apr 20 Aug 21 Oct 15
Mar 15 - Apr 25 Mar 15 - Apr 15 Apr 25 - May 25 (NA) Apr 25 - May 30 Sep 15 - Mar 1 May 1 - Jun 15 Sep 15 - Dec 31 Nov 15 - Dec 15
May 5 Apr 30 Jun 15 (NA) Jun 15 Mar 15 Jul 1 Jan 31 Dec 30
Jul 15 Jun 1 Sep 20 May 10 Aug 15 Jan 15 Oct 1 Oct 7 May 1
Aug 1 - Sept 10 Jun 10 - Jul 20 Oct 1 - Nov 20 Jun 1 - Sep 15 Sep 10 - Nov 30 Feb 1 - Jun 15 Oct 15 - Nov 25 Oct 30 - Mar 21 May 15 - May 31
Oct 1 Aug 10 Dec 15 Nov 20 Dec 15 Jul 1 Dec 1 Apr 15 Jun 15
(NA) Not available.
Usual Planting and Harvesting Dates by Crop – Georgia
State 2009
Harvested acres
Usual planting dates Usual harvesting dates
Begin Most active End Begin Most active End
(1,000 acres)
Corn for grain .................................. Cotton, all ....................................... Hay, other ....................................... Oats, fall ......................................... Peanuts .......................................... Rye ................................................. Sorghum for grain ........................... Soybeans ....................................... Tobacco, Class 1 1 .......................... Wheat, winter ..................................
370 990.0 700 20
505 25 40
440 14.0
250
Mar 14 Apr 23 (NA) Sep 27 Apr 27 Sep 23 Apr 17 May 5 Mar 30 Oct 12
Mar 22 - Apr 21 May 2 - May 31 (NA) Oct 10 - Dec 5 May 6 - May 31 Oct 4 - Nov 25 Apr 30 - Jun 26 May 17 - Jun 26 Apr 4 - Apr 25 Nov 3 - Dec 15
May 4 Jun 11 (NA) Dec 13 Jun 7 Dec 9 Jul 12 Jul 5 May 1 Dec 22
Aug 6 Sep 23 May 15 May 25 Sep 15 May 15 Aug 21 Oct 11 Jun 29 May 24
Aug 16 - Sep 22 Oct 10 - Dec 2 (NA) Jun 1 - Jun 22 Sep 25 - Oct 31 May 25 - Jun 20 Sep 4 - Nov 19 Oct 25 - Dec 8 Jul 12 - Aug 30 May 30 - Jun 18
Oct 7 Dec 18 Nov 1 Jul 3 Nov 11 Jun 25 Dec 9 Dec 17 Sep 11 Jun 27
(NA) Not available. 1 Includes flue-cured types 11-14.

38 Field Crops Usual Planting and Harvesting Dates (October 2010) USDA, National Agricultural Statistics Service
Usual Planting and Harvesting Dates by Crop – Idaho
State 2009
Harvested acres
Usual planting dates Usual harvesting dates
Begin Most active End Begin Most active End
(1,000 acres)
Barley, spring ................................. Beans, dry edible ........................... Corn for grain ................................. Corn for silage ............................... Hay, alfalfa ..................................... Hay, other ...................................... Oats, spring ................................... Potatoes, fall .................................. Sugarbeets .................................... Wheat, Durum ................................ Wheat, spring ................................. Wheat, winter .................................
510 99.0 80
215 1,140
370 25
319.0 163.0 20
530 700
Mar 24 May 12 Apr 21 Apr 21 (NA) (NA) Mar 31 Apr 6 Mar 24 Apr 1 Mar 21 Sep 8
Apr 7 - May 5 May 26 - Jun 9 May 5 - May 26 May 5 - May 26 (NA) (NA) Apr 14 - May 19 Apr 28 - May 19 Apr 3 - Apr 21 Apr 10 - May 14 Apr 7 - May 3 Sep 22 - Oct 13
May 26 Jun 23 Jun 9 Jun 9 (NA) (NA) Jun 2 Jun 9 May 5 May 30 May 26 Nov 3
Jul 28 Aug 18 Sep 29 Sep 1 May 22 Jun 1 Jul 21 Aug 15 Sep 15 Aug 8 Aug 4 Jul 23
Aug 11 - Sep 8 Sep 8 - Oct 6 Oct 20 - Nov 10 Sep 15 - Oct 6 (NA) (NA) Aug 11 - Sep 8 Sep 22 - Oct 13 Oct 8 - Oct 30 Aug 13 - Sep 10 Aug 13 - Sep 8 Aug 4 - Aug 25
Sep 29 Oct 20 Nov 24 Oct 27 Oct 20 Sep 10 Sep 29 Oct 27 Nov 10 Sep 29 Sep 29 Sep 14
(NA) Not available.
Usual Planting and Harvesting Dates by Crop – Illinois
State 2009
Harvested acres
Usual planting dates Usual harvesting dates
Begin Most active End Begin Most active End
(1,000 acres)
Corn for grain ................................. Hay, alfalfa ..................................... Hay, other ...................................... Oats, spring ................................... Sorghum for grain .......................... Soybeans ....................................... Wheat, winter .................................
11,800 340 270 25 36
9,350 820
Apr 14 (NA) (NA) Mar 20 May 4 May 2 Sep 28
Apr 21 - May 23 (NA) (NA) Mar 29 - Apr 30 May 17 - Jun 26 May 8 - Jun 12 Oct 5 - Oct 29
Jun 5 (NA) (NA) May 12 Jul 6 Jun 24 Nov 9
Sep 14 May 9 May 11 Jul 4 Sep 18 Sep 19 Jun 15
Sep 23 - Nov 5 May 19 - Sep 8 May 20 - Jun 28 Jul 14 - Aug 7 Sep 30 - Nov 8 Sep 26 - Oct 26 Jun 19 - Jul 11
Nov 20 Sep 21 Jul 17 Aug 13 Nov 20 Nov 7 Jul 19
(NA) Not available.
Usual Planting and Harvesting Dates by Crop – Indiana
State 2009
Harvested acres
Usual planting dates Usual harvesting dates
Begin Most active End Begin Most active End
(1,000 acres)
Corn for grain ................................. Corn for silage ............................... Hay, alfalfa ..................................... Hay, other ...................................... Oats, spring ................................... Soybeans ....................................... Winter, wheat .................................
5,460 110 300 320
7 5,440
450
Apr 20 Apr 20 (NA) (NA) Apr 1 May 1 Sep 25
May 1 - Jun 1 May 1 - Jun 1 (NA) (NA) Apr 5 - Apr 25 May 5 - Jun 10 Oct 1 - Nov 1
Jun 10 Jun 10 (NA) (NA) May 10 Jun 25 Nov 5
Sep 15 Aug 15 May 15 May 15 Jul 10 Sep 20 Jun 15
Oct 1 - Nov 10 Aug 25 - Sep 5 (NA) (NA) Jul 15 - Aug 5 Oct 1 - Nov 1 Jun 25 - Jul 15
Nov 25 Sep 20 Sep 20 Sep 20 Aug 10 Nov 10 Jul 25
(NA) Not available.

Field Crops Usual Planting and Harvesting Dates (October 2010) 39 USDA, National Agricultural Statistics Service
Usual Planting and Harvesting Dates by Crop – Iowa
State 2009
Harvested acres
Usual planting dates Usual harvesting dates
Begin Most active End Begin Most active End
(1,000 acres)
Corn for grain .................................. Corn for silage ................................ Hay, alfalfa ..................................... Hay, other ....................................... Oats, spring .................................... Soybeans ....................................... Wheat, winter ..................................
13,400 220 920 300 95
9,530 22
Apr 19 Apr 19 (NA) (NA) Mar 25 May 2 Sep 6
Apr 25 - May 18 Apr 25 - May 18 (NA) (NA) Apr 2 - May 2 May 8 - Jun 2 Sep 26 - Oct 15
May 26 Jun 23 (NA) (NA) May 13 Jun 16 Oct 30
Sep 21 Aug 15 May 24 Jun 5 Jul 9 Sep 21 Jun 24
Oct 5 - Nov 9 Aug 25 - Sep 20 May 30 - Sep 15 Jun 14 - Aug 17 Jul 17 - Aug 5 Sep 28 - Oct 20 Jul 6 - Jul 22
Nov 21 Sep 25 Sep 29 Sep 3 Aug 11 Oct 31 Aug 7
(NA) Not available.
Usual Planting and Harvesting Dates by Crop – Kansas
State 2009
Harvested acres
Usual planting dates Usual harvesting dates
Begin Most active End Begin Most active End
(1,000 acres)
Barley, fall ....................................... Barley, spring .................................. Cotton, all ....................................... Corn for grain .................................. Hay, alfalfa ..................................... Hay, other ....................................... Oats, spring .................................... Sorghum for grain ........................... Soybeans ....................................... Sunflower, all .................................. Wheat, winter ..................................
9 ( 1 ) 34.0
3,860 850
1,700 35
2,550 3,650
155.0 8,800
Sep 15 Mar 1 May 10 Apr 5 (NA) (NA) Feb 20 May 5 May 5 May 15 Sep 10
Oct 1 - Oct 15 Mar 5 - Apr 1 May 20 - Jun 15 Apr 15 - May 15 (NA) (NA) Mar 5 - Apr 1 May 15 - Jun 20 May 15 - Jun 20 May 25 - Jun 30 Sep 15 - Oct 20
Nov 1 May 1 Jun 25 May 25 (NA) (NA) May 1 Jul 15 Jul 1 Jul 10 Nov 1
Jun 20 Jun 20 Oct 15 Sep 1 May 10 May 25 Jul 10 Sep 10 Sep 20 Sep 15 Jun 15
Jun 15 - Jul 1 Jun 25 - Jul 1 Oct 25 - Dec 15 Sep 10 - Oct 25 May 20 - Oct 15 Jun 1 - Sep 1 Jul 15 - Aug 1 Sep 25 - Nov 10 Oct 1 - Nov 1 Oct 1 - Nov 15 Jun 20 - Jul 5
Jul 5 Jul 10 Dec 30 Nov 10 Nov 1 Sep 15 Aug 10 Nov 25 Nov 15 Nov 30 Jul 15
(NA) Not available. 1 An "All" harvested acreage estimate is published under the "Fall" category.
Usual Planting and Harvesting Dates by Crop – Kentucky
State 2009
Harvested acres
Usual planting dates Usual harvesting dates
Begin Most active End Begin Most active End
(1,000 acres)
Corn for grain .................................. Corn for silage ................................ Hay, alfalfa ..................................... Hay, other ....................................... Soybeans ....................................... Tobacco, Class 2 1 .......................... Tobacco, Class 3A 2 ....................... Tobacco, Class 3B 3 ....................... Wheat, winter ..................................
1,150 60
220 2,300 1,420
9.1 75.0 4.6
390
Apr 6 Apr 20 (NA) (NA) May 4 May 11 May 9 May 11 Sep 27
Apr 14 - May 24 May 1 - Jun 10 (NA) (NA) May 16 - Jun 27 May 17 - Jun 15 May 17 - Jun 17 May 17 - Jun 15 Oct 6 - Nov 12
Jun 8 Jun 25 (NA) (NA) Jul 7 Jun 28 Jun 28 Jun 28 Nov 21
Sep 1 Aug 20 May 5 May 15 Sep 25 Aug 11 Aug 10 Aug 11 Jun 10
Sep 9 - Oct 24 Aug 25 - Sep 30 May 15 - Sep 1 Jun 1 - Sep 1 Oct 10 - Nov 14 Aug 17 - Sep 25 Aug 16 - Sep 26 Aug 17 - Sep 25 Jun 15 - Jul 4
Nov 10 Oct 10 Sep 15 Oct 10 Nov 25 Oct 5 Oct 4 Oct 5 Jul 10
(NA) Not available. 1 Includes fire-cured types 21-23. 2 Includes light air-cured types 31-32. 3 Includes dark air-cured types 35-37.

40 Field Crops Usual Planting and Harvesting Dates (October 2010) USDA, National Agricultural Statistics Service
Usual Planting and Harvesting Dates by Crop – Louisiana
State 2009
Harvested acres
Usual planting dates Usual harvesting dates
Begin Most active End Begin Most active End
(1,000 acres)
Corn for grain ................................. Cotton, all ...................................... Hay, other ...................................... Rice, all .......................................... Sorghum for grain .......................... Soybeans ....................................... Sugarcane ..................................... Sweet potatoes .............................. Wheat, winter .................................
610 225.0 380 464 65
940 425.0 12.0
175
Mar 13 Apr 17 (NA) Mar 20 Apr 6 Apr 18 Aug 11 May 13 Oct 16
Mar 19 - Apr 8 Apr 24 - May 17 (NA) Mar 28 - May 1 Apr 11 - May 15 Apr 23 - Jun 4 Aug 18 - Sep 21 May 24 - Jun 25 Oct 27 - Dec 1
Apr 16 May 26 (NA) May 15 May 29 Jun 16 Oct 1 Jul 6 Dec 7
Jul 31 Sep 14 Apr 17 Jul 27 Aug 7 Aug 28 Oct 5 Aug 24 May 14
Aug 9 - Sep 5 Sep 23 - Oct 23 (NA) Aug 4 - Sep 15 Aug 16 - Sep 10 Sep 3 - Oct 25 Oct 18 - Dec 17 Sep 10 - Nov 10 May 21 - Jun 7
Sep 12 Nov 6 Sep 14 Sep 28 Sep 24 Oct 31 Dec 23 Nov 20 Jun 14
(NA) Not available.
Usual Planting and Harvesting Dates by Crop – Maryland
State 2009
Harvested acres
Usual planting dates Usual harvesting dates
Begin Most active End Begin Most active End
(1,000 acres)
Barley, fall ...................................... Corn for grain ................................. Corn for silage ............................... Hay, alfalfa ..................................... Hay, other ...................................... Potatoes, summer .......................... Soybeans ....................................... Wheat, winter .................................
48 425 40 40
170 2.3
475 195
Sep 17 Apr 20 Apr 20 (NA) (NA) Apr 7 May 11 Oct 5
Oct 1 - Oct 21 Apr 30 - May 20 Apr 30 - May 20 (NA) (NA) Apr 12 - Apr 28 May 28 - Jun 26 Oct 17 - Nov 6
Nov 7 Jun 7 Jun 7 (NA) (NA) May 10 Jul 16 Nov 19
Jun 12 Sep 9 Aug 24 May 12 May 10 Jul 1 Oct 5 Jun 22
Jun 16 - Jun 28 Sep 22 - Oct 22 Sep 9 - Oct 1 (NA) (NA) Jul 20 - Aug 11 Oct 18 - Nov 15 Jun 28 - Jul 12
Jul 8 Nov 17 Oct 14 Nov 30 Nov 19 Aug 28 Dec 1 Jul 20
(NA) Not available.
Usual Planting and Harvesting Dates by Crop – Michigan
State 2009
Harvested acres
Usual planting dates Usual harvesting dates
Begin Most active End Begin Most active End
(1,000 acres)
Barley, spring ................................. Beans, dry edible ........................... Corn for grain ................................. Corn for silage ............................... Hay, alfalfa ..................................... Hay, other ...................................... Oats, spring ................................... Potatoes, fall .................................. Soybeans ....................................... Sugarbeets .................................... Wheat, winter .................................
11 195.0
2,090 220 700 290 55 43.5
1,990 136.0 560
Apr 10 May 29 Apr 21 Apr 21 (NA) (NA) Apr 10 Apr 16 May 2 Apr 7 Sep 13
Apr 13 - May 20 Jun 3 - Jun 17 May 1 - May 27 May 1 - May 27 (NA) (NA) Apr 13 - May 14 Apr 24 - May 31 May 11 - Jun 9 Apr 10 - May 11 Sep 22 - Oct 22
May 27 Jun 28 Jun 6 Jun 6 (NA) (NA) May 22 Jun 8 Jun 18 May 16 Nov 1
Jul 26 Sep 3 Sep 5 Aug 26 May 31 May 31 Jul 19 Jul 24 Sep 25 Sep 26 Jul 6
Aug 3 - Aug 19 Sep 12 - Oct 12 Oct 10 - Nov 25 Sep 7 - Oct 10 Jun 15 - Sep 11 Jul 28 - Sep 11 Jul 28 - Aug 24 Aug 8 - Oct 19 Oct 3 - Nov 3 Oct 13 - Nov 3 Jul 11 - Jul 29
Aug 31 Oct 24 Dec 10 Oct 20 Oct 14 Oct 14 Sep 2 Oct 28 Nov 13 Nov 11 Aug 5
(NA) Not available.

Field Crops Usual Planting and Harvesting Dates (October 2010) 41 USDA, National Agricultural Statistics Service
Usual Planting and Harvesting Dates by Crop – Minnesota
State 2009
Harvested acres
Usual planting dates Usual harvesting dates
Begin Most active End Begin Most active End
(1,000 acres)
Barley, spring .................................. Beans, dry edible ............................ Corn for grain .................................. Corn for silage ................................ Hay, alfalfa ..................................... Hay, other ....................................... Oats, spring .................................... Potatoes, fall ................................... Soybeans ....................................... Sugarbeets ..................................... Sunflower, all .................................. Wheat, spring ................................. Wheat, winter ..................................
80 140.0
7,150 380
1,300 750 170 45.0
7,120 449.0
64.0
1,550 45
Apr 15 May 7 Apr 22 Apr 22 (NA) (NA) Apr 11 Apr 20 May 2 Apr 18 May 7 Apr 14 Aug 25
Apr 23 - May 25 May 14 - Jun 7 Apr 26 - May 19 Apr 26 - May 19 (NA) (NA) Apr 19 - May 15 Apr 25 - May 30 May 8 - Jun 2 Apr 24 - May 18 May 16 - Jun 7 Apr 23 - May 23 Sep 1 - Sep 20
Jun 3 Jun 18 May 29 May 29 (NA) (NA) May 26 Jun 10 Jun 13 May 26 Jun 15 Jun 1 Sep 25
Jul 26 Aug 29 Sep 27 Aug 27 May 25 Jun 5 Jul 21 Aug 15 Sep 20 Sep 16 Sep 26 Jul 30 Jul 20
Aug 1 - Sep 3 Sep 5 - Oct 9 Oct 8 - Nov 8 Sep 4 - Oct 5 (NA) (NA) Jul 26 - Aug 24 Aug 29 - Oct 12 Sep 27 - Oct 20 Sep 30 - Oct 19 Oct 4 - Nov 8 Aug 5 - Sep 9 Aug 1 - Aug 25
Sep 18 Oct 17 Nov 23 Oct 14 Sep 24 Aug 30 Sep 4 Oct 20 Oct 31 Oct 27 Nov 25 Sep 22 Sep 10
(NA) Not available.
Usual Planting and Harvesting Dates by Crop – Mississippi
State 2009
Harvested acres
Usual planting dates Usual harvesting dates
Begin Most active End Begin Most active End
(1,000 acres)
Corn for grain .................................. Corn for silage ................................ Cotton, all ....................................... Hay, other ....................................... Peanuts .......................................... Rice, all .......................................... Sorghum for grain ........................... Sorhgum for silage .......................... Soybeans ....................................... Sweet potatoes ............................... Wheat, winter ..................................
695 10
290.0 700 18
243 11 1
2,030 11.0
165
Mar 17 Mar 17 Apr 20 (NA) Apr 25 Apr 6 Apr 8 Apr 8 Apr 19 May 4 Sep 26
Mar 24 - Apr 27 Mar 24 - Apr 27 Apr 27 - May 19 (NA) May 6 - May 31 Apr 18 - May 16 Apr 14 - May 21 Apr 14 - May 21 Apr 26 - May 31 Jun 7 - Jun 23 Oct 10 - Nov 18
May 4 May 4 May 29 (NA) Jun 15 May 24 Jun 3 Jun 3 Jun 17 Jul 7 Nov 30
Aug 11 Jul 13 Sep 15 Apr 10 Sep 20 Aug 29 Aug 19 Aug 4 Sep 10 Aug 20 May 28
Aug 23 - Sep 23 Jul 19 - Aug 29 Sep 27 - Oct 29 (NA) Sep 29 - Oct 31 Sep 5 - Oct 6 Aug 29 - Sep 27 Aug 12 - Sep 16 Sep 13 - Oct 31 Sep 2 - Oct 28 Jun 2 - Jun 21
Oct 7 Sep 12 Nov 12 Sep 26 Nov 10 Oct 20 Oct 8 Oct 2 Nov 9 Nov 7 Jul 1
(NA) Not available.
Usual Planting and Harvesting Dates by Crop – Missouri
State 2009
Harvested acres
Usual planting dates Usual harvesting dates
Begin Most active End Begin Most active End
(1,000 acres)
Corn for grain .................................. Cotton, all ....................................... Hay, alfalfa ..................................... Hay, other ....................................... Oats, spring .................................... Rice, all .......................................... Sorghum for grain ........................... Soybeans ....................................... Wheat, winter ..................................
2,920 260.0 280
3,600 9
200 43
5,300 730
Apr 3 Apr 22 (NA) (NA) Mar 1 Apr 10 Apr 23 May 2 Sep 24
Apr 11 - May 27 Apr 29 - May 23 (NA) (NA) Mar 15 - Apr 20 Apr 20 - May 19 May 6 - Jun 18 May 13 - Jun 24 Oct 4 - Nov 10
Jun 12 May 29 (NA) (NA) Apr 30 May 26 Jun 28 Jul 4 Nov 27
Aug 29 Sep 17 May 16 May 17 Jun 20 Sep 6 Sep 6 Sep 25 Jun 11
Sep 8 - Nov 3 Sep 27 - Nov 9 Jun 28 - Aug 14 Jun 24 - Jul 14 Jul 1 - Jul 25 Sep 14 - Oct 18 Sep 16 - Nov 7 Oct 3 - Nov 8 Jun 16 - Jul 10
Dec 22 Nov 24 Sep 1 Aug 5 Aug 1 Oct 30 Nov 22 Nov 23 Jul 18
(NA) Not available.

42 Field Crops Usual Planting and Harvesting Dates (October 2010) USDA, National Agricultural Statistics Service
Usual Planting and Harvesting Dates by Crop – Montana
State 2009
Harvested acres
Usual planting dates Usual harvesting dates
Begin Most active End Begin Most active End
(1,000 acres)
Barley, spring ................................. Beans, dry edible ........................... Corn for grain ................................. Corn for silage ............................... Hay, alfalfa ..................................... Hay, other ...................................... Oats, spring ................................... Potatoes, fall .................................. Sugarbeets .................................... Wheat, Durum ................................ Wheat, spring ................................. Wheat, winter .................................
720 11.5 26 45
1,700 800 32 9.7
33.6 535
2,350 2,420
Apr 3 May 5 Apr 26 Apr 26 (NA) (NA) Apr 18 May 7 Apr 14 Apr 25 Apr 6 Sep 6
Apr 13 - May 11 May 10 - Jun 3 May 4 - May 28 May 4 - May 28 (NA) (NA) Apr 26 - May 28 May 17 - Jun 7 Apr 20 - May 12 May 1 - Jun 1 Apr 14 - May 12 Sep 12 - Oct 7
May 20 Jun 9 Jun 4 Jun 4 (NA) (NA) Jun 5 Jun 13 May 18 Jun 15 May 18 Oct 16
Jul 27 Aug 27 Oct 4 Aug 26 Jun 18 Jun 20 Aug 8 Sep 19 Sep 28 Aug 11 Jul 30 Jul 22
Aug 3 - Sep 2 Sep 3 - Oct 2 Oct 25 - Dec 3 Sep 6 - Oct 1 (NA) (NA) Aug 15 - Sep 9 Sep 22 - Oct 23 Oct 9 - Oct 27 Aug 19 - Sep 22 Aug 7 - Sep 6 Jul 26 - Aug 12
Sep 10 Oct 11 Dec 8 Oct 10 Sep 23 Oct 7 Sep 22 Oct 31 Nov 4 Oct 4 Sep 13 Aug 17
(NA) Not available.
Usual Planting and Harvesting Dates by Crop – Nebraska
State 2009
Harvested acres
Usual planting dates Usual harvesting dates
Begin Most active End Begin Most active End
(1,000 acres)
Beans, dry edible ........................... Corn for grain ................................. Hay, alfalfa ..................................... Hay, other ...................................... Oats, spring ................................... Sorghum for grain .......................... Soybeans ....................................... Sugarbeets .................................... Sunflower, all ................................. Wheat, winter .................................
115.0 8,850
950 1,750
30 140
4,760 52.6 47.0
1,600
May 21 Apr 19 (NA) (NA) Mar 26 May 9 May 5 Apr 1 Jun 1 Sep 3
May 27 - Jun 16 Apr 27 - May 15 (NA) (NA) Apr 1 - Apr 24 May 16 - Jun 9 May 11 - May 31 Apr 10 - Apr 30 Jun 5 - Jun 30 Sep 9 - Oct 2
Jun 21 May 21 (NA) (NA) May 3 Jun 16 Jun 8 May 5 Jul 5 Oct 12
Sep 3 Sep 18 May 19 Jun 5 Jul 4 Sep 26 Sep 23 Oct 5 Oct 1 Jun 28
Sep 13 - Oct 9 Oct 4 - Nov 10 (NA) (NA) Jul 10 - Jul 30 Oct 8 - Nov 8 Sep 29 - Oct 24 Oct 10 - Oct 30 Oct 5 - Oct 25 Jul 3 - Jul 21
Oct 19 Nov 20 Oct 15 Sep 20 Aug 7 Nov 17 Nov 2 Nov 5 Nov 5 Jul 27
(NA) Not available.
Usual Planting and Harvesting Dates by Crop – Nevada
State 2009
Harvested acres
Usual planting dates Usual harvesting dates
Begin Most active End Begin Most active End
(1,000 acres)
Alfalfa seed .................................... Hay, alfalfa ..................................... Hay, other ...................................... Wheat, spring ................................. Wheat, winter .................................
5 280 210
2 11
(NA) (NA) (NA) Apr 5 Sep 5
(NA) (NA) (NA) Apr 15 - May 15 Sep 15 - Oct 10
(NA) (NA) (NA) May 20 Oct 20
Aug 20 May 20 Jun 15 Jul 20 Jul 15
Aug 25 - Sep 15 (NA) (NA) Aug 1 - Aug 25 Jul 20 - Aug 20
Sep 20 Oct 15 Sep 15 Sep 5 Aug 25
(NA) Not available.

Field Crops Usual Planting and Harvesting Dates (October 2010) 43 USDA, National Agricultural Statistics Service
Usual Planting and Harvesting Dates by Crop – New England
State 2009
Harvested acres
Usual planting dates Usual harvesting dates
Begin Most active End Begin Most active End
(1,000 acres)
Barley, spring 1 ............................... Corn for silage ................................ Hay, alfalfa ..................................... Hay, other ....................................... Oats, spring 1 .................................. Potatoes, fall Maine .......................................... Massachusetts ............................ Rhode Island .............................. Tobacco, Class 5 2 3 ....................... Tobacco, Class 6 2 4 .......................
15 161 65
481 31
55.5 3.4 0.4 1.4 0.9
May 4 May 5 (NA) (NA) May 5 May 9 Apr 25 Apr 27 May 22 May 15
May 9 - May 30 May 12 - Jun 9 (NA) (NA) May 10 - May 31 May 14 - Jun 3 Apr 27 - May 23 Apr 30 - May 23 May 29 - Jun 23 May 18 - Jun 3
Jun 6 Jun 22 (NA) (NA) Jun 7 Jun 9 May 30 Jun 9 Jul 1 Jun 9
Aug 9 Sep 5 May 25 May 25 Aug 11 Sep 6 Aug 1 Aug 3 Jul 28 Jul 16
Aug 18 - Sep 18 Sep 14 - Oct 16 (NA) (NA) Aug 21 - Sep 22 Sep 20 - Oct 10 Aug 15 - Oct 10 Aug 16 - Oct 1 Aug 3 - Aug 31 Jul 24 - Aug 28
Sep 30 Oct 26 Oct 31 Oct 31 Oct 4 Oct 17 Oct 22 Oct 16 Sep 10 Sep 6
(NA) Not available. 1 Maine only. 2 Connecticut and Massachusetts only. 3 Includes cigar binder type 51. 4 Includes cigar wrapper type 61.
Usual Planting and Harvesting Dates by Crop – New Jersey
State 2009
Harvested acres
Usual planting dates Usual harvesting dates
Begin Most active End Begin Most active End
(1,000 acres)
Corn for grain .................................. Corn for silage ................................ Hay, alfalfa ..................................... Hay, other ....................................... Potatoes, summer .......................... Soybeans ....................................... Sweet potatoes ............................... Wheat, winter ..................................
70 9
25 85 2.1
87 1.2
29
Apr 15 Apr 15 (NA) (NA) Apr 20 May 10 May 10 Sep 30
May 1 - May 20 May 1 - May 20 (NA) (NA) May 1 - May 20 May 20 - Jul 1 May 20 - Jun 20 Oct 5 - Oct 20
Jun 15 Jul 1 (NA) (NA) Jun 1 Jul 10 Jul 10 Nov 1
Sep 25 Aug 30 May 15 May 10 Jul 10 Oct 1 Sep 10 Jun 25
Oct 10 - Nov 1 Sep 10 - Sep 30 (NA) (NA) Jul 20 - Sep 30 Oct 20 - Nov 10 Sep 20 - Nov 10 Jul 1 - Jul 10
Nov 15 Nov 20 Nov 1 Oct 15 Oct 15 Nov 15 Nov 20 Jul 15
(NA) Not available.
Usual Planting and Harvesting Dates by Crop – New Mexico
State 2009
Harvested acres
Usual planting dates Usual harvesting dates
Begin Most active End Begin Most active End
(1,000 acres)
Beans, dry edible ............................ Corn for grain .................................. Corn for silage ................................ Cotton, all ....................................... Hay, alfalfa ..................................... Hay, other ....................................... Peanuts .......................................... Potatoes, fall ................................... Sorghum for grain ........................... Sorghum for silage .......................... Wheat, winter ..................................
12.4 50 78 32.3
240 80 7 6.4
50 18
140
May 15 Apr 15 Apr 15 Apr 10 (NA) (NA) May 10 Apr 20 May 15 May 10 Aug 25
May 20 - Jun 1 Apr 20 - May 10 Apr 20 - May 10 Apr 20 - May 10 (NA) (NA) May 15 - May 25 Apr 25 - May 5 May 20 - Jun 15 May 20 - Jun 10 Sep 10 - Sep 24
Jun 15 May 20 May 20 May 20 (NA) (NA) Jun 1 May 10 Jul 10 Jun 20 Oct 15
Aug 15 Sep 25 Sep 1 Oct 10 May 1 May 1 Oct 1 Sep 1 Oct 15 Sep 5 Jun 15
Sep 1 - Sep 30 Oct 1 - Oct 30 Sep 10 - Oct 1 Oct 25 - Nov 30 (NA) (NA) Oct 10 - Oct 30 Sep 25 - Oct 10 Oct 20 - Nov 15 Sep 15 - Oct 10 Jun 20 - Jul 10
Oct 15 Nov 20 Nov 1 Dec 20 Oct 20 Oct 20 Nov 10 Oct 20 Dec 15 Nov 1 Jul 15
(NA) Not available.

44 Field Crops Usual Planting and Harvesting Dates (October 2010) USDA, National Agricultural Statistics Service
Usual Planting and Harvesting Dates by Crop – New York
State 2009
Harvested acres
Usual planting dates Usual harvesting dates
Begin Most active End Begin Most active End
(1,000 acres)
Barley, spring ................................. Beans, dry edible ........................... Corn for grain ................................. Corn for silage ............................... Hay, alfalfa ..................................... Hay, other ...................................... Oats, spring ................................... Potatoes, fall .................................. Soybeans ....................................... Wheat, winter .................................
10 15.6
595 470 350
1,010 60 16.5
254 105
Apr 1 Jun 1 Apr 20 Apr 20 (NA) (NA) Mar 25 Mar 25 May 12 Sep 10
Apr 7 - Apr 29 Jun 15 - Jun 30 May 4 - Jun 13 May 4 - Jun 13 (NA) (NA) Apr 1 - Apr 22 May 15 - May 25 May 19 - Jun 22 Sep 15 - Oct 5
May 29 Jul 13 Jun 20 Jun 20 (NA) (NA) May 29 Jun 15 Jun 29 Nov 1
Aug 1 Sep 1 Oct 7 Sep 5 May 25 May 25 Jul 30 Jul 27 Sep 27 Jul 10
Aug 7 - Aug 27 Sep 15 - Sep 30 Oct 14 - Nov 14 Sep 10 - Oct 1 (NA) (NA) Aug 4 - Aug 24 Aug 1 - Oct 7 Oct 7 - Nov 14 Jul 17 - Aug 7
Sep 12 Oct 15 Nov 25 Oct 15 Oct 10 Oct 15 Sep 9 Oct 22 Nov 20 Aug 14
(NA) Not available.
Usual Planting and Harvesting Dates by Crop – North Carolina
State 2009
Harvested acres
Usual planting dates Usual harvesting dates
Begin Most active End Begin Most active End
(1,000 acres)
Barley, fall ...................................... Corn for grain ................................. Corn for silage ............................... Cotton, all ...................................... Hay, alfalfa ..................................... Hay, other ...................................... Oats, fall ........................................ Peanuts ......................................... Potatoes, spring ............................. Soybeans ....................................... Sweet potatoes .............................. Tobacco, Class 1 1 ......................... Tobacco, Class 3A 2 ....................... Wheat, winter .................................
19 800 55
370.0 7
840 15 66 15.0
1,750
46.0 174.0
3.4 600
Sep 25 Apr 1 Apr 1 Apr 20 (NA) (NA) Sep 25 Apr 30 Mar 5 May 1 May 5 Apr 15 May 15 Sep 20
Oct 15 - Nov 10 Apr 10 - Apr 25 Apr 10 - Apr 25 May 1 - May 20 (NA) (NA) Oct 15 - Nov 25 May 10 - May 30 Mar 10 - Apr 10 May 20 - Jun 30 May 20 - Jun 15 Apr 20 - May 25 May 20 - Jun 10 Oct 15 - Nov 20
Dec 1 May 15 May 20 Jun 1 (NA) (NA) Dec 10 Jun 1 Apr 30 Jul 20 Jul 15 Jun 5 Jun 30 Dec 20
May 25 Aug 25 Aug 1 Sep 30 Apr 30 Apr 30 May 30 Sep 25 Jun 10 Oct 10 Sep 1 Jul 1 Aug 20 May 30
Jun 10 - Jun 30 Sep 10 - Oct 10 Aug 20 - Sep 20 Oct 10 - Nov 15 (NA) (NA) Jun 10 - Jun 30 Oct 10 - Oct 30 Jun 25 - Jul 15 Nov 10 - Dec 5 Sep 25 - Nov 5 Jul 20 - Sep 15 Sep 1 - Sep 20 Jun 10 - Jun 30
Jul 25 Nov 1 Oct 20 Dec 15 Nov 15 Nov 15 Jul 25 Nov 15 Aug 10 Dec 20 Nov 20 Oct 10 Oct 15 Jul 25
(NA) Not available. 1 Includes flue-cured types 11-14. 2 Includes light air-cured types 31-32.
Usual Planting and Harvesting Dates by Crop – North Dakota
State 2009
Harvested acres
Usual planting dates Usual harvesting dates
Begin Most active End Begin Most active End
(1,000 acres)
Barley, spring ................................. Beans, dry edible ........................... Corn for grain ................................. Corn for silage ............................... Flaxseed ........................................ Hay, alfalfa ..................................... Hay, other ...................................... Oats, spring ................................... Potatoes, fall .................................. Soybeans ....................................... Sugarbeets .................................... Sunflower, all ................................. Wheat, Durum ................................ Wheat, spring ................................. Wheat, winter .................................
1,130 580.0
1,740 170 293
1,780 1,180
165 75.0
3,870
218.0 868.0
1,570 6,300
545
Apr 19 May 14 Apr 26 Apr 26 Apr 30 (NA) (NA) Apr 19 Apr 28 May 7 Apr 19 May 14 Apr 23 Apr 16 Sep 6
Apr 26 - May 25 May 19 - Jun 6 May 2 - May 28 May 2 - May 28 May 7 - Jun 3 (NA) (NA) Apr 26 - May 25 May 5 - May 30 May 14 - Jun 3 Apr 24 - May 18 May 19 - Jun 8 May 2 - May 31 Apr 24 - May 25 Sep 10 - Sep 25
Jun 3 Jun 13 Jun 4 Jun 4 Jun 12 (NA) (NA) Jun 3 Jun 6 Jun 11 May 26 Jun 15 Jun 8 Jun 3 Oct 2
Jul 28 Aug 30 Sep 28 Aug 27 Aug 17 Jun 10 Jun 19 Jul 28 Sep 2 Sep 17 Sep 17 Oct 1 Aug 7 Aug 1 Jul 15
Aug 4 - Sep 3 Sep 7 - Oct 11 Oct 8 - Nov 19 Sep 6 - Oct 5 Aug 26 - Oct 3 (NA) (NA) Aug 5 - Sep 5 Sep 10 - Oct 7 Sep 24 - Oct 21 Sep 30 - Oct 17 Oct 9 - Nov 10 Aug 15 - Sep 23 Aug 8 - Sep 13 Jul 20 - Jul 29
Sep 16 Oct 26 Dec 6 Oct 14 Oct 15 Sep 6 Sep 2 Sep 18 Oct 16 Nov 5 Oct 25 Nov 23 Oct 5 Sep 25 Aug 10
(NA) Not available.

Field Crops Usual Planting and Harvesting Dates (October 2010) 45 USDA, National Agricultural Statistics Service
Usual Planting and Harvesting Dates by Crop – Ohio
State 2009
Harvested acres
Usual planting dates Usual harvesting dates
Begin Most active End Begin Most active End
(1,000 acres)
Corn for grain .................................. Corn for silage ................................ Hay, alfalfa ..................................... Hay, other ....................................... Oats, spring .................................... Potatoes, fall ................................... Soybeans ....................................... Tobacco, Class 3A 1 ....................... Wheat, winter ..................................
3,140 170 380 660 45 2.1
4,530 3.4
980
Apr 18 Apr 18 (NA) (NA) Apr 4 Apr 10 Apr 26 May 25 Sep 26
Apr 24 - May 24 Apr 24 - May 24 (NA) (NA) Apr 9 - May 5 Apr 20 - May 28 May 3 - May 30 Jun 1 - Jun 15 Oct 2 - Oct 25
May 30 May 30 (NA) (NA) May 13 Jun 8 Jun 10 Jun 25 Nov 6
Sep 27 Aug 22 May 17 May 20 Jul 13 Jul 30 Sep 23 Aug 20 Jun 28
Oct 11 - Nov 20 Sep 2 - Oct 4 May 25 - Sep 11 May 27 - Oct 2 Jul 20 - Aug 7 Aug 8 - Oct 6 Sep 30 - Oct 31 Sep 5 - Sep 15 Jul 2 - Jul 17
Dec 1 Oct 14 Sep 24 Oct 13 Aug 11 Oct 17 Nov 12 Sep 30 Jul 20
(NA) Not available. 1 Includes light air-cured types 31-32.
Usual Planting and Harvesting Dates by Crop – Oklahoma
State 2009
Harvested acres
Usual planting dates Usual harvesting dates
Begin Most active End Begin Most active End
(1,000 acres)
Canola ............................................ Corn for grain .................................. Cotton, all ....................................... Hay, alfalfa ..................................... Hay, other ....................................... Oats, spring .................................... Peanuts .......................................... Rye ................................................. Sorghum for grain ........................... Soybeans ....................................... Sunflower, all .................................. Wheat, winter ..................................
37.0 320 195.0 320
2,900 15 13 40
220 390 15.0
3,500
Sep 10 Mar 21 May 2 (NA) (NA) Feb 15 Apr 28 Sep 3 Apr 24 Apr 15 May 1 Sep 3
Sep 15 - Sep 30 Apr 2 - May 8 May 11 - Jun 10 (NA) (NA) Feb 22 - Mar 17 May 7 - Jun 6 Sep 10 - Oct 15 May 12 - Jun 25 Apr 27 - Jun 27 May 15 - Jul 15 Sep 15 - Oct 22
Oct 10 May 17 Jun 18 (NA) (NA) Mar 26 Jun 11 Oct 28 Jul 6 Jul 9 Jul 30 Nov 6
May 20 Aug 20 Oct 4 Apr 20 Apr 20 Jun 4 Oct 2 Jun 3 Sep 9 Sep 9 Aug 1 Jun 1
Jun 1 - Jun 10 Aug 29 - Oct 9 Oct 15 - Dec 9 (NA) (NA) Jun 10 - Jul 4 Oct 9 - Nov 16 Jun 10 - Jul 2 Sep 26 - Nov 21 Sep 22 - Nov 20 Aug 30 - Oct 30 Jun 6 - Jun 27
Jun 20 Oct 20 Dec 24 Oct 13 Oct 20 Jul 13 Nov 26 Jul 11 Dec 2 Dec 1 Dec 10 Jul 3
(NA) Not available.
Usual Planting and Harvesting Dates by Crop – Oregon
State 2009
Harvested acres
Usual planting dates Usual harvesting dates
Begin Most active End Begin Most active End
(1,000 acres)
Barley, spring .................................. Corn for grain .................................. Corn for silage ................................ Hay, alfalfa ..................................... Hay, other ....................................... Oats, fall ......................................... Potatoes, fall ................................... Sugarbeets ..................................... Wheat, spring ................................. Wheat, winter ..................................
32 32 28
400 630 22 37.0 10.5
127 750
Mar 1 Mar 25 May 5 (NA) (NA) Sep 15 Mar 15 Apr 1 Mar 1 Sep 15
Mar 30 - May 15 Apr 25 - Jun 5 May 25 - Jun 10 (NA) (NA) Oct 15 - Nov 15 Apr 15 - May 14 Apr 10 - Apr 20 Mar 25 - Apr 15 Oct 10 - Nov 10
May 25 Jun 15 Jun 25 (NA) (NA) Dec 10 May 25 Apr 25 May 6 Dec 1
Jul 10 Oct 10 Sep 1 May 5 May 20 Jul 10 Jul 15 Oct 1 Jul 20 Jul 10
Jul 21 - Sep 1 Oct 20 - Nov 20 Sep 10 - Sep 20 (NA) (NA) Aug 10 - Aug 20 Oct 10 - Oct 20 Oct 10 - Oct 20 Jul 25 - Sep 1 Jul 17 - Aug 15
Sep 8 Dec 5 Sep 30 Sep 20 Oct 15 Sep 1 Nov 15 Oct 30 Sep 3 Aug 23
(NA) Not available.

46 Field Crops Usual Planting and Harvesting Dates (October 2010) USDA, National Agricultural Statistics Service
Usual Planting and Harvesting Dates by Crop – Pennsylvania
State 2009
Harvested acres
Usual planting dates Usual harvesting dates
Begin Most active End Begin Most active End
(1,000 acres)
Barley, fall ...................................... Corn for grain ................................. Corn for silage ............................... Hay, alfalfa ..................................... Hay, other ...................................... Oats, spring ................................... Potatoes, fall .................................. Soybeans ....................................... Tobacco, Class 3A 1 ....................... Tobacco, Class 4 2 ......................... Wheat, winter .................................
45 920 420 500
1,050 80 9.5
445 6.2 2.0
175
Aug 25 Apr 30 Apr 30 (NA) (NA) Apr 15 Apr 10 May 10 May 25 May 25 Aug 30
Sep 15 - Oct 15 May 10 - May 25 May 10- May 25 (NA) (NA) Apr 15 - May 10 Apr 30 - May 25 May 20 - Jun 10 May 30 - Jun 15 May 30 - Jun 15 Sep 15 - Oct 15
Oct 25 Jun 15 Jun 30 (NA) (NA) May 25 Jun 10 Jul 5 Jun 25 Jun 25 Oct 30
Jun 20 Sep 25 Aug 30 May 15 May 30 Jul 20 Aug 10 Oct 5 Aug 10 Aug 10 Jul 5
Jun 25 - Jul 20 Oct 15 - Nov 20 Sep 10 - Oct 10 (NA) (NA) Jul 25 - Aug 20 Aug 25 - Oct 10 Oct 20 - Nov 10 Aug 20 - Sep 10 Aug 20 - Sep 10 Jul 10 - Jul 30
Aug 10 Dec 10 Nov 5 Nov 15 Sep 25 Aug 30 Oct 30 Nov 30 Sep 25 Sep 25 Aug 10
(NA) Not available. 1 Includes light air-cured types 31-32. 2 Includes cigar filler type 41.
Usual Planting and Harvesting Dates by Crop – South Carolina
State 2009
Harvested acres
Usual planting dates Usual harvesting dates
Begin Most active End Begin Most active End
(1,000 acres)
Corn for grain ................................. Cotton, all ...................................... Hay, other ...................................... Oats, fall ........................................ Peanuts ......................................... Soybeans ....................................... Tobacco, Class 1 1 ......................... Wheat, winter .................................
320 114.0 350 15 48
565 18.5
150
Mar 10 Apr 24 (NA) Sep 23 Apr 20 May 10 Apr 2 Sep 25
Mar 20 - Apr 20 May 1 - May 20 (NA) Oct 15 - Nov 20 Apr 25 - May 15 May 27 - Jun 27 Apr 9 - Apr 30 Nov 11 - Dec 15
May 15 Jun 1 (NA) Dec 15 Jun 5 Jul 11 May 10 Dec 31
Jul 25 Sep 23 May 15 May 25 Sep 8 Oct 20 Jun 30 May 26
Aug 20 - Sep 25 Oct 15 - Nov 13 (NA) Jun 3 - Jun 20 Oct 2 - Nov 1 Nov 10 - Dec 10 Jul 18 - Aug 26 Jun 6 - Jun 25
Oct 10 Dec 5 Nov 13 Jul 3 Nov 10 Dec 30 Sep 20 Jul 1
(NA) Not available. 1 Includes flue-cured types 11-14.
Usual Planting and Harvesting Dates by Crop – South Dakota
State 2009
Harvested acres
Usual planting dates Usual harvesting dates
Begin Most active End Begin Most active End
(1,000 acres)
Barley, spring ................................. Corn for grain ................................. Corn for silage ............................... Hay, alfalfa ..................................... Hay, other ...................................... Oats, spring ................................... Sorghum for grain .......................... Sorghum for silage ......................... Soybeans ....................................... Sunflower, all ................................. Wheat, Durum ................................ Wheat, spring ................................. Wheat, winter .................................
22 4,680
250 2,500 1,300
90 120 15
4,190 558
9
1,470 1,530
Apr 6 Apr 26 Apr 26 (NA) (NA) Apr 3 May 11 May 11 May 8 May 16 Mar 31 Mar 31 Sep 1
Apr 14 - May 17 May 2 - May 27 May 2 - May 27 (NA) (NA) Apr 10 - May 15 May 20 - Jun 20 May 20 - Jun 20 May 15 - Jun 11 May 24 - Jun 21 Apr 8 - May 12 Apr 8 - May 12 Sep 9 - Oct 5
May 24 Jun 10 Jun 10 (NA) (NA) May 23 Jun 30 Jun 30 Jun 21 Jun 29 May 21 May 21 Oct 16
Jul 20 Sep 24 Aug 24 May 29 Jun 11 Jul 14 Sep 21 Aug 20 Sep 22 Sep 25 Jul 20 Jul 20 Jul 8
Jul 27 - Aug 19 Oct 6 - Nov 16 Sep 3 - Oct 5 Jun 5 - Sep 12 Jun 20 - Aug 14 Jul 21 - Aug 15 Oct 1 - Nov 6 Sep 2 - Oct 11 Sep 28 - Oct 24 Oct 3 - Nov 10 Jul 27 - Aug 20 Jul 27 - Aug 20 Jul 14 - Aug 5
Aug 27 Dec 3 Oct 14 Sep 20 Aug 24 Aug 23 Nov 17 Oct 21 Nov 3 Nov 21 Aug 29 Aug 29 Aug 13
(NA) Not available.

Field Crops Usual Planting and Harvesting Dates (October 2010) 47 USDA, National Agricultural Statistics Service
Usual Planting and Harvesting Dates by Crop – Tennessee
State 2009
Harvested acres
Usual planting dates Usual harvesting dates
Begin Most active End Begin Most active End
(1,000 acres)
Corn for grain .................................. Corn for silage ................................ Cotton, all ....................................... Hay, alfalfa ..................................... Hay, other ....................................... Soybeans ....................................... Tobacco, Class 2 1 .......................... Tobacco, Class 3A 2 ....................... Tobacco, Class 3B 3 ....................... Wheat, winter ..................................
590 50
280.0 15
1,900 1,530
6.4 14.0 1.2
340
Apr 1 Apr 10 Apr 25 (NA) (NA) May 5 May 5 May 5 May 5 Sep 25
Apr 5 - May 10 Apr 15 - May 15 May 1 - May 25 (NA) (NA) May 15 - Jun 25 May 15 - Jun 15 May 15 - Jun 15 May 15 - Jun 15 Oct 10 - Nov 20
May 25 May 30 Jun 5 (NA) (NA) Jul 5 Jun 25 Jun 25 Jun 25 Nov 30
Aug 25 Aug 1 Sep 20 May 1 May 1 Sep 25 Aug 5 Aug 5 Aug 5 Jun 5
Sep 1 - Oct 10 Aug 10 - Sep 20 Sep 30 - Nov 10 (NA) (NA) Oct 5 - Nov 20 Aug 15 - Sep 25 Aug 15 - Sep 25 Aug 15 - Sep 20 Jun 10 - Jun 30
Oct 30 Oct 1 Nov 25 Oct 1 Oct 1 Nov 30 Oct 5 Oct 5 Sep 30 Jul 5
(NA) Not available. 1 Includes fire-cured types 21-23. 2 Includes light air-cured types 31-32. 3 Includes dark air-cured types 35-37.
Usual Planting and Harvesting Dates by Crop – Texas
State 2009
Harvested acres
Usual planting dates Usual harvesting dates
Begin Most active End Begin Most active End
(1,000 acres)
Corn for grain .................................. Corn for silage ................................ Cotton, all ....................................... Hay, alfalfa ..................................... Hay, other ....................................... Oats, fall ......................................... Peanuts .......................................... Rice, all .......................................... Sorghum for grain ........................... Sorghum for silage .......................... Soybeans ....................................... Sugarcane ...................................... Sunflower, all .................................. Wheat, winter ..................................
1,960 140
3,517.8 120
4,500 60
155 170
2,050 100
190 39.7
118.0 2,450
Mar 1 Feb 28 Mar 22 (NA) (NA) Sep 7 May 1 Mar 17 Mar 1 Mar 3 Mar 24 (NA) Apr 5 Sep 4
Mar 8 - May 7 Mar 20 - Apr 29 Apr 8 - Jun 7 (NA) (NA) Sep 20 - Nov 5 May 6 - Jun 5 Mar 23 - Apr 26 Mar 11 - Jun 15 Mar 22 - May 23 Mar 30 - May 30 (NA) May 1 - Jul 4 Sep 12 - Nov 3
May 17 May 15 Jun 20 (NA) (NA) Nov 25 Jun 15 May 10 Jul 5 Jun 28 Jun 12 (NA) Jul 15 Nov 23
Jul 18 Jul 5 Aug 10 Apr 15 May 1 May 13 Sep 25 Jul 29 Jun 25 Jul 1 Aug 18 Oct 10 Aug 20 May 25
Aug 1 - Oct 11 Jul 20 - Sep 5 Sep 13 - Dec 21 (NA) (NA) May 23 - Jun 22 Oct 7 - Nov 16 Aug 7 - Sep 4 Jul 8 - Nov 16 Jul 15 - Oct 1 Aug 22 - Oct 17 Nov 1 - Mar 1 Sep 1 - Nov 21 Jun 1 - Jul 2
Nov 8 Oct 1 Jan 11 Sep 20 Sep 30 Jul 4 Nov 30 Sep 20 Dec 6 Nov 1 Nov 7 Apr 15 Dec 3 Jul 12
(NA) Not available.
Usual Planting and Harvesting Dates by Crop – Utah
State 2009
Harvested acres
Usual planting dates Usual harvesting dates
Begin Most active End Begin Most active End
(1,000 acres)
Barley, spring .................................. Corn for grain .................................. Corn for silage ................................ Hay, alfalfa ..................................... Hay, other ....................................... Oats, spring .................................... Wheat, spring ................................. Wheat, winter ..................................
30 17 47
530 160
5 12
135
Mar 20 Apr 15 May 1 (NA) (NA) Mar 20 Mar 20 Aug 20
Apr 1 - Apr 20 Apr 30 - May 20 May 5 - May 25 (NA) (NA) Apr 10 - May 5 Apr 1 - Apr 20 Aug 25 - Oct 5
May 10 Jun 5 Jun 5 (NA) (NA) Jun 1 May 1 Nov 10
Jul 15 Sep 25 Sep 5 Jun 1 Jul 10 Jul 25 Jul 15 Jul 10
Jul 25 - Aug 15 Oct 10 - Oct 30 Sep 20 - Oct 5 (NA) (NA) Aug 15 - Sep 10 Aug 5 - Aug 25 Jul 25 - Aug 10
Sep 1 Dec 10 Oct 20 Oct 25 Aug 25 Sep 30 Sep 5 Aug 25
(NA) Not available.

48 Field Crops Usual Planting and Harvesting Dates (October 2010) USDA, National Agricultural Statistics Service
Usual Planting and Harvesting Dates by Crop – Virginia
State 2009
Harvested acres
Usual planting dates Usual harvesting dates
Begin Most active End Begin Most active End
(1,000 acres)
Barley, fall ...................................... Corn for grain ................................. Corn for silage ............................... Cotton, all ...................................... Hay, alfalfa ..................................... Hay, other ...................................... Oats, fall ........................................ Peanuts ......................................... Soybeans ....................................... Tobacco, Class 1 1 ......................... Tobacco, Class 2 2 ......................... Tobacco, Class 3A 3 ....................... Wheat, winter .................................
43 330 135 63.0 90
1,090 4
12 570
17.5 0.7 2.0
210
Sep 18 Apr 5 Apr 5 Apr 23 (NA) (NA) Sep 15 Apr 25 May 5 Apr 29 May 7 May 12 Sep 25
Sep 26 - Oct 29 Apr 11 - May 20 Apr 11 - May 20 Apr 25 - May 11 (NA) (NA) Sep 27 - Oct 29 Apr 30 - May 18 May 15 - Jul 3 May 3 - May 20 May 11 - May 29 May 16 - Jun 9 Oct 10 - Nov 21
Nov 8 May 29 May 29 May 16 (NA) (NA) Nov 9 May 25 Jul 9 May 26 Jun 4 Jun 16 Dec 1
May 28 Aug 31 Aug 12 Sep 30 May 1 May 25 May 28 Sep 18 Oct 4 Jul 26 Aug 7 Aug 17 Jun 9
Jun 6 - Jun 25 Sep 6 - Oct 28 Aug 20 - Sep 27 Oct 8 - Nov 20 (NA) (NA) Jun 9 - Jul 3 Sep 25 - Oct 17 Oct 16 - Nov 28 Aug 4 - Sep 29 Aug 12 - Sep 10 Aug 27 - Sep 24 Jun 16 - Jul 5
Jul 1 Nov 9 Oct 5 Nov 27 Oct 20 Oct 1 Jul 20 Oct 24 Dec 4 Oct 8 Sep 20 Sep 30 Jul 12
(NA) Not available. 1 Includes flue-cured types 11-14. 2 Includes fire-cured types 21-23. 3 Includes light air-cured types 31-32.
Usual Planting and Harvesting Dates by Crop – Washington
State 2009
Harvested acres
Usual planting dates Usual harvesting dates
Begin Most active End Begin Most active End
(1,000 acres)
Barley, spring ................................. Beans, dry edible ........................... Corn for grain ................................. Corn for silage ............................... Hay, alfalfa ..................................... Hay, other ...................................... Oats, spring ................................... Peas, dry edible ............................. Potatoes, fall .................................. Wheat, spring ................................. Wheat, winter .................................
97 60.0
105 65
490 320
6 85.0
145.0 585
1,640
Mar 20 Apr 10 Apr 10 Apr 10 (NA) (NA) Mar 5 Mar 10 Mar 30 Mar 15 Aug 30
Mar 30 - May 5 Apr 20 - May 25 Apr 20 - May 20 Apr 20 - May 20 (NA) (NA) Mar 10 - Apr 10 Apr 10 - May 15 Apr 5 - May 10 Mar 25 - Apr 30 Sep 1 - Oct 10
May 10 Jun 5 Jun 1 Jun 1 (NA) (NA) Apr 20 May 20 May 15 May 10 Oct 20
Jul 25 Aug 10 Sep 25 Aug 15 May 15 May 15 Jul 15 Jul 10 Jul 10 Jul 25 Jul 15
Aug 1 - Aug 30 Aug 20 - Oct 1 Oct 5 - Nov 15 Aug 30 - Oct 15 Jun 1 - Sep 5 Jun 1 - Aug 20 Aug 1 - Aug 30 Jul 20 - Aug 20 Jul 25 - Oct 15 Aug 1 - Aug 30 Jul 25 - Aug 20
Sep 5 Oct 10 Nov 25 Oct 25 Oct 1 Sep 15 Sep 10 Aug 30 Oct 30 Sep 5 Aug 30
(NA) Not available.
Usual Planting and Harvesting Dates by Crop – West Virginia
State 2009
Harvested acres
Usual planting dates Usual harvesting dates
Begin Most active End Begin Most active End
(1,000 acres)
Corn for grain ................................. Corn for silage ............................... Hay, alfalfa ..................................... Hay, other ...................................... Soybeans ....................................... Wheat, winter .................................
30 16 25
600 19 5
Apr 20 Apr 20 (NA) (NA) May 5 Sep 5
May 1 - Jun 5 May 1 - Jun 5 (NA) (NA) May 10 - Jun 30 Sep 15 - Nov 5
Jun 20 Jun 20 (NA) (NA) Jul 5 Nov 10
Sep 15 Aug 25 May 20 May 20 Sep 25 Jun 10
Sep 30 - Nov 20 Sep 1 - Sep 20 (NA) (NA) Oct 5 - Nov 30 Jun 25 - Jul 25
Dec 1 Sep 30 Oct 1 Nov 10 Dec 1 Aug 5
(NA) Not available.
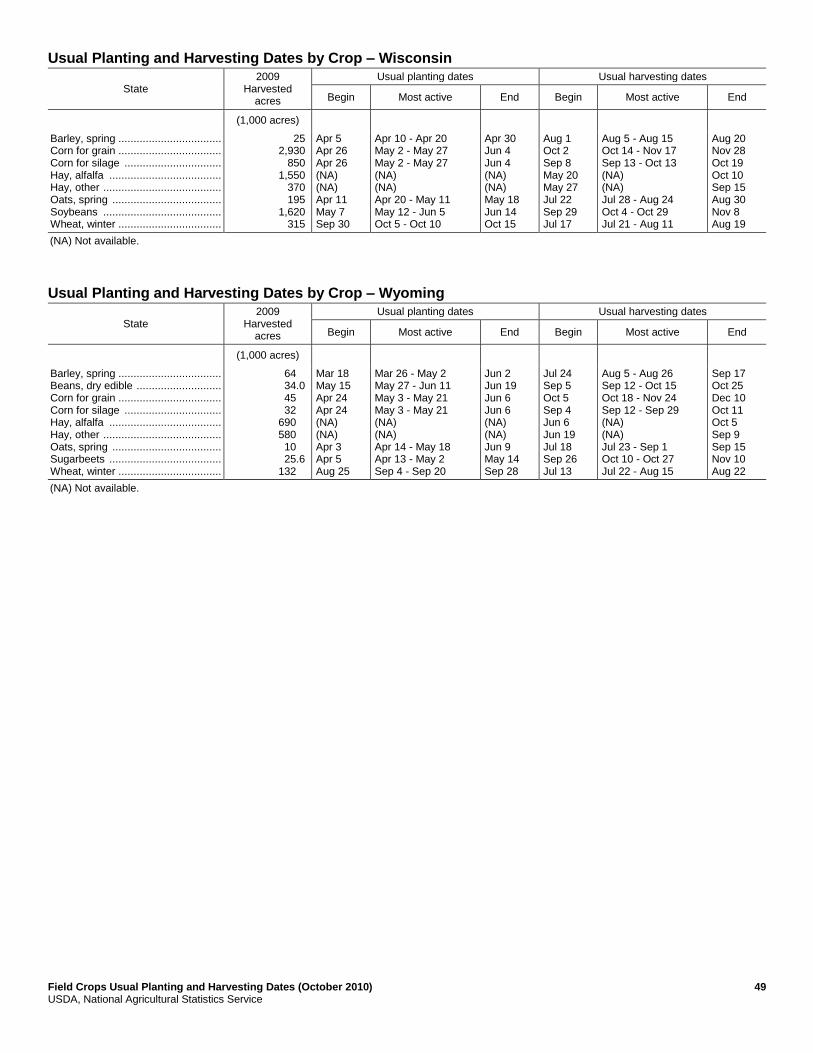
Field Crops Usual Planting and Harvesting Dates (October 2010) 49 USDA, National Agricultural Statistics Service
Usual Planting and Harvesting Dates by Crop – Wisconsin
State 2009
Harvested acres
Usual planting dates Usual harvesting dates
Begin Most active End Begin Most active End
(1,000 acres)
Barley, spring .................................. Corn for grain .................................. Corn for silage ................................ Hay, alfalfa ..................................... Hay, other ....................................... Oats, spring .................................... Soybeans ....................................... Wheat, winter ..................................
25 2,930
850 1,550
370 195
1,620 315
Apr 5 Apr 26 Apr 26 (NA) (NA) Apr 11 May 7 Sep 30
Apr 10 - Apr 20 May 2 - May 27 May 2 - May 27 (NA) (NA) Apr 20 - May 11 May 12 - Jun 5 Oct 5 - Oct 10
Apr 30 Jun 4 Jun 4 (NA) (NA) May 18 Jun 14 Oct 15
Aug 1 Oct 2 Sep 8 May 20 May 27 Jul 22 Sep 29 Jul 17
Aug 5 - Aug 15 Oct 14 - Nov 17 Sep 13 - Oct 13 (NA) (NA) Jul 28 - Aug 24 Oct 4 - Oct 29 Jul 21 - Aug 11
Aug 20 Nov 28 Oct 19 Oct 10 Sep 15 Aug 30 Nov 8 Aug 19
(NA) Not available.
Usual Planting and Harvesting Dates by Crop – Wyoming
State 2009
Harvested acres
Usual planting dates Usual harvesting dates
Begin Most active End Begin Most active End
(1,000 acres)
Barley, spring .................................. Beans, dry edible ............................ Corn for grain .................................. Corn for silage ................................ Hay, alfalfa ..................................... Hay, other ....................................... Oats, spring .................................... Sugarbeets ..................................... Wheat, winter ..................................
64 34.0 45 32
690 580 10 25.6
132
Mar 18 May 15 Apr 24 Apr 24 (NA) (NA) Apr 3 Apr 5 Aug 25
Mar 26 - May 2 May 27 - Jun 11 May 3 - May 21 May 3 - May 21 (NA) (NA) Apr 14 - May 18 Apr 13 - May 2 Sep 4 - Sep 20
Jun 2 Jun 19 Jun 6 Jun 6 (NA) (NA) Jun 9 May 14 Sep 28
Jul 24 Sep 5 Oct 5 Sep 4 Jun 6 Jun 19 Jul 18 Sep 26 Jul 13
Aug 5 - Aug 26 Sep 12 - Oct 15 Oct 18 - Nov 24 Sep 12 - Sep 29 (NA) (NA) Jul 23 - Sep 1 Oct 10 - Oct 27 Jul 22 - Aug 15
Sep 17 Oct 25 Dec 10 Oct 11 Oct 5 Sep 9 Sep 15 Nov 10 Aug 22
(NA) Not available.

50 Field Crops Usual Planting and Harvesting Dates (October 2010) USDA, National Agricultural Statistics Service
Information Contacts
Listed below are the commodity statisticians in the Crops Branch of the National Agricultural Statistics Service to contact
for additional information. E-mail inquiries may be sent to [email protected]
Lance Honig, Chief, Crops Branch ....................................................................................................... (202) 720-2127
Jacqueline Moore, Head, Field Crops Section ...................................................................................... (202) 720-2127
Suzanne Avilla – Peanuts, Rice ........................................................................................................ (202) 720-7688
Bryan Durham – Hay, Oats .............................................................................................................. (202) 690-3234
Steve Maliszewski – Cotton, Cotton Ginnings, Sorghum ................................................................ (202) 720-5944
Anthony Prillaman – Corn, Proso Millet, Flaxseed ......................................................................... (202) 720-9526
Nick Schauer – Wheat, Rye ............................................................................................................. (202) 720-8068
Julie Schmidt – Crop Weather, Barley, Sugar Crops ....................................................................... (202) 720-7621
Travis Thorson – Soybeans, Sunflower, Other Oilseeds .................................................................. (202) 720-7369
Jorge Garcia-Pratts, Head, Fruits, Vegetables and Special Crops Section ............................................ (202) 720-2127
Debbie Flippin – Fresh and Processing Vegetables, Onions, Strawberries...................................... (202) 720-2157
Fred Granja – Apples, Apricots, Cherries, Plums, Prunes, Tobacco ............................................... (202) 720-4288
Dawn Keen – Floriculture, Maple Syrup, Nursery, Tree Nuts ........................................................ (202) 720-4215
Steve Maliszewski – Citrus, Coffee, Grapes, Tropical Fruits .......................................................... (202) 720-5412
Tierra Mobley – Berries, Cranberries, Potatoes, Sweet Potatoes .................................................... (202) 720-4285
Dan Norris – Austrian Winter Peas, Dry Edible Peas, Lentils, Mints,
Mushrooms, Peaches, Pears, Wrinkled Seed Peas, Dry Beans .................................................. (202) 720-3250
Kim Ritchie – Hops .......................................................................................................................... (360) 709-2400

Access to NASS Reports For your convenience, you may access NASS reports and products the following ways:
All reports are available electronically, at no cost, on the NASS web site: http://www.nass.usda.gov
Both national and state specific reports are available via a free e-mail subscription. To set-up this free
subscription, visit http://www.nass.usda.gov and in the “Receive NASS Updates” box under “Receive reports by
Email,” click on “National” or “State” to select the reports you would like to receive.
Printed reports may be purchased from the National Technical Information Service (NTIS) by calling toll-free
(800) 999-6779, or (703) 605-6220 if calling from outside the United States or Canada. Accepted methods of
payment are Visa, MasterCard, check, or money order.
For more information on NASS surveys and reports, call the NASS Agricultural Statistics Hotline at (800) 727-9540,
7:30 a.m. to 4:00 p.m. ET, or e-mail: [email protected].
The United States Department of Agriculture (USDA) prohibits discrimination in all its programs and activities on the
basis of race, color, national origin, age, disability, and where applicable, sex, marital status, familial status, parental
status, religion, sexual orientation, political beliefs, genetic information, reprisal, or because all or a part of an individual's
income is derived from any public assistance program. (Not all prohibited bases apply to all programs.) Persons with
disabilities who require alternative means for communication of program information (Braille, large print, audiotape, etc.)
should contact USDA's TARGET Center at (202) 720-2600 (voice and TDD).
To file a complaint of discrimination, write to USDA, Assistant Secretary for Civil Rights, Office of the Assistant
Secretary for Civil Rights, 1400 Independence Avenue, S.W., Stop 9410, Washington, DC 20250-9410, or call toll-free at
(866) 632-9992 (English) or (800) 877-8339 (TDD) or (866) 377-8642 (English Federal-relay) or (800) 845-6136
(Spanish Federal-relay). USDA is an equal opportunity provider and employer.