field-induced texturing of ceramic materials for ... · field-induced texturing of ceramic...
TRANSCRIPT
ARL-TR-7985 ● MAR 2017
US Army Research Laboratory
Field-Induced Texturing of Ceramic Materials for Unparalleled Properties
by Raymond Brennan, Victoria Blair, Nicholas Ku, Krista Limmer, Tanya Chantawansri, Mahesh Neupane, Berend Rinderspacher, Jennifer Elward, Constantine Fountzoulas, Michael Kornecki, Selva Vennila Raju, Carli Moorehead, Erik Nykwest, Joseph Marsico, Dinesh Agrawal, Gerard Ludtka, Orlando Rios, and Shenqiang Ren Approved for public release; distribution is unlimited.

NOTICES
Disclaimers The findings in this report are not to be construed as an official Department of the Army position unless so designated by other authorized documents. Citation of manufacturer’s or trade names does not constitute an official endorsement or approval of the use thereof. Destroy this report when it is no longer needed. Do not return it to the originator.

ARL-TR-7985 ● MAR 2017
US Army Research Laboratory
Field-Induced Texturing of Ceramic Materials for Unparalleled Properties
by Raymond Brennan, Victoria Blair, Nicholas Ku, Krista Limmer, Tanya Chantawansri, Mahesh Neupane, Berend Rinderspacher, Jennifer Elward, Constantine Fountzoulas, Michael Kornecki, and Selva Vennila Raju Weapons and Materials Research Directorate, ARL
Carli Moorehead Drexel University, Philadelphia, PA
Erik Nykwest University of Connecticut, Storrs, CT
Joseph Marsico Rochester Institute of Technology, Rochester, NY
Dinesh Agrawal Pennsylvania State University, University Park, PA
Gerard Ludtka and Orlando Rios Oak Ridge National Laboratory, Oak Ridge, TN
Shenqiang Ren Temple University, Philadelphia, PA Approved for public release; distribution is unlimited.
ii
REPORT DOCUMENTATION PAGE Form Approved OMB No. 0704-0188
Public reporting burden for this collection of information is estimated to average 1 hour per response, including the time for reviewing instructions, searching existing data sources, gathering and maintaining the data needed, and completing and reviewing the collection information. Send comments regarding this burden estimate or any other aspect of this collection of information, including suggestions for reducing the burden, to Department of Defense, Washington Headquarters Services, Directorate for Information Operations and Reports (0704-0188), 1215 Jefferson Davis Highway, Suite 1204, Arlington, VA 22202-4302. Respondents should be aware that notwithstanding any other provision of law, no person shall be subject to any penalty for failing to comply with a collection of information if it does not display a currently valid OMB control number. PLEASE DO NOT RETURN YOUR FORM TO THE ABOVE ADDRESS.
1. REPORT DATE (DD-MM-YYYY)
March 2017 2. REPORT TYPE
Director’s Strategic Initiative (DSI) 3. DATES COVERED (From - To)
October 2014–September 2016 4. TITLE AND SUBTITLE
Field-Induced Texturing of Ceramic Materials for Unparalleled Properties 5a. CONTRACT NUMBER
5b. GRANT NUMBER
5c. PROGRAM ELEMENT NUMBER
6. AUTHOR(S)
Raymond Brennan, Victoria Blair, Nicholas Ku, Krista Limmer, Tanya Chantawansri, Mahesh Neupane, Berend Rinderspacher, Jennifer Elward, Constantine Fountzoulas, Michael Kornecki, Selva Vennila Raju, Carli Moorehead, Erik Nykwest, Joseph Marsico, Dinesh Agrawal, Gerard Ludtka, Orlando Rios, and Shenqiang Ren
5d. PROJECT NUMBER
5e. TASK NUMBER
5f. WORK UNIT NUMBER
7. PERFORMING ORGANIZATION NAME(S) AND ADDRESS(ES)
US Army Research Laboratory ATTN: RDRL-WMM-D Aberdeen Proving Ground, MD 21005-5069
8. PERFORMING ORGANIZATION REPORT NUMBER
ARL-TR-7985
9. SPONSORING/MONITORING AGENCY NAME(S) AND ADDRESS(ES)
10. SPONSOR/MONITOR'S ACRONYM(S)
11. SPONSOR/MONITOR'S REPORT NUMBER(S)
12. DISTRIBUTION/AVAILABILITY STATEMENT
Approved for public release; distribution is unlimited.
13. SUPPLEMENTARY NOTES
14. ABSTRACT
The objective of this research was to characterize and exploit effects of energetic fields (microwave, magnetic, etc.) on microstructural development of materials to formulate a physical explanation of the fundamental mechanisms dictating material interactions during processing. This strategy was used to develop processing methods and computational modeling capabilities for synthesizing transparent noncubic alumina (Al2O3) through magnetic alignment of particles during forming and heat treatment, microwave-enhanced densification, and high-energy field microstructure and crystalline phase transformation control. The influence of dopant addition on phase formation, grain alignment, and enhancement of material response to applied fields was also assessed. These interactions were explored by utilizing external fields to initiate simultaneous grain size reduction and crystallographic texturing enhancement.
15. SUBJECT TERMS
Director’s Strategic Initiative (DSI), alumina, rare-earth dopants, magnetic field, microwave field
16. SECURITY CLASSIFICATION OF: 17. LIMITATION OF ABSTRACT
UU
18. NUMBER OF PAGES
86
19a. NAME OF RESPONSIBLE PERSON
Raymond Brennan a. REPORT
Unclassified b. ABSTRACT
Unclassified c. THIS PAGE
Unclassified 19b. TELEPHONE NUMBER (Include area code)
(410) 306-0913 Standard Form 298 (Rev. 8/98) Prescribed by ANSI Std. Z39.18
Approved for public release; distribution is unlimited.
iii
Contents
List of Figures v
List of Tables viii
Acknowledgments ix
1. Introduction and Background 1
1.1 Materials Synthesis and Processing 1
1.2 Field-Enhanced Processing and Crystallographic Texturing 3
2. Synthesis and Processing of Er-Doped Alumina 5
2.1 Powder Synthesis 5
2.2 Initial Powder Characterization 7
2.3 Powder Morphology 10
2.4 Undoped Alumina vs. Er-Doped Alumina 12
2.5 Lanthanide-Doped Alumina Series Preparation 15
3. Advanced Characterization of Dopants Effects on Alumina 16
4. Density Functional Theory Modeling and Simulation 23
5. Microwave Sintering of Rare-Earth-Doped Alumina 27
6. Magnetic Field Processing of Rare-Earth-Doped Alumina 34
6.1 DFT Modeling of Magnetic-Field Effects 34
6.2 High-Temperature DSC Characterization under Applied Magnetic Field 43
6.3 Magnetic Field Texturing of Epoxy Samples 45
6.4 Magnetic Field Texturing of Gel Cast Samples 55
7. Conclusions 59
8. Transitions 62
Approved for public release; distribution is unlimited.
iv
9. References 64
10. Bibliography 69
List of Symbols, Abbreviations, and Acronyms 72
Distribution List 74
Approved for public release; distribution is unlimited.
v
List of Figures
Fig. 1 Estimated transitions of Al2O3 from crystallized aluminum hydroxide 2
Fig. 2 Schematic of the magnetic alignment mechanism .................................5
Fig. 3 Schematic of principle described by Eq. 1 .............................................5
Fig. 4 Schematic representation of rare-earth-doped alumina sample preparation .............................................................................................7
Fig. 5 Heating schedule used for the dried precipitate AACH samples in HT-XRD .......................................................................................................8
Fig. 6 DSC data showing the heat flow vs. temperature where exothermic reactions are down and endothermic reactions are up ...........................9
Fig. 7 Flow chart of the precipitated powder phase development .................10
Fig. 8 TEM image of the precipitate calcined at 230 °C to obtain boehmite, AlO(OH) ..............................................................................................10
Fig. 9 TEM image of the precipitate calcined at 1050 °C to obtain θ-Al2O3 .11
Fig. 10 TEM image of powder calcined at 1350 °C to obtain α-Al2O3 ...........11
Fig. 11 SEM image of the powder calcined at 1350 °C to obtain α-Al2O3 .....12
Fig. 12 High-temperature DSC data comparing Er-doped Al2O3 to undoped Al2O3 (heating rate 3 °C/min) ..............................................................13
Fig. 13 HT-XRD of undoped AACH. The figure identifies where specific transformations occur as well as the specific space groups of each phase. ...................................................................................................14
Fig. 14 HT-XRD of Er-doped AACH. The figure identifies where specific transformations occur as well as the specific space groups of each phase. ...................................................................................................15
Fig. 15 SEM images of Ln-doped alumina. The scale bar is 1 µ. ....................15
Fig. 16 a) Overlay of 1-D 27Al MAS NMR spectra for Al2O3, Er-doped Al2O3, undoped α-Al2O3 phase and undoped θ-Al2O3 phase. The MAS rate was equal to 10 kHz. b) 2-D 27Al MQ-MAS spectra of undoped Al2O3; c) 2-D 27Al MQ-MAS spectra of Er-doped Al2O3. ..............................17
Fig. 17 a) High-temperature DSC curves of Al2O3 (purple) and Er-Al2O3 (red); b) SEM image of Er-doped Al2O3 .......................................................19
Fig. 18 2-D MQ-MAS spectra of Ln-doped Al2O3 ..........................................20
Approved for public release; distribution is unlimited.
vi
Fig. 19 a) Low-angle HR-XRD data of the Ln-doped alumina. From top to bottom: Ln = Pr, Er, La, Gd, Yb, Nd, Tm, Lu, Dy, respectively. The data were sequentially offset by a factor of 10 for clarity. The peaks denoted “*” represented the α-phase and the peaks denoted “o” symbols represented the θ-phase. b) Graphical representation of the α- and θ-phase populations at ~1300 °C. The Dy- and Lu-doped alumina exhibited only α-phase. c) Graphical representation of Ln-cationic phase fraction, octahedral coordination radius and phase diameters. The data points represented Ln-series elements in decreasing order of atomic number, moving from left to right (Lu, Yb, Tm, Er, Dy, Gd, Nd, Pr, and La). The diameter was represented by the orange data points and the phase fraction was represented by the blue data points. A refinement summary of all Ln3+ doped alumina was included. d) SEM images of Dy- and Tm-doped alumina. ......................................22
Fig. 20 Schematic representation of Al2O3 unit cells a) α-Al2O3 and b) θ-Al2O3 with atomic coloring of the smaller Al (blue) and larger O (red) ........23
Fig. 21 Changes in local structural properties: a) Ln-O bond length (solid) and change in substitutional site volume (dashed), and b) quadratic elongation (solid) and bond angle standard deviation (dashed), as a function of dopant ionic radius (octahedral, 3+) for Ln-doped α- and θ-Al2O3 at different lattice sites. The error bars (A) represent the range of Ln-O bond distances. .......................................................................25
Fig. 22 DFT calculated a) cohesive energy (Ecoh) and b) defect formation energy (Edefect) for Ln-doped α- and θ-Al2O3 with composition Al47LnO72 .............................................................................................26
Fig. 23 XRD patterns for calcined Er-doped Al2O3 powder and microwave sintered sample SM-30:70. The inset shows the (420) peak of the Er3Al5O12 phase and the (104) peak of the Al2O3 phase, which were used to determine the peak-height ratios given in Table 2. .................30
Fig. 24 Ratio of magnetic to electric field strength vs. density of all microwave-sintered Er-doped Al2O3 (dashed line represents density of conventionally sintered Er-doped Al2O3) ............................................31
Fig. 25 Ratio of magnetic to electric field vs. equivalent vol% of ErAG of all microwave sintered Er-doped Al2O3 (dashed line represents equivalent wt% of conventionally sintered Er-doped Al2O3) ................................32
Fig. 26 SEM images of sample MM using secondary electrons. A high degree of porosity can be seen in the region which was ion-polished. ...........33
Fig. 27 a) SEM images of sample SM-30:70 using secondary electrons, and b) back-scattered electrons. Regions of differing Z-contrast are very clear in b. ......................................................................................................33
Approved for public release; distribution is unlimited.
vii
Fig. 28 DFT-calculated magnetic moment of Ln-doped Al2O3. a) Magnetic moment of Ln-dopant as a single atom in vacuum, the full α-Al2O3:Ln supercell, and localized on the Ln-dopant within the α-Al2O3:Ln supercell. b) 1/4 supercell of α-Al2O3:Gd, and c) 1/4 supercell of θ-Al2O3:Yb with arrows indicating the localization and magnitude of the magnetic moment for each atom, with atoms colored as O (red), Al (blue), Gd (green), and Yb (yellow). ..............................................36
Fig. 29 Collinear vs. noncollinear spin-orbit coupled cohesive energy for α-phase RE-doped and undoped alumina ................................................38
Fig. 30 Collinear vs. noncollinear spin-orbit coupled cohesive energy for θ-phase (octahedral site) RE-doped alumina .......................................39
Fig. 31 Collinear vs. noncollinear spin-orbit coupled cohesive energy for θ-phase (tetrahedral site) RE-doped and undoped alumina .................39
Fig. 32 Change in total energy as a result of the addition of spin-orbit coupling. Energy change is given in eV and shown for each RE-dopant and material phase................................................................................40
Fig. 33 MAE interpolated surface plots for Pr-doped Al2O3 ...........................40
Fig. 34 MAE interpolated surface plots for Er-doped Al2O3 ...........................41
Fig. 35 MAE interpolated surface plots for Gd-doped Al2O3 ..........................41
Fig. 36 The magnetic susceptibility of α-phase and θ-phase (octahedral, tetrahedral) RE-doped alumina ...........................................................43
Fig. 37 DSC data comparison between ARL DSC data and ORNL DSC data, both data sets measured at a heating rate of 10 °C/min .......................44
Fig. 38 DSC data collected at ORNL at both 0 T and 9 T magnetic field, both data sets measured at a heating rate of 10 °C/min ...............................45
Fig. 39 Aligning epoxy and slurry casts within a 1.8 T magnetic field ...........47
Fig. 40 Cutting and mounting pattern of epoxy pucks cured in magnetic field ......................................................................................................47
Fig. 41 Idealized rhombohedral unit cell illustrating the (006) and (110) crystal planes ........................................................................................48
Fig. 42 a) LF as a function of field strength and dopant type with respect to the (006), LF(006) and b) LF as a function of field strength and dopant type with respect to the (110), LF(110) ..........................................................49
Fig. 43 XRD example spectra of Yb:Al2O3 samples with increasing magnetic field strength ........................................................................................50
Fig. 44 Percentage alignment values for each dopant type ..............................54
Fig. 45 Percent alignment values for each powder type of green gel-cast specimens .............................................................................................57
Fig. 46 XRD spectra of the unaligned green body, aligned green body, and sintered aligned body. As can be seen, the (006) peak at ~41.5 °2Θ increases with alignment. .....................................................................58
Approved for public release; distribution is unlimited.
viii
Fig. 47 SEM image of a polished cross section from a sintered, aligned gel-cast part ................................................................................................58
List of Tables
Table 1 Compositions synthesized for this study................................................6
Table 2 List of sintering conditions, density and phase quantification for all samples .................................................................................................29
Table 3 Cohesive energy (eV) of rare-earth-doped alumina with z-axis oriented spins from collinear and noncollinear spin orbit coupled calculations 37
Table 4 Energetic contribution (eV) of the rare-earth dopant spin-orbit coupling for z-axis oriented spins from nonself-consistent calculations ..........................................................................................38
Table 5 DFT calculated easy magnetic axis and maximal MAE (meV) indicating degree of magnetic anisotropy in the Ln-doped supercell for Ln-dopants in the Al-octahedral site of α- and θ-Al2O3 ......................41
Table 6 LFs calculated from (006) and (110) planes for magnetically aligned ceramic composite samples ..................................................................49
Table 7 Quantification of alumina polymorphs in the materials examined, determined by Rietveld refinement of synchrotron X-ray diffraction .52
Table 8 Average percentage alignment values ± standard deviation for phase-pure α-alumina epoxy samples. Third column also lists the percentage alignment values recalculated using the average facial angle method from the previous mixed-phase alumina epoxy alignment samples for comparison. ..........................................................................................53
Table 9 Alignment directions identified previously through DFT and their corresponding XRD alignment peak based on a dot product equal to zero. Some directions had no measurable XRD peaks. .......................55
Table 10 Average percentage alignment values ± standard deviation for phase-pure α-alumina gel casting samples .....................................................56

Approved for public release; distribution is unlimited.
ix
Acknowledgments
Carli Moorehead (Drexel University, Philadelphia, Pennsylvania) and Joseph Marsico (Rochester Institute of Technology, Rochester, New York) were funded through a contract with the College Qualified Leaders program.

Approved for public release; distribution is unlimited.
x
INTENTIONALLY LEFT BLANK.
Approved for public release; distribution is unlimited.
1
1. Introduction and Background
The objective of this research was to characterize and exploit effects of energetic fields (microwave, magnetic, etc.) on microstructural development of materials to formulate a physical explanation of the fundamental mechanisms dictating material interactions during processing. This strategy was used to develop processing methods and computational modeling capabilities for synthesizing transparent noncubic alumina (Al2O3) through magnetic alignment of particles during forming and heat treatment, microwave-enhanced densification, and high-energy field microstructure and crystalline phase transformation control. The influence of dopant addition on phase formation, grain alignment, and enhancement of material response to applied fields was also assessed. These interactions were explored by utilizing external fields to initiate simultaneous grain size reduction and crystallographic texturing enhancement.
1.1 Materials Synthesis and Processing
Transparent ceramic materials have made an impact on a wide range of applications, including optically transparent armor, windows, and sensors.1–4 Current research has focused on transparent polycrystalline materials for high-energy lasers (HELs), as ceramics typically have higher strengths than single crystals, glasses, and polymers.5 Additionally, processing polycrystalline ceramics can provide cost savings when compared to growing large single crystals, and fosters a more homogenous chemical composition across the part. One of the major challenges for HELs is the difficulty of removing waste heat from laser gain media during lasing. Current polycrystalline ceramics such as neodymium-doped yttrium aluminum garnet (Nd:YAG) have a significantly lower thermal conductivity, and result in low-thermal efficiency during operation, thus limiting the total power from the laser. However, replacement materials with high-thermal conductivity properties can enable more rapid dissipation of heat from the laser source. Transparent polycrystalline Al2O3 could potentially replace Nd:YAG due to its improved strength and thermal conductivity properties. However, major challenges exist, as the material must be doped with a critical lasing ion (i.e., rare-earth cation) and exhibit transparency.
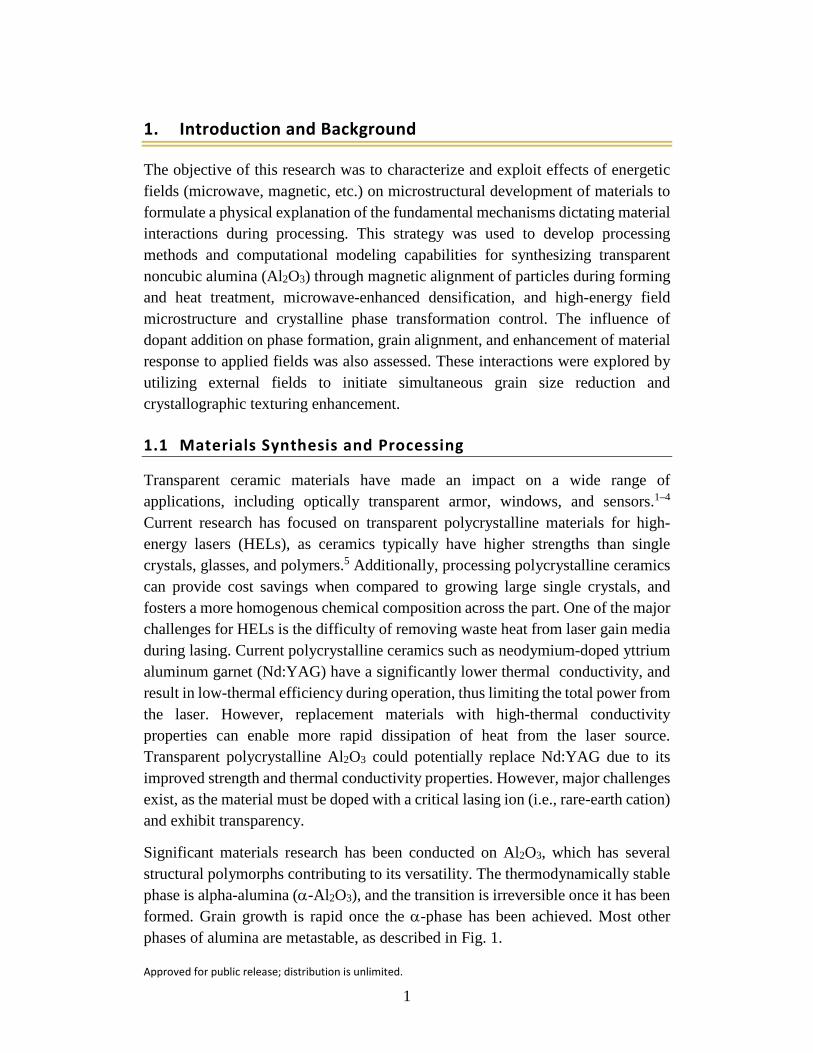
Significant materials research has been conducted on Al2O3, which has several structural polymorphs contributing to its versatility. The thermodynamically stable phase is alpha-alumina (α-Al2O3), and the transition is irreversible once it has been formed. Grain growth is rapid once the α-phase has been achieved. Most other phases of alumina are metastable, as described in Fig. 1.
Approved for public release; distribution is unlimited.
2
Fig. 1 Estimated transitions of Al2O3 from crystallized aluminum hydroxide
During chemical synthesis of alumina, for example, the phases develop at different temperatures as a function of the synthesis and processing techniques used.6,7 It is possible to seed α-Al2O3 with a polymorph transition alumina (i.e., theta or gamma), which can lead to changes in the densification process.6,8 Using a dual-phase alumina mixture that includes a majority of theta polymorph and an addition of alpha polymorph seeds allows for full densification of the sample while keeping the grain size small. Since alumina grains grow quickly once the material reaches the alpha polymorph, the sample is almost completely dense by the time the material is purely alpha phase.
Materials research on alumina has examined transition behavior and phase stability extensively. For example, transition metal and lanthanide cations have been doped into alumina, resulting in stability of metastable phases.9–13 However, addition of rare-earth dopants in bulk alumina continues to be a challenge, as most of the work has focused on thin films.14 The rare-earth dopant is more difficult to incorporate into the crystal structure due to the cation size mismatch with aluminum, but can be aided by working with thin films and nanoparticles via wet chemical synthesis methods. A study by Thompson et al. showed that the rare-earth cation typically segregates to the grain boundaries.15 Clustering of rare-earth cations reduces the efficiency and power of a laser.14,16 Penilla et al. demonstrated successful terbium doping of transparent alumina through field-assisted sintering of mixed materials. However, their spectroscopic data showed broadening of the emission lines, which could lead to a decrease in overall efficiency. Novel research in synthesis and processing of alumina by Sanamyan et al. led to production of transparent Erbium (Er)-doped Al2O3 using a nanoprecipitation technique combined with spark plasma sintering.16 The subsequent spectroscopic results indicated that the Er3+ dopant was trapped in the lattice, giving rise to single-site activation with a concentration of
Approved for public release; distribution is unlimited.
3
0.1–0.3 atom percent. Recent work published by the US Army Research Laboratory (ARL), which will be detailed in this report, revealed the presence of localized structural distortions in alumina that drastically affect the phase development of rare-earth-doped alumina. 17
1.2 Field-Enhanced Processing and Crystallographic Texturing
High-energy magnetic, electric, acoustic, and other fields applied during processing have been shown to influence grain and interphase boundary-related phenomena such as texturing, nucleation, grain growth, phase transformation, grain boundary migration, segregation, atomic diffusion, and sintering.18 By taking advantage of these effects, microstructures can be manipulated to harness otherwise unattainable physical properties that are beyond the current state-of-the-art. Although electromagnetic (EM) fields are currently being implemented during materials processing, a fundamental understanding of the underlying physics responsible for microstructural modification is lacking. In this effort, the influence of microwave and magnetic fields on the behavior of rare-earth-doped alumina was explored, emphasizing the effects on phase formation and crystallographic texturing.
Texture has been shown to have a profound influence over many properties, such as optical transparency, strength, electrical conductivity, and piezoelectricity.19 Highly textured materials are desired for a variety of DOD-relevant applications including microactuators, nonvolatile memories, tunable microwave devices, and battery membranes, since they often possess significantly improved properties compared to their randomly oriented polycrystalline or single crystal counterparts.
Many techniques have been explored to produce grain alignment, including platelet seeding for anisotropic grain growth, hot pressing, incorporating sintering additives, and magnetic alignment, the last of which has not been well researched.20–32 Magnetic manipulation of liquid metals has been used for some applications, but those techniques are of limited use in ceramics because liquid metals usually have an inherently strong magnetic susceptibility while ceramics do not.24,31,33,34 Ceramics are often paramagnetic or diamagnetic, and respond weakly to magnetic fields, thus requiring much stronger fields to produce effects.22–24,26–27,30 Additionally, many ceramics have slightly different magnetic susceptibilities associated with each crystallographic plane.24–27,30,32,34 The magnetic response of ceramics is governed by 2 main equations:
∆𝐸𝐸 = 𝑉𝑉�𝜒𝜒𝑐𝑐 − 𝜒𝜒𝑎𝑎,𝑏𝑏�
12µ0𝐵𝐵2 > 𝑘𝑘𝐵𝐵𝑇𝑇 (1)
Approved for public release; distribution is unlimited.
4
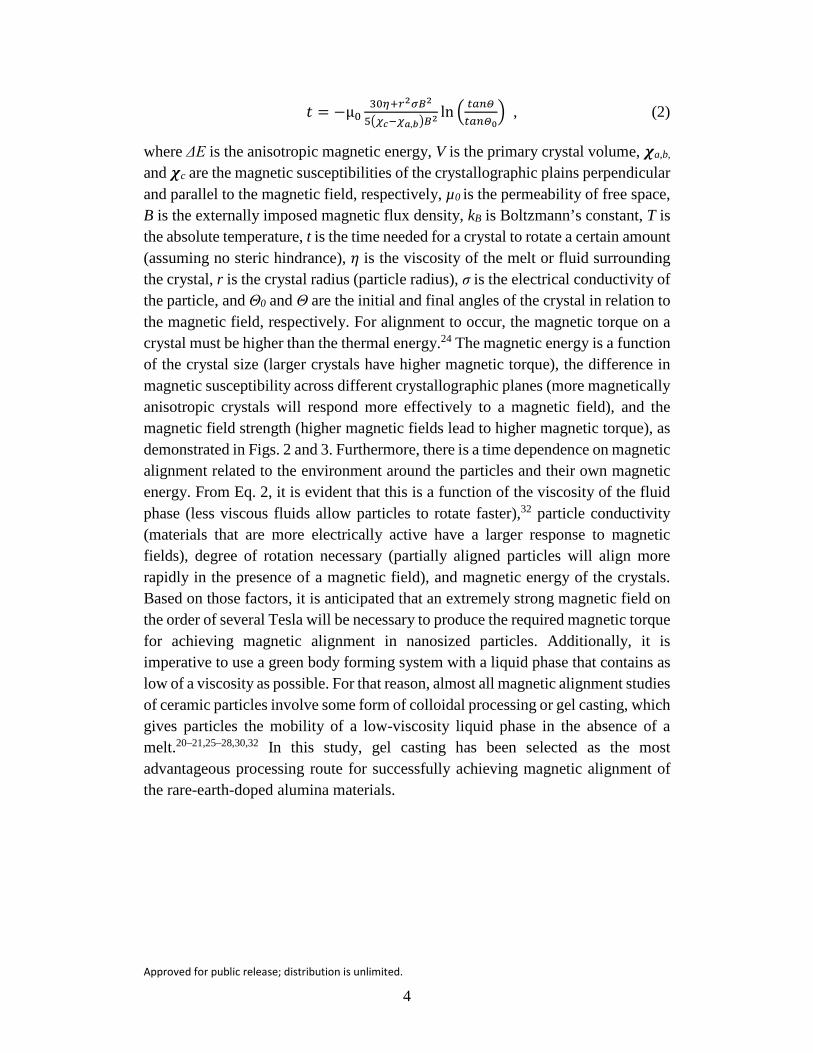
𝑡𝑡 = −µ030𝜂𝜂+𝑟𝑟2𝜎𝜎𝐵𝐵2
5�𝜒𝜒𝑐𝑐−𝜒𝜒𝑎𝑎,𝑏𝑏�𝐵𝐵2ln � 𝑡𝑡𝑎𝑎𝑡𝑡𝑡𝑡
𝑡𝑡𝑎𝑎𝑡𝑡𝑡𝑡0� , (2)
where ΔE is the anisotropic magnetic energy, V is the primary crystal volume, 𝝌𝝌a,b,
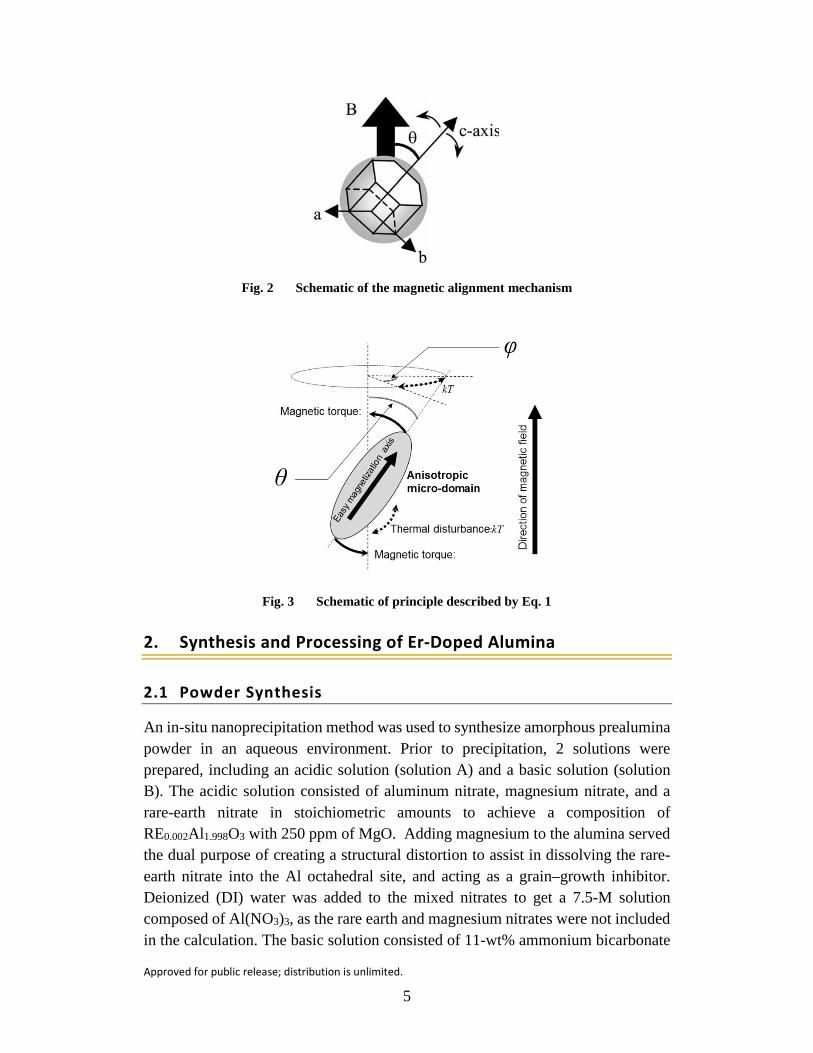
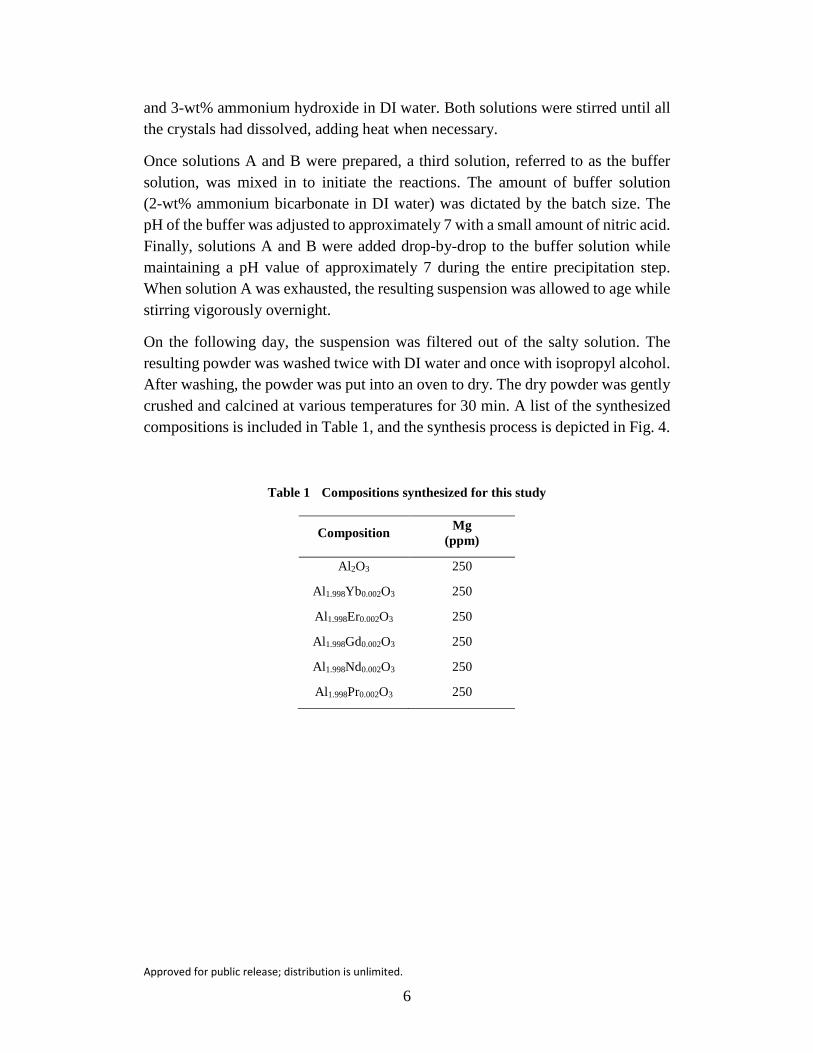
and 𝝌𝝌c are the magnetic susceptibilities of the crystallographic plains perpendicular and parallel to the magnetic field, respectively, µ0 is the permeability of free space, B is the externally imposed magnetic flux density, kB is Boltzmann’s constant, T is the absolute temperature, t is the time needed for a crystal to rotate a certain amount (assuming no steric hindrance), 𝜂𝜂 is the viscosity of the melt or fluid surrounding the crystal, r is the crystal radius (particle radius), σ is the electrical conductivity of the particle, and Θ0 and Θ are the initial and final angles of the crystal in relation to the magnetic field, respectively. For alignment to occur, the magnetic torque on a crystal must be higher than the thermal energy.24 The magnetic energy is a function of the crystal size (larger crystals have higher magnetic torque), the difference in magnetic susceptibility across different crystallographic planes (more magnetically anisotropic crystals will respond more effectively to a magnetic field), and the magnetic field strength (higher magnetic fields lead to higher magnetic torque), as demonstrated in Figs. 2 and 3. Furthermore, there is a time dependence on magnetic alignment related to the environment around the particles and their own magnetic energy. From Eq. 2, it is evident that this is a function of the viscosity of the fluid phase (less viscous fluids allow particles to rotate faster),32 particle conductivity (materials that are more electrically active have a larger response to magnetic fields), degree of rotation necessary (partially aligned particles will align more rapidly in the presence of a magnetic field), and magnetic energy of the crystals. Based on those factors, it is anticipated that an extremely strong magnetic field on the order of several Tesla will be necessary to produce the required magnetic torque for achieving magnetic alignment in nanosized particles. Additionally, it is imperative to use a green body forming system with a liquid phase that contains as low of a viscosity as possible. For that reason, almost all magnetic alignment studies of ceramic particles involve some form of colloidal processing or gel casting, which gives particles the mobility of a low-viscosity liquid phase in the absence of a melt.20–21,25–28,30,32 In this study, gel casting has been selected as the most advantageous processing route for successfully achieving magnetic alignment of the rare-earth-doped alumina materials.
Approved for public release; distribution is unlimited.
5
Fig. 2 Schematic of the magnetic alignment mechanism
Fig. 3 Schematic of principle described by Eq. 1
2. Synthesis and Processing of Er-Doped Alumina
2.1 Powder Synthesis
An in-situ nanoprecipitation method was used to synthesize amorphous prealumina powder in an aqueous environment. Prior to precipitation, 2 solutions were prepared, including an acidic solution (solution A) and a basic solution (solution B). The acidic solution consisted of aluminum nitrate, magnesium nitrate, and a rare-earth nitrate in stoichiometric amounts to achieve a composition of RE0.002Al1.998O3 with 250 ppm of MgO. Adding magnesium to the alumina served the dual purpose of creating a structural distortion to assist in dissolving the rare-earth nitrate into the Al octahedral site, and acting as a grain–growth inhibitor. Deionized (DI) water was added to the mixed nitrates to get a 7.5-M solution composed of Al(NO3)3, as the rare earth and magnesium nitrates were not included in the calculation. The basic solution consisted of 11-wt% ammonium bicarbonate
Approved for public release; distribution is unlimited.
6
and 3-wt% ammonium hydroxide in DI water. Both solutions were stirred until all the crystals had dissolved, adding heat when necessary.
Once solutions A and B were prepared, a third solution, referred to as the buffer solution, was mixed in to initiate the reactions. The amount of buffer solution (2-wt% ammonium bicarbonate in DI water) was dictated by the batch size. The pH of the buffer was adjusted to approximately 7 with a small amount of nitric acid. Finally, solutions A and B were added drop-by-drop to the buffer solution while maintaining a pH value of approximately 7 during the entire precipitation step. When solution A was exhausted, the resulting suspension was allowed to age while stirring vigorously overnight.
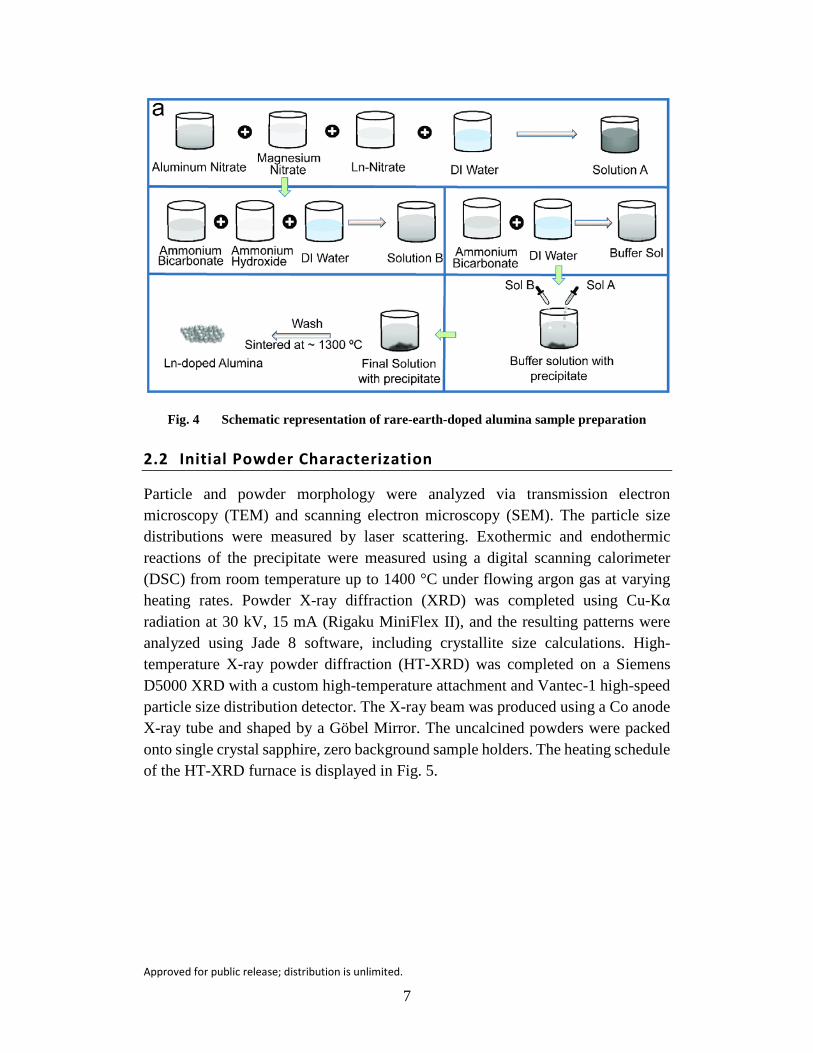
On the following day, the suspension was filtered out of the salty solution. The resulting powder was washed twice with DI water and once with isopropyl alcohol. After washing, the powder was put into an oven to dry. The dry powder was gently crushed and calcined at various temperatures for 30 min. A list of the synthesized compositions is included in Table 1, and the synthesis process is depicted in Fig. 4.
Table 1 Compositions synthesized for this study
Composition Mg (ppm)
Al2O3 250
Al1.998Yb0.002O3 250
Al1.998Er0.002O3 250
Al1.998Gd0.002O3 250
Al1.998Nd0.002O3 250
Al1.998Pr0.002O3 250
Approved for public release; distribution is unlimited.
7
Fig. 4 Schematic representation of rare-earth-doped alumina sample preparation
2.2 Initial Powder Characterization
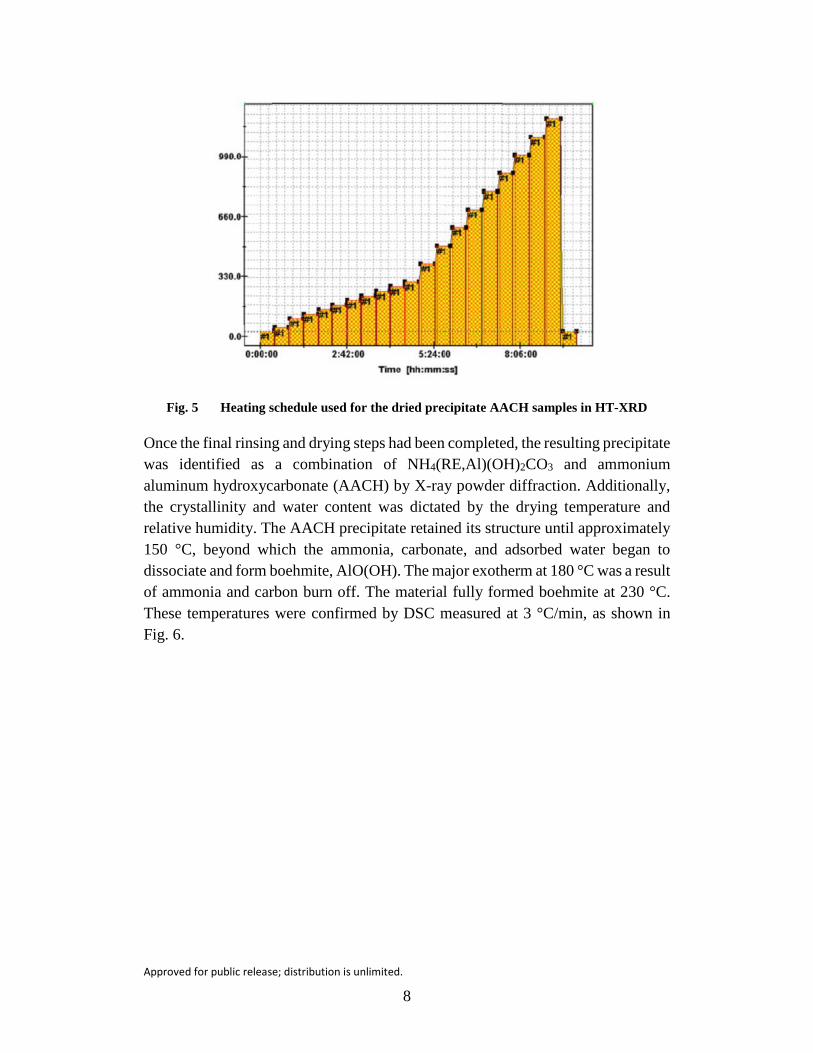
Particle and powder morphology were analyzed via transmission electron microscopy (TEM) and scanning electron microscopy (SEM). The particle size distributions were measured by laser scattering. Exothermic and endothermic reactions of the precipitate were measured using a digital scanning calorimeter (DSC) from room temperature up to 1400 °C under flowing argon gas at varying heating rates. Powder X-ray diffraction (XRD) was completed using Cu-Kα radiation at 30 kV, 15 mA (Rigaku MiniFlex II), and the resulting patterns were analyzed using Jade 8 software, including crystallite size calculations. High-temperature X-ray powder diffraction (HT-XRD) was completed on a Siemens D5000 XRD with a custom high-temperature attachment and Vantec-1 high-speed particle size distribution detector. The X-ray beam was produced using a Co anode X-ray tube and shaped by a Göbel Mirror. The uncalcined powders were packed onto single crystal sapphire, zero background sample holders. The heating schedule of the HT-XRD furnace is displayed in Fig. 5.
Approved for public release; distribution is unlimited.
8
Fig. 5 Heating schedule used for the dried precipitate AACH samples in HT-XRD
Once the final rinsing and drying steps had been completed, the resulting precipitate was identified as a combination of NH4(RE,Al)(OH)2CO3 and ammonium aluminum hydroxycarbonate (AACH) by X-ray powder diffraction. Additionally, the crystallinity and water content was dictated by the drying temperature and relative humidity. The AACH precipitate retained its structure until approximately 150 °C, beyond which the ammonia, carbonate, and adsorbed water began to dissociate and form boehmite, AlO(OH). The major exotherm at 180 °C was a result of ammonia and carbon burn off. The material fully formed boehmite at 230 °C. These temperatures were confirmed by DSC measured at 3 °C/min, as shown in Fig. 6.
Approved for public release; distribution is unlimited.
9
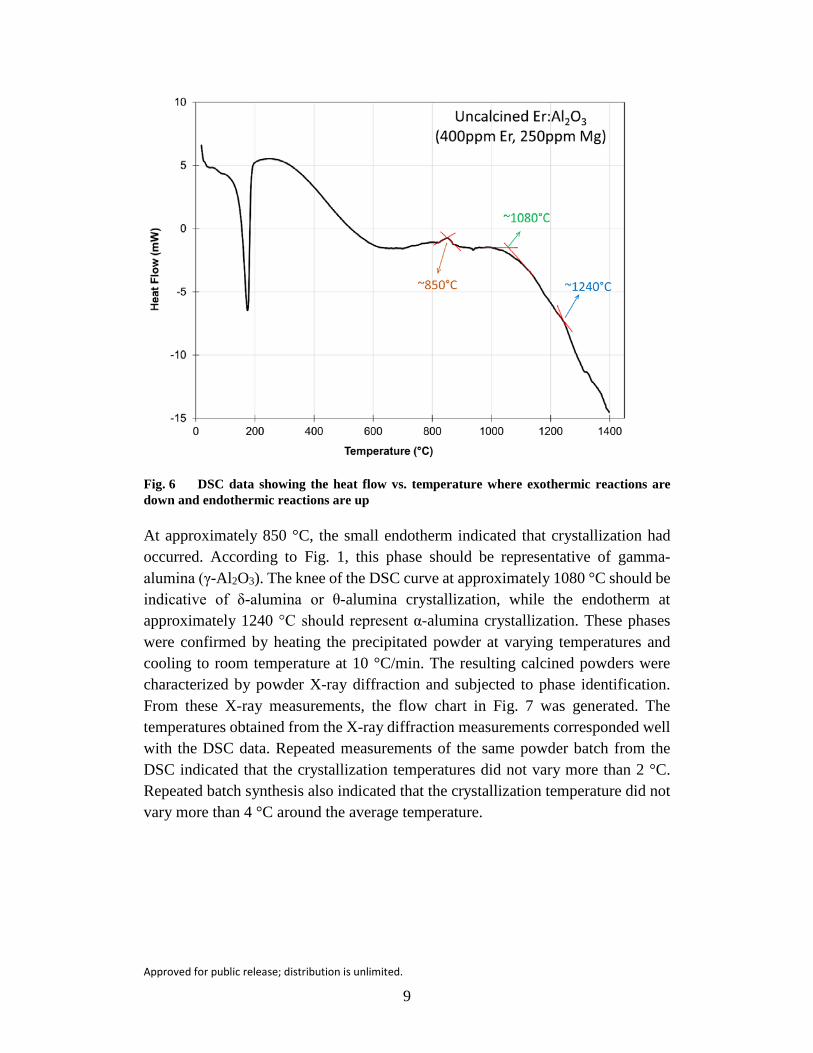
Fig. 6 DSC data showing the heat flow vs. temperature where exothermic reactions are down and endothermic reactions are up
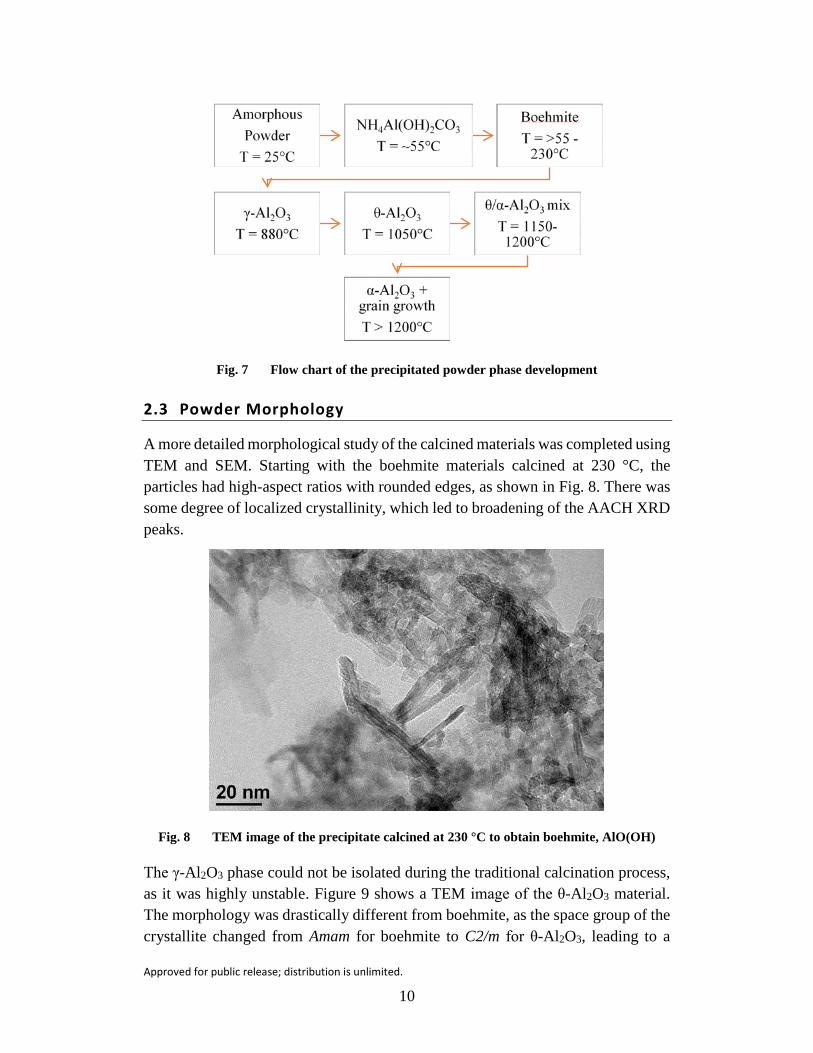
At approximately 850 °C, the small endotherm indicated that crystallization had occurred. According to Fig. 1, this phase should be representative of gamma-alumina (γ-Al2O3). The knee of the DSC curve at approximately 1080 °C should be indicative of δ-alumina or θ-alumina crystallization, while the endotherm at approximately 1240 °C should represent α-alumina crystallization. These phases were confirmed by heating the precipitated powder at varying temperatures and cooling to room temperature at 10 °C/min. The resulting calcined powders were characterized by powder X-ray diffraction and subjected to phase identification. From these X-ray measurements, the flow chart in Fig. 7 was generated. The temperatures obtained from the X-ray diffraction measurements corresponded well with the DSC data. Repeated measurements of the same powder batch from the DSC indicated that the crystallization temperatures did not vary more than 2 °C. Repeated batch synthesis also indicated that the crystallization temperature did not vary more than 4 °C around the average temperature.
Approved for public release; distribution is unlimited.
10
Fig. 7 Flow chart of the precipitated powder phase development
2.3 Powder Morphology
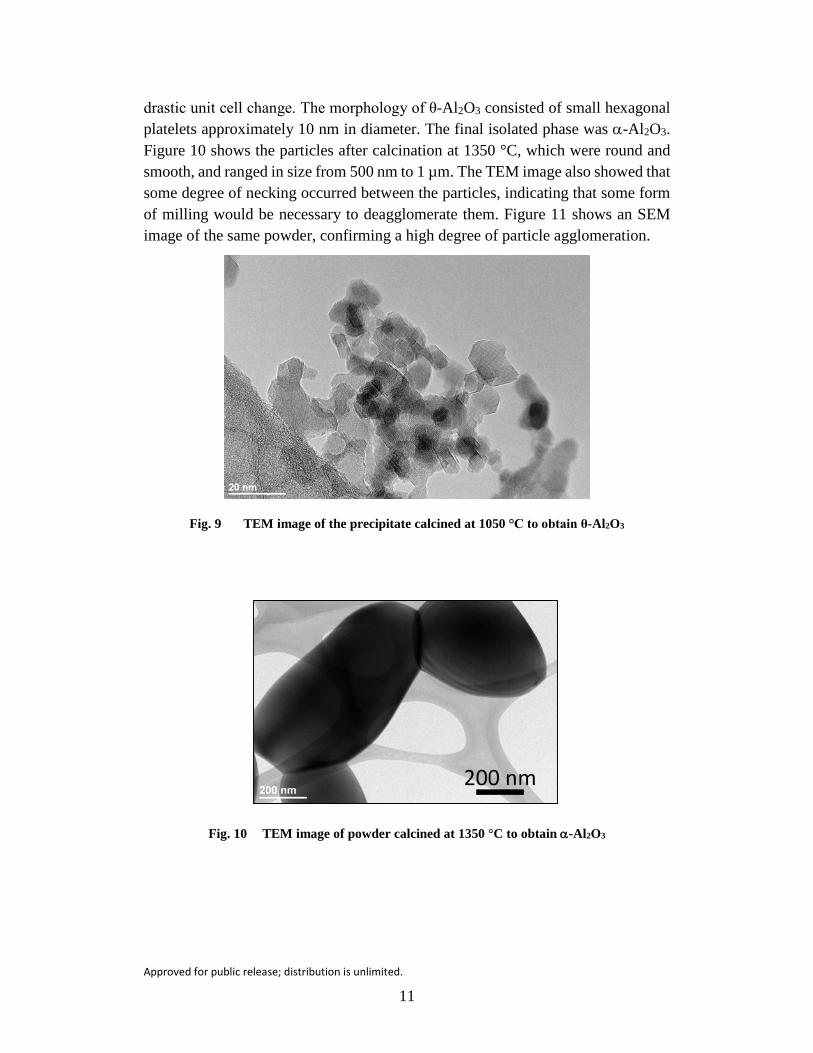
A more detailed morphological study of the calcined materials was completed using TEM and SEM. Starting with the boehmite materials calcined at 230 °C, the particles had high-aspect ratios with rounded edges, as shown in Fig. 8. There was some degree of localized crystallinity, which led to broadening of the AACH XRD peaks.
Fig. 8 TEM image of the precipitate calcined at 230 °C to obtain boehmite, AlO(OH)
The γ-Al2O3 phase could not be isolated during the traditional calcination process, as it was highly unstable. Figure 9 shows a TEM image of the θ-Al2O3 material. The morphology was drastically different from boehmite, as the space group of the crystallite changed from Amam for boehmite to C2/m for θ-Al2O3, leading to a
Approved for public release; distribution is unlimited.
11
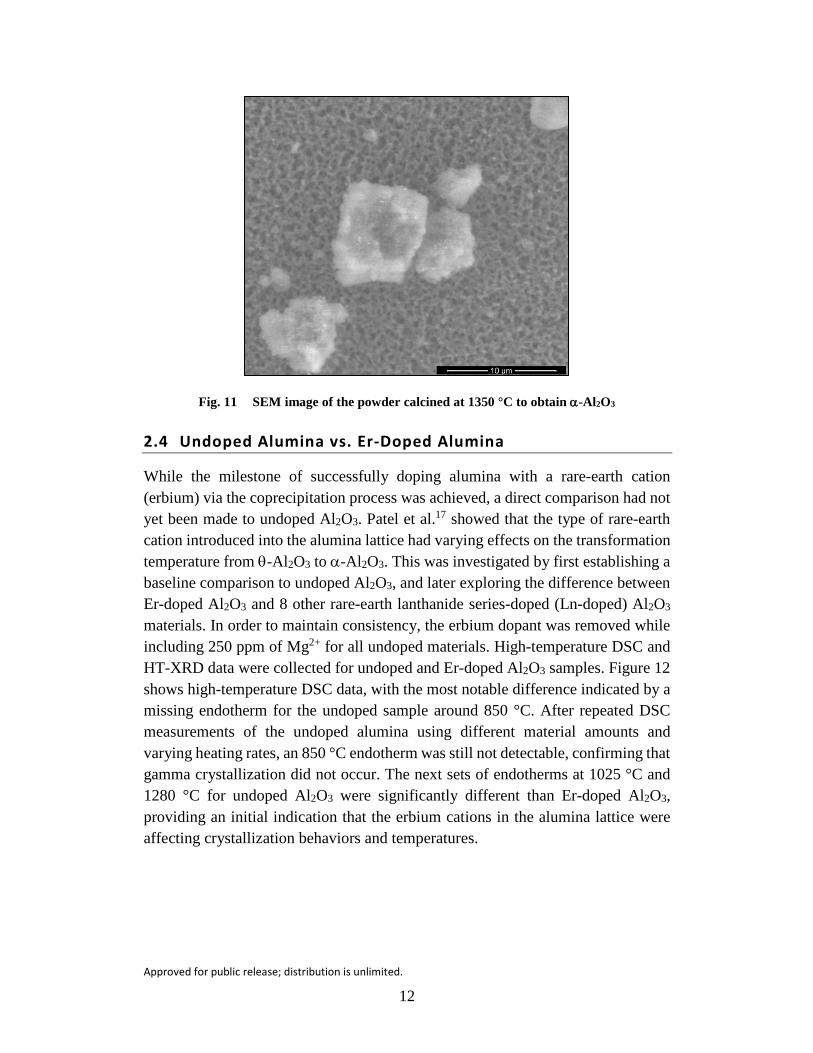
drastic unit cell change. The morphology of θ-Al2O3 consisted of small hexagonal platelets approximately 10 nm in diameter. The final isolated phase was α-Al2O3. Figure 10 shows the particles after calcination at 1350 °C, which were round and smooth, and ranged in size from 500 nm to 1 µm. The TEM image also showed that some degree of necking occurred between the particles, indicating that some form of milling would be necessary to deagglomerate them. Figure 11 shows an SEM image of the same powder, confirming a high degree of particle agglomeration.
Fig. 9 TEM image of the precipitate calcined at 1050 °C to obtain θ-Al2O3
Fig. 10 TEM image of powder calcined at 1350 °C to obtain α-Al2O3
Approved for public release; distribution is unlimited.
12
Fig. 11 SEM image of the powder calcined at 1350 °C to obtain α-Al2O3
2.4 Undoped Alumina vs. Er-Doped Alumina
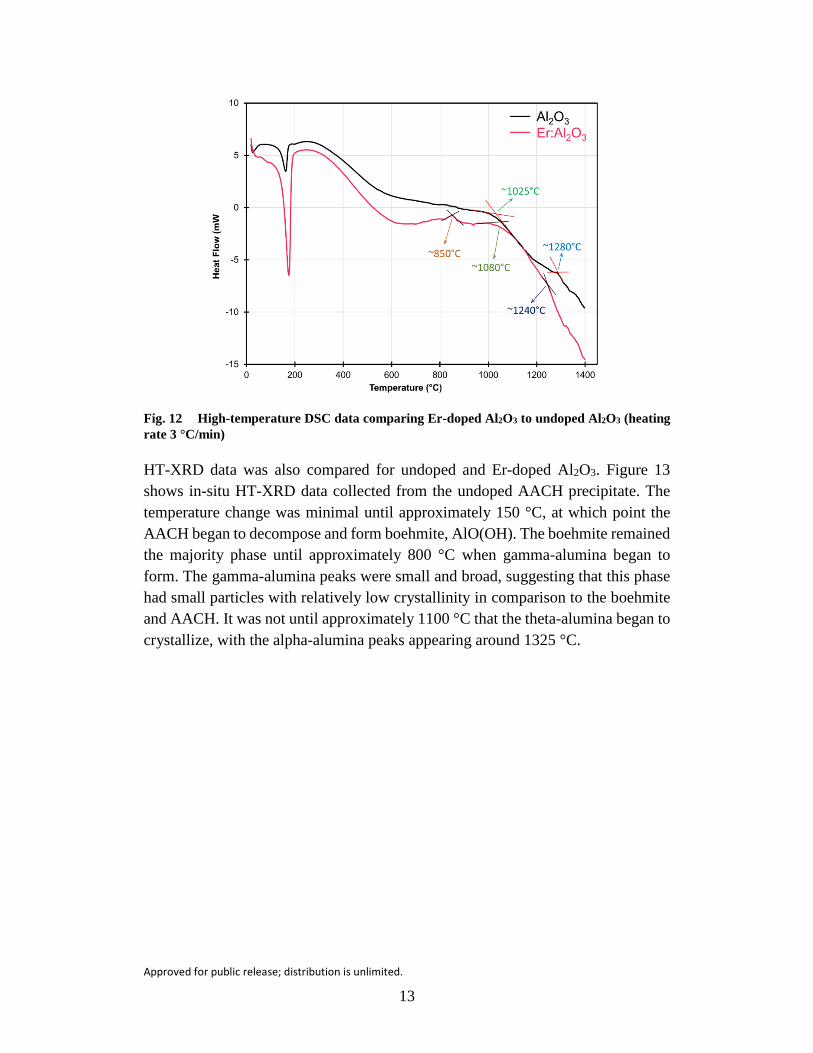
While the milestone of successfully doping alumina with a rare-earth cation (erbium) via the coprecipitation process was achieved, a direct comparison had not yet been made to undoped Al2O3. Patel et al.17 showed that the type of rare-earth cation introduced into the alumina lattice had varying effects on the transformation temperature from θ-Al2O3 to α-Al2O3. This was investigated by first establishing a baseline comparison to undoped Al2O3, and later exploring the difference between Er-doped Al2O3 and 8 other rare-earth lanthanide series-doped (Ln-doped) Al2O3 materials. In order to maintain consistency, the erbium dopant was removed while including 250 ppm of Mg2+ for all undoped materials. High-temperature DSC and HT-XRD data were collected for undoped and Er-doped Al2O3 samples. Figure 12 shows high-temperature DSC data, with the most notable difference indicated by a missing endotherm for the undoped sample around 850 °C. After repeated DSC measurements of the undoped alumina using different material amounts and varying heating rates, an 850 °C endotherm was still not detectable, confirming that gamma crystallization did not occur. The next sets of endotherms at 1025 °C and 1280 °C for undoped Al2O3 were significantly different than Er-doped Al2O3, providing an initial indication that the erbium cations in the alumina lattice were affecting crystallization behaviors and temperatures.
Approved for public release; distribution is unlimited.
13
Fig. 12 High-temperature DSC data comparing Er-doped Al2O3 to undoped Al2O3 (heating rate 3 °C/min)
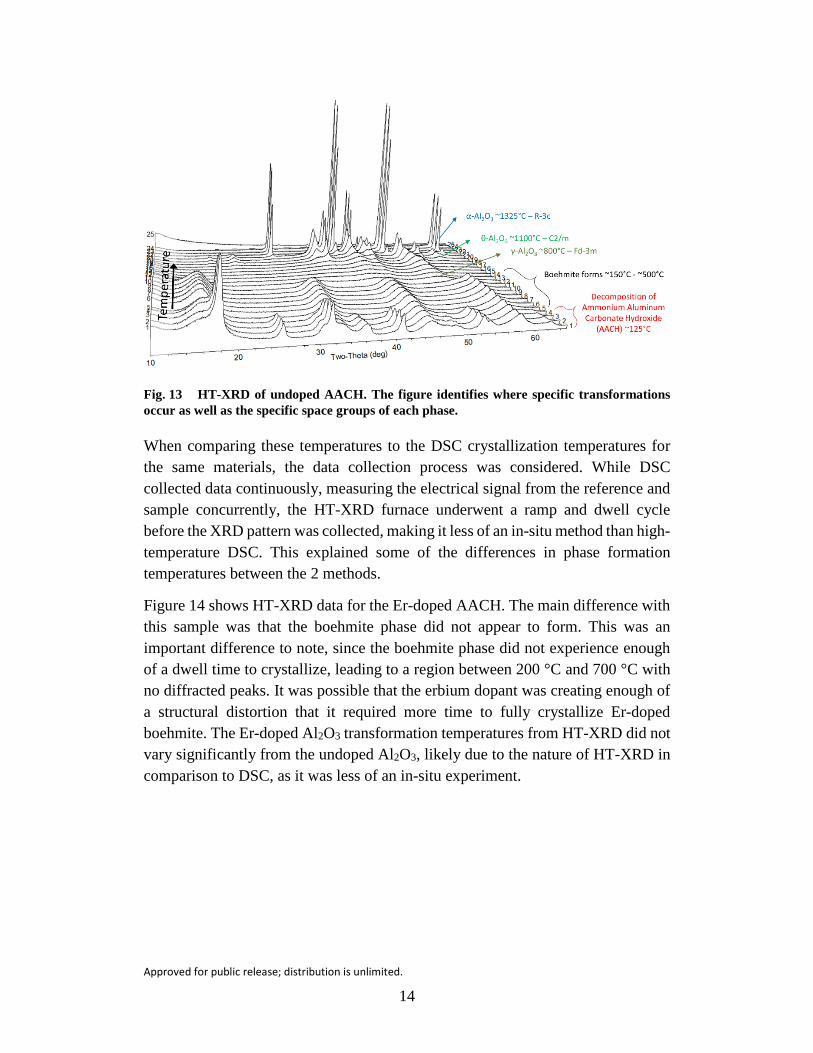
HT-XRD data was also compared for undoped and Er-doped Al2O3. Figure 13 shows in-situ HT-XRD data collected from the undoped AACH precipitate. The temperature change was minimal until approximately 150 °C, at which point the AACH began to decompose and form boehmite, AlO(OH). The boehmite remained the majority phase until approximately 800 °C when gamma-alumina began to form. The gamma-alumina peaks were small and broad, suggesting that this phase had small particles with relatively low crystallinity in comparison to the boehmite and AACH. It was not until approximately 1100 °C that the theta-alumina began to crystallize, with the alpha-alumina peaks appearing around 1325 °C.
Approved for public release; distribution is unlimited.
14
Fig. 13 HT-XRD of undoped AACH. The figure identifies where specific transformations occur as well as the specific space groups of each phase.
When comparing these temperatures to the DSC crystallization temperatures for the same materials, the data collection process was considered. While DSC collected data continuously, measuring the electrical signal from the reference and sample concurrently, the HT-XRD furnace underwent a ramp and dwell cycle before the XRD pattern was collected, making it less of an in-situ method than high-temperature DSC. This explained some of the differences in phase formation temperatures between the 2 methods.
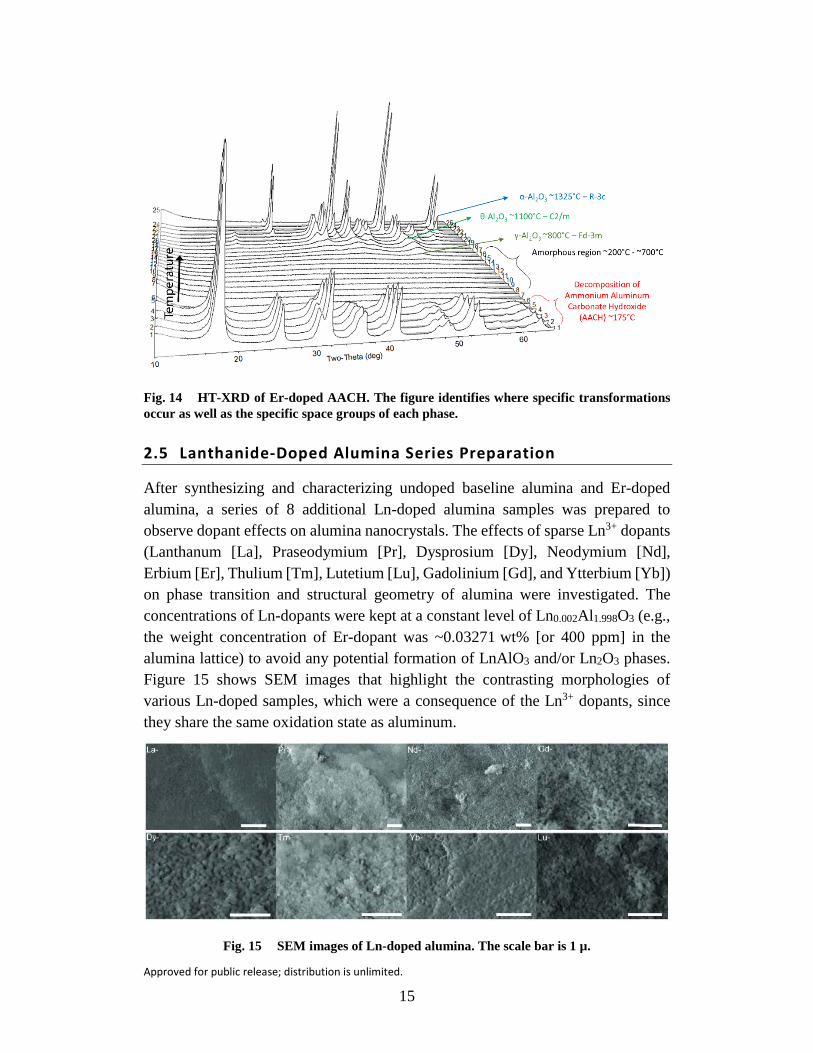
Figure 14 shows HT-XRD data for the Er-doped AACH. The main difference with this sample was that the boehmite phase did not appear to form. This was an important difference to note, since the boehmite phase did not experience enough of a dwell time to crystallize, leading to a region between 200 °C and 700 °C with no diffracted peaks. It was possible that the erbium dopant was creating enough of a structural distortion that it required more time to fully crystallize Er-doped boehmite. The Er-doped Al2O3 transformation temperatures from HT-XRD did not vary significantly from the undoped Al2O3, likely due to the nature of HT-XRD in comparison to DSC, as it was less of an in-situ experiment.
Approved for public release; distribution is unlimited.
15
Fig. 14 HT-XRD of Er-doped AACH. The figure identifies where specific transformations occur as well as the specific space groups of each phase.
2.5 Lanthanide-Doped Alumina Series Preparation
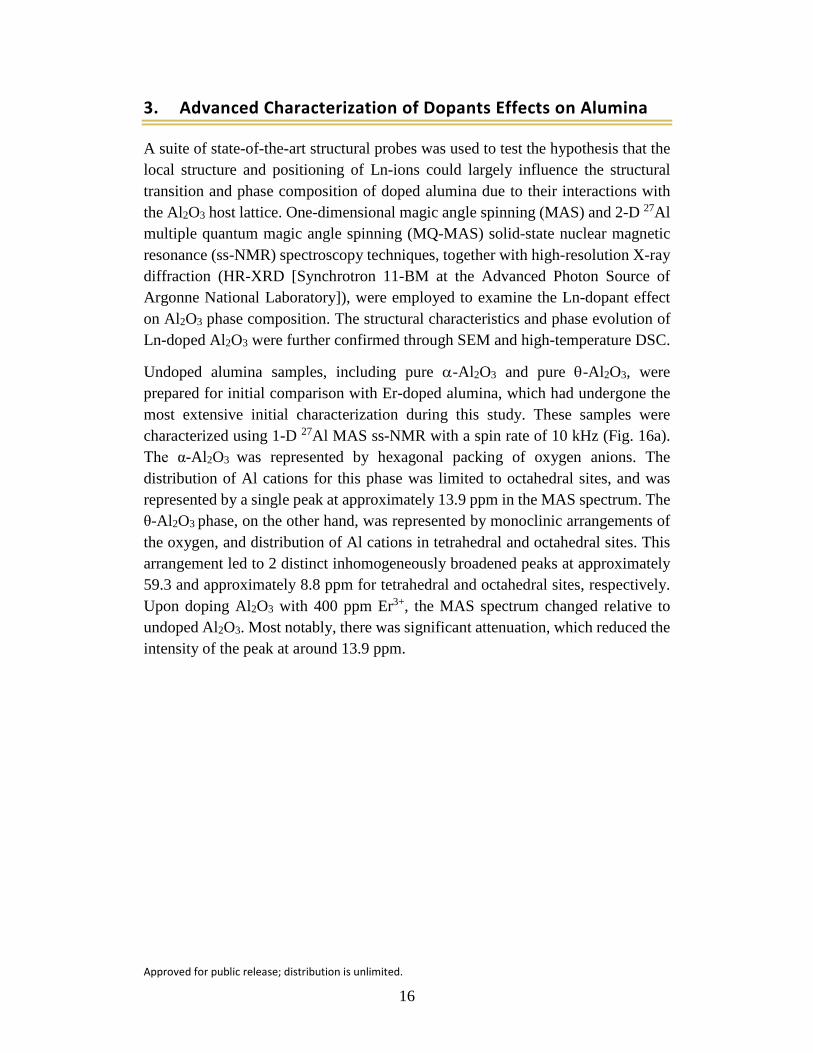
After synthesizing and characterizing undoped baseline alumina and Er-doped alumina, a series of 8 additional Ln-doped alumina samples was prepared to observe dopant effects on alumina nanocrystals. The effects of sparse Ln3+ dopants (Lanthanum [La], Praseodymium [Pr], Dysprosium [Dy], Neodymium [Nd], Erbium [Er], Thulium [Tm], Lutetium [Lu], Gadolinium [Gd], and Ytterbium [Yb]) on phase transition and structural geometry of alumina were investigated. The concentrations of Ln-dopants were kept at a constant level of Ln0.002Al1.998O3 (e.g., the weight concentration of Er-dopant was ~0.03271 wt% [or 400 ppm] in the alumina lattice) to avoid any potential formation of LnAlO3 and/or Ln2O3 phases. Figure 15 shows SEM images that highlight the contrasting morphologies of various Ln-doped samples, which were a consequence of the Ln3+ dopants, since they share the same oxidation state as aluminum.
Fig. 15 SEM images of Ln-doped alumina. The scale bar is 1 µ.
Approved for public release; distribution is unlimited.
16
3. Advanced Characterization of Dopants Effects on Alumina
A suite of state-of-the-art structural probes was used to test the hypothesis that the local structure and positioning of Ln-ions could largely influence the structural transition and phase composition of doped alumina due to their interactions with the Al2O3 host lattice. One-dimensional magic angle spinning (MAS) and 2-D 27Al multiple quantum magic angle spinning (MQ-MAS) solid-state nuclear magnetic resonance (ss-NMR) spectroscopy techniques, together with high-resolution X-ray diffraction (HR-XRD [Synchrotron 11-BM at the Advanced Photon Source of Argonne National Laboratory]), were employed to examine the Ln-dopant effect on Al2O3 phase composition. The structural characteristics and phase evolution of Ln-doped Al2O3 were further confirmed through SEM and high-temperature DSC.
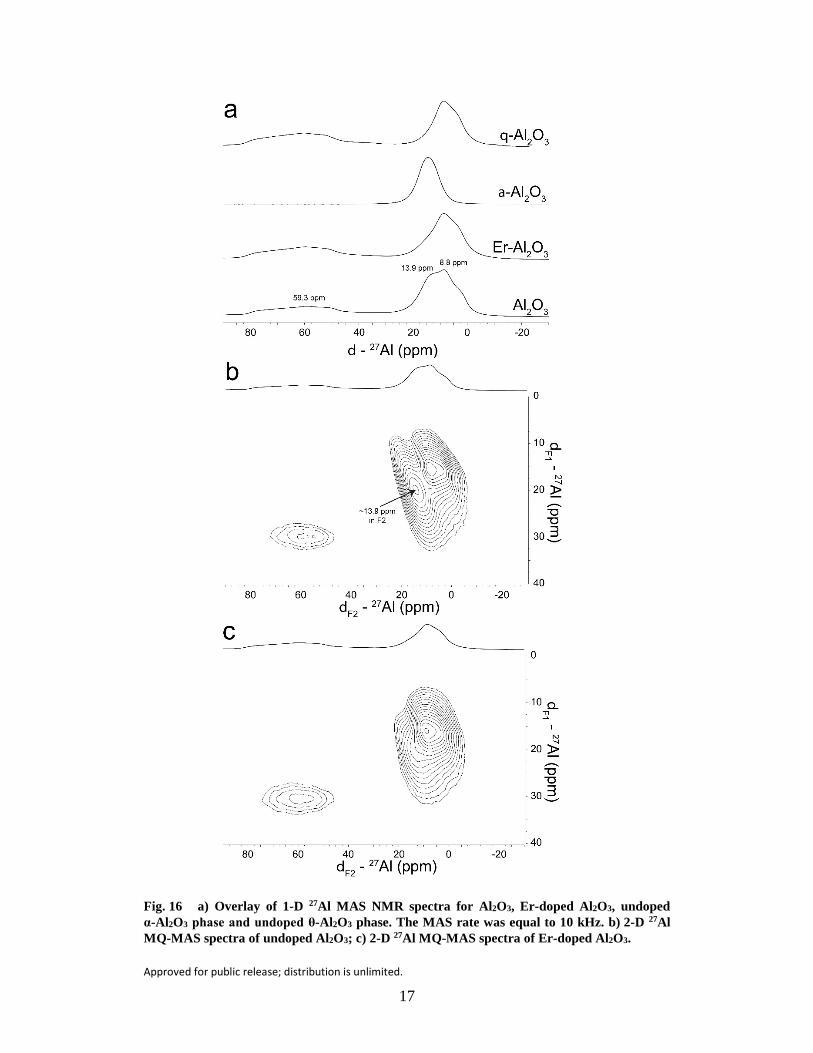
Undoped alumina samples, including pure α-Al2O3 and pure θ-Al2O3, were prepared for initial comparison with Er-doped alumina, which had undergone the most extensive initial characterization during this study. These samples were characterized using 1-D 27Al MAS ss-NMR with a spin rate of 10 kHz (Fig. 16a). The α-Al2O3 was represented by hexagonal packing of oxygen anions. The distribution of Al cations for this phase was limited to octahedral sites, and was represented by a single peak at approximately 13.9 ppm in the MAS spectrum. The θ-Al2O3 phase, on the other hand, was represented by monoclinic arrangements of the oxygen, and distribution of Al cations in tetrahedral and octahedral sites. This arrangement led to 2 distinct inhomogeneously broadened peaks at approximately 59.3 and approximately 8.8 ppm for tetrahedral and octahedral sites, respectively. Upon doping Al2O3 with 400 ppm Er3+, the MAS spectrum changed relative to undoped Al2O3. Most notably, there was significant attenuation, which reduced the intensity of the peak at around 13.9 ppm.
Approved for public release; distribution is unlimited.
17
Fig. 16 a) Overlay of 1-D 27Al MAS NMR spectra for Al2O3, Er-doped Al2O3, undoped α-Al2O3 phase and undoped θ-Al2O3 phase. The MAS rate was equal to 10 kHz. b) 2-D 27Al MQ-MAS spectra of undoped Al2O3; c) 2-D 27Al MQ-MAS spectra of Er-doped Al2O3.
Approved for public release; distribution is unlimited.
18
Multidimensional ss-NMR was used to further explore these results, as 2-D 27Al MQ-MAS spectra were collected on undoped and Er-doped Al2O3, as shown in Figs. 16b and 16c. There were 3 clear peaks in the MQ-MAS spectrum of Al2O3 at approximately 59.3, 13.9, and 8.8 ppm, respectively, in the F2 dimension. The intensity of the peak at approximately 13.9 ppm in F2 in the MQ-MAS spectrum was reduced significantly upon doping with Er3+, which was in agreement with the results of the 1-D MAS spectra. Taken together, these results suggested that, given the approximately 0.03271% weight percentage of dopant, changes in the NMR spectra were not attributed to Er3+ induced changes from anisotropic spin interactions, but rather an alteration in alumina phase composition caused by the doping procedure.
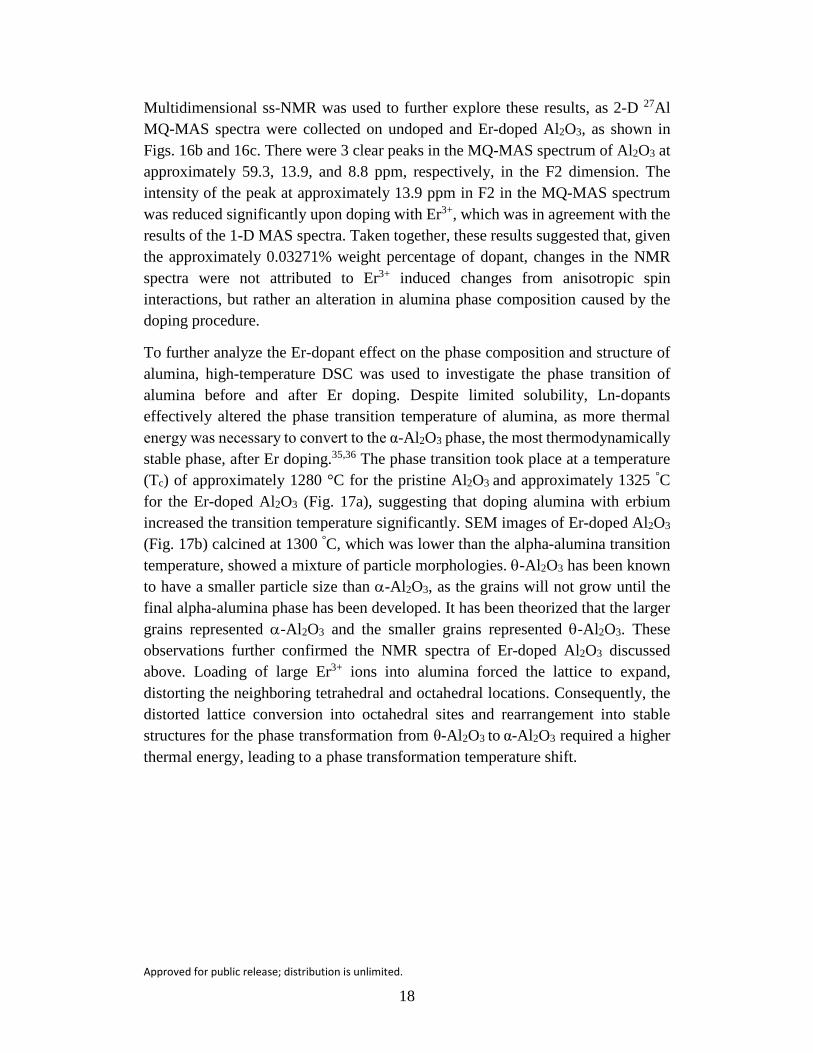
To further analyze the Er-dopant effect on the phase composition and structure of alumina, high-temperature DSC was used to investigate the phase transition of alumina before and after Er doping. Despite limited solubility, Ln-dopants effectively altered the phase transition temperature of alumina, as more thermal energy was necessary to convert to the α-Al2O3 phase, the most thermodynamically stable phase, after Er doping.35,36 The phase transition took place at a temperature (Tc) of approximately 1280 °C for the pristine Al2O3 and approximately 1325 °C for the Er-doped Al2O3 (Fig. 17a), suggesting that doping alumina with erbium increased the transition temperature significantly. SEM images of Er-doped Al2O3 (Fig. 17b) calcined at 1300 °C, which was lower than the alpha-alumina transition temperature, showed a mixture of particle morphologies. θ-Al2O3 has been known to have a smaller particle size than α-Al2O3, as the grains will not grow until the final alpha-alumina phase has been developed. It has been theorized that the larger grains represented α-Al2O3 and the smaller grains represented θ-Al2O3. These observations further confirmed the NMR spectra of Er-doped Al2O3 discussed above. Loading of large Er3+ ions into alumina forced the lattice to expand, distorting the neighboring tetrahedral and octahedral locations. Consequently, the distorted lattice conversion into octahedral sites and rearrangement into stable structures for the phase transformation from θ-Al2O3 to α-Al2O3 required a higher thermal energy, leading to a phase transformation temperature shift.
Approved for public release; distribution is unlimited.
19
Fig. 17 a) High-temperature DSC curves of Al2O3 (purple) and Er-Al2O3 (red); b) SEM image of Er-doped Al2O3
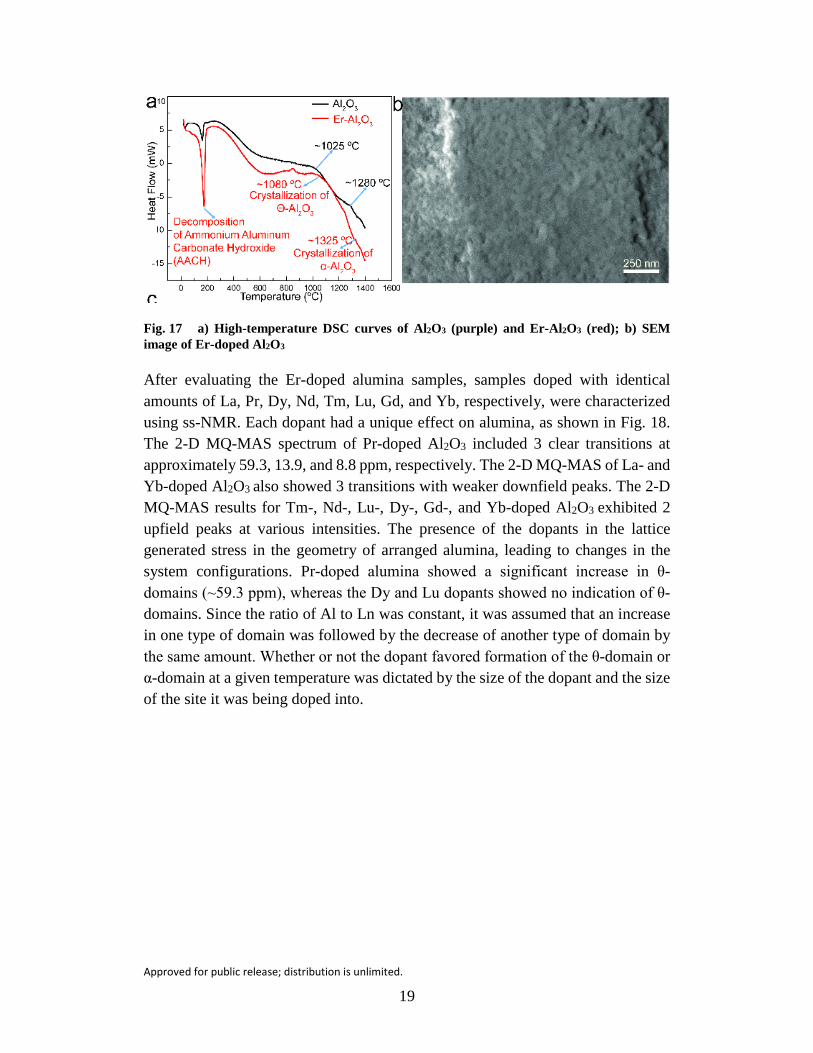
After evaluating the Er-doped alumina samples, samples doped with identical amounts of La, Pr, Dy, Nd, Tm, Lu, Gd, and Yb, respectively, were characterized using ss-NMR. Each dopant had a unique effect on alumina, as shown in Fig. 18. The 2-D MQ-MAS spectrum of Pr-doped Al2O3 included 3 clear transitions at approximately 59.3, 13.9, and 8.8 ppm, respectively. The 2-D MQ-MAS of La- and Yb-doped Al2O3 also showed 3 transitions with weaker downfield peaks. The 2-D MQ-MAS results for Tm-, Nd-, Lu-, Dy-, Gd-, and Yb-doped Al2O3 exhibited 2 upfield peaks at various intensities. The presence of the dopants in the lattice generated stress in the geometry of arranged alumina, leading to changes in the system configurations. Pr-doped alumina showed a significant increase in θ-domains (~59.3 ppm), whereas the Dy and Lu dopants showed no indication of θ-domains. Since the ratio of Al to Ln was constant, it was assumed that an increase in one type of domain was followed by the decrease of another type of domain by the same amount. Whether or not the dopant favored formation of the θ-domain or α-domain at a given temperature was dictated by the size of the dopant and the size of the site it was being doped into.
Approved for public release; distribution is unlimited.
20
Fig. 18 2-D MQ-MAS spectra of Ln-doped Al2O3
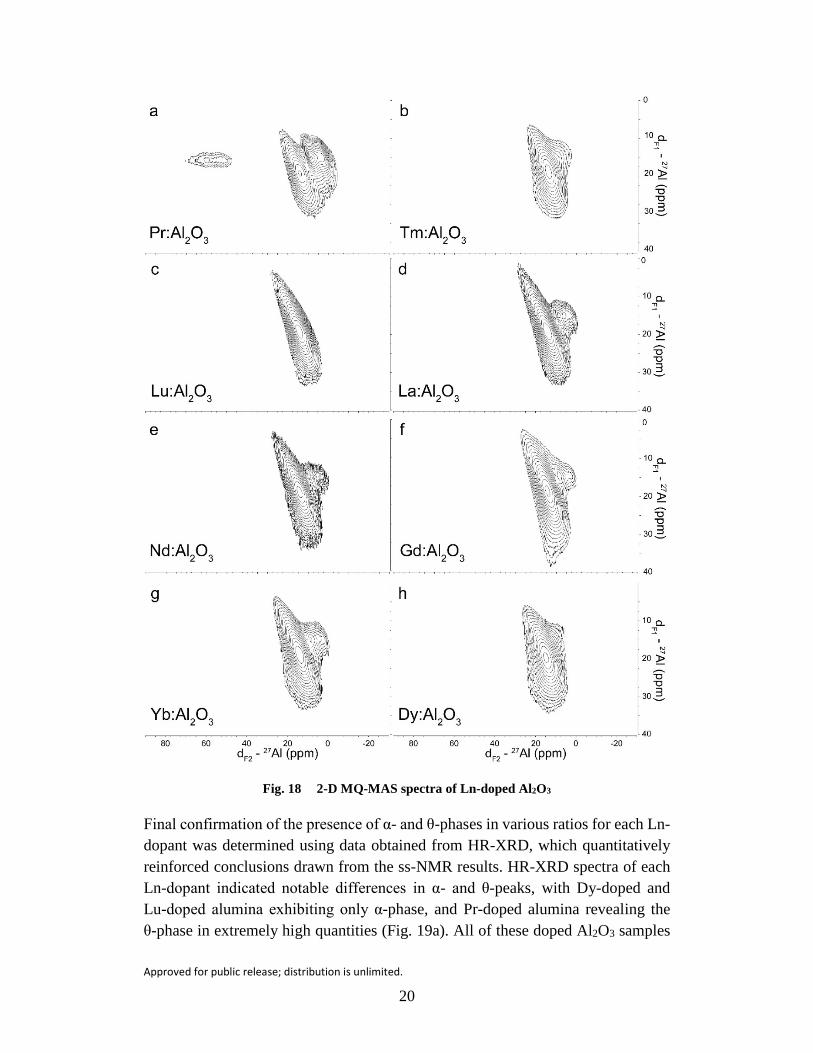
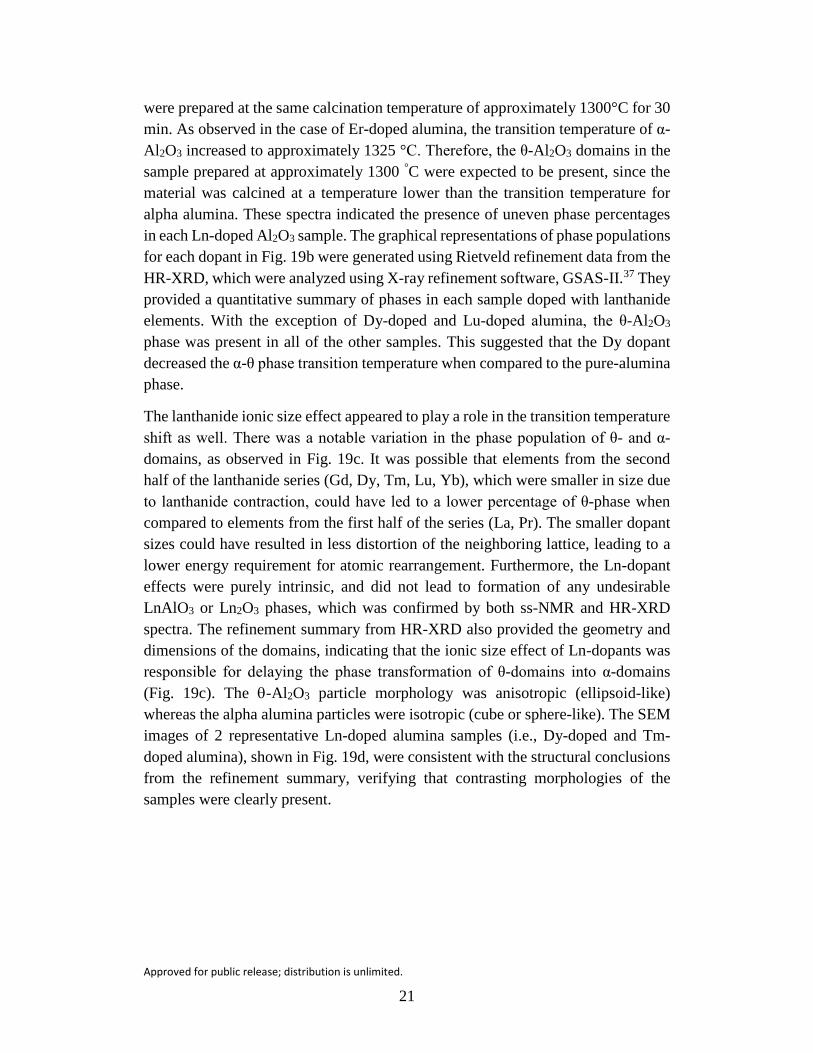
Final confirmation of the presence of α- and θ-phases in various ratios for each Ln-dopant was determined using data obtained from HR-XRD, which quantitatively reinforced conclusions drawn from the ss-NMR results. HR-XRD spectra of each Ln-dopant indicated notable differences in α- and θ-peaks, with Dy-doped and Lu-doped alumina exhibiting only α-phase, and Pr-doped alumina revealing the θ-phase in extremely high quantities (Fig. 19a). All of these doped Al2O3 samples
Approved for public release; distribution is unlimited.
21
were prepared at the same calcination temperature of approximately 1300°C for 30 min. As observed in the case of Er-doped alumina, the transition temperature of α-Al2O3 increased to approximately 1325 °C. Therefore, the θ-Al2O3 domains in the sample prepared at approximately 1300 °C were expected to be present, since the material was calcined at a temperature lower than the transition temperature for alpha alumina. These spectra indicated the presence of uneven phase percentages in each Ln-doped Al2O3 sample. The graphical representations of phase populations for each dopant in Fig. 19b were generated using Rietveld refinement data from the HR-XRD, which were analyzed using X-ray refinement software, GSAS-II.37 They provided a quantitative summary of phases in each sample doped with lanthanide elements. With the exception of Dy-doped and Lu-doped alumina, the θ-Al2O3 phase was present in all of the other samples. This suggested that the Dy dopant decreased the α-θ phase transition temperature when compared to the pure-alumina phase.
The lanthanide ionic size effect appeared to play a role in the transition temperature shift as well. There was a notable variation in the phase population of θ- and α- domains, as observed in Fig. 19c. It was possible that elements from the second half of the lanthanide series (Gd, Dy, Tm, Lu, Yb), which were smaller in size due to lanthanide contraction, could have led to a lower percentage of θ-phase when compared to elements from the first half of the series (La, Pr). The smaller dopant sizes could have resulted in less distortion of the neighboring lattice, leading to a lower energy requirement for atomic rearrangement. Furthermore, the Ln-dopant effects were purely intrinsic, and did not lead to formation of any undesirable LnAlO3 or Ln2O3 phases, which was confirmed by both ss-NMR and HR-XRD spectra. The refinement summary from HR-XRD also provided the geometry and dimensions of the domains, indicating that the ionic size effect of Ln-dopants was responsible for delaying the phase transformation of θ-domains into α-domains (Fig. 19c). The θ-Al2O3 particle morphology was anisotropic (ellipsoid-like) whereas the alpha alumina particles were isotropic (cube or sphere-like). The SEM images of 2 representative Ln-doped alumina samples (i.e., Dy-doped and Tm-doped alumina), shown in Fig. 19d, were consistent with the structural conclusions from the refinement summary, verifying that contrasting morphologies of the samples were clearly present.
Approved for public release; distribution is unlimited.
22
Fig. 19 a) Low-angle HR-XRD data of the Ln-doped alumina. From top to bottom: Ln = Pr, Er, La, Gd, Yb, Nd, Tm, Lu, Dy, respectively. The data were sequentially offset by a factor of 10 for clarity. The peaks denoted “*” represented the α-phase and the peaks denoted “o” symbols represented the θ-phase. b) Graphical representation of the α- and θ-phase populations at ~1300 °C. The Dy- and Lu-doped alumina exhibited only α-phase. c) Graphical representation of Ln-cationic phase fraction, octahedral coordination radius and phase diameters. The data points represented Ln-series elements in decreasing order of atomic number, moving from left to right (Lu, Yb, Tm, Er, Dy, Gd, Nd, Pr, and La). The diameter was represented by the orange data points and the phase fraction was represented by the blue data points. A refinement summary of all Ln3+ doped alumina was included. d) SEM images of Dy- and Tm-doped alumina.
Approved for public release; distribution is unlimited.
23
The advanced characterization study demonstrated that Ln doping (400 ppm) in alumina had a significant influence over structural and phase evolution. Ln dopants served as structural promoters to increase the phase transformation temperature (θ →α) by a notable magnitude, which delayed the onset of alumina lattice phase transformations. Lanthanide doping in alumina enabled control of the phase population with no additional unwanted phases (i.e., LnAl2O3 or Ln2O3) observed. Additionally, it was determined that the lanthanide dopants resided in the vacant octahedral locations within the alumina lattice. The formation of 100% α-phase was also observed in the case of Dy- and Lu-doped alumina. This study revealed a new perspective on the significance of Ln-doping in alumina.
4. Density Functional Theory Modeling and Simulation
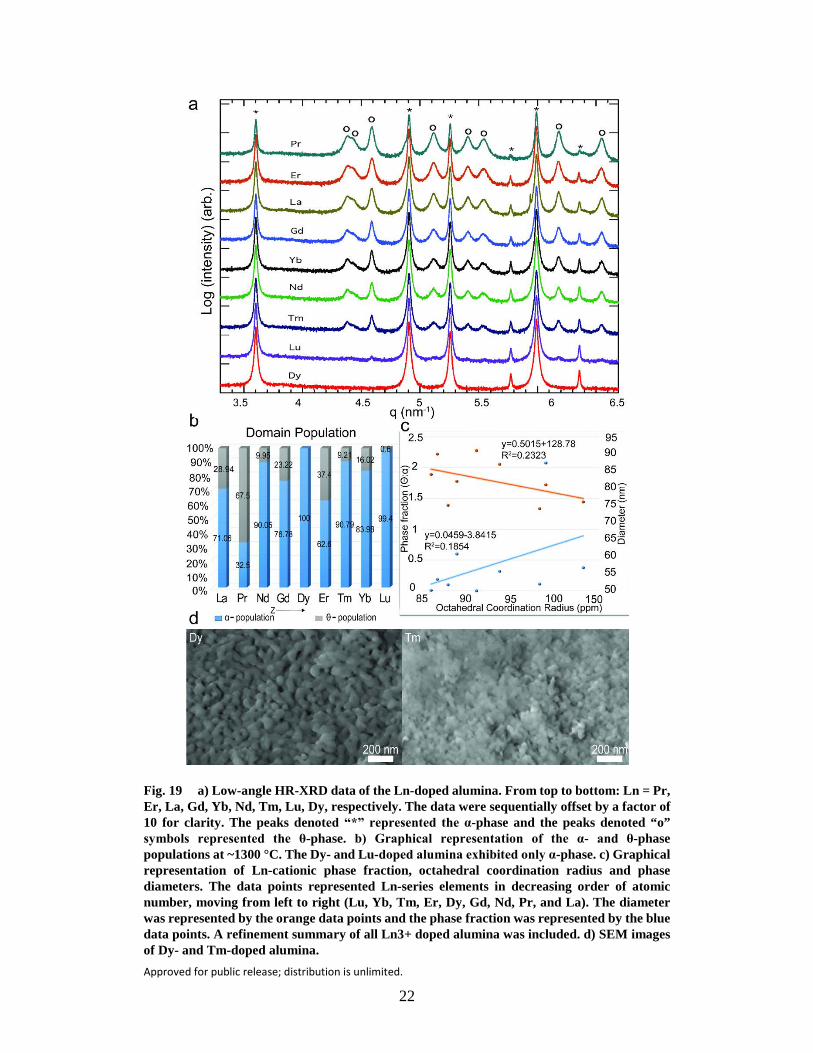
Density functional theory (DFT) was used to provide insight into the effect of rare-earth dopants on structure and phase stability of α- and θ-Al2O3. Lanthanide series rare-earth dopants, including Er, Yb, Nd, Gd, and Pr selected for evaluation. The α-Al2O3 and θ-Al2O3 were modeled. The α-Al2O3 unit cell contained 30-atoms in a corundum structure with space group symmetry 𝑅𝑅3�𝑐𝑐 as shown in Fig. 20a. The oxygen ions (O2-) were arranged in a distorted HCP lattice, while the aluminum ions (Al3+) were located in 2/3 of the equivalent octahedral interstitial positions. The θ-Al2O3 unit cell contained 20 atoms and belonged to the monoclinic C2/m space group, as shown in Fig. 20b. The O2- ions were arranged as an FCC array, yielding 2 nonequivalent Al3+ sites in the θ-phase, an octahedral and tetrahedral site, on which the Al3+ ions were evenly distributed. To study the doping effect, a supercell approach was adopted, where supercells were generated by repeating unit cells: 2 × 2 × 1 and 1 × 3 × 2 for α-Al2O3 and θ-Al2O3, respectively. These asymmetric repetitions of the lattice vectors created similarly sized supercells for both phases composed of 120 atoms each (i.e., 24 Al2O3 formula units).
Fig. 20 Schematic representation of Al2O3 unit cells a) α-Al2O3 and b) θ-Al2O3 with atomic coloring of the smaller Al (blue) and larger O (red)
Approved for public release; distribution is unlimited.
24
Ln-doped supercells were modeled by substituting one of the Al3+ ions with the Ln-dopant near the center of the supercell, resulting in a composition of Al1.958Ln0.042O3. All symmetry equivalent Al3+ sites were examined (i.e., octahedral sites in α-Al2O3; octahedral and tetrahedral sites in θ-Al2O3). The spacing between Ln-dopants and their periodic image was approximately 1 nm. This spacing was found to be sufficient to avoid Ln–Ln interactions in an Er-doped supercell, where increasing the Er–Er spacing to greater than 1 nm affected the defect formation energy by less than 0.3 meV. Further, similar studies on doped alumina38–43 and doped oxides44–45 confirmed that a distance of 1 nm was sufficient to minimize dopant–dopant interactions.
The calculated lattice parameters of undoped α-Al2O3 (a = b = 4.81 Å and c = 13.12 Å) and θ-Al2O3 (a = 11.77 Å, b = 2.92 Å, c = 5.62 Å, and β = 104.0°) were consistent with other theoretical values,39 and were also within 1% of reported experimental values.46–47 Local distortion of the Al3+ sites were also in good agreement with experimental values. In particular, Al-O bond distances associated with the distorted Al3+ sites compared well with experimental values given in parenthesis, for α-Al2O3 octahedral sites of 1.87–1.99 Å (1.86–1.97 Å),48 θ-Al2O3
octahedral sites of 1.87–2.00 Å (1.86–1.99 Å)47 and θ-Al2O3 tetrahedral sites of 1.76–1.80 Å (1.73–1.82 Å).47
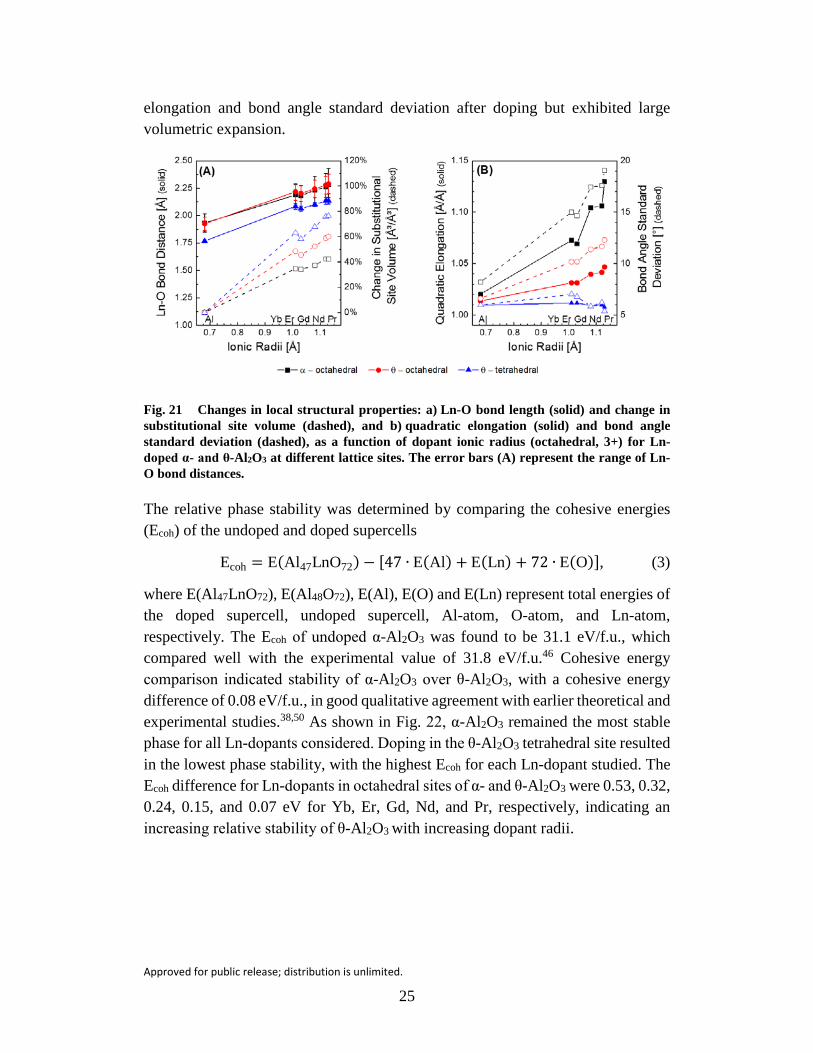
Substitution of an Al-atom with an Ln-dopant increased the lattice parameters and enhanced the local structural distortion around the substitution site. Local distortion was quantified as a function of Ln-O bond distance, Ln-site volume, quadratic elongation, and standard deviation of the internal bond angles.49 Substitution by the large Ln-dopants led to an increase in the lattice parameters by approximately 0.5% for all sites and dopants considered. Substitutional site volume and Ln-O bond distances increased with increasing ionic radii, as shown in Fig. 21a. The increase in Ln-O bond length with respect to dopant radii was approximately linear and of the same magnitude for the octahedral and tetrahedral sites. Due to the smaller size of the tetrahedral site, this manifested as a larger percentage change in the site volume (Fig. 21a). Interestingly, the θ-Al2O3 octahedral site volume also increased more substantially than that of the α-Al2O3 octahedral site. This may be explained in part by the substitutional site quadratic elongation and bond angle standard deviation shown in Fig. 21b. The α-Al2O3 octahedral site had the largest geometric site distortion, indicating that the Ln-O bond length increase was primarily accommodated by octahedral distortion rather than expansion. Undoped θ-Al2O3
had a lower calculated density than α-Al2O3, 3.62 versus 3.87 g/cm3, respectively, allowing for the volumetric expansion of its octahedral and tetrahedral sites to be more easily accommodated within the less dense structure. This was exaggerated in the θ-Al2O3 tetrahedral site, which had negligible change in the quadratic
Approved for public release; distribution is unlimited.
25
elongation and bond angle standard deviation after doping but exhibited large volumetric expansion.
Fig. 21 Changes in local structural properties: a) Ln-O bond length (solid) and change in substitutional site volume (dashed), and b) quadratic elongation (solid) and bond angle standard deviation (dashed), as a function of dopant ionic radius (octahedral, 3+) for Ln-doped α- and θ-Al2O3 at different lattice sites. The error bars (A) represent the range of Ln-O bond distances.
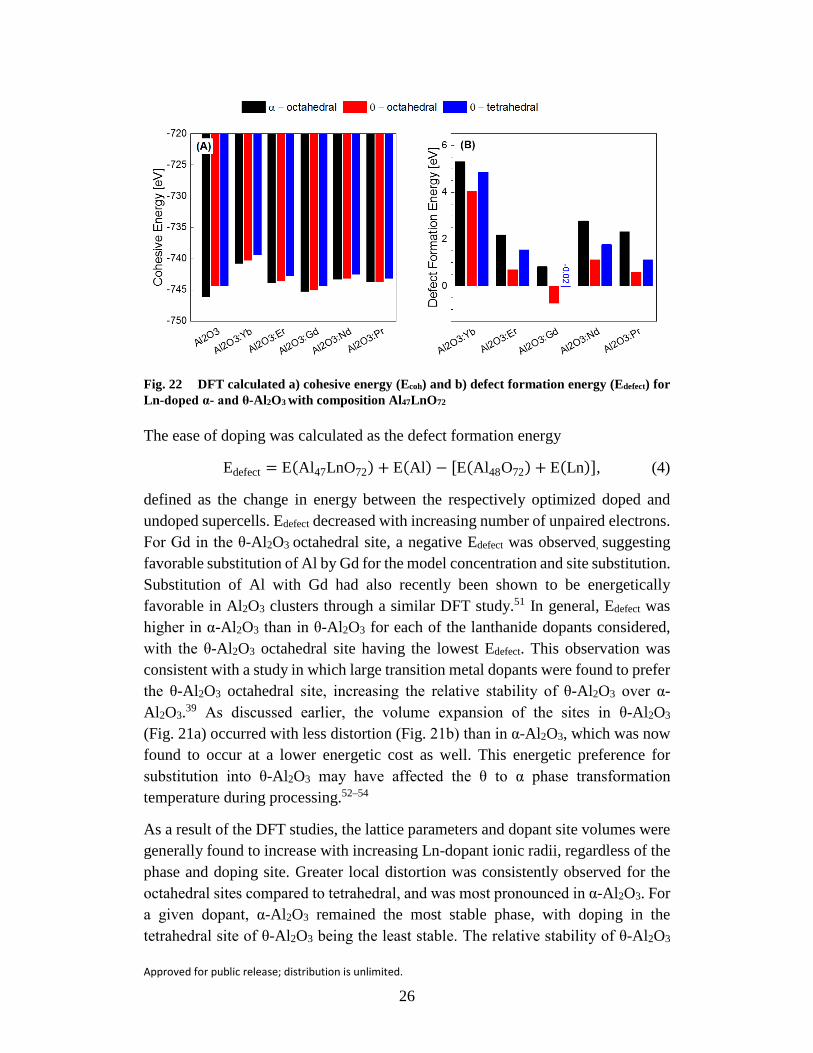
The relative phase stability was determined by comparing the cohesive energies (Ecoh) of the undoped and doped supercells
Ecoh = E(Al47LnO72) − [47 ∙ E(Al) + E(Ln) + 72 ∙ E(O)], (3)
where E(Al47LnO72), E(Al48O72), E(Al), E(O) and E(Ln) represent total energies of the doped supercell, undoped supercell, Al-atom, O-atom, and Ln-atom, respectively. The Ecoh of undoped α-Al2O3 was found to be 31.1 eV/f.u., which compared well with the experimental value of 31.8 eV/f.u.46 Cohesive energy comparison indicated stability of α-Al2O3 over θ-Al2O3, with a cohesive energy difference of 0.08 eV/f.u., in good qualitative agreement with earlier theoretical and experimental studies.38,50 As shown in Fig. 22, α-Al2O3 remained the most stable phase for all Ln-dopants considered. Doping in the θ-Al2O3 tetrahedral site resulted in the lowest phase stability, with the highest Ecoh for each Ln-dopant studied. The Ecoh difference for Ln-dopants in octahedral sites of α- and θ-Al2O3 were 0.53, 0.32, 0.24, 0.15, and 0.07 eV for Yb, Er, Gd, Nd, and Pr, respectively, indicating an increasing relative stability of θ-Al2O3 with increasing dopant radii.
Approved for public release; distribution is unlimited.
26
Fig. 22 DFT calculated a) cohesive energy (Ecoh) and b) defect formation energy (Edefect) for Ln-doped α- and θ-Al2O3 with composition Al47LnO72
The ease of doping was calculated as the defect formation energy
Edefect = E(Al47LnO72) + E(Al) − [E(Al48O72) + E(Ln)], (4)
defined as the change in energy between the respectively optimized doped and undoped supercells. Edefect decreased with increasing number of unpaired electrons. For Gd in the θ-Al2O3 octahedral site, a negative Edefect was observed, suggesting favorable substitution of Al by Gd for the model concentration and site substitution. Substitution of Al with Gd had also recently been shown to be energetically favorable in Al2O3 clusters through a similar DFT study.51 In general, Edefect was higher in α-Al2O3 than in θ-Al2O3 for each of the lanthanide dopants considered, with the θ-Al2O3 octahedral site having the lowest Edefect. This observation was consistent with a study in which large transition metal dopants were found to prefer the θ-Al2O3 octahedral site, increasing the relative stability of θ-Al2O3 over α-Al2O3.39 As discussed earlier, the volume expansion of the sites in θ-Al2O3 (Fig. 21a) occurred with less distortion (Fig. 21b) than in α-Al2O3, which was now found to occur at a lower energetic cost as well. This energetic preference for substitution into θ-Al2O3 may have affected the θ to α phase transformation temperature during processing.52–54
As a result of the DFT studies, the lattice parameters and dopant site volumes were generally found to increase with increasing Ln-dopant ionic radii, regardless of the phase and doping site. Greater local distortion was consistently observed for the octahedral sites compared to tetrahedral, and was most pronounced in α-Al2O3. For a given dopant, α-Al2O3 remained the most stable phase, with doping in the tetrahedral site of θ-Al2O3 being the least stable. The relative stability of θ-Al2O3
Approved for public release; distribution is unlimited.
27
with an octahedral site dopant increased with increasing dopant radii, as observed in Ecoh differences. The octahedral site of θ-Al2O3 was also found to be the preferred substitutional site for all Ln-dopants considered, where the defect formation energy decreased with an increasing number of unpaired electrons.
After thorough characterization and initial DFT modeling demonstrated the effect of rare earth dopant addition on alumina structure and phase, investigation of external field interactions with rare-earth doped alumina samples were also explored. In this phase of the program, microwave sintering and magnetic field processing were studied in relation to densification and crystallographic texturing behavior.
5. Microwave Sintering of Rare-Earth-Doped Alumina
Microwave sintering is a technique that converts microwave energy of different frequencies and fields into heat. In multimode microwave sintering—the most common microwave technology used in materials processing—microwave radiation is emitted into a reflective cavity that is much larger than the wavelength, and multiple modes are excited within the cavity. This design is intended to produce a mixed-EM energy within the cavity. While this is beneficial for heating large objects uniformly, it inherently limits fundamental studies of the mechanisms by which microwave energy interacts with matter, since many modes are active in the chamber and the effects of electric and magnetic fields cannot be separated. In contrast to multimode systems, single-mode microwave sintering systems have been developed through careful design of the applicator to form a standing wave, in which only a single mode is excited. One advantage of this design is the significantly lower power requirement, since microwave energy is concentrated on 1 or 2 modes in a small area of the cavity. Another advantage is the ability to fully separate the electric and magnetic field components of EM waves at specific cavity locations. Single-mode microwave heating, therefore, holds great promise for fundamental research in microwave processing, since the electric and magnetic field maxima are separated spatially in the chamber. Depending on the sample position, the sample can be subjected to 100% electric and 0% magnetic energy and vice versa. Earlier reports55–57 have demonstrated that processing materials in the regions of electric field and magnetic field maxima in a single-mode microwave system can produce unique microstructures and phase transformations, enabling the processing of a wider range of materials.
While many studies have been performed in the regions of electric or magnetic maxima using single-mode microwave systems, the potential benefits of using mixed-component microwave fields have been largely unexplored. In addition to
Approved for public release; distribution is unlimited.
28
the 100%:0% field ratios, the sample may be placed such that it experiences a nonzero percentage of both fields: a mixed-field mode (e.g., 30% electric field and 70% magnetic field). This unique experimental parameter afforded by single-mode microwave sintering may provide insight into how the different fields affect crystal structure and microstructure-controlling mechanisms during such heat treatment. In addition, the ability to adjust the relative amounts of applied electric and magnetic fields may be especially useful for materials such as Al2O3, which is diamagnetic, and does not couple to the magnetic field, so the 100% magnetic field, 0% electric-field condition does not heat the sample. Therefore, by using the mixed-field condition, one field can be used to heat the sample and the other field can be varied to study its effects on the material microstructure quasi-independently.
In this effort, Er-doped Al2O3 was sintered using both multi- and single-mode microwave systems. Powders and sintered pellets were characterized via Archimedes density measurements, XRD, SEM, and energy dispersive spectroscopy (EDS). The focus was centered on the single-mode microwave sintering system, and the effect of placing the sample in different positions along the cavity for exposure to varying proportions of electric field and magnetic field. To study how the EM field at microwave frequencies (2.45 GHz) affected sintering behavior of rare-earth-doped Al2O3, microwave sintering parameters including the temperature, microwave frequency, and sintering atmosphere were held constant. The results showed that the mixed-field parameters had an effect on both the density of the sintered ceramic, as well as the dopant migration.
Pellets of Er-doped Al2O3 13 mm in diameter were cold isostatically pressed to 400 MPa, and either conventionally sintered or microwave sintered. To obtain baseline materials, 2 samples were pressure-less sintered, using a ramp rate of 15 °C/min and a hold time of 2 h. Microwave sintering was performed using either a 2-kW, 2.45-GHz multimode system or a 2-kW, 2.45-GHz single-mode system. The details of single-mode microwave systems are provided by other resources.56 The microwave sintering parameters, as well as the sintering parameters for the baseline samples, are shown in Table 2 (where SM stands for single-mode microwave sintered, BL stands for baseline conventionally sintered, and MM stands for multimode microwave sintered). The SM samples also included the relative amounts of the electric and magnetic field. For example, SM-100:0 was sintered at the center of the electric field maximum, where magnetic field was zero, while SM-30:70 was situated along the chamber axis where the ratio of electric and magnetic fields was estimated to be 30:70. All samples were sintered in air at 1400 °C (with a 2-h hold). The temperature measurement was made using an optical pyrometer (Leeds and Northrup Company, Philadelphia, PA, USA) focused on the surface of the sample.
Approved for public release; distribution is unlimited.
29
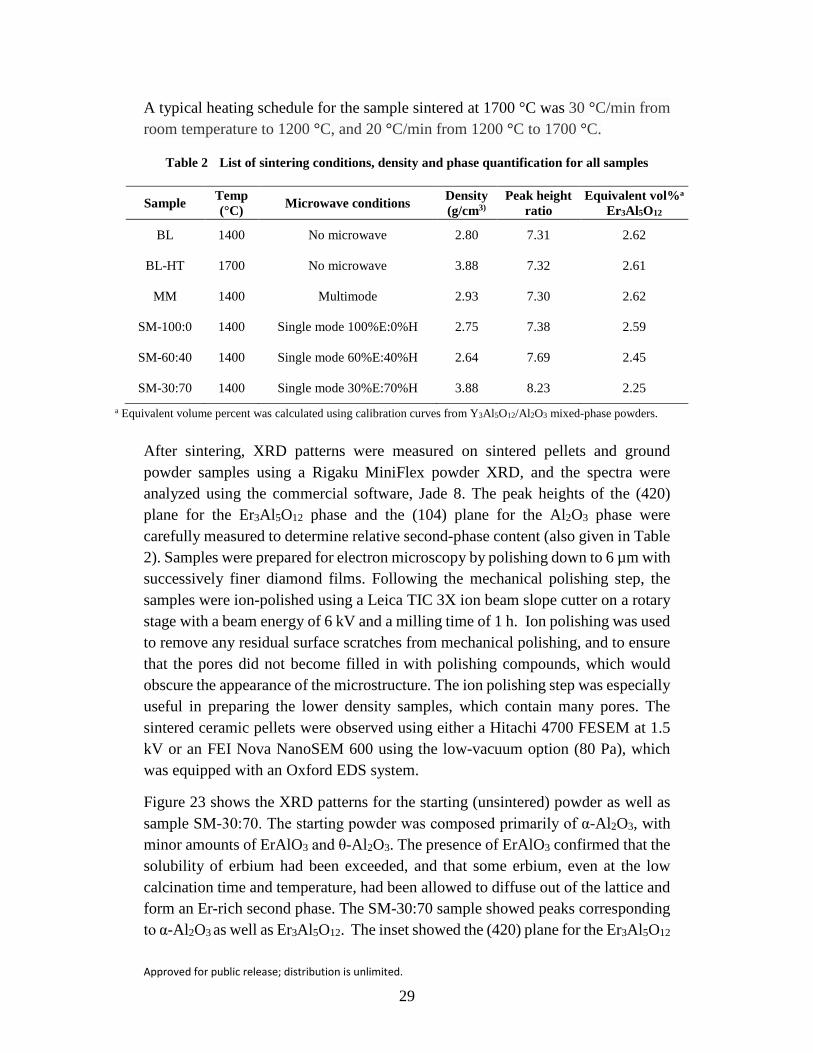
A typical heating schedule for the sample sintered at 1700 °C was 30 °C/min from room temperature to 1200 °C, and 20 °C/min from 1200 °C to 1700 °C.
Table 2 List of sintering conditions, density and phase quantification for all samples
Sample Temp (°C) Microwave conditions Density
(g/cm3) Peak height
ratio Equivalent vol%a
Er3Al5O12
BL 1400 No microwave 2.80 7.31 2.62
BL-HT 1700 No microwave 3.88 7.32 2.61
MM 1400 Multimode 2.93 7.30 2.62
SM-100:0 1400 Single mode 100%E:0%H 2.75 7.38 2.59
SM-60:40 1400 Single mode 60%E:40%H 2.64 7.69 2.45
SM-30:70 1400 Single mode 30%E:70%H 3.88 8.23 2.25 a Equivalent volume percent was calculated using calibration curves from Y3Al5O12/Al2O3 mixed-phase powders.
After sintering, XRD patterns were measured on sintered pellets and ground powder samples using a Rigaku MiniFlex powder XRD, and the spectra were analyzed using the commercial software, Jade 8. The peak heights of the (420) plane for the Er3Al5O12 phase and the (104) plane for the Al2O3 phase were carefully measured to determine relative second-phase content (also given in Table 2). Samples were prepared for electron microscopy by polishing down to 6 µm with successively finer diamond films. Following the mechanical polishing step, the samples were ion-polished using a Leica TIC 3X ion beam slope cutter on a rotary stage with a beam energy of 6 kV and a milling time of 1 h. Ion polishing was used to remove any residual surface scratches from mechanical polishing, and to ensure that the pores did not become filled in with polishing compounds, which would obscure the appearance of the microstructure. The ion polishing step was especially useful in preparing the lower density samples, which contain many pores. The sintered ceramic pellets were observed using either a Hitachi 4700 FESEM at 1.5 kV or an FEI Nova NanoSEM 600 using the low-vacuum option (80 Pa), which was equipped with an Oxford EDS system.
Figure 23 shows the XRD patterns for the starting (unsintered) powder as well as sample SM-30:70. The starting powder was composed primarily of α-Al2O3, with minor amounts of ErAlO3 and θ-Al2O3. The presence of ErAlO3 confirmed that the solubility of erbium had been exceeded, and that some erbium, even at the low calcination time and temperature, had been allowed to diffuse out of the lattice and form an Er-rich second phase. The SM-30:70 sample showed peaks corresponding to α-Al2O3 as well as Er3Al5O12. The inset showed the (420) plane for the Er3Al5O12

Approved for public release; distribution is unlimited.
30
phase and the (104) plane for the Al2O3 phase, which were used for phase content calculations.
Fig. 23 XRD patterns for calcined Er-doped Al2O3 powder and microwave sintered sample SM-30:70. The inset shows the (420) peak of the Er3Al5O12 phase and the (104) peak of the Al2O3 phase, which were used to determine the peak-height ratios given in Table 2.
To establish a baseline material, Er-doped Al2O3 powder was initially sintered using conventional (pressure-less) sintering (sample BL was sintered at 1400 °C for 2 h and sample BL-HT was sintered at 1650 °C for 5 h). As shown in Table 2, the density for BL was quite low at 2.80 g/cm3, which was approximately 70% of the theoretical density. Without the benefit of applied pressure or wet powder processing, this low density was not surprising. Most microwave-processed samples had similar densities. SM-60:40 and SM-100:0 had similar densities compared to the conventionally sintered sample, with the densities of these 2 microwave-sintered samples within 5% of the baseline sample. MM was slightly more dense (2.93 g/cm3). SM-30:70, however, was significantly more dense (3.88 g/cm3, or about 97% of the theoretical density of Al2O3). The density value of SM-30:70 was highly encouraging, as it was comparable to values achieved by hot-pressing Er-doped Al2O3 at 1350 °C. Therefore, by using the 30%E:70%H microwave sintering condition, the need for hot-pressing could potentially be eliminated, and the only compromise would be an increased sintering temperature of 50 °C (1350 °C to 1400 °C). In fact, SM-30:70 was similar in density to BL-HT despite the 250 °C difference in temperature. If it was assumed that BL-HT represented the maximum density possible within the sample set (as limited by the particular powder and particle packing characteristics), SM-30:70 achieved
Approved for public release; distribution is unlimited.
31
maximum density under thermal conditions that would otherwise produce 70% dense samples.
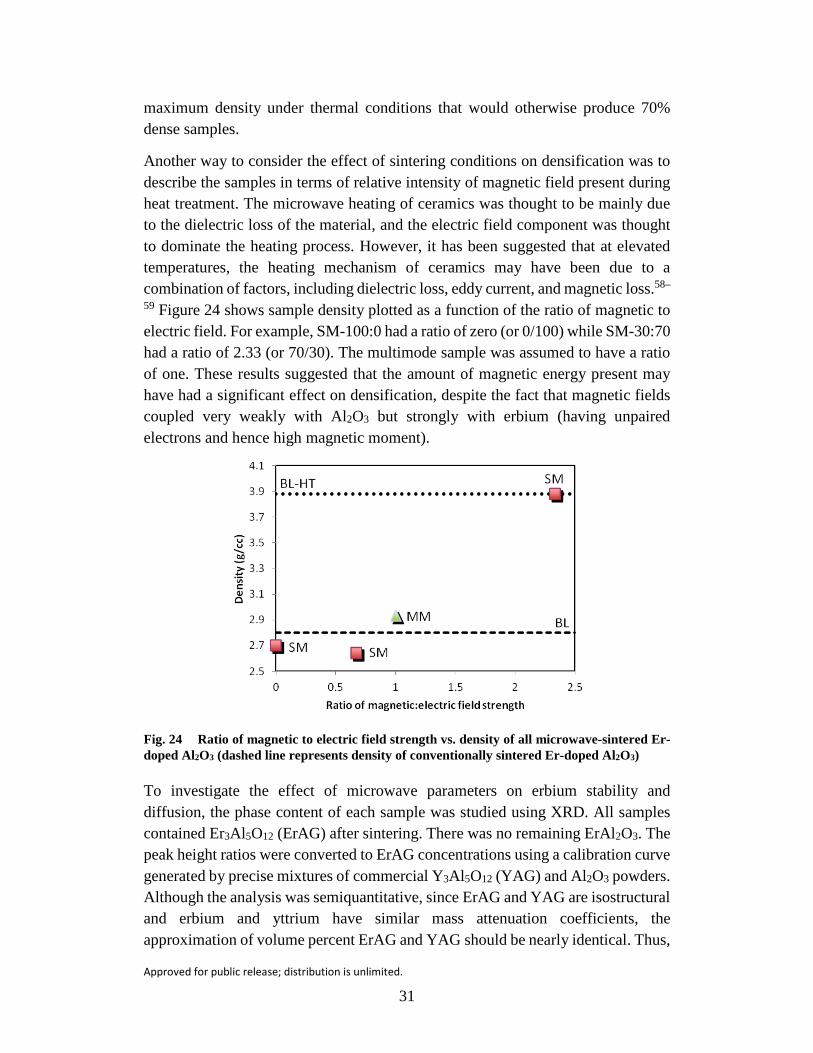
Another way to consider the effect of sintering conditions on densification was to describe the samples in terms of relative intensity of magnetic field present during heat treatment. The microwave heating of ceramics was thought to be mainly due to the dielectric loss of the material, and the electric field component was thought to dominate the heating process. However, it has been suggested that at elevated temperatures, the heating mechanism of ceramics may have been due to a combination of factors, including dielectric loss, eddy current, and magnetic loss.58–
59 Figure 24 shows sample density plotted as a function of the ratio of magnetic to electric field. For example, SM-100:0 had a ratio of zero (or 0/100) while SM-30:70 had a ratio of 2.33 (or 70/30). The multimode sample was assumed to have a ratio of one. These results suggested that the amount of magnetic energy present may have had a significant effect on densification, despite the fact that magnetic fields coupled very weakly with Al2O3 but strongly with erbium (having unpaired electrons and hence high magnetic moment).
Fig. 24 Ratio of magnetic to electric field strength vs. density of all microwave-sintered Er-doped Al2O3 (dashed line represents density of conventionally sintered Er-doped Al2O3)
To investigate the effect of microwave parameters on erbium stability and diffusion, the phase content of each sample was studied using XRD. All samples contained Er3Al5O12 (ErAG) after sintering. There was no remaining ErAl2O3. The peak height ratios were converted to ErAG concentrations using a calibration curve generated by precise mixtures of commercial Y3Al5O12 (YAG) and Al2O3 powders. Although the analysis was semiquantitative, since ErAG and YAG are isostructural and erbium and yttrium have similar mass attenuation coefficients, the approximation of volume percent ErAG and YAG should be nearly identical. Thus,

Approved for public release; distribution is unlimited.
32
the ErAG concentrations are referred to as equivalent concentrations, and these are indicated by an asterisk in Table 2.
While phase composition did not vary as widely as density across the sample set, there was still an observable effect. The baseline samples at both temperatures, as well as SM-100:0 and MM, were composed of approximately 2.6 volume percent ErAG. This amount of second-phase ErAG corresponded to an overall Er:Al cation ratio of approximately 0.54%, which matched the initial concentration quite well. This indicated that all Er in these samples had formed second-phase precipitates, and that very little, if any, remained in the crystal structure. The SM-30:70 sample had an ErAG concentration of 2.25, making it the most favorable for preventing erbium from diffusing out of the crystal structure. If the remaining erbium was still in solution within the Al2O3, approximately 0.08% Er doping was achieved. The phase composition data is shown in Fig. 25, and the equivalent volume percent of ErAG was plotted as a ratio of magnetic to electric field intensity. In this plot, the results suggested that increasing the magnetic component of the microwave field decreased second-phase formation.
Fig. 25 Ratio of magnetic to electric field vs. equivalent vol% of ErAG of all microwave sintered Er-doped Al2O3 (dashed line represents equivalent wt% of conventionally sintered Er-doped Al2O3)
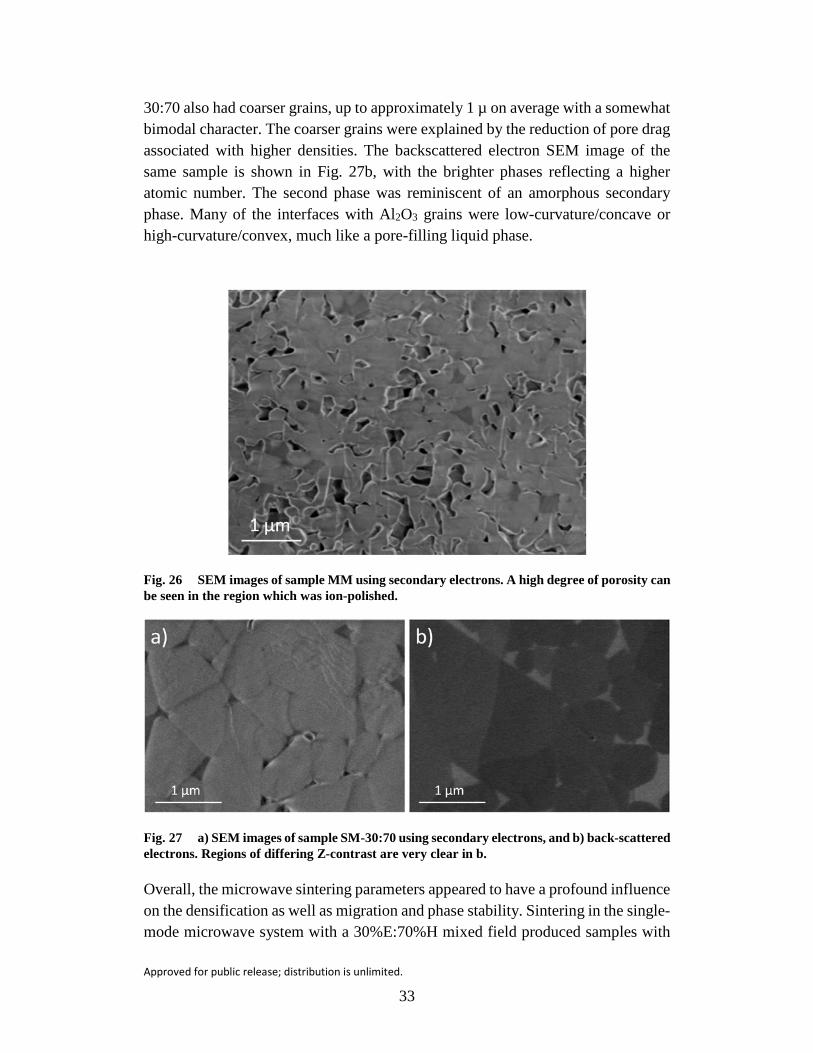
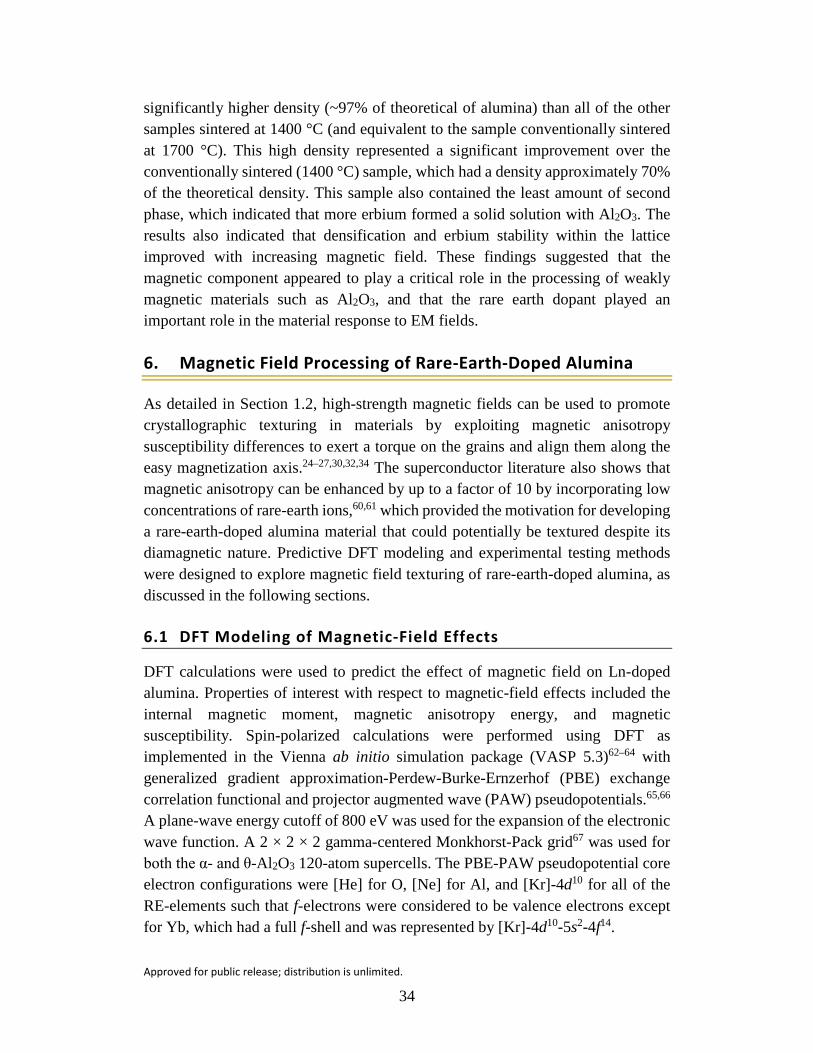
The microstructure of the MM sample is shown in Fig. 26. A high degree of porosity was observed, as suggested by the density results. The average grain size of the sample was approximately 250–300 nm, and the grain size distribution was very uniform. SEM micrographs of samples BL, SM-100:0, and SM-60:40 were all very similar to Fig. 26. The microstructure of SM-30:70, however, was quite different, as shown in Fig. 27. As observed in the secondary electron image of Fig. 27a, SM-30:70 had much less porosity, which confirmed the density results. SM-
Approved for public release; distribution is unlimited.
33
30:70 also had coarser grains, up to approximately 1 µ on average with a somewhat bimodal character. The coarser grains were explained by the reduction of pore drag associated with higher densities. The backscattered electron SEM image of the same sample is shown in Fig. 27b, with the brighter phases reflecting a higher atomic number. The second phase was reminiscent of an amorphous secondary phase. Many of the interfaces with Al2O3 grains were low-curvature/concave or high-curvature/convex, much like a pore-filling liquid phase.
Fig. 26 SEM images of sample MM using secondary electrons. A high degree of porosity can be seen in the region which was ion-polished.
Fig. 27 a) SEM images of sample SM-30:70 using secondary electrons, and b) back-scattered electrons. Regions of differing Z-contrast are very clear in b.
Overall, the microwave sintering parameters appeared to have a profound influence on the densification as well as migration and phase stability. Sintering in the single-mode microwave system with a 30%E:70%H mixed field produced samples with
Approved for public release; distribution is unlimited.
34
significantly higher density (~97% of theoretical of alumina) than all of the other samples sintered at 1400 °C (and equivalent to the sample conventionally sintered at 1700 °C). This high density represented a significant improvement over the conventionally sintered (1400 °C) sample, which had a density approximately 70% of the theoretical density. This sample also contained the least amount of second phase, which indicated that more erbium formed a solid solution with Al2O3. The results also indicated that densification and erbium stability within the lattice improved with increasing magnetic field. These findings suggested that the magnetic component appeared to play a critical role in the processing of weakly magnetic materials such as Al2O3, and that the rare earth dopant played an important role in the material response to EM fields.
6. Magnetic Field Processing of Rare-Earth-Doped Alumina
As detailed in Section 1.2, high-strength magnetic fields can be used to promote crystallographic texturing in materials by exploiting magnetic anisotropy susceptibility differences to exert a torque on the grains and align them along the easy magnetization axis.24–27,30,32,34 The superconductor literature also shows that magnetic anisotropy can be enhanced by up to a factor of 10 by incorporating low concentrations of rare-earth ions,60,61 which provided the motivation for developing a rare-earth-doped alumina material that could potentially be textured despite its diamagnetic nature. Predictive DFT modeling and experimental testing methods were designed to explore magnetic field texturing of rare-earth-doped alumina, as discussed in the following sections.
6.1 DFT Modeling of Magnetic-Field Effects
DFT calculations were used to predict the effect of magnetic field on Ln-doped alumina. Properties of interest with respect to magnetic-field effects included the internal magnetic moment, magnetic anisotropy energy, and magnetic susceptibility. Spin-polarized calculations were performed using DFT as implemented in the Vienna ab initio simulation package (VASP 5.3)62–64 with generalized gradient approximation-Perdew-Burke-Ernzerhof (PBE) exchange correlation functional and projector augmented wave (PAW) pseudopotentials.65,66 A plane-wave energy cutoff of 800 eV was used for the expansion of the electronic wave function. A 2 × 2 × 2 gamma-centered Monkhorst-Pack grid67 was used for both the α- and θ-Al2O3 120-atom supercells. The PBE-PAW pseudopotential core electron configurations were [He] for O, [Ne] for Al, and [Kr]-4d10 for all of the RE-elements such that f-electrons were considered to be valence electrons except for Yb, which had a full f-shell and was represented by [Kr]-4d10-5s2-4f14.
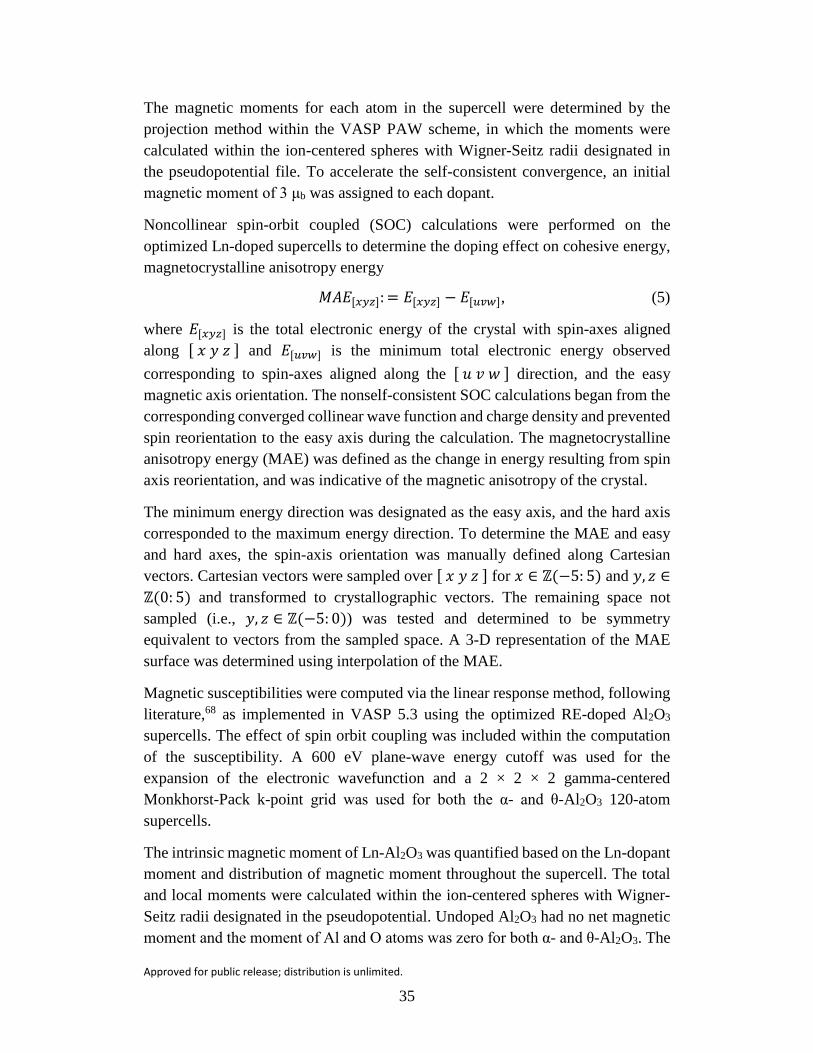
Approved for public release; distribution is unlimited.
35
The magnetic moments for each atom in the supercell were determined by the projection method within the VASP PAW scheme, in which the moments were calculated within the ion-centered spheres with Wigner-Seitz radii designated in the pseudopotential file. To accelerate the self-consistent convergence, an initial magnetic moment of 3 μb was assigned to each dopant.
Noncollinear spin-orbit coupled (SOC) calculations were performed on the optimized Ln-doped supercells to determine the doping effect on cohesive energy, magnetocrystalline anisotropy energy
𝑀𝑀𝑀𝑀𝐸𝐸[𝑥𝑥𝑥𝑥𝑥𝑥]: = 𝐸𝐸[𝑥𝑥𝑥𝑥𝑥𝑥] − 𝐸𝐸[𝑢𝑢𝑢𝑢𝑢𝑢], (5)
where 𝐸𝐸[𝑥𝑥𝑥𝑥𝑥𝑥] is the total electronic energy of the crystal with spin-axes aligned along [ 𝑥𝑥 𝑦𝑦 𝑧𝑧 ] and 𝐸𝐸[𝑢𝑢𝑢𝑢𝑢𝑢] is the minimum total electronic energy observed corresponding to spin-axes aligned along the [ 𝑢𝑢 𝑣𝑣 𝑤𝑤 ] direction, and the easy magnetic axis orientation. The nonself-consistent SOC calculations began from the corresponding converged collinear wave function and charge density and prevented spin reorientation to the easy axis during the calculation. The magnetocrystalline anisotropy energy (MAE) was defined as the change in energy resulting from spin axis reorientation, and was indicative of the magnetic anisotropy of the crystal.
The minimum energy direction was designated as the easy axis, and the hard axis corresponded to the maximum energy direction. To determine the MAE and easy and hard axes, the spin-axis orientation was manually defined along Cartesian vectors. Cartesian vectors were sampled over [ 𝑥𝑥 𝑦𝑦 𝑧𝑧 ] for 𝑥𝑥 ∈ ℤ(−5: 5) and 𝑦𝑦, 𝑧𝑧 ∈ℤ(0: 5) and transformed to crystallographic vectors. The remaining space not sampled (i.e., 𝑦𝑦, 𝑧𝑧 ∈ ℤ(−5: 0)) was tested and determined to be symmetry equivalent to vectors from the sampled space. A 3-D representation of the MAE surface was determined using interpolation of the MAE.
Magnetic susceptibilities were computed via the linear response method, following literature,68 as implemented in VASP 5.3 using the optimized RE-doped Al2O3 supercells. The effect of spin orbit coupling was included within the computation of the susceptibility. A 600 eV plane-wave energy cutoff was used for the expansion of the electronic wavefunction and a 2 × 2 × 2 gamma-centered Monkhorst-Pack k-point grid was used for both the α- and θ-Al2O3 120-atom supercells.
The intrinsic magnetic moment of Ln-Al2O3 was quantified based on the Ln-dopant moment and distribution of magnetic moment throughout the supercell. The total and local moments were calculated within the ion-centered spheres with Wigner-Seitz radii designated in the pseudopotential. Undoped Al2O3 had no net magnetic moment and the moment of Al and O atoms was zero for both α- and θ-Al2O3. The
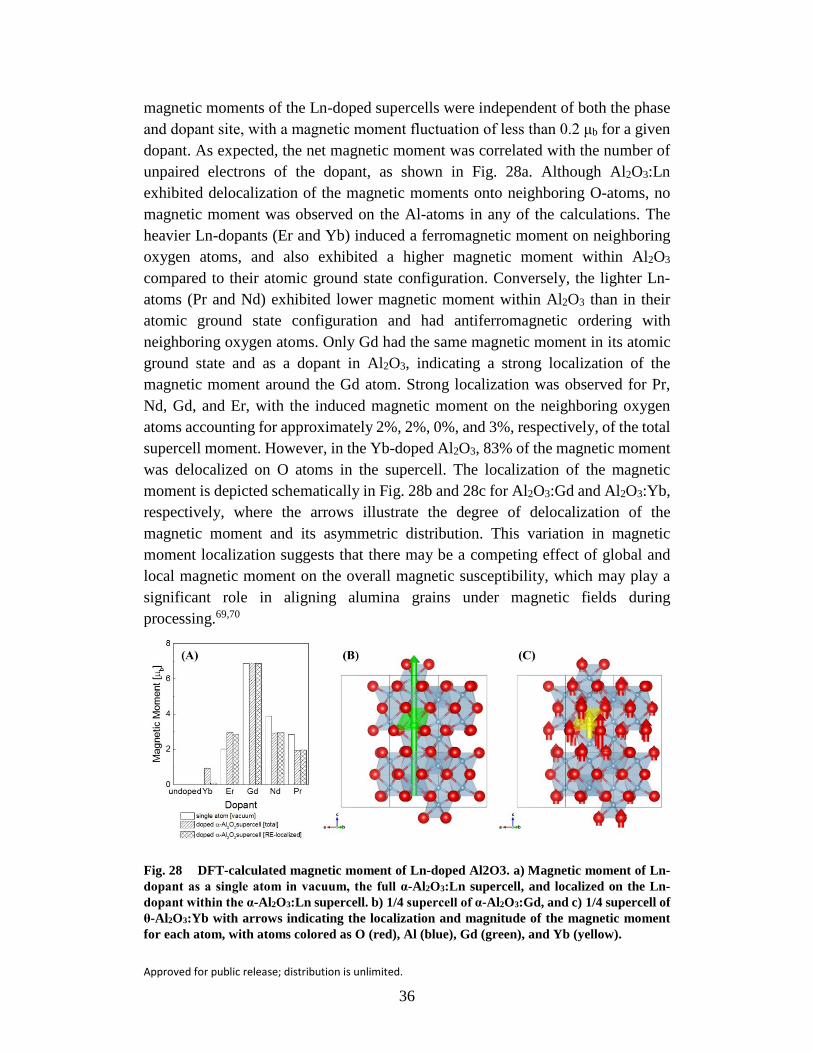
Approved for public release; distribution is unlimited.
36
magnetic moments of the Ln-doped supercells were independent of both the phase and dopant site, with a magnetic moment fluctuation of less than 0.2 μb for a given dopant. As expected, the net magnetic moment was correlated with the number of unpaired electrons of the dopant, as shown in Fig. 28a. Although Al2O3:Ln exhibited delocalization of the magnetic moments onto neighboring O-atoms, no magnetic moment was observed on the Al-atoms in any of the calculations. The heavier Ln-dopants (Er and Yb) induced a ferromagnetic moment on neighboring oxygen atoms, and also exhibited a higher magnetic moment within Al2O3 compared to their atomic ground state configuration. Conversely, the lighter Ln-atoms (Pr and Nd) exhibited lower magnetic moment within Al2O3 than in their atomic ground state configuration and had antiferromagnetic ordering with neighboring oxygen atoms. Only Gd had the same magnetic moment in its atomic ground state and as a dopant in Al2O3, indicating a strong localization of the magnetic moment around the Gd atom. Strong localization was observed for Pr, Nd, Gd, and Er, with the induced magnetic moment on the neighboring oxygen atoms accounting for approximately 2%, 2%, 0%, and 3%, respectively, of the total supercell moment. However, in the Yb-doped Al2O3, 83% of the magnetic moment was delocalized on O atoms in the supercell. The localization of the magnetic moment is depicted schematically in Fig. 28b and 28c for Al2O3:Gd and Al2O3:Yb, respectively, where the arrows illustrate the degree of delocalization of the magnetic moment and its asymmetric distribution. This variation in magnetic moment localization suggests that there may be a competing effect of global and local magnetic moment on the overall magnetic susceptibility, which may play a significant role in aligning alumina grains under magnetic fields during processing.69,70
Fig. 28 DFT-calculated magnetic moment of Ln-doped Al2O3. a) Magnetic moment of Ln-dopant as a single atom in vacuum, the full α-Al2O3:Ln supercell, and localized on the Ln-dopant within the α-Al2O3:Ln supercell. b) 1/4 supercell of α-Al2O3:Gd, and c) 1/4 supercell of θ-Al2O3:Yb with arrows indicating the localization and magnitude of the magnetic moment for each atom, with atoms colored as O (red), Al (blue), Gd (green), and Yb (yellow).
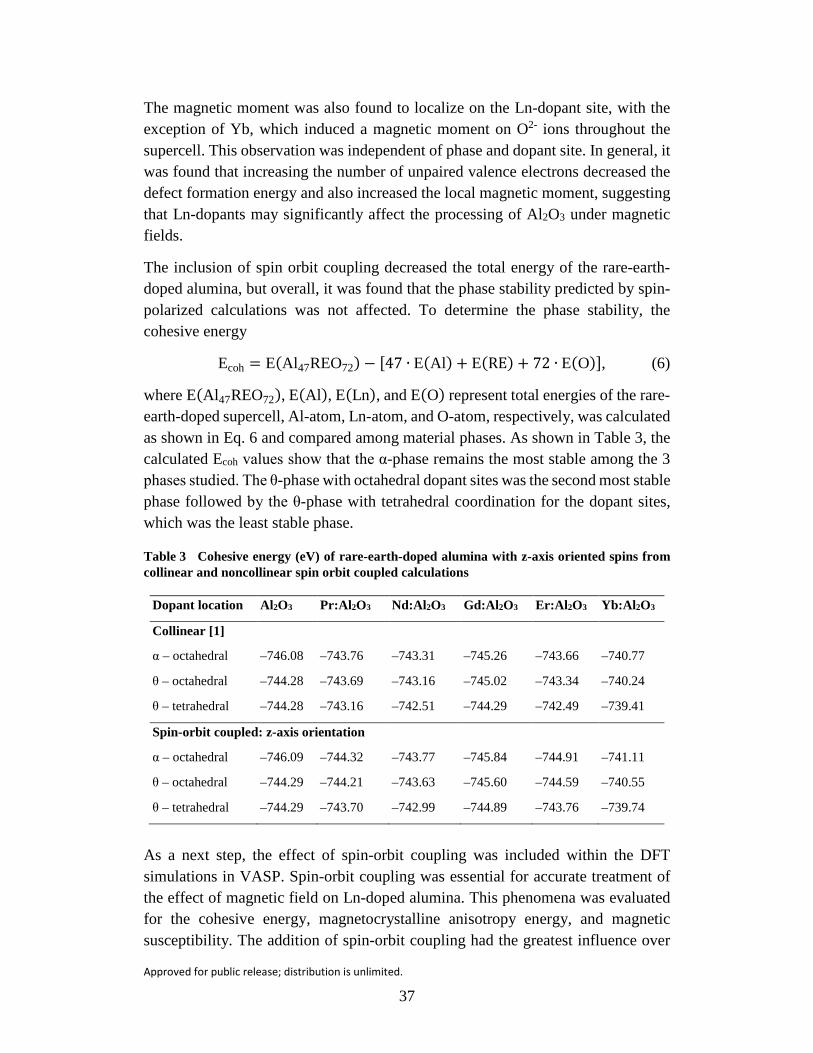
Approved for public release; distribution is unlimited.
37
The magnetic moment was also found to localize on the Ln-dopant site, with the exception of Yb, which induced a magnetic moment on O2- ions throughout the supercell. This observation was independent of phase and dopant site. In general, it was found that increasing the number of unpaired valence electrons decreased the defect formation energy and also increased the local magnetic moment, suggesting that Ln-dopants may significantly affect the processing of Al2O3 under magnetic fields.
The inclusion of spin orbit coupling decreased the total energy of the rare-earth-doped alumina, but overall, it was found that the phase stability predicted by spin-polarized calculations was not affected. To determine the phase stability, the cohesive energy
Ecoh = E(Al47REO72) − [47 ∙ E(Al) + E(RE) + 72 ∙ E(O)], (6)
where E(Al47REO72), E(Al), E(Ln), and E(O) represent total energies of the rare-earth-doped supercell, Al-atom, Ln-atom, and O-atom, respectively, was calculated as shown in Eq. 6 and compared among material phases. As shown in Table 3, the calculated Ecoh values show that the α-phase remains the most stable among the 3 phases studied. The θ-phase with octahedral dopant sites was the second most stable phase followed by the θ-phase with tetrahedral coordination for the dopant sites, which was the least stable phase.
Table 3 Cohesive energy (eV) of rare-earth-doped alumina with z-axis oriented spins from collinear and noncollinear spin orbit coupled calculations
Dopant location Al2O3 Pr:Al2O3 Nd:Al2O3 Gd:Al2O3 Er:Al2O3 Yb:Al2O3
Collinear [1]
α – octahedral –746.08 –743.76 –743.31 –745.26 –743.66 –740.77
θ – octahedral –744.28 –743.69 –743.16 –745.02 –743.34 –740.24
θ – tetrahedral –744.28 –743.16 –742.51 –744.29 –742.49 –739.41
Spin-orbit coupled: z-axis orientation
α – octahedral –746.09 –744.32 –743.77 –745.84 –744.91 –741.11
θ – octahedral –744.29 –744.21 –743.63 –745.60 –744.59 –740.55
θ – tetrahedral –744.29 –743.70 –742.99 –744.89 –743.76 –739.74
As a next step, the effect of spin-orbit coupling was included within the DFT simulations in VASP. Spin-orbit coupling was essential for accurate treatment of the effect of magnetic field on Ln-doped alumina. This phenomena was evaluated for the cohesive energy, magnetocrystalline anisotropy energy, and magnetic susceptibility. The addition of spin-orbit coupling had the greatest influence over

Approved for public release; distribution is unlimited.
38
the energetic contribution of the rare-earth dopant. The change in energy as a function of SOC for each alumina phase and dopant are given in Table 4. In general, it was the dopant type, rather than alumina phase, which had a much more significant effect on the energetic contribution to the SOC. Er-dopant had the largest energetic gain, which was double the next highest candidate dopant, Gd. For consistency, these results are also shown in Figs. 29–32.
Table 4 Energetic contribution (eV) of the rare-earth dopant spin-orbit coupling for z-axis oriented spins from nonself-consistent calculations
Dopant location Al2O3 Pr:Al2O3 Nd:Al2O3 Gd:Al2O3 Er:Al2O3 Yb:Al2O3
α – octahedral 0.00 –1.07 –0.90 –1.15 –2.26 –0.64
θ – octahedral 0.00 –1.04 –0.90 –1.14 –2.28 –0.59
θ – tetrahedral 0.00 –1.06 –0.93 –1.17 –2.30 –0.63
Fig. 29 Collinear vs. noncollinear spin-orbit coupled cohesive energy for α-phase RE-doped and undoped alumina

Approved for public release; distribution is unlimited.
39
Fig. 30 Collinear vs. noncollinear spin-orbit coupled cohesive energy for θ-phase (octahedral site) RE-doped alumina
Fig. 31 Collinear vs. noncollinear spin-orbit coupled cohesive energy for θ-phase (tetrahedral site) RE-doped and undoped alumina
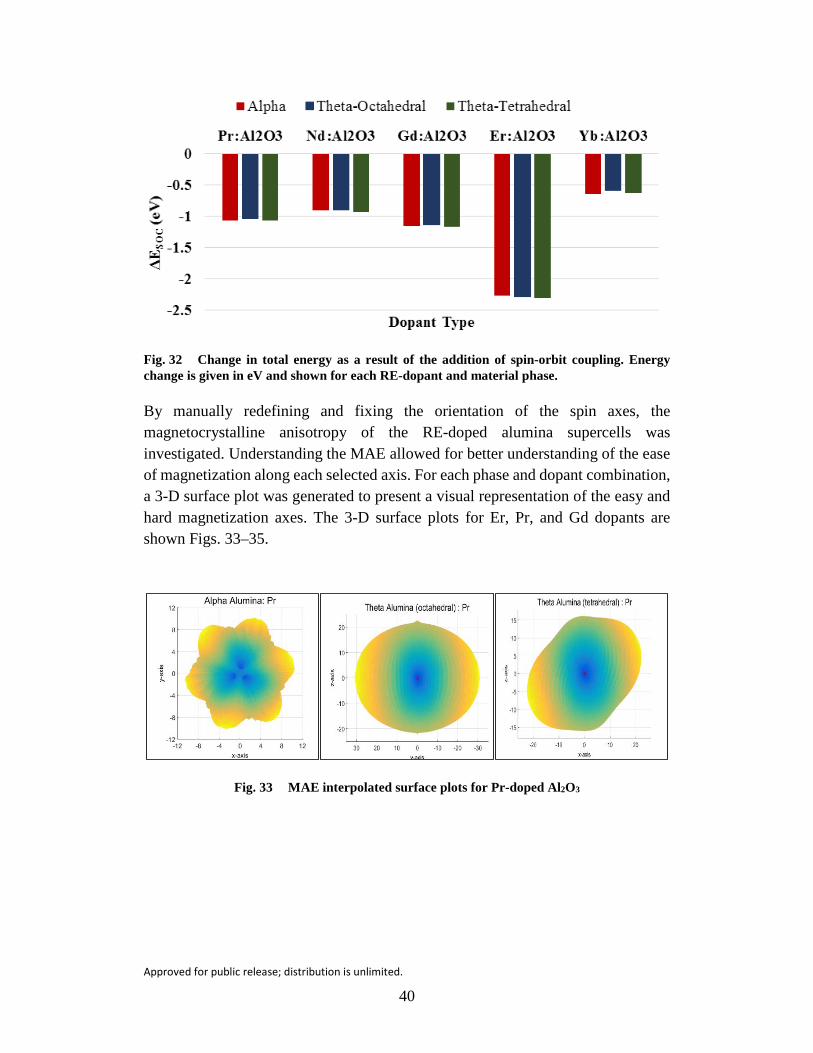
Approved for public release; distribution is unlimited.
40
Fig. 32 Change in total energy as a result of the addition of spin-orbit coupling. Energy change is given in eV and shown for each RE-dopant and material phase.
By manually redefining and fixing the orientation of the spin axes, the magnetocrystalline anisotropy of the RE-doped alumina supercells was investigated. Understanding the MAE allowed for better understanding of the ease of magnetization along each selected axis. For each phase and dopant combination, a 3-D surface plot was generated to present a visual representation of the easy and hard magnetization axes. The 3-D surface plots for Er, Pr, and Gd dopants are shown Figs. 33–35.
Fig. 33 MAE interpolated surface plots for Pr-doped Al2O3

Approved for public release; distribution is unlimited.
41
Fig. 34 MAE interpolated surface plots for Er-doped Al2O3
Fig. 35 MAE interpolated surface plots for Gd-doped Al2O3
The MAE and easy axis were affected by the dopant site and phase as shown in Table 5, though the total magnetic moment remained consistent for a given dopant type. The largest anisotropy was generally observed for Er followed by Pr, with Gd having the smallest anisotropy despite having the largest magnetic moment. The Θ-Al2O3 was more magnetically anisotropic than α-Al2O3 and this effect was most pronounced for Pr-doped Al2O3, which had a 3-fold increase in MAE. Additionally, the easy axis was dependent on the dopant type. In α-Al2O3, both Gd and Yb maintained easy axes near to easy axis of undoped α-Al2O3, the c-axis.
Table 5 DFT calculated easy magnetic axis and maximal MAE (meV) indicating degree of magnetic anisotropy in the Ln-doped supercell for Ln-dopants in the Al-octahedral site of α- and θ-Al2O3
Yb:Al2O3 Er:Al2O3 Gd:Al2O3 Pr:Al2O3
α-Al2O3 < 3 2 10 > < 1 2 0 > < 0 0 1 > < 2 3 2 >
6.1 23.1 0.4 11.0
θ-Al2O3 < 3 0 1 > < –4 3 4 > < 1 0 20 > < 1 0 0 >
0.5 31.3 0.4 30.9
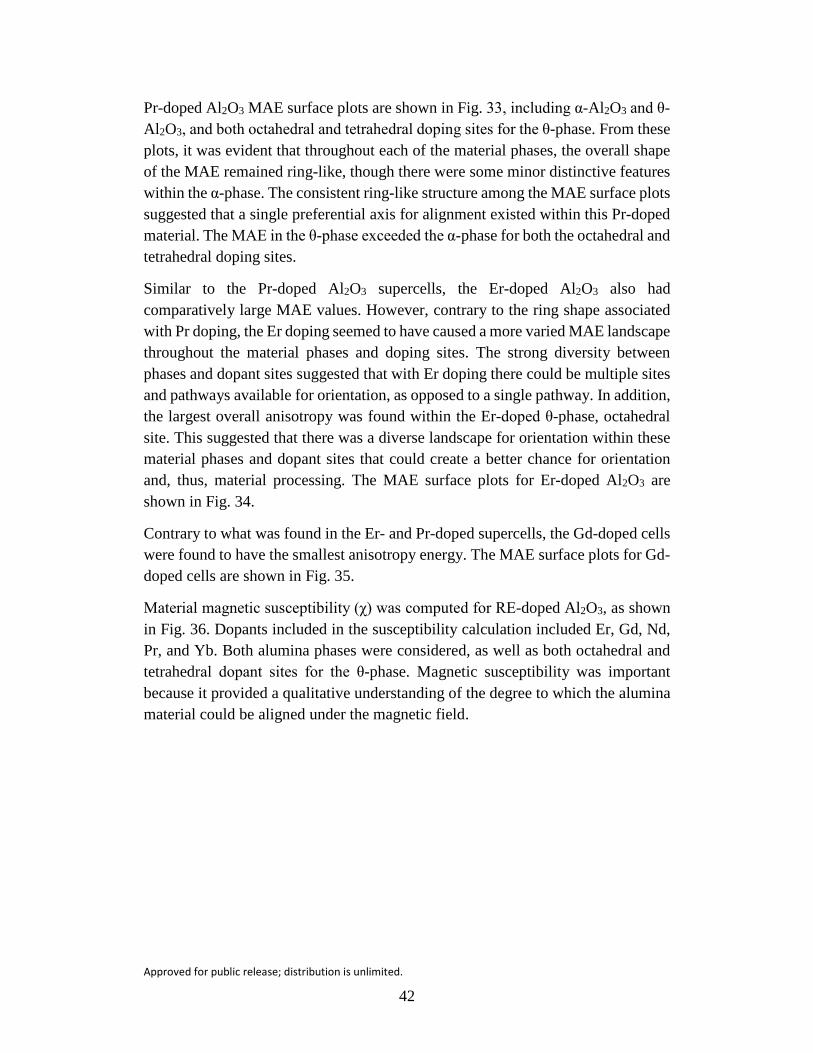
Approved for public release; distribution is unlimited.
42
Pr-doped Al2O3 MAE surface plots are shown in Fig. 33, including α-Al2O3 and θ-Al2O3, and both octahedral and tetrahedral doping sites for the θ-phase. From these plots, it was evident that throughout each of the material phases, the overall shape of the MAE remained ring-like, though there were some minor distinctive features within the α-phase. The consistent ring-like structure among the MAE surface plots suggested that a single preferential axis for alignment existed within this Pr-doped material. The MAE in the θ-phase exceeded the α-phase for both the octahedral and tetrahedral doping sites.
Similar to the Pr-doped Al2O3 supercells, the Er-doped Al2O3 also had comparatively large MAE values. However, contrary to the ring shape associated with Pr doping, the Er doping seemed to have caused a more varied MAE landscape throughout the material phases and doping sites. The strong diversity between phases and dopant sites suggested that with Er doping there could be multiple sites and pathways available for orientation, as opposed to a single pathway. In addition, the largest overall anisotropy was found within the Er-doped θ-phase, octahedral site. This suggested that there was a diverse landscape for orientation within these material phases and dopant sites that could create a better chance for orientation and, thus, material processing. The MAE surface plots for Er-doped Al2O3 are shown in Fig. 34.
Contrary to what was found in the Er- and Pr-doped supercells, the Gd-doped cells were found to have the smallest anisotropy energy. The MAE surface plots for Gd-doped cells are shown in Fig. 35.
Material magnetic susceptibility (χ) was computed for RE-doped Al2O3, as shown in Fig. 36. Dopants included in the susceptibility calculation included Er, Gd, Nd, Pr, and Yb. Both alumina phases were considered, as well as both octahedral and tetrahedral dopant sites for the θ-phase. Magnetic susceptibility was important because it provided a qualitative understanding of the degree to which the alumina material could be aligned under the magnetic field.
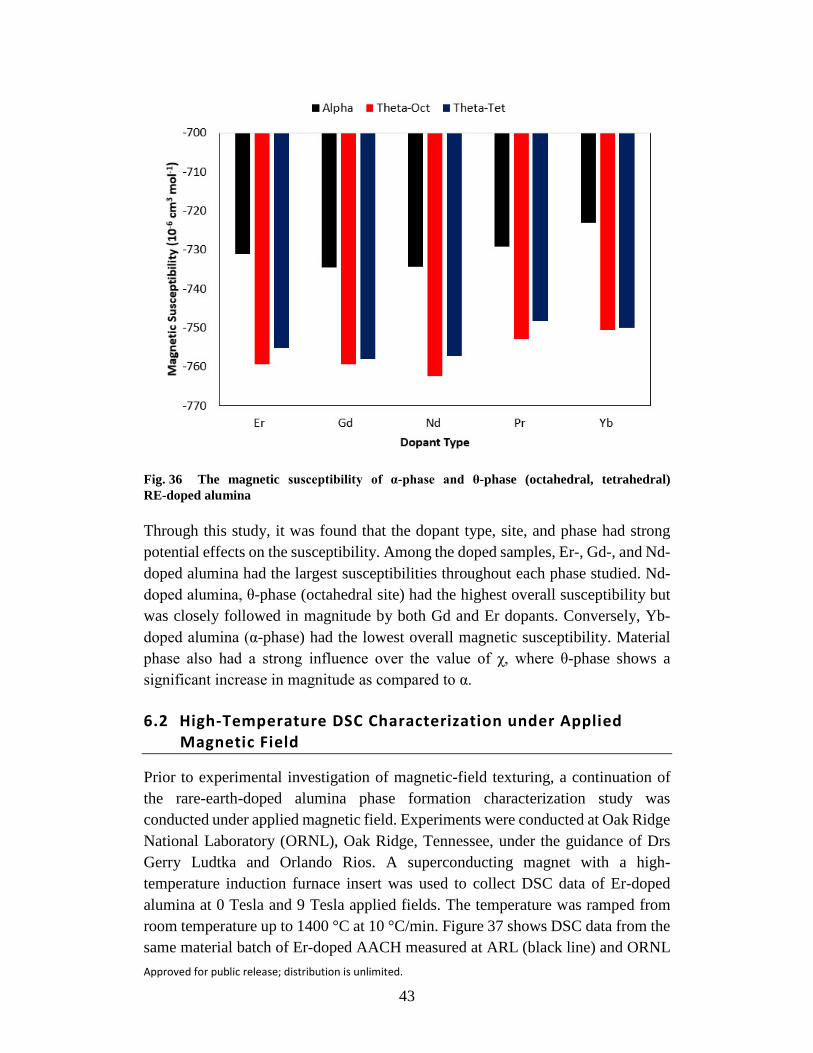
Approved for public release; distribution is unlimited.
43
Fig. 36 The magnetic susceptibility of α-phase and θ-phase (octahedral, tetrahedral) RE-doped alumina
Through this study, it was found that the dopant type, site, and phase had strong potential effects on the susceptibility. Among the doped samples, Er-, Gd-, and Nd-doped alumina had the largest susceptibilities throughout each phase studied. Nd-doped alumina, θ-phase (octahedral site) had the highest overall susceptibility but was closely followed in magnitude by both Gd and Er dopants. Conversely, Yb-doped alumina (α-phase) had the lowest overall magnetic susceptibility. Material phase also had a strong influence over the value of χ, where θ-phase shows a significant increase in magnitude as compared to α.
6.2 High-Temperature DSC Characterization under Applied Magnetic Field
Prior to experimental investigation of magnetic-field texturing, a continuation of the rare-earth-doped alumina phase formation characterization study was conducted under applied magnetic field. Experiments were conducted at Oak Ridge National Laboratory (ORNL), Oak Ridge, Tennessee, under the guidance of Drs Gerry Ludtka and Orlando Rios. A superconducting magnet with a high-temperature induction furnace insert was used to collect DSC data of Er-doped alumina at 0 Tesla and 9 Tesla applied fields. The temperature was ramped from room temperature up to 1400 °C at 10 °C/min. Figure 37 shows DSC data from the same material batch of Er-doped AACH measured at ARL (black line) and ORNL
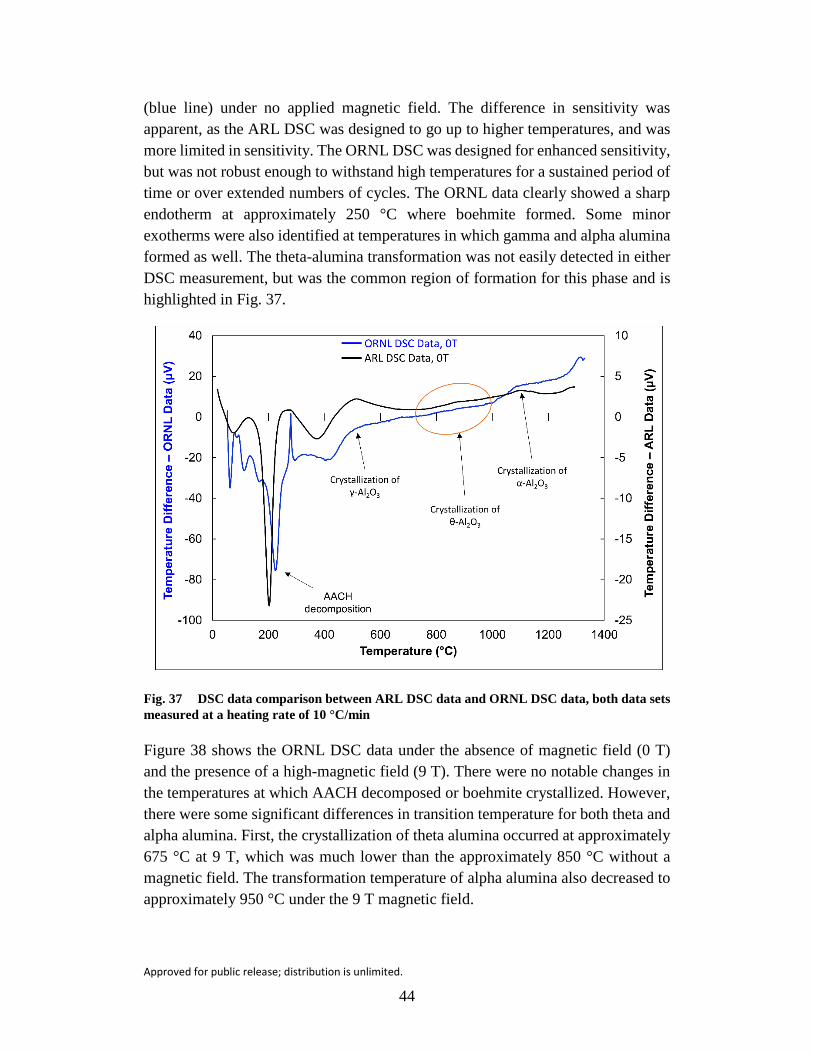
Approved for public release; distribution is unlimited.
44
(blue line) under no applied magnetic field. The difference in sensitivity was apparent, as the ARL DSC was designed to go up to higher temperatures, and was more limited in sensitivity. The ORNL DSC was designed for enhanced sensitivity, but was not robust enough to withstand high temperatures for a sustained period of time or over extended numbers of cycles. The ORNL data clearly showed a sharp endotherm at approximately 250 °C where boehmite formed. Some minor exotherms were also identified at temperatures in which gamma and alpha alumina formed as well. The theta-alumina transformation was not easily detected in either DSC measurement, but was the common region of formation for this phase and is highlighted in Fig. 37.
Fig. 37 DSC data comparison between ARL DSC data and ORNL DSC data, both data sets measured at a heating rate of 10 °C/min
Figure 38 shows the ORNL DSC data under the absence of magnetic field (0 T) and the presence of a high-magnetic field (9 T). There were no notable changes in the temperatures at which AACH decomposed or boehmite crystallized. However, there were some significant differences in transition temperature for both theta and alpha alumina. First, the crystallization of theta alumina occurred at approximately 675 °C at 9 T, which was much lower than the approximately 850 °C without a magnetic field. The transformation temperature of alpha alumina also decreased to approximately 950 °C under the 9 T magnetic field.
Approved for public release; distribution is unlimited.
45
Fig. 38 DSC data collected at ORNL at both 0 T and 9 T magnetic field, both data sets measured at a heating rate of 10 °C/min
It was theorized that the magnetic moment residing in the erbium affected the local strain when the material was under the applied-magnetic field, which influenced the driving force for phase transformation. Generally, the magnetic field was satisfying the endothermic energy requirement for crystallization. It was possible that a similar behavior could occur in the other rare-earth dopants, but previous DFT modeling and characterization of Er-doped alumina indicated that erbium would have the strongest influence under the applied-magnetic field. The small but notable difference in transformation temperature that was observed upon rare-earth doping in Section 3 had been significantly enhanced under the influence of a high-strength 9 T magnetic field.
6.3 Magnetic Field Texturing of Epoxy Samples
Experiments were set up to determine the effects of magnetic fields over crystallographic texturing of rare-earth-doped alumina materials. The critical parameters detailed in Section 1.2 were referenced during the design of experiments. One point of emphasis was that a low-viscosity casting system would be required to allow the grains to rotate in response to the magnetic field before stiffening or hardening to lock the textured condition in place.71 For this reason, epoxy was selected as a test matrix for running initial experiments before switching to a gel-casting process for final development of the rare-earth-doped samples. The
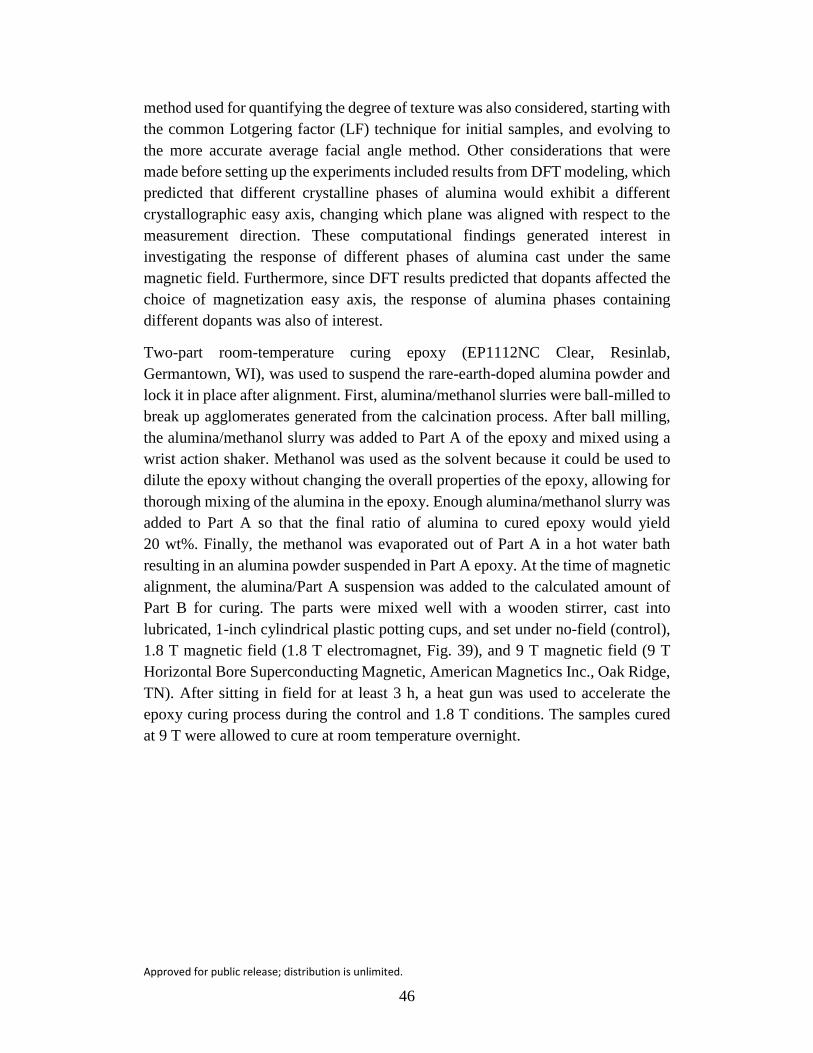
Approved for public release; distribution is unlimited.
46
method used for quantifying the degree of texture was also considered, starting with the common Lotgering factor (LF) technique for initial samples, and evolving to the more accurate average facial angle method. Other considerations that were made before setting up the experiments included results from DFT modeling, which predicted that different crystalline phases of alumina would exhibit a different crystallographic easy axis, changing which plane was aligned with respect to the measurement direction. These computational findings generated interest in investigating the response of different phases of alumina cast under the same magnetic field. Furthermore, since DFT results predicted that dopants affected the choice of magnetization easy axis, the response of alumina phases containing different dopants was also of interest.
Two-part room-temperature curing epoxy (EP1112NC Clear, Resinlab, Germantown, WI), was used to suspend the rare-earth-doped alumina powder and lock it in place after alignment. First, alumina/methanol slurries were ball-milled to break up agglomerates generated from the calcination process. After ball milling, the alumina/methanol slurry was added to Part A of the epoxy and mixed using a wrist action shaker. Methanol was used as the solvent because it could be used to dilute the epoxy without changing the overall properties of the epoxy, allowing for thorough mixing of the alumina in the epoxy. Enough alumina/methanol slurry was added to Part A so that the final ratio of alumina to cured epoxy would yield 20 wt%. Finally, the methanol was evaporated out of Part A in a hot water bath resulting in an alumina powder suspended in Part A epoxy. At the time of magnetic alignment, the alumina/Part A suspension was added to the calculated amount of Part B for curing. The parts were mixed well with a wooden stirrer, cast into lubricated, 1-inch cylindrical plastic potting cups, and set under no-field (control), 1.8 T magnetic field (1.8 T electromagnet, Fig. 39), and 9 T magnetic field (9 T Horizontal Bore Superconducting Magnetic, American Magnetics Inc., Oak Ridge, TN). After sitting in field for at least 3 h, a heat gun was used to accelerate the epoxy curing process during the control and 1.8 T conditions. The samples cured at 9 T were allowed to cure at room temperature overnight.
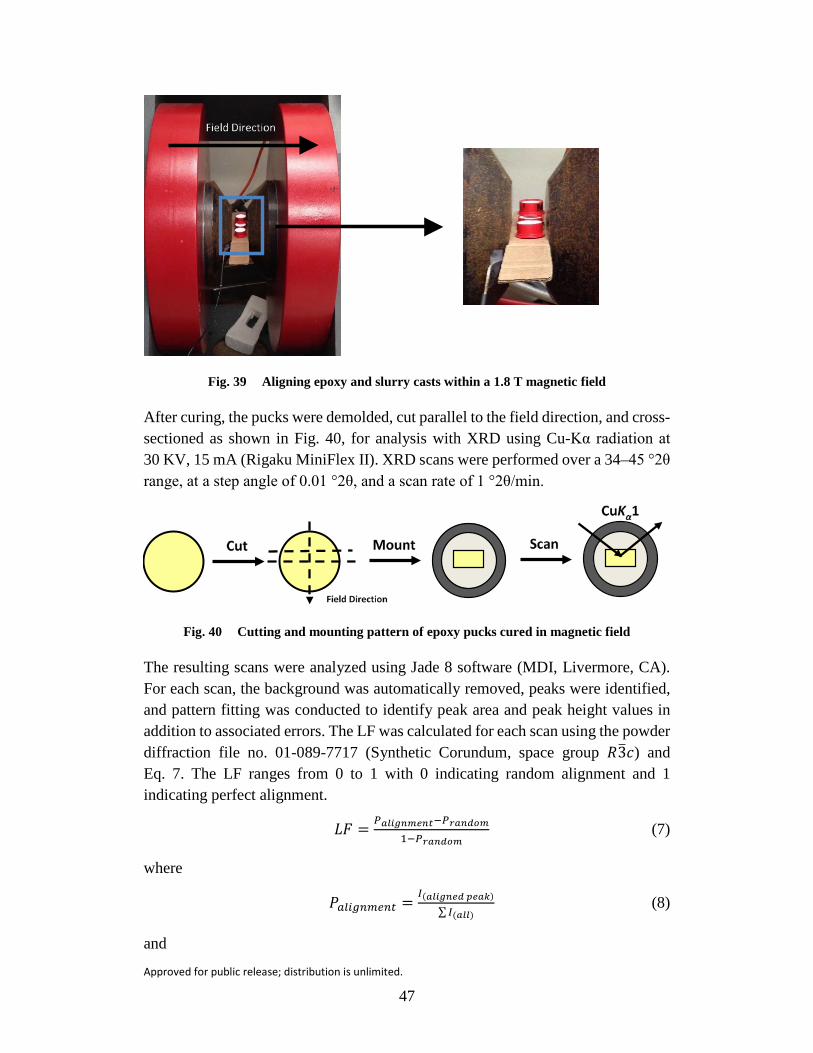
Approved for public release; distribution is unlimited.
47
Fig. 39 Aligning epoxy and slurry casts within a 1.8 T magnetic field
After curing, the pucks were demolded, cut parallel to the field direction, and cross-sectioned as shown in Fig. 40, for analysis with XRD using Cu-Κα radiation at 30 KV, 15 mA (Rigaku MiniFlex II). XRD scans were performed over a 34–45 °2θ range, at a step angle of 0.01 °2θ, and a scan rate of 1 °2θ/min.
Fig. 40 Cutting and mounting pattern of epoxy pucks cured in magnetic field
The resulting scans were analyzed using Jade 8 software (MDI, Livermore, CA). For each scan, the background was automatically removed, peaks were identified, and pattern fitting was conducted to identify peak area and peak height values in addition to associated errors. The LF was calculated for each scan using the powder diffraction file no. 01-089-7717 (Synthetic Corundum, space group 𝑅𝑅3�𝑐𝑐) and Eq. 7. The LF ranges from 0 to 1 with 0 indicating random alignment and 1 indicating perfect alignment.
𝐿𝐿𝐿𝐿 = 𝑃𝑃𝑎𝑎𝑎𝑎𝑎𝑎𝑎𝑎𝑎𝑎𝑎𝑎𝑎𝑎𝑎𝑎𝑎𝑎−𝑃𝑃𝑟𝑟𝑎𝑎𝑎𝑎𝑟𝑟𝑟𝑟𝑎𝑎1−𝑃𝑃𝑟𝑟𝑎𝑎𝑎𝑎𝑟𝑟𝑟𝑟𝑎𝑎
(7)
where
𝑃𝑃𝑎𝑎𝑎𝑎𝑎𝑎𝑎𝑎𝑡𝑡𝑎𝑎𝑎𝑎𝑡𝑡𝑡𝑡 =𝐼𝐼(𝑎𝑎𝑎𝑎𝑎𝑎𝑎𝑎𝑎𝑎𝑎𝑎𝑟𝑟 𝑝𝑝𝑎𝑎𝑎𝑎𝑝𝑝)
∑ 𝐼𝐼(𝑎𝑎𝑎𝑎𝑎𝑎) (8)
and
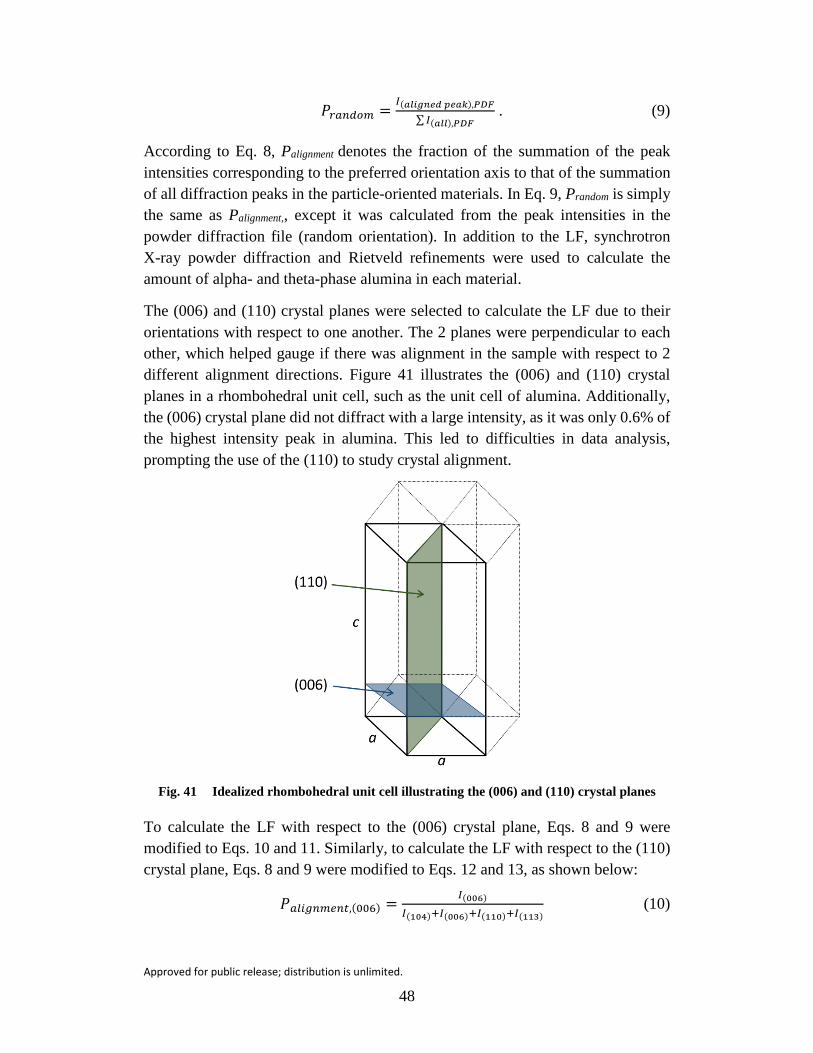
Approved for public release; distribution is unlimited.
48
𝑃𝑃𝑟𝑟𝑎𝑎𝑡𝑡𝑟𝑟𝑟𝑟𝑎𝑎 =𝐼𝐼(𝑎𝑎𝑎𝑎𝑎𝑎𝑎𝑎𝑎𝑎𝑎𝑎𝑟𝑟 𝑝𝑝𝑎𝑎𝑎𝑎𝑝𝑝),𝑃𝑃𝑃𝑃𝑃𝑃
∑ 𝐼𝐼(𝑎𝑎𝑎𝑎𝑎𝑎),𝑃𝑃𝑃𝑃𝑃𝑃 . (9)
According to Eq. 8, Palignment denotes the fraction of the summation of the peak intensities corresponding to the preferred orientation axis to that of the summation of all diffraction peaks in the particle-oriented materials. In Eq. 9, Prandom is simply the same as Palignment,, except it was calculated from the peak intensities in the powder diffraction file (random orientation). In addition to the LF, synchrotron X-ray powder diffraction and Rietveld refinements were used to calculate the amount of alpha- and theta-phase alumina in each material.
The (006) and (110) crystal planes were selected to calculate the LF due to their orientations with respect to one another. The 2 planes were perpendicular to each other, which helped gauge if there was alignment in the sample with respect to 2 different alignment directions. Figure 41 illustrates the (006) and (110) crystal planes in a rhombohedral unit cell, such as the unit cell of alumina. Additionally, the (006) crystal plane did not diffract with a large intensity, as it was only 0.6% of the highest intensity peak in alumina. This led to difficulties in data analysis, prompting the use of the (110) to study crystal alignment.
Fig. 41 Idealized rhombohedral unit cell illustrating the (006) and (110) crystal planes
To calculate the LF with respect to the (006) crystal plane, Eqs. 8 and 9 were modified to Eqs. 10 and 11. Similarly, to calculate the LF with respect to the (110) crystal plane, Eqs. 8 and 9 were modified to Eqs. 12 and 13, as shown below:
𝑃𝑃𝑎𝑎𝑎𝑎𝑎𝑎𝑎𝑎𝑡𝑡𝑎𝑎𝑎𝑎𝑡𝑡𝑡𝑡,(006) = 𝐼𝐼(006)
𝐼𝐼(104)+𝐼𝐼(006)+𝐼𝐼(110)+𝐼𝐼(113) (10)
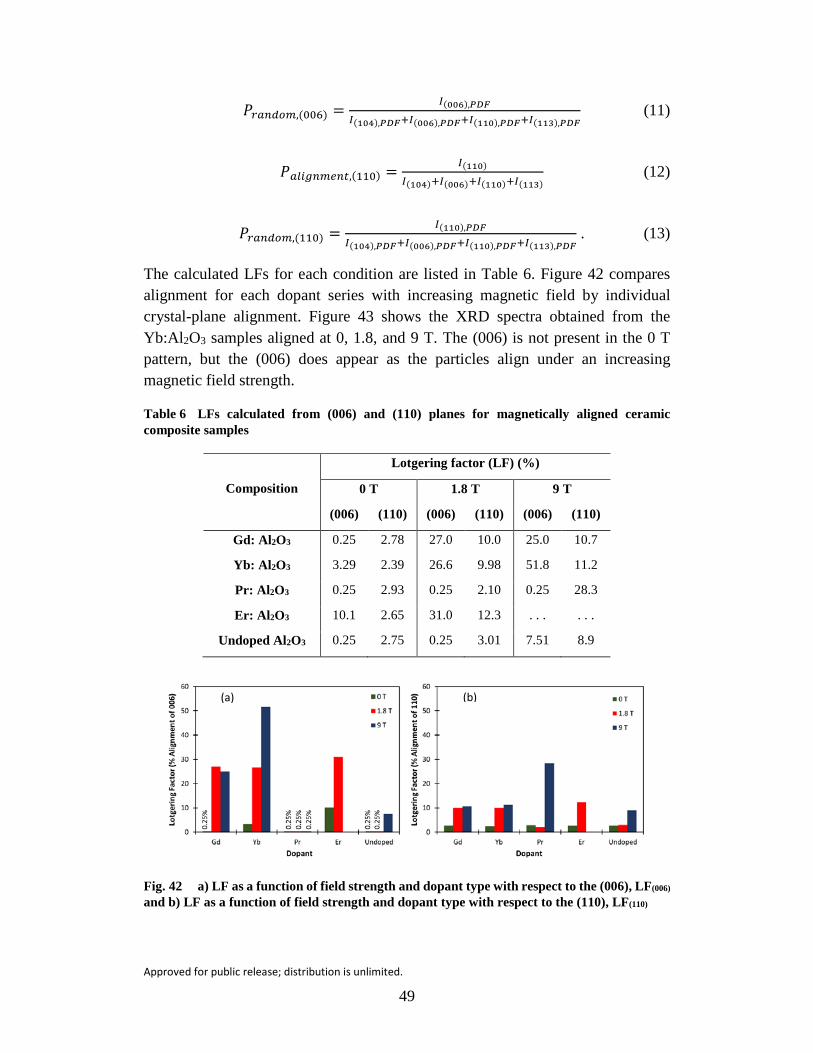
Approved for public release; distribution is unlimited.
49
𝑃𝑃𝑟𝑟𝑎𝑎𝑡𝑡𝑟𝑟𝑟𝑟𝑎𝑎,(006) = 𝐼𝐼(006),𝑃𝑃𝑃𝑃𝑃𝑃
𝐼𝐼(104),𝑃𝑃𝑃𝑃𝑃𝑃+𝐼𝐼(006),𝑃𝑃𝑃𝑃𝑃𝑃+𝐼𝐼(110),𝑃𝑃𝑃𝑃𝑃𝑃+𝐼𝐼(113),𝑃𝑃𝑃𝑃𝑃𝑃 (11)
𝑃𝑃𝑎𝑎𝑎𝑎𝑎𝑎𝑎𝑎𝑡𝑡𝑎𝑎𝑎𝑎𝑡𝑡𝑡𝑡,(110) = 𝐼𝐼(110)
𝐼𝐼(104)+𝐼𝐼(006)+𝐼𝐼(110)+𝐼𝐼(113) (12)
𝑃𝑃𝑟𝑟𝑎𝑎𝑡𝑡𝑟𝑟𝑟𝑟𝑎𝑎,(110) = 𝐼𝐼(110),𝑃𝑃𝑃𝑃𝑃𝑃
𝐼𝐼(104),𝑃𝑃𝑃𝑃𝑃𝑃+𝐼𝐼(006),𝑃𝑃𝑃𝑃𝑃𝑃+𝐼𝐼(110),𝑃𝑃𝑃𝑃𝑃𝑃+𝐼𝐼(113),𝑃𝑃𝑃𝑃𝑃𝑃 . (13)
The calculated LFs for each condition are listed in Table 6. Figure 42 compares alignment for each dopant series with increasing magnetic field by individual crystal-plane alignment. Figure 43 shows the XRD spectra obtained from the Yb:Al2O3 samples aligned at 0, 1.8, and 9 T. The (006) is not present in the 0 T pattern, but the (006) does appear as the particles align under an increasing magnetic field strength.
Table 6 LFs calculated from (006) and (110) planes for magnetically aligned ceramic composite samples
Composition
Lotgering factor (LF) (%)
0 T 1.8 T 9 T
(006) (110) (006) (110) (006) (110)
Gd: Al2O3 0.25 2.78 27.0 10.0 25.0 10.7
Yb: Al2O3 3.29 2.39 26.6 9.98 51.8 11.2
Pr: Al2O3 0.25 2.93 0.25 2.10 0.25 28.3
Er: Al2O3 10.1 2.65 31.0 12.3 . . . . . .
Undoped Al2O3 0.25 2.75 0.25 3.01 7.51 8.9
Fig. 42 a) LF as a function of field strength and dopant type with respect to the (006), LF(006) and b) LF as a function of field strength and dopant type with respect to the (110), LF(110)
(a) (b)
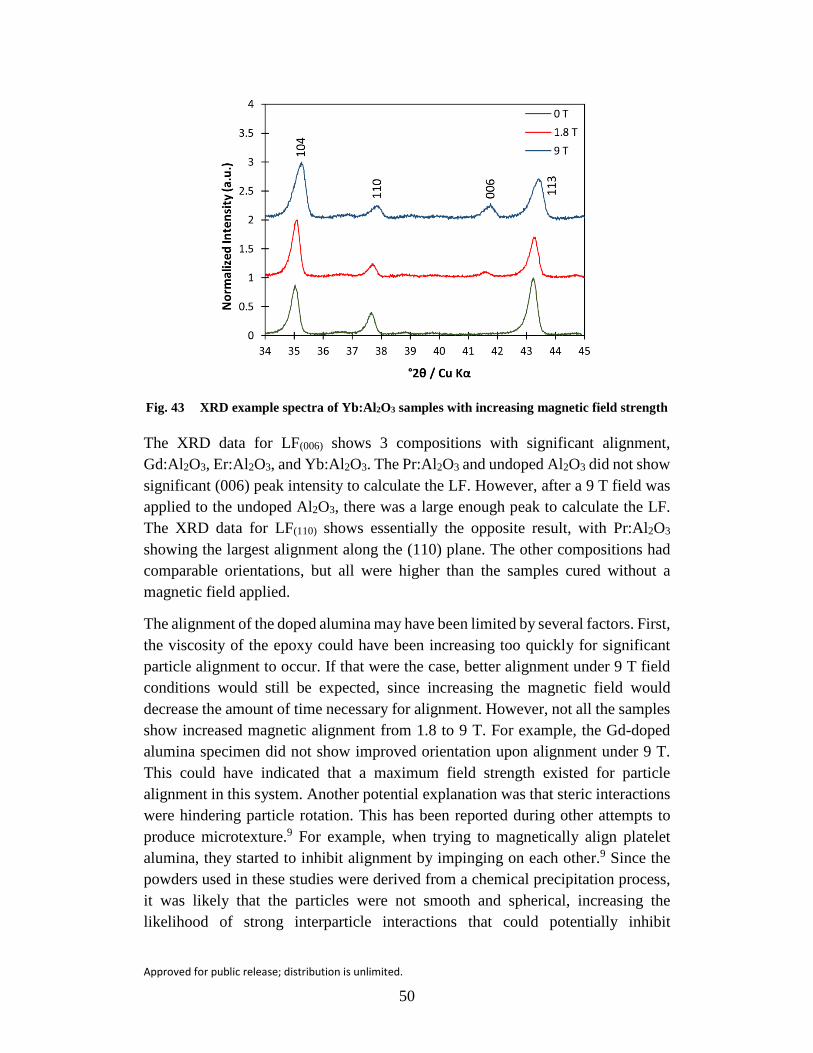
Approved for public release; distribution is unlimited.
50
Fig. 43 XRD example spectra of Yb:Al2O3 samples with increasing magnetic field strength
The XRD data for LF(006) shows 3 compositions with significant alignment, Gd:Al2O3, Er:Al2O3, and Yb:Al2O3. The Pr:Al2O3 and undoped Al2O3 did not show significant (006) peak intensity to calculate the LF. However, after a 9 T field was applied to the undoped Al2O3, there was a large enough peak to calculate the LF. The XRD data for LF(110) shows essentially the opposite result, with Pr:Al2O3 showing the largest alignment along the (110) plane. The other compositions had comparable orientations, but all were higher than the samples cured without a magnetic field applied.
The alignment of the doped alumina may have been limited by several factors. First, the viscosity of the epoxy could have been increasing too quickly for significant particle alignment to occur. If that were the case, better alignment under 9 T field conditions would still be expected, since increasing the magnetic field would decrease the amount of time necessary for alignment. However, not all the samples show increased magnetic alignment from 1.8 to 9 T. For example, the Gd-doped alumina specimen did not show improved orientation upon alignment under 9 T. This could have indicated that a maximum field strength existed for particle alignment in this system. Another potential explanation was that steric interactions were hindering particle rotation. This has been reported during other attempts to produce microtexture.9 For example, when trying to magnetically align platelet alumina, they started to inhibit alignment by impinging on each other.9 Since the powders used in these studies were derived from a chemical precipitation process, it was likely that the particles were not smooth and spherical, increasing the likelihood of strong interparticle interactions that could potentially inhibit
Approved for public release; distribution is unlimited.
51
alignment. However, since the samples contained only 20 wt% solids, it was unlikely that steric hindrance had a large effect.
The overall agglomeration of alumina crystallites could have also led to the variation in data. Although no analysis had been done to quantify the degree of agglomeration, it was likely that some amount of agglomeration was present since no dispersant was used. If multiple crystallites were present in different orientations within the agglomerates, the torques applied to the agglomerate by the magnetic field would be in competition. It was unknown if these torques would be strong enough to break up hard agglomerates.
As can be seen in Fig. 42, alignment generally increases with magnetic field strength. Looking at the data, 2 points stood out. First, both the Gd-doped Al2O3 and the Yb-doped Al2O3 had similar alignment along the (110) plane despite Gd-doped Al2O3 having a much stronger total magnetic moment. However, when considering the LF(006), the Yb:Al2O3 had a larger response. This may have been due, in part, to the localization of the magnetic moment. In the case of Gd:Al2O3, the magnetic moment was localized to the dopant position; whereas, for Yb-doped Al2O3 the magnetic moment was more globally distributed within the structure, possibly inducing higher torque along selected crystal planes at the same field strength. The second interesting result was that the undoped samples experienced a small degree of alignment when the field strength was high enough. Calculations indicated a field of approximately 10 T should be necessary for moderate amounts of alignment.27,30 However, Eqs. 1 and 2 indicated that alignment should be possible with a high enough magnetic field strength, no matter how small the magnetic susceptibility anisotropy was.
The disproportionately weak response observed in the Pr-doped Al2O3 compared with the other dopants was due to the significant content of theta phase, as shown in Section 3. Table 7 shows the calculated amount of alpha and theta phases in each of the rare-earth-doped alumina materials, which were consistent with results from Fig. 15b. Due to the high theta-phase content, it was theorized that Pr-doped Al2O3 was preferentially aligned along the (110) plane.
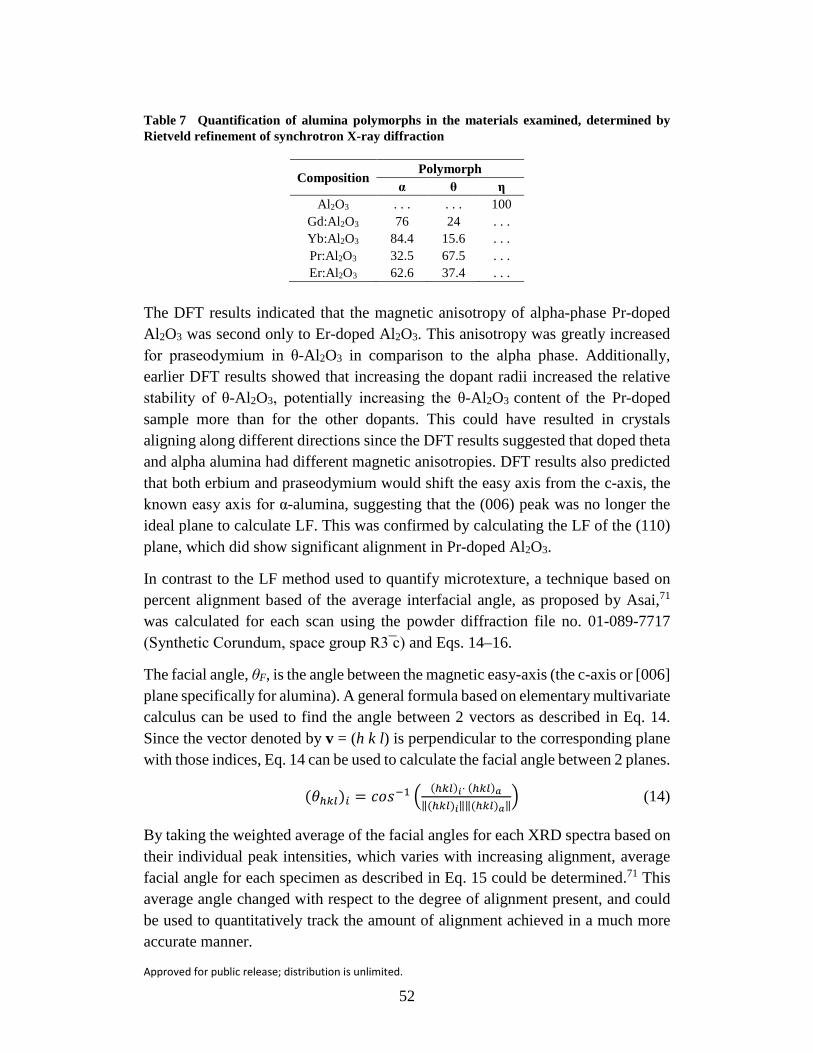
Approved for public release; distribution is unlimited.
52
Table 7 Quantification of alumina polymorphs in the materials examined, determined by Rietveld refinement of synchrotron X-ray diffraction
Composition Polymorph
α θ η Al2O3 . . . . . . 100
Gd:Al2O3 76 24 . . . Yb:Al2O3 84.4 15.6 . . . Pr:Al2O3 32.5 67.5 . . . Er:Al2O3 62.6 37.4 . . .
The DFT results indicated that the magnetic anisotropy of alpha-phase Pr-doped Al2O3 was second only to Er-doped Al2O3. This anisotropy was greatly increased for praseodymium in θ-Al2O3 in comparison to the alpha phase. Additionally, earlier DFT results showed that increasing the dopant radii increased the relative stability of θ-Al2O3, potentially increasing the θ-Al2O3 content of the Pr-doped sample more than for the other dopants. This could have resulted in crystals aligning along different directions since the DFT results suggested that doped theta and alpha alumina had different magnetic anisotropies. DFT results also predicted that both erbium and praseodymium would shift the easy axis from the c-axis, the known easy axis for α-alumina, suggesting that the (006) peak was no longer the ideal plane to calculate LF. This was confirmed by calculating the LF of the (110) plane, which did show significant alignment in Pr-doped Al2O3.
In contrast to the LF method used to quantify microtexture, a technique based on percent alignment based of the average interfacial angle, as proposed by Asai,71 was calculated for each scan using the powder diffraction file no. 01-089-7717 (Synthetic Corundum, space group R3 ̅c) and Eqs. 14–16.
The facial angle, θF, is the angle between the magnetic easy-axis (the c-axis or [006] plane specifically for alumina). A general formula based on elementary multivariate calculus can be used to find the angle between 2 vectors as described in Eq. 14. Since the vector denoted by v = (h k l) is perpendicular to the corresponding plane with those indices, Eq. 14 can be used to calculate the facial angle between 2 planes.
(𝜃𝜃ℎ𝑘𝑘𝑎𝑎)𝑎𝑎 = 𝑐𝑐𝑐𝑐𝑠𝑠−1 � (ℎ𝑘𝑘𝑎𝑎)𝑎𝑎· (ℎ𝑘𝑘𝑎𝑎)𝑎𝑎‖(ℎ𝑘𝑘𝑎𝑎)𝑎𝑎‖‖(ℎ𝑘𝑘𝑎𝑎)𝑎𝑎‖
� (14)
By taking the weighted average of the facial angles for each XRD spectra based on their individual peak intensities, which varies with increasing alignment, average facial angle for each specimen as described in Eq. 15 could be determined.71 This average angle changed with respect to the degree of alignment present, and could be used to quantitatively track the amount of alignment achieved in a much more accurate manner.
Approved for public release; distribution is unlimited.
53
𝜃𝜃𝐹𝐹 = ∑(𝐼𝐼ℎ𝑝𝑝𝑎𝑎)𝑎𝑎(𝜃𝜃ℎ𝑝𝑝𝑎𝑎)𝑎𝑎∑(𝐼𝐼ℎ𝑝𝑝𝑎𝑎)𝑎𝑎
, (15)
where Ihkl denotes the intensity of the ith peak. However, since the facial angle is in units of degrees and varies between 1 and 90, it is difficult to interpret. By adapting the Lotgering equation16,10 and comparing the observed average facial angle with that of the average facial angle of a perfectly random specimen (the PDF card), a percentage alignment for each specimen was calculated according to Eq. 16.
% 𝑎𝑎𝑎𝑎𝑎𝑎𝑎𝑎𝑎𝑎𝑎𝑎𝑎𝑎𝑎𝑎𝑡𝑡 = 𝜃𝜃𝑃𝑃𝑟𝑟−𝜃𝜃𝑃𝑃𝜃𝜃𝑃𝑃𝑟𝑟
, (16)
where θFr denotes the average facial angle of the powder diffraction card with respect to the (006) peak. The percentage alignment values for each condition were averaged across the 3 repeats. Two-tailed, 2-sample t-tests were conducted to compare the alignment of the 1.8-T samples with the controls. An alpha value of α = 0.05 was used.
Table 8 lists the average percent alignment value standard deviation for each condition while Fig. 44 compared the percent alignment across dopants. All of the magnetically aligned samples had higher statistically significant percent alignment values, as expected. As shown in Table 8 and Fig. 42, the Er-doped samples exhibited the highest degree of alignment, followed by Yb-doped and Gd-doped. This was in agreement with what was observed in the mixed-phase alumina epoxy samples when the data was recalculated using the average facial angle calculation (Table 8). Again, ytterbium exhibited a higher degree of alignment than gadolinium, despite having a much lower total magnetic moment.
Table 8 Average percentage alignment values ± standard deviation for phase-pure α-alumina epoxy samples. Third column also lists the percentage alignment values recalculated using the average facial angle method from the previous mixed-phase alumina epoxy alignment samples for comparison.
Dopant
Phase-pure α-alumina alignment
(%)
Mixed-phase alumina alignment
(%)10 0 T 1.8 T 1.8 T
Gd 0.93 ± 0.86 6.49 ± 1.81 15.01 ± 9.65 Yb 2.22 ± 0.14 21.01 ± 0.64 20.50 ± 1.64 Er 2.20 ±0.41 26.43 ± 6.46 27.12 ± 0.56 Pr 2.18 ± 0.71 -2.37 ± 1.62 0.25 ± 6.11
Undoped 2.51 ± 0.58 5.86 ± 1.48 4.05 ± 0.48a aIndicates n = 2
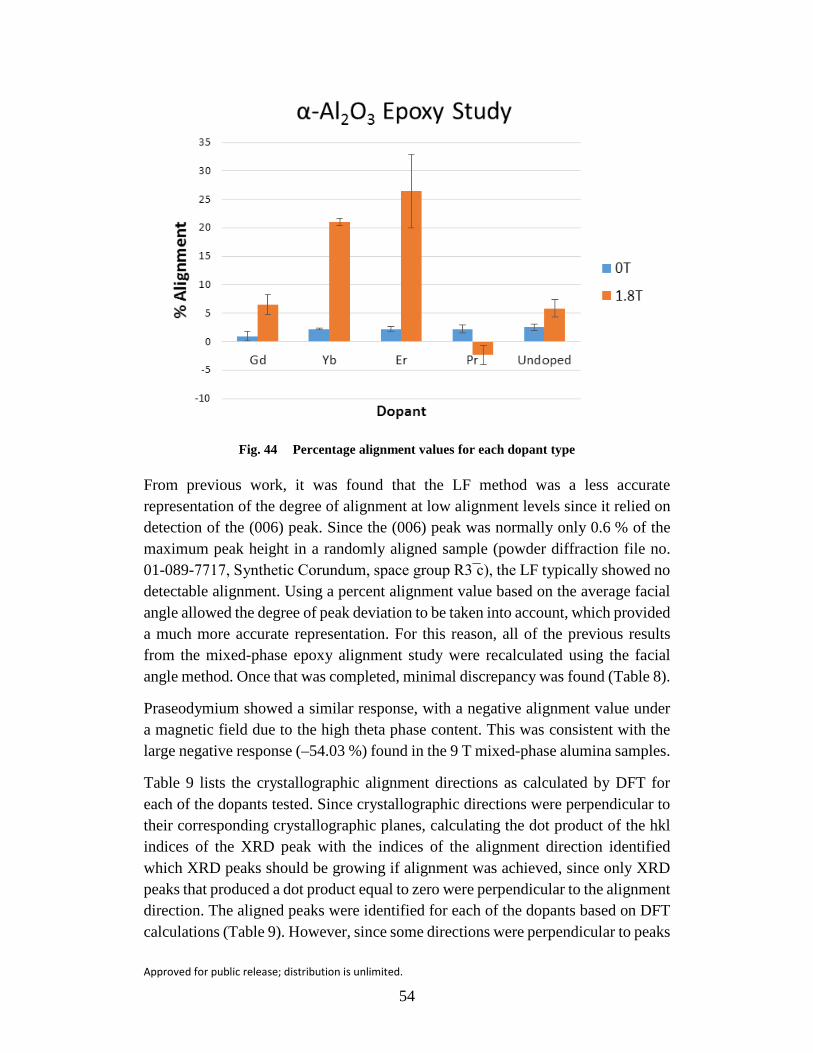
Approved for public release; distribution is unlimited.
54
Fig. 44 Percentage alignment values for each dopant type
From previous work, it was found that the LF method was a less accurate representation of the degree of alignment at low alignment levels since it relied on detection of the (006) peak. Since the (006) peak was normally only 0.6 % of the maximum peak height in a randomly aligned sample (powder diffraction file no. 01-089-7717, Synthetic Corundum, space group R3 ̅c), the LF typically showed no detectable alignment. Using a percent alignment value based on the average facial angle allowed the degree of peak deviation to be taken into account, which provided a much more accurate representation. For this reason, all of the previous results from the mixed-phase epoxy alignment study were recalculated using the facial angle method. Once that was completed, minimal discrepancy was found (Table 8).
Praseodymium showed a similar response, with a negative alignment value under a magnetic field due to the high theta phase content. This was consistent with the large negative response (–54.03 %) found in the 9 T mixed-phase alumina samples.
Table 9 lists the crystallographic alignment directions as calculated by DFT for each of the dopants tested. Since crystallographic directions were perpendicular to their corresponding crystallographic planes, calculating the dot product of the hkl indices of the XRD peak with the indices of the alignment direction identified which XRD peaks should be growing if alignment was achieved, since only XRD peaks that produced a dot product equal to zero were perpendicular to the alignment direction. The aligned peaks were identified for each of the dopants based on DFT calculations (Table 9). However, since some directions were perpendicular to peaks
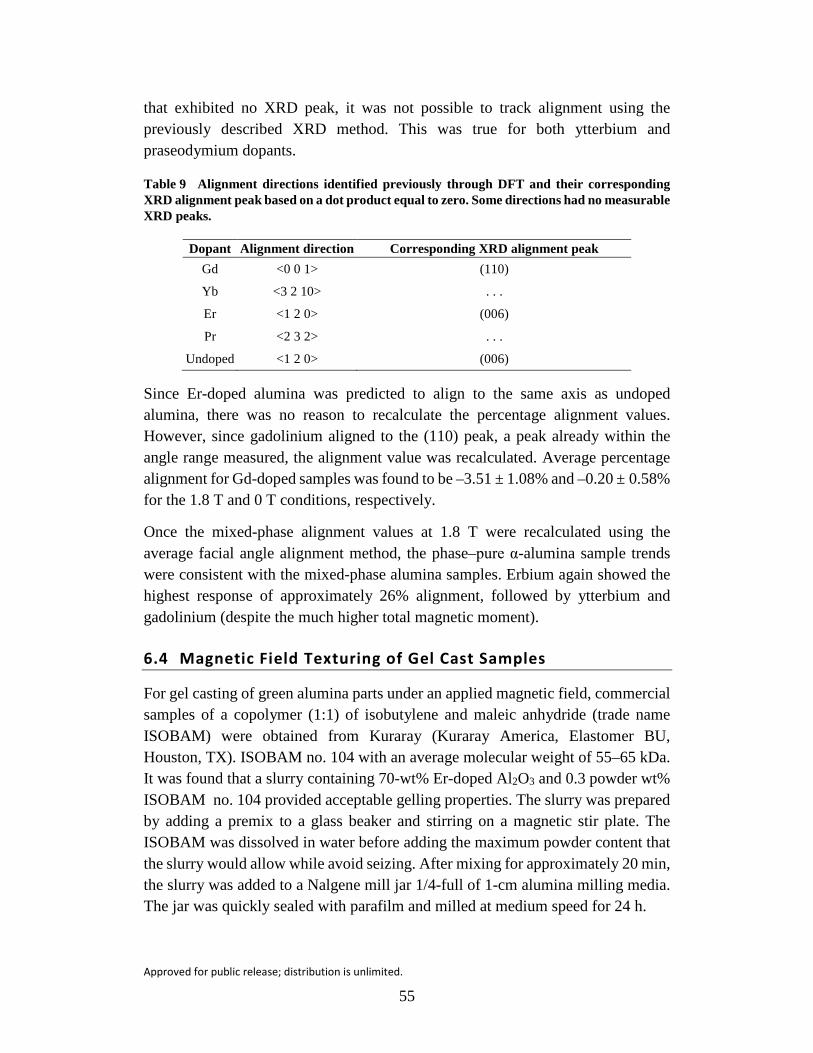
Approved for public release; distribution is unlimited.
55
that exhibited no XRD peak, it was not possible to track alignment using the previously described XRD method. This was true for both ytterbium and praseodymium dopants.
Table 9 Alignment directions identified previously through DFT and their corresponding XRD alignment peak based on a dot product equal to zero. Some directions had no measurable XRD peaks.
Dopant Alignment direction Corresponding XRD alignment peak Gd <0 0 1> (110)
Yb <3 2 10> . . .
Er <1 2 0> (006)
Pr <2 3 2> . . .
Undoped <1 2 0> (006)
Since Er-doped alumina was predicted to align to the same axis as undoped alumina, there was no reason to recalculate the percentage alignment values. However, since gadolinium aligned to the (110) peak, a peak already within the angle range measured, the alignment value was recalculated. Average percentage alignment for Gd-doped samples was found to be –3.51 ± 1.08% and –0.20 ± 0.58% for the 1.8 T and 0 T conditions, respectively.
Once the mixed-phase alignment values at 1.8 T were recalculated using the average facial angle alignment method, the phase–pure α-alumina sample trends were consistent with the mixed-phase alumina samples. Erbium again showed the highest response of approximately 26% alignment, followed by ytterbium and gadolinium (despite the much higher total magnetic moment).
6.4 Magnetic Field Texturing of Gel Cast Samples
For gel casting of green alumina parts under an applied magnetic field, commercial samples of a copolymer (1:1) of isobutylene and maleic anhydride (trade name ISOBAM) were obtained from Kuraray (Kuraray America, Elastomer BU, Houston, TX). ISOBAM no. 104 with an average molecular weight of 55–65 kDa. It was found that a slurry containing 70-wt% Er-doped Al2O3 and 0.3 powder wt% ISOBAM no. 104 provided acceptable gelling properties. The slurry was prepared by adding a premix to a glass beaker and stirring on a magnetic stir plate. The ISOBAM was dissolved in water before adding the maximum powder content that the slurry would allow while avoid seizing. After mixing for approximately 20 min, the slurry was added to a Nalgene mill jar 1/4-full of 1-cm alumina milling media. The jar was quickly sealed with parafilm and milled at medium speed for 24 h.
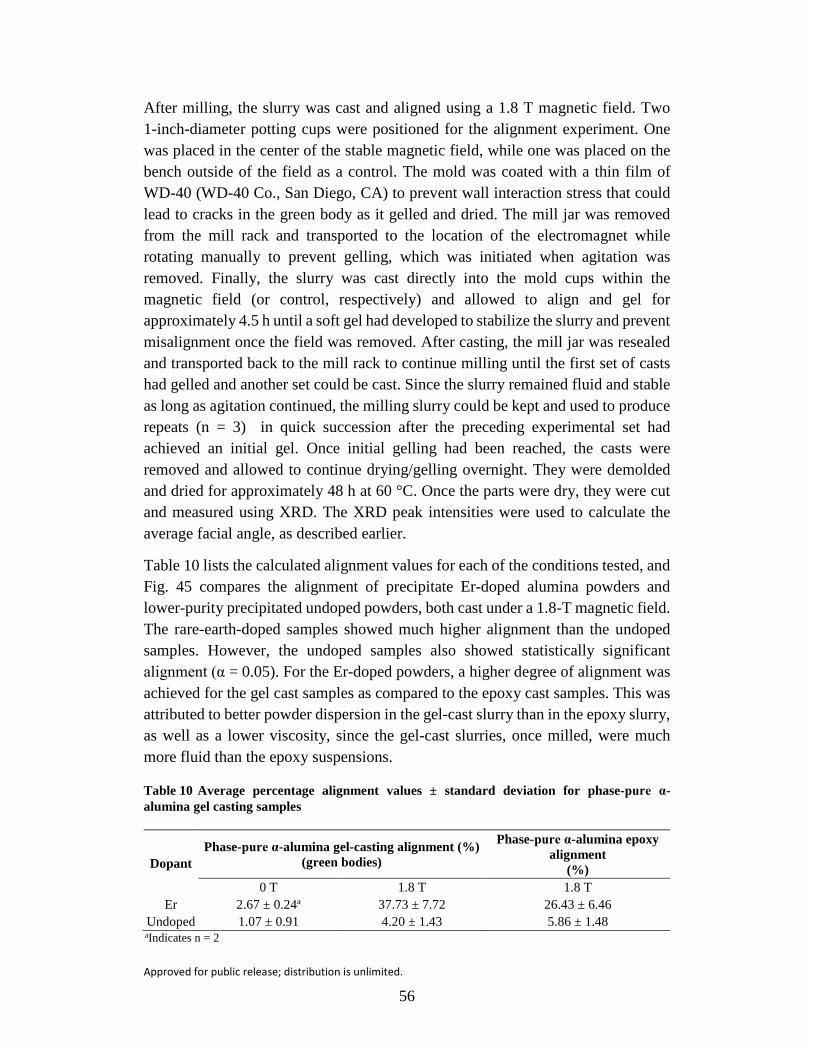
Approved for public release; distribution is unlimited.
56
After milling, the slurry was cast and aligned using a 1.8 T magnetic field. Two 1-inch-diameter potting cups were positioned for the alignment experiment. One was placed in the center of the stable magnetic field, while one was placed on the bench outside of the field as a control. The mold was coated with a thin film of WD-40 (WD-40 Co., San Diego, CA) to prevent wall interaction stress that could lead to cracks in the green body as it gelled and dried. The mill jar was removed from the mill rack and transported to the location of the electromagnet while rotating manually to prevent gelling, which was initiated when agitation was removed. Finally, the slurry was cast directly into the mold cups within the magnetic field (or control, respectively) and allowed to align and gel for approximately 4.5 h until a soft gel had developed to stabilize the slurry and prevent misalignment once the field was removed. After casting, the mill jar was resealed and transported back to the mill rack to continue milling until the first set of casts had gelled and another set could be cast. Since the slurry remained fluid and stable as long as agitation continued, the milling slurry could be kept and used to produce repeats (n = 3) in quick succession after the preceding experimental set had achieved an initial gel. Once initial gelling had been reached, the casts were removed and allowed to continue drying/gelling overnight. They were demolded and dried for approximately 48 h at 60 °C. Once the parts were dry, they were cut and measured using XRD. The XRD peak intensities were used to calculate the average facial angle, as described earlier.
Table 10 lists the calculated alignment values for each of the conditions tested, and Fig. 45 compares the alignment of precipitate Er-doped alumina powders and lower-purity precipitated undoped powders, both cast under a 1.8-T magnetic field. The rare-earth-doped samples showed much higher alignment than the undoped samples. However, the undoped samples also showed statistically significant alignment (α = 0.05). For the Er-doped powders, a higher degree of alignment was achieved for the gel cast samples as compared to the epoxy cast samples. This was attributed to better powder dispersion in the gel-cast slurry than in the epoxy slurry, as well as a lower viscosity, since the gel-cast slurries, once milled, were much more fluid than the epoxy suspensions.
Table 10 Average percentage alignment values ± standard deviation for phase-pure α-alumina gel casting samples
Dopant Phase-pure α-alumina gel-casting alignment (%)
(green bodies)
Phase-pure α-alumina epoxy alignment
(%) 0 T 1.8 T 1.8 T
Er 2.67 ± 0.24a 37.73 ± 7.72 26.43 ± 6.46 Undoped 1.07 ± 0.91 4.20 ± 1.43 5.86 ± 1.48 aIndicates n = 2

Approved for public release; distribution is unlimited.
57
Fig. 45 Percent alignment values for each powder type of green gel-cast specimens
Figure 46 shows the XRD spectra change as a function of sintering. In a green body state, the sample exhibited 37.9% alignment. After sintering, the percent alignment value remained at 33.8%. This was unexpected, since it was hypothesized that the addition of thermal energy without a magnetic field would provide enough movement for the particles to become misaligned during the sintering process, resulting in reduced alignment values. This was not the case, indicating that a high degree of alignment achieved in the green-body state could potentially be maintained in the sintered body. The SEM cross-sectional image in Fig. 47 shows necking at the particle contact points, but no further densification. This indicated that the sintering profile was inadequate for densifying the nanopowders, and that further optimization was necessary.
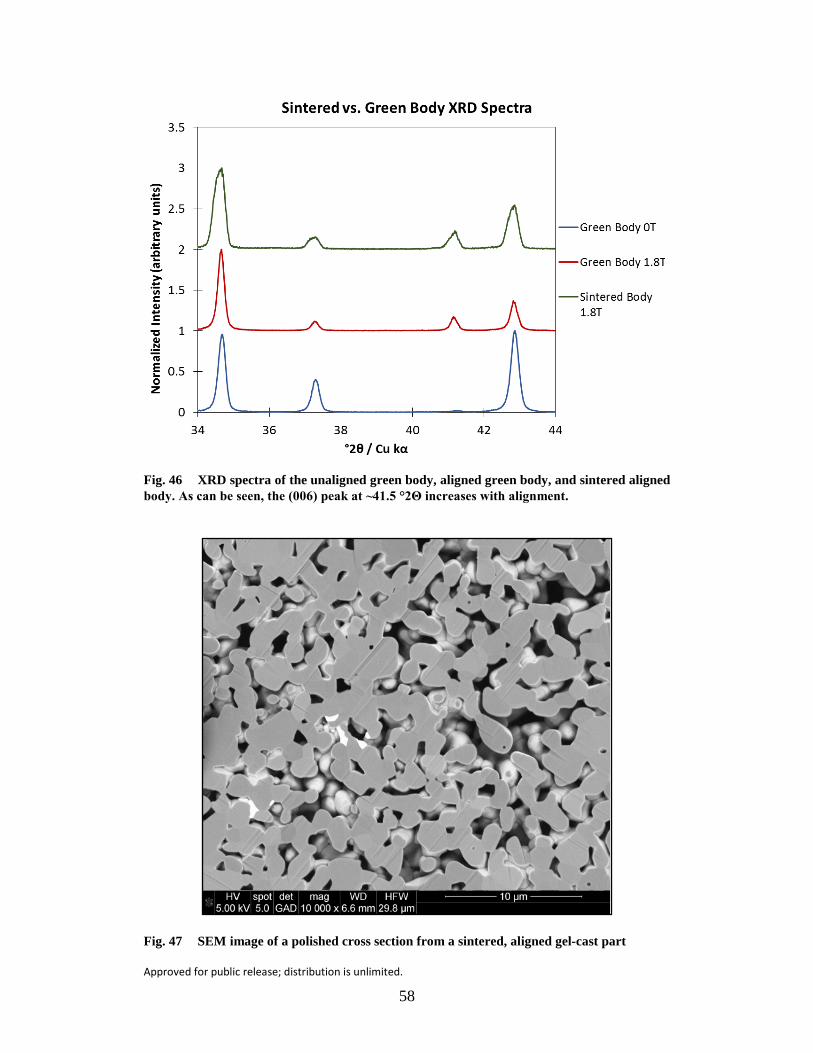
Approved for public release; distribution is unlimited.
58
Fig. 46 XRD spectra of the unaligned green body, aligned green body, and sintered aligned body. As can be seen, the (006) peak at ~41.5 °2Θ increases with alignment.
Fig. 47 SEM image of a polished cross section from a sintered, aligned gel-cast part
Approved for public release; distribution is unlimited.
59
7. Conclusions
The addition of rare-earth dopants to diamagnetic Al2O3 was studied to determine the influence over structure, phase, and alignment under applied external fields. The motivation for adding rare earths to Al2O3 was to enhance the magnetic susceptibility anisotropy and increase magnetic torque of the material system, thereby increasing the influence of magnetic field application on grain rotation and alignment. A coprecipitation synthesis method was developed to overcome ionic size mismatch between nano-Al2O3 particles and rare-earth dopants, leading to the successful fabrication of a number of rare-earth-doped alumina powders. The powders contained a maximum of 400 ppm of rare-earth dopant to avoid the formation of unwanted phases. Nine rare-earth dopants from the lanthanide (Ln)-series, including erbium (Er), neodymium (Nd), gadolinium (Gd), ytterbium (Yb), lanthanum (La), lutetium (Lu), praseodymium (Pr), dysprosium (Dy), and thulium (Tm) were used to fabricate rare-earth-doped Al2O3 powders.
Advanced characterization of the powders via SEM, TEM, HT-XRD, high-temperature DSC, ss-NMR, and MAS were conducted. It was determined that Ln dopants served as structural promoters to increase the phase-transformation temperature (θ →α) by a notable magnitude, which delayed the onset of alumina lattice phase transformation. Ln doping of alumina enabled control of the phase population, with no additional unwanted phases (i.e., LnAl2O3 or Ln2O3) observed. It was determined that the Ln dopants resided in the vacant octahedral locations within the alumina lattice. The formation of 100% α-phase was also observed in the case of Dy- and Lu-doped alumina.
Ln-doped alumina powders were subjected to microwave fields, which were found to affect rare-earth migration (phase formation) and enhance density at lower temperatures. Er-doped Al2O3 powders sintered in a single-mode microwave system with a 30%E:70%H mixed field produced samples with significantly higher density (~97% of theoretical density) compared to samples sintered conventionally at the same temperature of 1400 °C (~70% of theoretical density), representing a savings of 250 °C–300 °C for producing high-density samples. These samples also contained the lowest amount of second phase, which indicated that more Er formed a solid solution with Al2O3. The findings suggested that the magnetic component played a critical role in the processing of Al2O3 at microwave frequencies, and that the dopant material played an important role in material response to EM fields.
Ln-doped alumina powders exposed to magnetic fields were also evaluated in terms of phase development and crystallographic texturing. High-temperature DSC under applied magnetic fields indicated a significant change in phase formation of rare-earth-doped alumina, as data collected under a 9 T field indicated crystallization of
Approved for public release; distribution is unlimited.
60
α-Al2O3 at a temperature 300 °C lower than without the application of a magnetic field. This demonstrated that the application of a magnetic field could lead to crystallization of the ideal phase at reduced processing temperatures. Experiments showing overlapping transition temperatures between in-situ HT-XRD and high-temperature DSC data provided confirmation of the structural transitions.
Density functional theory was utilized, in conjunction with experimental efforts, to study the effects of rare-earth dopants on the structure, phase stability, magnetic properties, and magnetic field effects of α- and θ-Al2O3. Specific rare-earth dopants (Er, Gd, Pr, Nd, Yb) were down-selected based on their potential to strongly influence material processing under magnetic fields. Initial study of the doped α- and θ-phase Al2O3 found that dopant incorporation into the Al2O3 lattice resulted in an increase in the lattice parameters. The relative distortion was found to be proportional to the ionic radius of the selected dopant. As multiple material phases and dopant sites were investigated, the stability of the phases were determined through comparison of cohesive energies, which determined that the α-phase was the most stable overall. Initial work also investigated magnetic moment and localization in the crystal lattice. It was found that there was a strong localization of the magnetic moment on the rare-earth atom in all dopants except Yb, which showed delocalization of the magnetic moment throughout the supercell. As a natural progression, to investigate the effect of magnetic field on the doped alumina, the effect of spin-orbit coupling was introduced. Spin-orbit coupling decreased the total cohesive energy, but did not change the phase stability. Ease of magnetization was also probed through the computation of MAE. Dopant and material phase were found to have a strong effect on the MAE magnitude, with Er and Pr dopants having the largest overall anisotropy energy. In addition, the magnetic susceptibility was evaluated to determine material responsivity with respect to exposure to magnetic field. It was found, similar to the MAE, that the susceptibility was strongly influenced by material phase and dopant, with the Er dopant having the largest contribution.
Ln-doped Al2O3 powders were added to epoxy during the application of a 1.8 Tesla magnetic field to study the effects of crystallographic orientation. XRD results showed that the (104) peak had the highest intensity for the “no field” condition, while the (110) peak had the highest intensity in a 1.8 T field, indicating crystallite alignment. When the (110)/(104) peak ratios were calculated and plotted for all of the Ln-doped Al2O3 powders to quantify texturing via the Lotgering factor, there was a consistent trend of improved particle orientation for all rare-earth additives, with the highest particle alignment evident for Er-doped Al2O3. These results were extremely encouraging, considering the relatively low 1.8-T magnetic field strength proved to be sufficient for affecting the crystallographic texturing of a rare-earth-
Approved for public release; distribution is unlimited.
61
doped diamagnetic material. Epoxy alignment experiments were expanded to include samples aligned under a 9 T magnetic field using undoped, Gd-doped, and Yb-doped Al2O3 powders, with an increase in alignment generally observed with increasing magnetic field strength. Results indicated that the Gd-doped and Yb-doped powders exhibited equivalent alignment, despite the latter having a weaker total magnetic moment. DFT modeling suggested that this may have been due to the global effect of the magnetic moment exhibited by Yb, despite its total magnetic moment being weaker than Gd. The data also supported the claim that undoped Al2O3 could be affected by a strong enough magnetic field. After identifying a more accurate method for quantifying texture, the average facial angle alignment method was used to recalculate texturing results. It was determined that the trends were the same, with erbium again showing the highest response, with approximately 26% alignment. The epoxy experiments demonstrated that dopant inclusion affected the responsiveness of alumina to a magnetic field, presumably by changing the magnetic anisotropy of the crystal. Both Gd and Yb were effective at increasing the grain alignment under lower magnetic field strengths as compared to undoped alumina.
A gel casting system was also developed to enable casting under magnetic fields and sintering of aligned bodies to examine the effects of fields on texturing. Preliminary pressureless sintered gel cast samples were approximately 98% dense, indicating that gel casting could yield parts to achieve full densification under hot isostatic pressing. Formulas using both nanosized commercial Al2O3 powders were shown to set within 30 min while demonstrating moderate strength to allow easy transportation and sintering. For the Er-doped powders, a higher degree of alignment was achieved for the gel cast samples as compared to the epoxy cast samples. This was attributed to better powder dispersion in the gel-cast slurry than in the epoxy slurry, as well as a lower viscosity, since the gel cast slurries, once milled, were much more fluid than the epoxy suspensions. In a green-body state, the sample exhibited 37.9% alignment. After sintering, the percent alignment value remained at 33.8%, indicating that the high degree of alignment achieved in the green-body state could potentially be maintained in the sintered body.
The program produced a number of significant results for influencing the structure, phase formation, and crystallographic texturing of weakly magnetic alumina materials by doping with a small amount of Ln-series rare-earth materials and applying microwave and magnetic fields during processing. Transition of these results to future research is discussed in the following section.
Approved for public release; distribution is unlimited.
62
8. Transitions
The DSI program has been transitioned into a WMRD-MMSD 6.2 Mission program entitled, “Magnetic Field-Assisted Tailoring of Ceramic Materials for Unparalleled Properties”. The purpose of this new program is to enable new capabilities for gaining access to unique, nonequilibrium structures in ceramic materials through the use of magnetic fields, which will lead to new materials, functionalities, and property combinations. While rare-earth dopants were selected to enhance the responsiveness of alumina ceramics to applied fields during the DSI program, this decision was driven by compatibility with laser host applications. The selection of rare earths was not ideal, as the large ionic size mismatch with nanosized alumina led to significant doping challenges. The rare earths were also limited in their magnetic property values. Because the new 6.2 Mission program is not limited to laser host applications, transition metal dopants and ferromagnetic additives that have an ionic size that is more compatible with alumina (and therefore higher solubility in alumina) and higher magnetic properties should provide a much higher response to magnetic fields, which were shown to influence structure, phase formation, and texturing during the DSI. The 6.2 Mission program will seek to deliver the following:
• Novel synthesis methods for fabricating highly responsive ceramic powders containing transition metal dopants or ferromagnetic additives that can influence susceptibility, conductivity, and other key properties in the presence of magnetic fields.
• Advanced in-situ and ex-situ characterization methods for monitoring structure and property responses (conductivity, susceptibility, microstructural variations, etc.) during and after processing under magnetic fields.
• Predictive models of materials properties (e.g., structure, mechanical response) from composition and processing conditions, in particular under magnetic fields, but also related to pressure, temperature, and so forth.
Expected US Army impact related to the new applications will include the following:
• Improved Soldier and vehicle protection through higher ballistic efficiency ceramics with improved multihit capabilities.
• Improved lethality performance of munitions and/or gun barrels via magnetic field processing for improved reliability and wear resistance.
Approved for public release; distribution is unlimited.
63
• Lower manufacturing and design costs of high-performance ceramics through use of predictive, integrated modeling and simulation tools.
By taking lessons learned from the DSI program, the 6.2 Mission program should generate significant accomplishments in “Energy Coupled to Matter” research.

Approved for public release; distribution is unlimited.
64
9. References
1. Krell A, Klimke J, Hutzler T. Advanced spinel and sub-μm Al2O3 for transparent armour applications. J of the European Ceramic Soc. 2009;29:275–281.
2. Liu XJ, Chen F, Zhang F, Zhang HL, Zhang Z, Wang J, Wang SW, Huang ZR. Hard transparent AlON ceramic for visible/IR windows. Int J of Refractory Metals and Hard Mater. 2013;39:38–43.
3. Patel PJ, Gilde GA, Dehmer PG, McCauley JW. Transparent ceramics for armor and EM window applications. Proceedings of SPIE 4102, Inorganic Optical Materials II. 2000. p. 1–14.
4. Sands JM, Fountzoulas CG, Gilde GA, Patel PJ. Modelling transparent ceramics to improve military armour. J of the Euro Ceramic Soc. 2009;29:261–266.
5. Krell A, Blank P, Ma H, Hutzler T, van Bruggen MPB, Apetz R. Transparent sintered corundum with high hardness and strength. J of the Amer Ceramic Soc. 2003;86:12–18.
6. Tsukada T, Segawa H, Yasumori A, Okada K. Crystallinity of boehmite and its effect on the phase transition temperature of alumina. J of Mat Chem. 1999;9:549–553.
7. Levin I, Brandon D. Metastable alumina polymorphs: crystal structures and transition sequences. J of the Amer Ceramic Soc. 1998;81:1995–2012.
8. Li J, Pan Y, Wu Y, Kou H, Guo J. Microstructure and mechanical properties of hot-pressed α-Al2O3-seeded γ-alumina ceramics. Int J of App Ceramic Tech. 2007;4:276–284.
9. Chen X, Liu Y, Niu G, Yang Z, Bian M, He A. High temperature thermal stabilization of alumina modified by lanthanum species. Applied catalysis a: general. 2001;205:159–172.
10. Djuricic B, Pickering S, Glaude P, McGarry D, Tambuyser P. Thermal stability of transition phases in zirconia-doped alumina. J Mater Sci. 1997;32:589–601.
11. Loong CK, Richardson JW Jr, Ozawa M. Structural phase transformations of rare-earth modified transition alumina to corundum1. J of Alloys and Compounds. 1997;250:356–359.
Approved for public release; distribution is unlimited.
65
12. Piras A, Trovarelli A, Dolcetti G. Remarkable stabilization of transition alumina operated by ceria under reducing and redox conditions. Applied Catalysis B: Environmental. 2000;28:L77–L81.
13. Rossignol S, Kappenstein C. Effect of doping elements on the thermal stability of transition alumina. Inter J of Inorganic Mater. 2001;3:51–58.
14. Kurokawa Y, Ishizaka T, Ikoma T, Tero-Kubota S. Photo-properties of rare earth ion (Er3+, Eu3+ and Sm3+)-doped alumina films prepared by the sol–gel method. Chem Phys Letters. 1998;287:737–741.
15. Thompson AM, Soni KK, Chan HM, Harmer MP, Williams DB, Chabala JM, Levi-Setti R. Dopant distributions in rare-earth-doped alumina. J of the Amer Ceramic Soc. 1997;80:373–376.
16. Sanamyan T, Pavlacka R, Gilde G, Dubinskii M. Spectroscopic properties of Er3+-doped α-Al2O3. Optical Mater. 2013;35:821–826.
17. Patel K, Blair V, Douglas J, Dai Q, Liu Y, Ren S, Brennan R. Structural effects of lanthanide dopants on alumina. Sci Rep. 2017;7:39946.
18. Watanabe T, Tsurekawa S, Zhao X, Zuo L. Scripta Materialia. 2006;54:969–975.
19. Wenk H-R, Van Houtte P. Rep Prog Phys. 2004;67:1367–1428.
20. Liu P, Yi H, Zhou G, Zhang J, Wang S. Opt Mater Express. 2015;5:441–446.
21. Libanori R, Erb RM, Studart AR. ACS Appl Mater and Interfaces. 2013;5:10794–10805.
22. Libanori R, Reusch FB, Erb RM, Studart AR. Langmuir. 2013;29:14674–14680.
23. Sun ZHI, Guo M, Vleugels J, Van der Biest O, Blanpain B. Current Op in Sol State and Mater Sci. 2013;17:193–201.
24. Sun ZHI, Guo X, Guo M, Vleugels J, Van der Biest O, Blanpain B. J of Alloys and Compounds. 2013;551:568–577.
25. Suzuki TS, Sakka Y, Kitazawa K. Adv Engineering Mater. 2001;3:490–492.
26. Terada N, Suzuki HS, Suzuki TS, Kitazawa Sakka HY, Kaneko K, Metoki N. Appl Phys Letters. 2008;92:112507.
27. Terada N, Suzuki HS, Suzuki TS, Kitazawa H, Sakka Y, Kaneko K, Metoki N. J of Phys D: Appl Phys. 2009;42:105404.
Approved for public release; distribution is unlimited.
66
28. Wei M, Zhi D, Brandon DG. Scripta Materialia. 2005;53:1327–1332.
29. Yang Z, Yu J, Deng K, Lan L, Wang H, Ren Z, Wang Q, Dai Y, Wang H. Mater Letters. 2014;135,218–221.
30. Zhang L, Vleugels J, Van der Biest O. Jour of the Amer Ceramic Soc. 2010;93:3148–3152.
31. Sun ZHI, Zhang X, Guo M, Pandelaers L, Vleugels J, Van der Biest O, Van Reusel K, Blanpain B. Jour of Colloid and Interface Sci. 2012;375:203–212.
32. Makiya A, Shouji D, Tanaka S, Uchida N, Kimura T, Uematsu K. Key Engineering Mater. 2002;206–213:445–448.
33. Sun ZHI, Guo M, Vleugels J, Van der Biest O, Blanpain B. Current Op in Sol State and Mater Sci. 2012;16:254–267.
34. Gillon P. Materials Science and Engineering: A. 2000;287:146–152.
35. Chen XY, Liu Y, Niu G, He A. High temperature thermal stabilization of alumina modified by lanthanum species. Appl Catalysis a-General. 2001;205:159–172.
36. Church JS, Cant NW, Trimm DL. Stabilization of aluminas by rare-earth and alkaline-earth ions. Appl Catalysis a-General. 1993;101:105–116.
37. Toby BH, Von Dreele RB. GSAS-II: the genesis of a modern open-source all purpose crystallography software package. J of Appl Crystallography. 2013;46:544–549.
38. Andersson JM, Wallin E, Chirita V, Münger EP, Helmersson U. Phys Review B. 2005;71(1):014101.
39. Wallin E, Andersson JM, Chirita V, Helmersson U. J of Phys: Condensed Matter. 2004;16(49):8971.
40. Jiang K, Music D, Sarakinos K, Schneider JM. Journal of Physics: Condensed Matter. 2010;22(50):505502.
41. Lima AF, Dantas JM, Lalic M. J of Appl Phys. 2012;112(9):093709.
42. Dantas J, Lima A, Lalic M. Paper presented at the J of Phys: Conf Series; 2010 (unpublished).
43. Alibad HAR, Benam MR, Arabshahi H. Int J Phys Sci; 2009;4(8):437–442.
44. Yang Z, Luo G, Lu Z, Woo TK, Hermansson K. J of Phys: Condensed Matter. 2007;20(3):035210.
Approved for public release; distribution is unlimited.
67
45. Mowbray D, Martinez JI, García Lastra J, Thygesen KS, Jacobsen KW. The J of Phys Chem C. 2009;113(28):12301–12308.
46. CRC Handbook of Physics and Chemistry. Boca Raton (FL); 1983.
47. Yamaguchi G, Yasui I, Chiu W-C. Bulletin of the Chem Soc of Japan. 1970;43(8):2487–2491.
48. Newnham EE, de Haan ΥM. Zeitschrift für Kristallographie-Crystalline Materials. 1962;117(1–6):235–237.
49. Robinson K, Gibbs G, Ribbe P. Science. 1971;172(3983):567–570.
50. Yokokawa T, Kleppa OJ. The J of Phys Chem. 1964;68(11):3246–3249.
51. Rahane AB, Deshpande MD, Kumar V. The J of Phys Chem C. 2012;116(10):6115–6126.
52. Chen X, Liu Y, Niu G, Yang Z, Bian M, He A. Appl Catalysis A: Gen. 2001;205(1):159–172.
53. Piras A, Trovarelli A, Dolcetti G. Applied Catalysis B: Environmental. 2000;28(2):L77–L81.
54. Rossignol S, Kappenstein C. Inter J of Inorganic Mater. 2001;3(1):51–58.
55. Roy R, Peelamedu R, Hurtt L, Cheng J, Agrawal D. Definitive experimental evidence for microwave effects: radically new effects of separated E and H fields, such as decrystallization of oxides in seconds. Mat Res Innovat; 2002;6:128–140.
56. Roy R, Agrawal D, Cheng J. New first principles of microwave-material interaction: discovering the role of the H field and anisothermal reactions. In Microwaves: Theory and Application in Materials Processing V; Westerville, OH: Amer Ceramic Soc, 2001;471.
57. Cheng J, Roy R, Agrawal D. Radically different effects on materials by separated microwave electric and magnetic fields. Mat Res Innov. 2002;5:170–177.
58. Yoshikawa N. Recent studies on fundamentals and application of microwave processing of materials. In Advances in Induction and Microwave Heating of Mineral and Organic Materials; Rijeka, Croatia: InTech Europe; 2011.
59. Agrawal D. Microwave sintering of ceramics, composites, metals, and transparent materials. J Mater Education. 1997;19:49–57.
Approved for public release; distribution is unlimited.
68
60. Horii S, Ishihara A, Fukushima T, Uchikoshi T, Ogino H, Suzuki TS, Sakka Y, Shimoyama J, Kishio K. Sci Tech Adv Mater. 2009;10:014604.
61. Livingston JD, Hart HR Jr, Wolf WP. J Appl Phys. 64, 1988;5806–5808.
62. Kresse G, Furthmüller J. Comp Mater Sci. 1996;6(1):15–50.
63. Kresse G, Furthmüller J. Phys Rev B. 1996;54(16):11169–11186.
64. Kresse G, Hafner J. Phys Rev B. 1993;47(1):558–561.
65. Kresse G, Joubert D. Phys Rev B. 1999;59(3):1758–1775.
66. Perdew JP, Ernzerhof M, Burke K. The J of Chem Phys. 1996;105(22):9982–9985.
67. Monkhorst HJ, Pack JD. Special points for Brillonin-zone integrations. Phy Rev B. 1976;13(12):5188–5192.
68. Yates JR, Pickard CJ, Francesco M. Calculation of NMR chemical shifts for extended systems using ultrasoft pseudopotentials. Phys Rev B. 2007;76:024401.
69. Watanabe T, Tsurekawa S, Fujii H, Kanno T. Paper presented at the Mater Science Forum; 2005 (unpublished).
70. Watanabe T, Kido K, Tsurekawa S, Kawahara K. Paper presented at the Mater Science Forum; 2007 (unpublished).
71. Sugiyama T, Tahashi M, Sassa K, Asai S. The control of crystal orientation in non-magnetic metals by imposition of a high magnetic field. ISIJ Inter. 2003;43(6):855–861.
Approved for public release; distribution is unlimited.
69
10. Bibliography
Publications
1. Moorehead C, Blair V, Ku N, Brennan R. Magnetic alignment of erbium doped alpha alumina using a novel gel casting system. In preparation 2017.
2. Limmer K, Elward JM, Rinderspacher BC. Magnetic anisotropy in rare-earth doped alumina. In preparation 2017.
3. Patel K, Blair V, Douglas J, Dai Q, Liu Y, Ren S, Brennan R. Structural effects of lanthanide dopants on alumina. Nature: Scientific Reports. 2017;7. Article no. 39946.
4. Limmer KR, Neupane MR, Brennan RE, Chantawansri TL. Rare-earth dopant effects on the structural, energetic, and magnetic properties of alumina from first principles. J of the Amer Ceramic Soc. December 2016;99(12):4007–4012.
5. Moorehead C, Kornecki M, Blair V, Brennan R. Sensitivity analysis and simulation of theoretical response of ceramics to strong magnetic field. Adelphi (MD): Army Research Laboratory (US); 2016 Sep. Report No.: ARL-TN-0774.
6. Moorehead C, Blair V, Brennan R, Adams J. Preferred orientation of rare-earth doped alumina crystallites by an applied magnetic field. ARL Technical Report, Adelphi (MD): Army Research Laboratory (US); 2016 Jun. Report No.: ARL-TR-7702.
7. Brennan R, Moorehead C, Blair V, Limmer K. Energy coupled to matter for magnetic alignment of rare earth-doped alumina. Materials and Manufacturing Processes. Published online 2016 Jun.
8. Moorehead C, Blair V, Adams J. Characterization of novel gel-casting system to make complex-shaped Al2O3 parts. ARL Technical Report, Adelphi (MD): Army Research Laboratory (US); 2016 Mar. Report No.: ARL-TR-7620.
9. V Blair, J Marsico. Synthesis of Al2O3-coated Fe3O4 nanoparticles for thermomagnetic processing. Adelphi (MD): Army Research Laboratory (US); 2015 Dec. Report No.: ARL-TN-0720.
10. Pavlacka R, Brennan C, Blair V, Brennan R, Fountzoulas C, Cheng Agrawal JD. Single-mode microwave sintering of Er:Al2O3. Processing and Properties of Advanced Ceramics and Composites VII. John Wiley and Sons, Inc.; 2015 Oct;1–11.
Approved for public release; distribution is unlimited.
70
Presentations
1. Ku N, Blair V, Rahane A, Kumar V, Synowczynski-Dunn J, Moorehead C, Brennan R. Doping erbium into the lattice of aluminum oxide. 41st International Conference on Advanced Ceramics and Composites; Optical Materials Session; 2017 Jan; Daytona Beach, FL.
2. Moorehead C, Sietins J, Blair V. MicroCT used to assess de-agglomeration and de-gassing methods for improvement of ISOBAM gel casting system for alumina poster. 41st International Conference on Advanced Ceramics and Composites; Optical Materials Session; 2017 Jan; Daytona Beach, FL.
3. Brennan R, McWilliams B, Blair V, Yu J, Ku N, Kornecki M. Energy coupled to matter for field-assisted sintering of materials. Invited talk; Materials Science and Technology Conference 2016; Sintering and Related Powder Processing Science and Technologies Session; 2016 Oct; Salt Lake City, UT.
4. Blair V, Moorehead C, Ku N, Limmer K, Brennan R. Magnetic alignment of rare earth doped alumina grains in an epoxy matrix – a proof of concept study. Invited Talk; Materials Science and Technology Conference 2016; Processing and performance of materials using microwaves, electric and magnetic fields, ultrasound, lasers, and mechanical work – Rustum Roy Symposium; 2016 Oct; Salt Lake City, UT.
5. Moorehead C, Blair V, Brennan R. Formation of micro-textured alumina bodies under applied magnetic field. Materials Science and Technology Conference 2016; Processing and performance of materials using microwaves, electric and magnetic fields, ultrasound, lasers, and mechanical work – Rustum Roy Symposium; 2016 Oct; Salt Lake City, UT.
6. Brennan R, Dowding R, Zabinski J. Energy coupled to matter research for materials-by-design and advanced processing. Invited talk; 17th International Conference on Experimental Mechanics; 2016 Jul; Rhodes, Greece.
7. Brennan R, Dowding R, Zabinski J. Energy coupled to matter research for field-assisted processing. Invited talk; Engineering Conferences International Electric Field Assisted Sintering and Related Phenomena Far from Equilibrium; 2016 Mar; Tomar, Portugal.
8. Blair VL, Ku N, Lobur N, Brennan R, Rios O. High Temperature Phase Transformation of Alumina under Applied Magnetic Field and its Influences on Sintering. 40th International Conference on Advanced Ceramics and Composites; Field Assisted Sintering and Related Phenomena at High Temperatures Session; 2016 Jan; Daytona Beach, FL.
Approved for public release; distribution is unlimited.
71
9. Moorehead C, Blair V, Brennan R. Formation of micro-textured alumina bodies under applied magnetic field using novel, water soluble polymer gelling system. 40th International Conference on Advanced Ceramics and Composites; 5th Global Young Investigator Forum Session; 2016 Jan; Daytona Beach, FL.
10. Blair VL, Pavlacka R, Lobur N, Brennan C, Brennan R. Synthesis and processing of nano-sized Er:Al2O3 transparent ceramics for laser applications. Materials Science and Technology Conference; Innovative Processing and Synthesis of Ceramics, Glasses and Composites Session; 2015 Oct; Columbus, OH.
11. Brennan R, Brennan C, Pavlacka R, Fountzoulas C, Blair V. Multi and single-mode microwave sintering for field-enhanced texturing of alumina. International Conference on Advanced Ceramics and Composites; 2015 Jan; Daytona Beach, FL.
12. Brennan R, Pavlacka R, Brennan C, Blair V, Fountzoulas C, Cheng J, Agrawal D. Field-enhanced crystallographic texturing of transparent alumina. Materials Science and Technology 2014 Presentation; Rustum Roy Symposium on Processing and Performance of Materials using Microwaves, Electric and Magnetic Fields, Ultrasound, Lasers, and Mechanical Work Session; 2014 October; Pittsburgh, PA.
Approved for public release; distribution is unlimited.
72
List of Symbols, Abbreviations, and Acronyms
2-D 2-dimensional
AACH ammonium aluminum hydroxycarbonate
ARL US Army Research Laboratory
BL baseline conventionally sintered
DFT density functional theory
DI deionized
DSC digital scanning calorimeter
Dy Dysprosium
EDS energy dispersive spectroscopy
EM electromagnetic
Er Erbium
Gd Gadolinium
HEL high-energy laser
HR-XRD high-resolution X-ray diffraction
HT-XRD high-temperature X-ray diffraction
La Lanthanum
LF Lotgering factor
Lu Lutetium
MAE magnetocrystalline anisotropy energy
MAS magic angle spinning
MM multimode microwave sintered
MQ-MAS multiple quantum magic angle spinning
Nd Neodymium
Nd:YAG neodymium-doped yttrium aluminum garnet
ORNL Oak Ridge National Laboratory
PAW projector augmented wave
Approved for public release; distribution is unlimited.
73
PBE Perdew-Burke-Ernzerhof
Pr Praseodymium
SEM scanning electron microscopy
SM single-mode microwave sintered
SOC spin-orbit coupled
ss-NMR solid-state nuclear magnetic resonance
TEM transmission electron microscopy
Tm Thulium
wt% weight-percent
XRD X-ray diffraction
Yb Ytterbium
Approved for public release; distribution is unlimited.
74
1 DEFENSE TECHNICAL (PDF) INFORMATION CTR DTIC OCA 2 DIRECTOR (PDF) US ARMY RESEARCH LAB RDRL CIO L IMAL HRA MAIL & RECORDS MGMT 1 GOVT PRINTG OFC (PDF) A MALHOTRA 1 DIR USARL (PDF) RDRL WMM D R BRENNAN