field studies of co migration from blasting · 2012-08-29 · field studies of co migration from...
TRANSCRIPT

Field Studies of CO Migration from Blasting
By Marcia L Harris Michael J Sapko and Richard J Mainiero
National Institute for Occupational Safety and Health Pittsburgh Research Laboratory
ABSTRACT
Since 1988 there have been thirteen documented incidents in the United States and Canada in which carbon monoxide (CO) is suspected to have migrated through near surface strata into structures or other enclosed spaces as a result of nearby trench blasting or surface mine blasting From these incidents there are thirty suspected or medically verified CO poisonings and one fatality associated with these incidents To better understand the variables contributing to this hazard the National Institute for Occupational Safety and Health (NIOSH) carried out a small-scale field study to identify key factors that may contribute to the migration of CO through the ground NIOSH conducted single-hole heavily confined experimental test shots to measure the radial pressure pulse as it propagated through surrounding monitoring holes to determine if a relationship existed between the pressure pulse and resulting CO measurements afterwards NIOSH also monitored blasts at an airport construction site Following the detonations the concentrations of CO nitric oxide (NO) and nitrogen dioxide (NO2) were monitored for several days in the surrounding satellite holes The peak CO measurements relative to distances from the shots were compared Pressure histories and peak particle velocities (PPV) were measured at monitoring boreholes It was found that the differential pressures recorded within the boreholes give some indication as to the likelihood of CO appearing whereas the PPV measurements do not seem to be as good an indicator for potential CO migration In this limited study changes in barometric pressure had very little influence on removing the trapped detonation products whereas applying a vacuum to the monitoring holes was effective in reducing the entrapped CO concentration
INTRODUCTION
Toxic gases such as CO and the oxides of nitrogen (NOx) are produced by the detonation of explosives The adverse health affects and methods for minimization of such products have been studied for decades12 Early research addressed toxicity issues associated with blasting in confined spaces such as underground coal mines Over the past decade there has been an increased interest in the toxic gases that are released during some large blasts in surface mines More recently the mining and construction industry has been concerned with gaseous toxic detonation products that may travel laterally through near surface strata and soil rather than be vented to the atmosphere Since 1988 there have been 13 documented incidents in the US where explosive-generated CO moved through the earth and accumulated in nearby structures and other underground enclosed spaces3456 In each case the overburden heavily confined the explosives in the blasts restricting the venting of the associated byproduct explosive gases to the atmosphere All the blasts associated with these incidents were in or near residential areas and none of the areas were excavated immediately after the blast Five of the blasts were within 20 to 50 ft (6 to 15 m) of the structures or other enclosed underground spaces three were 100 to 150 ft (30 to 46 m) away and one was 400 to 500 ft (120 to 150 m) away
BACKGROUND
Martel et al4 studied the migration of CO from blasting operations in civil engineering operations such as construction of piping systems under roads pools houses and buildings Their paper summarizes the CO intoxication cases that occurred in the Province of Queacutebec following blasting activities The primary objectives of their investigations were to evaluate the production of CO and identify the migration mechanism through fractures induced in the rock following the blasting of a house basement They found that the structural geology of the rock formation plays a role in the direction and distance of gas propagation in fractures generated when blasting with explosives Also the type of blast
confinement can affect the quantity of gas migrating through the fractured rock They suggested that advection is the initial mechanism of CO migration in both blast induced fractures or naturally occurring joints present before the blast The distance of migration by this mechanism is short (16 to 26 ft [5 to 8 m]) In trenches of mucks (fills under roads) the distance of CO migration by advection is 39 to 66 ft (12 to 20 m) In the 2 to 3 days following the blast further CO migration of up to 49 ft (15 m) was controlled by diffusion in the induced fractures in trenches Finally they found that the pathways were underground conduits broken by blasts and fill around underground conduits in a road trench house trench or fractured rock created by the blast Martel also evaluated procedures that might minimize the travel of CO These procedures were (1) excavation and refilling (ventilating) of the muck and the overburden immediately after each blast (2) installation of vents in the rock around the blast (3) modification of the blasting sequence and (4) modification of explosive type None of these procedures were very effective One mitigation technique that seemed to be effective in minimizing the CO migration after a blast was removing the detonation gases from within the muck by attaching pumps to boreholes and pulling the fumes out of the ground The authors also recommended that CO detectors be put inside every house located within a radial distance of about 100 ft (30 m) from a blast to warn people if significant CO concentrations begin to infiltrate their homes They suggested that the distance should be increased to about 250 ft (75 m) from the blast along roads with underground public utilities This recommendation is consistent with an earlier NIOSH Hazard Alert publication recommending that CO monitors be placed in confined spaces near a blast site until better techniques to protect personnel and the public could be developed7 Due to an increased frequency of CO migration incidents over the past several years NIOSHrsquos Pittsburgh Research Laboratory (PRL) has conducted additional research focused on the reduction and mitigation of CO production and migration from trench blasting operations Initial laboratory research examined the relative amounts of toxic fumes produced from unconfined detonations of several explosive types that were involved in some of the reported CO poisonings Results indicated that all explosives produced CO at rates ranging from 0149 ft3lb (93 lkg) to 63 ft3lb (393 lkg)8 The primary focus of the current field studies is to help answer five questions posed by explosive manufacturers blasters regulators and researchers 1) Is there an obvious relationship between measured PPV at a given location surrounding a trench blast and the subsequent post-blast CO migration and accumulation 2) Is there an obvious relationship between blast pressure history as measured at a monitoring borehole and subsequent CO migration and accumulation 3) How effective is negative pressure at reducing the CO concentration trapped in voids within the blasted material and surrounding strata 4) Is the CO measured at the remote monitoring hole associated with the initial arrival of the pressure pulse at that location or is the CO transport away from the detonation controlled by post detonation diffusion 5) Do changes in the barometric pressure significantly influence the rate of CO dissipation
EXPERIMENTAL APPROACH
NIOSH PRL FIELD SITE Field studies were conducted at the NIOSH PRL site and at a location in Latrobe PA At the PRL site a small-scale study was conducted using nineteen 2frac12-in (635-cm) diameter monitoring holes drilled approximately 10 ft (305 m) deep and approximately 5 ft (152 m) apart (Figure 1) The holes were lined with 10-ft (3-m) long 2-in (5-cm) inside diameter (ID) PVC pipe (Figure 2) The bottom 5 ft (15 m) of the pipe was perforated with multiple rows of frac14-in (064-cm) diameter holes spaced at 3-in (762shycm) apart vertically every 90deg around the pipe circumference to allow for infiltration of gases from the ground Each monitoring hole was equipped with a PVC cap that included a port for installing two frac14-in (0635-cm) OD sampling tubes One line was extended approximately 8 ft (243 m) into the hole and the other was placed at a depth of approximately 1 ft (03 m) Prior to each shot instrumentation for acquiring pressure and vibration data were set up Pressure measurements at the time of detonation were obtained from pressure transducers placed on the short (1 ft [03 m] depth) tube A total of 8 transducers were used to measure pressure histories at surrounding monitoring holes Figure 1 shows the placement of mini-seismographs and pressure transducers In Hole L 374 lb (16945 g) of dynamite were detonated The explosive was placed at the bottom of the hole and the remainder of the hole was stemmed with sand After the detonation the pressure transducers were removed from the various holes and on-line gas analyzers were installed Two Testo 350sa
a Reference to specific products does not imply endorsement by NIOSH
electrochemical cell-based gas analyzers were used to periodically determine the CO NO NO2 and O2 in the holes surrounding the shot To avoid sample dilution in the monitoring hole the analyzer pump drew the sample from the tube placed near the bottom of the hole while the exhaust from the analyzer was returned to the top tube thus maintaining a closed system The instruments were allowed to sample for more than 2 minutes at a rate of 00423 cubic ftmin (CFM) (12 litersminute [Lmin]) before stabilized measurements were recorded Three consecutive measurements were recorded at each location before the instrument was relocated to another hole
Gas mixtures consisting of 800 ppm CO 300 ppm NO and the balance N2 were also injected at a rate of 046 CFM (13 Lmin) into the ground at Hole M and the concentration was measured at Hole N The gas was injected through the longer tube and the flow was regulated using a needle valve and flow meter The short line of the injection hole was capped to prevent gases from venting When applying vacuum (negative pressure) to Hole A D G or H a vacuum hose was inserted into the PVC pipe and taped to prevent leaks A 0-50 in (0-127 cm) water column (WG) differential pressure gauge was installed in the vacuum hose to measure the hole vacuum
LATROBE FIELD SITE
An opportunity for a large-scale field study of blasting induced CO migration was available in Latrobe PA A total of eight shots at a construction site were monitored by NIOSH The blaster loaded the first six blasts with an ANFOEmulsion blend Figure 3 shows the pattern and placement of holes relative to the shots The first shots consisted of 6frac12-in (165-cm) diameter holes drilled in a 15 ft by 15 ft (46 m
by 46 m) pattern to a depth of 40 ft (12m) The holes were double primed with 1frac34-lb (7938-g) cast boosters and loaded with 378-520 lbs (1715-2359 kg) of blasting agent Drill cuttings were used to stem the top 15 feet (46 m) of the hole The holes varied in depth from 35 ft to 40 ft (106 to 12 m) The gas sampling boreholes were drilled to the depth of the blast holes on average 40 ft (12 m) which was the final grade for the construction project (see Figure 3 for sample hole placement) The top 5 ft (152 m) of each monitoring hole was lined with a length of 4-in (102-cm) diameter PVC pipe and drill cuttings were used to fill the annulus between pipe and drill hole limiting the exchange of gases with the atmosphere Figure 4 shows the construction of the borehole liners
The borehole liners were made from a 5 ft (15 m) length of 4-in (102-cm) ID PVC with a 4-in (102shycm) toilet floor flange cemented approximately 1 ft (03 m) from the end of the top of the pipe This provided a lip that would support the pipe above the hole by two short pieces of 2-in by 4-in (51-cm by 102-cm) wood A 4-in (102-cm) PVC cap with a screwed fitting was installed at the end of the pipe above the toilet flange (approximately 1 ft [03 m] from the toilet flange) Two holes were drilled into the cap for insertion of frac14-in (0635-cm) OD gas sampling tubes to depths of 25 ft and 5 ft (76 m and 15 m) At the bottom end of the liner a 4-in (102-cm) PVC sleeve with a fluted skirt was installed The skirt caught the drill cuttings that were backfilled around the pipe to provide an effective seal to limit the exchange of borehole gases with the atmosphere
Prior to each shot instrumentation for recording borehole pressures and vibration data were set up Pressures at the time of detonation were measured using +- 15 psig (pounds per square inch gauge) differential pressure transducers placed on the short (5 ft [15 m] depth) tube with the other 25 ft (76 m) tube referenced to atmospheric pressure Mini-seismographs were also placed on the surface close to selected monitoring holes to measure PPV
Table 1 - Mini-Seismograph and Pressure Transducer Placement at Latrobe Field Site
Shot Mini-Seismograph
Pressure Transducer
Shot Mini-Seismograph
Pressure Transducer
1 Hole 1 Hole 1 5 Hole 8 Hole 8 Hole 2 Hole 2 Hole 9 Hole 3 Hole 3 Hole 4 Hole 4 6 Hole 6 Hole 5 Hole 7 Hole 6 2 Hole 2 Hole 1 Hole 8 Hole 7 Hole 3 Hole 2 Hole 9 Hole 8 Hole 4 Hole 3 Hole 9 Hole 4 7 Hole A Hole A 4 Hole 5 Hole D Hole B Hole 6 Hole C Hole 7 Hole D Hole 8 Hole E 5 Hole 5 Hole 5 8 Hole F Hole F Hole 6 Hole 6 Hole G Hole G
Table 1 - Mini-Seismograph and Pressure Transducer Placement at Latrobe Field Site
Shot Mini-Seismograph
Pressure Transducer Shot Mini-
Seismograph Pressure
Transducer Hole 7 Hole 7 Hole H Hole H
After each shot the gases within each of the monitoring boreholes were measured using MSA FiveStars with pump attachments and two Testo 350s One or both of the Testo 350s were set up to record gas concentration data (CO NO NO2 and O2) overnight with an average reading being logged at least every 30 minutes The gas probe from the respective analyzer was attached to the longer tube to sample gas at 24 ft (73 m) below the surface CO NO NO2 CH4 and O2 concentrations were measured periodically at each monitoring hole using MSA FiveStars Gas samples were also collected in (092-in3 [15-ml]) Vacutainer glass sampling bottles for subsequent gas chromatograph (GC) analysis The GC analysis was used to verify CO concentrations and also identify any O2 H2 CO CH4 and heavier hydrocarbons through C5 that might have been present in the detonation products The final 2 shots (7-8) monitored at the Latrobe field site were substantially different from the first 6 shots Shallower hole depths ranged from only 10 to 12 ft (3 to 365 m) There were more rows and holes per row in a 12 ft by 12 ft (365 m by 365 m) pattern as shown in Figure 5 Thirty-five pounds (159 kg) of emulsionAN packaged explosive were loaded in each hole with 7-9 ft (21-274 m) of drill cuttings for stemming The same borehole liner configurations were used as for shots 1-6 except the gas sample tubes only extended to depths of 10 ft (305 m) and 1 ft (03 m) RESULTS AND DISCUSSION PRL FIELD SITE SHOT DATA
A preliminary shot at the PRL field site used Hole O as the loaded hole (see Figure 1) The detonation hole for the shot discussed here was Hole L with all other holes as monitoring points The pressures in selected boreholes were recorded along with peak particle velocity (PPV) at various locations (Figure 1) Figure 6 shows a typical borehole pressure history and PPV measured at the top of Hole A The initial rise in the borehole pressure history occurs at the same time as the seismic signal arrives at the top of the hole At Hole A the PPV peaks at just over 4 ins (10 cms) as the shock wave radiates away from the blast site Within 02 seconds after the blast there is very little seismic activity remaining As the shock wave passes through the ground and intersects the hole there is a sharp rise in pressure to about 013 psig (0896 kPa) The initial gas pressure pulse due to the shock wave interaction with the borehole then decays as does the seismic activity at about 02 seconds after the blast Following this initial decay the pressure builds more slowly to about 015 psig (103 kPa) and then decays to almost zero pressure in about 2 seconds as the detonation gases cool This longer duration gas pressure pulse is believed to be associated with the compression of the gases within the fracture zone surrounding the blast hole The maximum gas pressure decreases with increasing distance from the hole as is shown in Table 2 which is a composite of all measured pressure histories around shot Hole L
Table 2 ndash Peak Pressure Curve Area and Next-Day CO Measurements at PRL
Hole Next-Day CO Measurements ppm
Peak Pressure psi (kPa)
Pressure Curve Area psi-sec (kPa-sec)
E 1055 054 (372) 047 (324)
N 276 107 (738) 055 (379)
J 44 029 (200) 033 (228)
C 13 044 (303) 039 (269)
G 0 031 (214) 036 (248)
H 0 014 (097) 027 (186)
A 0 015 (103) 025 (172)
T 0 009 (062) 019 (131)
Immediate post-shot gas sampling did not indicate the presence of CO or other detonation gases The CO did not appear for several minutes or in some cases several hours after the detonation Shown in Figure 7 is the CO concentration in Hole M for 3 periods of sampling over 55 hours after the shot Due to logistical problems it was not possible to record continuous measurements throughout the 55 hours The CO concentration had peaked sometime between 5 hours and 23 hours after the shot while the PPV and borehole pressure dissipated in less than 2 seconds after the shot This suggests that the gas pressure pulse recorded at the borehole is not produced from net movement of detonation products to the monitoring hole but by the compression of pre-existing gases between the detonation hole and the monitoring hole Therefore the controlling factor for CO migration appears to be the diffusion transport of CO However the higher the pressures and impulses suggest more open pathways for enhanced CO migration between them Because there is a relationship between decreasing barometric pressure and methane out-gassing from coal mines significant changes in barometric pressure have to be considered as a factor that might affect the retention of CO within the ground and its migration9101112 One would expect to see similar influences on CO retention and migration Figure 8 displays the rise of CO concentration in Hole M and the barometric pressure on the same day after the shot In this test the CO concentration within the hole more than triples from 4000 ppm to about 14000 ppm in about a 3 frac12-hour period while the barometric pressure remains relatively constant at about 297 in Hg (755 mm Hg) Figure 9 shows a decreasing CO concentration from 12000 ppm to 8200 ppm over a 4-hour period in Hole M on the day after the shot at the PRL field site During this same period the barometric pressure rose slightly from 2986 in Hg (7585 mm Hg) to 2990 in Hg (7598 mm Hg) then returned to its initial value while the CO concentration decay rate remained relatively constant at about 690 ppmhour From the data shown in figures 8 and 9 barometric pressure did not appear to significantly influence CO migration Shown in Figure 10 is the concentration of CO measured within Hole M The concentration remained at 2200 ppm 72 hours after the shot before starting to decline at a rate of 233 ppmhr In an attempt to enhance CO extraction on the fourth day after the shot a Shop-Vac was used to apply suction to Holes
H and J The suction applied at Hole H 30 ft (91 m) away from Hole M pulled about 96 CFM (2718 Lmin) producing a borehole pressure of -8 inches (-2032 cm) of water gauge (in WG) Shortly after the suction was applied the rate of CO concentration decline more than doubled from 233 ppmhr to 580 ppmhr After about 90 minutes the suction was stopped at Hole H and about 10 minutes later was applied to Hole J (20 ft [61 m] away from Hole M) The applied suction produced 109 CFM (3087 Lmin) at a differential pressure of -19 in (-4826 cm) WG The authors expected a higher CO decay rate since Hole J was closer to injection Hole M In fact the decay was less This finding indicates there may be better or more selective communication pathways between Hole M and Hole H than between Hole M and Hole J even though Hole J was 10 ft (305 m) closer to Hole M When suction was discontinued at Hole J the rate of CO concentration decay at Hole M continued at about 132 ppmhr but was beginning to level off as shown in Figure 10
MITIGATION
To further investigate the effectiveness of borehole vacuum as a mitigation technique an 800 ppm CO300 ppm NObalance N2 gas was injected into Hole M The CO concentration history in Hole N 10 ft (3 m) from injection Hole M was continuously recorded while suction was alternately applied to holes G H D and A Figure 11 displays one concentration history measured at Hole N while the vacuum was applied to Hole G At time zero the gas injection started at Hole M about 20 minutes later the CO appeared in Hole N The concentration climbed rapidly to about 225 ppm and when the gas injection was stopped the CO concentration started to decay at about 7 ppmhr About 2 hours into the experiment suction was started at Hole G The CO concentration in Hole N decayed rapidly at about 188 ppmhr and slowed to about 17 ppmhr when the vacuum was stopped When suction was applied at Hole A H and J similar results were obtained
LATROBE FIELD SITE SHOT DATA
Core samples were obtained at the Latrobe field site to get a better understanding of the soil profile and bedrock The top 26 to 40 ft (79 to 1585 m) of material was to be removed by blasting The core samples indicated that only about 1 to 2 in (25 to 508 cm) of topsoil existed on the site Beneath the topsoil was 9 to 11 ft (274 to 335 m) of clayey sand a thin band of shale and coal 12 ft of sandy siltstone and finally limestone for the final grade at the bottom
Data collected during the shots at Latrobe included recorded peak pressure values pressure impulse curve areas and CO concentration measurements following the day of the shot (Table 3) Although one would think that more CO would be detected in holes located closer to the blast this did not hold true especially in the case of Hole 8 After shot 4 CO measurements were highest (gt2000 ppm) at Hole 8 which was farther from the blast than Holes 5 6 and 7 After evaluation of shots 5 and 6 it is clear that there is a preference for CO to migrate towards Hole 8 (the CO in Hole 8 was at least double that measured in any other hole) even though the distances to holes 5 through 8 are similar Detailed geology of the area was not available to map the sequence of joints and fracture systems that run through the area However the contractor encountered numerous voids ranging 8-12 in wide (20-30 cm) wide that were empty or filled with mud These void spaces generally ran in an East-West direction Data was not gathered for shot 3 and is not included in Table 3
Table 3 ndash Peak Pressure Curve Area
and Next-Day CO Measurements at Latrobe Field Site
Shot Number Hole
Distance from Shot
Next-Day CO
Measure ments
Peak Pressure Curve Area PPV
ft m ppm psi kPa psi-s kPa-s ins cms
1 1 100 305 42 0404 2785 6662 45933 6 15
2 150 457 11 0159 1096 4442 30627 4 11
3 200 610 3 0039 0270 0604 4164 4 10
4 250 762 2 0038 0259 0290 1999 3 7
2 1 32 96 17 0000 0000 0
2 82 248 27 0188 1296 9182 63308 18 46
3 132 401 18 0084 0576 4985 34370 9 23
4 182 553 12 0056 0386 1728 11914 7 18
4 5 50 152 436 0000 0000 20 51
6 100 305 0000 0000 10 26
7 150 457 106 0000 0000 7 17
8 200 610 gt2000 0000 0000 4 10
9 215 655 27 0000 0000 0
5 5 127 387 241 0248 1710 7993 55110 7 17
6 129 393 0115 0793 7530 51918 7 18
7 127 387 4 0146 1007 2250 15513 7 17
8 125 381 8895 0534 3682 10523 72554 7 18
9 68 207 301 -0162 -1117 6242 43037 0
6 5 51 154 78 -0052 -0361 5629 38811 0
6 48 145 -1540 -10618 11805 81393 15 38
7 43 132 1050 -5350 -36887 11010 75911 19 48
8 45 137 4732 0186 1282 3087 21284 22 55
9 43 131 558 -1040 -7171 4870 33577 24 61
7 A 60 183 23 -0021 -0145 0240 1655 385 10
B 30 91 1699 -0072 -0498 0864 5957 0
Table 3 ndash Peak Pressure Curve Area and Next-Day CO Measurements at Latrobe Field Site
Shot Number Hole
Distance from Shot
Next-Day CO
Measure ments
Peak Pressure Curve Area PPV
ft m ppm psi kPa psi-s kPa-s ins cms
C 30 91 23 -0097 -0672 1081 7453 0
D 60 183 19 -0034 -0232 0252 1737 395 10
E 45 137 12 -0007 -0050 0177 1220 0
8 F 15 46 227 -0917 -6322 1049 7233 17 44
G 29 88 5720 -0889 -6129 13452 92748 13 32
H 76 232 11 -0061 -0421 1420 9791 5 12
PRESSURE HISTORIES
Shown in Figure 13 are the pressure histories that were recorded at holes 5 6 7 8 and 9 from the detonation of about 23900 lbs (10841 kg) of explosives during Shot 4 Figure 3 is the plan view of blast holes and satellite monitoring holes for the Latrobe field site Hole 8 which is 125 ft (381 m) from the edge of the blast yielded the highest pressure of about 0534 psi (368 kPa) while Hole 9 which was closer showed about -0162 psi (-1117 kPa) Figure 13 shows that the pressure stays up for quite some time It may be due to the entrapped detonation gases cooling and the underground pressure within the fractures equilibrating
In contrast Figure 14 is the satellite borehole pressure histories for Latrobe shot 6 where all monitoring holes were closer to the last row of shot holes (about 43-50 ft [131-1524 m]) than in previous shot 5 Notice that only Hole 8 showed a quasi-static positive pressure of about 018 psi (124 kPa) whereas for holes 5 6 7 and 9 the pressures were significantly negative or below ambient pressure The negative pressure swing may be due to additional void spaces being created as the explosive detonates fracturing and lifting the ground The additional volume creates lower pressure until air and gases can flow in and bring the pressure back to atmospheric
Because Hole 8 showed a dramatic increase in CO as compared to the other holes holes 5-9 were examined with a borehole camera after shot 6 These holes had been drilled to a depth of 40 ft (122 m) The camera recorded perpendicular to the wall of the hole Water infiltrated all of the holes at approximately 23 ft (7 m) below grade Hole 6 had a water level of 26 ft (79 m) while Hole 7 and Hole 9 had water levels of 38 and 41 feet (116 and 125 m) respectively Hole 8 did not have any water accumulation However Hole 8 did have a very noticeable vertical fracture This vertical fracture which would most likely not allow for the accumulation of water could also serve as a conduit for CO movement
Motivating this experiment some researchers and blasters have asked the question ldquoIs there an obvious relationship between measured pressure history recorded at a satellite monitoring hole and the
subsequent CO concentration or migration rate of CO to that locationrdquo The initial thinking was that a higher post-blast quasi-static pressure might indicate the degree of open fractures and communication pathways between the shot rubble and the satellite monitoring holes
To help answer the above question Figure 12 displays the pressure curves for all of the holes associated with the shot Hole N and E have the highest pressures and greater area under the curve They also show the highest amounts of CO measured the next day (presented in Table 2) Table 2 shows the CO concentration about 24 hours following the shot the peak pressure value and the area under the pressure-time curve for each of the holes measured Although the pressure peaks or the impulse are not indicative quantitatively of the degree to which CO will appear they do seem to indicate qualitatively that the higher the pressure recorded in the hole the more CO is likely to appear
PRESSURE CURVE AREAS AND PPV
Figures 15 and 16 show a close relationship between the pressure curve area and the next-day CO measurements versus the scaled distance (the distance divided by the cubed root of total weight of explosives used in the shot)13 In Figure 15 as the distance increases the pressure curve area and the CO measured in the hole the next-day decreases The plots of pressure curve area and the CO measurement exhibit a similar trend Although the values in Figure 16 do not exhibit the same curve as in Figure 15 the pressure curve area and CO measurements do exhibit a similar trend The high values of about 13 psi-sec (8963 kPa-sec) and 6000 ppm CO may be due to an overriding conduit similar to what was seen for Hole 8 in the earlier shots The effects of an open pathway seem to overwhelm and obscure any other trend There appears to be a general trend where the higher the pressure impulse the more CO is measured
There are many factors involved that differed between the shots displayed on Figure 15 (shots 1 and 2) and Figure 16 (shots 7 and 8) Some of these factors include blasting in a different area shorter hole depths (40 ft vs 10 ft [122 m vs 3 m]) degree of wetness in the holes amount of explosives used and time delays used in the shots
Figures 15 and 16 also display the PPVs corresponding to the next-day CO measurements and the pressure curve areas Looking at Figure 15 alone it would seem that the higher the PPV the higher the CO concentration However this does not always prove to be true based on the results from shots 7 and 8 (Figure 16) The high PPV of 17 insec (43 cmsec) of shot 8 is associated with the low pressure curve area of 1049 psi-sec (7233 kPa-sec) The PPV of 13 insec (33 cmsec) of shot 8 has the highest pressure curve area of 13452 psi-sec (92748 kPa)
The data from shot 5 (Figure 17) shows an even more dramatic disparity of PPV and CO While all the holes measure 7 insec (18 cmsec) PPV the pressure areas varied along with the CO measurements Hole 8 had 4732 ppm CO and the largest pressure curve area of 10523 psi-sec (72553 kPa-sec) while Hole 7 had the lowest next-day CO concentration of 4 ppm and the smallest pressure curve area of 225 psi-sec (1551 kPa-sec) The distance from the shot varied only by 2 ft (06 m) Thus the PPV does not appear to be a good indicator of CO migration
In addition to the online gas analyzer used in this study to follow the CO concentration over time gas samples were collected on a few of the monitoring holes for subsequent analysis by gas chromatography
(GC) Shown in Table 4 is GC analysis of samples from Hole 7 and 8 after shots 6 and 5 respectively In Hole 8 the sample results show 6300 ppm CO 4500 ppm H2 015 methane 57 ppm ethylene and 30 ppm ethane
Table 4 ndash GC Analysis of Select Monitoring Borehole Gas Samples Latrobe Field Site Location H2 O2 N2 CH4 CO CO2 C2H4 C2H6 Ar
ppm ppm ppm ppm Hole 7 760 310 9074 004 890 502 6 6 093 Hole 8 4500 880 8310 015 6300 595 57 30 093
The presence of high concentrations of CO and H2 can be indicative of either non-ideal detonation the detonation of a fuel-rich formulation or a combination of both If the fuel oil was not distributed uniformly throughout the prills during the one- to two-hour period before the detonation there may be zones within the prill column where the fuel oil concentration varies from fuel-lean to fuel-rich condition Such variations could produce a less than ideal or uniform detonation Therefore less efficient and lower temperature combustion would occur Both would contribute to the formation of CO H2 methane ethane and ethylene14
When studying explosive detonation fumes some researchers follow the concentration of CO2 produced to measure the efficiency of combustion but in this study the CO2 concentration measured at a monitoring hole is strongly influenced by CO2 lost by absorption in the damp soil since CO2 is very water soluble compared to CO H2 methane ethane and ethylene Measurement of other detonation gases besides CO and NO such as H2 CH4 C2H6 and C2H4 may be helpful in understanding the relative in-hole detonation efficiency in particular when compared with the efficiency and products expected or predicted under ideal detonation condition NIOSH is continuing to study this issue as part of its inshyhouse research program
EFFECTS OF EXCAVATION
The effect of mucking on the Latrobe shots is illustrated in Figures 18 and 19 In Figure 18 the CO concentration in Hole 5 steadily increased for about 22 hours after shot 4 while the barometric pressure increased and decayed during this period At about 22 hours after shot 6 (as indicated in Figure 19) mucking operations began nearby At about this same time the CO concentration started to decrease In this case the near surface mucking operations seems to play a key role in reducing the concentration of trapped CO whereas the barometric pressure shows little to none The result can be contrasted with data shown in Figure 18 where no mucking occurred during the sampling period The barometric pressure rose and leveled to form two plateaus at about 3004 in Hg (763 mm Hg) and 3005 in Hg (7633 mm Hg) approximately 7 and 20 hours after the shot respectively Approximately 7 hours after the shot CO appeared in the monitoring hole and steadily increased to almost 500 ppm despite the plateaus in barometric pressure This rise in pressure may have caused by the redistribution of trapped gas producing a rise in CO concentration
Figure 20 shows the CO accumulation after the first shot in the 10-ft (305-m) deep holes The top of the muck pile was excavated overnight Holes B and C were monitored and both reached a peak or plateau in CO during the night at about 22 hours Prior to this peak being reached the CO had increased from 0 to 2500 ppm despite a decrease in barometric pressure
After the shot 8 (no excavation) the CO did not dissipate from the ground (see Figure 21) There was an initial dramatic increase until it leveled off at about 5100 ppm After it leveled the CO curve followed the barometric pressure When the barometric pressure increased 002 in Hg (05 mm Hg) the
CO concentration increased from 5100 ppm to 6100 ppm The excavation of the material may have removed all CO from the immediate rubble material but as supported by the figures did not significantly impact the CO that had already traveled into the cracks and fissures beyond the rubble zone SUMMARY Preliminary results do not indicate a consistent relationship between measured PPV or borehole pressures at monitoring holes and the subsequent migration of CO to those locations There are general trends in the data that suggest a relationship but unknown variations in geology of rock formation from site to site fracture systems old trenches or other anomalies make it impossible to predict or locate the potential migration paths away from the shot Based on this study changes in barometric pressure did not significantly influence the subsurface CO migration whereas the application of suction on holes placed between the shot and monitoring point was very effective in reducing the concentration of trapped CO Based on this result applying negative pressure to a hole or series of holes shows promise as an effective mitigation technique At the PRL site the rate of CO disappearance with negative pressure application to sealed holes is much more effective than letting it naturally dissipate The effectiveness of this technique was also demonstrated in the study of the Amherst NY incident6 Also the vacuum technique need not be applied to every shot but rather when a problem with CO migration is encountered As in these studies the CO can persist for several weeks if no action is taken to remove the trapped CO Thus the CO could remain trapped and continue to migrate along available pathways Mucking does appear to help remove some gas but depending on when mucking is done relative to the shot CO may migrate beyond the rubble zone Mucking at a later stage will not completely remove the CO already migrated beyond the rubble area Studies continue to better understand the effects of mucking Clearly blastersrsquo awareness is important in preventing future CO poisonings Monitoring nearby enclosed spaces for toxic gases before and after blasting still remains the best recommendation for a first approach to intervention and triggering other actions ACKNOWLEDGMENTS The work of Cindy Hollerich Paul Kolarosky Jerry Morrow and Rich Sobeck technicians who instrumented and collected the data at both the NIOSH and Latrobe sites is gratefully acknowledged The assistance from Wampum Hardware and Atlas Construction was invaluable Without their help the data gathered at the Latrobe field location would not have been possible
A FB C D E G
H
I
J
K
L
M
P
R
S
T
N
O
N
Pressure Transducer Pressure Transducer and Seismograph
Detonation Hole
Monitoring Point
5 ft
5 ft
5 ft
5 ft
5 ft
5 ft
5 ft
5 ft
5 ft
5 ft
5 ft
5 ft
5ft
5 ft
5ft
5 ft
Figure 1 - PRL Sample Hole Layout
2 in PVC pipe
2 in PVC cap
Cement
2 frac12 in
10 ft
2 in
1 4 in
Gas Sampling Tube Pressure Monitoring Tube
3 in
(Not drawn to scale)
8 ft
Figure 2 - PRL Borehole Liners
Shot 1
Shot 2
Shot 3
Shot 4
Shot 5
Boreholes are spaced 15rsquox15rsquo 35rsquo - 40rsquo deep
5 6 7 8
9 1
2
3
4
Shot 6
Monitoring Hole Shot Hole N
Figure 3 - Latrobe Field Site Shots 1-6
4 in PVC pipe
Toilet Flange
4 in sleeve with screw plug
Wood Supports
Drill Cuttings
Sleeve
Fluted Skirt
25 ft
Gas Sampling Tube Pressure Transducer Tube
6 frac12 in Borehole Diameter
5 ft
Figure 4 - Latrobe Gas Sampling Borehole Configuration
Shot 7
Shot 8
AB
C
D
E
F
G N
H Monitoring Hole
Shot Hole
Boreholes are spaced 12rsquox12rsquo 10rsquo deep
Figure 5 - Latrobe Field Site Shots 7-8
05
0 02 04 06 08 1 12 14 16 18 2
Time seconds
Pressure
PPV
5
04 4
Pres
sure
psi
03 3
02 2
01 1
0 0
Part
icle
Vel
ocity
in
s
-01 -1
Figure 6 - Pressure and Particle Velocity vs Time Hole A
0
2000
4000
6000
8000
10000
12000
14000
16000
0 5 10 15 20 25 30 35 40 45 50 55
Time (hours elapsed since shot)
CO
Con
cent
ratio
n p
pm
14
142
144
146
148
15
152
154
156
CO O2
Oxy
gen
Figure 7 ndash CO and O2 concentrations Hole M after the shot
y = 32881x + 26314 R2 = 09904
0
2000
4000
6000
8000
10000
12000
14000
16000
000 025 050 075 100 125 150 175 200 225 250 275 300 325 350 375 400
Time (hours elapsed since shot)
CO
Con
cent
ratio
n (p
pm)
754
755
756
757
758
759
CO Barometric Pressure Linear (CO)
Bar
omet
ric P
ress
ure
(mm
Hg)
Figure 8 - Rise of CO concentration in Hole M on the Day of the shot
CO
Con
cent
ratio
n (p
pm)
14000 763
10000
12000 y = -69119x + 27602 R2 = 09671 762
8000 761
6000 760
2000
4000 759
0 225 230 235 240 245 250 255 260 265 270 275 280
758
Time (hours elapsed since shot)
CO Barometric Pressure Linear (CO)
Figure 9 - Decline Of CO Concentration In Hole M The Day After The Shot
Bar
omet
ric P
ress
ure
(mm
Hg)
2500 771 Start vacuum on hole H (30)
-233 ppmhr Stop vacuum on hole H 2000 770
CO
Con
cent
ratio
n (p
pm)
1500
-580 ppmhr Start vacuum on hole J (20)
769
1000 -290 ppmhr Stop vacuum on hole J
-132 ppmhr 768
500 767
0 705 710 715 720 725 730 735 740 745
Time (hours elapsed since shot)
CO Barometric Pressure
750 755 760 765 766
Bar
omet
ric P
ress
ure
(mm
Hg)
Figure 10 - Negative Pressure Applied as Mitigation Technique Hole M
133 CFM vacuum flow rate -12 in WC 7389 mm Hg barometric pressure
250250 Start vacuum Stop gas O2
Mea
sure
d A
mou
nt 200200 Measure natural decline R2 = 067 -7 slope
150
CO C
once
ntra
tion
(ppm
)
( -
O2)
100
Flow gas into ground Measure natural decline R2 = 097 -17 slope
CO 50
Stop vacuum 50
000 00 05 10 15 20 25 30 35 40 45 50
Time (hours) Elapsed Since Start of Gas Injection
150 Negative pressure applied R2 = 098 -188 slope
100
Figure 11 - Gas injection (Hole M) to evaluate negative pressure mitigation Vacuum applied to Hole G CO O2 concentration measured at Hole N
0 02
Hole N
Hole E
04 06 08
Hole C
Hole G
Hole J
Hole A Hole H Hole T
Hol
e pr
essu
re p
sig
2
15
1
05
0
-05
1
Time seconds
Figure 12 - Pressure History at Each Monitoring Hole PRL Shot
-03
-02
-01
0
01
02
03
04
05
06
0 10 20 30 40 50 60
Time seconds
Bor
e H
ole
Pres
sure
psi
g
Hole 5
Hole 6
Hole 7
Hole 8
Hole 9
Figure 13 - Pressure History for Holes 5-9 Latrobe Field Site Shot 5
-60 -55 -50 -45 -40 -35 -30 -25 -20 -15 -10 -05 00 05 10 15
0 5 10 15 20 25 30
Time seconds
Bor
e ho
le p
ress
ure
psig
Hole 5
Hole 6
Hole 7
Hole 8 Hole 9
Figure 14 - Pressure History for Holes 5-9 Latrobe Field Site Shot 6
0
2
4
6
8
10
12
14
16
18
20
0 2 4 6 8 10 12
DistanceWeight13 (ftlb13)
Pres
sure
Cur
ve A
rea
(psi
-sec
) PP
V (in
sec
)
0
5
10
15
20
25
30
35
40
45
Shot 1 Area Shot 2 Area Shot 1 PPV Shot 2 PPV Shot 1 CO Shot 2 CO
CO
Mea
sure
men
ts (n
ext-d
ay p
pm)
Figure 15 - Pressure Curve Area Peak Particle Velocity and Next-Day CO Measurements vs Scaled Distance Shots 1 and 2
0
2
4
6
8
10
12
14
16
18
0 1 2 3 4 5
DistanceWeight13 (ftlb13)
Pres
sure
Cur
ve A
rea
(psi
-sec
) PP
V (in
sec
)
0
1000
2000
3000
4000
5000
6000
7000
Shot 7 Area Shot 8 Area Shot 7 PPV Shot 8 PPV Shot 7 CO Shot 8 CO
CO
Mea
sure
men
ts (n
ext-d
ay p
pm)
Figure 16 - Pressure Curve Area Peak Particle Velocity and Next-Day CO Measurements vs Scaled Distance Shots 7 and 8
0
2
4
6
8
10
12
433 434 435 436 437 438 439 440 441 442
DistanceWeight13 (ftlb13)
Pres
sure
Cur
ve A
rea
(psi
-sec
) PP
V (in
sec
)
0
50
100
150
200
250
300
Shot 5 Area Shot 5 PPV Shot 5 CO
CO
Mea
sure
men
ts (n
ext-d
ay p
pm)
Figure 17 - Pressure Curve Area and CO vs Scaled Distance Latrobe Field Site Shot 5
0
100
200
300
400
500
600
15 20 25 30 35 Time (hours since shot)
ppm
CO
759
760
761
762
763
764
765
766
767
768
CO Baro Press
mm
Hg
0720 - 0721
Figure 18 ndash CO Monitoring at Hole 5 After
Shot 4 (No Excavation After the Shot)
0
200
400
600
800
1000
1200
1400
1600
1800
2000
15 20 25 30 35 Time (hours since shot)
ppm
CO
759
760
761
762
763
764
765
766
767
768
CO - Hole 7 - 43 ft Baro Press
mm
Hg
0729 - 0730
Figure 19 ndash CO Monitoring at Hole 7 After Shot 6
(Previous Shot Behind It Was Excavated)
0
500
1000
1500
2000
2500
3000
12 17 22 27 32 37 Time (hours since shot)
ppm
CO
759
760
761
762
763
764
765
766
767
768
CO - Hole B - 30 ft CO - Hole C - 30 ft Baro Press
mm
Hg
0809 - 0810
Figure 20 ndash CO Monitoring at Hole B amp C
After Shot 7 (The Top Of The Muck Pile Was
Excavated Overnight)
0
1000
2000
3000
4000
5000
6000
7000
12 17 22 27 32 37 Time (hours since shot)
ppm
CO
759
760
761
762
763
764
765
766
767
768
CO Baro Press
hPa
0811 - 0812
mm
Hg
Figure 21 ndash CO Monitoring At Hole G After
Shot 8 (No Excavation Overnight)
REFERENCES
1 Streng A G Evaluation of Toxic After-Detonation Gases Formed by Industrial Explosives Explosivstoffe Vol 19 No 34 1971 pp 58-642 Karmakar N C and S P Banerjee A Review of Laboratory and Field Test Methods for Studying Fume Characteristic of Explosives Journal of Mines Metals and Fuels Vol 32 No 12 Jan-Feb 1984 pp 398-4023 Santis Lon D A Summary of Subsurface Carbon Monoxide Migration Incidents Proceedings of the Twenty-Seventh Annual Conference on Explosives and Blasting Technique International Society of Explosives Engineers 2001 volume 2-AS pp 143-154 2001 4 Martel R L Treacutepanier L Boutin M Lavigne B Leacutevesque G Sanfaccedilon P Auger L Galarneau and P Brousseau Carbon Monoxide Poisoning From Blasting Operations in Construction Works An Earth Odyssey 20015 Harris M L J H Rowland and R J Mainiero Blasting Related Carbon Monoxide Incident in BristowVirginia International Society of Explosives Engineers 2004 volume 2 pp 319-327 2004 6 Harris M L J H Rowland and R J Mainiero CO Migration from Trench Blasting in Amherst New York International Society of Explosives Engineers 2004 volume 2 pp 25-39 2004
7 Technology News 488 Mainiero RJ [2001] Migration of blasting fumes into a western Pennsylvania home US Department of Health and Human Services Public Health Service Centers for Disease Control and Prevention National Institute for Occupational Safety and Health 8 Sapko M Rowland J H Mainiero R J and Isaac Zlochower [2002] Chemical and Physical Factors that Influence NOx Production During Blasting - Exploratory Study In Proceedings of the 28th Annual Conference on Explosives and Blasting Technique Las Vegas NV International Society of Explosives Engineers9 Carter HN Durst CS [1955-1956] The Influence of Barometric Changes on the Emission of Firedamp Transactions of the Institution of Mining Engineers Vol 115 pp 3-2910 Fuumlssell W Hudewentz D [1974] Die Barometrische Ausgasung-Beobachtungen Und Bekampfungsversuch Gluckauf 110 (1974) Nr 24 11 Eschenburg HM [1977] Note on the Interaction Between Barometric Pressure and Methane Issuing From Fissures Jnl Of the Mine Ventilation Society of Sout Africa Vol 30 pp 203-204 12 Stevenson JW [1968] Effects of Bleeder Entries During Atmospheric Pressure Changes Mining Engineering June 1968 pp 61-64 13 Blastersrsquo Handbook 17th Edition ed Robert B Hopler International Society of Explosives Engineers 1998 p 599 14 Rowland JH Mainiero RJ [2000] Factors affecting ANFO fumes production In Proceedings of the 26th Annual Conference on Explosives and Blasting Technique Anaheim CA International Society of Explosives Engineers pp 163-174
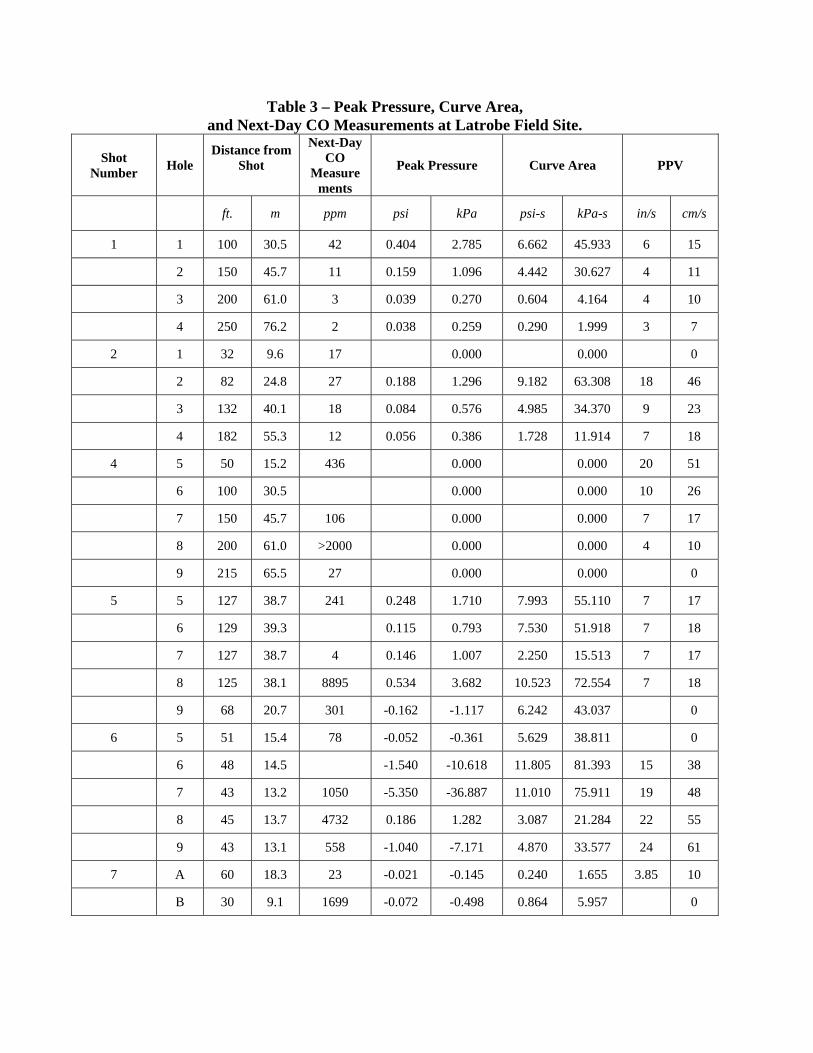
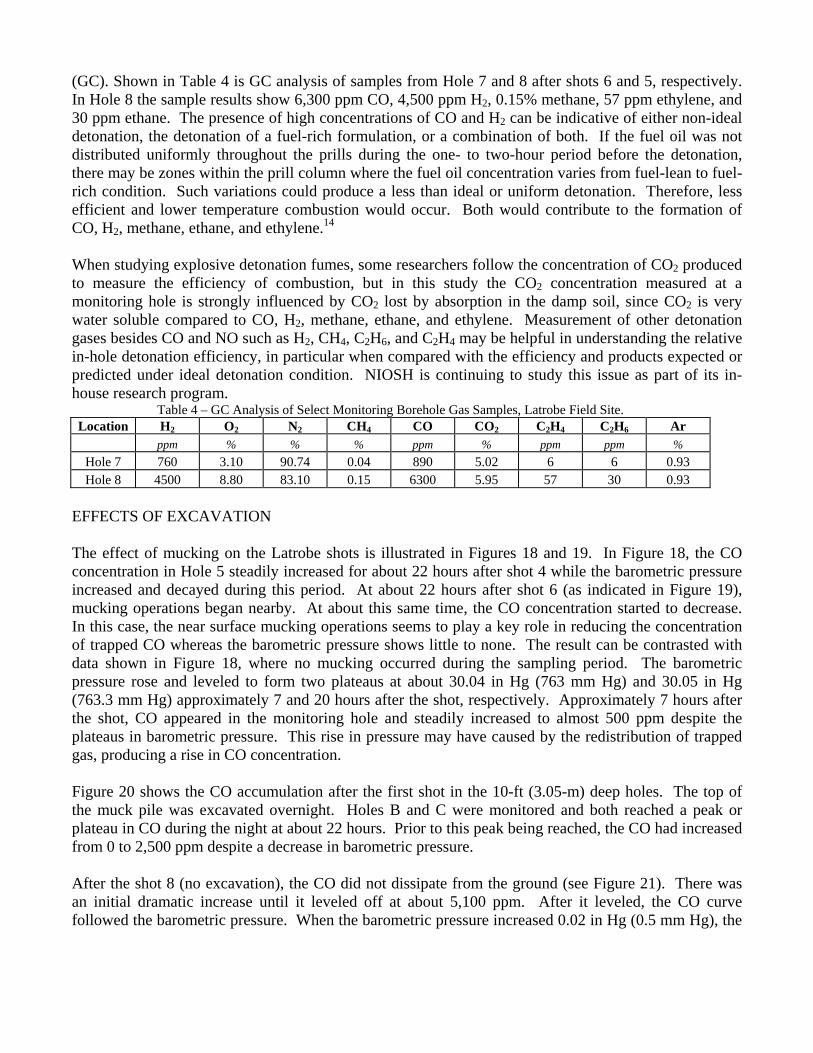

05
0 02 04 06 08 1 12 14 16 18 2
Time seconds
Pressure
PPV
5
04 4
Pres
sure
psi
03 3
02 2
01 1
0 0
Part
icle
Vel
ocity
in
s
-01 -1
Figure 6 - Pressure and Particle Velocity vs Time Hole A
0
2000
4000
6000
8000
10000
12000
14000
16000
0 5 10 15 20 25 30 35 40 45 50 55
Time (hours elapsed since shot)
CO
Con
cent
ratio
n p
pm
14
142
144
146
148
15
152
154
156
CO O2
Oxy
gen
Figure 7 ndash CO and O2 concentrations Hole M after the shot
y = 32881x + 26314 R2 = 09904
0
2000
4000
6000
8000
10000
12000
14000
16000
000 025 050 075 100 125 150 175 200 225 250 275 300 325 350 375 400
Time (hours elapsed since shot)
CO
Con
cent
ratio
n (p
pm)
754
755
756
757
758
759
CO Barometric Pressure Linear (CO)
Bar
omet
ric P
ress
ure
(mm
Hg)
Figure 8 - Rise of CO concentration in Hole M on the Day of the shot
CO
Con
cent
ratio
n (p
pm)
14000 763
10000
12000 y = -69119x + 27602 R2 = 09671 762
8000 761
6000 760
2000
4000 759
0 225 230 235 240 245 250 255 260 265 270 275 280
758
Time (hours elapsed since shot)
CO Barometric Pressure Linear (CO)
Figure 9 - Decline Of CO Concentration In Hole M The Day After The Shot
Bar
omet
ric P
ress
ure
(mm
Hg)
2500 771 Start vacuum on hole H (30)
-233 ppmhr Stop vacuum on hole H 2000 770
CO
Con
cent
ratio
n (p
pm)
1500
-580 ppmhr Start vacuum on hole J (20)
769
1000 -290 ppmhr Stop vacuum on hole J
-132 ppmhr 768
500 767
0 705 710 715 720 725 730 735 740 745
Time (hours elapsed since shot)
CO Barometric Pressure
750 755 760 765 766
Bar
omet
ric P
ress
ure
(mm
Hg)
Figure 10 - Negative Pressure Applied as Mitigation Technique Hole M
133 CFM vacuum flow rate -12 in WC 7389 mm Hg barometric pressure
250250 Start vacuum Stop gas O2
Mea
sure
d A
mou
nt 200200 Measure natural decline R2 = 067 -7 slope
150
CO C
once
ntra
tion
(ppm
)
( -
O2)
100
Flow gas into ground Measure natural decline R2 = 097 -17 slope
CO 50
Stop vacuum 50
000 00 05 10 15 20 25 30 35 40 45 50
Time (hours) Elapsed Since Start of Gas Injection
150 Negative pressure applied R2 = 098 -188 slope
100
Figure 11 - Gas injection (Hole M) to evaluate negative pressure mitigation Vacuum applied to Hole G CO O2 concentration measured at Hole N
0 02
Hole N
Hole E
04 06 08
Hole C
Hole G
Hole J
Hole A Hole H Hole T
Hol
e pr
essu
re p
sig
2
15
1
05
0
-05
1
Time seconds
Figure 12 - Pressure History at Each Monitoring Hole PRL Shot
-03
-02
-01
0
01
02
03
04
05
06
0 10 20 30 40 50 60
Time seconds
Bor
e H
ole
Pres
sure
psi
g
Hole 5
Hole 6
Hole 7
Hole 8
Hole 9
Figure 13 - Pressure History for Holes 5-9 Latrobe Field Site Shot 5
-60 -55 -50 -45 -40 -35 -30 -25 -20 -15 -10 -05 00 05 10 15
0 5 10 15 20 25 30
Time seconds
Bor
e ho
le p
ress
ure
psig
Hole 5
Hole 6
Hole 7
Hole 8 Hole 9
Figure 14 - Pressure History for Holes 5-9 Latrobe Field Site Shot 6
0
2
4
6
8
10
12
14
16
18
20
0 2 4 6 8 10 12
DistanceWeight13 (ftlb13)
Pres
sure
Cur
ve A
rea
(psi
-sec
) PP
V (in
sec
)
0
5
10
15
20
25
30
35
40
45
Shot 1 Area Shot 2 Area Shot 1 PPV Shot 2 PPV Shot 1 CO Shot 2 CO
CO
Mea
sure
men
ts (n
ext-d
ay p
pm)
Figure 15 - Pressure Curve Area Peak Particle Velocity and Next-Day CO Measurements vs Scaled Distance Shots 1 and 2
0
2
4
6
8
10
12
14
16
18
0 1 2 3 4 5
DistanceWeight13 (ftlb13)
Pres
sure
Cur
ve A
rea
(psi
-sec
) PP
V (in
sec
)
0
1000
2000
3000
4000
5000
6000
7000
Shot 7 Area Shot 8 Area Shot 7 PPV Shot 8 PPV Shot 7 CO Shot 8 CO
CO
Mea
sure
men
ts (n
ext-d
ay p
pm)
Figure 16 - Pressure Curve Area Peak Particle Velocity and Next-Day CO Measurements vs Scaled Distance Shots 7 and 8
0
2
4
6
8
10
12
433 434 435 436 437 438 439 440 441 442
DistanceWeight13 (ftlb13)
Pres
sure
Cur
ve A
rea
(psi
-sec
) PP
V (in
sec
)
0
50
100
150
200
250
300
Shot 5 Area Shot 5 PPV Shot 5 CO
CO
Mea
sure
men
ts (n
ext-d
ay p
pm)
Figure 17 - Pressure Curve Area and CO vs Scaled Distance Latrobe Field Site Shot 5
0
100
200
300
400
500
600
15 20 25 30 35 Time (hours since shot)
ppm
CO
759
760
761
762
763
764
765
766
767
768
CO Baro Press
mm
Hg
0720 - 0721
Figure 18 ndash CO Monitoring at Hole 5 After
Shot 4 (No Excavation After the Shot)
0
200
400
600
800
1000
1200
1400
1600
1800
2000
15 20 25 30 35 Time (hours since shot)
ppm
CO
759
760
761
762
763
764
765
766
767
768
CO - Hole 7 - 43 ft Baro Press
mm
Hg
0729 - 0730
Figure 19 ndash CO Monitoring at Hole 7 After Shot 6
(Previous Shot Behind It Was Excavated)
0
500
1000
1500
2000
2500
3000
12 17 22 27 32 37 Time (hours since shot)
ppm
CO
759
760
761
762
763
764
765
766
767
768
CO - Hole B - 30 ft CO - Hole C - 30 ft Baro Press
mm
Hg
0809 - 0810
Figure 20 ndash CO Monitoring at Hole B amp C
After Shot 7 (The Top Of The Muck Pile Was
Excavated Overnight)
0
1000
2000
3000
4000
5000
6000
7000
12 17 22 27 32 37 Time (hours since shot)
ppm
CO
759
760
761
762
763
764
765
766
767
768
CO Baro Press
hPa
0811 - 0812
mm
Hg
Figure 21 ndash CO Monitoring At Hole G After
Shot 8 (No Excavation Overnight)
REFERENCES
1 Streng A G Evaluation of Toxic After-Detonation Gases Formed by Industrial Explosives Explosivstoffe Vol 19 No 34 1971 pp 58-642 Karmakar N C and S P Banerjee A Review of Laboratory and Field Test Methods for Studying Fume Characteristic of Explosives Journal of Mines Metals and Fuels Vol 32 No 12 Jan-Feb 1984 pp 398-4023 Santis Lon D A Summary of Subsurface Carbon Monoxide Migration Incidents Proceedings of the Twenty-Seventh Annual Conference on Explosives and Blasting Technique International Society of Explosives Engineers 2001 volume 2-AS pp 143-154 2001 4 Martel R L Treacutepanier L Boutin M Lavigne B Leacutevesque G Sanfaccedilon P Auger L Galarneau and P Brousseau Carbon Monoxide Poisoning From Blasting Operations in Construction Works An Earth Odyssey 20015 Harris M L J H Rowland and R J Mainiero Blasting Related Carbon Monoxide Incident in BristowVirginia International Society of Explosives Engineers 2004 volume 2 pp 319-327 2004 6 Harris M L J H Rowland and R J Mainiero CO Migration from Trench Blasting in Amherst New York International Society of Explosives Engineers 2004 volume 2 pp 25-39 2004
7 Technology News 488 Mainiero RJ [2001] Migration of blasting fumes into a western Pennsylvania home US Department of Health and Human Services Public Health Service Centers for Disease Control and Prevention National Institute for Occupational Safety and Health 8 Sapko M Rowland J H Mainiero R J and Isaac Zlochower [2002] Chemical and Physical Factors that Influence NOx Production During Blasting - Exploratory Study In Proceedings of the 28th Annual Conference on Explosives and Blasting Technique Las Vegas NV International Society of Explosives Engineers9 Carter HN Durst CS [1955-1956] The Influence of Barometric Changes on the Emission of Firedamp Transactions of the Institution of Mining Engineers Vol 115 pp 3-2910 Fuumlssell W Hudewentz D [1974] Die Barometrische Ausgasung-Beobachtungen Und Bekampfungsversuch Gluckauf 110 (1974) Nr 24 11 Eschenburg HM [1977] Note on the Interaction Between Barometric Pressure and Methane Issuing From Fissures Jnl Of the Mine Ventilation Society of Sout Africa Vol 30 pp 203-204 12 Stevenson JW [1968] Effects of Bleeder Entries During Atmospheric Pressure Changes Mining Engineering June 1968 pp 61-64 13 Blastersrsquo Handbook 17th Edition ed Robert B Hopler International Society of Explosives Engineers 1998 p 599 14 Rowland JH Mainiero RJ [2000] Factors affecting ANFO fumes production In Proceedings of the 26th Annual Conference on Explosives and Blasting Technique Anaheim CA International Society of Explosives Engineers pp 163-174
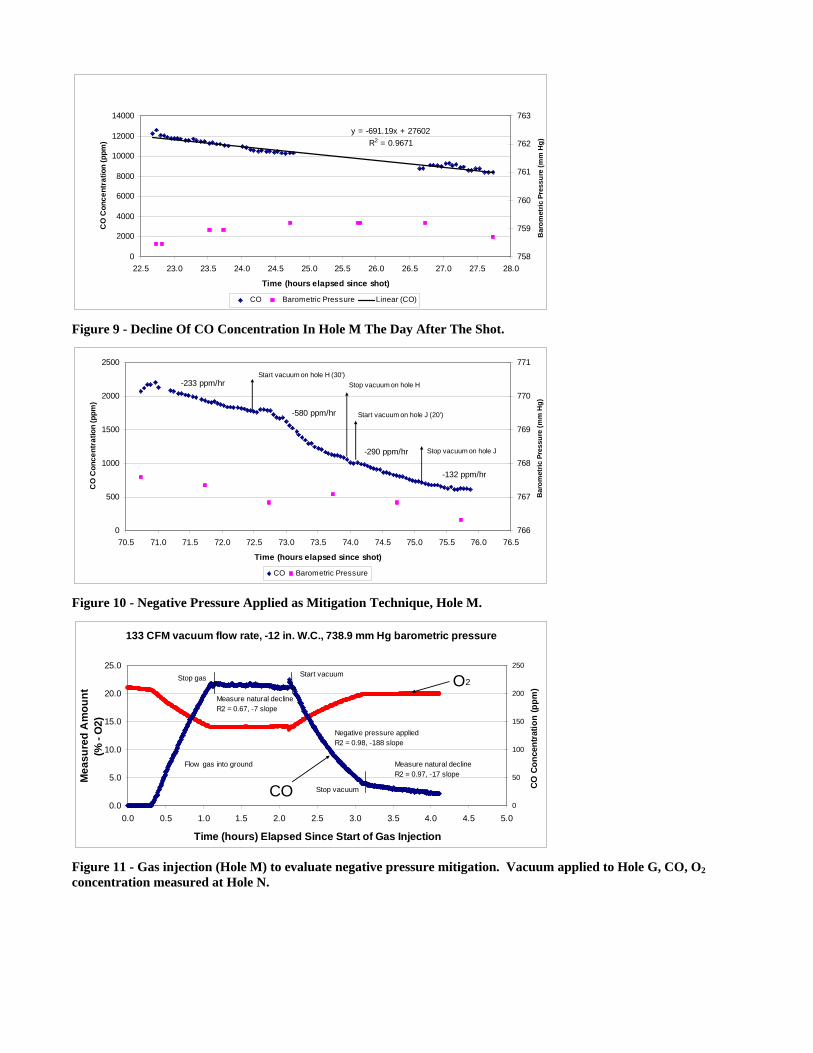
CO
Con
cent
ratio
n (p
pm)
14000 763
10000
12000 y = -69119x + 27602 R2 = 09671 762
8000 761
6000 760
2000
4000 759
0 225 230 235 240 245 250 255 260 265 270 275 280
758
Time (hours elapsed since shot)
CO Barometric Pressure Linear (CO)
Figure 9 - Decline Of CO Concentration In Hole M The Day After The Shot
Bar
omet
ric P
ress
ure
(mm
Hg)
2500 771 Start vacuum on hole H (30)
-233 ppmhr Stop vacuum on hole H 2000 770
CO
Con
cent
ratio
n (p
pm)
1500
-580 ppmhr Start vacuum on hole J (20)
769
1000 -290 ppmhr Stop vacuum on hole J
-132 ppmhr 768
500 767
0 705 710 715 720 725 730 735 740 745
Time (hours elapsed since shot)
CO Barometric Pressure
750 755 760 765 766
Bar
omet
ric P
ress
ure
(mm
Hg)
Figure 10 - Negative Pressure Applied as Mitigation Technique Hole M
133 CFM vacuum flow rate -12 in WC 7389 mm Hg barometric pressure
250250 Start vacuum Stop gas O2
Mea
sure
d A
mou
nt 200200 Measure natural decline R2 = 067 -7 slope
150
CO C
once
ntra
tion
(ppm
)
( -
O2)
100
Flow gas into ground Measure natural decline R2 = 097 -17 slope
CO 50
Stop vacuum 50
000 00 05 10 15 20 25 30 35 40 45 50
Time (hours) Elapsed Since Start of Gas Injection
150 Negative pressure applied R2 = 098 -188 slope
100
Figure 11 - Gas injection (Hole M) to evaluate negative pressure mitigation Vacuum applied to Hole G CO O2 concentration measured at Hole N
0 02
Hole N
Hole E
04 06 08
Hole C
Hole G
Hole J
Hole A Hole H Hole T
Hol
e pr
essu
re p
sig
2
15
1
05
0
-05
1
Time seconds
Figure 12 - Pressure History at Each Monitoring Hole PRL Shot
-03
-02
-01
0
01
02
03
04
05
06
0 10 20 30 40 50 60
Time seconds
Bor
e H
ole
Pres
sure
psi
g
Hole 5
Hole 6
Hole 7
Hole 8
Hole 9
Figure 13 - Pressure History for Holes 5-9 Latrobe Field Site Shot 5
-60 -55 -50 -45 -40 -35 -30 -25 -20 -15 -10 -05 00 05 10 15
0 5 10 15 20 25 30
Time seconds
Bor
e ho
le p
ress
ure
psig
Hole 5
Hole 6
Hole 7
Hole 8 Hole 9
Figure 14 - Pressure History for Holes 5-9 Latrobe Field Site Shot 6
0
2
4
6
8
10
12
14
16
18
20
0 2 4 6 8 10 12
DistanceWeight13 (ftlb13)
Pres
sure
Cur
ve A
rea
(psi
-sec
) PP
V (in
sec
)
0
5
10
15
20
25
30
35
40
45
Shot 1 Area Shot 2 Area Shot 1 PPV Shot 2 PPV Shot 1 CO Shot 2 CO
CO
Mea
sure
men
ts (n
ext-d
ay p
pm)
Figure 15 - Pressure Curve Area Peak Particle Velocity and Next-Day CO Measurements vs Scaled Distance Shots 1 and 2
0
2
4
6
8
10
12
14
16
18
0 1 2 3 4 5
DistanceWeight13 (ftlb13)
Pres
sure
Cur
ve A
rea
(psi
-sec
) PP
V (in
sec
)
0
1000
2000
3000
4000
5000
6000
7000
Shot 7 Area Shot 8 Area Shot 7 PPV Shot 8 PPV Shot 7 CO Shot 8 CO
CO
Mea
sure
men
ts (n
ext-d
ay p
pm)
Figure 16 - Pressure Curve Area Peak Particle Velocity and Next-Day CO Measurements vs Scaled Distance Shots 7 and 8
0
2
4
6
8
10
12
433 434 435 436 437 438 439 440 441 442
DistanceWeight13 (ftlb13)
Pres
sure
Cur
ve A
rea
(psi
-sec
) PP
V (in
sec
)
0
50
100
150
200
250
300
Shot 5 Area Shot 5 PPV Shot 5 CO
CO
Mea
sure
men
ts (n
ext-d
ay p
pm)
Figure 17 - Pressure Curve Area and CO vs Scaled Distance Latrobe Field Site Shot 5
0
100
200
300
400
500
600
15 20 25 30 35 Time (hours since shot)
ppm
CO
759
760
761
762
763
764
765
766
767
768
CO Baro Press
mm
Hg
0720 - 0721
Figure 18 ndash CO Monitoring at Hole 5 After
Shot 4 (No Excavation After the Shot)
0
200
400
600
800
1000
1200
1400
1600
1800
2000
15 20 25 30 35 Time (hours since shot)
ppm
CO
759
760
761
762
763
764
765
766
767
768
CO - Hole 7 - 43 ft Baro Press
mm
Hg
0729 - 0730
Figure 19 ndash CO Monitoring at Hole 7 After Shot 6
(Previous Shot Behind It Was Excavated)
0
500
1000
1500
2000
2500
3000
12 17 22 27 32 37 Time (hours since shot)
ppm
CO
759
760
761
762
763
764
765
766
767
768
CO - Hole B - 30 ft CO - Hole C - 30 ft Baro Press
mm
Hg
0809 - 0810
Figure 20 ndash CO Monitoring at Hole B amp C
After Shot 7 (The Top Of The Muck Pile Was
Excavated Overnight)
0
1000
2000
3000
4000
5000
6000
7000
12 17 22 27 32 37 Time (hours since shot)
ppm
CO
759
760
761
762
763
764
765
766
767
768
CO Baro Press
hPa
0811 - 0812
mm
Hg
Figure 21 ndash CO Monitoring At Hole G After
Shot 8 (No Excavation Overnight)
REFERENCES
1 Streng A G Evaluation of Toxic After-Detonation Gases Formed by Industrial Explosives Explosivstoffe Vol 19 No 34 1971 pp 58-642 Karmakar N C and S P Banerjee A Review of Laboratory and Field Test Methods for Studying Fume Characteristic of Explosives Journal of Mines Metals and Fuels Vol 32 No 12 Jan-Feb 1984 pp 398-4023 Santis Lon D A Summary of Subsurface Carbon Monoxide Migration Incidents Proceedings of the Twenty-Seventh Annual Conference on Explosives and Blasting Technique International Society of Explosives Engineers 2001 volume 2-AS pp 143-154 2001 4 Martel R L Treacutepanier L Boutin M Lavigne B Leacutevesque G Sanfaccedilon P Auger L Galarneau and P Brousseau Carbon Monoxide Poisoning From Blasting Operations in Construction Works An Earth Odyssey 20015 Harris M L J H Rowland and R J Mainiero Blasting Related Carbon Monoxide Incident in BristowVirginia International Society of Explosives Engineers 2004 volume 2 pp 319-327 2004 6 Harris M L J H Rowland and R J Mainiero CO Migration from Trench Blasting in Amherst New York International Society of Explosives Engineers 2004 volume 2 pp 25-39 2004
7 Technology News 488 Mainiero RJ [2001] Migration of blasting fumes into a western Pennsylvania home US Department of Health and Human Services Public Health Service Centers for Disease Control and Prevention National Institute for Occupational Safety and Health 8 Sapko M Rowland J H Mainiero R J and Isaac Zlochower [2002] Chemical and Physical Factors that Influence NOx Production During Blasting - Exploratory Study In Proceedings of the 28th Annual Conference on Explosives and Blasting Technique Las Vegas NV International Society of Explosives Engineers9 Carter HN Durst CS [1955-1956] The Influence of Barometric Changes on the Emission of Firedamp Transactions of the Institution of Mining Engineers Vol 115 pp 3-2910 Fuumlssell W Hudewentz D [1974] Die Barometrische Ausgasung-Beobachtungen Und Bekampfungsversuch Gluckauf 110 (1974) Nr 24 11 Eschenburg HM [1977] Note on the Interaction Between Barometric Pressure and Methane Issuing From Fissures Jnl Of the Mine Ventilation Society of Sout Africa Vol 30 pp 203-204 12 Stevenson JW [1968] Effects of Bleeder Entries During Atmospheric Pressure Changes Mining Engineering June 1968 pp 61-64 13 Blastersrsquo Handbook 17th Edition ed Robert B Hopler International Society of Explosives Engineers 1998 p 599 14 Rowland JH Mainiero RJ [2000] Factors affecting ANFO fumes production In Proceedings of the 26th Annual Conference on Explosives and Blasting Technique Anaheim CA International Society of Explosives Engineers pp 163-174
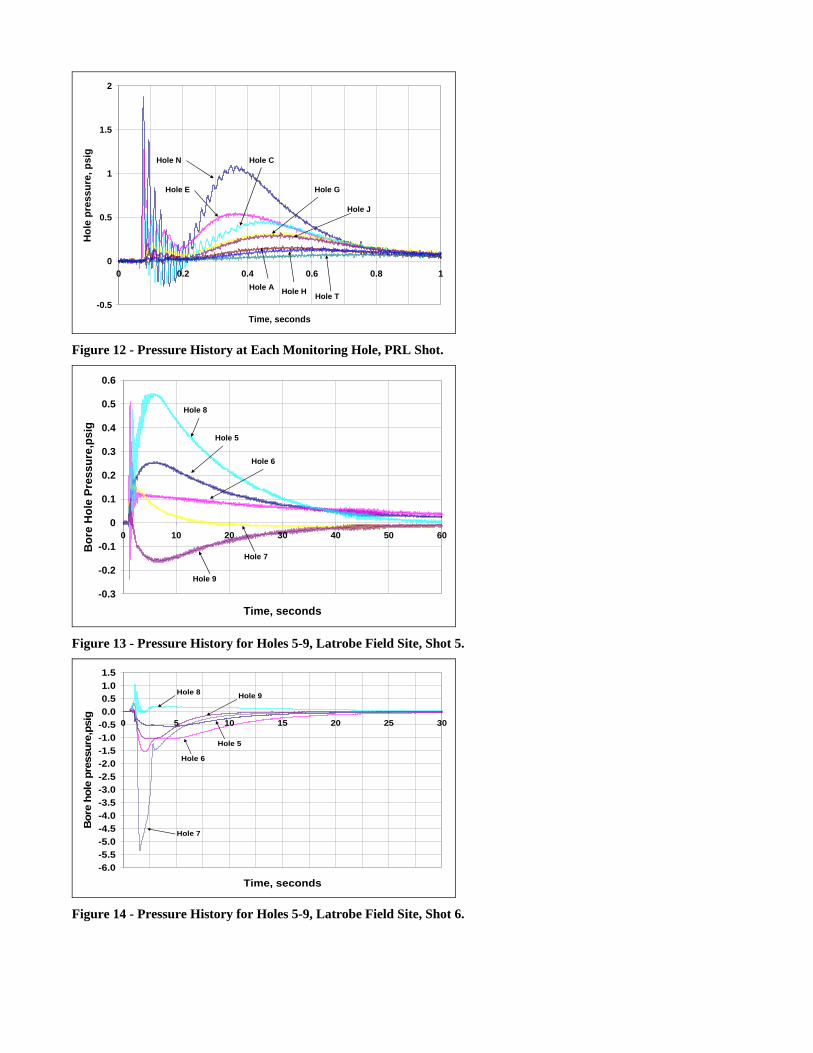

0
2
4
6
8
10
12
14
16
18
20
0 2 4 6 8 10 12
DistanceWeight13 (ftlb13)
Pres
sure
Cur
ve A
rea
(psi
-sec
) PP
V (in
sec
)
0
5
10
15
20
25
30
35
40
45
Shot 1 Area Shot 2 Area Shot 1 PPV Shot 2 PPV Shot 1 CO Shot 2 CO
CO
Mea
sure
men
ts (n
ext-d
ay p
pm)
Figure 15 - Pressure Curve Area Peak Particle Velocity and Next-Day CO Measurements vs Scaled Distance Shots 1 and 2
0
2
4
6
8
10
12
14
16
18
0 1 2 3 4 5
DistanceWeight13 (ftlb13)
Pres
sure
Cur
ve A
rea
(psi
-sec
) PP
V (in
sec
)
0
1000
2000
3000
4000
5000
6000
7000
Shot 7 Area Shot 8 Area Shot 7 PPV Shot 8 PPV Shot 7 CO Shot 8 CO
CO
Mea
sure
men
ts (n
ext-d
ay p
pm)
Figure 16 - Pressure Curve Area Peak Particle Velocity and Next-Day CO Measurements vs Scaled Distance Shots 7 and 8
0
2
4
6
8
10
12
433 434 435 436 437 438 439 440 441 442
DistanceWeight13 (ftlb13)
Pres
sure
Cur
ve A
rea
(psi
-sec
) PP
V (in
sec
)
0
50
100
150
200
250
300
Shot 5 Area Shot 5 PPV Shot 5 CO
CO
Mea
sure
men
ts (n
ext-d
ay p
pm)
Figure 17 - Pressure Curve Area and CO vs Scaled Distance Latrobe Field Site Shot 5
0
100
200
300
400
500
600
15 20 25 30 35 Time (hours since shot)
ppm
CO
759
760
761
762
763
764
765
766
767
768
CO Baro Press
mm
Hg
0720 - 0721
Figure 18 ndash CO Monitoring at Hole 5 After
Shot 4 (No Excavation After the Shot)
0
200
400
600
800
1000
1200
1400
1600
1800
2000
15 20 25 30 35 Time (hours since shot)
ppm
CO
759
760
761
762
763
764
765
766
767
768
CO - Hole 7 - 43 ft Baro Press
mm
Hg
0729 - 0730
Figure 19 ndash CO Monitoring at Hole 7 After Shot 6
(Previous Shot Behind It Was Excavated)
0
500
1000
1500
2000
2500
3000
12 17 22 27 32 37 Time (hours since shot)
ppm
CO
759
760
761
762
763
764
765
766
767
768
CO - Hole B - 30 ft CO - Hole C - 30 ft Baro Press
mm
Hg
0809 - 0810
Figure 20 ndash CO Monitoring at Hole B amp C
After Shot 7 (The Top Of The Muck Pile Was
Excavated Overnight)
0
1000
2000
3000
4000
5000
6000
7000
12 17 22 27 32 37 Time (hours since shot)
ppm
CO
759
760
761
762
763
764
765
766
767
768
CO Baro Press
hPa
0811 - 0812
mm
Hg
Figure 21 ndash CO Monitoring At Hole G After
Shot 8 (No Excavation Overnight)
REFERENCES
1 Streng A G Evaluation of Toxic After-Detonation Gases Formed by Industrial Explosives Explosivstoffe Vol 19 No 34 1971 pp 58-642 Karmakar N C and S P Banerjee A Review of Laboratory and Field Test Methods for Studying Fume Characteristic of Explosives Journal of Mines Metals and Fuels Vol 32 No 12 Jan-Feb 1984 pp 398-4023 Santis Lon D A Summary of Subsurface Carbon Monoxide Migration Incidents Proceedings of the Twenty-Seventh Annual Conference on Explosives and Blasting Technique International Society of Explosives Engineers 2001 volume 2-AS pp 143-154 2001 4 Martel R L Treacutepanier L Boutin M Lavigne B Leacutevesque G Sanfaccedilon P Auger L Galarneau and P Brousseau Carbon Monoxide Poisoning From Blasting Operations in Construction Works An Earth Odyssey 20015 Harris M L J H Rowland and R J Mainiero Blasting Related Carbon Monoxide Incident in BristowVirginia International Society of Explosives Engineers 2004 volume 2 pp 319-327 2004 6 Harris M L J H Rowland and R J Mainiero CO Migration from Trench Blasting in Amherst New York International Society of Explosives Engineers 2004 volume 2 pp 25-39 2004
7 Technology News 488 Mainiero RJ [2001] Migration of blasting fumes into a western Pennsylvania home US Department of Health and Human Services Public Health Service Centers for Disease Control and Prevention National Institute for Occupational Safety and Health 8 Sapko M Rowland J H Mainiero R J and Isaac Zlochower [2002] Chemical and Physical Factors that Influence NOx Production During Blasting - Exploratory Study In Proceedings of the 28th Annual Conference on Explosives and Blasting Technique Las Vegas NV International Society of Explosives Engineers9 Carter HN Durst CS [1955-1956] The Influence of Barometric Changes on the Emission of Firedamp Transactions of the Institution of Mining Engineers Vol 115 pp 3-2910 Fuumlssell W Hudewentz D [1974] Die Barometrische Ausgasung-Beobachtungen Und Bekampfungsversuch Gluckauf 110 (1974) Nr 24 11 Eschenburg HM [1977] Note on the Interaction Between Barometric Pressure and Methane Issuing From Fissures Jnl Of the Mine Ventilation Society of Sout Africa Vol 30 pp 203-204 12 Stevenson JW [1968] Effects of Bleeder Entries During Atmospheric Pressure Changes Mining Engineering June 1968 pp 61-64 13 Blastersrsquo Handbook 17th Edition ed Robert B Hopler International Society of Explosives Engineers 1998 p 599 14 Rowland JH Mainiero RJ [2000] Factors affecting ANFO fumes production In Proceedings of the 26th Annual Conference on Explosives and Blasting Technique Anaheim CA International Society of Explosives Engineers pp 163-174

0
100
200
300
400
500
600
15 20 25 30 35 Time (hours since shot)
ppm
CO
759
760
761
762
763
764
765
766
767
768
CO Baro Press
mm
Hg
0720 - 0721
Figure 18 ndash CO Monitoring at Hole 5 After
Shot 4 (No Excavation After the Shot)
0
200
400
600
800
1000
1200
1400
1600
1800
2000
15 20 25 30 35 Time (hours since shot)
ppm
CO
759
760
761
762
763
764
765
766
767
768
CO - Hole 7 - 43 ft Baro Press
mm
Hg
0729 - 0730
Figure 19 ndash CO Monitoring at Hole 7 After Shot 6
(Previous Shot Behind It Was Excavated)
0
500
1000
1500
2000
2500
3000
12 17 22 27 32 37 Time (hours since shot)
ppm
CO
759
760
761
762
763
764
765
766
767
768
CO - Hole B - 30 ft CO - Hole C - 30 ft Baro Press
mm
Hg
0809 - 0810
Figure 20 ndash CO Monitoring at Hole B amp C
After Shot 7 (The Top Of The Muck Pile Was
Excavated Overnight)
0
1000
2000
3000
4000
5000
6000
7000
12 17 22 27 32 37 Time (hours since shot)
ppm
CO
759
760
761
762
763
764
765
766
767
768
CO Baro Press
hPa
0811 - 0812
mm
Hg
Figure 21 ndash CO Monitoring At Hole G After
Shot 8 (No Excavation Overnight)
REFERENCES
1 Streng A G Evaluation of Toxic After-Detonation Gases Formed by Industrial Explosives Explosivstoffe Vol 19 No 34 1971 pp 58-642 Karmakar N C and S P Banerjee A Review of Laboratory and Field Test Methods for Studying Fume Characteristic of Explosives Journal of Mines Metals and Fuels Vol 32 No 12 Jan-Feb 1984 pp 398-4023 Santis Lon D A Summary of Subsurface Carbon Monoxide Migration Incidents Proceedings of the Twenty-Seventh Annual Conference on Explosives and Blasting Technique International Society of Explosives Engineers 2001 volume 2-AS pp 143-154 2001 4 Martel R L Treacutepanier L Boutin M Lavigne B Leacutevesque G Sanfaccedilon P Auger L Galarneau and P Brousseau Carbon Monoxide Poisoning From Blasting Operations in Construction Works An Earth Odyssey 20015 Harris M L J H Rowland and R J Mainiero Blasting Related Carbon Monoxide Incident in BristowVirginia International Society of Explosives Engineers 2004 volume 2 pp 319-327 2004 6 Harris M L J H Rowland and R J Mainiero CO Migration from Trench Blasting in Amherst New York International Society of Explosives Engineers 2004 volume 2 pp 25-39 2004
7 Technology News 488 Mainiero RJ [2001] Migration of blasting fumes into a western Pennsylvania home US Department of Health and Human Services Public Health Service Centers for Disease Control and Prevention National Institute for Occupational Safety and Health 8 Sapko M Rowland J H Mainiero R J and Isaac Zlochower [2002] Chemical and Physical Factors that Influence NOx Production During Blasting - Exploratory Study In Proceedings of the 28th Annual Conference on Explosives and Blasting Technique Las Vegas NV International Society of Explosives Engineers9 Carter HN Durst CS [1955-1956] The Influence of Barometric Changes on the Emission of Firedamp Transactions of the Institution of Mining Engineers Vol 115 pp 3-2910 Fuumlssell W Hudewentz D [1974] Die Barometrische Ausgasung-Beobachtungen Und Bekampfungsversuch Gluckauf 110 (1974) Nr 24 11 Eschenburg HM [1977] Note on the Interaction Between Barometric Pressure and Methane Issuing From Fissures Jnl Of the Mine Ventilation Society of Sout Africa Vol 30 pp 203-204 12 Stevenson JW [1968] Effects of Bleeder Entries During Atmospheric Pressure Changes Mining Engineering June 1968 pp 61-64 13 Blastersrsquo Handbook 17th Edition ed Robert B Hopler International Society of Explosives Engineers 1998 p 599 14 Rowland JH Mainiero RJ [2000] Factors affecting ANFO fumes production In Proceedings of the 26th Annual Conference on Explosives and Blasting Technique Anaheim CA International Society of Explosives Engineers pp 163-174

7 Technology News 488 Mainiero RJ [2001] Migration of blasting fumes into a western Pennsylvania home US Department of Health and Human Services Public Health Service Centers for Disease Control and Prevention National Institute for Occupational Safety and Health 8 Sapko M Rowland J H Mainiero R J and Isaac Zlochower [2002] Chemical and Physical Factors that Influence NOx Production During Blasting - Exploratory Study In Proceedings of the 28th Annual Conference on Explosives and Blasting Technique Las Vegas NV International Society of Explosives Engineers9 Carter HN Durst CS [1955-1956] The Influence of Barometric Changes on the Emission of Firedamp Transactions of the Institution of Mining Engineers Vol 115 pp 3-2910 Fuumlssell W Hudewentz D [1974] Die Barometrische Ausgasung-Beobachtungen Und Bekampfungsversuch Gluckauf 110 (1974) Nr 24 11 Eschenburg HM [1977] Note on the Interaction Between Barometric Pressure and Methane Issuing From Fissures Jnl Of the Mine Ventilation Society of Sout Africa Vol 30 pp 203-204 12 Stevenson JW [1968] Effects of Bleeder Entries During Atmospheric Pressure Changes Mining Engineering June 1968 pp 61-64 13 Blastersrsquo Handbook 17th Edition ed Robert B Hopler International Society of Explosives Engineers 1998 p 599 14 Rowland JH Mainiero RJ [2000] Factors affecting ANFO fumes production In Proceedings of the 26th Annual Conference on Explosives and Blasting Technique Anaheim CA International Society of Explosives Engineers pp 163-174