field survey report on the landslide occurrence in kotmale
TRANSCRIPT

15, October, 2015
Field survey report on the Landslide Occurrence in Kotmale (Lilisland)
JICA survey team
On September 25, 2015, a landslide occurred in Lilisland of the Wedamulla estate of Kotmale, Nuwara Eliya
district and seven people have lost their lives. Just after the disaster, NBRO (National Building Research
Organization) made a field survey quickly and summarized a report "Preliminary Land Survey Report on the
Landslide Occurrence in Lilisland of Wedamulla Estate of Kotmale AGA Division, Nuwara Eliya District"
(hereinafter referred to as NBRO report). Through the media, it was announced as "Landslide", and even
NBRO used a same terminology "Landslide" in their report as well.
JICA survey team conducted a field survey after a landslide disaster of Koslanda, Badulla district, at the end
of October, 2014. Similarly to the response for Koslanda Landslide, Japanese engineers from various JICA’s
On-Going Project participated and conducted field survey in Lilisland from Japanese point of view.
According to the newspaper, TV and internet images, it seemed to be a debris flow, which we call this kinds
of phenomena in Japan, caused after the shallow collapse on top of the event. Therefore we conducted a
survey for the purpose of elucidating the outbreak form and mechanism. Two day field survey was conducted
out on 9/30 and 10/1.
〇Members of survey
・Mr. Kenichi HANDA, JICA Expert 【TCLMP1】 9/30-10/1
・Mr. Mitsuya OKAMURA, NITTOC Construction Co., Ltd.【JOCV2】 9/30-10/1
・Mr. Yoshinori KAWAMURA, Oriental Consultants Co., Ltd. 【LDPP3】 9/30
・Dr. Yoji KASAHARA, Japan Conservation Engineers & Co., Ltd.【LDPP】9/30
〇Date of survey
・September 30, 2015, Wednesday, 15:30-17:00
・October 1, 2015, Thursday, 10:30-13:00
〇Used machine for survey
・Nikon COOLSHOT AS range finder (measurable distance 4.5-550m in a straight line)
〇Overview of the landslide area
According to the nearest Department of Meteorology (DOM) rain gauge (10km southeastern from the
disaster site, the Mt. Pidulutaragala mountaintop), as for the precipitation on 9/25 08:30, daily precipitation
was 33.0mm, and weekly precipitation was 76.5mm. As for the precipitation on 9/26 08:30, daily
precipitation was 19.5mm, and weekly precipitation was 91.5mm. Another rain gauge indicated that 135mm
1 Abbreviation of “Technical Cooperation for Landslide Mitigation”, which is
implemented under the Technical Cooperation for sediment related disaster measures
reinforcement. 2 Abbreviation of “Japan Overseas Cooperation Volunteer” 3 Abbreviation of “Landslide Disaster Prevention Project”, which is implemented under
the JICA Loan to construct structural measures for landslide alongside National Road.

is recorded in 9/25 at the neighbor Tea Estate.
The Precambrian strata of metamorphic rock in granulite faces classified as Highland Complex (HC)
underlie the Central Highland including the disaster site. Among HC, charnokitic gneiss was confirmed at the
site. The charnokitic gneiss observed in the Central Highland often composes ridge lines with its fine and
hard rock properties, as seen at the site as the planer slope. By showing the similar sets of strike and dip4
with those of the planer slope, the outcrops at the source and the course of the debris flow imply that the dip
structure developed by the foliation of the chanokitic gneiss governed the shape and direction of the said
planer slope.
By the interview to inhabitants, the big landslide did not seem to happen for a past.
〇Measurement result and estimate of the situation how debris flow flowed down
Below, we summarized the result of field survey for two days (cf. Appendix-1).
From ① ~ ②, it can be seen that collapse source is 91m in length, 19m in width. The angle of the slope is
21 degrees. Distance between ② and ③ is 53m, and there is a tea estate road at ③. At ④, 42m below ③,
there are cracked rocks, which seem to be the trace of destroyed waterway. At ⑤, 31m downstream of ④,
there is a trace of debris flow, which formed valley or mountain stream and is 1.6m in depth and width. We
assume the collapsed soil gathered once between ② and ④, and then became debris flow. There is also a
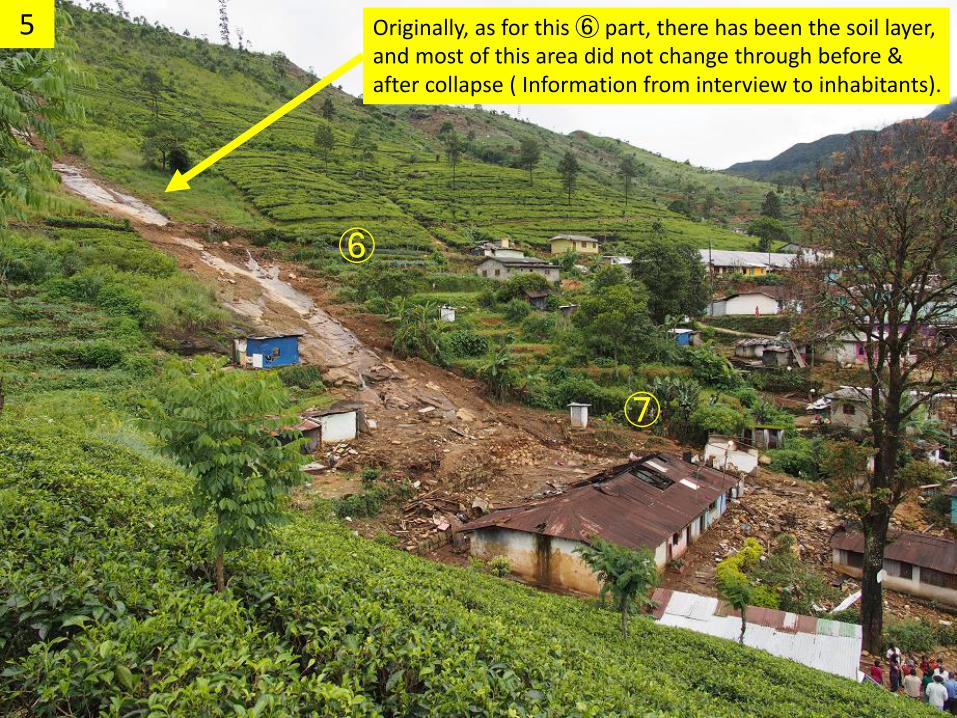
road at ⑥ (48m beneath ⑤). The angle of slope is 20 degrees there. According to the interview from the
villagers, the condition between ⑤ and ⑥ did not change so much before and after the disaster. It is thought
that after the collapsed soil became debris flow at ⑤, the debris flow flowed down with sharpening thin
surface soil on the bedrock to some extent.
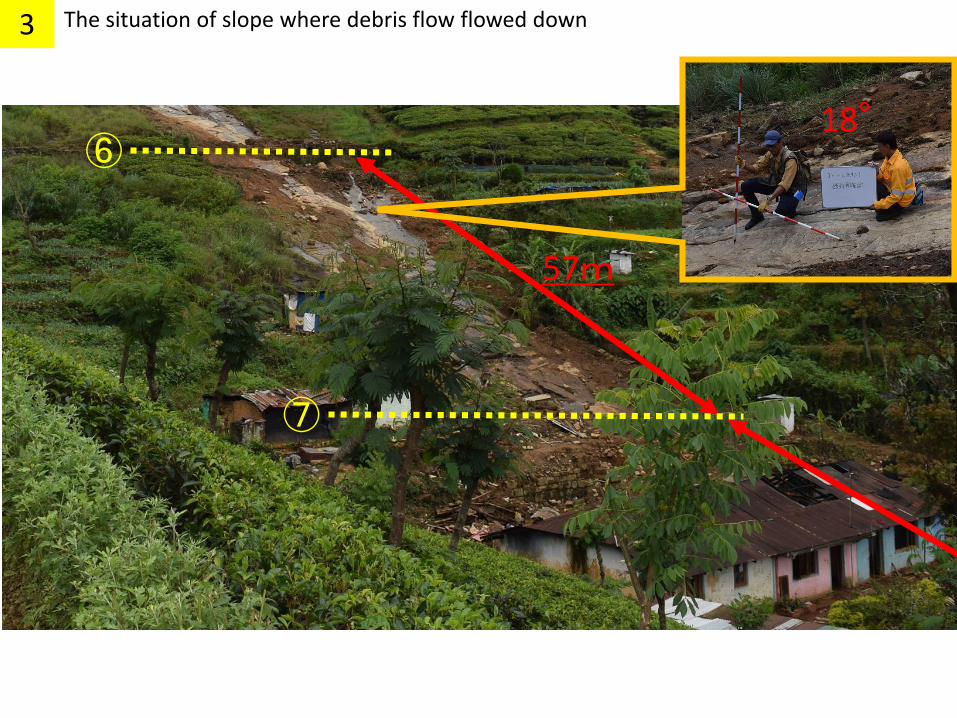
The angle from ⑥ to ⑦ (⑦ was top part of suffering houses) is 18 degrees, and the distance in a straight
line is 57m.
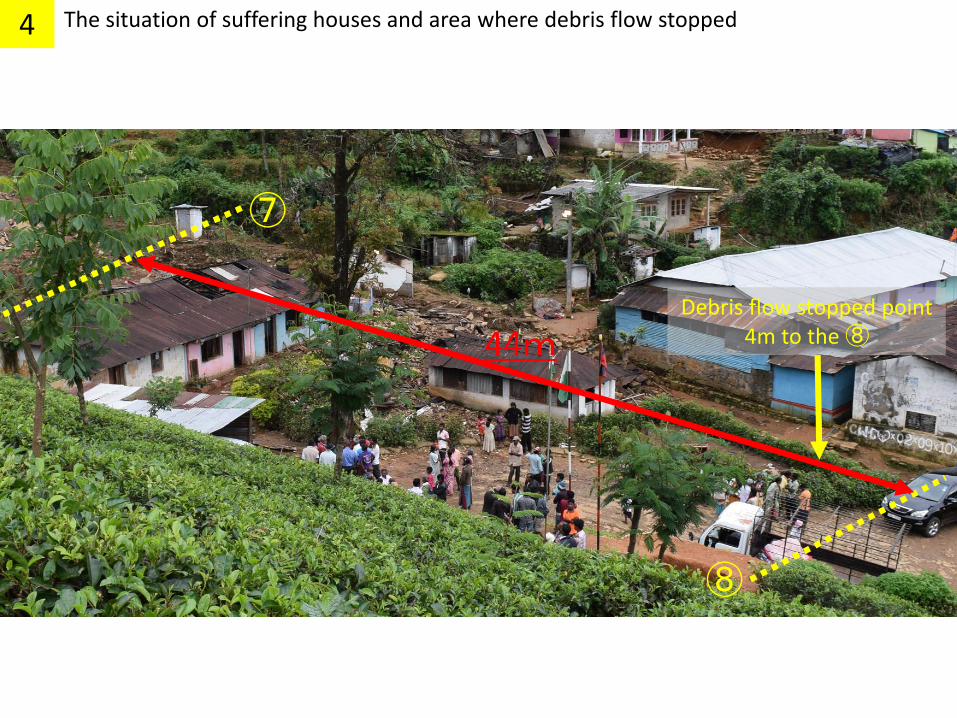
The distance from ⑦ to the lowest point where the debris flow stopped is around 40m. Because ⑧ is the
bridge, which we have eye marked, we need to deduct distance approximately 4m from 44m, 4m is distance
from the point where debris flow stopped (⑧).
The affected houses located at the top part, ⑦, had been demolished at the time of our field survey; it is
unclear whether it was removed for the Search and Rescue effort or due to other reasons. Earth and sand
deposited about 1.6m height between the top and second row of affected houses. According to the interview
from villagers, four people passed away at the top house, and two people died in the second row houses.
In summary, our observations are followings:
1. A debris flow collided to the house of the top row.
2. After destroying the house of the top row, the debris flow damaged the houses of the second row, and
most earth and sand stopped there.
3. The flow (earth and sand style) which came later was deposited after the second row house
approximately 40cm.
4 The sets of strike and dip recorded by NBRO are N150W30E (210/30E) at the source and N145W20E
(215/20E) at the course of the debris flow.

〇Quantity of shallow collapse and peak discharge of debris flow
From the field measurement, area of shallow collapse is 19m width and 91m length. The thickness of the
surface soil and weathered rock, top part of collapse, are 1.0m, but the sedimentation on bedrock around the
collapse area varies. Because there are grasses grows on some part of left side of the collapse, which we do
not have any idea when last collapse occurred there, however, we consider that the grass covered part on
bedrock had collapsed in the past.
We assume the height of collapse is half (50cm) of the thickness between the surface soil and weathered rock,
the quantity of collapse is regarded as 864.5m3, approximately around 870m
3.
In addition, we calculate peak debris flow quantity by the trace at ⑤, peak discharge of debris flow is
approximately 10-30m3/s and velocity is 4.0-4.8m/s (Appendix-2).
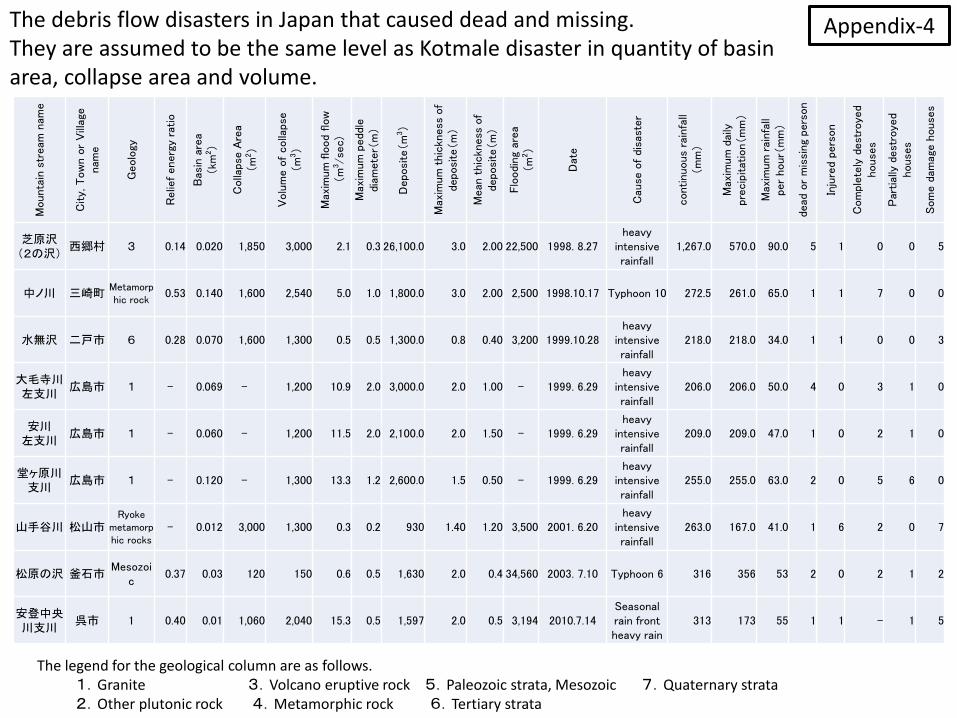
Furthermore, we made a topographical map in 1/5,000 from "ASTER-GDEM" and calculated a basin area
based on a field survey result (Appendix-3). The basin area is approximately 30,000m2. For your references,
we attach the table of the same scale of disasters occurred in Japan, which caused death or missing
(Appendix-4). These 9 Japanese disaster examples were recorded under more than 160mm daily precipitation,
and maximum hourly rainfall was around 30-90mm. Most of the cases, these disasters were caused by heavy
intensive rainfall and 2 were caused by the typhoon. The peak discharge of the debris flow is 0.3 -
15.3m3/sec and same in the size of a debris flow as Kotmale.
〇Expert’s Observation from Japanese point of views
The angles of debris flow at source area is, 21 degrees, and at suffering houses, 18 degrees, are in the range
of outbreak section (more than 15 degrees) of debris flow.
The reasons why the earth and sand did not reach to sedimentation section (‘taiseki-kukan’ in Japanese) and
tractive section (‘soryu-kukan’ in Japanese) are considered as below;
・Quantity of collapsed soil was extremely small.
・The house of first row played ‘Sabo Dam’ role as an erosion control dam, and performed restraint (stopped
force of) earth and sand from outflowing.
NBRO report also touches upon old landslides, which NBRO confirmed two places in the left side of
collapse area. Because the collapse ruins (swamp line) as geographical features are also recognized in
Google Map with contour, it is estimated that debris flowed after collapse occurred in a past as well. Big
landslides have not happened in the past according to the interview to villagers; however, we assume that
small earth and sand outflows repeatedly happened or big landslide could have been occurred long before.
It is anticipated that the feature of debris flow in this area went down linearly and thus did not have much
lateral damages to sideways due to steepness of riverbed. Because surface sediment layer is thin around the
collapse area, it is supposed that the area is in danger where even little rainfall causes debris flow.
In addition, we believe that it is crucial to have further examination (presence or continuity of the opening
crack) of the bedrock around collapse in near future. We also believe that the conduction of various technical
investigations and accumulation of obtained data will enable disaster management related organizations to
improve their predictabilities of sediment related disasters for future.

1 Whole viewAppendis-1

①
②
③
④
⑤
19m
91m
53m
42m
31m
48m
21°
20°
⑥
2 The situation of collapse and slope where debris flow flowed down
⑥
⑦
57m
18°
3 The situation of slope where debris flow flowed down
⑦
⑧
44m
4
Debris flow stopped point4m to the ⑧
The situation of suffering houses and area where debris flow stopped
⑥
⑦
Originally, as for this ⑥ part, there has been the soil layer, and most of this area did not change through before & after collapse ( Information from interview to inhabitants).
5
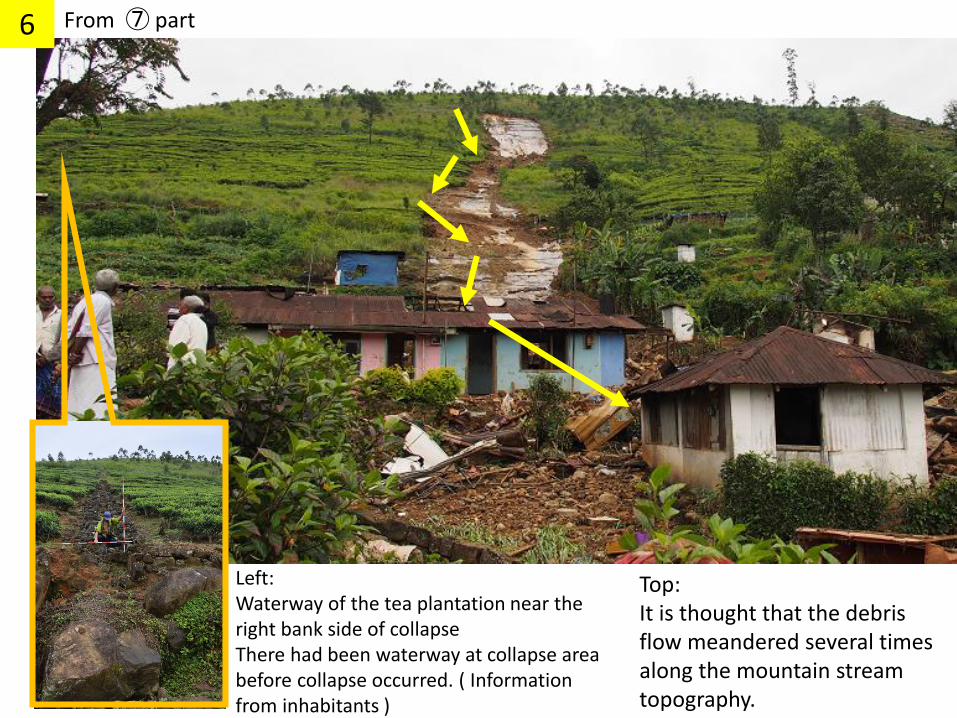
6 From ⑦ part
Left: Waterway of the tea plantation near the right bank side of collapseThere had been waterway at collapse area before collapse occurred. ( Information from inhabitants )
Top:It is thought that the debris flow meandered several times along the mountain stream topography.

7 The section where debris flow flowed down( top and bottom slope of ⑥ )
Under the right bank side of ⑥ part:It is thought that surface soil layer is thin.
Left bank side of ⑥ part : Here is the area without any surface soil.
Surface soil: Around 30cm
Detachment of the bedrock of around 20cm is observed
The sedimentation is observed along the mountain stream topography
Appendix 2
1
Estimation of peak discharge and velocity of debris flow induced by Kotmale Landslide
Sabo & Landslide Technical Center Nobuaki KATO and Masayuki MIYASE
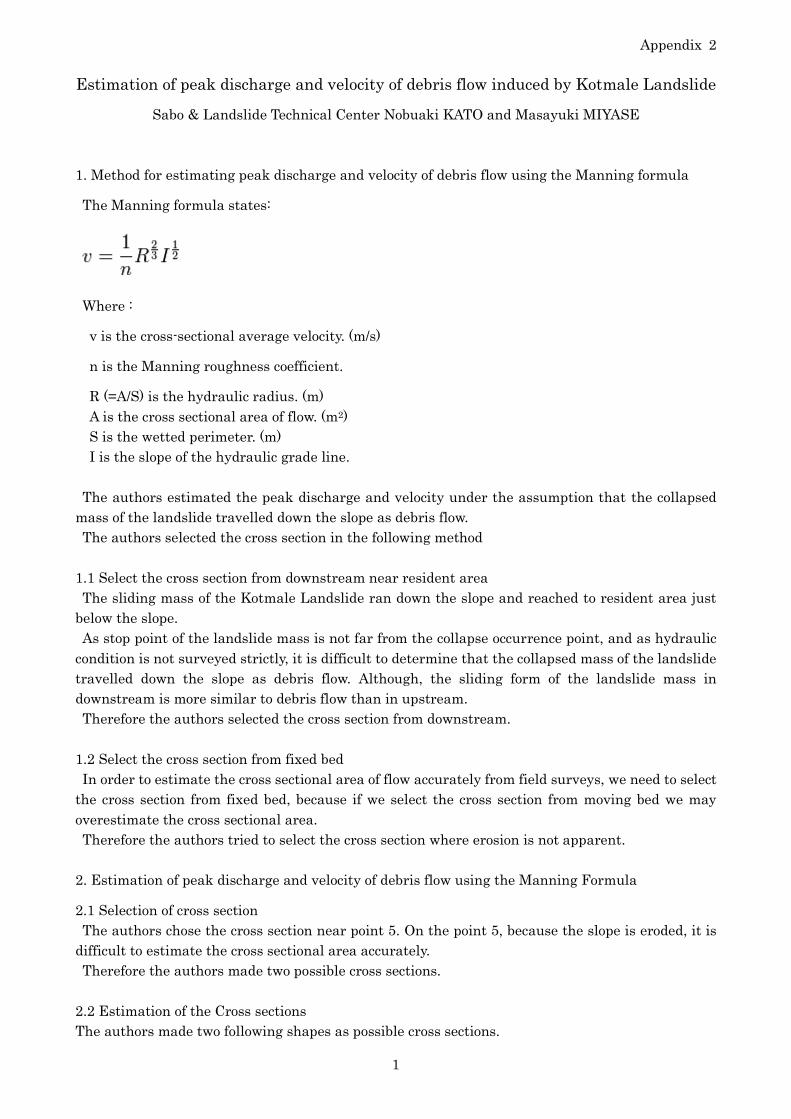
1. Method for estimating peak discharge and velocity of debris flow using the Manning formula
The Manning formula states:
Where :
v is the cross-sectional average velocity. (m/s)
n is the Manning roughness coefficient.
R (=A/S) is the hydraulic radius. (m)
A is the cross sectional area of flow. (m2)
S is the wetted perimeter. (m)
I is the slope of the hydraulic grade line.
The authors estimated the peak discharge and velocity under the assumption that the collapsed
mass of the landslide travelled down the slope as debris flow.
The authors selected the cross section in the following method
1.1 Select the cross section from downstream near resident area
The sliding mass of the Kotmale Landslide ran down the slope and reached to resident area just
below the slope.
As stop point of the landslide mass is not far from the collapse occurrence point, and as hydraulic
condition is not surveyed strictly, it is difficult to determine that the collapsed mass of the landslide
travelled down the slope as debris flow. Although, the sliding form of the landslide mass in
downstream is more similar to debris flow than in upstream.
Therefore the authors selected the cross section from downstream.
1.2 Select the cross section from fixed bed
In order to estimate the cross sectional area of flow accurately from field surveys, we need to select
the cross section from fixed bed, because if we select the cross section from moving bed we may
overestimate the cross sectional area.
Therefore the authors tried to select the cross section where erosion is not apparent.
2. Estimation of peak discharge and velocity of debris flow using the Manning Formula
2.1 Selection of cross section
The authors chose the cross section near point 5. On the point 5, because the slope is eroded, it is
difficult to estimate the cross sectional area accurately.
Therefore the authors made two possible cross sections.
2.2 Estimation of the Cross sections
The authors made two following shapes as possible cross sections.
Appendix 2
2
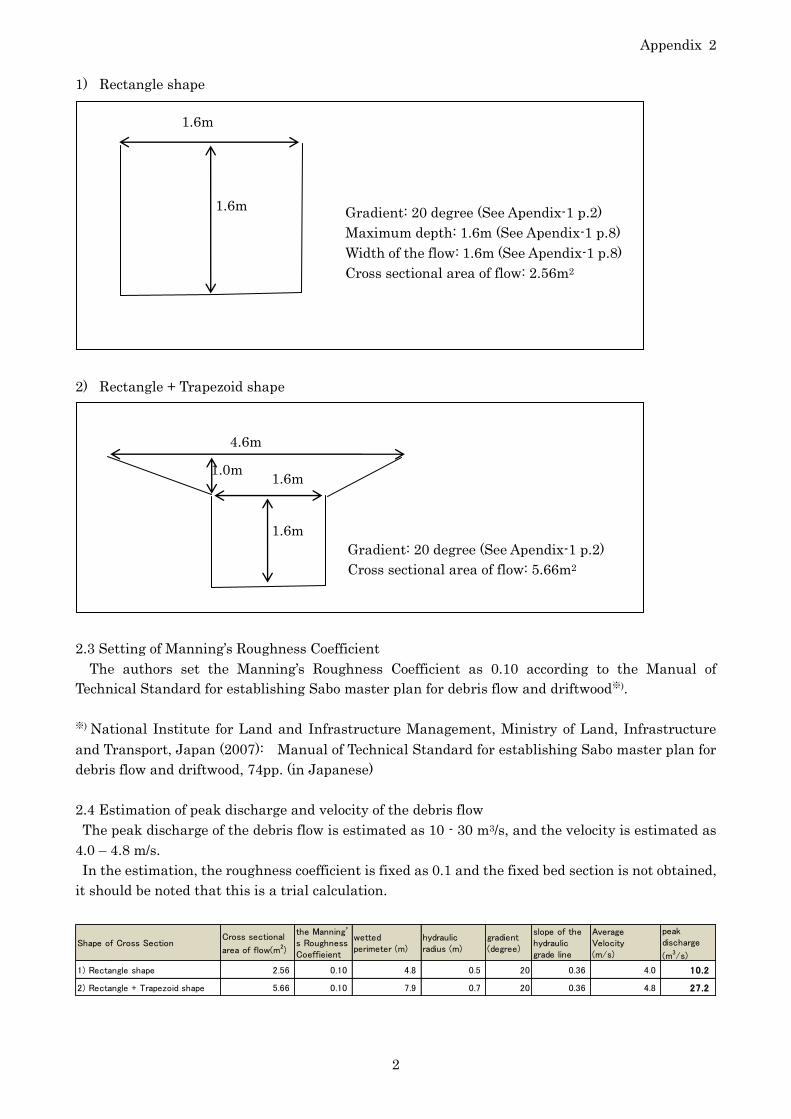
1) Rectangle shape
2) Rectangle + Trapezoid shape
2.3 Setting of Manning’s Roughness Coefficient
The authors set the Manning’s Roughness Coefficient as 0.10 according to the Manual of
Technical Standard for establishing Sabo master plan for debris flow and driftwood※).
※) National Institute for Land and Infrastructure Management, Ministry of Land, Infrastructure
and Transport, Japan (2007): Manual of Technical Standard for establishing Sabo master plan for
debris flow and driftwood, 74pp. (in Japanese)
2.4 Estimation of peak discharge and velocity of the debris flow
The peak discharge of the debris flow is estimated as 10 - 30 m3/s, and the velocity is estimated as
4.0 – 4.8 m/s.
In the estimation, the roughness coefficient is fixed as 0.1 and the fixed bed section is not obtained,
it should be noted that this is a trial calculation.
Shape of Cross SectionCross sectional
area of flow(m2)
the Manning’s RoughnessCoeffieient
wettedperimeter (m)
hydraulicradius (m)
gradient(degree)
slope of thehydraulicgrade line
AverageVelocity(m/s)
peakdischarge
(m3/s)
1) Rectangle shape 2.56 0.10 4.8 0.5 20 0.36 4.0 10.2
2) Rectangle + Trapezoid shape 5.66 0.10 7.9 0.7 20 0.36 4.8 27.2
Gradient: 20 degree (See Apendix-1 p.2)
Maximum depth: 1.6m (See Apendix-1 p.8)
Width of the flow: 1.6m (See Apendix-1 p.8)
Cross sectional area of flow: 2.56m2
1.6m
1.6m
1.6m
1.6m
4.6m
1.0m
Gradient: 20 degree (See Apendix-1 p.2)
Cross sectional area of flow: 5.66m2

36.8m
57.8m
84.2m
147.3m
57.9m 68.4m 31.6m
52.6m
168.4m
Area(m2)
Kotmale Landslide
S= No A(m) B(m) C(m) (A+B+C)/2 Area(㎡)
1 36.8 289.5 310.5 318.4 4524.4
2 289.5 57.8 242.1 294.7 4369.9
3 242.1 84.2 168.4 247.4 4089.8
4 168.4 147.3 100.0 207.9 7317.5
5 100.0 57.9 100.0 129.0 2771.0
6 100.0 68.4 110.5 139.5 3363.9
7 110.5 31.6 115.8 129.0 1745.2
8 115.8 52.6 73.7 121.1 1435.2
Sum (㎡) 29,616.9
①
②
③
④
⑤ ⑥ ⑦
⑧
Area calculation: Mitsuya OKAMURA【JOCV】
Appendix-3
Made from ASTER-GDEM : ESS Toru KOIKE 【TCLMP】
Mounta
in s
tream
nam
e
City,
Tow
n o
r V
illag
e
nam
e
Geolo
gy
Relie
f energ
y ra
tio
Bas
in a
rea
(km
2 )
Colla
pse A
rea
(m
2 )
Volu
me o
f colla
pse
(m
3 )
Max
imum
flo
od
flow
(m
3 /se
c)
Max
imum
pedd
le
diam
eter(
m)
Depo
site(m
3 )
Max
imum
thic
kness
of
depo
site(m)
Mean
thic
kness
of
de
posi
te(m)
Flo
odi
ng
area
(m
2 )
Dat
e
Cau
se o
f di
sast
er
continuous
rain
fall
(m
m)
Max
imum
dai
ly
precip
itat
ion(m
m)
Max
imum
rai
nfa
ll pe
r hour(
mm)
dead
or
mis
sing
pers
on
Inju
red
pers
on
Com
plete
ly d
est
roye
d house
s
Par
tial
ly d
est
roye
d house
s
Som
e d
amag
e h
ouse
s
芝原沢 (2の沢)
西郷村 3 0.14 0.020 1,850 3,000 2.1 0.3 26,100.0 3.0 2.00 22,500 1998. 8.27 heavy
intensive rainfall
1,267.0 570.0 90.0 5 1 0 0 5
中ノ川 三崎町 Metamorphic rock
0.53 0.140 1,600 2,540 5.0 1.0 1,800.0 3.0 2.00 2,500 1998.10.17 Typhoon 10 272.5 261.0 65.0 1 1 7 0 0
水無沢 二戸市 6 0.28 0.070 1,600 1,300 0.5 0.5 1,300.0 0.8 0.40 3,200 1999.10.28 heavy
intensive rainfall
218.0 218.0 34.0 1 1 0 0 3
大毛寺川左支川
広島市 1 - 0.069 - 1,200 10.9 2.0 3,000.0 2.0 1.00 - 1999. 6.29 heavy
intensive rainfall
206.0 206.0 50.0 4 0 3 1 0
安川 左支川
広島市 1 - 0.060 - 1,200 11.5 2.0 2,100.0 2.0 1.50 - 1999. 6.29 heavy
intensive rainfall
209.0 209.0 47.0 1 0 2 1 0
堂ヶ原川支川
広島市 1 - 0.120 - 1,300 13.3 1.2 2,600.0 1.5 0.50 - 1999. 6.29 heavy
intensive rainfall
255.0 255.0 63.0 2 0 5 6 0
山手谷川 松山市 Ryoke
metamorphic rocks
- 0.012 3,000 1,300 0.3 0.2 930 1.40 1.20 3,500 2001. 6.20 heavy
intensive rainfall
263.0 167.0 41.0 1 6 2 0 7
松原の沢 釜石市 Mesozoi
c 0.37 0.03 120 150 0.6 0.5 1,630 2.0 0.4 34,560 2003. 7.10 Typhoon 6 316 356 53 2 0 2 1 2
安登中央川支川
呉市 1 0.40 0.01 1,060 2,040 15.3 0.5 1,597 2.0 0.5 3,194 2010.7.14 Seasonal rain front heavy rain
313 173 55 1 1 - 1 5
The debris flow disasters in Japan that caused dead and missing. They are assumed to be the same level as Kotmale disaster in quantity of basin area, collapse area and volume.
The legend for the geological column are as follows. 1.Granite 3.Volcano eruptive rock 5.Paleozoic strata, Mesozoic 7.Quaternary strata 2.Other plutonic rock 4.Metamorphic rock 6.Tertiary strata
Appendix-4