figure 15-3 (p. 512) examples of positive and negative relationships. (a) beer sales are positively...
TRANSCRIPT
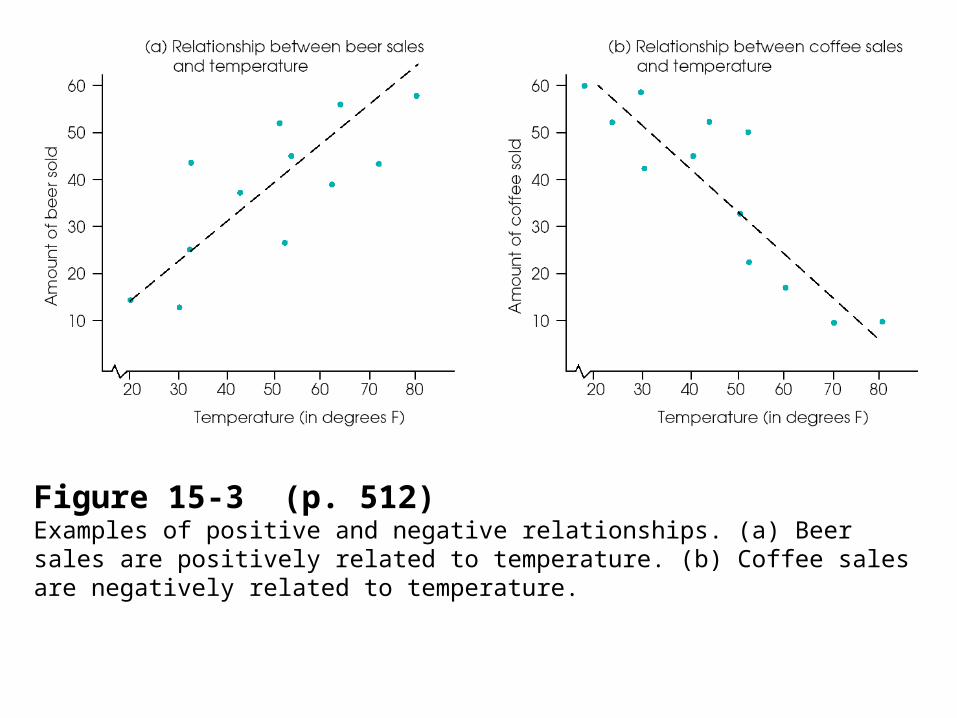
Figure 15-3 (p. 512)Examples of positive and negative relationships. (a) Beer sales are positively related to temperature. (b) Coffee sales are negatively related to temperature.

Figure 15-4 (p. 513) Examples of different values for linear correlations: (a) shows a strong positive relationship, approximately +0.90; (b) shows a relatively weak negative correlation, approximately –0.40; (c) shows a perfect negative correlation, –1.00; (d) shows no linear trend, 0.00.

The Pearson Correlation
The Pearson correlation “r” measures the direction and degree of linear (straight line) relationship between two variables.
The magnitude of the Pearson correlation ranges from 0 (indicating no linear relationship between X and Y) to 1.00 (indicating a perfect straight-line relationship between X and Y).
The correlation can be either positive or negative depending on the direction of the relationship.

The Pearson Correlation• r = degree to which X and Y vary together divided by
degree to which X and Y vary separately
• The Pearson correlation compares the amount of • Covariability; variation from the relationship between X and Y• to the amount X and Y vary separately
• • If there is a perfect linear relationship
• every change in X is matched by a change in the Y variable• see fig 15.4a which illustrates a perfect negative correlation
• When X goes up one unit Y goes down one unit• When X goes up two units Y goes down two units • So X and Y covary

• To compute the Pearson correlation• calculate the variability of X and Y scores separately by
computing SS for the scores of each variable SSX and SSY
• Calculate Covariability which is the sum of products of deviation scores SP = (X-Mx)(Y-My)
• The Pearson correlation is found by computing the ratio of SP compared to square root of the SSxSSy
• r = SP/(SSX)(SSY) .
The Pearson Correlation
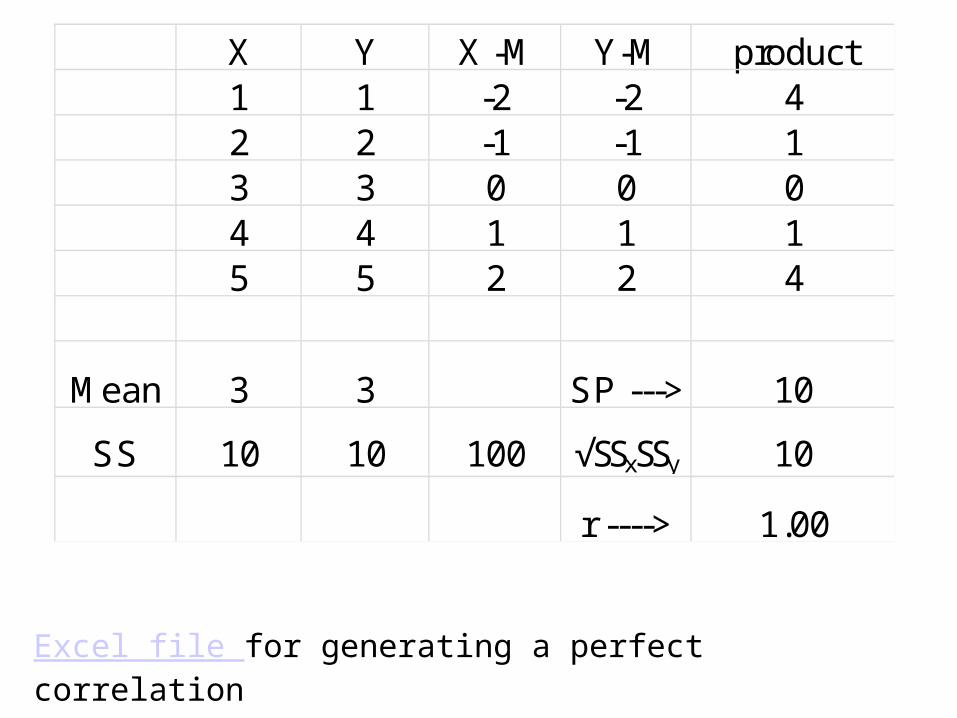
Excel file for generating a perfect correlation
X Y X -M Y-M product1 1 -2 -2 42 2 -1 -1 13 3 0 0 04 4 1 1 15 5 2 2 4
Mean 3 3 SP ---> 10
SS 10 10 100 √SSxSSy 10
r ----> 1.00

The Pearson Correlation Calculations Example 15.2
Calculating SP from definitional formula
SP = (X-Mx)(Y-My)
Using squared deviation table p 515
X Y X-Mx Y-My Products (X-Mx)2 (Y-My)2
1 3 -2 -2 +4 4 4
2 6 -1 +1 -1 1 1
4 4 +1 -1 -1 1 1
5 7 +2 +2 +4 4 4
M=3 M=5 SP = 6 SSx= 10 SSy= 10
Calculation of Pearson correlationr = SP / √ (ssx)(ssy)r = 6 / √ (ssx)(ssy) r = 6/ √ (10)(10)r = 0.60
Note: SS columns are not in the textbook

The Pearson Correlation Calculations Example 15.2
SP Using Computational formulaSP = XY – (XY / n) SP = 66 - [12(20)] /4 = 6
SS Using Computational formulaSSx = X2 – (X)2 /n SSx = 46 – (12) 2 / 4 = 10 SSy = Y2 – (Y)2 /n SSy = – ()2 /4 = 10
Calculation of Pearson correlationr = SP / √ (ssx)(ssy)r = 6/ √ (10)(10)r = 0.60
X Y X2 Y2 XY
1 3 1 9 3
2 6 4 36 12
4 4 16 16 16
5 7 25 49 35
12 20 46 110 66

Calculating Sum of Products (SP) Example 15.3
Using definitional formula table 15.1 page 518

Figure 15.5 (p. 517)Scatter plot of data from Example 15.3
r = SP/(SSX)(SSY)r = 28/ (64)(16)r = 28/32 = +0.875
X Y
0 2
10 6
4 2
8 4
8 6
Time For More Fun With SPSS

Using and Interpreting The Pearson Correlation
• Predictions:• knowing the relationship between SAT and GPA
• makes it possible to use SAT to predict GPA
• Validity:• comparing two tests of the same construct such as “anxiety”
• if they have high correlation their is construct validity
• Reliability:• Test – Retest reliability
• Theory Verification:• When a theory makes a prediction about the relationship
between two variables they can be tested with correlation
• Amount of sleep is positively related to GPA

Interpreting Correlations
• Correlations describe relationships• but do not explain why they exist
• can not draw cause and effect conclusions
• However causation is not ruled out either• Cigarette smoking is positively correlated with cancer
• Correlations are sensitive to the range of scores• Correlations are sensitive to outliers• Correlations are not proportions
• size of the r value is not directly related to strength of the relationship
• use r2 to interpret strength of the relationship

Figure 15-6 (p. 522)Hypothetical data showing the logical relationship between the number of churches and the number of serious crimes for a sample of U.S. cities.
• Correlations describe relationships• but do not explain why they exist• can not draw cause and effect conclusions

Problem of Restricted Range
Figure 15-7 (p. 523)In this example, the green ellipse, when the full range of X and Y values are used there is a strong, positive correlation.However, the brown circle, when the X values have a restricted range of scores the correlation is near zero.
• Correlations are sensitive to the range of scores

Problem of OutliersFigure 15-8 (p. 524)A demonstration of how one extreme data point (an outlier) can influence the value of a correlation.
• Correlations are sensitive to outliers

Correlation and Strength of the Relationship
• Coefficient of Determination r2 – Using correlation for prediction
• Using SAT to predict GPA• Based on degree of the relationship• r value is not a good measure for predictions
– r2 measures the proportion of variability in one variable that can be determined by the other variable
• Small, Medium, Large see table 9.3• Used as a measure of effect size for t test• Amount of variance in the dependent explained by the
independent

Figure 15.9 (p. 525) Three sets of data showing three different degrees of linear relationships.

Calculations for Pearson Correlation Coefficient
• Definitional Formula– r = SP / √ (ssx)(ssy)
– SP = (X-Mx)(Y-My)
• Computational Formula– r = SP / √ (ssx)(ssy)
– SP = XY - XY / n
• z – score formula (for samples)– r = zxzy / n-1

The Spearman Correlation
• The Spearman correlation is used in two general situations: – (1) X and Y both consist of ranks
• Because it measures the relationship between two ordinal variables
– (2)When the relationship is non linear• the two variables must be converted to ranks before the
Spearman correlation is computed• Because it measures the consistency of direction of the
relationship between two variables.

Examples of relationships that are not linear: (a) relationship between reaction time and age(b) relationship between mood and drug dose.

Relationship between practice and performance. There is a consistent positive relationship.Fig. 15-14, p. 536

The Spearman Correlation (cont.)
The calculation of the Spearman correlation requires:
1. Two variables are observed for each individual.2. The observations for each variable are rank ordered.
Note that the X values and the Y values are ranked separately.
3. After the variables have been ranked, the Spearman correlation is computed by either:
a. Using the Pearson formula with the ranked data.
b. Using the special Spearman formula assuming there are few, if any, tied ranks
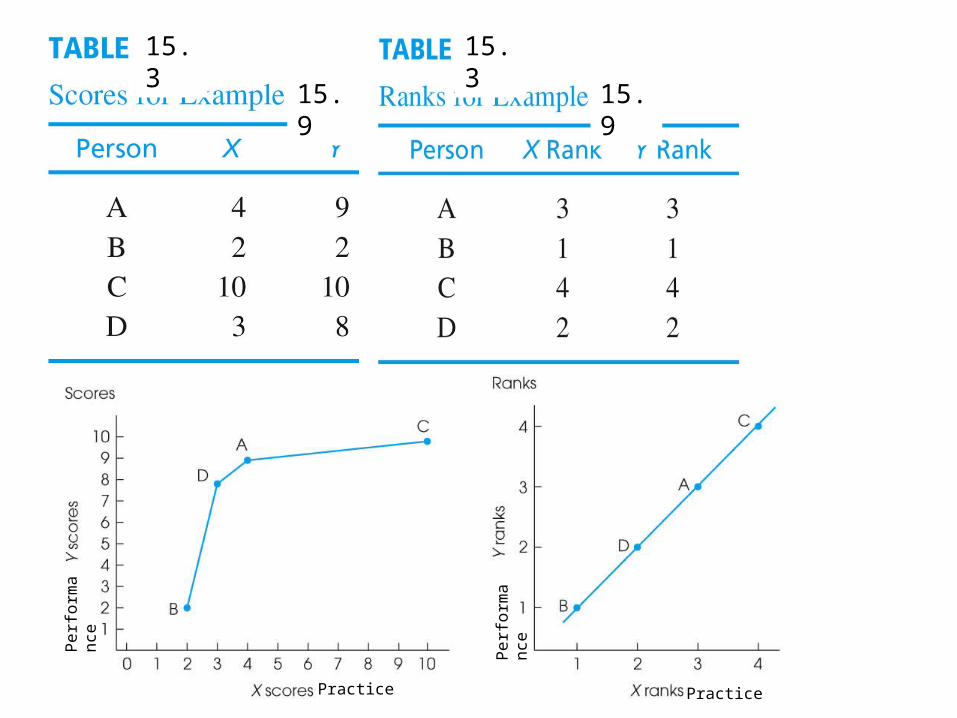
Practice
Pe
rfo
rma
nc
e Pe
rfo
rma
nc
e
Practice
15.3 15.3
15.9 15.9
The Spearman Correlation Formulas and Calculations
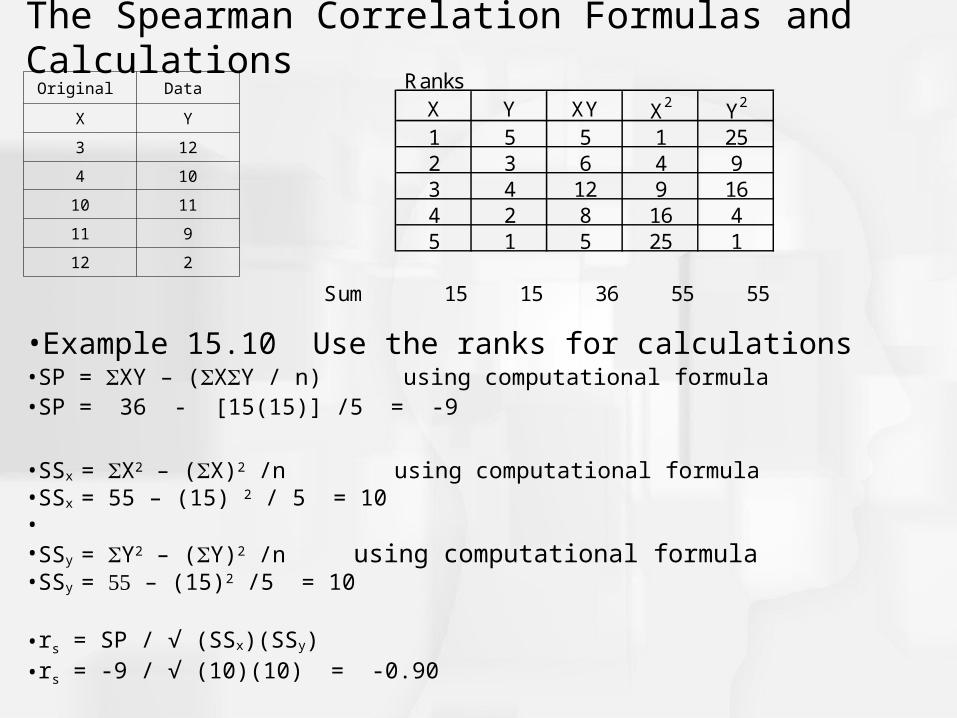
•Example 15.10 Use the ranks for calculations•SP = XY – (XY / n) using computational formula•SP = 36 - [15(15)] /5 = -9
•SSx = X2 – (X)2 /n using computational formula •SSx = 55 – (15) 2 / 5 = 10 • •SSy = Y2 – (Y)2 /n using computational formula•SSy = – (15)2 /5 = 10
•rs = SP / √ (SSx)(SSy)•rs = -9 / √ (10)(10) = -0.90
Original Data
X Y
3 12
4 10
10 11
11 9
12 2
RanksX Y XY X2 Y2
1 5 5 1 252 3 6 4 93 4 12 9 164 2 8 16 45 1 5 25 1
Sum 15 15 36 55 55

Scatter plots of original scores and ranks for Example 15.10
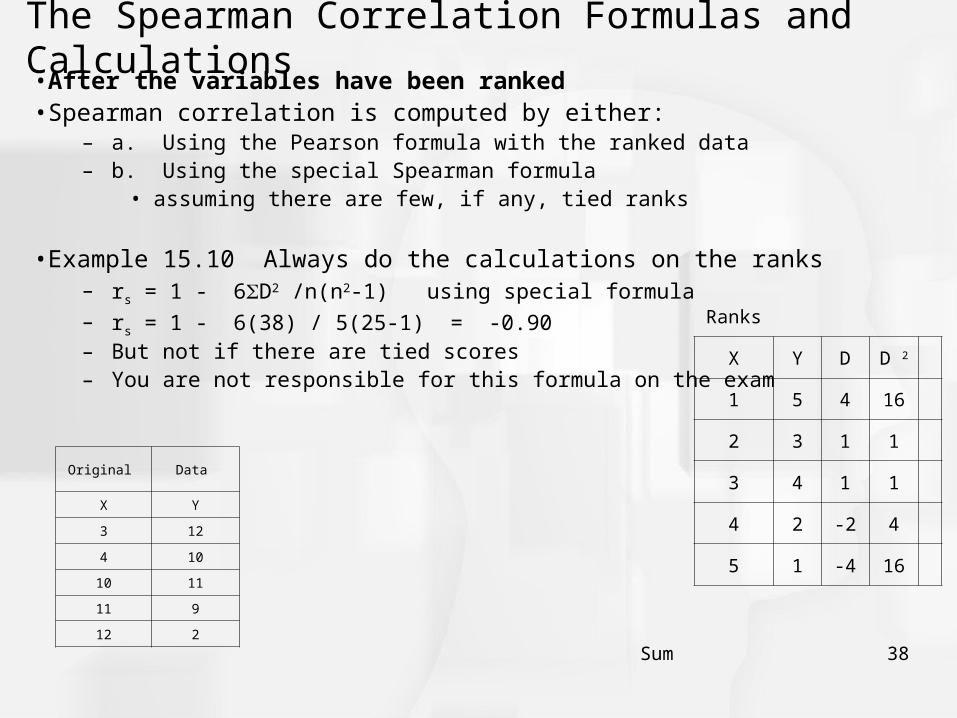
The Spearman Correlation Formulas and Calculations•After the variables have been ranked•Spearman correlation is computed by either:
– a. Using the Pearson formula with the ranked data– b. Using the special Spearman formula
• assuming there are few, if any, tied ranks
•Example 15.10 Always do the calculations on the ranks– rs = 1 - 6D2 /n(n2-1) using special formula – rs = 1 - 6(38) / 5(25-1) = -0.90– But not if there are tied scores– You are not responsible for this formula on the exam
Original Data
X Y
3 12
4 10
10 11
11 9
12 2
Ranks
X Y D D 2
1 5 4 16
2 3 1 1
3 4 1 1
4 2 -2 4
5 1 -4 16
Sum 38

Ranking Tied ScoresExample from page 545
Initial FinalScore Rank Rank
3 1 1.53 2 1.55 3 36 4 56 5 56 6 5
12 7 7
Use the Pearson correlation equation on the ranked scores

point-biserial correlation as an alternative to the Pearson Correlation
• The Pearson correlation formula can also be used to measure the relationship between two variables when one or both of the variables is dichotomous.
• A dichotomous variable is one for which there are exactly two categories: for example, men/women or succeed/fail.
• The point-biserial correlation is used in situations where one variable is dichotomous and the other consists of regular numerical scores ;interval or ratio scale

point-biserial correlation as an alternative to the Pearson Correlation
• The calculation of the point-biserial correlation proceeds as follows:– Assign numerical values to the two categories of the
dichotomous variable(s). Traditionally, one category is assigned a value of 0 and the other is assigned a value of 1.
– Use the regular Pearson correlation formula to calculate the correlation.
point-biserial correlation as an alternative to the Pearson Correlation
• The point-biserial correlation is closely related to the independent-measures t test introduced in Chapter 10.
• When the data consists of one dichotomous variable and one numerical variable, the dichotomous variable can also be used to separate the individuals into two groups.
• Then, it is possible to compute a sample mean for the numerical scores in each group.

point-biserial correlation as an alternative to the Pearson Correlation
• In this case, the independent-measures t test can be used to evaluate the mean difference between groups.
• If the effect size for the mean difference is measured by computing r2 (the percentage of variance explained), the value of r2 will be equal to the value obtained by squaring the point-biserial correlation.

phi-coefficient as an alternatives to the Pearson Correlation
• The phi-coefficient is used when both variables are dichotomous.
• The calculation proceeds as follows:– Convert each of the dichotomous variables to numerical values
by assigning a 0 to one category and a 1 to the other category for each of the variables.
– Use the regular Pearson formula with the converted scores.

phi-coefficient as an alternatives to the Pearson Correlation

phi-coefficient as an alternatives to the Pearson Correlation