final addendum to the additional report -...
TRANSCRIPT

1
Final addendum to the
Additional Report - public version -
Additional risk assessment provided by the rapporteur Member State
Germany for the existing active substance
CARBOFURAN
according to the Accelerated Resubmission Procedure laid down in
Commission Regulation (EC) No. 33/2008
May 2009

2
Table of contents
Addendum to Volume 3 March 2009 ............................................................. 3
B.8 Environmental fate and behaviour
Addendum to Volume 3 March 2009 ........................................................... 17
B.9 Ecotoxicology
Addendum to Volume 3 April 2009 ............................................................. 22
B.7 Residue data
Addendum to Volume 3 April 2009 .................................................................
B.9 Ecotoxicology
Addendum to Volume 3 May 2009 .............................................................. 44
B.6 Toxicology and metabolism
Addendum to Volume 3 May 2009 .............................................................. 76
B.9 Ecotoxicology

3
ANNEX B
Addendum March 2009
Carbofuran
B.8 Environmental fate and behaviour

Methomyl – Additional Report (Addendum 1) November 2008
4
B.8.1.2 Rate of degradation (Annex IIA 7.1.1.2.1; Annex IIIA 9.1.1.1.1)
B.8.1.2.1 Aerobic degradation
The RMS disagrees with the conclusions of the PRAPER 62 meeting on this point and would like that his
argumentation is taken on board in the conclusions of carbofuran.
Study by Saxena:
- In this study two soils were used, called as acidic and alkaline soil. The alkaline soil was prepared by adding
lime to the collected sandy loam soil (acidic), by this the pH was modified from 5.7 to 7.7.
- The soil indeed seems to be dry if compared with e.g. the FOCUS default values for sandy loam, but the
moisture holding capacity of the soil was determined in this GLP study and the actual moisture content was set
for this (75% of 1/3 bar=4.05%) in accordance with EPA guidelines (Very often, degradation determined
according EPA guideline is slower).
- The microbial biomass was checked several times throughout the study and the results show that both soils
were viable at the end of the study.
- According to the RMS, one soil has been tested in this study (same soil properties, except pH, same
microflora). It is therefore not valid to derive 2 DT50 in order to artificially increase the mean or the median
DT50.
Study by Schocken:
- The pH of this sandy loam soil was also modified by lime from 5.8 to 7.1.
The microbial activity of the soil was checked by measuring the evolved 14
CO2 from 14
C labelled glucose up to 57
days in a parallel experiment. The evolved CO2 was continuously increasing and reached 62.3% by the end of this
term.
It was stated in the DAR that the carbofuran degradation in this study is occurring through a chemical rather than a
microbial process (similar degradation rates under sterile and non-sterile conditions).
Absence of mineralization is observed in this study
The degradation of carbofuran has been determined under aerobic laboratory conditions with carbofuran,
benfuracarb or carbosulfan as test substance (14 studies with DT50 ranging between 5.7 and 22.7 days) and under
field conditions (5 studies with DT50 ranging between 1.3 and 27 days). Under anaerobic laboratory conditions, the
DT50 in one soil is 7.6 days.

Methomyl – Additional Report (Addendum 1) November 2008
5
Distribution of carbofuran lab and field DT50
0
5
10
15
0-25
d
50-7
5 d
100-
125
d
150-
175
d
200-
225
d
250-
275
d
300-
325
d
350-
375
d
nu
mb
er o
f tr
ials
lab data
field data
The RMS considers that there are sufficient arguments that are indicating that the DT50 of 151, 54.6 days (actually
one soil tested in Saxena 1994) and 387 days (one soil in Schocken, 1989) are not valid. Considering these 3 data,
the standard deviation is 94.35.
Considering the DT50 that have been recalculated by EFSA (benfuracarb endpoints list) with exclusion of the 3
outlier points, the median and geomean DT50 are respectively 12.63 days and 12.54 days. The standard deviation is
then 5.61. Moreover it is clear that the distribution of DT50 population is less dissymetrical.
The field median and geomean DT50 are respectively 16 days and 8.12 days.
Relevance of the metabolites (data already available in the DAR of November 2008)
Presence in laboratory degradation studies
According to agreed guidance, PECgw calculations have to be performed for metabolites that were recovered at level
>5% AR at least at two sampling points.
It has been shown in the original submission that the metabolites of carbofuran were clearly not major (never at level
above 5% at 2 sampling points): 3-OH-carbofuran (max 0.8%, once in 1 out of 5 soils), 3-keto-carbofuran (once at
maximum level of 6.2% AR, in 1 out of 5 soils), carbofuran-phenol (=7-phenol) (max 2.1%, once in 1 out of 5 soils)
(Arysta, FMC)
However EPCO 31 agreed that 3-OH-carbofuran and 3-keto-carbofuran need to be further assessed as carbofuran
metabolites containing the active carbamate moiety. Carbofuran-phenol does not contain the carbamate moeity.
PECgw calculations
The notifer has provided DT50 (the 3 metabolites are not persistent) and Koc (Koc for modelling has been chosen
according to a worst case approach) for the metabolites.
The PECgw for the metabolites 7-phenol-carbofuran, 3-hydroxy- carbofuran, and 3-keto-carbofuran have been
calculated assuming extreme worst case scenarios (100% formation fraction used in modelling while the observed
level of the metabolites in aerobic degradation studies is <5%AR, worst case Koc derivation). In consequence, the
few exceedances of the 0.1 µg/L trigger are not a concern (PEARL triennial scenarios).
The metabolites are not present in groundwater and therefore not included in the residue definition.
Toxicological relevance
Methomyl – Additional Report (Addendum 1) November 2008
6
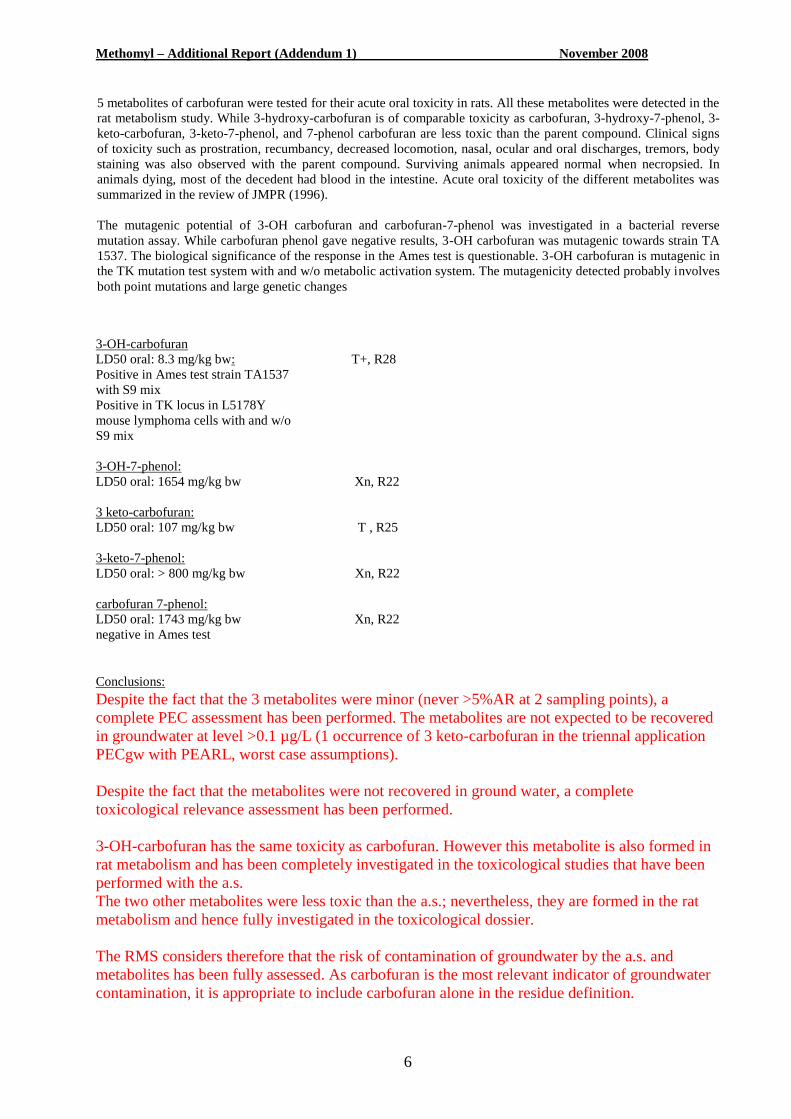
5 metabolites of carbofuran were tested for their acute oral toxicity in rats. All these metabolites were detected in the
rat metabolism study. While 3-hydroxy-carbofuran is of comparable toxicity as carbofuran, 3-hydroxy-7-phenol, 3-
keto-carbofuran, 3-keto-7-phenol, and 7-phenol carbofuran are less toxic than the parent compound. Clinical signs
of toxicity such as prostration, recumbancy, decreased locomotion, nasal, ocular and oral discharges, tremors, body
staining was also observed with the parent compound. Surviving animals appeared normal when necropsied. In
animals dying, most of the decedent had blood in the intestine. Acute oral toxicity of the different metabolites was
summarized in the review of JMPR (1996).
The mutagenic potential of 3-OH carbofuran and carbofuran-7-phenol was investigated in a bacterial reverse
mutation assay. While carbofuran phenol gave negative results, 3-OH carbofuran was mutagenic towards strain TA
1537. The biological significance of the response in the Ames test is questionable. 3-OH carbofuran is mutagenic in
the TK mutation test system with and w/o metabolic activation system. The mutagenicity detected probably involves
both point mutations and large genetic changes
3-OH-carbofuran
LD50 oral: 8.3 mg/kg bw: T+, R28
Positive in Ames test strain TA1537
with S9 mix
Positive in TK locus in L5178Y
mouse lymphoma cells with and w/o
S9 mix
3-OH-7-phenol:
LD50 oral: 1654 mg/kg bw Xn, R22
3 keto-carbofuran:
LD50 oral: 107 mg/kg bw T , R25
3-keto-7-phenol:
LD50 oral: > 800 mg/kg bw Xn, R22
carbofuran 7-phenol:
LD50 oral: 1743 mg/kg bw Xn, R22
negative in Ames test
Conclusions:
Despite the fact that the 3 metabolites were minor (never >5%AR at 2 sampling points), a
complete PEC assessment has been performed. The metabolites are not expected to be recovered
in groundwater at level >0.1 µg/L (1 occurrence of 3 keto-carbofuran in the triennal application
PECgw with PEARL, worst case assumptions).
Despite the fact that the metabolites were not recovered in ground water, a complete
toxicological relevance assessment has been performed.
3-OH-carbofuran has the same toxicity as carbofuran. However this metabolite is also formed in
rat metabolism and has been completely investigated in the toxicological studies that have been
performed with the a.s.
The two other metabolites were less toxic than the a.s.; nevertheless, they are formed in the rat
metabolism and hence fully investigated in the toxicological dossier.
The RMS considers therefore that the risk of contamination of groundwater by the a.s. and
metabolites has been fully assessed. As carbofuran is the most relevant indicator of groundwater
contamination, it is appropriate to include carbofuran alone in the residue definition.

Methomyl – Additional Report (Addendum 1) November 2008
7
Evaluation of the argumentation given in the position paper by Shaaban F. Elnaggar, 2005
The argumentation points that were available in the DAR have been repeated in an addendum
Degradation studies of carbofuran and 7-phenol show that 7-phenol is a short-lived degradation product in/on
soil/sediment environment.
Carbofuran-phenol does not contain the carbamate moiety.
Carbofuran-phenol is 4 orders of magnitude less toxic than carbofuran to aquatic organisms. This
compound does not pose a risk to aquatic organisms.
B.8.6.1 Predicted Environmental Concentrations in ground water (PECgw) (Annex IIIA 9.21)
The notifier has proposed new PECgw calculations taking into account the endpoints that have been defined during
the PRAPER meeting on benfuracarb (January 2009)
Modelling softwares:
The calculation of Predicted Environmental Concentrations (PECs) in groundwater is required as part of the
registration procedure for plant protection products in the European Union (EU), using the Standard Forum for the
Co-ordination of Pesticide Fate Models and their Use (FOCUS) ground water scenarios to represent a realistic worst-
case (FOCUS 2000). In this case, the Dutch model Pesticide Emission Assessment at Regional and Local scales
(PEARL ver. 3.3.3) (Tiktak 2003) and the Pesticide Leaching Model (PELMO ver. 3.22) (Klein 2002) were used to
address the potential leaching of carbofuran and its three metabolites 1) 7-phenol-carbofuran, 2) 3-hydroxy-
carbofuran, and 3) 3-keto-carbofuran to the target groundwater depth of one meter below the sugar beet field surface
for nine different scenarios over a 26-year period.
Input data:
PEARL and PELMO calculations: The carbofuran PECgw after an at-plant application incorporated into the soil to
7.0 cm at a maximum rate of 0.600 kg a.s./ha annually (worst-case) and at maximum rate of 0.600 kg a.s./ha
triennially (realistic worst-case) were calculated. PECgw of carbofuran at a use rate of 0.060 kg a.s./ha annually and
a rate of 0.060 kg a.s./ha triennially were also calculated using the same planting and timing conditions as those used
for the higher use rate.
Application occurs 14 days before crop emergence.
Table B.8.6.1-1: Test Substance Parameters Parameter carbofuran 3OHCF 3ketoCF 7PCF
Mw 221.3 237.3 235.24 164.2
Water solubility (mg/L, 20°C) 322 6207 4464 1096
Vapour pressure (Pa, 25°C) 8e-5 3.29e-3 2.6e-3 1.32
DT50 soil (days) 14 0.41 3.01 1
Kom 12.8 31.9 192 598
Koc 22 55 331 1031
1/n 0.96 1 1 0.9

Methomyl – Additional Report (Addendum 1) November 2008
8
Ffm 1 1 1
Q10 2.58 2.58 2.58 2.58
Plant Uptake 0 0 0 0
Proposed dissipation pathway GW: CF to 3OHcf (ffm 1.0) to 3ketoCF (ffm 1.0) CF to 7PCF (ffm 1.0)
Findings:
Table B.8.6.1-2: 80
th Percentile Annual Average Groundwater FOCUS PEARL PECs (0.600 kg a.s./ha) [runs 148-
156]
Location Application
Scheme
Carbofuran
PEC
(µg/L)
3-Hydroxy-
Carbofuran
PEC
(µg/L)
3-Keto-
Carbofuran
PEC
(µg/L)
7-Phenol
Carbofuran
PEC (µg/L)
Châteaudun Sugar beets 1.6643 0.0437 0.1176 0.0028
Hamburg Sugar beets 1.5890 0.0495 0.2085 0.0597
Jokioinen Sugar beets 1.6238 0.0391 0.0651 0.0017
Kremsmünster Sugar beets 1.2330 0.0334 0.1093 0.0027
Okehampton Sugar beets 1.2805 0.0366 0.1185 0.0046
Piacenza Sugar beets 2.3195 0.0738 0.4252 0.1055
Porto Sugar beets 0.0366 0.0008 0.0013 0.0000
Sevilla Sugar beets 7.2117 0.1587 0.2120 0.0063
Thiva Sugar beets 0.1936 0.0054 0.0171 0.0004
Table B.8.6.1-3: 80th
Percentile Triennial Annual Average Groundwater FOCUS PEARL PECs (0.600 kg a.s./ha)
[runs 157-165]

Methomyl – Additional Report (Addendum 1) November 2008
9
Location Application
Scheme
Carbofuran
PEC
(µg/L)
3-Hydroxy-
Carbofuran
PEC
(µg/L)
3-Keto-
Carbofuran
PEC
(µg/L)
7-Phenol
Carbofuran
PEC (µg/L)
Châteaudun Sugar beets 0.6327 0.0165 0.0458 0.0011
Hamburg Sugar beets 0.5585 0.0175 0.0733 0.0216
Jokioinen Sugar beets 0.5957 0.0144 0.0224 0.0006
Kremsmünster Sugar beets 0.4143 0.0111 0.0308 0.0007
Okehampton Sugar beets 0.3823 0.0109 0.0371 0.0013
Piacenza Sugar beets 1.0945 0.0343 0.1782 0.0446
Porto Sugar beets 0.0181 0.0004 0.0006 0.0000
Sevilla Sugar beets 1.2633 0.0286 0.0481 0.0013
Thiva Sugar beets 0.0556 0.0016 0.0052 0.0001

Methomyl – Additional Report (Addendum 1) November 2008
10
Table B.8.6.1-4: 80th
Percentile Annual Average Groundwater FOCUS PELMO PECs (0.600 kg a.s./ha)
Location Application
Scheme
Carbofuran
PEC
(µg/L)
3-Hydroxy-
Carbofuran
PEC
(µg/L)
3-Keto-
Carbofuran
PEC
(µg/L)
7-Phenol
Carbofuran
PEC (µg/L)
Châteaudun Sugar beets 0.639 0.017 0.038 0.001
Hamburg Sugar beets 0.933 0.029 0.114 0.026
Jokioinen Sugar beets 0.762 0.015 0.022 0.001
Kremsmünster Sugar beets 0.600 0.015 0.030 0.001
Okehampton Sugar beets 1.085 0.030 0.089 0.003
Piacenza Sugar beets 1.205 0.036 0.178 0.040
Porto Sugar beets 0.018 0.000 0.000 0.000
Sevilla Sugar beets 0.480 0.010 0.010 0.000
Thiva Sugar beets 0.003 0.000 0.004 0.000
Table B.8.6.1-5: 80th
Percentile Annual Average Groundwater FOCUS PEARL PECs (0.060 kg a.s./ha) [runs 166-
174]
Location Application
Scheme
Carbofuran
PEC
(µg/L)
3-Hydroxy-
Carbofuran
PEC
(µg/L)
3-Keto-
Carbofuran
PEC
(µg/L)
7-Phenol
Carbofuran
PEC (µg/L)
Châteaudun Sugar beets 0.1431 0.0039 0.0102 0.0002
Hamburg Sugar beets 0.1342 0.0042 0.0178 0.0050
Jokioinen Sugar beets 0.1418 0.0035 0.0054 0.0001
Kremsmünster Sugar beets 0.1078 0.0030 0.0092 0.0002
Okehampton Sugar beets 0.1140 0.0033 0.0101 0.0003
Piacenza Sugar beets 0.2044 0.0065 0.0375 0.0093
Porto Sugar beets 0.0027 0.0001 0.0001 0.0000
Sevilla Sugar beets 0.5977 0.0136 0.0187 0.0004
Thiva Sugar beets 0.0170 0.0005 0.0015 0.0000

Methomyl – Additional Report (Addendum 1) November 2008
11
Table B.8.6.1-6: 80th
Percentile Triennial Average Groundwater FOCUS PEARL PECs (0.060 kg a.s./ha) [runs 175-
183]
Location Application
Scheme
Carbofuran
PEC
(µg/L)
3-Hydroxy-
Carbofuran
PEC
(µg/L)
3-Keto-
Carbofuran
PEC
(µg/L)
7-Phenol
Carbofuran
PEC (µg/L)
Châteaudun Sugar beets 0.0544 0.0015 0.0040 0.0001
Hamburg Sugar beets 0.0467 0.0015 0.0062 0.0018
Jokioinen Sugar beets 0.0496 0.0012 0.0020 0.0000
Kremsmünster Sugar beets 0.0347 0.0009 0.0027 0.0000
Okehampton Sugar beets 0.0330 0.0010 0.0032 0.0001
Piacenza Sugar beets 0.0974 0.0031 0.0159 0.0039
Porto Sugar beets 0.0013 0.0000 0.0000 0.0000
Sevilla Sugar beets 0.1080 0.0025 0.0042 0.0001
Thiva Sugar beets 0.0049 0.0001 0.0005 0.0000
Table B.8.6.1-7: 80th
Percentile Annual Average Groundwater FOCUS PELMO PECs (0.060 kg a.s./ha)
Location Application
Scheme
Carbofuran
PEC
(µg/L)
3-Hydroxy-
Carbofuran
PEC
(µg/L)
3-Keto-
Carbofuran
PEC
(µg/L)
7-Phenol
Carbofuran
PEC (µg/L)
Châteaudun Sugar beets 0.053 0.001 0.003 0.000
Hamburg Sugar beets 0.085 0.003 0.009 0.003
Jokioinen Sugar beets 0.054 0.001 0.002 0.000
Kremsmünster Sugar beets 0.048 0.001 0.003 0.000
Okehampton Sugar beets 0.096 0.003 0.008 0.000
Piacenza Sugar beets 0.102 0.003 0.015 0.003
Porto Sugar beets 0.001 0.000 0.000 0.000
Sevilla Sugar beets 0.036 0.001 0.001 0.000
Thiva Sugar beets 0.000 0.000 0.000 0.000
Conclusions:
The PECgw were recalculated considering the endpoints which have been defined during the
PRAPeR meeting on benfuracarb (January 2009).
Application rate of 0.600 kg a.s./ha: Results of the modelling indicated that the 80th
percentile annual average PECs
for carbofuran and its three soil metabolites in groundwater one metre below the surface did not exceed 0.1 µg/L for
1 out of 9 PEARL scenarios and 2 out of 9 PELMO scenarios at the 0.600 kg a.s./ha use rate.
At the application rate of 0.600 kg a.s./ha, one application every 3 years, that can be considered as the representative
worst case GAP (conventional sugar beet crop rotation), the 80th
percentile triennial average PECgw for carbofuran
and its soil metabolites did not exceed 0.1 µg/L for 2 out of 9 PEARL scenarios
The PECgw for the metabolites 7-phenol-carbofuran, 3-hydroxy- carbofuran, and 3-keto-carbofuran have been
calculated assuming extreme worst case scenarios (100% formation fraction in modelling, observed level of the
metabolites in aerobic degradation studies <5%AR, Koc). In consequence, the few exceedances of the 0.1 µg/L
trigger are not a concern.
Application rate of 0.060 kg a.s./ha:
In his resubmission dossier, Beside the GAP at 600 g a.s./ha (as in the original dossier), FMC supports an additional
use at reduced dose rate of 60 g a.s./ha. These PECgw have been included for completion.
Results of the modelling indicated that the 80th
percentile annual average PECs for carbofuran and its three soil
metabolites in groundwater one metre below the surface did not exceed 0.1 µg/L for 2 out of 9 PEARL scenarios
and for 8out of 9 PELMO scenarios.

Methomyl – Additional Report (Addendum 1) November 2008
12
At the application rate of 0.060 kg a.s./ha, one application every 3 years, that can be considered as the representative
worst case GAP (conventional sugar beet crop rotation), the 80th
percentile triennial average PECgw for carbofuran
and its soil metabolites did not exceed 0.1 µg/L for 8 out of 9 PEARL scenarios.
Based on these results, it can be expected that carbofuran would not pose a risk to groundwater in certain scenarios.
These calculations also show that a minor change of the DT50 endpoint (from 12.83 d to 14 d; within the variation
coefficient range) has a huge impact on the PEC outcome. It indicates that there is a large uncertainty on the
modelling results. It also demonstrated that an accumulation of worst cases assumptions would lead to highly worst
case outcome. In presenting the PEC conclusions to risk managers, the impact of the choice of endpoints on the PEC
results should be explicitely mentioned.
It can be expect that any of the carbofuran metabolites would be expected to reach groundwater at 1 m depth in a
majority of scenarios.
The RMS recommends therefore refining the groundwater risk assessment at national level.

Methomyl – Additional Report (Addendum 1) November 2008
13
B.8.6.2 Predicted Environmental Concentrations in surface water and sediment (PECsw) (Annex IIIA 9.2.3)
The notifier has proposed new PECsw calculations taking into account the endpoints that have been defined during
the PRAPER meeting on benfuracarb (January 2009)
Modelling softwares, input parameters:
The models used to calculate PEC are SWASH (+ FOCUS drift calculator), TOXSWA, MACRO and PRZM.
The PECsw and PECsed were calculated for the following GAPs of the formulation FURADAN 5G: maximum rate
of 0.600 kg a.s./ha and 0.060 kg a.s./ha (reduced application rate), once a year, at-plant application with
incorporation into the soil to 7.0 cm.
The PEC were calculated for the a.s. and the metabolites 3-hydroxy-carbofuran, 3-keto-carbofuran and
7-phenol-carbofuran.
The application dates generated by SWASH were 16th
March, 18th
April, 17th
March and 19th
February respectively
for the scenarios D3, D4, R1 and R3. Granular application (CAM=8, DEPI=7)
Table B.8.6.2-1: Input data
Parameter carbofuran 3OHCF 3ketoCF 7-phenolCF
Mw 221.3 237.3
221.3 for
MACRO runs*
235.24
221.3 for
MACRO runs*
164.2
Water solubility (mg/L, 20°C) 322 6207 4464 1096
Vapour pressure (Pa, 25°C) 8e-5 3.29e-3 2.6e-3 1.32
DT50 soil (days) 14 0.41 3.01 1
Kom 12.8 31.9 192 598
Koc 22 55 331 1031
1/n 0.96 1 1 0.9
Ffm 1 1 1
Q10 2.58 2.58 2.58 2.58
Plant Uptake 0 0 0 0
Crop washoff 0.146 0.455 0.401 0.234
Water DT50 15.3 1000 1000 9.9
Sediment DT50 1000 1000 1000 1000
*PECs adjusted for mw at end.
SW: CF to 7PhenolCF
CF to 3OHCF
CF to 3OHCF to 3KCF; non-standard MACRO runs (driver file for formation of 3KCF generated from CF
to 3OHCF runs)

Methomyl – Additional Report (Addendum 1) November 2008
14
CAM8 depi 7 cm Findings:
Table B.8.6.2-2: PEC SW, application of 600 g carbofuran/ha in sugar beet
File Scenario Compound Max PECsw
(µg/L)
Date of
max
PECsw
Max
PECsed
(µg/kg)
Date of max
PECsed
00031d_pa.sum D3 ( (Ditch) CF 0.0264 02-Feb-93 0.0461 14-Apr-93

Methomyl – Additional Report (Addendum 1) November 2008
15
00032p_pa.sum D4 ( (Pond) CF 0.1030 30-Dec-85 0.1250 20-Feb-86
00032s_pa.sum D4 ( (Stream) CF 0.0914 16-Dec-85 0.0871 31-Jan-86
00033p_pa.sum R1 ( (Pond) CF 0.0000 01-Mar-84 0.0000 01-Mar-84
00033s_pa.sum R1 ( (Stream) CF 0.0000 01-Mar-84 0.0000 01-Mar-84
00034s_pa.sum R3 ( (Stream) CF 0.0000 01-Oct-80 0.0000 01-Oct-80
00031d_m1.sum D3 ( (Ditch) 7PCF 0.0000 29-Jan-93 0.0012 01-May-93
00032p_m1.sum D4 ( (Pond) 7PCF 0.0001 29-Jan-86 0.0017 23-Feb-86
00032s_m1.sum D4 ( (Stream) 7PCF 0.0002 01-Jan-85 0.0020 01-Feb-86
00033p_m1.sum R1 ( (Pond) 7PCF 0.0000 01-Mar-84 0.0000 01-Mar-84
00033s_m1.sum R1 ( (Stream) 7PCF 0.0000 01-Mar-84 0.0000 01-Mar-84
00034s_m1.sum R3 ( (Stream) 7PCF 0.0000 01-Oct-80 0.0000 01-Oct-80
00015d_m1.sum D3 ( (Ditch) 3OHCF 0.0008 29-Jan-93 0.0018 19-Apr-93
00016p_m1.sum D4 ( (Pond) 3OHCF 0.0041 31-Jan-86 0.0082 27-Mar-86
00016s_m1.sum D4 ( (Stream) 3OHCF 0.0024 17-Dec-85 0.0029 31-Jan-86
00009p_m1.sum R1 ( (Pond) 3OHCF 0.0000 01-Mar-84 0.0000 01-Mar-84
00009s_m1.sum R1 ( (Stream) 3OHCF 0.0000 01-Mar-84 0.0000 01-Mar-84
00010s_m1.sum R3 ( (Stream) 3OHCF 0.0000 01-Oct-80 0.0000 01-Oct-80
00027d_m1.sum D3 ( (Ditch) 3KCF 0.0026 30-Jan-93 0.0185 01-May-93
00028p_m1.sum D4 ( (Pond) 3KCF 0.0079 01-Feb-86 0.0476 01-May-86
00028s_m1.sum D4 ( (Stream) 3KCF 0.0044 01-Jan-85 0.0182 30-Jan-86
00045p_m2.sum R1 ( (Pond) 3KCF 0.0000 01-Mar-84 0.0000 01-Mar-84
00045s_m2.sum R1 ( (Stream) 3KCF 0.0000 01-Mar-84 0.0000 01-Mar-84
00046s_m2.sum R3 ( (Stream) 3KCF 0.0000 01-Oct-80 0.0000 01-Oct-80
Table B.8.6.2-3: PEC SW, application of 60 g carbofuran/ha in sugar beet
File Scenario Compound Max PECsw
(µg/L)
Date of
max
PECsw
Max
PECsed
(µg/kg)
Date of max
PECsed
00035d_pa.sum D3 ( (Ditch) CF 0.0020 02-Feb-93 0.0038 15-Apr-93
00036p_pa.sum D4 ( (Pond) CF 0.0093 30-Dec-85 0.0117 21-Feb-86
00036s_pa.sum D4 ( (Stream) CF 0.0083 16-Dec-85 0.0080 31-Jan-86
00037p_pa.sum R1 ( (Pond) CF 0.0000 01-Mar-84 0.0000 01-Mar-84
00037s_pa.sum R1 ( (Stream) CF 0.0000 01-Mar-84 0.0000 01-Mar-84
00038s_pa.sum R3 ( (Stream) CF 0.0000 01-Oct-80 0.0000 01-Oct-80
00035d_m1.sum D3 ( (Ditch) 7PCF 0.0000 29-Jan-93 0.0001 01-Apr-93
00036p_m1.sum D4 ( (Pond) 7PCF 0.0000 29-Jan-86 0.0001 23-Feb-86
00036s_m1.sum D4 ( (Stream) 7PCF 0.0000 01-Jan-85 0.0002 02-Feb-86
00037p_m1.sum R1 ( (Pond) 7PCF 0.0000 01-Mar-84 0.0000 01-Mar-84
00037s_m1.sum R1 ( (Stream) 7PCF 0.0000 01-Mar-84 0.0000 01-Mar-84
00038s_m1.sum R3 ( (Stream) 7PCF 0.0000 01-Oct-80 0.0000 01-Oct-80
00017d_m1.sum D3 ( (Ditch) 3OHCF 0.0001 31-Jan-93 0.0001 20-Apr-93
00018p_m1.sum D4 ( (Pond) 3OHCF 0.0004 31-Jan-86 0.0007 27-Mar-86
00018s_m1.sum D4 ( (Stream) 3OHCF 0.0002 17-Dec-85 0.0003 31-Jan-86
00013p_m1.sum R1 ( (Pond) 3OHCF 0.0000 01-Mar-84 0.0000 01-Mar-84
00013s_m1.sum R1 ( (Stream) 3OHCF 0.0000 01-Mar-84 0.0000 01-Mar-84
00014s_m1.sum R3 ( (Stream) 3OHCF 0.0000 01-Oct-80 0.0000 01-Oct-80
00029d_m1.sum D3 ( (Ditch) 3KCF 0.0002 31-Jan-93 0.0014 01-May-93
00030p_m1.sum D4 ( (Pond) 3KCF 0.0007 31-Jan-86 0.0043 01-May-86
00030s_m1.sum D4 ( (Stream) 3KCF 0.0004 20-Dec-85 0.0016 30-Jan-86

Methomyl – Additional Report (Addendum 1) November 2008
16
00041p_m2.sum R1 ( (Pond) 3KCF 0.0000 01-Mar-84 0.0000 01-Mar-84
00041s_m2.sum R1 ( (Stream) 3KCF 0.0000 01-Mar-84 0.0000 01-Mar-84
00042s_m2.sum R3 ( (Stream) 3KCF 0.0000 01-Oct-80 0.0000 01-Oct-80
Conclusions:
The PECgw were recalculated considering the endpoints which have been defined during the
PRAPeR meeting on benfuracarb (January 2009).
These calculations also show that a minor change of the DT50 endpoint (from 12.83 d to 14 d; within the variation
coefficient range) has a huge impact on the PEC outcome. It indicates that there is a large uncertainty on the
modelling results. It also demonstrated that an accumulation of worst cases assumptions would lead to highly worst
case outcome. In presenting the PEC conclusions to risk managers, the impact of the choice of endpoints on the PEC
results should be explicitely mentioned.

17
ANNEX B
Addendum March 2009
Carbofuran
B.9 Ecotoxicology

Carbofuran Volume 3 – Annex B – Ecotoxicology March 2009
Belgium
___________________________________________________________________________
_______________
18
B.9.1 Effects on birds (Annex IIA 8.1; Annex IIIA 10.1)
Comments 5(19) and 5(28) in the reporting table:
The risk for birds drinking water possibly contaminated with carbofuran is assessed by the puddle scenario.
PECpuddle = )(1000
10/
sxKocw
AR
with :
AR = application rate in g/ha; divisor of 10 to achieve rate in mg/m²
w = 0.02 (pore water term: volume)
s = 0.0015 (soil term: volume, density, organic carbon content)
The application rate for carbofuran is 0.600 kg a.s./ha. The Kfoc value for carbofuran is 23.3 mL/g.
PECpuddle = )0015.03.2302.0(1000
10/600
x = 1.09 mg a.s./L
A small granivorous bird (passerines) has a drinking water rate DRW equivalent to 0.46 L/kg b.w./day.
The estimated theoretical exposure to carbofuran via drinking water is calculated as :
ETE = DRW x PECpuddle = 0.46 L/kg b.w./day x 1.09 mg a.s./L = 0.50 mg a.s./kg b.w./day
The acute risk is calculated as :
TER = LD50 / ETE = 0.71 / 0.50 = 1.41
The acute TER is below the trigger value of 10.
However, the RMS is of the opinion that this calculation is unrealistic worst-case (birds consuming their entire
drinking water demand on possibly contaminated puddles).

Carbofuran Volume 3 – Annex B – Ecotoxicology March 2009
Belgium
___________________________________________________________________________
_______________
19
B.9.2 Effects on aquatic organisms (fish, aquatic invertebrates, algae) (Annex IIA 8.2; Annex IIIA 10.2)
Comment 5(52) in the reporting table:
B.9.2.15 Summary of effects to aquatic organisms (Annex IIA 8.2; Annex IIIA 10.2)
Table B. 9.2.15-1 : Summary of effects of carbofuran to aquatic organisms (FMC)
Test species Test substance Test system Endpoints References
Chironomus
riparius
carbofuran 28 d static NOEC = 0.0032 mg a.s./L (mean measured)
Putt E., 2008
Table B. 9.2.15-2 : Summary of effects of metabolites of carbofuran to aquatic organisms (Dianica)
Test species Test substance Test system Endpoints References
Chironomus
riparius
7-phenol 25 d static NOEC = 5.34 mg a.s./L (mean measured)
Memmert U., 2002
B.9.2.16 Exposure and risk assessment for aquatic organisms (Annex IIIA 10.2)
B.9.2.16.1 Risk assessment for the active substance
Table B.9.2.16.1-1 : Toxicity Exposure Ratio’s (TER’s) for aquatic organisms exposed to carbofuran in surface
water for the intended use in sugar beet (1 x 0.600 kg a.s./ha) based on FOCUS Step 1 calculations
Test
substance
Organism Toxicity
end
point
(mg/L)
Time
scale
PECsw
(µg/L)
PECtwa
(µg/L)
TER Annex
VI
Trigger
carbofuran Chironomus
riparius
0.0032 chronic 193.97 - 0.02 10
Table B.9.2.16.1-2 : Toxicity Exposure Ratio’s (TER’s) for aquatic organisms exposed to carbofuran in surface
water for the intended use in sugar beet (1 x 0.600 kg a.s./ha) based on FOCUS Step 2 calculations
Test
substance
N/S Organism Toxicity
end
point
(mg/L)
Time
scale
PECsw
(µg/L)
TER Annex
VI
Trigger
cabofuran N Chironomus riparius 0.0032 chonic 31.26 0.10 10
S 62.51 0.05 10

Carbofuran Volume 3 – Annex B – Ecotoxicology March 2009
Belgium
___________________________________________________________________________
_______________
20
Table B.9.2.16.1-3 : Toxicity Exposure Ratio’s (TER’s) for aquatic organisms exposed to carbofuran in surface
water for the intended use in sugar beet (1 x 0.600 kg a.s./ha) based on FOCUS Step 3 calculations
Scenario Water
body
type
Test organism Time scale Toxicity
end
point
(mg/L)
PECsw
(µg/L)
TER Annex
VI
trigger
D3 Ditch
Chironomus
riparius 28 d 0.0032
0.0021 1524 100
D4 Pond 0.0196 163 100
D4 Stream 0.0146 219 100
R1 Pond 0.000 - 100
R1 Stream 0.000 - 100
R3 Stream 0.000 - 100
B.9.2.16.2 Risk assessment for the metabolites
Table B.9.2.16.2-4 : Toxicity Exposure Ratio’s (TER’s) for aquatic organisms exposed to 7-phenol in surface
water for the intended use in sugar beet (1 x 0.600 kg a.s./ha) based on FOCUS Step 1 calculations
Test
substance
Organism Toxicity
end
point
(mg/L)
Time
scale
PECsw
(µg/L)
PECtwa
(µg/L)
TER Annex
VI
Trigger
7-phenol Chironomus
riparius
5.34 chronic 64.43 - 83 10
In conclusion, the risk of carbofuran and the metabolite 7-phenol to sediment dwelling organisms is acceptable
based on FOCUS step 3, respectively FOCUS step 1 PECsw calculations.

Carbofuran Volume 3 – Annex B – Ecotoxicology March 2009
Belgium
___________________________________________________________________________
_______________
21
B.9.3 Effects on other terrestrial vertebrates (Annex IIIA 10.3)
Comment 5(47) in the reporting table:
The risk for mammals drinking water possibly contaminated with carbofuran is assessed by the puddle scenario.
PECpuddle = )(1000
10/
sxKocw
AR
with :
AR = application rate in g/ha; divisor of 10 to achieve rate in mg/m²
w = 0.02 (pore water term: volume)
s = 0.0015 (soil term: volume, density, organic carbon content)
The application rate for carbofuran is 0.600 kg a.s./ha. The Kfoc value for carbofuran is 23.3 mL/g.
PECpuddle = )0015.03.2302.0(1000
10/600
x = 1.09 mg a.s./L
A small granivorous mammal (non-desert species) has a drinking water rate DRW equivalent to 0.24 L/kg
b.w./day.
The estimated theoretical exposure to carbofuran via drinking water is calculated as :
ETE = DRW x PECpuddle = 0.24 L/kg b.w./day x 1.09 mg a.s./L = 0.26 mg a.s./kg b.w./day
The acute risk is calculated as :
TER = LD50 / ETE = 5.3 / 0.26 = 20
The acute TER is above the trigger value of 10, indicating that the risk is low.

Carbofuran Addendum to the DAR – Residue data April 2009 Belgium
22
ANNEX B
Carbofuran
B.7 Residue data
(Addendum April 2009)
Open point 3.1 of the Evaluation tables: “The residue definition in plant commodities both for monitoring and risk assessment should be discussed in a meeting of experts”.
Carbofuran Addendum to the DAR – Residue data April 2009 Belgium
23
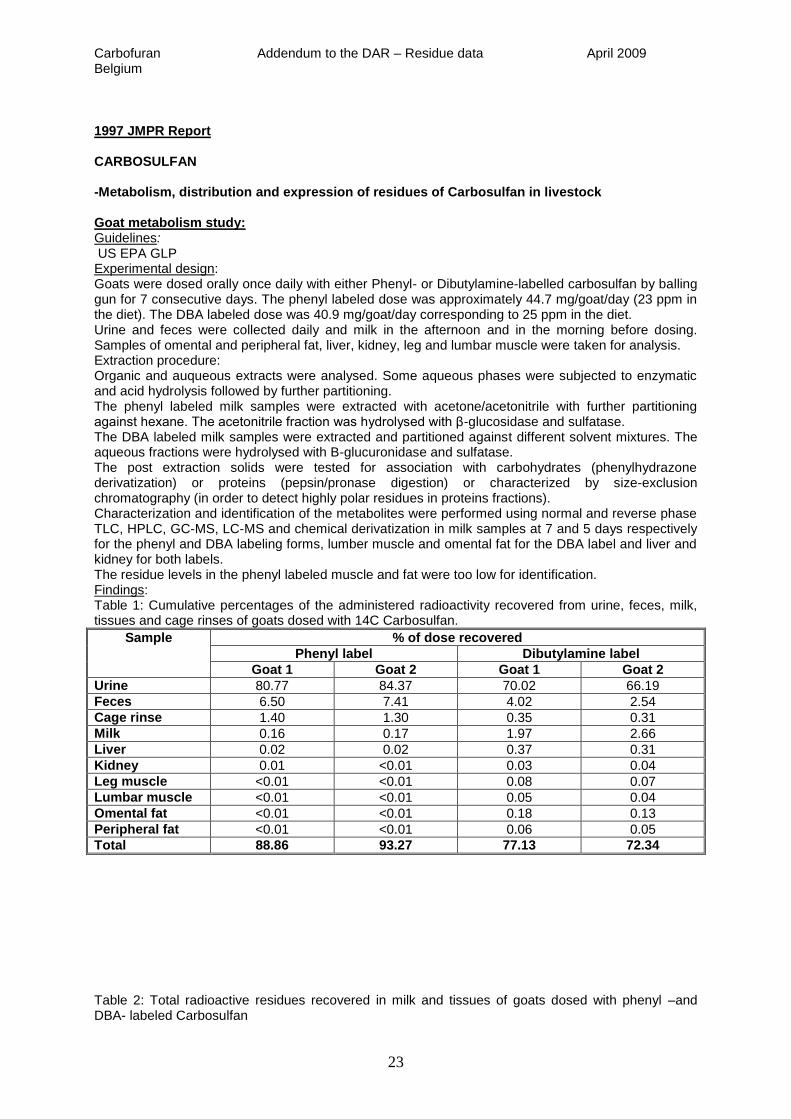
1997 JMPR Report CARBOSULFAN -Metabolism, distribution and expression of residues of Carbosulfan in livestock
Goat metabolism study: Guidelines: US EPA GLP Experimental design: Goats were dosed orally once daily with either Phenyl- or Dibutylamine-labelled carbosulfan by balling gun for 7 consecutive days. The phenyl labeled dose was approximately 44.7 mg/goat/day (23 ppm in the diet). The DBA labeled dose was 40.9 mg/goat/day corresponding to 25 ppm in the diet. Urine and feces were collected daily and milk in the afternoon and in the morning before dosing. Samples of omental and peripheral fat, liver, kidney, leg and lumbar muscle were taken for analysis. Extraction procedure: Organic and auqueous extracts were analysed. Some aqueous phases were subjected to enzymatic and acid hydrolysis followed by further partitioning. The phenyl labeled milk samples were extracted with acetone/acetonitrile with further partitioning against hexane. The acetonitrile fraction was hydrolysed with β-glucosidase and sulfatase. The DBA labeled milk samples were extracted and partitioned against different solvent mixtures. The aqueous fractions were hydrolysed with B-glucuronidase and sulfatase. The post extraction solids were tested for association with carbohydrates (phenylhydrazone derivatization) or proteins (pepsin/pronase digestion) or characterized by size-exclusion chromatography (in order to detect highly polar residues in proteins fractions). Characterization and identification of the metabolites were performed using normal and reverse phase TLC, HPLC, GC-MS, LC-MS and chemical derivatization in milk samples at 7 and 5 days respectively for the phenyl and DBA labeling forms, lumber muscle and omental fat for the DBA label and liver and kidney for both labels. The residue levels in the phenyl labeled muscle and fat were too low for identification. Findings: Table 1: Cumulative percentages of the administered radioactivity recovered from urine, feces, milk, tissues and cage rinses of goats dosed with 14C Carbosulfan.
Sample % of dose recovered
Phenyl label Dibutylamine label
Goat 1 Goat 2 Goat 1 Goat 2
Urine 80.77 84.37 70.02 66.19
Feces 6.50 7.41 4.02 2.54
Cage rinse 1.40 1.30 0.35 0.31
Milk 0.16 0.17 1.97 2.66
Liver 0.02 0.02 0.37 0.31
Kidney 0.01 <0.01 0.03 0.04
Leg muscle <0.01 <0.01 0.08 0.07
Lumbar muscle <0.01 <0.01 0.05 0.04
Omental fat <0.01 <0.01 0.18 0.13
Peripheral fat <0.01 <0.01 0.06 0.05
Total 88.86 93.27 77.13 72.34
Table 2: Total radioactive residues recovered in milk and tissues of goats dosed with phenyl –and DBA- labeled Carbosulfan

Carbofuran Addendum to the DAR – Residue data April 2009 Belgium
24
TRR expressed as mg 14
C Carbosulfan equiv./kg
Label Milk Liver Kidney Muscle Peripheral fat
Omental fat
Phenyl 0.04-0.09 0.06 0.18 <0.01 0.01 0.009
DBA 0.3-0.94 1.13 0.75 0.18 0.74 1.2
Table 3: Distribution and identification of the Carbosulfan metabolites from feeding of phenyl-labelled carbosulfan to goats for 7 consecutive days (23 ppm in the diet).
Metabolites % of TRR
Milk Liver Kidney
Total residue (mg/kg as Carbosulfan)
0.09 0.06 0.154
3-hydroxy carbofuran 34.20 9.50 21.50
3-OH-7-phenol 21.10 15.60 13.30
3-keto-7-phenol 29.90 3.00 8.30
7-phenol 9.20 4.60 8.90
Minor components 1.20 4.40(1)
7.60(1)
Characterised organosolubles
2.30 17.30 17.40
Protein associated metabolites
- 22.60 2.50
Polar aqueous metabolites
0.70 10.40 18.40
Unextractable residues
1.40 12.70 2.10
(1): Comprising 5-OH-carbofuran, N-hydroxy-carbofuran, 3-keto-carbofuran, Carbofuran, Carbosulfan,
3-keto-carbosulfan sulfone, 3-OH-carbosulfan and carbosulfan-sulfone.
Table 4: Distribution and identification of the Carbosulfan metabolites from feeding of Dibutylamine-labelled carbosulfan to goats for 7 consecutive days (25 ppm in the diet).
Metabolite % of TRR
Milk Fat Liver Kidney Muscle
Total residue (mg 14
Carbosulfan equi./kg)
0.680 1.286 0.986 0.823 0.193
Aminobutanols 29.7 0.8 8.1 11.9 ND
Dibutylamine(1)
6.7 0.6 13.4 10.5 9.6
Natural constituents
(2)
30.2 87.3 29.1 13.8 32.0
Unconjugated amines
11.8 ND 6.3 24.3 5.9
Conjugated or bound amines
10.5 ND 18.0 12.3 14.7
Lipophilic metabolites
0.6 0.5 1.3 4.5 1.2
Polar aqueous metabolites
7.6 0.2 16.6 18.5 26.5
Post extraction solids
2.9 10.5 7.2 4.2 10.0
(1): Including related compounds of Dibutylamine: hydroxydibutylamine, butylamine.
(2): In milk, fatty acids (13.4% TRR), amino acids (5.5 % TRR), carbohydrates (10.3% TRR) and
triglycerides (1.1% TRR). In omental fat, fatty acids (82% TRR) and triglycerides (5.3% TRR). In lumbar muscle, 20.6 % TRR were associated with conjugated, unconjugated or bound amines and 32 %TRR with amino acids (??).

Carbofuran Addendum to the DAR – Residue data April 2009 Belgium
25
-Metabolism, distribution and expression of residues of Carbosulfan in plants The following study was reported both in the 1997 JMPR report and in the DAR (July, 2004): “Nature of the Residue: Metabolism of Carbosulfan in/on Oranges (Randy A., Weintraub Ph.D., 1996)”. CARBOFURAN -Metabolism, distribution and expression of residues of Carbofuran in livestock The following study was reported both in the 1997 JMPR report and in the Carbofuran DAR (July, 2004): - Metabolism of
14C Carbofuran in Lactating Goats (Hoffman S.L & Robinson R.A., 1994a)
- Metabolism of 14
C Carbofuran in Laying Hens (Hoffman S.L & Robinson R.A., 1994b) -Metabolism, distribution and expression of residues of Carbofuran in plants -Potatoes: Experimental design: Greenhouse grown potatoes were treated with (phenyl)14C Carbofuran in a single direct application to the soil surface at 7.4 kg a.s./ha after plant emergence. Immature vines were sampled after 56 days and mature tubers harvest after 104 days. The samples were assayed for total radioactivity by combustion and Liquid scintillation counting. Extraction procedure: The extraction of immature vine and mature tubers was carried out with Methanol/water followed by partitioning against Methylene chloride to provide the organosoluble and aqueous soluble phases. The aqueous phase from the methylene chloride partitioning was sequentially incubated with B-glucosidase and hydrolysed with 0.25 N HCl and 2 N HCl in order to release organosoluble compounds from their conjugated form. The parent compound and the metabolites were identified or characterized by reverse-phase HPLC and normal-phase TLC. Tentative identifications were confirmed by GC-MS. Findings:
Compound Mature tuber (104-day PHI)
Immature foliage (56-day PHI)
% of TRR Mg/kg % of TRR Mg/kg
TRR (mg/kg) 100 0.80 100 30.5
Methanol/water extraction phase Not given Not given
Methylene chloride organosoluble phase
22 0.176 6 1.83
Aqueous soluble phase 61 0.488 87 26.53 14
C released by enzymatic digestion (B-glucosidase)
7.9 0.063 51 15.55
14C released by 0.25 N HCl 32 0.256 14 4.27
14C released by 2 N HCl 9.4 0.075 13 3.96
Metabolites identification
Carbofuran nd nd 3.5 1.071
3-OH-carbofuran 2.9 0.023 22.6 6.906
3-keto-carbofuran - - 1.1 0.324
7-phenol 45.3 0.361 6.7 2.044
3-OH-7-phenol 13.4 0.107 5.4 1.658
3-keto-7-phenol 6.6 0.052 9.4 2.858
5-OH-carbofuran - - 34.4 10.522
Total identified 68.2 (2.2%
unconjugated)
0.543 83.1 (4.6%
unconjugated)
25.383

Carbofuran Addendum to the DAR – Residue data April 2009 Belgium
26
Others 3.7 0.029 2.6 0.807
Polar residues 23.3 0.185 11.0 3.354
Unextractable residues 4.9 0.039 3.3 1.002
Total residues 100.0 0.80 100.1 30
-Soya beans: Experimental design: Sandy loam soil was treated with Carbofuran uniformly labeled with
14C in the phenyl ring at 5.5 kg
a.s./ha (USA). The test substance was applied deep furrow. Immediately after application, soya bean seeds were sown in a single row and covered with untreated soil. The soya beans were grown outdoors and samples of forage (PHI: 45 days), beans (PHI: 139 days) and hay (PHI: 139 days) were collected. Extraction procedure: The samples were assayed for total radioactivity by combustion and Liquid scintillation counting. Samples were sequentially extracted with Methanol/water and with 0.25 N HCl. The extracted samples were extracted with Methylene chloride and the residual solids were sequentially hydrolysed with 0.25 N HCl, cellulose, B-glucosidase, amyloglucosidase, pectinase, protease, 6N HCl and 2N NaOH. The solid residues from the hay samples after solvent extraction were solubilized with dioxane-water to release lignin. After each hydrolysis the aqueous extracts were adjusted to pH 2 and extracted with acetonitrile to recover organosolubles. The methanol/water and acid-reflluxed methanol/water extracts were analysed by reversed-phase HPLC. Confirmation was by normal-phase TLC and the main metabolites were identified by GC-MS. Unknown compounds separated by TLC and HPLC were investigated by HPLC-MS. Findings:
Compound Total radioactive residues expressed as % of TRR and mg/kg 14
C Carbofuran equiv.
Forage (63 mg/kg) Soya beans (0.32 mg/kg) Hay (36 mg/kg)
Methanol extract
Acid-refluxed extract
Methanol extract
Acid-refluxed extract
Methanol extract
Acid-refluxed extract
% TRR
Mg/kg % TRR
Mg/kg % TRR
Mg/kg % TRR
Mg/kg % TRR
Mg/kg % TRR
Mg/kg
Carbofuran 11.6 7.3 11.4 7.2 - - 0.42 0.001 0.30 0.11 0.62 0.22
3-keto-carbofuran
1.7 1.1 1.6 1.0 - - 5.3 0.02 0.41 0.15 - -
3-OH-carbofuran
10.6 6.6 28 18 0.56 0.002 1.5 0.005 3.2 0.50 7.8 2.8
7-phenol - - 1.4 0.90 0.38 0.001 4.0 0.013 0.67 0.24 0.72 0.26
3-keto-7-phenol
1.6 1.0 13 8.1 0.71 0.002 9.2 0.030 4.3 1.6 9.8 3.5
0-glucoside conjugate of 3-OH or 3-keto-7-phenol
16 9.9 3.4 2.1 11 0.036 - - 3.6 1.3 - -
2-OH-methyl-3-keto-carbofuran
- - 3.6 2.2 - - 0.93 0.03 - - 0.84 0.30
Total identified.
42 62 13 21 12 20
-Maize: Experimental design:

Carbofuran Addendum to the DAR – Residue data April 2009 Belgium
27
Loam soil was treated with Carbofuran uniformely labelled with 14
C in the phenyl ring at a rate of 8.3 kg a.s./ha. The test substance was sprayed in a band on the soil and was incorporated to a depth of about 5 cm before planting maize seed. Maize samples were taken at 3 growth stages: forage (immature stage, 47 days PHI), silage (99 days, PHI) and stover and grain (kernels without cob and husk, 158 days PHI). Extraction procedure: The samples were assayed for total radioactivity by combustion and Liquid scintillation counting. Each sample was extracted with methanol/water and the extracts acidified to pH 1 and partitioned with methylene chloride/ether. The aqueous fractions from the methylene chloride/ether partitioning of the forage and silage samples were divided in 2 fractions and treated sequentially with B-glucosidase and by acid refluxing followed by partitioning against methylene chloride/ether. The aqueous layer from this extract of the silage and forage samples was acidified by acid refluxing followed by extraction with methylene chloride/ether to collect the organosoluble unconjugated metabolites. The post extraction solids (PES) from the initial methanol/water extraction were refluxed with 0.25 N HCl. The hydrolysate from the grain was tested to determine the presence of reducing sugars with Benedict‟s solution and by osazone formation. Both tests indicated reducing sugars. The residue after acid hydrolysis was treated with a surfactant. The organosoluble fractions from the forage and silage, i.e. the methylene chloride/ether extracts of the acidified methanol/water extract and of the 0.25 N hydrolysate, were analysed by HPLC, TLC and GC-MS. The extracts from grain and stover were not further analysed because of the very low level of recovered radioactivity. Findings:
Fraction/Compounds Grain Forage Stover Silage
Total radioactive residues (mg/kg)
0.023 0.81 0.075 0.14
% TRR Mg/kg % TRR Mg/kg % TRR Mg/kg % TRR Mg/kg
Methylene chloride/ether (non conjugates)
5.8 0.001 42 0.34 4.4 0.003 4.6 0.006
Acid-released methylene chloride/ether (aglycones)
32 0.26 - - 20 0.028
Glucosidase-released (aglycones)
- - 19 0.15 - - 23 0.032
Residual acid aqueous
- - 8.1 0.066 22 0.016 31 0.036
Acid-released from PES
48 0.011 3.5 0.028 13 0.010 9.9 0.014
Surfactant-released from PES
- - 1.6 0.013 4.7 0.004 5.1 0.007
Total released residue
48 87 44 71
Identification of the metabolites in the organosoluble extracts of maize silage and forage
Carbofuran 14 0.11 0.18 <0.001
Carbofuran aglycone 2.4 0.019 2.1 0.003
3-keto-carbofuran 1.6 0.013 - -
3-keto-carbofuran aglycone
0.28 0.003 0.91 0.001
3-OH-carbofuran 13 0.11 1.3 0.002
3-OH-carbofuran aglycone
9.7 0.078 7.9 0.011
7-phenol 0.47 0.004 0.088 <0.001
7-phenol aglycone 7.5 0.060 2.8 <0.001
3-keto-7-phenol 4.8 0.039 1.4 0.002
3-keto-7-phenol aglycone
5.6 0.045 2.4 0.003

Carbofuran Addendum to the DAR – Residue data April 2009 Belgium
28
3-OH-7-phenol 2.4 0.020 0.88 0.001
3-OH-7-phenol aglycone
3.6 0.029 2.3 0.003
Total 65 0.53 22 0.026
The predominant compounds recovered in maize forage and silage was the carbofuran and 3-OH-carbofuran, free and conjugated. The amount of radioactivity that could not be extracted with solvent or released by acid hydrolysis increased with the PHI, suggesting incorporation of the radioactivity into plants constituents. Residues in succeeding or rotational crops Experimental design: In a confined crop rotation study (Phenyl)-
14C-Carbofuran was applied directly to a silt loam soil at an
application rate of 3.4 kg as/ha. Wheat, soya beans and sugar beet were seeded into the treated soil 4 and 12 months after treatment and grown to maturity. Wheat forage, straw and grain, soya bean silage, stems, pods and beans and sugar beet tops and roots were assayed for the determination of the total radioactive residues. Extraction procedure: Each sample was extracted with Methanol/water and separated into non polar and polar fractions for further metabolites identification. Conjugated metabolites were hydrolysed with 0.25 N HCl. Metabolites were identified by TLC, by co-chromatography with reference standards. Findings:
Crop Sample Total radioactive residues (mg/kg)
4 months 12 months
Wheat Forage - 1.40
Straw 54.0 0.30
Grain 0.60 0.04
Soya bean Silage 16.0 0.50
Stem 18.0 0.70
Pod 5.0 0.10
Beans 1.0 0.08
Sugar beet Top 0.40 0.05
Root 0.20 0.05
The phenolic metabolites were the main degradation products recovered in the rotated crops. The carbamates (carbofuran, 3-OH-carbofuran and 3-keto-carbofuran) constituted a small proportion of the total radioactive residues (<10 % of the TRR in any crop sown at 4 and 12 months). Open point 3.3 of the evaluation tables: “It should be clarified whether in the data generation methods (residue trials) the efficiency of the hydrolysis step was validated?” The validation data package is presented here below:

Carbofuran Addendum to the DAR – Residue data April 2009 Belgium
29
-Determination of residues of carbosulfan and its metabolites carbofuran and 3-hydroxy carbofuran by HPLC-MS-MS in maize and sugar beet samples – Validation of the method. (Enriquez, 2006, Report BATTELLE A-17-05-13) GLP : GLP-compliance stated Principle of the method : Carbosulfan and Carbofuran (CS-CF) is extracted from 5 g sample with a mixture of hexane – acetone (4:1, v/v) and filtered through Celite and sodium sulphate anhydrous.
The metabolite 3-hydroxy carbofuran (3-OHCF) is extracted from the remaining filter cake by refluxing with 0.25 M hydrochloric acid. After filtration the 3-hydroxy carbofuran is cleaned-up through a C18 SPE cartridge using methanol 1% in dichloromethane.
The combined organic extract (CS-CF and 3-OHCF) is evaporated (at temperatures below 35°C and after addition of „keeper‟ 1-decanol, in order to avoid losses of carbosulfan), re-constituted and kept in acetonitrile. Then the re-constituted extract is diluted with acetonitrile and water (to have the same composition of the mobile phase) and analysed by HPLC (column: Aqua C18, 50mm x 2mm ID, 5µm particles) with MS-MS detection (ESI, positive mode).
Findings:
Specificity – interferences :
- Following ion transitions were monitored (MRM): m/z 381.1 118.1
(carbosulfan); m/z 222.1 123.0 (carbofuran); m/z 237.9 163.0 (3-OH-carbofuran);
LC-MS/MS is highly specific no need for separate confirmatory method. - No significant interferences (>30% of LOQ) were observed at the
retention times of carbosulfan, carbofuran or 3-hydroxy carbofuran in any blank or control sample.
Linearity : The detector response for each compound was linear over the concentration range 1 ng/mL to 25 ng/mL (corresponding to a residue conc. range of 2 to 50 ppb). Correlation coefficients > 0.99.
Recovery – precision :
see Table B.5.2.1-9b
Validation by an independent laboratory :
First validation of method by Battelle; ILV described in study by Zietz (2008) was conducted by SGS Institut Fresenius.
Limit of quantification (LOQ) : 0.005 mg/kg (= 5 ppb) for each analyte in maize and sugar beet Table B.5.2.1-9b: Lab validation of LC-MS/MS method for residues of Carbofuran and 3-OH Carbofuran in maize and sugar beet (Enriquez, 2006) (FMC)
Matrix Analyte
Fortification level (mg/kg commodity)
Recovery
Number of samples
Range (%) Mean (%) RSD (%)
Maize grain Carbosulfan 0.005 0.050
5 5
77-82 70-79
80 75
3 5
Overall 10 70-82 78 5
Carbofuran 0.005 0.050
5 5
87-94 96-102
89 99
3 2
Overall 10 87-102 94 6
3-OH carbofuran
0.005 0.050
5 5
94-107 100-104
97 101
5 2
Overall 10 94-107 100 4
Sugar beet
Carbosulfan 0.005 0.050
5 5
67-77 82-91
73 87
5 4
Overall 10 67-91 80 10
Carbofuran 0.005 0.050
5 5
82-94 84-104
86 97
6 8

Carbofuran Addendum to the DAR – Residue data April 2009 Belgium
30
Overall 10 82-104 92 9
3-OH carbofuran
0.005 0.050
5 5
102-115 75-100
107 92
5 11
Overall 10 75-115 100 11
Conclusion: The analytical method is suitable for the determination of carbosulfan and its metabolites carbofuran and 3-hydroxy carbofuran in maize and sugar beet samples with a LOQ of 5 ppb for each analyte.

Carbofuran Addendum to the DAR – Residue data April 2009 Belgium
31
Open point 3.6 of the Evaluation tables: “Assessment of residues in animal matrices, considering information available from all animal studies, to be submitted in an addendum and reviewed by the meeting of experts” A) Metabolism, distribution and expression of residues of carbofuran in lactating goats
Summary of the nature of the metabolites in tissues and milk of a lactating goat orally dosed with (Phenyl ring -UL-
14C) –carbofuran (Feeding level: 1.35 mg/kg
b.w./day) – Results expressed in % of the total radioactive residues –( mg 14
C carbofuran equiv/kg). Samples Carbofuran 3-OH-
carbofuran 7-phenol
3-OH-7-phenol
3-keto-7-phenol
Aqueous residues
Polar residues
Unknown metabolites
Total identified metabolites
Bound residues
Total
Milk 0.41 (0.001)
10.01 (0.032)
15.25 (0.048)
6.83 (0.021)
31.85 (0.102)
6.34 (0.020)
21.90(1)
(0.070) 4.93
(0.016) 64.38
(0.204) 2.47
(0.008) 99.9
(0.318)
Loin muscle
nd nd nd nd nd 27.57 (0.003)
nd 0.35 (<0.001)
- 72.08 (0.007)
100.1 (0.010)
Liver nd 4.02 (0.005)
2.45 (0.003)
12.39 (0.017)
nd 31.72 (0.045)
6.87 (0.010)
35.17(2)
(0.046) 18.86
(0.025) 7.37
(0.010) 99.99
(0.136)
Kidney nd 11.00 (0.029)
nd 15.84 (0.042)
nd 28.58 (0.076)
16.64(3)
(0.044) 22.96
(4)
(0.060) 26.84
(0.071) 4.99
(0.013) 100.01 (0.264)
Nd : not radiodetected. (1) : sum of 3 fractions , none exceeding 19.71 % (0.063 ppm) (2) : sum of 10 fractions , none exceeding 8.63 % (0.012 ppm) (3) : sum of 3 fractions , none exceeding 8.34 % (0.022 ppm) (4) : sum of 10 fractions , none exceeding 5.29 % (0.014 ppm)
Remark: Because the extraction profiles from the initial extractions of milk, liver and kidney from both the 2 treated goats were very similar, metabolite analysis was performed only on the extracts from one of the 2 goats.

Carbofuran Addendum to the DAR – Residue data April 2009 Belgium
32
B) Metabolism, distribution and expression of residues of carbofuran in laying hens
Recovery of radioactivity from hens after oral administration of (Phenyl ring -UL-14
C) –carbofuran (% of total administered radioactivity).
Hen group B C D Average of the % of total dose
Average of TRR (mg/kg) % of total
dose TRR
(mg/kg) % of total
dose TRR
(mg/kg) % of total
dose TRR
(mg/kg)
Excreta(1)
83.13 - 81.63 - 83.71 - 82.82 -
Egg white(1)
0.30 0.058 0.24 0.056 0.28 0.064 0.27 0.059
Egg yolk(1)
0.23 0.137 0.19 0.151 0.22 0.135 0.21 0.141
Total excretion 83.66 82.06 84.21 83.33 -
Liver 0.11 0.142 0.12 0.145 0.09 0.125 0.11 0.137
Kidney 0.01 0.034 0.01 0.035 0.01 0.033 0.01 0.034
Breast muscle 0.03 <0.010 0.02 <0.010 0.01 <0.010 0.02 <0.01
Thigh muscle 0.01 <0.010 <0.01 <0.010 <0.01 <0.010 <0.01 <0.01
Fat with skin <0.01 0.010 0.01 <0.010 <0.01 <0.010 <0.01 0.01
Total recovery 83.82 - 82.21 - 84.32 - 83.44 - (1)
: values expressed as a cumulative percentage of the total administered dose on day 7. No justification was provided by the notifier for lacking 17 % of the total dose for the 3 hen groups.
Summary of the nature of the metabolites in tissues and eggs of laying hens orally dosed with (Phenyl ring -UL-
14C) –carbofuran (Feeding level : 1.92 mg/kg
b.w./day) – Results expressed in (% of the total radioactive residues) –(mg 14
C carbofuran equiv/kg).
Samples Carbofuran 3-OH-carbofuran
7-phenol
3-OH-7-phenol
3-keto-7-phenol
Phenolic conjugates
Aqueous residues
Polar residues
Unknown metabolites
Bound residues
Total
Egg white nd nd nd nd nd 90.00 (0.060)
nd nd 0.73 (<0.001)
9.27 (0.006)
100.0 (0.066)
Egg yolk nd 12.05 (0.019)
15.66 (0.026)
39.16 (0.062)
7.41 (0.012)
nd 4.58 (0.007)
nd 12.7 (0.021)
8.45 (0.014)
100.01 (0.161)
Liver nd nd 5.68 (0.008)
7.36 (0.010)
nd nd 26.09 (0.035)
11.79 (0.016)
45.84(1)
(0.065) 3.24 (0.005)
100.0 (0.139)
Kidney nd nd 4.87 (0.001)
5.35 (0.002)
nd nd 22.21 (0.008)
30.13 (0.010)
34.91(2)
(0.011) 2.55 (0.001)
100.02 (0.033)
Nd: not radiodetected. (1) : this value represents the sum of 9 fractions, none exceeding 9.26 % (0.013 mg/kg) (2) : this value represents the sum of 7 fractions, none exceeding 15.44 % (0.005 mg/kg)

Carbofuran Addendum to the DAR – Residue data April 2009 Belgium
33
The residue levels recovered in the following matrices were determined in compliance with the proposed residue definition for risk assessment: 3-OH-carbofuran, free and conjugated expressed as 3-OH-carbofuran. Ruminants (metabolism study): -Milk: 0.0003 mg/kg (Table B.7.2.1-3 in the DAR) -Liver: 0.00005 mg/kg (Table B.7.2.1-3 in the DAR) -Kidney: 0.0003 mg/kg (Table B.7.2.1-3 in the DAR) -Muscle: TRR: 0.000083 mg/kg (Table B.7.2.1-1 in the DAR) -Fat: TRR: 0.000083 mg/kg (Table B.7.2.1-1 in the DAR) Poultry (metabolism study): -Eggs: 0.000008 mg/kg (Table B.7.2.2-3 in the DAR) 3-OH-carbofuran was not detected in egg white, liver, kidney, muscle and fat.
Open point: 3.9 of the Evaluation Tables: “The consumer risk assessment should be discussed in a meeting of expert, considering all relevant sources of exposure to carbofuran residues with respect to the notified use”
A) Dietary intake risk assessment to Carbofuran and 3-OH carbofuran residues according to EFSA PRIMo Input values: Sugar beet root (residue trials): 0.01 mg/kg (LoQ of the analytical method for the sum of Carbofuran and 3-OH carbofuran, free and conjugated, expressed as carbofuran) The residue levels recovered in the following matrices were in compliance with the proposed residue definition for risk assessment: 3-OH-carbofuran, free and conjugated expressed as 3-OH-carbofuran. Ruminants (metabolism study): -Milk: 0.0003 mg/kg (Table B.7.2.1-3 in the DAR) -Liver: 0.00005 mg/kg (Table B.7.2.1-3 in the DAR) -Kidney: 0.0003 mg/kg (Table B.7.2.1-3 in the DAR) -Muscle: TRR: 0.000083 mg/kg (Table B.7.2.1-1 in the DAR) -Fat: TRR: 0.000083 mg/kg (Table B.7.2.1-1 in the DAR) Poultry (metabolism study):
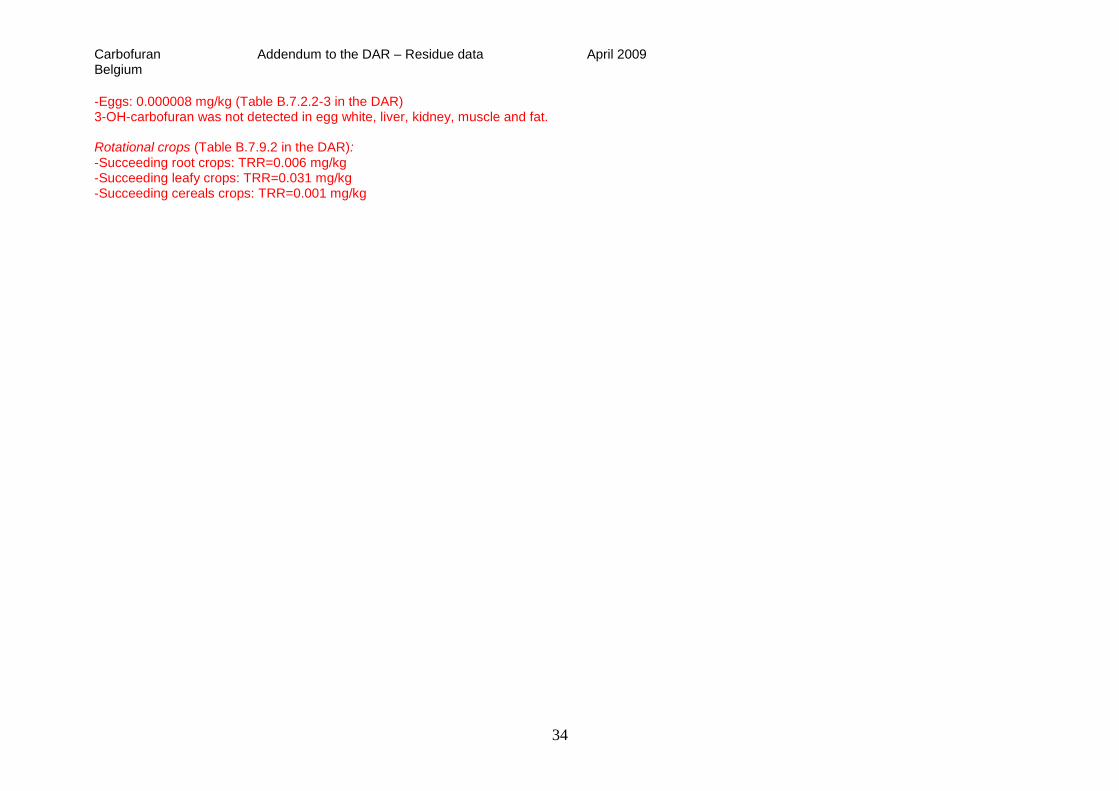
Carbofuran Addendum to the DAR – Residue data April 2009 Belgium
34
-Eggs: 0.000008 mg/kg (Table B.7.2.2-3 in the DAR) 3-OH-carbofuran was not detected in egg white, liver, kidney, muscle and fat. Rotational crops (Table B.7.9.2 in the DAR): -Succeeding root crops: TRR=0.006 mg/kg -Succeeding leafy crops: TRR=0.031 mg/kg -Succeeding cereals crops: TRR=0.001 mg/kg

Carbofuran Addendum to the DAR – Residue data April 2009 Belgium
35
Carbofuran + 3-OH-carbofuran
Status of the active substance: Code no.
LOQ (mg/kg bw): 0,005 proposed LOQ:
Toxicological end points
ADI (mg/kg bw/day): 0,00015 ARfD (mg/kg bw): 0,00015
Source of ADI: DAR Source of ARfD: DAR
Year of evaluation: 2009 Year of evaluation: 2009
Chronic risk assessment
TMDI (range) in % of ADI minimum - maximum
10 173
No of diets exceeding ADI: 1
Highest calculated
TMDI values in % of ADI MS Diet
Highest contributor to MS
diet (in % of ADI)
Commodity / group of commodities
2nd contributor to MS diet
(in % of ADI) Commodity / group of commodities
3rd contributor to MS diet (in % of
ADI)
Commodity / group of commodities
pTMRLs at LOQ (in % of ADI)
172,9 UK Toddler 152,5 Sugar beet (root) 14,0 Potatoes 3,0 CEREALS 3,1
89,4 UK Infant 67,2 Sugar beet (root) 13,0 Potatoes 5,3 Carrots 3,0
54,0 NL child 23,6 Potatoes 7,6 Spinach & similar (leaves)
6,4 Lettuce and other salad plants including Brassicacea
9,7
49,5 FR toddler 20,3 Potatoes 14,2 Spinach & similar
(leaves) 9,8 Carrots 2,1
43,2 FR infant 16,5 Potatoes 10,6 Carrots 8,9 Spinach & similar (leaves)
5,8
42,8 SE general population 90th percentile 16,7 Potatoes 8,3 Lettuce and other salad plants including Brassicacea
5,2 Leafy brassica
5,8
40,8 WHO Cluster diet B 10,7 Potatoes 8,2 Lettuce and other salad plants including Brassicacea
7,9 CEREALS 8,7
37,4 UK Adult 26,6 Sugar beet (root) 5,6 Potatoes 2,4 Lettuce and
other salad 1,4

Carbofuran Addendum to the DAR – Residue data April 2009 Belgium
36
plants including Brassicacea
37,2 UK vegetarian 25,2 Sugar beet (root) 5,5 Potatoes 2,9 Lettuce and other salad plants including Brassicacea
1,7
33,1 WHO cluster diet D 16,2 Potatoes 7,6 Leafy brassica 5,6 CEREALS 6,6
31,9 WHO regional European diet 16,1 Potatoes 8,5 Lettuce and other salad plants including Brassicacea
2,5 CEREALS 3,5
30,8 WHO Cluster diet F 13,6 Potatoes 6,2 Lettuce and other salad plants including Brassicacea
3,6 CEREALS 4,5
29,8 PT General population 21,3 Potatoes 3,6 CEREALS 2,7 Carrots 3,6
29,0 IE adult 9,2 Potatoes 4,4 CEREALS 4,1 Leafy
brassica 5,0
28,4 WHO cluster diet E 15,3 Potatoes 4,1 Lettuce and other salad plants including Brassicacea
4,0 CEREALS 4,7
27,9 DE child 10,3 Potatoes 4,2 Spinach & similar
(leaves) 4,1 Carrots 6,6
26,3 ES child 8,6 Lettuce and other salad plants including Brassicacea
7,4 Potatoes 3,5 CEREALS 6,1
25,7 NL general 11,0 Potatoes 5,0 Lettuce and other salad plants including Brassicacea
3,0 Spinach & similar (leaves)
3,2
25,5 DK child 9,7 Potatoes 6,9 CEREALS 5,5 Carrots 7,0
23,0 IT adult 11,5 Lettuce and other salad plants including Brassicacea
4,4 Spinach & similar (leaves)
3,4 CEREALS 3,4
22,3 IT kids/toddler 8,5 Lettuce and other salad plants including Brassicacea
5,6 CEREALS 3,6 Potatoes 5,6
21,9 ES adult 11,1 Lettuce and other salad plants including Brassicacea
3,7 Potatoes 3,3 Spinach & similar (leaves)
3,2
17,8 LT adult 12,7 Potatoes 1,8 CEREALS 1,3 Lettuce and other salad plants including Brassicacea
2,6
17,1 PL general population 13,7 Potatoes 1,2 Carrots 0,9 Beetroot 0,0
16,1 FR all population 6,6 Lettuce and other salad
plants 4,5 Potatoes 2,3 CEREALS 2,9

Carbofuran Addendum to the DAR – Residue data April 2009 Belgium
37
including Brassicacea
13,1 DK adult 5,8 Potatoes 2,7 Lettuce and other salad plants including Brassicacea
1,9 CEREALS 2,0
9,8 FI adult 4,9 Potatoes 1,6 Lettuce and other salad plants including Brassicacea
1,3 CEREALS 1,3
Acute risk assessment /children Acute risk assessment / adults / general population
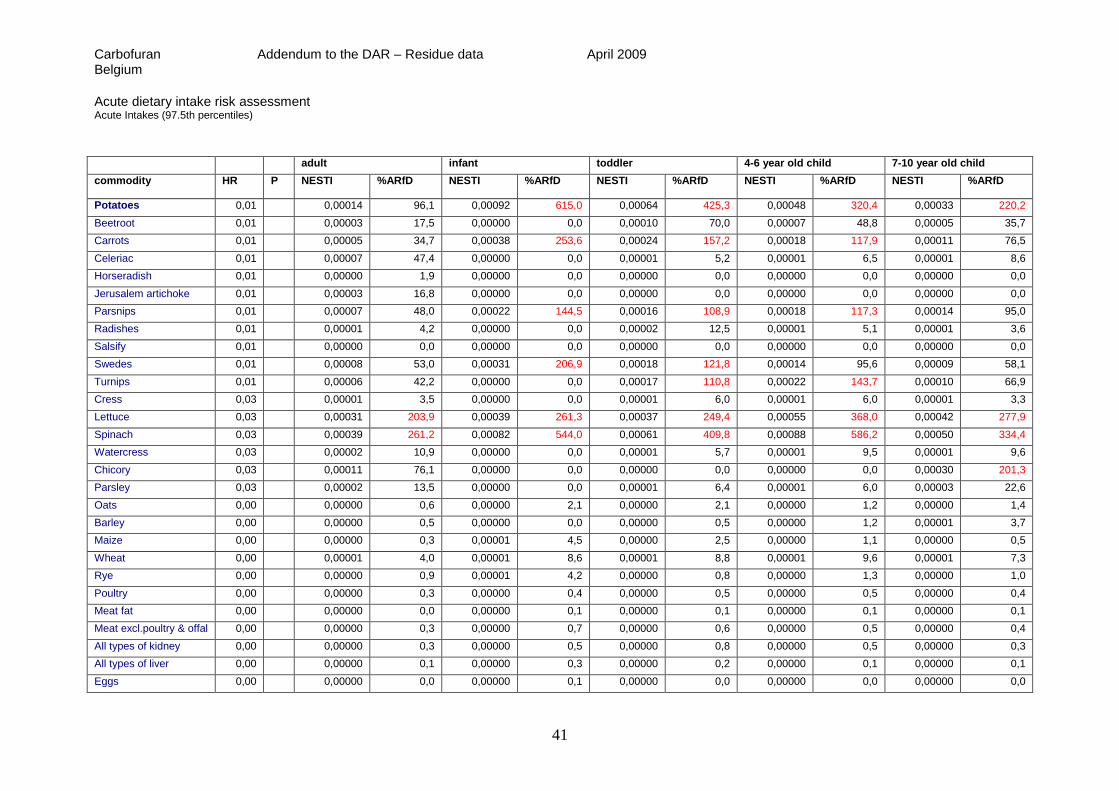
In the IESTI 1 calculation, the variability factors were 10, 7 or 5 (according to JMPR manual 2002), for lettuce a variability factor of 5 was used. In the IESTI 2 calculations, the variability factors of 10 and 7 were replaced by 5. For lettuce the calculation was performed with a variabilty factor of 3.
Threshold MRL is the calculated residue level which would leads to an exposure equivalent to 100 % of the ARfD.
Un
pro
cessed
co
mm
od
itie
s
No of commodities for which ARfD/ADI is exceeded (IESTI 1): 16
No of commodities for which ARfD/ADI is exceeded (IESTI 2): 16
No of commodities for which ARfD/ADI is exceeded (IESTI 1): 9
No of commodities for which ARfD/ADI is exceeded (IESTI 2): 8
IESTI 1 *) **) IESTI 2 *) **) IESTI 1 *) **) IESTI 2 *) **)
Highest % of
ARfD/ADI Commodities
pTMRL/ threshold
MRL (mg/kg)
Highest % of ARfD/ADI Commodities
pTMRL/ threshold
MRL (mg/kg)
Highest % of ARfD/ADI Commodities
pTMRL/ threshold
MRL (mg/kg)
Highest % of
ARfD/ADI Commodities
pTMRL/ threshold
MRL (mg/kg)
1806,8 Scarole (broad-leaf endive)
0,031 / 0 1806,8 Scarole (broad-leaf endive)
0,031 / 0 738,1 Chinese cabbage
0,031 / 0 738,1 Chinese cabbage
0,031 / 0
1397,1 Kale 0,031 / 0 998,3 Kale 0,031 / 0 421,2 Kale 0,031 / 0 313,0 Kale 0,031 / 0
767,4 Chinese cabbage 0,031 / 0 767,4 Chinese cabbage
0,031 / 0 227,1 Lettuce 0,031 / 0,01
187,9 Purslane 0,03 / 0,01
615,0 Potatoes 0,006 / 0 452,0 Spinach 0,03 / 0 206,7 Purslane 0,03 / 0,01
183,4 Scarole (broad-leaf endive)
0,031 / 0,01
556,0 Lettuce 0,031 / 0 439,3 Potatoes 0,006 / 0 183,4 Scarole (broad-leaf endive)
0,031 / 0,01
178,7 Spinach 0,03 / 0,01
452,0 Spinach 0,03 / 0 425,7 Sugar beet (root)
0,01 / 0 178,7 Spinach 0,03 / 0,01
172,9 Sugar beet (root)
0,01 / 0
425,7 Sugar beet (root) 0,01 / 0 333,6 Lettuce 0,031 / 0 172,9 Sugar beet (root)
0,01 / 0 136,3 Lettuce 0,031 / 0,02
351,1 Beet leaves (chard) 0,03 / 0 266,4 Beet leaves (chard)
0,03 / 0,01
148,4 Beet leaves (chard)
0,03 / 0,02
125,4 Beet leaves (chard)
0,03 / 0,02
302,2 Purslane 0,03 / 0 229,1 Purslane 0,03 / 0,01
119,4 Potatoes 0,006 / 0 95,6 Swedes 0,006 / -
253,6 Carrots 0,006 / 0 221,2 Celeriac 0,006 / 0 95,6 Swedes 0,006 / - 93,5 Potatoes 0,006 / -
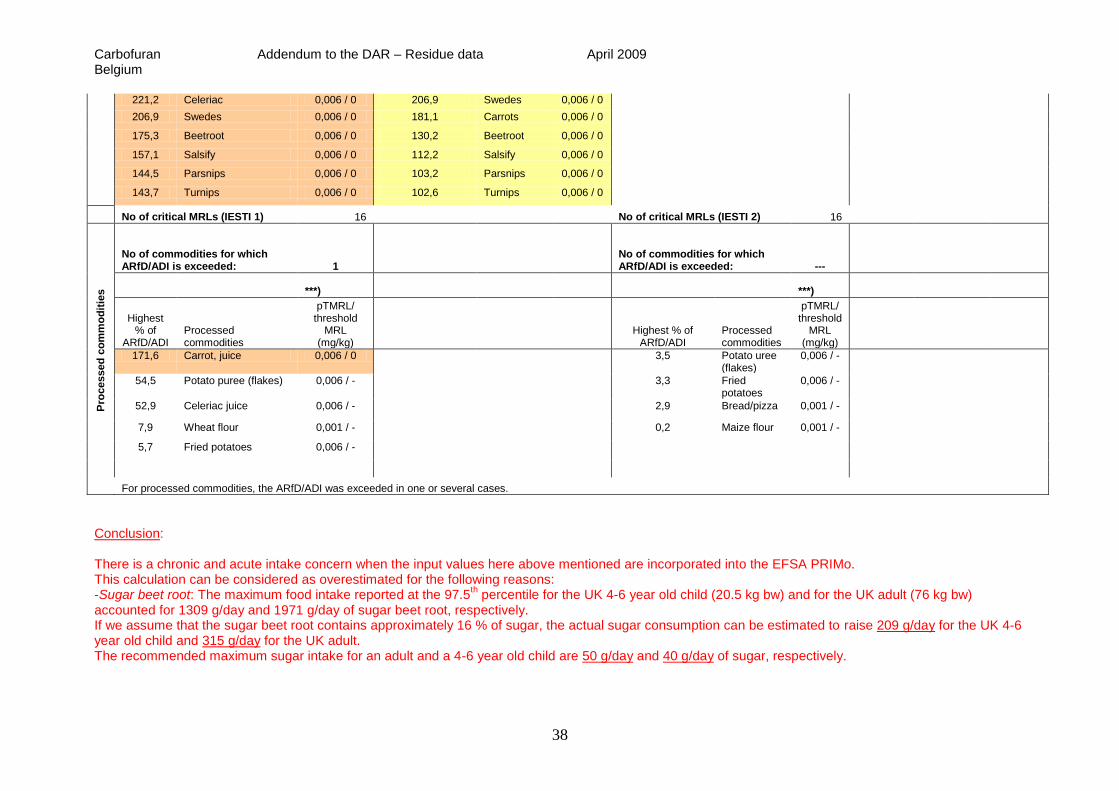
Carbofuran Addendum to the DAR – Residue data April 2009 Belgium
38
221,2 Celeriac 0,006 / 0 206,9 Swedes 0,006 / 0
206,9 Swedes 0,006 / 0 181,1 Carrots 0,006 / 0
175,3 Beetroot 0,006 / 0 130,2 Beetroot 0,006 / 0
157,1 Salsify 0,006 / 0 112,2 Salsify 0,006 / 0
144,5 Parsnips 0,006 / 0 103,2 Parsnips 0,006 / 0
143,7 Turnips 0,006 / 0 102,6 Turnips 0,006 / 0
No of critical MRLs (IESTI 1) 16 No of critical MRLs (IESTI 2) 16
Pro
cessed
co
mm
od
itie
s
No of commodities for which ARfD/ADI is exceeded: 1
No of commodities for which ARfD/ADI is exceeded: ---
***) ***)
Highest % of
ARfD/ADI Processed commodities
pTMRL/ threshold
MRL (mg/kg)
Highest % of ARfD/ADI
Processed commodities
pTMRL/ threshold
MRL (mg/kg)
171,6 Carrot, juice 0,006 / 0
3,5 Potato uree (flakes)
0,006 / -
54,5 Potato puree (flakes) 0,006 / -
3,3 Fried potatoes
0,006 / -
52,9 Celeriac juice 0,006 / -
2,9 Bread/pizza 0,001 / -
7,9 Wheat flour 0,001 / -
0,2 Maize flour 0,001 / -
5,7 Fried potatoes 0,006 / -
For processed commodities, the ARfD/ADI was exceeded in one or several cases.
Conclusion: There is a chronic and acute intake concern when the input values here above mentioned are incorporated into the EFSA PRIMo. This calculation can be considered as overestimated for the following reasons: -Sugar beet root: The maximum food intake reported at the 97.5
th percentile for the UK 4-6 year old child (20.5 kg bw) and for the UK adult (76 kg bw)
accounted for 1309 g/day and 1971 g/day of sugar beet root, respectively. If we assume that the sugar beet root contains approximately 16 % of sugar, the actual sugar consumption can be estimated to raise 209 g/day for the UK 4-6 year old child and 315 g/day for the UK adult. The recommended maximum sugar intake for an adult and a 4-6 year old child are 50 g/day and 40 g/day of sugar, respectively.

Carbofuran Addendum to the DAR – Residue data April 2009 Belgium
39
In addition, when taking into account the no-residue situation in sugar beet root characterized by an extremely low Limit of Quantification (0.005 mg/kg for each analyte), the soil DT90 values of Carbofuran and 3-OH-carbofuran and assuming that any residue that may be left in the roots is substantially reduced during production of sugar, the outcome of the model can be considered as clearly conservative. -Rotational crops: The input values in the EFSA PRIMo corresponded to the amount of TRR found in the succeeding crops after 30 days (simulating a crop failure). This approach is rather conservative since the residue levels of Carbofuran and 3-OH-carbofuran are lower than the TRR values (see available plant metabolism studies performed with Carbosulfan and Carbofuran) considering the DT50/90 values of Carbofuran and 3-OH-carbofuran and also the metabolisation of Carbofuran into its other carbamate and phenolic metabolites that occurs in soil before planting the succeeding crops. B) Dietary intake risk assessment to Carbofuran and 3-OH carbofuran residues according to UK Model Same input values as for point A. Chronic dietary intake risk assessment
Active substance: Carbofuran ADI: 0,00015 mg/kg bw/day Source: DAR 2009
TOTAL INTAKE based on 97.5th percentile
ADULT INFANT TODDLER 4-6
YEARS 7-10
YEARS 11-14
YEARS 15-18
YEARS VEGETARIAN
ELDERLY (OWN HOME)
ELDERLY (RESIDENTIAL)
mg/kg bw/day 0,00005 0,00014 0,00015 0,00011 0,00010 0,00007 0,00006 0,00005 0,00005 0,00005
% of ADI 32% 93% 101% 75% 65% 46% 42% 37% 33% 32%
STMR P COMMODITY INTAKES
Commodity (mg/kg) (mg/kg bw/day)
Beetroot 0,006 0,00000 L/C 0,00001 0,00000 0,00000 0,00000 0,00000 0,00000 0,00000 0,00000
Carrots 0,006 0,00000 0,00002 0,00001 0,00001 0,00001 0,00001 0,00001 0,00001 0,00001 0,00000
Celeriac 0,006 0,00000 L/C L/C 0,00000 0,00000 L/C L/C L/C L/C L/C
Horseradish 0,006 0,00000 L/C L/C L/C L/C L/C L/C L/C 0,00000 L/C
Jerusalem artichokes 0,006 0,00000 L/C L/C L/C L/C L/C L/C L/C L/C L/C
Parsnips 0,006 0,00000 0,00001 0,00001 0,00000 0,00000 0,00000 0,00000 0,00000 0,00000 0,00000
Radishes 0,006 0,00000 L/C 0,00001 L/C 0,00000 0,00000 0,00000 0,00000 0,00000 0,00000

Carbofuran Addendum to the DAR – Residue data April 2009 Belgium
40
Salsify 0,006 L/C L/C L/C L/C L/C L/C L/C L/C L/C L/C
Swedes 0,006 0,00000 0,00002 0,00001 0,00000 0,00000 0,00000 0,00000 0,00000 0,00000 0,00000
Turnips 0,006 0,00000 L/C 0,00001 0,00001 0,00000 0,00000 0,00000 0,00000 0,00000 0,00000
Cress 0,031 0,00000 L/C 0,00000 0,00000 0,00000 0,00000 0,00000 0,00000 0,00000 0,00000
Lettuce 0,031 0,00002 0,00001 0,00003 0,00002 0,00002 0,00001 0,00001 0,00002 0,00002 0,00001
Spinach 0,031 0,00002 0,00003 0,00005 0,00003 0,00003 0,00002 0,00001 0,00002 0,00002 0,00001
Watercress 0,031 0,00000 L/C L/C 0,00000 0,00000 0,00001 L/C 0,00001 0,00001 L/C
Chicory 0,031 0,00000 L/C L/C L/C L/C L/C L/C 0,00000 L/C L/C
Parsley 0,031 0,00001 L/C 0,00000 L/C 0,00000 0,00000 0,00000 0,00001 0,00001 0,00001
Potatoes 0,006 0,00002 0,00007 0,00006 0,00005 0,00004 0,00003 0,00003 0,00002 0,00002 0,00002
Oats 0,001 0,00000 0,00000 0,00000 0,00000 0,00000 0,00000 0,00000 0,00000 0,00000 0,00000
Barley 0,001 0,00000 L/C 0,00000 0,00000 0,00000 0,00000 0,00000 0,00000 0,00000 0,00000
Buckwheat 0,001 L/C L/C L/C L/C L/C L/C L/C L/C L/C L/C
Maize 0,001 0,00000 0,00000 0,00000 0,00000 0,00000 0,00000 0,00000 0,00000 0,00000 0,00000
Wheat 0,001 0,00000 0,00000 0,00001 0,00001 0,00001 0,00000 0,00000 0,00000 0,00000 0,00000
Rye 0,001 0,00000 0,00000 0,00000 0,00000 0,00000 0,00000 0,00000 0,00000 0,00000 0,00000
Poultry 0,000083 0,00000 0,00000 0,00000 0,00000 0,00000 0,00000 0,00000 0,00000 0,00000 0,00000
Meat fat 0,000083 0,00000 0,00000 0,00000 0,00000 0,00000 0,00000 0,00000 0,00000 0,00000 0,00000
Meat excl. poultry & offal 0,000083 0,00000 0,00000 0,00000 0,00000 0,00000 0,00000 0,00000 0,00000 0,00000 0,00000
All types of kidney 0,0003 0,00000 0,00000 0,00000 0,00000 0,00000 0,00000 0,00000 L/C 0,00000 0,00000
All types of Liver 0,00005 0,00000 0,00000 0,00000 0,00000 0,00000 0,00000 0,00000 L/C 0,00000 0,00000
Eggs 0,000008 0,00000 0,00000 0,00000 0,00000 0,00000 0,00000 0,00000 0,00000 0,00000 0,00000
Milk 0,0003 0,00000 0,00003 0,00002 0,00001 0,00001 0,00000 0,00000 0,00000 0,00000 0,00000
Refined sugar 0,01 0,00002 0,00005 0,00008 0,00005 0,00005 0,00003 0,00003 0,00002 0,00002 0,00002
Carbofuran Addendum to the DAR – Residue data April 2009 Belgium
41
Acute dietary intake risk assessment Acute Intakes (97.5th percentiles)
adult infant toddler 4-6 year old child 7-10 year old child
commodity HR P NESTI %ARfD NESTI %ARfD NESTI %ARfD NESTI %ARfD NESTI %ARfD
Potatoes 0,01 0,00014 96,1 0,00092 615,0 0,00064 425,3 0,00048 320,4 0,00033 220,2
Beetroot 0,01 0,00003 17,5 0,00000 0,0 0,00010 70,0 0,00007 48,8 0,00005 35,7
Carrots 0,01 0,00005 34,7 0,00038 253,6 0,00024 157,2 0,00018 117,9 0,00011 76,5
Celeriac 0,01 0,00007 47,4 0,00000 0,0 0,00001 5,2 0,00001 6,5 0,00001 8,6
Horseradish 0,01 0,00000 1,9 0,00000 0,0 0,00000 0,0 0,00000 0,0 0,00000 0,0
Jerusalem artichoke 0,01 0,00003 16,8 0,00000 0,0 0,00000 0,0 0,00000 0,0 0,00000 0,0
Parsnips 0,01 0,00007 48,0 0,00022 144,5 0,00016 108,9 0,00018 117,3 0,00014 95,0
Radishes 0,01 0,00001 4,2 0,00000 0,0 0,00002 12,5 0,00001 5,1 0,00001 3,6
Salsify 0,01 0,00000 0,0 0,00000 0,0 0,00000 0,0 0,00000 0,0 0,00000 0,0
Swedes 0,01 0,00008 53,0 0,00031 206,9 0,00018 121,8 0,00014 95,6 0,00009 58,1
Turnips 0,01 0,00006 42,2 0,00000 0,0 0,00017 110,8 0,00022 143,7 0,00010 66,9
Cress 0,03 0,00001 3,5 0,00000 0,0 0,00001 6,0 0,00001 6,0 0,00001 3,3
Lettuce 0,03 0,00031 203,9 0,00039 261,3 0,00037 249,4 0,00055 368,0 0,00042 277,9
Spinach 0,03 0,00039 261,2 0,00082 544,0 0,00061 409,8 0,00088 586,2 0,00050 334,4
Watercress 0,03 0,00002 10,9 0,00000 0,0 0,00001 5,7 0,00001 9,5 0,00001 9,6
Chicory 0,03 0,00011 76,1 0,00000 0,0 0,00000 0,0 0,00000 0,0 0,00030 201,3
Parsley 0,03 0,00002 13,5 0,00000 0,0 0,00001 6,4 0,00001 6,0 0,00003 22,6
Oats 0,00 0,00000 0,6 0,00000 2,1 0,00000 2,1 0,00000 1,2 0,00000 1,4
Barley 0,00 0,00000 0,5 0,00000 0,0 0,00000 0,5 0,00000 1,2 0,00001 3,7
Maize 0,00 0,00000 0,3 0,00001 4,5 0,00000 2,5 0,00000 1,1 0,00000 0,5
Wheat 0,00 0,00001 4,0 0,00001 8,6 0,00001 8,8 0,00001 9,6 0,00001 7,3
Rye 0,00 0,00000 0,9 0,00001 4,2 0,00000 0,8 0,00000 1,3 0,00000 1,0
Poultry 0,00 0,00000 0,3 0,00000 0,4 0,00000 0,5 0,00000 0,5 0,00000 0,4
Meat fat 0,00 0,00000 0,0 0,00000 0,1 0,00000 0,1 0,00000 0,1 0,00000 0,1
Meat excl.poultry & offal 0,00 0,00000 0,3 0,00000 0,7 0,00000 0,6 0,00000 0,5 0,00000 0,4
All types of kidney 0,00 0,00000 0,3 0,00000 0,5 0,00000 0,8 0,00000 0,5 0,00000 0,3
All types of liver 0,00 0,00000 0,1 0,00000 0,3 0,00000 0,2 0,00000 0,1 0,00000 0,1
Eggs 0,00 0,00000 0,0 0,00000 0,1 0,00000 0,0 0,00000 0,0 0,00000 0,0

Carbofuran Addendum to the DAR – Residue data April 2009 Belgium
42
Milk 0,00 0,00000 2,6 0,00004 24,8 0,00002 14,7 0,00001 9,3 0,00001 6,0
Sugar Beet 0,01 0,00026 172,9 0,00056 370,7 0,00078 518,3 0,00064 425,7 0,00052 348,8
Refined sugar 0,01 0,00004 25,1 0,00004 25,1 0,00004 25,1 0,00004 25,1 0,00004 25,1
11-14 year old child 15-18 year old child vegetarian Elderly - own home Elderly - residential
commodity HR P NESTI %ARfD NESTI %ARfD NESTI %ARfD NESTI %ARfD NESTI %ARfD
Potatoes 0,01 0,00023 155,8 0,00017 116,3 0,00018 119,4 0,00014 95,0 0,00016 103,9
Beetroot 0,01 0,00004 23,7 0,00003 16,8 0,00003 19,4 0,00003 19,1 0,00002 16,3
Carrots 0,01 0,00008 51,2 0,00006 42,2 0,00006 39,4 0,00005 35,6 0,00006 37,7
Celeriac 0,01 0,00001 4,8 0,00000 2,4 0,00005 34,2 0,00000 0,0 0,00000 0,0
Horseradish 0,01 0,00000 1,6 0,00000 0,5 0,00000 1,8 0,00000 1,8 0,00000 0,6
Jerusalem artichoke 0,01 0,00000 0,0 0,00000 0,0 0,00003 22,7 0,00000 0,0 0,00000 0,0
Parsnips 0,01 0,00011 70,6 0,00006 40,2 0,00008 56,3 0,00008 50,8 0,00005 31,2
Radishes 0,01 0,00000 3,2 0,00000 2,9 0,00001 4,9 0,00001 3,9 0,00000 1,0
Salsify 0,01 0,00000 0,0 0,00000 0,0 0,00006 42,8 0,00000 0,0 0,00000 0,0
Swedes 0,01 0,00011 71,2 0,00008 52,6 0,00007 48,9 0,00006 39,8 0,00005 35,6
Turnips 0,01 0,00011 70,1 0,00006 39,4 0,00004 27,2 0,00007 44,6 0,00005 33,1
Cress 0,03 0,00000 2,8 0,00000 2,7 0,00001 7,8 0,00001 5,0 0,00001 3,4
Lettuce 0,03 0,00026 172,2 0,00025 165,9 0,00034 227,1 0,00022 145,7 0,00012 81,5
Spinach 0,03 0,00048 316,9 0,00025 168,1 0,00056 370,1 0,00033 220,7 0,00022 145,8
Watercress 0,03 0,00001 8,3 0,00001 6,3 0,00003 22,2 0,00002 15,6 0,00000 0,7
Chicory 0,03 0,00000 0,0 0,00043 285,7 0,00007 43,4 0,00000 0,0 0,00000 0,0
Parsley 0,03 0,00001 6,0 0,00000 2,1 0,00004 24,8 0,00001 9,0 0,00001 8,7
Oats 0,00 0,00000 0,6 0,00000 1,0 0,00000 0,8 0,00000 0,5 0,00000 0,4
Barley 0,00 0,00000 0,3 0,00000 0,4 0,00000 0,5 0,00000 0,3 0,00000 0,2
Maize 0,00 0,00000 0,5 0,00000 0,7 0,00000 1,4 0,00000 0,3 0,00000 0,2
Wheat 0,00 0,00001 5,9 0,00001 5,6 0,00001 5,2 0,00000 3,1 0,00000 3,0
Rye 0,00 0,00000 0,5 0,00000 0,5 0,00000 1,1 0,00000 0,6 0,00000 0,2
Poultry 0,00 0,00000 0,3 0,00000 0,3 0,00000 0,6 0,00000 0,3 0,00000 0,1
Meat fat 0,00 0,00000 0,1 0,00000 0,1 0,00000 0,0 0,00000 0,0 0,00000 0,0
Meat excl.poultry & offal 0,00 0,00000 0,3 0,00000 0,3 0,00000 0,1 0,00000 0,2 0,00000 0,2

Carbofuran Addendum to the DAR – Residue data April 2009 Belgium
43
All types of kidney 0,00 0,00000 0,3 0,00000 0,4 0,00000 0,0 0,00000 0,3 0,00000 0,3
All types of liver 0,00 0,00000 0,1 0,00000 0,1 0,00000 0,0 0,00000 0,1 0,00000 0,1
Eggs 0,00 0,00000 0,0 0,00000 0,0 0,00000 0,0 0,00000 0,0 0,00000 0,0
Milk 0,00 0,00001 4,1 0,00001 3,5 0,00000 3,0 0,00000 2,2 0,00000 2,9
Sugar Beet 0,01 0,00039 260,4 0,00036 239,5 0,00021 139,0 0,00014 92,9 0,00019 126,0
Refined sugar 0,01 0,00004 25,1 0,00004 25,1 0,00004 25,1 0,00004 25,1 0,00004 25,1
Conclusion: In the chronic dietary intake risk assessment, the intake of sugar beet root was not considered since it is assumed that only the processed sugar represents the main consumption data. There is a chronic intake concern for the UK toddlers (101 % of the ADI). Exceedances of the ARfD were observed for all the categories of UK consumers when consuming sugar beet roots and root vegetables (except for UK adults) and leafy vegetables grown as rotated crops. There is no acute intake concern for refined sugar.

Carbofuran Volume 3 – Annex B – Toxicology and metabolism May 2009
Belgium
44
ANNEX B
Original version July 2004, revised in november 2008
Carbofuran

Carbofuran Volume 3 – Annex B – Toxicology and metabolism May 2009
Belgium
45
B.6 Toxicology and metabolism
Addendum May 2009
Carbofuran Volume 3 – Annex B – Toxicology and metabolism May 2009
Belgium
46
Introductory note
Following the expert meeting round 14 (PRAPeR 69, 04-08.2009), the proposed AOEL of 0.0003 mg/kg b.w./d
was confirmed.
The level of skin absorption was also discussed, and the meeting agreed to adopt a default 10% rat in-vivo
absorption rate instead of the proposed 6.19% measured in the in-vivo rat study after 24h, based on the
uncertainty of a further absorption beyond this time-point (NL comment).
The rat/human absorption ratio of 2.08 , obtained in the in-vitro rat/human study remained unaltered.
Thus, a final absorption value of 10 2.08 = 4.8%, rounded to 5% was adopted.
As a consequence, the operator exposure was recalculated, based on the revised skin absorption study.
(changed values are highlighted in green). The exposure calculations were only based upon the PHED-model, as
the UK and German models were not considered appropriate for a granular application.

Carbofuran Volume 3 – Annex B – Toxicology and metabolism May 2009
Belgium
47
B.6.15 Exposure data (Annex IIIA 7.2)
B.6.15.1 Estimation of operator exposure (Annex IIIA 7.2.1.1)
Notifier (FMC) proposal:
Furadan 5G is a granular product containing 50-g/kg carbofuran and is to use in field crops of sugar beet and
maize at the time of drilling. The product is applied using a tractor mounted granule applicator by placement in
the open furrow directly behind each drill coulter. The product is applied using a maximum rate of 12 kg
product per hectare, which is equivalent to 600 g active substance per hectare. A maximum work rate of 15
ha/day has been estimated for sugar beet and maize. The vapor pressure of technical carbofuran is 3.55x10⁻⁵
Pa
at 20°C. Furadan 5 G is formulated to ensure that the end product is virtually dust-free.
Notifier proposed to apply a skin absorption value of 0.11%, and to propose the original AOEL = 0.001 mg/kg
b.w./d.
RMS proposal:
A new estimation of exposure to granular formulation was performed using 10 ha/day as work rate according to
the PHED model, with or without additional protection during loading and without additional protection during
application.
As explained under B.6.10 and B.6.12, the AOEL was revised downwards to 0.0003 mg/kg b.w. i.o. 0.001
mg/kg b.w./d. In addition, the dermal absorption was 5% i.o. the notifier’s proposal of 0.11%.
The POEM model for granules was devised by PSD after examining the American pesticides Handlers Exposure
Database (PHED). The PHED is a compilation of actual field monitoring data on dermal and inhalation
exposure drawn from field studies reflecting actual occupational situations. PSD looked at all of the available
data in the PHED and selected data sets to determine appropriate surrogate values for the estimation of operator
exposure resulting from loading and application of the granules.
The appropriate data are selected in terms of product type, method of application, and central tendency values
are normally calculated for dermal and inhalation exposure. However, the PHED exposure calculation provides
no information on the total levels of exposure experienced by the individuals involved in the monitoring studies.
Dermal and inhalation data from a large number of field studies are incorporated in this database and the
appropriate data have been selected to estimate exposure for the relevant usage scenario. The 75th
percentile
exposure values from these data subsets have been used as conservative estimates of likely exposure from the
proposed uses of granular formulations assuming that gloves are worn for all activities. Exposure at the 75th
and
95th
percentiles will therefore assume a relatively dusty formulation. In the case of Furadan 5G, which is
virtually dust free, the exposure estimates are likely to be a worst case.
Applications parameters:
Table B.6.15.1-1: exposure to granular formulations: vehicle-mounted equipment
Variables:
Work rate 10 ha/day
Application rate 0.6 kg a.s. /ha
Kg as. Loaded/day 6 kg
Dermal absorption 5%
Inhalation absorption 100%
Systemic AOEL as proposed by RMS 0.0003 mg/kg bw/d
Remark

Carbofuran Volume 3 – Annex B – Toxicology and metabolism May 2009
Belgium
48
In the PHED studies gloves and normal workwear were worn during loading .and application operations.
Thus, this level of PPE is assumed in the PHED estimates.
(i) Expected operator exposure according to the PHED model:
In table B.6.15.1-2 (Annex A, estimates I, II and III), the estimated exposure of the operator handling and
spreading Furadan 5G granules was tabulated. The values were calculated in the absence and in the presence of
a half-mask with P2 filter possessing an assigned protection factor of 10 . The RPE was assumed during the
tasks of loading and spreading of the product.
Table B.6.15.1-2: Estimated operator exposure for the use of Furadan 5G according to the PHED model
Application method Dermal exposure
(5 % dermal absorption)
Inhalation exposure
(100% inhalation absorption)
Total
exposure
Load Apply Total Load Apply Total
without RPE 0.005249 0.001538 0.006787 0.124861 0.005996 0.130857 0,137644
with RPE § 0.005249 0.001538 0.006787 0.124861 0.005996 0.130857 0,019873
The calculations were based on 75th percentile surrogate values; values expressed in mg/person/day; §: a half mask with a respiratory filter (EN 149, FFP2) conferring a protection of 90% is assumed with this RPE.
Predicted exposure (75th
percentile values) as a proportion of the AOEL
A comparison of the systemic AOEL with the above estimates of operator exposure is presented in table
B.6.15.1-3.
-The exposure of the operator (assuming a 70 kg body weight), wearing gloves both during the loading and the
spreading, but in the absence of RPE amounted to 0.0001966 mg/kg b.w./d, corresponding with about 6.6 the
AOEL.
-This exposure was reduced to about 0.0002839 mg/kg b.w./d, in the presence of RPE with 90% protection
factor, equivalent to about 95% of the AOEL. It is thus considered that this exposure was safe under conditions
of good agricultural practice, and the wearing of both PPE and RPE.
Table B.6.15.1-3: Exposure as a proportion of AOEL
Application method Total systemic exposure % of AOEL
without RPE with RPE without RPE with RPE
Vehicle mounted
equipment:
0.0001966 0.0002839 655% 95%
Values expressed in mg/kg b.w./d, assuming an operator weight of 70 kg; compared with AOEL = 0.0003 mg/kg bw/d
Assessment and conclusion:
The estimated exposure of the operator without RPE protection is about 7 the systemic AOEL according to the
PHED model. Thus, additional protective measures are needed.
Taking into account the toxicological properties of the plant protection product Furadan 5G, reflected by the
corresponding classification and labeling, personal protective equipment must be used.
Using adequate repiratory protection reduces the operator exposure to 95% of AOEL according to the PHED.
In conclusion, the operator exposure assessment shows that exposure to Furadan 5G is acceptable
according to the PHED model, when both gloves and respiratory protection is used during the loading

Carbofuran Volume 3 – Annex B – Toxicology and metabolism May 2009
Belgium
49
and the spreading of the granules. Moreover, it is worthwile to stress that the application should be
restricted to a granular application only.
B.6.15.2 Measurement of operator exposure (Annex IIIA 7.2.1.2)
No information available. Based on exposure modeling, these should not be required.
B.6.15.3 Estimation of bystander exposure (Annex IIIA 7.2.2)
According to the explanation of the applicant, carbofuran is not volatile, the granular formulation is applied by
ground-directed equipment that is nearly dust free, the level of bystander exposure to vapor or airborne particles
at the time of application is likely to be negligible. The movement of carbofuran from the point of application is
likely to be further mitigated by the sub-surface application of these products. Dermal exposure is therefore not
expected. The use of Furadan 5G should not pose a risk to bystanders.
B.6.15.4 Estimation of worker exposure (Annex IIIA 7.2.3.1)
Furadan 5G is incorporated by mechanical means into the soil when sowing. Therefore, worker exposure to
carbofuran is unlikely to occur.
B.6.15.5 Measurement of worker exposure (Annex IIIA 7.2.3.2)
Not required.
Carbofuran Volume 3 – Annex B – Toxicology and metabolism May 2009
Belgium
50
ANNEX B
FURADAN 5G
Appendix A: Estimations of the exposure

Carbofuran Volume 3 – Annex B – Toxicology and metabolism May 2009
Belgium
51

Carbofuran Volume 3 – Annex B – Toxicology and metabolism May 2009
Belgium
52
PHED MODEL:

Carbofuran Volume 3 – Annex B – Toxicology and metabolism May 2009
Belgium
53
-ESTIMATE I: FURADAN 5G: GLOVES WHEN HANDLING THE
PRODUCT AND DURING APPLICATION

Carbofuran Volume 3 – Annex B – Toxicology and metabolism May 2009
Belgium
54
-ESTIMATE II: FURADAN 5G: GLOVES AND RPE (EN 149, FFP2) WHEN
HANDLING THE PRODUCT DURING LOADING BUT NOT DURING
APPLICATION
-ESTIMATE III: Furadan 5G: Gloves and RPE (EN 149, FFP2) when handling the product during loading and
during application.

Carbofuran Addendum to the DAR – Residue data April 2009 Belgium
55

Carbofuran Addendum to the DAR – Residue data April 2009 Belgium
56
ESTIMATE I: FURADAN 5G: GLOVES WHEN HANDLING THE PRODUCT AND DURING APPLICATION
EXPOSURE TO GRANULAR FORMULATIONS: VEHICLE-MOUNTED EQUIPMENT
VARIABLES
Work rate 10 ha/day RPE
Application rate 0,6 kg a.s./ha Loading no
Dermal absorption 5 % Application no
Inhalation absorption 100 % 1
Systemic AOEL 0,0003 mg/kg bw/day 1
75th PERCENTILES 95th PERCENTILES
LOADER
Dermal exposure
PHED surrogate - hands ADE 0,001414707 mg/kg a.s. 0,006876188 mg/kg a.s.
PHED surrogate - body ADE 0,016083379 mg/kg a.s. 0,038017233 mg/kg a.s.
kg a.s. loaded 6 kg a.s./day 6 kg a.s./day
dermal exposure 0,104988516 mg a.s./day 0,269360526 mg a.s./day
absorbed dose 0,005249426 5% 0,013468026 5%
7,49918E-05 mg a.s./kg bw/d 0,0001924 mg a.s./kg bw/d
Inhalation exposure
PHED surrogate 0,020810185 mg/kg a.s. 0,045293628 mg/kg a.s.
kg a.s. loaded 6 kg a.s./day 6 kg a.s./day
inhalation exposure 0,12486111 mg a.s./day 0,271761768 mg a.s./day
absorbed dose 0,12486111 100% 0,271761768 100%
0,00178373 mg a.s./kg bw/d 0,003882311 mg a.s./kg bw/d
APPLICATOR

Carbofuran Addendum to the DAR – Residue data April 2009 Belgium
57
Dermal exposure
PHED surrogate - hands ADE 0,000346426 mg/kg a.s. 0,000959819 mg/kg a.s.
PHED surrogate - body ADE 0,004781305 mg/kg a.s. 0,015843348 mg/kg a.s.
kg a.s. applied 6 kg a.s./day 6 kg a.s./day
dermal exposure 0,030766386 mg a.s./day 0,100819002 mg a.s./day
absorbed dose 0,001538319 5% 0,00504095 5%
2,1976E-05 mg a.s./kg bw/d 7,20136E-05 mg a.s./kg bw/d
Inhalation exposure
PHED surrogate 0,000999325 mg/kg a.s. 0,004377544 mg/kg a.s.
kg a.s. applied 6 kg a.s./day 6 kg a.s./day
inhalation exposure 0,00599595 mg a.s./day 0,026265264 mg a.s./day
absorbed dose 0,00599595 100% 0,026265264 100%
8,56564E-05 mg a.s./kg bw/d 0,000375218 mg a.s./kg bw/d
TOTAL SYSTEMIC 0,00196635 mg/kg bw/d 0,00452194 mg/kg bw/d
EXPOSURE AS % OF AOEL 655,45 % 1507,31 %
PPE: In the PHED studies gloves and normal workwear were worn during loading
and application operations. This level of PPE is assumed in the above estimate.

Carbofuran Addendum to the DAR – Residue data April 2009 Belgium
58

Carbofuran Addendum to the DAR – Residue data April 2009 Belgium
59

Carbofuran Addendum to the DAR – Residue data April 2009 Belgium
60
ESTIMATE II: FURADAN 5G: GLOVES AND RPE (EN 149, FFP2) WHEN HANDLING THE PRODUCT
DURING LOADING BUT NOT DURING APPLICATION.
EXPOSURE TO GRANULAR FORMULATIONS: VEHICLE-MOUNTED EQUIPMENT
VARIABLES
Work rate 10 ha/day RPE
Application rate 0,6 kg a.s./ha Loading yes
Dermal absorption 5 % Application no
Inhalation absorption 100 % 0,1
Systemic AOEL 0,0003 mg/kg bw/day 1
75th PERCENTILES 95th PERCENTILES
LOADER
Dermal exposure
PHED surrogate - hands ADE 0,001414707 mg/kg a.s. 0,006876188 mg/kg a.s.
PHED surrogate - body ADE 0,016083379 mg/kg a.s. 0,038017233 mg/kg a.s.
kg a.s. loaded 6 kg a.s./day 6 kg a.s./day
dermal exposure 0,104988516 mg a.s./day 0,269360526 mg a.s./day
absorbed dose 0,005249426 5% 0,013468026 5%
7,49918E-05 mg a.s./kg bw/d 0,0001924 mg a.s./kg bw/d
Inhalation exposure
PHED surrogate 0,020810185 mg/kg a.s. 0,045293628 mg/kg a.s.
kg a.s. loaded 6 kg a.s./day 6 kg a.s./day
inhalation exposure 0,012486111 mg a.s./day 0,027176177 mg a.s./day
absorbed dose 0,012486111 100% 0,027176177 100%
0,000178373 mg a.s./kg bw/d 0,000388231 mg a.s./kg bw/d
APPLICATOR

Carbofuran Addendum to the DAR – Residue data April 2009 Belgium
61
Dermal exposure
PHED surrogate - hands ADE 0,000346426 mg/kg a.s. 0,000959819 mg/kg a.s.
PHED surrogate - body ADE 0,004781305 mg/kg a.s. 0,015843348 mg/kg a.s.
kg a.s. applied 6 kg a.s./day 6 kg a.s./day
dermal exposure 0,030766386 mg a.s./day 0,100819002 mg a.s./day
absorbed dose 0,001538319 5% 0,00504095 5%
2,1976E-05 mg a.s./kg bw/d 7,20136E-05 mg a.s./kg bw/d
Inhalation exposure
PHED surrogate 0,000999325 mg/kg a.s. 0,004377544 mg/kg a.s.
kg a.s. applied 6 kg a.s./day 6 kg a.s./day
inhalation exposure 0,00599595 mg a.s./day 0,026265264 mg a.s./day
absorbed dose 0,00599595 100% 0,026265264 100%
8,56564E-05 mg a.s./kg bw/d 0,000375218 mg a.s./kg bw/d
TOTAL SYSTEMIC 0,00036100 mg/kg bw/d 0,00102786 mg/kg bw/d
EXPOSURE AS % OF AOEL 120,33 % 342,62 %
PPE: In the PHED studies gloves and normal workwear were worn during loading
and application operations. This level of PPE is assumed in the above estimate.

Carbofuran Addendum to the DAR – Residue data April 2009 Belgium
62

Carbofuran Addendum to the DAR – Residue data April 2009 Belgium
63

Carbofuran Addendum to the DAR – Residue data April 2009 Belgium
64
ESTIMATE III: FURADAN 5G: GLOVES AND RPE (EN 149, FFP2) WHEN HANDLING THE PRODUCT
DURING LOADING AND DURING APPLICATION.
EXPOSURE TO GRANULAR FORMULATIONS: VEHICLE-MOUNTED EQUIPMENT
VARIABLES
Work rate 10 ha/day RPE
Application rate 0,6 kg a.s./ha Loading yes
Dermal absorption 5 % Application yes
Inhalation absorption 100 % 0,1
Systemic AOEL 0,0003 mg/kg bw/day 0,1
75th PERCENTILES 95th PERCENTILES
LOADER
Dermal exposure
PHED surrogate - hands ADE 0,001414707 mg/kg a.s. 0,006876188 mg/kg a.s.
PHED surrogate - body ADE 0,016083379 mg/kg a.s. 0,038017233 mg/kg a.s.
kg a.s. loaded 6 kg a.s./day 6 kg a.s./day
dermal exposure 0,104988516 mg a.s./day 0,269360526 mg a.s./day
absorbed dose 0,005249426 5% 0,013468026 5%
7,49918E-05 mg a.s./kg bw/d 0,0001924 mg a.s./kg bw/d
Inhalation exposure
PHED surrogate 0,020810185 mg/kg a.s. 0,045293628 mg/kg a.s.
kg a.s. loaded 6 kg a.s./day 6 kg a.s./day
inhalation exposure 0,012486111 mg a.s./day 0,027176177 mg a.s./day
absorbed dose 0,012486111 100% 0,027176177 100%
0,000178373 mg a.s./kg bw/d 0,000388231 mg a.s./kg bw/d
APPLICATOR

Carbofuran Addendum to the DAR – Residue data April 2009 Belgium
65
Dermal exposure
PHED surrogate - hands ADE 0,000346426 mg/kg a.s. 0,000959819 mg/kg a.s.
PHED surrogate - body ADE 0,004781305 mg/kg a.s. 0,015843348 mg/kg a.s.
kg a.s. applied 6 kg a.s./day 6 kg a.s./day
dermal exposure 0,030766386 mg a.s./day 0,100819002 mg a.s./day
absorbed dose 0,001538319 5% 0,00504095 5%
2,1976E-05 mg a.s./kg bw/d 7,20136E-05 mg a.s./kg bw/d
Inhalation exposure
PHED surrogate 0,000999325 mg/kg a.s. 0,004377544 mg/kg a.s.
kg a.s. applied 6 kg a.s./day 6 kg a.s./day
inhalation exposure 0,000599595 mg a.s./day 0,002626526 mg a.s./day
absorbed dose 0,000599595 100% 0,002626526 100%
8,56564E-06 mg a.s./kg bw/d 3,75218E-05 mg a.s./kg bw/d
TOTAL SYSTEMIC 0,00028391 mg/kg bw/d 0,00069017 mg/kg bw/d
EXPOSURE AS % OF AOEL 94,64 % 230,06 %
PPE: In the PHED studies gloves and normal workwear were worn during loading
and application operations. This level of PPE is assumed in the above estimate.

Carbofuran Addendum to the DAR – Residue data April 2009 Belgium
66
Appendix B: PHED model
GRANULE RECORDS FROM PHED AND DERIVED SURROGATE EXPOSURE VALUES

Carbofuran Addendum to the DAR – Residue data April 2009 Belgium
67
TRACTOR-MOUNTED/DRAWN EQUIPMENT: LOADER RECORDS
Record
number
Data
points
kg a.s. handled/applied % a.s. in
form’n
PPE Engineering
control
Acceptability
Min. Max. Mean
0422 2 90.72 90.72 90.72 15 gloves none yes
0425 3 10.21 12.25 10.89 10 gloves none yes
0427 1 2.84 2.84 2.84 10 gloves none yes
0448 8 182.35 444.53 287.70 10 gloves none yes
1003 22 314.69 935.55 744.95 15 gloves none yes
1004 15 3.13 5.44 4.42 5 gloves and
coveralls
none yes
1011 30 9.07 26.04 14.07 5 gloves none yes
1027 15 0.66 1.20 0.87 undisclos
ed
gloves none no
75th
percentile actual dermal exposure (less hands): 0.016 mg/kg a.s. handled/person/day
95th
percentile actual dermal exposure (less hands): 0.038 mg/kg a.s. handled/person/day
75th
percentile actual hand exposure: 0.0014 mg/kg a.s. handled/person/day
95th
percentile actual hand exposure: 0.0069 mg/kg a.s. handled/person/day
75th
percentile inhalation exposure: 0.021 mg/kg a.s. handled/person/day
95th
percentile inhalation exposure: 0.045 mg/kg a.s. handled/person/day

Carbofuran Addendum to the DAR – Residue data April 2009 Belgium
68

Carbofuran Addendum to the DAR – Residue data April 2009 Belgium
69
TRACTOR-MOUNTED/DRAWN EQUIPMENT: APPLICATOR RECORDS
Record
number
Data
points
Kg a.s. handled/applied % a.s. in
form’n
PPE Engineering
control
Acceptability
Min. Max. Mean
0422 2 10.61 12.25 11.43 15 gloves cab (closed
windows)
yes
0425 3 10.21 12.25 10.89 10 gloves cab (closed
windows)
yes
0427 1 2.84 2.84 2.84 10 gloves no cab yes
1004 15 3.13 5.44 4.42 5 gloves and
coveralls
(12)
gloves (3)
filtered cab yes
1011 29 8.39 22.68 12.90 5 gloves filtered cab (25)
no cab (4)
yes
75th
percentile actual dermal exposure (less hands): 0.0048 mg/kg a.s. handled/person/day
95th
percentile actual dermal exposure (less hands): 0.016 mg/kg a.s. handled/person/day
75th
percentile actual hand exposure: 0.00035 mg/kg a.s. handled/person/day
95th
percentile actual hand exposure: 0.00096 mg/kg a.s. handled/person/day
75th
percentile inhalation exposure: 0.0010 mg/kg a.s. handled/person/day
95th
percentile inhalation exposure: 0.0044 mg/kg a.s. handled/person/day

Carbofuran Addendum to the DAR – Residue data April 2009 Belgium
70
ACTUAL DERMAL (LESS HANDS): LOADER (Tractor Mounted Machinery)
0
1
2
3
4
5
6
7
8
9
0.0001 0.001 0.01 0.1 1 10
mg/kg a.i./person/day
RE
CO
RD
ID
Record ID 1 2 3 4 5 6 7 8
Study Ref. 0422 0425 0427 0448 1003 1004 1011 1027

Carbofuran Addendum to the DAR – Residue data April 2009 Belgium
71
ACTUAL HANDS: LOADER (Tractor Mounted Machinery)
0
1
2
3
4
5
6
7
8
9
0.00001 0.0001 0.001 0.01 0.1 1
mg/kg a.i./person/day
RE
CO
RD
ID
Record ID 1 2 3 4 5 6 7 8
Study Ref. 0422 0425 0427 0448 1003 1004 1011 1027

Carbofuran Addendum to the DAR – Residue data April 2009 Belgium
72
INHALATION: LOADER (Tractor Mounted Machinery)
0
1
2
3
4
5
6
7
8
9
0.00001 0.0001 0.001 0.01 0.1 1
mg/kg a.i.
RE
CO
RD
ID
Record ID 1 2 3 4 5 6 7 8
Study Ref. 0422 0425 0427 0448 1003 1004 1011 1027

Carbofuran Addendum to the DAR – Residue data April 2009 Belgium
73
ACTUAL DERMAL (LESS HANDS): APPLICATOR (Tractor Mounted Machinery)
0
1
2
3
4
5
6
0.0001 0.001 0.01 0.1
mg/kg a.i./person/day
RE
CO
RD
ID
Record ID 1 2 3 4 5
Study Ref. 0422 0425 0427 1004 1011

Carbofuran Addendum to the DAR – Residue data April 2009 Belgium
74
ACTUAL HANDS: APPLICATOR (Tractor Mounted Machinery)
0
1
2
3
4
5
6
0.00001 0.0001 0.001 0.01
mg/kg a.i./person/day
RE
CO
RD
ID
Record ID 1 2 3 4 5
Study Ref. 0422 0425 0427 1004 1011
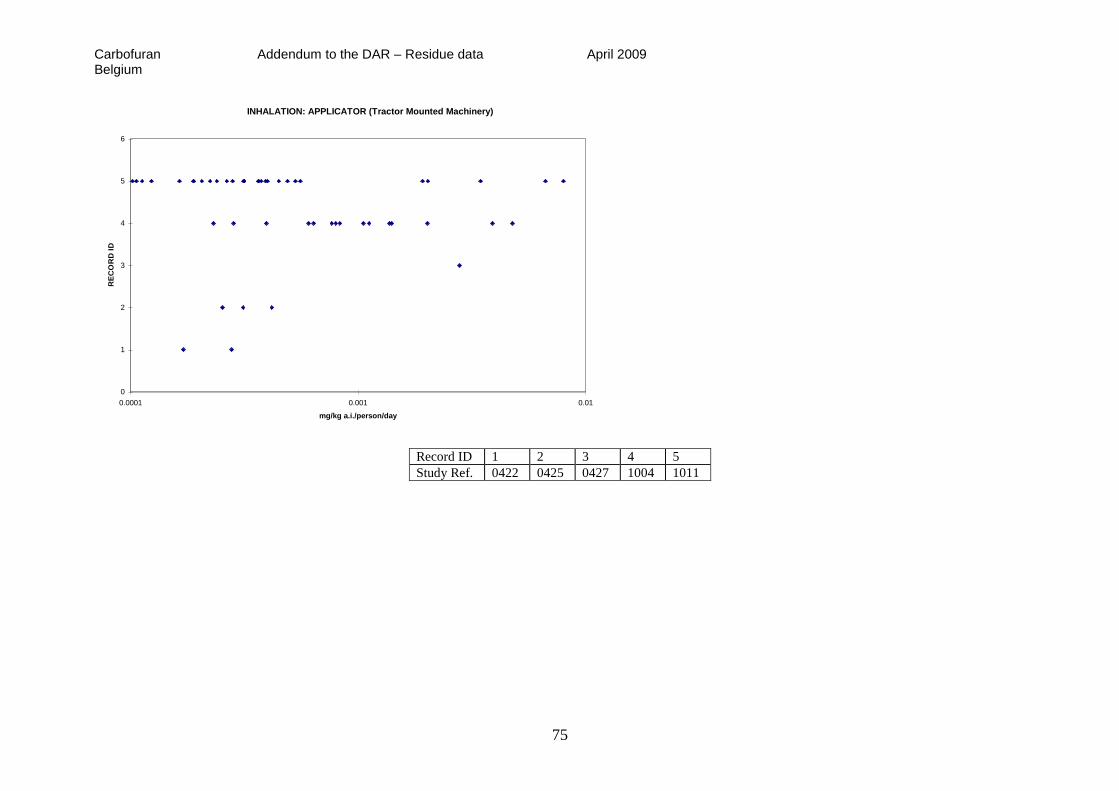
Carbofuran Addendum to the DAR – Residue data April 2009 Belgium
75
INHALATION: APPLICATOR (Tractor Mounted Machinery)
0
1
2
3
4
5
6
0.0001 0.001 0.01
mg/kg a.i./person/day
RE
CO
RD
ID
Record ID 1 2 3 4 5
Study Ref. 0422 0425 0427 1004 1011

Carbofuran Volume 3 – Annex B – Ecotoxicology April 2009
Belgium update May 2009
___________________________________________________________________________
_______________
76
ANNEX B
Addendum April 2009
Update May 2009 (after PRAPeR 68)
Carbofuran
B.9 Ecotoxicology

Carbofuran Volume 3 – Annex B – Ecotoxicology April 2009
Belgium
___________________________________________________________________________
_______________
77
B.9.1 Effects on birds (Annex IIA 8.1; Annex IIIA 10.1)
Comments 5(19) and 5(28) in the reporting table:
The risk for birds drinking water possibly contaminated with carbofuran is assessed by the puddle scenario.
PECpuddle = )(1000
10/
sxKocw
AR
with :
AR = application rate in g/ha; divisor of 10 to achieve rate in mg/m²
w = 0.02 (pore water term: volume)
s = 0.0015 (soil term: volume, density, organic carbon content)
The application rate for carbofuran is 0.600 kg a.s./ha. The Kfoc value for carbofuran is 23.3 mL/g.
PECpuddle = )0015.03.2302.0(1000
10/600
x = 1.09 mg a.s./L
A small granivorous bird (passerines) has a drinking water rate DRW equivalent to 0.46 L/kg b.w./day.
The estimated theoretical exposure to carbofuran via drinking water is calculated as :
ETE = DRW x PECpuddle = 0.46 L/kg b.w./day x 1.09 mg a.s./L = 0.50 mg a.s./kg b.w./day
The acute risk is calculated as :
TER = LD50 / ETE = 0.71 / 0.50 = 1.41
The acute TER is below the trigger value of 10.
However, the RMS is of the opinion that this calculation is unrealistic worst-case (birds consuming their entire
drinking water demand on possibly contaminated puddles).

Carbofuran Volume 3 – Annex B – Ecotoxicology April 2009
Belgium
___________________________________________________________________________
_______________
78
B.9.2 Effects on aquatic organisms (fish, aquatic invertebrates, algae) (Annex IIA 8.2; Annex IIIA 10.2)
Comment 5(52) in the reporting table:
B.9.2.15 Summary of effects to aquatic organisms (Annex IIA 8.2; Annex IIIA 10.2)
Table B. 9.2.15-1 : Summary of effects of carbofuran to aquatic organisms (FMC)
Test species Test substance Test system Endpoints References
Chironomus
riparius
carbofuran 28 d static NOEC = 0.0032 mg a.s./L (mean measured)
Putt E., 2008
Table B. 9.2.15-2 : Summary of effects of metabolites of carbofuran to aquatic organisms (Dianica)
Test species Test substance Test system Endpoints References
Chironomus
riparius
7-phenol 25 d static NOEC = 5.34 mg a.s./L (mean measured)
Memmert U., 2002
B.9.2.16 Exposure and risk assessment for aquatic organisms (Annex IIIA 10.2)
B.9.2.16.1 Risk assessment for the active substance
Table B.9.2.16.1-1 : Toxicity Exposure Ratio’s (TER’s) for aquatic organisms exposed to carbofuran in surface
water for the intended use in sugar beet (1 x 0.600 kg a.s./ha) based on FOCUS Step 1 calculations
Test
substance
Organism Toxicity
end
point
(mg/L)
Time
scale
PECsw
(µg/L)
PECtwa
(µg/L)
TER Annex
VI
Trigger
carbofuran Chironomus
riparius
0.0032 chronic 193.97 - 0.02 10
Table B.9.2.16.1-2 : Toxicity Exposure Ratio’s (TER’s) for aquatic organisms exposed to carbofuran in surface
water for the intended use in sugar beet (1 x 0.600 kg a.s./ha) based on FOCUS Step 2 calculations
Test
substance
N/S Organism Toxicity
end
point
(mg/L)
Time
scale
PECsw
(µg/L)
TER Annex
VI
Trigger
cabofuran N Chironomus riparius 0.0032 chonic 31.26 0.10 10
S 62.51 0.05 10

Carbofuran Volume 3 – Annex B – Ecotoxicology April 2009
Belgium
___________________________________________________________________________
_______________
79
B.9.2.16.2 Risk assessment for the metabolites
Table B.9.2.16.2-4 : Toxicity Exposure Ratio’s (TER’s) for aquatic organisms exposed to 7-phenol in surface
water for the intended use in sugar beet (1 x 0.600 kg a.s./ha) based on FOCUS Step 1 calculations
Test
substance
Organism Toxicity
end
point
(mg/L)
Time
scale
PECsw
(µg/L)
PECtwa
(µg/L)
TER Annex
VI
Trigger
7-phenol Chironomus
riparius
5.34 chronic 64.43 - 83 10
In conclusion, the risk of carbofuran and the metabolite 7-phenol to sediment dwelling organisms is acceptable
based on FOCUS step 3, respectively FOCUS step 1 PECsw calculations.
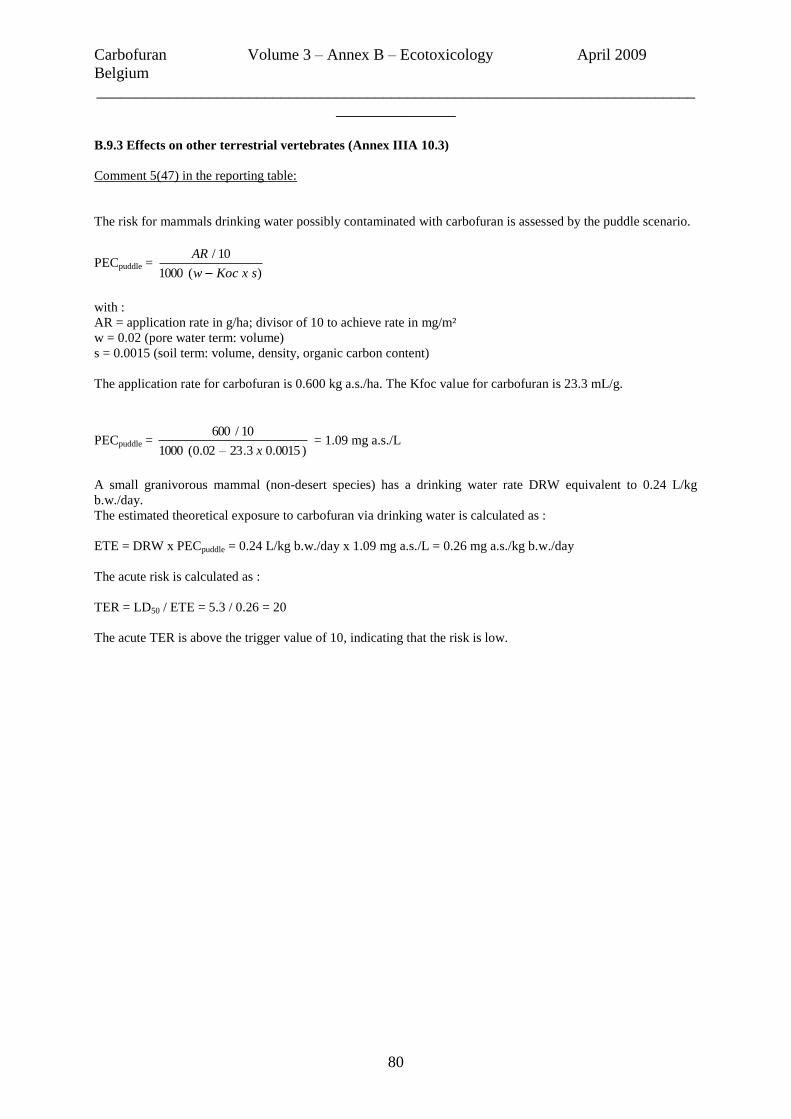
Carbofuran Volume 3 – Annex B – Ecotoxicology April 2009
Belgium
___________________________________________________________________________
_______________
80
B.9.3 Effects on other terrestrial vertebrates (Annex IIIA 10.3)
Comment 5(47) in the reporting table:
The risk for mammals drinking water possibly contaminated with carbofuran is assessed by the puddle scenario.
PECpuddle = )(1000
10/
sxKocw
AR
with :
AR = application rate in g/ha; divisor of 10 to achieve rate in mg/m²
w = 0.02 (pore water term: volume)
s = 0.0015 (soil term: volume, density, organic carbon content)
The application rate for carbofuran is 0.600 kg a.s./ha. The Kfoc value for carbofuran is 23.3 mL/g.
PECpuddle = )0015.03.2302.0(1000
10/600
x = 1.09 mg a.s./L
A small granivorous mammal (non-desert species) has a drinking water rate DRW equivalent to 0.24 L/kg
b.w./day.
The estimated theoretical exposure to carbofuran via drinking water is calculated as :
ETE = DRW x PECpuddle = 0.24 L/kg b.w./day x 1.09 mg a.s./L = 0.26 mg a.s./kg b.w./day
The acute risk is calculated as :
TER = LD50 / ETE = 5.3 / 0.26 = 20
The acute TER is above the trigger value of 10, indicating that the risk is low.

Carbofuran Volume 3 – Annex B – Ecotoxicology April 2009
Belgium
___________________________________________________________________________
_______________
81
In the discussion table of PRAPeR 68, open point 5.12, a concern was raised on the determination of the relevant
long-term endpoint for mammals.
In agreement with the mam tox experts, the RMS has following opinion on the ecotoxicologically relevant
NOAEL :
“For human health risk assessment, all reference doses were established on the toxicologically relevant decrease
of AChE levels in the brain. This was a conservative approach, as at the LOAEL for a 20% AChE decrease,
overt cholinergic clinical signs were not observed. In the recent acute neurotoxicity studies in rat, it appeared that after gavage administration of Carbofuran,
tremors appeared at 0.3 mg/kg b.w. in PND11 pups (Tyl, 2005a, c; Hoberman, 2007a). In adults, the clinical
signs appeared slightly later (at 12h post-treatment Tyl, 2005c) at 0.3 mg/kg b.w. and above. 53% decreases of
motor activity were observed at 0.3-0.5 mg/kg b.w., and more severe cholinergic signs increasing in a dose-
dependent way appeared at 0.75 mg/kg b.w. and above (Mc Daniel et al, 2007). Further support for this dose was found in the short-term studies; in a 1 year dog capsule feeding study (Spicer,
1990) clinical signs appeared at 1 mg/kg b.w./d, and a NOAEL at 0.1 mg/kg b.w./d. In a 1 year dietary dog
study, testicular degeneration was observed at 0.5 mg/kg b.w./d, with a NOAEL of 0.25 mg/kg b.w./d. Finally, in
a rat developmental study (gavage), clinical signs were observed at 0.3 mg/kg b.w./d, with a NOAEL of 0.1
mg/kg b.w./d (Roa, 1978). In a more recent 60d gavage study, tremor, hypoactivity and salivation occurred at 0.8
mg/kg b.w./d, with a NOAEL of 0.2 mg/kg b.w./d. Finally, in the rabbit developmental studies, increased mortality and clinical signs were obvious at 2 mg/kg
b.w./d, with a NOAEL of 0.5-0.6 mg/kg b.w./d. Although these effects were not always replicated in similar
studies, the findings were not ignored. The most relevant reprotoxicity NOAEL was established at 1.2 mg/kg b.w./d, for severe effects (decreased pup
survival) at 2.9 mg/kg b.w./d (Goldenthal, 1979). Generally speaking, the appearance of clinical signs are considered relevant in the risk assessment of mammals
from the ecotoxicological point of view. Especially for NMC’s, it is felt that the impact of these signs should not
be neglected, also knowing that pups are more sensitive and the onset may be earlier, when compared with
adults. A relevant NOAEL of 0.1 mg/kg b.w. may be a point of departure, knowing that the effects increase in
severity in the dose-range of 0.3-1 mg/kg b.w.. In the pragmatic approach of taking an ‘average’ NOAEL of 0.71 mg/kg b.w., it would appear that the margin of
safety (MOS) to the doses where overt clinical signs (and mortality in rabbits) appear, is quite small. As a conclusion, the conservative adoption of a NOAEL of 0.1 mg/kg b.w., based upon clinical signs and
neurotoxicity, at doses showing significant drops of 30-60% of brain AChE activity, may be defendable.
This leaves a MOS of about 30x to the doses where severe pup toxicity was observed in a multigeneration
study.”

Carbofuran Volume 3 – Annex B – Ecotoxicology April 2009
Belgium
___________________________________________________________________________
_______________
82
During the Peer Review of Carbofuran the notifier submitted following statement in April 2009.
Updated and Comparative Risk Assessment of the carbofuran use on sugar beet at 60 g ai/ha versus 600 g
ai/ha. (2009).

Carbofuran Volume 3 – Annex B – Ecotoxicology April 2009
Belgium
___________________________________________________________________________
_______________
83
INTRODUCTION :
FMC re-applied for Annex I inclusion of the active ingredient carbofuran under the rules laid down in Regulation 33/2008/EC – Chapter 3 (accelerated procedure). Article 15(1b) of this Regulation states that:
“The supported uses are the same as those that were the subject of the non-inclusion Decision. They may only be changed insofar as this is necessary, in the light of the reasons which gave rise to the non-inclusion Decision, to permit inclusion of that substance in Annex I to Directive 91/414/EEC”.
Whilst we still support the use of carbofuran on sugar beet at 600 g ai/ha
1 – and welcome the efforts to evaluate
the risk assessment at this dose rate - we also appreciate that interpretation of endpoints and acceptability of
refinement route may differ from the notifier to the evaluator’s view. Therefore, we introduced additional risk
assessments at lower dose rates, in particular at 60 g ai/ha, in order to increase the chances to identify a safe use
scenario.
The RA conducted by the RMS shows that while the risk to granular intake at 600 g ai/ha is acceptable
according to the EPPO scheme, the risk to secondary poisoning via ingestion of treated seedlings, earthworms
and/or arthropods needs further refinement. Furthermore, the evaluation table highlights that field study
conducted on non target arthropods and soil macro-organisms may only cover use of carbofuran up to 375 g
ai/ha. This suggests that a lower application rate should be considered for the risk assessments, as wisely
foreseen by Article 15b of the Regulation.
Should the EC decide that registration of carbofuran is possible only with limitation on its maximum applied
dose rate, this issue would be dealt by FMC at national level. Indeed, we are confident that certain technologies
are efficient at dose rate equal or lower to 60 g carbofuran/ha.
The aim of the present document is to compare the critical outcome of the risk assessment for application of 60 g carbofuran/ha versus 600 g carbofuran/ha. It will shortly investigate Operator exposure, consumer exposure, PEC calculation, Risk to non target organisms and eventually focus on the risk to birds and mammals via secondary poisoning.
1 At planting – in furrow – granule buried at 7 cm from the surface.

Carbofuran Volume 3 – Annex B – Ecotoxicology April 2009
Belgium
___________________________________________________________________________
_______________
84
Risk to birds and mammals :
Granule intake
The RA conducted by the RMS shows that the risk to granular intake at 600 g ai/ha is acceptable according to
the EPPO scheme. A similar conclusion can be drawn from the Probabilistic Risk assessment submitted by FMC
(Bastiansen F. and Wang M., 2008). Reducing the dose rate to 60 g ai/ha can only further increase the
confidence that the risk to birds via granule intake is acceptable.
Secondary poisoning risk assessment for birds and mammals
Residue of carbofuran in seedlings
Several residue trials and metabolism studies are evaluated in the carbofuran DAR in order to investigate the residue in seedling. The most valuable information comes from the decline curve residue trails (Waalkens and Baltussen, 2005 - France N&S), but its results must be corrected with a conversion factor in order to translate the measured carbofuran residue in carbofuran + 3-OH-carbofuran residue. Taking into consideration the evaluation of benfuracarb and the seedling metabolism studies provided in the carbofuran DAR, a conversion factor of 2.5 should be applied to short term and long term residue.

Carbofuran Volume 3 – Annex B – Ecotoxicology April 2009
Belgium
___________________________________________________________________________
_______________
85
Indeed, the sugar beet seedling metabolism (Mamouni A., 2006b) provides the following residue values in cotyledons, as documented under table B7.1.4-3 in carbofuran DAR:
Day Carbofuran (mg/kg) 3-OH-Carbofuran
(mg/kg)
Total (mg/kg) Ratio
3 (acute) 43.825 11.62 55.445 1.27
7 (short term) 16.516 9.571 26.087 1.58
14 7.534 8.958 16.492 2.19
28 0.313 5.153 5.466 17.46
TWA 3-28 days
(long term)
14.45 29.32 2.03
This demonstrates that a conversion factor of 2.5 is protective to correcting the residue 7 days (short term) and TWA (long term). For the acute risk, residue after 3 days remains mainly carbofuran. No correction factor needs therefore to be applied to the residue value at that time point. We propose to use the following residue endpoints for a risk assessment at 600 g ai/ha, on the basis of the residue trial results documented in table B.9.1.8-5 in the DAR. Acute toxicity: use 10.4 mg/kg. At this time point, no significant 3-OH-carbofuran metabolisation has started. Short term toxicity: use 6.6 x 2.5 = 16.5 mg/kg (carbofuran + 3-OH-carbofuran) Long term toxicity: use TWA of 2.4 x 2.5 = 6 mg/kg (carbofuran + 3-OH-carbofuran). Residue values will be 10 times lower when conducting the risk assessment at 60 g ai/ha. Indeed, the validity of
applying the RUD rule is confirmed by some trials undertaken by Zietz (2008) where residue in seedling of
carbofuran + 3-OH-carbofuran was compared after application of 600 g ai/ha and 60 g ai/ha in the same climatic
and soil condition. The results show a response linear with the dose rate. Results of the trails by Zietz (2008) are
documented in table B9.1.8-2, which is copied here after for easier reference.
Carbofuran and 3-OH-carbofuran in sugar beet seedlings – trials performed in Southern France and Italy
Trial No. Specime
n
material
Appl.
Rate kg
a.s./ha
Row
interval
(m)
g a.s./m
row
Timing
(BBCH)
DALA Carbofuran
(mg kg-1
)
3-hydroxy
carbofuran
(mg kg-1
)
Ratio
(3OH +
a.s.)/a.s.
Carbofura
n + 3OH
carbofuran
07-SF-013 Fodder
beet
seedling
Control 0.65 - 12 20 < 0.005 nd < 0.005 nd - -
07-SF-013 600 0.65 0.039 12 20 0.022 0.083 4.5 0.099
07-SF-014 Fodder
beet
seedling
Control 0.5 - 12 24 < 0.005 nd < 0.005 nd - -
07-SF-014 600 0.5 0.030 12 24 < 0.005 0.033 7.1 0.036
07-IT-019 Fodder
beet
seedling
Control 0.6 - 11 – 12 36 < 0.005 nd < 0.005 nd - -
07-IT-019 600 0.6 0.036 11 – 12 36 1.1 3.4 3.9 4.271
07-IT-019 60 0.6 0.0036 11 – 12 36 0.066 0.29 5.1 0.336
07-IT-020 Sugar
beet
seedling
Control 0.6 - 11 – 12 36 < 0.005 nd < 0.005 nd - -
07-IT-020 600 0.6 0.036 11 – 12 36 0.20 2.4 12.2 2.438
07-IT-020 60 0.6 0.0036 11 – 12 36 < 0.005 0.13 25.2 0.126
Mean 9.67
Median 6.10
DALA = days after last treatment
< 0.005 nd = no peak was detected
The results from trials 07-IT-019 and 07-IT-020 (highlighted in bold) confirm that – in the same conditions - the
expected residue at 60 g carbofuran/ha is 10 times lower than at 600 g ai/ha.

Carbofuran Volume 3 – Annex B – Ecotoxicology April 2009
Belgium
___________________________________________________________________________
_______________
86
Therefore, the proposed Residue values (normalized from the measured residue obtained from Waalkens and
Baltussen, 2005) and corrected for 3-OH-carbofuran content will be
Seedlings residue to be used in the birds and mammals Risk assessment
App rate [g as/ha] Acute [DAT 1] Short-term [DAT 5] Long-term [twa]
600 10.4 16.5 6
60 1.04 1.65 0.6
Residue of carbofuran in earthworms and insects
Residue in earthworms and beetles should only consider carbofuran. Indeed, 3-OH-carbofuran is a minor
metabolite in soil (<5%: see B.8.1.1.1 of original DAR) and will therefore not contaminate insect and soil
dwelling arthropods in any significant concentrations. This is confirmed in the DAR of benfuracarb were the
notifier Otsuka analysed both carbofuran and 3-OH-carbofuran in earthworm. These data confirm the modest
contribution of 3-OH-carbofuran to the carbofuran residue.
Proposed Residue values are derived by normalizing measured residue obtained from Brown et al (2007) at an
app rate of 375 g as/ha. The RUD rules apply well to these values since residue in earthworms and arthropods is
driven by the PEC soil, which is a linear function of the applied dose rate.
Earthworm residue to be used in the birds and mammals Risk assessment
App rate [g as/ha] Acute [DAT 1] Short-term [DAT 5] Long-term [twa]
600 0.128 0.224 0.128
60 0.0128 0.0224 0.0128
Arthropods residue to be used in the birds and mammals Risk assessment
App rate [g as/ha] Acute [DAT 1] Short-term [DAT 5] Long-term [twa]
600 5.84 0.512 2
60 0.584 0.05 0.2
Birds and mammals TER summaries
The TERs were re-calculated on the focal species using the FIR and PD values determined by RMS in the DAR.
The residue values as described here above were entered to assess the acute, short term and long term risk of
birds and mammals at 60 and 600 g ai/ha, in order to offer a revised deterministic evaluation of the secondary
poisoning.
Birds and mammals Risk assessment – summary table
Species App rate [g as/ha] App rate [g as/ha] App rate [g as/ha]
600 60 600 60 600 60
TERacute TERst TERlt
Woodpigeon 0.33 3.3 0.5 4.68 0.5 5.15
Yellow wagtail 0.2 2 5 51 0.53 5
Blackbird 5 51 7 66 5 46
Skylark 0.13 1.25 0.2 2.1 0.2 2.1
Hare 4.9 49 nd nd 1.1 11.4
Shrew 2.9 28.8 nd nd 1.0 9.7
These TER values show that reducing the dose rate to 60 g ai/ha allows finding an acceptable risk to mammals
and significantly improves the risk assessment to birds. Some TER values for birds still range from 1.25 to 4.68,
but they could be further refined if taking into account:
The use of a PT value on top of a PD value;

Carbofuran Volume 3 – Annex B – Ecotoxicology April 2009
Belgium
___________________________________________________________________________
_______________
87
Consideration of the reversibility of the AChE inhibition and rapid metabolisation/excretion of
carbofuran;
Or any other refinement step the evaluator judges appropriate in order to reflect the risk to birds and
mammals in a more realistic manner.
Detailed birds and mammals TER calculation are provided in the document of the notifier.
Conclusion of the RMS :
The RMS maintains its position that the proposal of the notifier for an additional risk assessment at a reduced
granular dose rate of 60 g a.s./ha, corresponding to the doses used for seed treatment is not acceptable. It is
indeed very questionable whether such use can be considered as a representative use :
- it is not representative for the use of a granular formulation as the dosage of 60 g carbofuran/ha is much
lower than the authorized dosages. The GAPs for granule formulations that were authorized in 2002 in
EU MS consisted in applications at sowing or transplant time, with incorporation in the furrow at
maximum rate of 600-750 g a.s./ha. (Broadcast applications were performed at even higher dosages)
- it is not representative for the use of a seed treatment formulation at similar rates of 60 g a.s./ha because
the exposure routes and risk assessments are not equivalent; for example, it is obvious that the
exposures of the consumer, of the operator, of the birds and mammals will be significantly different if
we compare a granular application to a seed treatment
- the resubmitted dossier does not contain trials performed at 60 g a.s./ha in order to determine the residue
levels in bird and mammal feed items (sugar beet seedlings, earthworms, arthropods).
The RMS concluded on the granule intake by birds, in addition to the notifiers statement :
The first tier risk assessment shows that birds in a body weight range of 15 to 50 g reach the LD50, LC50 and the
long-term NOEC with 0.2 – 1.8 granules.
The calculations according to the EPPO scheme show ETR values of 0.0062 to 0.7438 for realistic worst case
scenarios. However, no safety factor is taken on board in these calculations.
According to the RMS, there are numerous shortcomings in the probabilistic risk assessment (granules) and
therefore no sound conclusions can be drawn.
In conclusion, the risk of Furadan 5G granules to birds is not acceptable for the intended use.
The RMS cannot agree with the proposed conversion factor carbofuran / 3-OH-carbofuran of 2.5 from the
benfuracarb dossier. Also, the notifiers statement that residues in earthworms and beetles should only consider
carbofuran (3-OH-carbofuran residues are negligible) is based on the benfuracarb dossier. If data from
benfuracarb dossier are used, this should be accompanied by a letter of access.
The RMS disagrees with the statement of the notifier that the residue values at 60 g a.s./ha will be 10 times lower
compared to 600 g a.s./ha. The results showing a linear response with the dose rate are based on only 2 residue
trials. RMS also raises questions about the reduced dose rate :
- If carbofuran is applied at 60 g a.s./ha, the product will be applied in the plant hole, closer to the plant, to be as
effective as the higher dose rate. No extrapolation of the residues is possible from a residue trial conducted at
600 g a.s./ha in the furrow. Only a residue trial conducted at 60 g a.s./ha in the plant hole will give the residue
level in the field situation.
- If 60 g a.s./ha is efficient, why is the use at 600 g a.s./ha supported ?
Moreover, the RMS disagrees with the extrapolation factor of 2.5 from the benfuracarb dossier (cabbage) to the
carbofuran dossier (sugar beet). Only a residue trial conducted in the relevant crop (sugar beet) can be used to
calculate the conversion factor carbofuran / 3-OH-carbofuran.
The RMS concluded that the risk of carbofuran to birds and mammals consuming sugar beet seedlings,
earthworms and arthropods is not acceptable for the intended use based on insufficient information on the actual
residue level in feed items. In order to refine the risk to birds and mammals, more information is needed on the
actual residue levels in feed items (sugar beet seedlings, earthworms, arthropods). The information should allow
to perform statistical evaluations (enough residue trials, N and S European conditions, sampling over time,
enough sampling material, …). Also, the residue trials should be relevant for the intended use (crop, application
rate, granular or seed treatment use).

Carbofuran Volume 3 – Annex B – Ecotoxicology April 2009
Belgium
___________________________________________________________________________
_______________
88

Carbofuran Volume 3 – Annex B – Ecotoxicology April 2009
Belgium
___________________________________________________________________________
_______________
89

Carbofuran Volume 3 – Annex B – Ecotoxicology April 2009
Belgium
___________________________________________________________________________
_______________
90
Risk to aquatic organisms :
Risk assessment for aquatic organisms was re-calculated using the PEC surface water recently re-calculated and
the ecotoxicological endpoints agreed in the DAR. TERs are provided in the tables in the document of the
notifier.
Conclusion of the notifier :
Whilst all run off scenarios show acceptable risk to the aquatic organisms for applications at 600 or 60 g
carbofuran/ha, the low dose rate application at 60 g carbofuran/ha also presents acceptable risk to Dapnia magna
and Cerodapnia dubia in the drainage scenarios.
Calculations of the RMS :
Risk assessment for the active substance (0.600 kg a.s./ha)
Table B.9.2.16.1-3 : Toxicity Exposure Ratio’s (TER’s) for aquatic organisms exposed to carbofuran in surface
water for the intended use in sugar beet (1 x 0.600 kg a.s./ha) based on FOCUS Step 3 calculations
Scenario Water
body
type
Test organism Time
scale
Toxicity
end
point
(mg/L)
PECsw
(µg/L)
TER Annex
VI
trigger
D3 Ditch
Lepomis
macrochirus 96 h 0.18
0.0264 6818 100
D4 Pond 0.1030 1748 100
D4 Stream 0.0914 1969 100
R1 Pond 0.0000 - 100
R1 Stream 0.0000 - 100
R3 Stream 0.0000 - 100
D3 Ditch
Cyprinodon
variegatus 35 d 0.006
0.0264 227 10
D4 Pond 0.1030 58 10
D4 Stream 0.0914 66 10
R1 Pond 0.0000 - 10
R1 Stream 0.0000 - 10
R3 Stream 0.0000 - 10
D3 Ditch
Daphnia magna 48 h 0.00205
0.0264 78 100
D4 Pond 0.1030 20 100
D4 Stream 0.0914 22 100
R1 Pond 0.0000 - 100
R1 Stream 0.0000 - 100
R3 Stream 0.0000 - 100
D3 Ditch Ceriodaphnia dubia 7 d 0.00016
0.0264 6.1 10
D4 Pond 0.1030 1.6 10
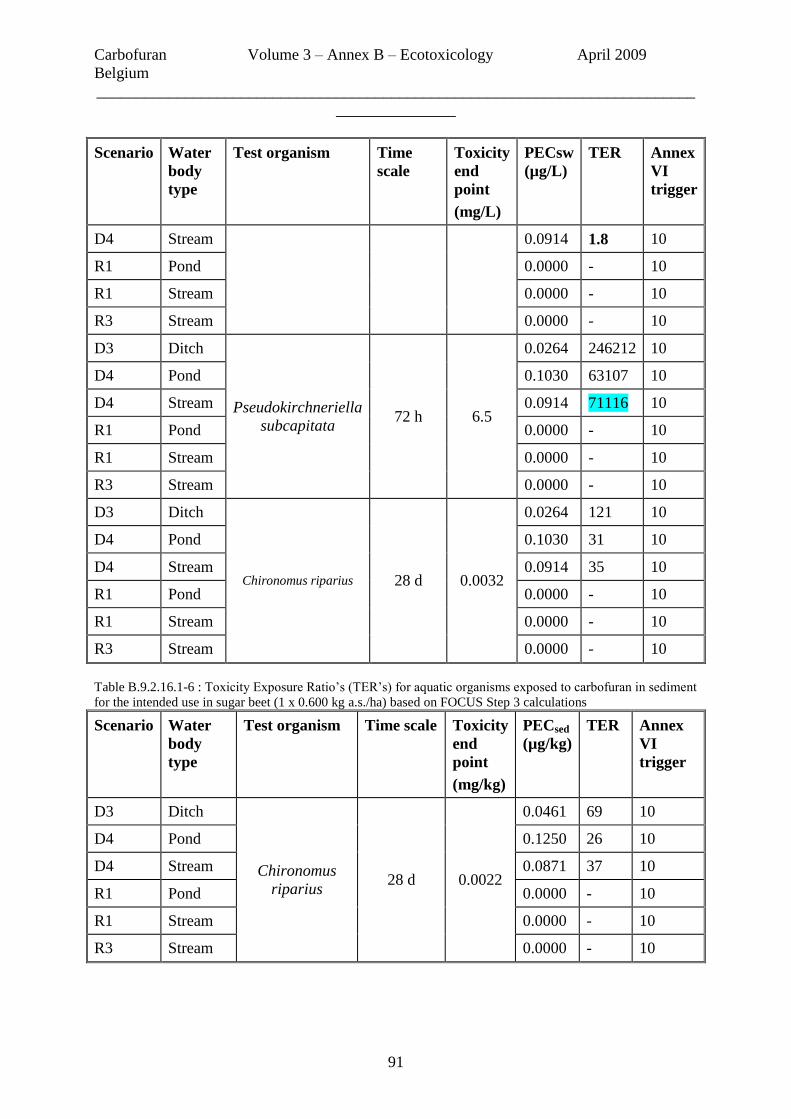
Carbofuran Volume 3 – Annex B – Ecotoxicology April 2009
Belgium
___________________________________________________________________________
_______________
91
Scenario Water
body
type
Test organism Time
scale
Toxicity
end
point
(mg/L)
PECsw
(µg/L)
TER Annex
VI
trigger
D4 Stream 0.0914 1.8 10
R1 Pond 0.0000 - 10
R1 Stream 0.0000 - 10
R3 Stream 0.0000 - 10
D3 Ditch
Pseudokirchneriella
subcapitata 72 h 6.5
0.0264 246212 10
D4 Pond 0.1030 63107 10
D4 Stream 0.0914 71116 10
R1 Pond 0.0000 - 10
R1 Stream 0.0000 - 10
R3 Stream 0.0000 - 10
D3 Ditch
Chironomus riparius 28 d 0.0032
0.0264 121 10
D4 Pond 0.1030 31 10
D4 Stream 0.0914 35 10
R1 Pond 0.0000 - 10
R1 Stream 0.0000 - 10
R3 Stream 0.0000 - 10
Table B.9.2.16.1-6 : Toxicity Exposure Ratio’s (TER’s) for aquatic organisms exposed to carbofuran in sediment
for the intended use in sugar beet (1 x 0.600 kg a.s./ha) based on FOCUS Step 3 calculations
Scenario Water
body
type
Test organism Time scale Toxicity
end
point
(mg/kg)
PECsed
(µg/kg)
TER Annex
VI
trigger
D3 Ditch
Chironomus
riparius 28 d 0.0022
0.0461 69 10
D4 Pond 0.1250 26 10
D4 Stream 0.0871 37 10
R1 Pond 0.0000 - 10
R1 Stream 0.0000 - 10
R3 Stream 0.0000 - 10

Carbofuran Volume 3 – Annex B – Ecotoxicology April 2009
Belgium
___________________________________________________________________________
_______________
92
Risk assessment for the metabolites (0.600 kg a.s./ha)
Table B.9.2.16.2-3 : Toxicity Exposure Ratio’s (TER’s) for aquatic organisms exposed to 3-keto-carbofuran in
surface water for the intended use in sugar beet (1 x 0.600 kg a.s./ha) based on FOCUS Step 3 calculations
Scenario Water
body
type
Test organism Time scale Toxicity
end
point
(mg/L)
PECsw
(µg/L)
TER Annex
VI
trigger
D3 Ditch
Ceriodaphnia
dubia 48 h 0.049
0.0026 18846 100
D4 Pond 0.0079 6203 100
D4 Stream 0.0044 11136 100
R1 Pond 0.0000 - 100
R1 Stream 0.0000 - 100
R3 Stream 0.0000 - 100
Table B.9.2.16.2-5bis : Toxicity Exposure Ratio’s (TER’s) for aquatic organisms exposed to 3-OH-carbofuran in
surface water for the intended use in sugar beet (1 x 0.600 kg a.s./ha) based on FOCUS Step 3 calculations
Scenario Water
body
type
Test organism Time scale Toxicity
end
point
(mg/L)
PECsw
(µg/L)
TER Annex
VI
trigger
D3 Ditch
Ceriodaphnia
dubia 48 h 0.023
0.0008 28750 100
D4 Pond 0.0041 5610 100
D4 Stream 0.0024 9583 100
R1 Pond 0.0000 - 100
R1 Stream 0.0000 - 100
R3 Stream 0.0000 - 100
Table B.9.2.16.2-6bis : Toxicity Exposure Ratio’s (TER’s) for aquatic organisms exposed to 7-phenol in surface
water for the intended use in sugar beet (1 x 0.600 kg a.s./ha) based on FOCUS Step 3 calculations
Scenario Water
body
type
Test organism Time
scale
Toxicity
end
point
(mg/L)
PECsw
(µg/L)
TER Annex
VI
trigger
D3 Ditch
Chironomus
riparius 25 d 5.34
0.0000 - 10
D4 Pond 0.0001 53400000 10
D4 Stream 0.0002 26700000 10
R1 Pond 0.0000 - 10
R1 Stream 0.0000 - 10

Carbofuran Volume 3 – Annex B – Ecotoxicology April 2009
Belgium
___________________________________________________________________________
_______________
93
Scenario Water
body
type
Test organism Time
scale
Toxicity
end
point
(mg/L)
PECsw
(µg/L)
TER Annex
VI
trigger
R3 Stream 0.0000 - 10

Carbofuran Volume 3 – Annex B – Ecotoxicology April 2009
Belgium
___________________________________________________________________________
_______________
94
Table B.9.2.16.2-7bis : Toxicity Exposure Ratio’s (TER’s) for aquatic organisms exposed to 7-phenol in
sediment for the intended use in sugar beet (1 x 0.600 kg a.s./ha) based on FOCUS Step 3 calculations
Scenario Water
body
type
Test organism Time
scale
Toxicity
end
point
(mg/kg)
PECsed
(µg/kg)
TER Annex
VI
trigger
D3 Ditch
Chironomus
riparius 25 d 1.36
0.0012 1133333 10
D4 Pond 0.0017 800000 10
D4 Stream 0.0020 680000 10
R1 Pond 0.0000 - 10
R1 Stream 0.0000 - 10
R3 Stream 0.0000 - 10
Risk assessment for the active substance (0.060 kg a.s./ha)
Table B.9.2.16.1-3 : Toxicity Exposure Ratio’s (TER’s) for aquatic organisms exposed to carbofuran in surface
water for the intended use in sugar beet (1 x 0.060 kg a.s./ha) based on FOCUS Step 3 calculations
Scenario Water
body
type
Test organism Time
scale
Toxicity
end
point
(mg/L)
PECsw
(µg/L)
TER Annex
VI
trigger
D3 Ditch
Lepomis
macrochirus 96 h 0.18
0.0020 90000 100
D4 Pond 0.0093 19355 100
D4 Stream 0.0083 21687 100
R1 Pond 0.0000 - 100
R1 Stream 0.0000 - 100
R3 Stream 0.0000 - 100
D3 Ditch
Cyprinodon
variegatus 35 d 0.006
0.0020 3000 10
D4 Pond 0.0093 645 10
D4 Stream 0.0083 723 10
R1 Pond 0.0000 - 10
R1 Stream 0.0000 - 10
R3 Stream 0.0000 - 10
D3 Ditch
Daphnia magna 48 h 0.00205
0.0020 1025 100
D4 Pond 0.0093 220 100
D4 Stream 0.0083 247 100

Carbofuran Volume 3 – Annex B – Ecotoxicology April 2009
Belgium
___________________________________________________________________________
_______________
95
Scenario Water
body
type
Test organism Time
scale
Toxicity
end
point
(mg/L)
PECsw
(µg/L)
TER Annex
VI
trigger
R1 Pond 0.0000 - 100
R1 Stream 0.0000 - 100
R3 Stream 0.0000 - 100
D3 Ditch
Ceriodaphnia dubia 7 d 0.00016
0.0020 80 10
D4 Pond 0.0093 17 10
D4 Stream 0.0083 19 10
R1 Pond 0.0000 - 10
R1 Stream 0.0000 - 10
R3 Stream 0.0000 - 10
D3 Ditch
Pseudokirchneriella
subcapitata 72 h 6.5
0.0020 3250000 10
D4 Pond 0.0093 698925 10
D4 Stream 0.0083 783133 10
R1 Pond 0.0000 - 10
R1 Stream 0.0000 - 10
R3 Stream 0.0000 - 10
D3 Ditch
Chironomus riparius 28 d 0.0032
0.0020 1600 10
D4 Pond 0.0093 344 10
D4 Stream 0.0083 386 10
R1 Pond 0.0000 - 10
R1 Stream 0.0000 - 10
R3 Stream 0.0000 - 10
Table B.9.2.16.1-6 : Toxicity Exposure Ratio’s (TER’s) for aquatic organisms exposed to carbofuran in sediment
for the intended use in sugar beet (1 x 0.060 kg a.s./ha) based on FOCUS Step 3 calculations
Scenario Water
body
type
Test organism Time scale Toxicity
end
point
(mg/kg)
PECsed
(µg/kg)
TER Annex
VI
trigger
D3 Ditch
Chironomus
riparius 28 d 0.0022
0.0038 842 10
D4 Pond 0.0117 274 10
D4 Stream 0.0080 400 10

Carbofuran Volume 3 – Annex B – Ecotoxicology April 2009
Belgium
___________________________________________________________________________
_______________
96
Scenario Water
body
type
Test organism Time scale Toxicity
end
point
(mg/kg)
PECsed
(µg/kg)
TER Annex
VI
trigger
R1 Pond 0.0000 - 10
R1 Stream 0.0000 - 10
R3 Stream 0.0000 - 10

Carbofuran Volume 3 – Annex B – Ecotoxicology April 2009
Belgium
___________________________________________________________________________
_______________
97
Risk assessment for the metabolites (0.060 kg a.s./ha)
Table B.9.2.16.2-3 : Toxicity Exposure Ratio’s (TER’s) for aquatic organisms exposed to 3-keto-carbofuran in
surface water for the intended use in sugar beet (1 x 0.060 kg a.s./ha) based on FOCUS Step 3 calculations
Scenario Water
body
type
Test organism Time
scale
Toxicity
end
point
(mg/L)
PECsw
(µg/L)
TER Annex
VI
trigger
D3 Ditch
Ceriodaphnia
dubia 48 h 0.049
0.0002 245000 100
D4 Pond 0.0007 70000 100
D4 Stream 0.0004 122500 100
R1 Pond 0.0000 - 100
R1 Stream 0.0000 - 100
R3 Stream 0.0000 - 100
Table B.9.2.16.2-5bis : Toxicity Exposure Ratio’s (TER’s) for aquatic organisms exposed to 3-OH-carbofuran in
surface water for the intended use in sugar beet (1 x 0.060 kg a.s./ha) based on FOCUS Step 3 calculations
Scenario Water
body
type
Test organism Time
scale
Toxicity
end
point
(mg/L)
PECsw
(µg/L)
TER Annex
VI
trigger
D3 Ditch
Ceriodaphnia
dubia 48 h 0.023
0.0001 230000 100
D4 Pond 0.0004 57500 100
D4 Stream 0.0002 115000 100
R1 Pond 0.0000 - 100
R1 Stream 0.0000 - 100
R3 Stream 0.0000 - 100
Table B.9.2.16.2-6bis : Toxicity Exposure Ratio’s (TER’s) for aquatic organisms exposed to 7-phenol in surface
water for the intended use in sugar beet (1 x 0.060 kg a.s./ha) based on FOCUS Step 3 calculations
Scenario Water
body
type
Test organism Time scale Toxicity
end
point
(mg/L)
PECsw
(µg/L)
TER Annex
VI
trigger
D3 Ditch
Chironomus
riparius 25 d 5.34
0.0000 - 10
D4 Pond 0.0000 - 10
D4 Stream 0.0000 - 10
R1 Pond 0.0000 - 10
R1 Stream 0.0000 - 10

Carbofuran Volume 3 – Annex B – Ecotoxicology April 2009
Belgium
___________________________________________________________________________
_______________
98
Scenario Water
body
type
Test organism Time scale Toxicity
end
point
(mg/L)
PECsw
(µg/L)
TER Annex
VI
trigger
R3 Stream 0.0000 - 10

Carbofuran Volume 3 – Annex B – Ecotoxicology April 2009
Belgium
___________________________________________________________________________
_______________
99
Table B.9.2.16.2-7bis : Toxicity Exposure Ratio’s (TER’s) for aquatic organisms exposed to 7-phenol in
sediment for the intended use in sugar beet (1 x 0.060 kg a.s./ha) based on FOCUS Step 3 calculations
Scenario Water
body
type
Test organism Time
scale
Toxicity
end
point
(mg/kg)
PECsed
(µg/kg)
TER Annex
VI
trigger
D3 Ditch
Chironomus
riparius 25 d 1.36
0.0001 13600000 10
D4 Pond 0.0001 13600000 10
D4 Stream 0.0002 6800000 10
R1 Pond 0.0000 - 10
R1 Stream 0.0000 - 10
R3 Stream 0.0000 - 10
Conclusion of the RMS :
The calculations of the notifier and RMS are in close agreement.
The risk of carbofuran and its relevant metabolites (3-keto-carbofuran, 3-OH-carbofuran and 7-phenol) at the
application rate of 0.600 kg a.s./ha to aquatic organisms is acceptable for all run-off scenarios and for all
drainage scenarios except for Daphnia magna and Ceriodaphnia dubia.
The risk of carbofuran and its relevant metabolites (3-keto-carbofuran, 3-OH-carbofuran and 7-phenol) at the
application rate of 0.060 kg a.s./ha to aquatic organisms is acceptable for all run-off scenarios and for all
drainage scenarios.

Carbofuran Volume 3 – Annex B – Ecotoxicology April 2009
Belgium
___________________________________________________________________________
_______________
100
Risk to Non target arthropods and macro soil organisms :
The risk to these organisms is addressed by a field study (Brown K.C., Forster A., Davies N.A., 2007) which
show acceptable risk at a dose rate of 375 g carbofuran/ha. Therefore, this study fully covers the risk at the low
dose rate (60 g carbofuran/ha). However, FMC observes from the evaluation tables that it is open for discussion
rather the same study also covers the risk at application rate of 600 g carbofuran/ha.
Conclusion of the RMS :
The risk of carbofuran at the application rate of 600 g a.s./ha is not acceptable for non-target arthropods,
including Folsomia candida.

Carbofuran Volume 3 – Annex B – Ecotoxicology April 2009
Belgium
___________________________________________________________________________
_______________
101
Risk to earthworms, bees, micro-organisms and non target plants :
The use of 600 g carbofuran/ha to these organisms is acceptable. Reducing the dose rate can only offer more
level of confidence.
Conclusion of the RMS :
RMS agrees with the notifier.