final case study, opportunities in capacity creation ... · case study : opportunities in capacity...
TRANSCRIPT

Case Study : Opportunities in Case Study : Opportunities in Case Study : Opportunities in Case Study : Opportunities in Capacity Creation Capacity Creation Capacity Creation Capacity Creation ---- Western India Western India Western India Western India versus Coastal Africaversus Coastal Africaversus Coastal Africaversus Coastal Africa
Dubai 2011
Holtec Consulting, IndiaHoltec Consulting, IndiaHoltec Consulting, IndiaHoltec Consulting, India
Soumen KarkunSoumen KarkunSoumen KarkunSoumen Karkun
Dubai 2011HOLTEC
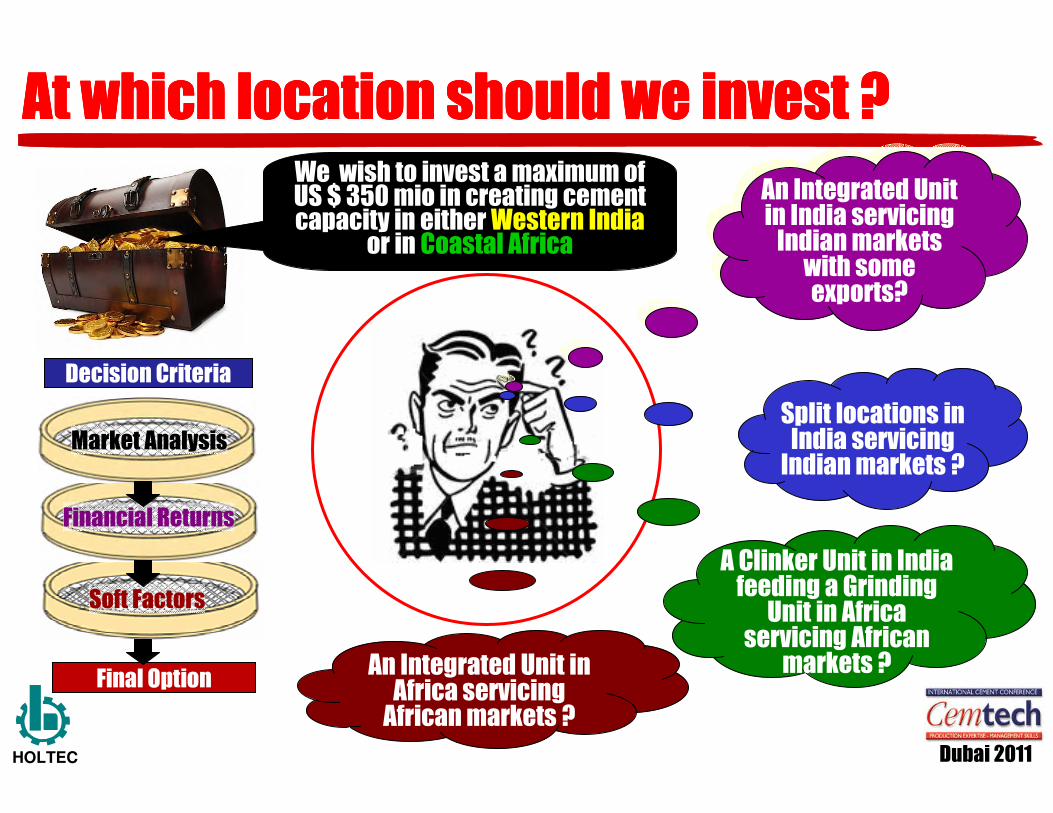
At which location should we invest ?At which location should we invest ?At which location should we invest ?At which location should we invest ?We wish to invest a maximum of US $ 350 mio in creating cement capacity in either Western India
or in Coastal Africa
Decision Criteria
Final Option
Market Analysis
Financial Returns
Soft Factors
An Integrated Unit in India servicing Indian markets with some exports?
An Integrated Unit in India servicing Indian markets with some exports?
Split locations in India servicing Indian markets ?
A Clinker Unit in India feeding a Grinding
Unit in Africa servicing African
markets ?An Integrated Unit in Africa servicing African markets ?

Dubai 2011HOLTEC
90
95
100
105
110
115
- 10 20 30
An Overview of IndiaAn Overview of IndiaAn Overview of IndiaAn Overview of India
� 2011 demand was around 225 mio t. This is expected to grow at around 10 % pa taking demand to ~ 365 mio t by 2015 and
over 480 mio t by 2018.
� Current PCC of around 187 kgs is expected to grow to 260 kgs by 2015 and over 330 kgs by 2018
� Current capacity of around 275 mio tpa is expected to exceed 400 mio tpa by 2015. Subsequent capacity additions are still to be frozen.
� Current price around of USD 104/ t indicates an annual cement spend of ~ USD 23.4 bn. This is expected to grow by over 15 % pa.
� Fragmented market. However, top 3 companies hold around
30-35 % market share. Consolidation unlikely in short term.
� Higher opportunities to service coastal
markets due to paucity of limestone.
Very High
Average
Very Low
High
Low
Market Attractiveness in 2010
Cement Spend (USD mio)
Consumption (2010-mio t)
Price (USD/t)
Maharashtra
Goa
Kerala
Karnataka
Gujarat
2,819
1,571
92964
1,496
248275
302332
365
273313
364399 405 405 405
482439
400
225
405405
2010 2011 2012 2013 2014 2015 2016 2017 2018
Demand - Supply
----
100
200
300
400
500
Demand Supply Capability

Dubai 2011HOLTEC
Why Western India (Kutch in Gujarat)? Why Western India (Kutch in Gujarat)? Why Western India (Kutch in Gujarat)? Why Western India (Kutch in Gujarat)?
110
66
�Available limestone lease in Kutch, Gujarat which can support a 6,000 tpd clinkerisation unit.
�Western India growing at 8-11% pa, taking cement demand from 66 mio t in 2011 to ~93 mio t in 2015 and ~ 110 mio t in 2018.
�Gujarat government offering to support creation of cement capacities.
� Low cost of production – limestone raising cost and fuel (lignite/ imported coal).
�Being port based, can dispatch clinker/ cement to the western coast of India that has negligible cement capacities. Can also export to other countries.
-
25
50
75
100
125
150
2011 2012 2013 2014 2015 2016 2017 2018
Most Likely Pessimistic Optimistic

Dubai 2011HOLTEC
Southeast Asia
Gulf Region
SURPLUS
DEFICIT
Why Africa? Why Africa? Why Africa? Why Africa?
Clinkerization Unit in Gujarat, India
Cement surplus region. Also, China has better competitiveness in this market.
Cement surplus region. Plants within the region cost competitive.
An overall cement deficit in Africa. 36 countries deficit. Hence, attractive as possible destinations for creating cement capacity.
North Africa
West Africa
Middle Africa
East Africa
DEFICIT
DEFICIT
SURPLUS
Negligible Gap
South Africa
Demand: 129Capacity: 138
(Figures in mio t for 2010)
Demand: 156Capacity: 170
Demand: 108Capacity: 107
Demand: 32Capacity: 27
Demand: 11Capacity: 4
Demand: 16Capacity: 17
Demand: 12Capacity: 18
SURPLUS
SURPLUS

Dubai 2011HOLTEC
An Overview of AfricaAn Overview of AfricaAn Overview of AfricaAn Overview of Africa�Currently around 70 % of Africa’s demand (126 mio t) and 67 % of cement spend is consumed by 6 countries, viz., Egypt, Algeria, Nigeria, Morocco, South Africa, and Libya. The balance (53 mio t) is consumed by the remaining 46 countries.
�Estimated to grow by 7-8 % pa, Africa’s demand would reach 252 mio t by 2015. The top 6 countries will retain their dominant positions.
�The current PCC of ~ 175 kgs (4-1,610 kgs) is expected to grow to 222 kgs (5-2,371 kgs) by 2015.
�The current capacity of ~ 173 mio tpa is expected to exceed 270 mio tpa by 2015.
�The average current price of ~ USD 157/ t gives a current cement spend of ~ USD 28bn. This is expected to grow at 8-12 % pa.
�The number of players are generally restricted to single digits in most markets. Consolidation unlikely. Some countries exhibit access restricting player.
�Higher opportunities in deficit markets due to logistical issues.
20152010
D: 179 mio t
C: 173 mio t
D: 252 mio t
C: 274 mio t
27 mio t 19 mio t
41 mio t21 mio t
Attractive Markets
-
50
100
150
200
250
300
350
0 10 20 30 40 50Consumption (2010) in mio t
Price (USD/t)
Cement Spend (USD mio)
4,468
3,877
3,139
2,506
1,826
2,808
Egypt Algeria
Nigeria
Libya
S. Africa
Morocco

Dubai 2011HOLTEC
What are the possible Options ?What are the possible Options ?What are the possible Options ?What are the possible Options ?
CK
CA
Gwc
GK
Bwc
MWC
MG
MA
MAExGALegend
C = Clinkerisation Unit, G = Grinding Unit, B = Blending Unit, M = MarketsK = Kutch, WC = West Coast (India), CA = Coastal Africa, Ex = Exports

Dubai 2011HOLTEC
Tools and DatabasesTools and DatabasesTools and DatabasesTools and DatabasesANALYTIC HIERARCHY PROCESS (AHP)
Criteria 1 Criteria 4 Criteria 5
Alternative 1 Alternative 3
GOAL
Criteria 2 Criteria 3
Alternative 2
CRITERIACRITERIACRITERIACRITERIA
ALTERNATIVESALTERNATIVESALTERNATIVESALTERNATIVES
Markets
Limestone
Blending Materials
Fuel
Land
Ports
Capex, Opex
Deposits LDSS
InCem Demand
Sources
Supply
InfluencePorts
Acquirability
Source
Equipment
Availability
Prices
DATABASES
HOW MUCH
PRODUCER
MARKET
COMPETITIVEADVANTAGE
HOW DOES THEMARKET LOOK ATTHE PRODUCER
CAN SELL
MARKETATTRACTIVENESS
HOW DOES THEPRODUCER LOOK AT THE MARKET
WANT TO SELL
WHAT WHERE TO WHOM HOW
COMPETITIVE ANALYSIS
DEMAND FORECASTING
Real GDPPast Data
CementConsumptionPast Data
PopulationPast Data
ConstructionSpend Past Data
Time
Cement Demand Forecasts
Generation &Validation of StatisticalCorrelations
SimulationSimulationSimulationSimulation
Population Projections (IMF), Real GDP Projections (IMF, EIU, etc), Oil
Price Projections (IEA, etc)
Supplier Conditions

Dubai 2011HOLTEC
2011Demand : 14Supply : 232015Demand : 21Supply : 41
An Overview of An Overview of An Overview of An Overview of WesternWesternWesternWestern IndiaIndiaIndiaIndia� Presently, Gujarat and Karnataka are surplus
whereas the other states are deficit. Considered as an entity, the region is marginally surplus, a situation likely to perpetuate.
� But with supply clusters being distant, market share can be captured by a grinding or blending unit on the coast, serviced by clinker shipped from Gujarat.
2011Demand : 16Supply : 252015Demand : 24Supply : 35
Supply Clusters
Grinding Unit
Blending Unit
2011Demand : 26Supply : 202015Demand : 36Supply : 34
2011Demand : 9Supply : <12015Demand : 12Supply : <1

Dubai 2011HOLTEC
1
2
3
4
567
8
Competitiveness of Competitiveness of Competitiveness of Competitiveness of Downstream LocationsDownstream LocationsDownstream LocationsDownstream Locations
91.3
89.5
88.9
87.6
87.3
87.1
87.9
66.0
Ex-Factory Realisation (USD/ t)
0.7
0.8
0.7
1.0
0.7
1.1
1.0
1.2
Achievable Volumes
(2015-mio t)
30.20.7-1.2Kutch (IU)1
23.91.0-1.1Mumbai (BU)2
0.3-0.5
0.3-0.5
0.3-0.5
0.4-0.8
0.5-0.8
0.9-1.0
Competitive Index
15.9Kochi (BU)8
15.2Calicut (BU)7
15.5Kannur (BU)6
20.4Udupi (GU)5
24.2Karwar (GU)4
27.1Jaigarh (GU)3
Profit (USD/ t)
OptionsCode
� The IU is competitive in Kutch; beyond that it’s competitiveness decreases. It can export 0.2-0.3 mio t annually to the East Coast of Africa.
� Mumbai BU has an above average realisation as other players’ lead distance/ freight to Mumbai region is also high.
� The Jaigarh GU is seen to be competitive and can sell high volumes due to its reach to attractive markets.
� The GU’s at Karwar and Udupi are less competitive due to higher competition from Andhra.
� The BU’s in Kerala are less competitive due to high freight and no proximate blending source.
Dubai 2011HOLTEC
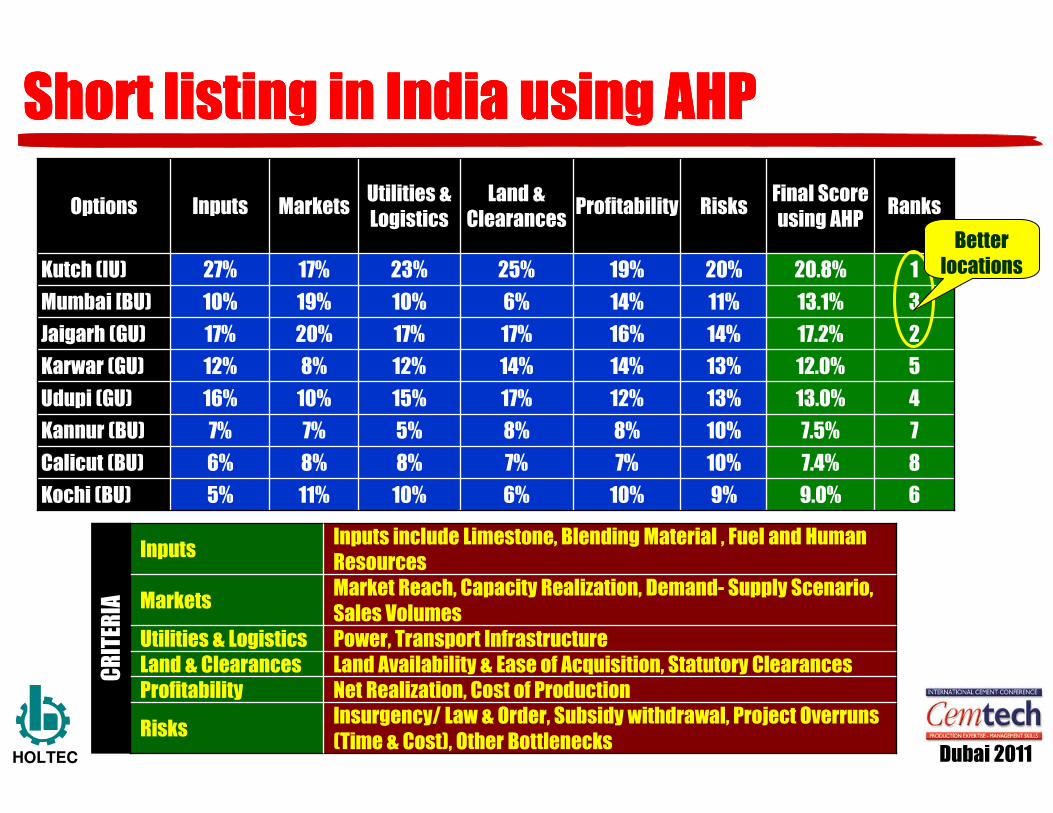
Short listing in India using AHPShort listing in India using AHPShort listing in India using AHPShort listing in India using AHP
69.0%9%10%6%10%11%5%Kochi (BU)
87.4%10%7%7%8%8%6%Calicut (BU)
77.5%10%8%8%5%7%7%Kannur (BU)
413.0%13%12%17%15%10%16%Udupi (GU)
512.0%13%14%14%12%8%12%Karwar (GU)
217.2%14%16%17%17%20%17%Jaigarh (GU)
313.1%11%14%6%10%19%10%Mumbai [BU)
120.8%20%19%25%23%17%27%Kutch (IU)
RanksFinal Score using AHP
RisksProfitabilityLand &
ClearancesUtilities & Logistics
MarketsInputsOptions
Better locations
Insurgency/ Law & Order, Subsidy withdrawal, Project Overruns (Time & Cost), Other Bottlenecks
Risks
Net Realization, Cost of ProductionProfitabilityLand Availability & Ease of Acquisition, Statutory ClearancesLand & ClearancesPower, Transport InfrastructureUtilities & Logistics
Market Reach, Capacity Realization, Demand- Supply Scenario, Sales Volumes
Markets
Inputs include Limestone, Blending Material , Fuel and Human Resources
Inputs
CRITERIA

Dubai 2011HOLTEC
Demand in Coastal AfricaDemand in Coastal AfricaDemand in Coastal AfricaDemand in Coastal Africa
118.4Total83.4
0.9Togo0.6
0.8Liberia0.5
0.9Guinea0.8
8.9Tunisia6.6
26.9Algeria20.1
25.7Morocco17.9
0.6Rep of Congo0.4
12.4Angola6.2
0.7Namibia0.5
1.2Benin1.1
24.7Nigeria18.0
2.2Cameroon1.6
0.6E. Guinea0.4
0.5Gabon0.4
5.1Ghana3.9
0.4
0.1
0.1
2.7
0.9
0.2
2010 2015Country
1.2Mauritania
0.5S. Leone
0.2G. Bissau
0.2Gambia
3.9Senegal
0.3W. Sahara
116.0Total82.5
16.8Libya10.4
65.3Egypt49.1
5.3Sudan3.6
0.3Eritrea0.2
0.4Djibouti0.2
0.7
10.9
1.1
2.5
3.7
0.1
2010 2015Country
5.9Kenya
0.8Madagascar
14.0South Africa
2.4Mozambique
4.6Tanzania
0.2Somalia
� Total 22 west coast based countries.
� Most high consumption markets expected to become surplus in future.
� Countries within the region better placed to cater the deficit markets in the region. Thus, not a very attractive market for creating new capacity or receiving exports from India
� Total 11 east coast based countries.
Export from India and setting up of Grinding Units to be restricted to deficit markets on East Coast of Africa.
Setting up of an Integrated Unit to be governed by limestone availability and access to deficit markets.
� Overall a deficit market. Egypt, Kenya, Tanzania, South Africa and Madagascar are surplus whereas all other countries are deficit.
� In future, Sudan also expected to become surplus.
� However, Tanzania likely to turn deficit.
Figures in mio t
2010 2015

Dubai 2011HOLTEC
Competitiveness & Sales VolumesCompetitiveness & Sales VolumesCompetitiveness & Sales VolumesCompetitiveness & Sales Volumes
0.7
0.7
0.6
0.5
0.5
Achievable Volumes: Year 2 (mio t)
0.6-0.9Mozambique
0.6-0.9Tanzania
0.6-0.9Somalia
0.6-0.9Djibouti
0.5-0.7Eritrea
CompetitivenessGU Locations
1.5
0.8
0.9
1.0
0.7
Achievable Volumes: Year
2 (mio t)
0.8 - 1.1> 4,000Mozambique
0.7 - 1.0> 500Madagascar
> 12,000
> 2,000
> 250
Limestone Resources (mio t)
0.7 - 1.1South Africa
0.8 - 1.1Tanzania
0.7 - 1.1Djibouti
Competitiveness in export and home
marketsIU Locations
The proposed cement plants (IU and GU) in Africa are envisaged to sell not only in their domestic markets but also to proximate deficit markets.
Will face competition from local players as well as exports from Oman, South Africa, Yemen, KSA, Pakistan, Jordan, UAE, China, etc, in order of their respective competitiveness.
However, countries like KSA are again likely to become deficit by 2015 and may not pose a threat.

Dubai 2011HOLTEC
Political, Commercial, Investment risks, including civil unrest, unfavorable local laws, etc
Risks
Power, Transport InfrastructureUtilities & Logistics
Market Reach, Capacity Realization, Demand- Supply Scenario, Import Threats, Export Dependence & Opportunities, Net Realization
Markets
Limestone, Correctives, Blending Material, Fuel, Human ResourcesInputs
CRITERIA
224%33%27%24%18%Mozambique
127%33%27%30%19%Tanzania
512%3%8%15%13%Somalia
322%27%22%18%25%Djibouti
416%4%16%13%25%Eritrea
RanksFinal Score using AHP
RisksUtilities & Logistics
MarketsInputsGU Options with
Clinker from India
226%24%30%22%30%South Africa
513%11%13%13%15%Madagascar
321%27%20%20%20%Mozambique
127%27%20%33%20%Tanzania
414%11%17%12%15%Djibouti
RanksFinal Score using AHP
RisksUtilities & Logistics
MarketsInput
MaterialsIU Options
Preferred locations for
GU
Preferred locations for
IU
Short listing in Coastal Africa using AHPShort listing in Coastal Africa using AHPShort listing in Coastal Africa using AHPShort listing in Coastal Africa using AHP

Dubai 2011HOLTEC
Risk ProfileRisk ProfileRisk ProfileRisk Profile
Commercial Risk The risk of default by a foreign private buyer. Depends also onmacroeconomic and systemic factors impacting the repayment capacity of all the buyers in a country.
0
2
4
6
8
0 2 4 6 8
Somalia
Eritrea
Djibouti
Mozambique
Tanzania
South Africa
Political Risk
War Risk
Risks from political events such as
revolutions, natural disasters, currency
shortages, government action, etc.
Risk resulting from the outbreak of war.
Least Risk
Highest RiskSize of bubbles represent Commercial Risk
Madagascar
LOW HIGH
LOW
HIGH
Source: ONDD (Office national du ducroire), http://www.ondd.be

Dubai 2011HOLTEC
Option 1: Features & OutcomesOption 1: Features & OutcomesOption 1: Features & OutcomesOption 1: Features & OutcomesOPC 10%
PPC 90%
� Plant Location: 40 Km from port. Jetty to be built.
� Limestone Quantity: 118.5 mio t. Plant Life: 37-38 years.
� Limestone Quality: CaO : 43 to 50 %. Siliceous and argillaceous correctives required. Limestone high in chlorides, thus requiring a bypass.
� Fuel: Locally available Lignite with imported coal (50:50).
� Power: Coal/ Lignite based Captive Power Plant.
� Fly Ash Source: Near Mundra at a distance of 220 km.
� Gypsum: 120 km. Silica Sand: 70 km.
� Laterite and Clay (owned).
LimestoneLimestoneLimestoneLimestone Silica SandSilica SandSilica SandSilica Sand
GypsumGypsumGypsumGypsum
1.46DSCR
6 Years 1 MonthsPay back
USD 60 mioNPV @ 12%
14.7%IRR
USD 322 millionInvestment
0.51.01.52.02.53.0
Gujarat Maharashtra Exports Total
Yr 1
Yr 2Yr 3
In mio t
Plant achieves 100 % utilisation in year 3 (2016)
1.1-1.3 1.0-1.2
0.2-0.3
2.3-2.8
37
145
82
40
64
0
10
20
30
40
50
60
70
Raw
Materials
Power
Fuel
Overheads
Salary &
Wages
Packing
UCOP
NCR
US$/ t
LigniteLigniteLigniteLignite
6,000 tpd CU with 1.56 mio tpa grinding at
Kutch
1.2 mio tpa Grinding Unit at Jaigarh

Dubai 2011HOLTEC
Option 2: Features & OutcomesOption 2: Features & OutcomesOption 2: Features & OutcomesOption 2: Features & Outcomes6,000 tpd CU with
1.7 mio tpa grinding at Kutch
Clinkerization+Grinding Unit at Kutch� Plant Location: 40 Km from port. Jetty to be built.� Limestone Quantity: 118.5 mio t. Plant Life: 37-38 years.� Fuel: Locally available Lignite with imported coal (50:50). � Power: Coal based Captive Power Plant.� Fly Ash Source: Near Mundra at a distance of 220 km.
1.0 mio tpa Grinding Unit at Dar es Saalam, Tanzania
-
0.5
1.0
1.5
2.0
2.5
Tanzania Others India Total
Yr 1 Yr 2 Yr 3mio t
From GU in Tanzania
From India
Product Mix100% PPC in India100% CEM II in Tanzania
Capacity UtilizationOverall 100% in Yr 6
*Others include Mozambique, Malawi & Zambia *
1.31
7 Years 2 Months
USD 35 mio
13.4%
USD 334million
DSCR
Pay back
NPV @ 12%
IRR
Investment Grinding Unit in Tanzania� Plant Location: 15 km from Dar es Salaam port� Limestone Source (for Cem II): 50 km from Dar es Salaam� Power: Grid� Gypsum: Locally purchased (quarry at Kilwa district of Lindi)
0.4-0.5 0.2-0.3
1.1-1.31.7-2.1
73
49 35
4 28
53
0
10
20
30
40
50
60
70
80
Raw
Materials
Power
Fuel
Overheads
Salary &
Wages
Packing
UCOP
NCR
US$/ t

Dubai 2011HOLTEC
-
0.5
1.0
1.5
Tanzania Others Total
Yr 1 Yr 2 Yr 3
Option 3: Features & OutcomesOption 3: Features & OutcomesOption 3: Features & OutcomesOption 3: Features & Outcomes
� Plant Location: ~130 Km from Mtwara port
� Limestone Quantity: >100 mio t. 64 years life.
� Limestone Quality: CaO : 52%. As the limestone is high in CaO and low in SiO2, Al2O3 and Fe2O3, suitable correctives are required
� Fuel: South African Coal
� Power: Grid
� Gypsum Source: Purchased from Lindi (85 km from plant site)
Product Mix100% CEM II
*Others include Mozambique, Malawi & Zambia
2.12DSCR
5 Years 3 MonthPay back
USD 96 mioNPV @ 12%
17.7%IRR
USD 203millionInvestment
*
Capacity Utilization100% in Yr 5
0.3-0.40.5-0.7
0.8-1.1
mio t
Limestone Deposit
Gypsum Deposit
Cement Plant
3,000 tpd CU with 1.24 mio tpa
grinding at Lindi(Tanzania)
57
167
10651
96
0
20
40
60
80
100
120
Raw
Materials
Power
Fuel
Overheads
Salary &
Wages
Packing
UCOP
NCR
Tanzania
US$/ t
Dubai 2011HOLTEC
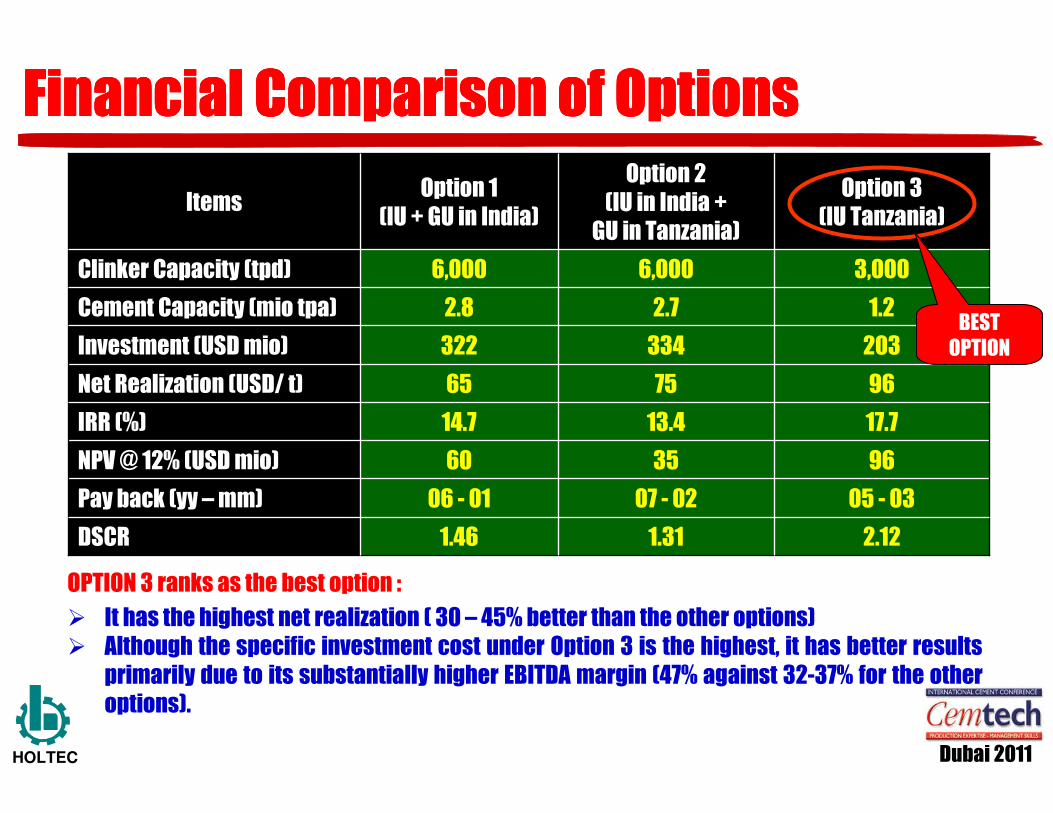
Financial Comparison of OptionsFinancial Comparison of OptionsFinancial Comparison of OptionsFinancial Comparison of Options
967565Net Realization (USD/ t)
3,0006,0006,000Clinker Capacity (tpd)
1.22.72.8Cement Capacity (mio tpa)
1.46
06 - 01
60
14.7
322
Option 1 (IU + GU in India)
1.31
07 - 02
35
13.4
334
Option 2(IU in India +
GU in Tanzania)
Option 3(IU Tanzania)
Items
2.12DSCR
05 - 03Pay back (yy –mm)
96NPV @ 12% (USD mio)
17.7IRR (%)
203Investment (USD mio)
OPTION 3 ranks as the best option :
� It has the highest net realization ( 30 – 45% better than the other options)� Although the specific investment cost under Option 3 is the highest, it has better results
primarily due to its substantially higher EBITDA margin (47% against 32-37% for the other options).
BEST OPTION

Dubai 2011HOLTEC
Overall Comparison of OptionsOverall Comparison of OptionsOverall Comparison of OptionsOverall Comparison of Options
Starting a business, dealing with construction permits, getting credit, protecting investors, paying taxes, trading across borders, enforcing contracts, etc
Ease of Doing Business
Financial results including IRR, NPV, etcFinancials
Political, Commercial, Investment risks, including civil unrest, unfavorable local laws, etc
Risks
Transport Infrastructure Logistics
Market Reach, Capacity Realization, Demand- Supply Scenario, Import Threats, Export Dependence & Opportunities, Net Realization
Markets
Limestone, Correctives, Blending Material, Fuel, Power, Human ResourcesInputs
CRITERIA
138%25%36%48%47%37%36%IU in Tanzania
325%31%26%21%22%21%25%IU at Kutch, GU in Tanzania
237%44%38%31%31%42%39%IU at Kutch, GU at Jaigarh
RanksFinal ScoreRisksEase of Doing
BusinessLogistics FinancialsMarketsInputsOptions
A final AHP analysis using Financial Results in conjunction with Soft Factors show that an IU in Tanzania still remains the best optionIU in Tanzania still remains the best optionIU in Tanzania still remains the best optionIU in Tanzania still remains the best option

Dubai 2011HOLTEC
ConclusionsConclusionsConclusionsConclusions
�Exporting cement to Africa, from a plant in Western India, not an attractive proposition. Such dispatches are less competitive as compared to local plants. Thus, only a marginal market share, indeficit markets alone, can be captured.
�A grinding unit in Africa, sourcing clinker from India, is also not very competitive on account of the high clinker freight.
�An integrated unit in Africa makes it a local player, thereby increasing its competitiveness in the market. It can capture a higher market share and achieve higher penetration in the domestic market.
�As compared to India, risks are possibly higher in Africa. However, so too are the returns. Risk mitigation can possibly be achieved through local partnerships.

Dubai 2011HOLTEC
Contact InformationContact InformationContact InformationContact Information
Web: www.holtecnet.com
E-Mail : [email protected]
Address: Holtec Centre, A Block Sushant Lok Phase I,
Gurgaon 122 001, India
Telephone : +91 - 124 - 2385095, 2392940, Extension 554
Mobile : +91 - 9810139149
Thank you for your attention !Thank you for your attention !Thank you for your attention !Thank you for your attention !