final draft - hzg · (harms and schilling 2008). v) newspapers and journals usually contained...
TRANSCRIPT
Final Draft of the original manuscript: Brazdil, R.; Dobrovolny, P.; Luterbacher, J.; Moberg, A.; Pfister, C.; Wheeler, D.; Zorita, E.: European climate of the past 500 years: new challenges for historical climatology In: Climatic Change ( 2010) Springer DOI: 10.1007/s10584-009-9783-z

European climate of the past 500 years: new challenges for historical climatology
Rudolf Brázdil1, Petr Dobrovolný1, Jürg Luterbacher2, Anders Moberg3, Christian Pfister4,
Dennis Wheeler5, Eduardo Zorita6
1Institute of Geography, Masaryk University, 611 37 Brno, Czech Republic 2Department of Geography, Justus-Liebig University, Giessen, Germany 3Department of Physical Geography and Quaternary Geology, Stockholm University, Sweden 4Oeschger Center for Climatic Change Research/Institute of History, University of Bern,
Unitobler, 3000 Bern 9, Switzerland 5University of Sunderland, Sunderland, SR1 3PZ, UK 6GKSS Research Centre, Geesthacht, Germany
Corresponding author:
Rudolf Brázdil
E-mail: [email protected]
Phone: +420-549493167
Fax: +420-549491487

Abstract. Temperature reconstructions from Europe for the past 500 years based on
documentary and instrumental data are analysed. First, the basic documentary data sources,
including information about climate and weather-related extremes, are characterised. Then,
the standard palaeoclimatological reconstruction method adopted here is discussed with
particular application to temperature reconstructions from documentary-based proxy data. The
focus is on two new reconstructions; January–April mean temperatures for Stockholm (1502–
2008), based on a combination of data for the sailing season in the Stockholm harbour and
instrumental temperature measurements, and monthly Central European temperature (CEuT)
series (1500–2007) based on documentary-derived temperature indices of the Czech Republic,
Germany and Switzerland combined with instrumental records from the same countries. The
two series are compared and analysed using running correlations and wavelet analysis. While
the Stockholm series shows a pronounced low-frequency component, the CEuT series shows
much weaker low-frequency variations. Both series are further analysed with respect to three
different long-period reconstructions of the North Atlantic Oscillation and are also compared
with other European temperature reconstructions based on tree-rings, wine-harvest data and
various climate multiproxies. Correlation coefficients between individual proxy-based series
show weaker correlations compared to the instrumental data. There are also indications of
temporally varying quality of the various proxy records. The two temperature reconstructions
have also been compared to geographically corresponding temperature output from
simulations with global and regional climate models for the past few centuries. On the one
hand, the analysis reinforces the hypothesis that the index-data based CEuT reconstruction
may not appropriately reflect the centennial scale variations. On the other hand, it is possible
that climate models may underestimate regional decadal variability. Finally, the results are
discussed from a broader point of view and attention is drawn to some new challenges for
future investigations in historical climatology in Europe.
Key words: historical climatology – instrumental data – documentary data – temperature
reconstruction – Europe
2

1 Introduction
Europe can be rightly regarded as the cradle of instrumental meteorological observations. This
can be primarily attributed to the development of the first instruments by Galileo Galilei
(1564–1642) and his students and successors in Italy; a development that was then stimulated
by the establishment of networks of cooperation between European meteorologists. For
example, Rete Medicea, the first European network of meteorological stations, had begun its
activities with ten stations in 1653–1654 (Camuffo 2002). In the second half of the 17th
century, further meteorological observations began in several other places, some of them still
in use today. It was on the basis of such undertakings that the temperature series for Central
England could be constructed from as early as 1659 (Manley 1974; Parker et al. 1992; Jones
and Hulme 1997; Jones 1999), with a corresponding precipitation series for Kew, England
from 1697 (Wales-Smith 1971). Also notable are a Paris precipitation series from the 1680s
(Slonosky 2002) and long temperature and pressure series for Paris and London (Legrand and
LeGoff 1992; Pfister and Bareiss 1994; Slonosky et al. 2001). Many other European
meteorological stations started observations during the 18th century (Jones 2001; Camuffo
and Jones 2002; Auer et al. 2007).
Such notable endeavours notwithstanding, meteorological information is by no means
absent for earlier periods. Investigations into pre-instrumental climate patterns need however
to take advantage of the proxy information contained in natural and man-made archives. Man-
made proxies consist largely of documentary evidence, which is used as a basis for research in
historical climatology (e.g. Brázdil 2000, 2003; Glaser 2001, 2008; Pfister 2001; Brázdil et al.
2005b; de Kraker 2006; Jones 2008; Pfister et al. 2008) – a research field recently defined as
being situated at the interface between climatology and (environmental) history and dealing
mainly with documentary evidence using methods from both climatology and history. One of
its objectives includes the reconstruction of temporal and spatial patterns of weather and
climate as well as the study of climate-related natural disasters for the centuries before the
establishment of national meteorological networks (Pfister et al. 2001, 2008; Brázdil et al.
2005b).
Over recent years several new temperature reconstructions have been published based
fully or partly on documentary data not already cited in the overview paper by Brázdil et al.
(2005b). While many of the previous reconstructions suffered from statistically incomplete
calibration and verification procedures within the instrumental period (Pfister 1984, 1992;
Brázdil 1996; Pfister and Brázdil 1999; Bullón 2008), these new reconstructions benefit from
3

a more rigorous application of such approaches to overlapping periods of documentary and
instrumental data (Leijonhufvud 2008, this issue; Dobrovolný et al. 2008, this issue).
This paper presents in the following section a discussion of known types and
properties of documentary evidence that include information about weather and climate in
Europe over the past 500 years. The third section deals with the generation of documentary-
based climate series, whereas section four focuses upon a new approach of developing
temperature reconstructions based on documentary data. The fifth section deals with the
examples of the Stockholm and Central European temperature reconstructions, their statistical
properties, inter-comparisons between the different, but mostly independently-derived,
reconstructions, and relations with different North Atlantic Oscillation Index (NAOI)
reconstructions. The last section discusses the overall nature of the various findings and
identifies new research challenges for historical climatology.
2 Types and properties of documentary evidence
Basic sources of documentary data worthy of note as sources of evidence of climate variations
for the past 500 years in Europe include those identified by Pfister (1984, 1999), Pfister et al.
(1999a, 2008), Glaser (2001, 2008), Brázdil et al. (2005b) and Garcia-Herrera et al. (2005).
When dealing with documentary evidence it is important to distinguish between two types of
data – direct and indirect – both of which are needed for the successful reconstruction of
monthly and seasonal climate, albeit in different ways. Direct data are narratives describing
the course of weather and climate per se, often including accounts of the societal impacts of
extreme events and their perception by communities and authorities. Indirect data, on the
other hand, refer to physically based phenomena associated with weather and climate such as
plant and animal life cycle events or ice and snow seasonality features. The assumed
relationship between such effects is not always apparent from the record and needs therefore
to be statistically investigated when it occurs within the instrumental period (e.g. Pfister 1984,
1992, 1999; Leijonhufvud et al. 2008, this issue).
Another important distinction within the field of documentary evidence relates to the
manner in which the sources were generated. A historical climate-relevant source is, in a
general sense, a unit of information such as a manuscript, a piece of printed matter (book,
newspaper etc.), a picture or an artefact (e.g. flood mark). With respect to source generation
however, Pfister et al. (2008) draws an important distinction between individual and
institutional sources, because those categories have very different properties. Sources
produced by individuals are unique and idiosyncratic in the sense that they are shaped by the
4

social background, the motivations and preferences of their authors. This source category
comprises therefore a notable variety of evidence: Moreover, their temporal scope is limited
to the life time of the observer and the merging of one such source with another to produce a
long series presents a number of challenges. Official series, produced by governments or other
bodies such as the church, are different in providing the possibility of long series of
reasonably consistent records embracing periods of time far longer than that of a single
human being.
A: individual sources
i) Annals, chronicles, memorial books and memoirs may contain descriptions of weather
and related phenomena with inevitably varying degrees of detail together with reports on a
range of non-climatological events such as wars, diseases, miracles etc. Chroniclers usually
supplemented their descriptions with reflections on the observed departures of plant-
phenological phases or other features of seasonality such as snow or ice from those in
“ordinary years”. The rhythm of the agricultural year was a widely-understood frame of
reference in agrarian societies (Pfister 1999) and departures from its normal pattern could be
readily discerned and provided important experiential material for chroniclers (Mauelshagen
2008). It is, however, recognised that the quality and accuracy of any such record depends on
the intellectual level of the writer and particularly whether he or she was an eye-witness to the
events described.
ii) Daily weather observations were recorded by their authors more or less regularly in
ephemerides, calendars and personal diaries. As well as descriptions of the weather, they also
include information about weather-related extremes and their societal consequences (Pfister et
al. 1999b; Limanówka 2001; Brázdil et al. 2003a, 2008a; Gimmi et al. 2007).
iii) Private correspondence may contain information about weather and related extremes if
the situation concerned the author of the letter in some way or excited their interest (Retsö
2002).
iv) Illustrated broadsheets (i.e. one-sided prints) were often printed and distributed on the
occasion of disastrous or remarkable weather-related events such as floods or windstorms.
These circulars (the forerunners of today’s newspapers) were issued mostly by private
individuals to satisfy a public demand but on occasion might be the result of official activity
(Harms and Schilling 2008).
v) Newspapers and journals usually contained descriptions of unusual weather or weather-
related extremes including information about their contemporarily understood causes and
consequences for the community. They may also publish early instrumental measurements
5
and might therefore be of particular value because the original records are often lost (Brázdil
et al. 2005c).
vi) Pictorial evidence (paintings, etchings, photographs) represents climate-related
phenomena (e.g. glacier position), weather-related disasters and specific landscapes. For
example, pictorial representations of historic glaciers may allow reconstructions to be made of
the former extension and volume of the ice, sometimes with a time resolution of years (e.g.
Nussbaumer et al. 2007). However, caution needs to be exercised since paintings in particular
are often reflections of the author’s imagination rather than a true representation of events.
vii) Stall-keepers’ and market songs often describe and recall extreme events such as a flash
flood after a thunderstorm or torrential rain. Such occurrences excited popular interest as a
result of their spectacular and dramatic nature, occasionally high death toll and the severe
damage on a local or regional scale. Although they may describe the event, its occurrence and
impacts, critical evaluation of the risk of distortion of reality contained in such archives
(licentia poetica) is essential (Brázdil et al. 2005a).
viii) Early scientific papers and communications often contain information about weather
and related extremes, their occurrence, causes and impacts (Katzerowsky 1886).
ix) Epigraphic sources usually consist of marks or comments chiselled into stone or marked
on houses, bridges, gates, or ancient trees. They often show the level of extremely high (or
low) water and river levels (Munzar et al. 2006; Macdonald 2007) or recall some unusual
occurrence such as someone’s death by lightning or flash flood.
x) Early instrumental meteorological observations started in some places long before the
establishment of national meteorological services in the 19th century. They may contain data
about air pressure and temperature, precipitation, wind direction, cloudiness and the
occurrence of meteorological phenomena, but technical details on instrumentation and
exposure essential for their homogenisation are often absent (Pfister, 1978; Brázdil et al.
2002, 2005c; Moberg et al. 2003; Können and Brandsma 2005).
B. Institutional sources
Sources produced by institutions (e.g. hospitals, bishoprics, municipalities, military or civil
authorities etc.) constitute the second category of documentary evidence. Institutional bodies
were typically not interested in describing climate but they often kept records in order to
document their activities in case of auditing or enquiry. The administrative routines involve
some standardisation in the way records were kept, which is a prerequisite for an acceptable
degree of homogeneity. Most importantly, institutions unlike individuals often worked in the
6
same way for centuries and in doing so they generated very long records (Pfister et al. 2008).
The following categories can be distinguished:
i) Books of account are usually related to recurrent activities such as the control or the
accounting of receipts and expenditures (in money or in kind). By-products of accounting
activities, in particular remarks related to the date of receipts (e.g. the start of the vine or grain
harvest) or expenditures (e.g. expenses for day labourers engaged in a specific agricultural
activity) or maintenance operations (e.g. ice cutting on waterways, snow clearing), yield long
time series of valuable physically based proxies (Pfister 1992; Brázdil and Kotyza 2000;
Chuine et al. 2004; Meier et al. 2007; Rutishauer et al. 2007; Brázdil et al. 2008b;
Leijonhufvud, this volume). Slightly different are the written accounts on the organization of
rogations and systems of prayer in the Catholic world. These provide evidence of climatic
stress giving rise to processions and other religious rituals conducted to alleviate droughts or
spells of extreme weather (Piervitali and Colacino 2001; Barriendos 2005; Dominguez-Castro
et al. 2008).
ii) Reports on weather damage related to claims for tax or similar alleviations appeared
when crops were heavily damaged due to inclement weather such as hail, flood, torrential rain
or windstorm prior to the harvest. In such situations taxpayers might apply for a proportional
tax rebate which might be conceded after inspection and the production of yet more
documentary evidence. Such reports may be preserved at different locations of the state
administration system from that of the village to regional or state level (Grove and Battagel
1983; Brázdil and Valášek 2003; García et al. 2003; Brázdil et al. 2003b, 2006).
iii) Official letters written as part of a regular reporting system. These may include letters
sent by estate administrators to the owners, in which they described serious weather events
that influenced the productive operation of the estate (Brázdil et al. 2003b). For example,
governors of the Venetian colonies in the Adriatic and Eastern Mediterranean had to report on
a regular basis to the authorities; importantly these reports were prepared in a consistent and
standard format thereby ensuring a notable degree of homogeneity (Grove and Conterio
1994).
iv) Ship logbooks are the most important institutional source yielding direct observations on
wind direction, wind force and weather for the world’s oceans and seas wherever trade and
imperial interests took the ships of the age (Wheeler 2006; Wheeler and Garcia-Herrera 2009;
Wheeler et al. this issue). Before the mid-nineteenth century the observations were almost
entirely non-instrumental in character, but their keeping was a near-universal requirement of
the military or merchant undertaking to which the ship belonged. The documents provided the
7

only official record of the voyage but, importantly, were prepared to a common vocabulary
within each language and to common standards of observation and recording.
Researchers attempting to work with any of the documentary data here described
should become familiar with certain caveats and pitfalls related to this type of evidence. In
order to avoid them, the historian’s traditional requirements for the critical evaluation of
sources need to be followed. The critique of sources attempts to find out why they were
produced, when and by whom. With regard to individual sources, the key issue is to
distinguish between observations contemporary to the event and those copied from other
sources. In particular, caution is needed when working with uncritical compilations (e.g.
Weikinn 1958–2002; Réthly 1962–1999), which contain different reports that are in some
cases far from exact or even credible. Non-contemporary observations are often misdated and
this may entail the spurious multiplication of extreme events (for a critique of such sources
see e.g. Bell and Ogilvie 1978; Brázdil et al. 2005b; Pfister et al. 2008). Therefore, at least
one contemporary observation is needed for a valid climatic reconstruction of a month or a
season. Non-contemporary observations should only be used if they broadly agree with an
already existing contemporary observation (Pfister 1984). With regard to contemporary
individual sources the personal motivation and social background of the chronicler needs to
be considered besides the analysis of the text itself. When dealing with institutional proxy
data, changes in the administrative, social and ecological framework generating the proxy
needs to be investigated to make sure that it provides the same signal throughout the existence
of the institution (Pfister et al. 2008). Sophisticated statistical analysis can be undertaken only
for the 19th and 20th century, when abundant instrumental data are available (Meier at al.
2007). For other times different approaches are required.
3 Production of documentary-based climatic series
It follows from the previous sections that historical climatology deals with a notable variety of
documentary data that differ not only in terms of the phenomena that they describe but differ
also in their temporal scales of resolution that from hours, through days and months to
seasons. Overall however the quality and density of the documentary evidence increases
forwards in time until the beginning of the instrumental period. After primary extraction and
processing of these data in whatever form they are presented, the interpreted evidence can be
used to create one of two types of climatic series both of which can be used for further climate
reconstructions:
(i) (bio)physically-based proxies
8
The description of extreme events in individual sources is often supported by (bio)physically
based proxies which permit the comparison of such descriptions over long time intervals.
Long continuous series of (bio)physical proxies are obtained from institutional sources
including books of account (Pfister et al. 2008). Dates of different agricultural activities such
as the beginnings of grain or wine harvests, which have been kept over several centuries,
belong to this group (e.g. Pfister 1992; Brázdil and Kotyza 2000; Chuine et al. 2004; Meier et
al. 2007; Brázdil et al. 2008b). Another example is the proxy evidence of winter temperatures
related to dates of the opening of northern harbours after winter freezing (Jevrejeva 2001;
Tarand and Nordli 2001; Leijonhufvud et al. 2008, this issue), and information about the
beginning and end dates of freezing on rivers, lakes (Kajander 1993; Nordli et al. 2007) and
canals (van den Dool et al. 1978). When biophysically-based proxies cannot be formulated
into a continuous temperature series, they may be nonetheless be used as objective
information to assist in the creation of other climate index series.
(ii) climate (temperature, precipitation) indices
Depending on the quantity and quality of the raw information, a graded scaling system can be
used to express the derived evidence in an ordinal number system. Simple (unweighted)
indices employing a three-term classification are often applied: months being classified as
index –1 (cold or dry), 0 (normal) and 1 (warm or wet). More sophisticated are weighted
indices which use a seven-term classification for months (temperature: –3 extremely cold, –2
very cold, –1 cold, 0 normal, 1 warm, 2 very warm, 3 extremely warm; and for precipitation:
–3 extremely dry, –2 very dry, –1 dry, 0 normal, 1 wet, 2 very wet, 3 extremely wet).
Seasonal or annual indices may be obtained by summation of monthly values (i.e. the three-
month seasonal values can fluctuate from –9 to 9 and annual values even from –36 to 36; see
Pfister 1984). A different classification into ordinal numbers on other scales has, however,
occasionally been used (Wang et al. 1991; Koslowski and Glaser 1999; Rodrigo et al. 1999;
van Engelen et al. 2001; Diodato 2007). (Bio)physically-based proxies can be used as
objective information from which weighted temperature and precipitation index series can be
produced.
The creation of monthly indices presents however a significant challenge, requiring a
broad statistical and dynamical understanding of the evidence base in addition to a deep
knowledge of the regional climates and familiarity with the strengths and weaknesses of each
source. The approach known as “weather hind-casting” is most straightforward. It focuses
upon the evidence for a specific season (e.g. winter) and proceeds in descending
chronological order beginning with the most recent and usually best documented winter.
9

Subsequently, the more ancient winters are interpreted for which the information is usually
more fragmentary. The other three seasons, or the individual months, can be treated in the
same way (Pfister 1999).
An index value for a particular time point is derived from contemporary reports
comprising all the interpretational indicators needed such as date, time, location, code, author,
source quality etc. The original source text needs to be archived itself and related to the code
to check for reliability. The processing of the information involves coding the evidence
according to an agreed scheme, sorting it in the chronological order and according to
classification, region etc. (Pfister and Schüle 1994; Dietrich-Felber 2004). Such reports can be
generated with the use of commercial data-base software or by specially designed information
systems such as CLIMDAT (http://mitglied.lycos.de/mili04/index.html), HISKLID
(http://www.hisklid.de/) or EURO-CLIMHIST (http://www.euroclimhist.com/).
A high degree of expertise is essential to minimise subjectivity in the process of
transforming the information in narrative accounts to numbers on a scale. Moreover, practical
issues may complicate matters yet further:
- missing data: documentary data may be missing for some months or the character of the
information does not allow for reliable interpretation in terms of temperature and precipitation
indices
- bias in observer focus on the weather over the course of the year: observers often paid
greater attention to more strongly expressed weather contrasts or indicators (e.g. heavy frosts,
severe heat-waves) and to seasons which were economically important for agriculture or other
activities
- extreme values: the selection of any ordinal scale does not allow a quantitative expression of
the most severe extremes that are typical of the very high deviations that can occur from
normal weather patterns (weighted temperature indices +3 and -3 should be supported by
(bio)physically based proxies if possible)
- “normal” weather patterns: authors of records described the weather with respect to their
own perceptions derived from the period in which they lived, i.e. each one of them had a
different concept of what constituted “normal”; a concept that cannot be adequately reflected
in the indices
- non-climatic signals: changes related to non-climatic causes may be wrongly interpreted as
climatologically forced, e.g. those arising out of changes in the variety of plants, land-use,
agricultural practices.
10
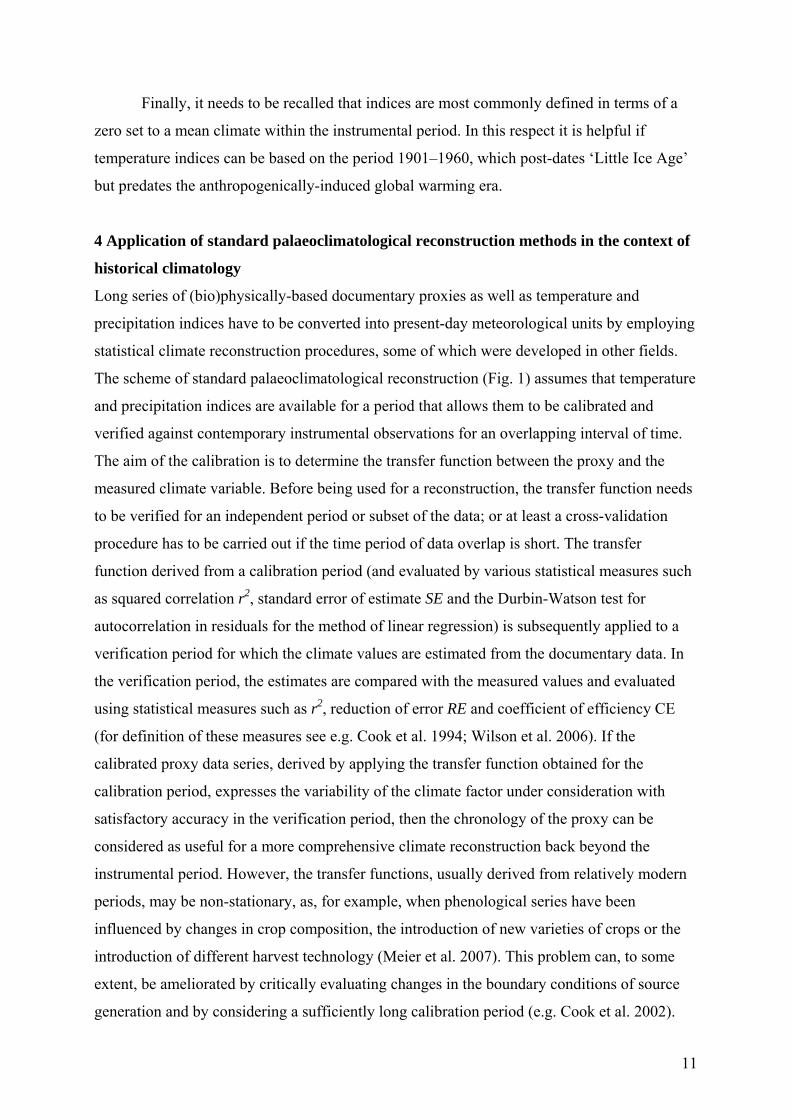
Finally, it needs to be recalled that indices are most commonly defined in terms of a
zero set to a mean climate within the instrumental period. In this respect it is helpful if
temperature indices can be based on the period 1901–1960, which post-dates ‘Little Ice Age’
but predates the anthropogenically-induced global warming era.
4 Application of standard palaeoclimatological reconstruction methods in the context of
historical climatology
Long series of (bio)physically-based documentary proxies as well as temperature and
precipitation indices have to be converted into present-day meteorological units by employing
statistical climate reconstruction procedures, some of which were developed in other fields.
The scheme of standard palaeoclimatological reconstruction (Fig. 1) assumes that temperature
and precipitation indices are available for a period that allows them to be calibrated and
verified against contemporary instrumental observations for an overlapping interval of time.
The aim of the calibration is to determine the transfer function between the proxy and the
measured climate variable. Before being used for a reconstruction, the transfer function needs
to be verified for an independent period or subset of the data; or at least a cross-validation
procedure has to be carried out if the time period of data overlap is short. The transfer
function derived from a calibration period (and evaluated by various statistical measures such
as squared correlation r2, standard error of estimate SE and the Durbin-Watson test for
autocorrelation in residuals for the method of linear regression) is subsequently applied to a
verification period for which the climate values are estimated from the documentary data. In
the verification period, the estimates are compared with the measured values and evaluated
using statistical measures such as r2, reduction of error RE and coefficient of efficiency CE
(for definition of these measures see e.g. Cook et al. 1994; Wilson et al. 2006). If the
calibrated proxy data series, derived by applying the transfer function obtained for the
calibration period, expresses the variability of the climate factor under consideration with
satisfactory accuracy in the verification period, then the chronology of the proxy can be
considered as useful for a more comprehensive climate reconstruction back beyond the
instrumental period. However, the transfer functions, usually derived from relatively modern
periods, may be non-stationary, as, for example, when phenological series have been
influenced by changes in crop composition, the introduction of new varieties of crops or the
introduction of different harvest technology (Meier et al. 2007). This problem can, to some
extent, be ameliorated by critically evaluating changes in the boundary conditions of source
generation and by considering a sufficiently long calibration period (e.g. Cook et al. 2002).
11
Nevertheless, it is impossible to fully evaluate the robustness of the transfer function solely
from the period of overlap between any proxy and instrumental data.
A detailed scheme of reconstruction using temperature indices based on documentary
evidence is shown in Fig. 2. The series of temperature indices is calibrated and verified using
instrumental temperatures in the overlapping period by linear regression. This also yields an
estimation of the explained variance in the reconstruction under the assumption of stationarity
over time. In the final stage, the calibrated index series is spliced with the instrumental series
to create one long and continuous time series. Error bars expressing the reconstruction
uncertainty (usually expressed as the unexplained variance within the instrumental calibration
period) in the proxy-data part are principally determined from the calibration statistics. This
approach has been applied in the calculation of the Prague-Klementinum temperature series
for 1718–2007 (Dobrovolný et al. 2008) and of the Central European temperature series for
1500–2007 (Dobrovolný et al. this issue).
The two new reconstructions introduced in other papers in this special issue
(Dobrovolný et al. this issue; Leijonhufvud et al. this issue) and being discussed here, are
based on a linear regression model (LRM) constructed with proxy data as the independent
variable (predictor) and instrumental temperature measurements as the dependent variable
(predictand). This calibration approach has the property of minimizing the prediction error of
the reconstruction, but it also leads to underestimation of the amplitude of the true but
unknown underlying temperature signal. To partly remedy this, palaeoclimatologists adjust
the variance of the reconstruction so that it becomes equal to that of the instrumental data in
the period of overlap; this is called ‘variance scaling’ (Esper et al. 2005). This approach was
applied to the two new reconstructions discussed here.
The availability of a period with sufficiently long overlap with an instrumental series
is critical to documentary-based reconstructions (as for any proxy series). With the onset of
the first instrumental measurements, mostly during the 18th century in Europe, some
traditional documentary sources gradually faded and were replaced with exclusively
instrumental data and therefore it is often difficult to assemble a sufficiently long
calibration/verification period. Even though some calibration approaches can be based solely
on recent measurements (Pfister 1992), independent comparison of proxy series with some
form of target measurements is a critical point for a standard palaeoclimatological
reconstruction (Cook et al. 1994). The existence of a sufficiently long period of data overlap
permits the use of conventional statistics and allows for the objective assessment of the
reconstruction skill of documentary proxies.
12

5 New climate reconstructions based on documentary data
5.1 Stockholm and Central European temperature series
Two new five-century long temperature series for Stockholm and Central Europe have been
developed using the approach described above, combining documentary and instrumental data
such that the calibration and verification is undertaken for reasonably time periods of data
overlap (Dobrovolný et al. this issue; Leijonhufvud et al. this issue). The documentary data
used for the Stockholm reconstruction belongs to the (bio)physical category, whereas the
Central European reconstruction is based on the climate index type of data (see above).
For the Stockholm case, the temperature reconstruction covers the months from
January to April (JFMA). The rationale is related to the geographic setting of Stockholm,
being located at the innermost part of an archipelago on the Swedish east coast of the Baltic
Sea at near 60ºN, where some amount of water is frozen each winter. The underlying
hypothesis for the JFMA temperature reconstruction is that the date of ice break-up in the
archipelago after each winter is strongly related to the mean temperature of the late winter and
early spring. Hence, information about the start of the sailing season each year has been
sought in historical documents; assuming that the start of sailing season is strongly associated
with the date of ice break-up (Leijonhufvud et al. 2008).
The start of the sailing season in the Stockholm harbour, derived from custom ledgers
and other documents related to port activities, was estimated for the period 1502 to 1892.
Several, partly overlapping, time series derived from these records were first standardized and
averaged. The resulting composite series was then calibrated and verified against Stockholm
JFMA instrumental temperatures over the overlapping period 1756 to 1892 (Leijonhufvud et
al. this issue). The instrumental observations were obtained from the old astronomical
observatory in the city, which has a record starting in 1756. The temperature series has
previously been homogenized with respect to changing observation hours, number of
observations per day, known instrumental errors and the urban heat island effect (Moberg et
al. 2002). After successful calibration and verification, the reconstruction for the period 1502–
1892 was adjusted to obtain the same mean and variance as the instrumental temperatures in
the overlapping period. Finally, the variance adjusted reconstruction was spliced with
instrumental temperatures for 1893–2008 (Leijonhufvud et al. this issue).
The other new temperature reconstruction discussed here is that for ‘Central Europe’
(henceforth CEuT). In this case, temperature index series were constructed for each month for
13
which data exist, using documentary data from Germany, Switzerland and the Czech
Republic. Monthly ‘national’ temperature index series were developed separately for each
country. These monthly index series were standardized and the three national series were
averaged to obtain a comprehensive Central European monthly temperature index series
covering the period 1500–1854. An overlap with instrumental temperature series from Central
Europe for the period 1760–1854 allowed the use of linear regression for calibration, followed
by calculation of generally strong verification statistics. Hence, it was possible to derive a
quantitative temperature reconstruction from documentary-based indices back to AD 1500.
The instrumental series used for calibration and verification was developed as an
average of 11 homogenized temperature series. Ten of these series are from the HISTALP
database (Auer et al. 2007) from Austria (Kremsmünster, Vienna-Hohe Warte, Innsbruck),
Switzerland (Basle, Geneva, Bern), Germany (Regensburg, Karlsruhe, Munich,
Hohenpeissenberg). The eleventh series is for the station Prague-Klementinum (the Czech
Republic). All eleven station series have been corrected for the bias of early thermometers
caused by the insufficient radiation shielding against direct radiation (see Böhm et al. this
issue), the intensification of the heat urban island effect and other sources of inhomogeneities
(Auer et al. 2007). The proxy-based reconstructions before 1760 were adjusted to have the
same mean and variance as the instrumental data over the overlapping period. Finally, the
variance scaled reconstruction for 1500–1760 was spliced with instrumental data for 1761–
2007 (Dobrovolný et al. this issue).
Because the proxy-data parts of the Stockholm and CEuT series were derived from
different types of documentary evidence (physically based seasonal proxies versus monthly
temperature indices), one may expect that these two reconstructions will differ especially in
the low-frequency domain. Fig. 3, which compares the two reconstructions for the JFMA
season, illustrates that there is somewhat higher variance (both at high- and low-frequency
domains) in the Stockholm data. This holds both for the instrumental part and the
documentary part of the records. Notably, however, in the pre-instrumental part there is
clearly more low-frequency variability in the Stockholm record compared to CEuT than what
might be expected from comparison of the instrumental parts of the two series. A pre-
instrumental period when the Stockholm series is notably warm relative to the CEuT series is
seen between the 1680s and 1760s. This period includes the warm 1730–1745 period
previously observed in northwestern Europe (Luterbacher et al. 2004; Xoplaki et al. 2005;
Jones and Briffa 2006). Cool periods around the 1570s and 1810s are expressed in both
reconstructions, but they are more pronounced for Stockholm.
14
It must be stressed that a part of the differences between the two reconstructions are
related to natural differences in temperature variability over Southern Scandinavia and Central
Europe. This is exemplified in Fig. 4 by showing the spatial correlation fields between mean
JFMA Stockholm data and gridded temperatures over Europe based on data for the period
1850–2007. Correlations between JFMA temperature variations at Stockholm and in Central
Europe can be expected to be from 0.5 to 0.7. Fig. 3d shows that correlations may be even
stronger in the instrumental period. A drop in correlations between the two series before 1900,
to near or below the 0.05 significance level, may be explained by the change from
instrumental to documentary data at 1892 in the Stockholm series. Further sharp decreases in
correlations between the series occur before 1560 and around 1640, going even into negative
values (see Fig. 3d). Such poor correlations can be explained, among other reasons, by poorer
data quality in these periods. However, other sub-periods of the documentary part of the
records (1575–1625 and 1670–1700) show quite strong and significant correlations indicating
that the correlation between the documentary data series can be nearly as high as in the
instrumental data. With only two series to compare, however, it is difficult to separate effects
from changing data quality and changes in the real temperature correlations between the
regions.
Further differences and similarities between the Stockholm and CEuT series can be
demonstrated by analyzing their frequency-dependent behaviour using suitable methods of
spectral analysis. One such method is wavelet analysis, which can be used to analyse both the
‘global’ spectral character over the entire time series and to provide information about
temporal changes in the spectrum (Torrence and Compo 1998).
Wavelet analysis of the two reconstructions (JFMA season in both cases) are shown in
Fig. 5. The global wavelets (right panels) clearly distinguish one difference between two
series; the Stockholm reconstruction has variance at the timescale of 256 years that
significantly exceed the level expected from a null hypothesis of a red noise spectrum,
whereas the variance in the CEuT series at the same timescale does not reach the 10%
significance level. Visual inspection of the full wavelet power spectra (left panels) reveals that
the Stockholm series has significant power at the 256-year scale consistently from the start to
the end of the record. The CEuT series, on the other hand, has significant power at the 256-
year scale in its instrumental part, but not in its documentary data part. Although this part of
the wavelet spectrum falls within the so-called cone of influence (where the analysis method
is uncertain due to the relative shortness of the records compared to the timescale of interest),
the result points to a difference in spectral character between the index-data based CEuT
15

series and the physical-based Stockholm series, which quantitatively reinforces the visual
difference seen in the time series plots in Fig. 3. This analysis alone is not sufficient to judge
if any of the two records has significant frequency-dependent biases, but our interpretation is
that the results point to a potential deficiency of the index-type of documentary evidence to
fully capture low-frequency temperature variability.
Among other observations that can be made in the wavelet power spectra, it can be
noted that there is no indication of any significant time-stable spectral peaks in either of the
two series. Moreover, the details of the wavelet spectra differ between the two series, which
illustrates a substantial degree of differences in regional climate variability between the
locations, in general agreement with the correlation map in Fig. 4, which shows correlations
of about 0.5 to 0.7 for JFMA; meaning that roughly only between 25 and 50% of the variance
is in common.
5.2 Comparison of the Stockholm and Central European temperature series with other
European reconstructions
To further illuminate the characteristics of the new Stockholm and CEuT reconstructions, they
can be compared with several previously available temperature or temperature-related
reconstructions from Europe. We have identified the following records with monthly to
annual resolution as interesting objects for comparison:
i) the seasonal Central European temperature series (henceforth LUT), 1500–2004, calculated
for the region 45–53º N and 5–18º E from the gridded temperature reconstructions by
Luterbacher et al. (2004, 2007) and Xoplaki et al. (2005). These datasets were created from
documentary and natural proxies for 1500–1658, a mixture of documentary data, natural
proxies and early instrumental records for 1659–1750 and solely from instrumental
temperature data from then onwards;
ii) the DJF, JJA and annual temperature series for the Low Countries, 764–1998, derived from
documentary evidence before 1706 and instrumental data thereafter by van Engelen et al.
(2001) and Shabalova and van Engelen (2003);
iii) the DJFM temperature series for Tallinn, 1500–1997, estimated from the first day of ice-
break up in the port of Tallinn and on the rivers in northern Estonia (1500–1756), combined
with instrumental temperature observations (after 1757), by Tarand and Nordli (2001);
iv) the Central England Temperature (CET) series, 1659–2005, compiled up to 1720 from
“the results of readings of highly imperfect instruments in uncertain exposures at a
considerable distance ... or on estimates based on interpretation of daily observations of wind
16
and weather” (Manley 1974) and followed by instrumental temperature records for Central
England from 1720 (Parker et al. 1992);
v) the winter ice severity index for the western Baltic, 1500–1997, derived from classified
values of accumulated areal ice volume along the German Baltic coast by Koslowski and
Glaser (1999);
vi) the April–September Western Europe temperature series, 1068–1987, for latitudes 35–55º
N and longitudes 10º W–20º E based on tree-ring widths, grape harvest dates, Greenland ice
oxygen isotope series and temperature indices derived from documentary data by Guiot et al.
(2005);
vii) the June–July Bavarian Forest/Austrian Alps temperature series, before 1500–1997,
created as a composite chronology from tree-ring widths measured in string instruments and
since 1800 from spruce Picea abies (Wilson and Topham 2004);
viii) the June–September temperatures of the European Alps, 755–2004, reconstructed from
larch Larix decidua Mill. tree-ring density series by Büntgen et al. (2006);
ix) the summer temperatures in the Hala Gąsienicowa (Tatra Mountains), 1550–2007,
reconstructed from tree-rings from the Tatras and the eastern Alps and compiled instrumental
series since 1791 by Niedźwiedź (2004);
x) the spring–summer Burgundy temperatures series, 1370–2003, reconstructed from records
of grape-harvest dates in the French region of Burgundy by Chuine et al. (2004);
xi) the April–August Swiss temperature series, 1480–2006, based on grape-harvest dates from
the Swiss Plateau region and north-western Switzerland by Meier et al. (2007).
Because some comparisons of the Stockholm and CEuT series with the above listed
other European series were presented already in the papers by Leijonhufvud et al. (this issue)
and Dobrovolný et al. (this issue), we do not repeat those graphical presentations here. Rather,
we focus on some new comparisons not shown elsewhere. Among the comparisons already
made in Dobrovolný et al. (this issue), we particularly draw the readers’ attention to the
detailed comparisons with the LUT series, which partly, and sometimes to a large extent,
share the original data with the new CEuT series. Therefore, the correlation coefficient is very
high between CEuT and LUT (for example, r = 0.93 for DJF and r = 0.85 for JJA).
Nevertheless, there are some notable differences between the two series which were discussed
by Dobrovolný et al. (this issue).
The spatial field of correlations between the CEuT series and gridded temperature data
across the whole of Europe is shown for the winter and summer seasons in the instrumental
period in Fig. 6. These maps can help to evaluate relations to other European reconstructions
17

including temporal stability of their relations as is presented below. As follows from
calculations of correlations fields for 30 year periods from 1851 to 2000 (not shown here), the
spatial patterns presented in Fig. 6 suggest relative stability.
As can be expected, the “winter” CEuT series shows weaker correlations when
compared with series farther to the north or north-east of Central Europe (Fig. 7a).
Correlations with the winter ice severity index of the western Baltic (Koslowski and Glaser
1999) are statistically significant (r = 0.65), with lowest values during the second half of the
19th century. The correlations with Stockholm and with the Tallinn reconstruction (Tarand
and Nordli 2001) are weaker (r = 0.45 and 0.36 respectively), but the two 31-year running
correlation sequences show a broadly similar picture, with correlations fluctuating around the
significance level, and sometimes even being negative before AD 1650. These fluctuations
cannot be explained by decreasing temperature correlations with increasing distance between
studied regions/stations alone; they are probably also related to weaknesses in the actual
reconstructions. For example, around AD 1600 the correlation with Stockholm is positive and
significant, whereas the correlation with Tallinn is clearly non-significant and even negative.
It points to a possibly poorer quality of the Tallinn record for this particular period, which
would call for further investigations of the raw data for a better understanding of the records.
Notable fluctuations in the running correlations are also seen in the comparison of the
“summer-half” CEuT series with reconstructions based on tree-rings (Niedźwiedź 2004:
Wilson and Topham 2004; Büntgen et al. 2006) (Fig. 7b). Correlations are mostly higher and
more time stable with reconstructions using wine harvest data (Chuine et al. 2004; Meier et al.
2007; r = 0.64 and r = 0.70) or based on multi-proxy data (Guiot et al. 2005; r = 0.65) (Fig.
7c) compared to those with tree-ring data (r between 0.41 and 0.46). The 31-year running
correlations between CEuT and the tree-ring-based series are often insignificant before 1800.
Notable decreases in correlations with the April–August Swiss grape harvest series also occur
albeit for rather short periods around 1750 and 1890 (the latter are similar to the April–
September multi-proxy series for Western Europe). Some differences in the series can
possibly be attributed to extreme years or seasons. However, it is difficult to establish the
extent to which some of the longer-term losses of coherence (e.g. in the 18th century when
CEuT is compared with tree-ring-based series, Fig. 7b) could be related to natural climate
variability or to the homogeneity and quality of proxy series.
5.3 The Stockholm and CEuT series and circulation indices
18
Luterbacher et al. (this issue) used long instrumental, documentary proxy and three-
dimensional climate model simulations to analyse the relations between European
temperature extremes and atmospheric circulation patterns. The strong relationship between
European winter climate and the atmospheric circulation allows the use of observed spatial
patterns of JFMA temperature extremes that occur within the period when instrumental sea
level pressure (SLP) data are available (1760–2007), as modern analogues, to independently
reconstruct SLP fields back to AD 1500 when widespread direct pressure information is not
available. It is found that cold European JFMA periods are related to positive SLP anomalies
in higher latitudes and below normal pressure in the south; a feature that resembles a strong
negative North Atlantic Oscillation Index (NAOI). The associated temperature anomaly
pattern indicates continental cold with the strongest negative anomalies over north-eastern
Europe and warm anomalies over Iceland and the south-eastern Mediterranean. Consistent
with the anomalous SLP distribution, reduced precipitation is found over large parts of
northern Europe and wetter conditions over parts of the Mediterranean (Luterbacher et al. this
issue).
To further illustrate some characteristics of the relationships between circulation and
temperature reconstructions, comparisons are made here of the Stockholm and CEuT series
with three reconstructions of NAO indices (NAOI); those by Cook et al. (2002), Luterbacher
et al. (2002), and Trouet et al. (2009). As shown in many papers (e.g. Hurrell 1995; Casty et
al. 2005; Hirschi and Sinha 2007; Beranová and Huth 2008; Brázdil et al. 2009), NAO effects
on temperatures in Central Europe are best expressed from December to March.
The reconstructed Stockholm JFMA temperatures often correlate positively and
significantly with DJF and MAM NAOI after Luterbacher et al. (2002) in several, but not
necessarily coincidental, periods. There is, however, a significant drop in correlation with
MAM NAOI after the mid-20th century down to negative values (Fig. 8a). As the Luterbacher
et al. (2002) NAOI is available for the JFMA season from 1659, it is possible to compare with
Stockholm for an identically defined season. Correlations have been found to be statistically
significant for the whole period with exception of the short interruption after 1700.
Nevertheless, the observed recent drop of correlation between Stockholm JFMA
temperatures and MAM NAOI indicates a change in the influence of NAO on spring
temperatures in southern Sweden about half-a-century ago. Correlations at the same weak, or
even negative, level in the 16th century may perhaps reflect similar climatic conditions as at
the present, but poorer data quality must be suspected as the primary reason.
19
The CEuT series show very high and time-stable positive correlations with the
Luterbacher et al. (2002) NAOI for three of the seasons (MAM, SON and DJF) before 1750
(Fig. 8b). As correlations for these seasons are notably weaker and also less timely stable in
the instrumental period, one must suspect that the high pre-1750 correlations can be related to
use of some identical proxies in both reconstructions (of NAOI by Luterbacher et al. 2002 and
CEuT). More complicated are correlations in summer with change from negative values
before 1660 to positive correlations afterwards, even statistically significant around 1800. But
negative correlations occurred also in the instrumental period (approximately between 1890
and 1940).
A comparison of the Stockholm and CEuT series (here for the JFMA season) with the
DJFM NAOI by Cook et al. (2002) provides further information. In particular, the Cook et al.
(2002) NAOI is based on a wholly different dataset to Luterbacher et al. (2002), and can be
considered as independent from CEuT. The running correlations in Fig. 8c show two distinct
parts for both series. Correlations are mostly non-significant before 1750 (documentary-based
part of temperature reconstructions) and often significant after that time (mixed documentary-
based and instrumental part for Stockholm series and only instrumental part for CEuT series).
After 1750, the correlation of the Cook et al. (2002) NAOI with Stockholm temperatures is
systematically stronger than with CEuT. However, weaker correlations are typical also for the
second part of the 19th century (both Stockholm and CEuT).
Weaker correlations are seen when the two temperature reconstructions are compared
with the Trouet et al. (2009) NAOI; the running 101-year correlation coefficients are only
episodically above the significance level (Fig. 8d). This is a consequence of the fact that this
NAOI express decadal fluctuations instead of year-by-year variability that is strongly
represented in both of the above temperature reconstructions.
Besides the possible data quality problems typical for all proxy-based reconstructions,
the existence of periods with weaker correlations in the modern period (e.g. Jacobeit et al.
2001; Slonosky and Yiou 2002; Jones et al. 2003; Casty et al. 2005) suggest that there can be
similar temporal instabilities in relations between NAOI and European winter temperatures
further back in time. Such inconsistencies complicate the interpretation of the proxy data in
terms of separating real changes in climate behaviour versus changes in data quality. Clearly,
more long proxy records of good quality are needed to improve our understanding of climate
variations and our ability to distinguish between true climate variations and artificial
variations in data properties.
20
6 Discussion and conclusions
The paper by Brázdil et al. (2005b) was devoted to an appraisal of the state of the art of
historical climatology in Europe as it was characterised at the time of writing, and following
developments in this field up to the early 2000s. Now, and although only a few years have
passed since that paper was written, substantial progress has been made in historical
climatology as is evidenced by several papers in this special issue and further references. In
particular, attention can now be drawn to the completion and development of existing and
new documentary databases and to the successful application of standard palaeoclimatological
calibration and verification methods in the preparation of climate (temperature or
precipitation) reconstructions derived from documentary evidence. The latter can,
importantly, be shown to be comparable with reconstructions based on other, longer-standing,
natural proxies. Moreover, the possibility of obtaining a temporal resolution down to
individual months (and even days) and subsequent seasonal combinations of these data
singles out documentary sources as being uniquely valuable in palaeoclimatological studies.
The reliability of proxy-based temperature (or any climate variable) reconstructions is
however dependent on the length and quality of instrumental series used for calibration and
verification of the transfer functions. Additionally, the instrumental data need to be adjusted
where necessary to eliminate possible inhomogeneities in these series (Peterson et al. 1998;
Brandsma and Können 2005; Della-Marta and Wanner 2006; Štěpánek et al. 2009). Such
procedures are important to avoid the inclusion of any non-climatic signal in the
reconstructions. An example is the need to eliminate any intensified urban heat island signal
due to the growth of cities (Brázdil and Budíková 1999; Brandsma et al. 2003; Stone 2007).
Moreover, when developing temperature reconstructions, one needs also to recognise what
has become known as the ‘early instrumental paradox’ where reconstructions based on
proxies reflecting summer temperatures depict cooler conditions than shown by instrumental
observations before the mid-to-late 19th century (Moberg et al. 2003; Böhm 2005; Frank et al.
2007). The relatively higher instrumentally-based temperatures are probably a consequence of
summer season thermometer over-exposure to radiation in the years before the invention of
the Stevenson screen. Analysis of 32 stations from the Greater Alpine Region by Böhm et al.
(this issue) demonstrated, for example, that mean April–September temperatures before 1850
have to be reduced by about 0.4°C as a result of this influence. Moberg et al. (2003),
undertaking a more preliminary and indirect study, concluded that summer temperatures at
Stockholm and Uppsala before the 1850s should probably be corrected even slightly more.
21

Reconstructed series should, for all the above reasons, be accompanied by uncertainty
estimates, preferably expressed in standard errors. Such estimates can be obtained from a
calibration period of overlap between proxy and instrumental data. However, it is sometimes
necessary to inflate the value of the standard error that is derived from calibration by taking
into account also factors that consider, for example, the changing number of replicated series
used in the construction of a proxy series or the mutual correlations between the constituent
proxy series. Moreover, there are various uncertainties specific to individual proxy types, as
well as those typical of documentary evidence, as discussed in Dobrovolný et al. (this issue).
Statistical methods for estimating errors are particularly well developed in dendroclimatology
(Cook et al. 1994; Briffa et al. 2002; Esper et al. 2007), but it has been demonstrated in this
special issue (Dobrovolný et al., Leijonhufvud et al.) that similar methods can be applied in
historical climatology.
The creation of long-term documentary-based temperature reconstructions also
provides the possibility of making comparisons with climate model simulations of the past
several centuries. Zorita et al. (this issue), for example, compares the JFMA temperatures for
Stockholm (Leijonhufvud et al. this issue) and seasonal and annual Central European
temperatures (Dobrovolný et al. this issue) with the temperature output of three climate
simulations with the global model ECHO-G and with the regional model RCA/FLAKE. The
Central European series, in contrast to the Stockholm reconstruction, shows weaker
agreement with model simulations at the relevant grid points, as regards the amplitude of the
low-frequency signal.
Although the amplitude of low-frequency variability in the ECHO-G simulations are
largely determined by the choice of forcing time series imposed on the model, the resulting
temperature field must anyway be regarded as physically consistent given the external forcing
imposed. Therefore, even if the simulations were unrealistic; the fact that the Central
European temperature reconstruction has weaker low-frequency variability than the
simulations, and the fact that the Stockholm reconstruction shows similar size of low-
frequency temperature variability as in the model, together with the observed weaker
variability at the bi-centennial scale in the documentary part (but not in the instrumental part)
of the Central European temperature series compared to Stockholm (see Figs. 3 and 5 ), may
indicate an inherent incapability of the index type of documentary data to capture low-
frequency variability compared to the (bio)physical type of documentary data. The problem
appears to be related to the fact that the authors of documentary records often described the
weather with respect to their own perception and experience and everyday understanding of
22

‘normal’ weather. This means that every one of them may have had a different concept of
what constituted such “normality”. However, this is not always a problem with descriptive
information, as some of the evidence used to derive temperature indices are more directly
physically based (e.g. dates of frost). Nevertheless, reconstructions based on the creation of
temperature indices necessarily involve some degree of subjectivity by the scientist who
transforms the raw information to the index form, and this may lead to poorly-placed ability
of the resulting reconstruction to express any low-frequency signal. This explanation is
compatible with the fact that the magnitude of the simulated and reconstructed interannual
variations is much more in agreement.
This situation may be partly improved if a particular reconstruction (which suffers
from a low-frequency variance problem) can be combined with other proxies in which low-
frequency signals are better preserved, for example series of phenophases, freezing of rivers
and lakes, ship logbook data, start of agricultural and viticultural harvests, etc.
Reconstructions based wholly on such long-term (bio)physically-based proxies may be
expected to be less influenced by low-frequency difficulties. But even in those cases there are
some unavoidable steps in the working process when, sometimes, more or less subjective
decisions have to be made in order to define the date of occurrence of an event of interest (e.g.
Chuine et al. 2004; Meier et al. 2007; Leijonhufvud et al. 2008, this issue).
On the other hand, there are also indications that model simulations may be
underestimating the decadal climate variability at regional scales. For instance, the warm
decades detected in several temperature reconstructions and early instrumental data around
1730 (e.g. Luterbacher et al. 2004; Xoplaki et al. 2005; Jones and Briffa 2006) are missing in
the model simulations, and seem not to be consistent with reconstructions of past external
climate forcing (solar variations or volcanic activity). This suggests possible deficiencies in
the ability of climate models to generate unforced (internal) regional climate variability, and
this possibility has to be taken into account in the projections of future regional climate.
Luterbacher et al. (this issue) have shown that the reconstructed patterns of the
extreme temperatures in late winter/early springs are in good overall agreement with the two
coupled climate models (ECHO-G and HadCM3). This suggests that the latter can be a useful
tool to provide approximate estimates of past large-scale fields related to extreme regional
climate variations in the absence of spatial details in the observational information. Further,
this agreement underscores a reasonable model skill, which is essential when simulating the
spatial pattern of extreme temperature and precipitation in future climate simulations. The
observed overall agreement between proxy/instrumental-based and simulated temperature
23
patterns also suggest that it is possible to constrain model states on the basis of the spatial
structure of anomalies observed in proxy data. This important feature supports the use of
documentary evidence in data assimilation experiments, which explicitly combines the
information in the proxy data with climate modelling efforts, as discussed by Luterbacher et
al. (this issue).
The preceding paragraphs and all the other papers included in this special issue
hopefully expose what recent and significant research efforts have been achieved in the
context of historical climatology of Europe for the past 500 years. Nevertheless, this field still
offers much potential for future research building upon the recent experiences. These can be
briefly itemised as follows:
(1) the revision of existing weather compilations, documentary datasets and their completion
drawing on new archival sources such as administrative records
(2) the creation of new temperature/precipitation index series based on documentary evidence
and completion of gaps in the existing series
(3) the further collection of documentary data for the periods of overlap with instrumental
records, thereby allowing for calibration/verification exercises using standard
palaeoclimatological methods
(4) the development and application of new methods for temperature/precipitation
reconstruction and calculation of associated uncertainties (error bars)
(5) whenever possible, the undertaking of direct comparison between reconstructions from the
same (or nearby) region(s), but derived separately from the index-type and the (bio)physical
type to improve understanding of the potential deficiency of index data to capture low-
frequency information
(6) the development of better homogenized long instrumental records for many sites,
including assessment and corrections for the warm bias in the early instrumental period
related to thermometer exposure
(7) the cross-checking of documentary data against temperature and precipitation
reconstructions and outputs of coupled climate model
(8) deepening of co-operation between environmental historians, climatologists and the
climate modelling community
(9) cross-checking and combining of reconstructions based on man-made and natural climate
proxies (tree-rings, speleothems, etc.).
A further comment should be made in connection with point 3 on the list above; there
are other good reasons to extend the documentary records to well within the instrumental
24

period than just for making the statistical calibration and verification. As pointed out by Jones
et al. (2009), the general lack of documentary data in the instrumental period is a severe
impediment to their use in gridded or large-scale mean climate reconstructions together with
other climate proxy data. Currently, when they have been used in such reconstructions, they
are generally represented by degraded temperature data to extend the series to the present, and
this may give a false sense of their reliability. Thus, to make documentary data records more
comparable with natural proxy records, it is desirable to extend the documentary series as far
up to the present as possible.
Lastly, it needs to be emphasised that Europe possesses a rich, diverse and extensive
collection of documentary evidence also for the climate before AD 1500, thereby opening the
possibility of extending some reconstructions and analysis to the period from the 12th century
(particularly with respect to Medieval Warm Anomaly), and sometimes even further back,
and broadening further horizons of historical climatology.
Acknowledgements
This work was undertaken within the EU FP6 Integrated Project no. 017008
European Climate of the Past Millennium (MILLENNIUM). Anders Moberg was also funded
by the Swedish Research Council, VR.
References
Auer I, Böhm R, Jurkovic A, Lipa W, Orlik A, Potzmann R, Schöner W, Ungersböck M,
Matulla C, Briffa K, Jones P, Efthymiadis D, Brunetti M, Nanni T, Maugeri M, Mercalli L,
Mestre O, Moisselin JM, Begert M, Müller-Westermeier G, Kveton V, Bochnicek O, Stastny
P, Lapin M, Szalai S, Szentimrey T, Cegnar T, Dolinar M, Gajic-Capka M, Zaninovic K,
Majstorovic Z, Nieplova E (2007) HISTALP – historical instrumental climatological surface
time series of the Greater Alpine Region. Int J Climatol 27:17–46.
Barriendos M (2005) Climate and culture in Spain. Religious responses to extreme climatic
events in the Hispanic Kingdoms (16th-19th centuries). In: Behringer W, Lehmann H, Pfister
C (eds) Cultural Consequences of the “Little Ice Age”, Vandenhoeck & Ruprecht, Göttingen,
pp 379–414.
Bell WT, Ogilvie AEJ (1978) Weather compilations as a source of data for the reconstruction
of European climate during the Medieval period. Clim Change 1:331–348.
25

Beranová R, Huth R (2008) Time variations of the effects of circulation variability modes on
European temperature and precipitation in winter. Int J Climatol 28:139–158.
Böhm R (2005) The early instrumental paradox. Presentation at the ALP-IMP third general
annual meeting. April 6-8th, Bologna.
Böhm R, Jones PD, Hiebl J, Brunetti M, Frank D, Maugeri M. (this issue) The early
instrumental warm-bias: A solution for long Central European temperature series 1760–2007.
Clim Change, accepted.
Brandsma T, Können GP (2005) Application of nearest-neighbor resampling for
homogenizing temperature records on a daily to sub-daily level. Int J Climatol 26:75–89.
Brandsma T, Können GP, Wessels HRA (2003) Empirical estimation of the effect of urban
heat advection on the temperature series of De Bilt (The Netherlands). Int J Climatol 23:829–
845.
Brázdil R (1996) Reconstructions of past climate from historical sources in the Czech Lands.
In: Jones PD, Bradley RS, Jouzel J (eds) Climatic Variations and Forcing Mechanisms of the
Last 2000 Years. Springer Verlag, Berlin Heidelberg New York, pp 409–431.
Brázdil R (2000) Historical climatology: definition, data, methods, results. Geogr Čas 52:99–
121.
Brázdil R (2002) Patterns of climate in Central Europe since Viking times. In: Wefer G,
Berger W, Behre KE, Jansen E (eds) Climate Development and History in the North Atlantic
Realm. Springer Verlag, Berlin Heidelberg New York Barcelona Hong Kong London Milan
Paris Tokyo, pp 355–368.
Brázdil R (2003): Historical climatology and its progress after 1990. In: Laszlovsky J, Szabó
P (eds) People and Nature in Historical Perspective. Central European University, Budapest,
pp 197–227.
Brázdil R, Budíková M (1999) An urban bias in air temperature fluctuations at the
Klementinum, Prague, the Czech Republic. Atm Environ 33:4211–4217.
Brázdil R, Chromá K, Dobrovolný P, Tolasz R (2009) Climate fluctuations in the Czech
Republic during the period 1961–2005. Int J Climatol 29:223–242.
26
Brázdil R, Černušák T, Řezníčková L (2008a) Weather information in the diaries of the
Premonstratensian Abbey at Hradisko, in the Czech Republic, 1693–1783. Weather 63:201–
207.
Brázdil R, Dobrovolný P (2009) Historical climate in Central Europe during the last 500
years. In: Przybylak R, Majorowicz J, Brázdil R, Kejna M (eds), The Polish Climate in the
European Context: An Historical Overview. Springer, in press.
Brázdil R, Dobrovolný P, Elleder L, Kakos V, Kotyza O, Květoň V, Macková J, Müller M,
Štekl J, Tolasz R, Valášek H (2005a) Historické a současné povodně v České republice
(Historical and Recent Floods in the Czech Republic). Masarkova univerzita, Český
hydrometeorologický ústav, Brno Praha, 370 pp.
Brázdil R, Kotyza O (2000) History of Weather and Climate in the Czech Lands IV.
Utilisation of Economic Sources for the Study of Climate Fluctuation in the Louny Region in
the Fifteenth–Seventeenth Centuries. Masaryk University, Brno, 350 pp.
Brázdil R, Pfister C, Wanner H, von Storch H, Luterbacher J (2005b) Historical climatology
in Europe – the state of the art. Clim Change 70:363–430.
Brázdil R, Valášek H (2003) Use of historic data in studying damage due to natural disasters
at the domain of Pernštejn in the period 1694–1718 and as a source of information for the
study of meteorological and hydrological extremes. Meteorol Čas 6:3–13.
Brázdil R, Valášek H, Chromá K (2006) Documentary evidence of an economic character as a
source for the study of meteorological and hydrological extremes and their impacts on human
activities. Geogr Ann 88A:79–86.
Brázdil R, Valášek H, Macková J (2003a) Climate in the Czech Lands during the 1780s in
light of the daily weather records of parson Karel Bernard Hein of Hodonice (south-western
Moravia): Comparison of documentary and instrumental data. Clim Change 60:297–327.
Brázdil R, Valášek H, Macková J (2005c) Meteorologická pozorování v Brně v první
polovině 19. století. Historie počasí a hydrometeorologických extrémů (Meteorological
observations in Brno in the first half of the 19th century. History of weather and
hydrometeorological extremes). Archiv města Brna, Brno, 452 pp.
Brázdil R, Valášek H, Sviták Z (2003b) Meteorological and hydrological extremes in the
Dietrichstein domains of Dolní Kounice and Mikulov between 1650 and 1849 according to
official economic records of natural disasters. Geogr Čas 55:325–353.
27

Brázdil R, Valášek H, Sviták Z, Macková J (2002) History of Weather and Climate in the
Czech Lands V. Instrumental Meteorological Measurements in Moravia up to the End of the
Eighteenth Century. Masaryk University, Brno, 250 pp.
Brázdil R, Zahradníček P, Dobrovolný P, Kotyza O, Valášek H (2008b) Historical and recent
viticulture as a source of climatological knowledge in the Czech Republic. Geografie – Sbor
Čes Geogr Spol 113:351–371.
Briffa KR, Osborn TJ, Schweingruber FH, Jones PD, Shiyatov SG, Vaganov EA (2002) Tree-
ring width and density data around the Northern Hemisphere: part 1, local and regional
climate signals. Holocene 12:737–758.
Brohan P, Kennedy JJ, Haris I, Tett SFB, Jones PD (2006) Uncertainty estimates in regional
and global observed temperature changes: a new dataset from 1850. J Geophys Res 111:
D12106.
Bullón T (2008) Winter temperatures in the second half of the sixteenth century in the central
area of the Iberian Peninsula. Clim Past 4:357–367.
Büntgen U, Frank DC, Nievergelt D, Esper J (2006) Summer temperature variations in the
European Alps, A.D. 755–2004. J Climate 19:5605–5623.
Camuffo D (2002) History of the long series of daily air temperature in Padova (1725–1998).
Clim Change 53:7–75.
Camuffo D, Jones P (eds) (2002) Improved Understanding of Past Climate Variability from
Early Daily European Instrumental Sources. Kluwer Academic Publishers, Dordrecht Boston
London, 392 pp.
Casty C, Wanner H, Luterbacher J, Esper J, Böhm R (2005) Temperature and precipitation
variability in the European Alps since 1500. Int J Climatol 25:1855–1880.
Chuine I, Yiou P, Viovy N, Seguin B, Daux V, Le Roy Ladurie E (2004) Historical
phenology: Grape ripening as a past climate indicator. Nature 432:289–290.
Cook ER, Briffa KR, Jones PD (1994) Spatial regression methods in dendroclimatology: A
review and comparison of two techniques. Int J Climatol 14:379–402.
Cook ER, D’Arrigo RD, Mann ME (2002) A well-verified, multiproxy reconstruction of the
winter North Atlantic Oscillation Index since A.D. 1400. J Climate 15:1754–1764.
28

Della-Marta PM, Wanner H (2006) A method of homogenizing the extremes and the mean of
daily temperature measurements. J Climate 19:4179–4197.
Dietrich-Felber U (2004) Using Java and XML in interdisciplinary research: A new data-
gathering tool for historians working with EuroClimHist. Hist Methods 37:174–185.
Diodato N (2007) Climatic fluctuations in southern Italy since the 17th century:
reconstruction with precipitation records at Benevento. Clim Change 80:411–431.
Dobrovolný P, Brázdil R, Valášek H, Kotyza O, Macková J, Halíčková M (2008) A standard
paleoclimatological approach to temperature reconstruction in historical climatology: an
example from the Czech Republic, AD 1718–2007. Int J Climatol, published online.
Dobrovolný P, Moberg A, Brázdil R, Pfister C, Glaser R, Wilson R, van Engelen A,
Limanówka D, Kiss A, Halíčková M, Macková J, Riemann D, Luterbacher J, Böhm R (this
issue) Monthly and seasonal temperature reconstructions for Central Europe derived from
documentary evidence and instrumental records since AD 1500. Clim Change, accepted.
Dominguez-Castro F, Santisteban JI, Barriendos M, Mediavilla R (2008) Reconstruction of
drought episodes for central Spain from rogation ceremonies recorded at the Toledo Cathedral
from 1506 to 1900: A methodological approach. Global Planet Change 63:230–242.
Esper J, Frank DC, Büntgen U, Verstege A, Luterbacher J, Xoplaki E (2007) Long-term
drought severity variations in Morocco. Geophys Res Lett 34:L17702.
Esper J, Frank DC, Wilson RJS, Briffa KR (2005) Effect of scaling and regression on
reconstructed amplitude for the past millennium. Geophys Res Lett 32:L07711.
Frank D, Büntgen U, Böhm R, Maugeri M, Esper J (2007) Warmer early instrumental
measurements versus colder reconstructed temperatures: shooting at a moving target. Quatern
Sci Rev 26:3298–3310.
García R, Macias A, Gallego D, Hernandez E, Gimeno L, Ribera P (2003) Reconstruction of
the precipitation in the Canary Islands for the period 1595–1836. Bull Amer Meteorol Soc 84:
1037–1039.
García-Herrera R, Können GP, Wheeler D, Prieto MR, Jones PD, Koek FB (2005) CLIWOC:
A climatological database for the world’s oceans 1750–1854. Clim Change 73:1–12.
Gimmi U, Luterbacher J, Pfister C, Wanner H (2007) A method to reconstruct long
precipitation series using systematic descriptive observations in weather diaries: the example
29
of the precipitation series for Bern, Switzerland (1760–2003). Theor Appl Climatol 87:185–
199.
Glaser R (2001) Klimageschichte Mitteleuropas. 1000 Jahre Wetter, Klima, Katastrophen.
Primus Verlag, Darmstadt, 227 pp.
Glaser R (2008) Klimageschichte Mitteleuropas. 1200 Jahre Wetter, Klima, Katastrophen.
Primus Verlag, Darmstadt, 264 pp.
Grove JM, Battagel A (1983) Tax records from western Norway, as an index of Little Ice Age
environmental and economic deterioration. Clim Change 5:265–282.
Grove JM, Conterio A (1994) Climate in the eastern and central Mediterranean, 1675 to 1715.
In: Frenzel B, Pfister C, Gläser B (eds) Climatic trends and anomalies in Europe 1675–1715.
Gustav Fischer Verlag, Stuttgart Jena New York, pp 275–286.
Guiot J, Nicault A, Rathegeber C, Edouard JL, Guibal F, Pichard G, Till C (2005) Last-
millenium summer temperature variations in western Europe based on proxy data. Holocene
15:489–500.
Harms W, Schilling M (2008) Das illustrierte Flugblatt der frühen Neuzeit: Traditionen,
Wirkungen, Kontexte. S. Hirzel Verlag, Stuttgart, 392 pp.
Hirschi JJM, Sinha B (2007) Negative NAO and cold Eurasian winters: How exceptional was
the winter of 1962/1963? Weather 62:43–48.
Hurrell JW (1995) Decadal trends in the North Atlantic Oscillation: regional temperatures and
precipitation. Science 269:676–679.
Jacobeit J, Jönsson P, Bärring L, Beck C, Ekström M (2001) Zonal indices for Europe 1780–
1995 and running correlations with temperature. Clim Change 48:219–241.
Jevrejeva S (2001) Severity of winter seasons in the northern Baltic Sea between 1529 and
1990: reconstruction and analysis. Clim Res 17:55–62.
Jones PD (1999) Classics in Physical Geography Revisited. Manley, G. 1974: Central
England temperatures: monthly means 1659–1973. Quarterly Journal of the Royal
Meteorological Society. Progr Phys Geogr 23:425–428.
Jones PD (2001) Early European instrumental records. In: Jones PD, Ogilvie AEJ, Davies TD,
Briffa KR (eds) History and Climate: Memories of the Future? Kluwer Academic / Plenum
Publishers, New York Boston Dordrecht, London Moscow, pp 55–77.
30
Jones P (2008) Historical climatology – a state of the art review. Weather 63:181–186.
Jones PD, Briffa KR (2006) Unusual climate in northwest Europe during the period 1730 to
1745 based on instrumental and documentary data. Clim Change 79:361–379.
Jones PD, Briffa KR, Osborn TJ (2003) Changes in the Northern Hemisphere annual cycle:
Implications for paleoclimatology? J Geophys Res 108:ACL 13-1 to 13-7.
Jones PD, Briffa KR, Osborn TJ, Lough JM, van Ommen TD, Vinther BM, Luterbacher J,
Wahl ER, Zwiers FW, Mann ME, Schmidt GA, Ammann CM, Buckley BM, Cobb KM,
Esper J, Goosse H, Graham N, Jansen E, Kiefer T, Kull C, Küttel M, Mosley-Thompson E,
Overpeck JT, Riedwyl N, Schulz M, Tudhope AW, Villalba R, Wanner H, Wolff E, Xoplaki
E (2009) High-resolution palaeoclimatology of the last millennium: a review of current status
and future prospects. Holocene 19:3–49.
Jones P, Hulme M (1997) The changing temperature of Central England. In: Hulme M,
Barrow E (eds) Climates of the British Isles: Present, Past and Future. Routledge, London
New York, pp 173–196.
Kajander J (1993) Methodological aspects on river cryophenology exemplified by a
tricentenniel break-up time series from Tornio. Geophysica 29:73–95.
Katzerowsky W (1886) Periodicität der Überschwemmungen. Mitteillungen des Vereines für
Geschichte der Deutschen in Böhmen 25:156–171.
Koslowski G, Glaser R (1999) Variations in reconstructed ice winter severity in the Western
Baltic from 1501 to 1995, and their implications for the North Atlantic Oscillation. Clim
Change 41:175–191.
Können GP, Brandsma T (2005) Instrumental pressure observations from the end of the 17th
century: Leiden (the Netherlands). Int J Climatol 25:1139–1145.
de Kraker AMJ (2006) Historical climatology, 1950–2006. An overview of a developing
science with a focus on the Low Countries. BELGEO 2006:307–337.
Legrand JP, LeGoff M (1992) Les observations météorologiques de Louis Morin entre 1670
et 1713. Monographie 6, Direction de la Météorologie Nationale, Paris, 128 pp.
Leijonhufvud L, Wilson R, Moberg A (2008) Documentary data provide evidence of
Stockholm average winter to spring temperatures in the eighteenth and nineteenth centuries.
Holocene 18:333–343.
31

Leijonhufvud L, Wilson R, Moberg A, Söderberg J, Retsö D, Söderlind U (this issue) Five
centuries of winter/spring temperatures in Stockholm reconstructed from documentary
evidence and instrumental observations. Clim Change, accepted.
Limanówka D (2001) Rekonstrukcja warunków klimatycznych Krakowa w pierwszej polowie
XVI wieku (Reconstruction of Climatic Patterns in Cracow During the First Part of the 16th
Century). Instytut Meteorologii i Gospodarki Wodnej, Warszawa, 176 pp.
Luterbacher J, Dietrich D, Xoplaki E, Grosjean M, Wanner H (2004) European seasonal and
annual temperature variability, trends and extremes since 1500. Science 303:1499–1503.
Luterbacher J, Koenig SJ, Franke J, van der Schrier G, Della-Marta PM, Jacobeit J, Küttel M,
Gonzales-Rouco FJ, Zorita E, Xoplaki E, Stössel M, Rutishauer T, Wanner H, Pfister C,
Brázdil R, Dobrovolný P, Camuffo D, Bertolin C, Moberg A, Leijonhufvud V, Soderberg J,
Allan R, Wilson R, Wheeler D, Barriendos M, Glaser R, Riemann D, Nordli O, Limanówka
D, van Engelen A, Zerefos CS (this issue) Circulation dynamics and influence on European
and Mediterranean winter climate over the past half millennium: results and insights from
instrumental data, documentary evidence and coupled climate models. Clim Change, in
revision.
Luterbacher J, Liniger MA, Menzel A, Estrella N, Della-Marta PM, Pfister C, Rutishauser T,
Xoplaki E (2007) The exceptional European warmth of autumn 2006 and winter 2007:
Historical context, the underlying dynamics and its phenological impacts. Geophys Res Lett
34:L12704.
Luterbacher J, Xoplaki E, Dietrich D, Jones PD, Davies TD, Portis D, Gonzalez-Rouco JF,
von Storch H, Gyalistras D, Casty C, Wanner H (2002) Extending North Atlantic Oscillation
reconstructions back to 1500. Atmos Sci Lett 2:114–124.
Macdonald N (2007) Epigraphic records: a valuable resource in re-assessing flood risk and
long-term climate variability. Environ Hist 12:136–140.
Manley G (1974) Central England temperatures: monthly means 1659 to 1973. Quart J R
Meteorol Soc 100:389–405.
Mauelshagen F (2008) Wunderkammer auf Papier. Die Wickiana zwischen Reformation und
Volksglaube. Studentendruckerei, Zürich.
32

Meier N, Rutishauser T, Pfister C, Wanner H, Luterbacher J (2007) Grape harvest dates as a
proxy for Swiss April to August temperature reconstructions back to AD 1480. Geophys Res
Lett 34:L20705.
Moberg A, Alexandersson H, Bergström H, Jones PD (2003) Were Southern Swedish summer
temperatures before 1860 as warm as measured? Int J Climatol 23:1495–1521.
Moberg A, Bergström H, Ruiz Kringsman J, Svanered O (2002) Daily air temperature and
pressure series for Stockholm (1756–1998). Clim Change 53:171–212.
Munzar J, Deutsch M, Elleder L, Ondráček S, Kallabová E, Hrádek M (2006) Historical
floods in Central Europe and their documentation by means of floodmarks and other
epigraphical monuments. Moravian Geographical Reports 14:26–44.
Niedźwiedź T (2004) Rekonstrukcja warunków termicznych lata w Tatrach od 1550 roku
(Reconstruction of summer temperature in the Tatra Mountains since 1550). In: Kotarba A
(ed) Rola małej epoki lodowej w przekształcaniu środowiska przyrodniczego. Tatr Prace
Geogr 197:57–88.
Nordli O, Lundstad E, Ogilvie AEJ (2007) A late winter-early spring temperature
reconstruction for Southeastern Norway from 1758–2006. Ann Glaciol 46:404–408.
Nussbaumer S, Zumbühl HJ, Steiner D (2007) Fluctuations of the Mer de Glace (Mont Blanc
area, France) AD 1500–2050 an interdisciplinary approach using new historical data and
neural network simulations. Zeitschrift für Glaziologie und Glazialgeologie 40:4–183.
Parker DE, Legg TP, Folland CK (1992) A new daily Central England temperature series. Int
J Climatol 12:317–342.
Peterson TC, Easterling DR, Karl TR, Groisman P, Auer I, Böhm R, Plummer N, Nicholis N,
Torok S, Vincent L, Tuomenvirta H, Salinger J, Førland EJ, Hanssen-Bauer I, Alexandersson
H, Jones P, Parker D (1998) Homogeneity adjustments of in situ atmospheric climate data: a
review. Int J Climatol 18:1493–1517.
Pfister C (1978) Die älteste Niederschlagsreihe Mitteleuropas: Zürich 1708–1754. Meteorol
Rdsch 31:56–62.
Pfister C (1984) Klimageschichte der Schweiz 1525–1860. Das Klima der Schweiz und seine
Bedeutung in der Geschichte von Bevölkerung und Landwirtschaft. Verlag Paul Haupt, Bern,
184 pp.
33
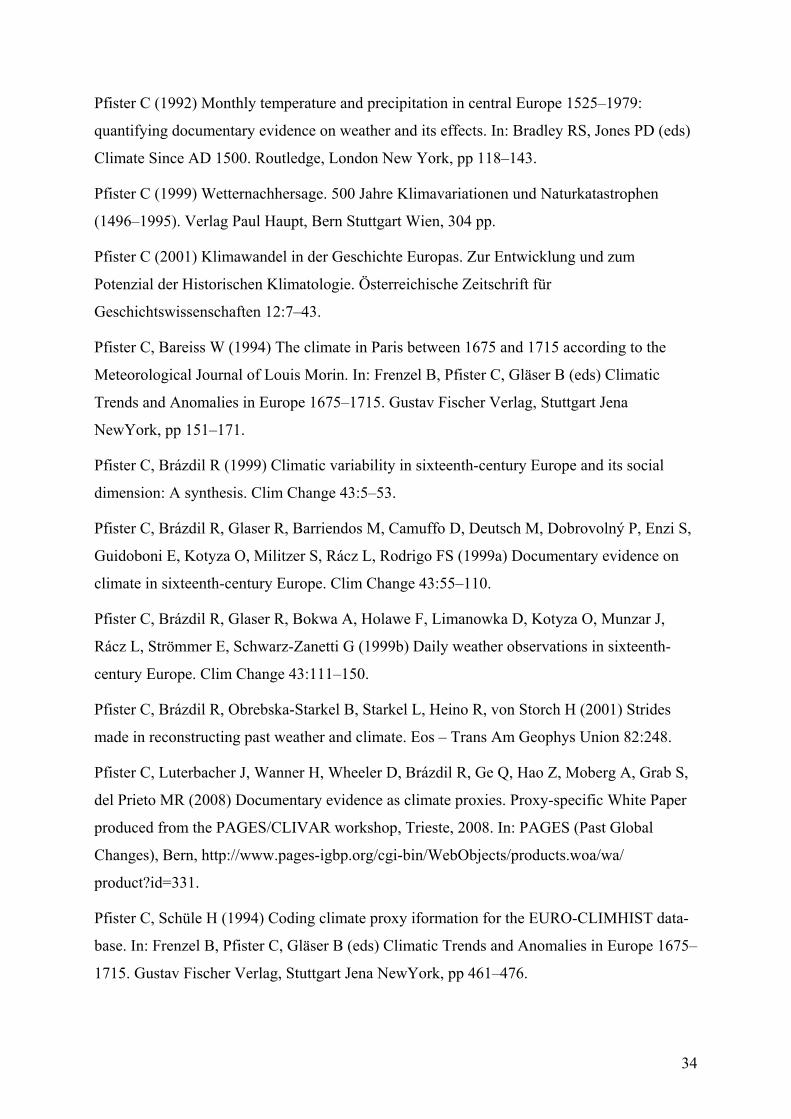
Pfister C (1992) Monthly temperature and precipitation in central Europe 1525–1979:
quantifying documentary evidence on weather and its effects. In: Bradley RS, Jones PD (eds)
Climate Since AD 1500. Routledge, London New York, pp 118–143.
Pfister C (1999) Wetternachhersage. 500 Jahre Klimavariationen und Naturkatastrophen
(1496–1995). Verlag Paul Haupt, Bern Stuttgart Wien, 304 pp.
Pfister C (2001) Klimawandel in der Geschichte Europas. Zur Entwicklung und zum
Potenzial der Historischen Klimatologie. Österreichische Zeitschrift für
Geschichtswissenschaften 12:7–43.
Pfister C, Bareiss W (1994) The climate in Paris between 1675 and 1715 according to the
Meteorological Journal of Louis Morin. In: Frenzel B, Pfister C, Gläser B (eds) Climatic
Trends and Anomalies in Europe 1675–1715. Gustav Fischer Verlag, Stuttgart Jena
NewYork, pp 151–171.
Pfister C, Brázdil R (1999) Climatic variability in sixteenth-century Europe and its social
dimension: A synthesis. Clim Change 43:5–53.
Pfister C, Brázdil R, Glaser R, Barriendos M, Camuffo D, Deutsch M, Dobrovolný P, Enzi S,
Guidoboni E, Kotyza O, Militzer S, Rácz L, Rodrigo FS (1999a) Documentary evidence on
climate in sixteenth-century Europe. Clim Change 43:55–110.
Pfister C, Brázdil R, Glaser R, Bokwa A, Holawe F, Limanowka D, Kotyza O, Munzar J,
Rácz L, Strömmer E, Schwarz-Zanetti G (1999b) Daily weather observations in sixteenth-
century Europe. Clim Change 43:111–150.
Pfister C, Brázdil R, Obrebska-Starkel B, Starkel L, Heino R, von Storch H (2001) Strides
made in reconstructing past weather and climate. Eos – Trans Am Geophys Union 82:248.
Pfister C, Luterbacher J, Wanner H, Wheeler D, Brázdil R, Ge Q, Hao Z, Moberg A, Grab S,
del Prieto MR (2008) Documentary evidence as climate proxies. Proxy-specific White Paper
produced from the PAGES/CLIVAR workshop, Trieste, 2008. In: PAGES (Past Global
Changes), Bern, http://www.pages-igbp.org/cgi-bin/WebObjects/products.woa/wa/
product?id=331.
Pfister C, Schüle H (1994) Coding climate proxy iformation for the EURO-CLIMHIST data-
base. In: Frenzel B, Pfister C, Gläser B (eds) Climatic Trends and Anomalies in Europe 1675–
1715. Gustav Fischer Verlag, Stuttgart Jena NewYork, pp 461–476.
34

Piervitali E, Colacino M (2001) Evidence of drought in Western Sicily during the period
1565–1915 from liturgical offices. Clim Change 49:225–238.
Réthly A (1962–1999) Időjárási események és elemi csapások Magyarországon 1700ig,
1701–1800, 1801–1900 (Weather Events and Natural Extremes in Hungary – 4 volumes).
Akadémiai Kiadó, Budapest.
Retsö D (2002) A contribution to the history of European winters: Some climatological proxy
data from early-sixteenth century Swedish documentary sources. Clim Change 52:137–173.
Rodrigo FS, Esteban-Parra MJ, Pozo-Vazquez D, Castro-Diez Y (1999) A 500-year
precipitation record in Southern Spain. Int J Climatol 19:1233–1253.
Rutishauser T, Luterbacher J, Jeanneret F, Pfister C, Wanner H (2007) A phenology-based
reconstruction of interannual changes in past spring seasons. J Geophys Res (Biogeosciences)
112:G04016.
Shabalova MV, van Engelen AFV (2003) Evaluation of a reconstruction of winter and
summer temperatures in the Low Countries, AD 764–1998. Clim Change 58:219–242.
Slonosky VC (2002) Wet winters, dry summers? Three centuries of precipitation data from
Paris. Geophys Res Lett 29:1-1 to 1-4.
Slonosky VC, Jones PD, Davies TD (2001) Instrumental pressure observation from the 17th
and 18th centuries: London and Paris. Int J Climatol 21:285–298.
Slonosky VC, Yiou P (2002) Does the NAO index represent zonal flow? The influence of the
NAO on North Atlantic surface temperature. Clim Dyn 19:17–30.
Stone B (2007) Urban and rural temperature trends in proximity to large US cities: 1951–
2000. Int J Climatol 27:1801–1807.
Štěpánek P, Zahradníček P, Skalák P (2009) Data quality control and homogenization of air
temperature and precipitation series in the area of the Czech Republic in the period 1961–
2007. Adv Sci Res 1:1–4.
Tarand A, Nordli PØ (2001) The Tallinn temperature series reconstructed back half a
millennium by use of proxy data. Clim Change 48:189–199.
Torrence C, Compo GP (1998) A practical guide to wavelet analysis. Bull Amer Meteor Soc
79:61–78.
35

Trouet V, Esper J, Graham NE, Baker A, Scourse JD, Frank DC (2009) Persistent positive
North Atlantic Oscillation mode dominated the Medieval Climate Anomaly. Science 324:78–
80.
Van den Dool HM, Schuurmans CJE, Krijnen HJ (1978) Average winter temperatures at De
Bilt (The Netherlands), 1634–1977. Clim Change 1:319–330.
Van Engelen AFV, Buisman J, IJnsen F (2001) A millennium of weather, winds and water in
the Low Countries. In: Jones PD, Ogilvie AEJ, Davies TD, Briffa KR (eds) History and
Climate: Memories of the Future? Kluwer Academic / Plenum Publishers, New York Boston
Dordrecht London Moscow, pp 101–124
Wales-Smith GB (1971) Monthly and annual totals of rainfall representative of Kew, Surrey,
for 1697 to 1970. Meteorol Mag 100:345–362.
Wang R, Wang S, Fraedrich K (1991) An approach to reconstruction of temperature on a
seasonal basis using historical documents from China. Int J Climatol 11:381–392.
Weikinn C (1958–2002) Quellentexte zur Witterungsgeschichte Europas bis zum Jahre 1850.
Hydrographie. Teil 1 (Zeitwende–1500), Teil 2 (1501–1600), Teil 3 (1601–1700), Teil 4
(1701–1750), Teil 5 (1751–1800), Teil 6 (1801–1850). Akademie-Verlag, Berlin.
Wheeler D (2006) Archives and climatic change: how old documents offer a key to
understanding the world’s weather. Archives 31:119–132.
Wheeler D, Garcia-Herrera R (2009) Ships’ logbooks in climatological research: reflections
and prospects. Annals of the New York Academy of Science special publication “Trends and
Directions in Climate Research” 1146:1–15.
Wheeler D, Garcia-Herrera R, Wilkinson CW, Ward C (this issue) Air circulation and
storminess in the Atlantic-European region derived from logbooks: 1685 to 1750. Clim
Change, accepted.
Wilson R, Topham J (2004) Violins and climate. Theor Appl Climatol 77:9–24.
Wilson R, Tudhope A, Brohan P, Briffa K, Osborn T, Tett S. (2006) Two-hundred-fifty years
of reconstructed and modeled tropical temperatures. J Geophys Res 111:C10007.
Xoplaki E, Luterbacher J, Paeth H, Dietrich D, Steiner N, Grosjean M, Wanner H (2005)
European spring and autumn temperature variability and change of extremes over the last half
millenium. Geophys Res Lett 32:L15713.
36

Zorita E, Moberg A, Leijonhufvud L, Wilson R, Brázdil R, Dobrovolný P, Luterbacher J,
Böhm R, Pfister C, Glaser R, Söderberg J, González-Rouco F (this issue) European
temperature records of the past five centuries based on documentary information compared to
climate simulations. Clim Change, in revision.
Internet sources
http://www.cru.uea.ac.uk/~timo/projpages/nao_update.htm
http://www.euroclimhist.com/
http://www.hisklid.de/
http://mitglied.lycos.de/mili04/index.html. See also Militzer S (1998) CLIMDAT: Klima –
Umwelt – Mensch (1500–1800). Leipzig, CD ROM.
37

List of Figures
Fig. 1. Scheme of a standard palaeoclimatological reconstruction (modified after Brázdil
2002)
Fig. 2. Simplified diagram of the temperature reconstruction procedure using documentary
evidence-based temperature index series (modified after Brázdil and Dobrovolný 2009)
Fig. 3. Comparison of reconstructed JFMA Stockholm (1502–2008) and CEuT (1500–2007)
temperatures (anomalies from the 1961–1990 mean). Original series of CEuT (a) and
Stockholm (b) are smoothed with a 30-year Gaussian filter (c) and compared using 31-year
running correlations between unfiltered data (d). The horizontal dashed line in (d) denotes the
critical value of correlation coefficients for α = 0.05 for one-tailed t-test
Fig. 4. Spatial correlations between the JFMA Stockholm instrumental temperature series and
HadCRUT3 5º x 5º gridded temperatures (Brohan et al. 2006) for 1850–2007
Fig. 5. (a) The wavelet power spectrum (Torrence and Compo 1998) of JFMA reconstructed
temperature from Stockholm (1543–2008, A) and CEuT (1500–2007, B). The power has been
scaled by the global wavelet spectrum (right). The cross-hatched region is the cone of
influence, where the spectrum is less certain. The black line is the 10% significance level,
using a red-noise (autoregressive lag 1) background spectrum as null hypothesis. (b) The
global wavelet power spectrum (black line). The dashed line is the significance level for the
global wavelet spectrum, assuming the same significance level and background spectrum as in
(a)
Fig. 6. Spatial correlations between seasonal DJF and JJA CEuT series (the instrumental part)
and HadCRUT3 5º x 5º gridded temperatures (Brohan et al. 2006) for 1850–2007 (after
Brázdil and Dobrovolný 2009)
Fig. 7. Running 31-year correlation coefficients of (a) “winter” CEuT series with (1) JFMA
Stockholm series (Leijonhufvud et al. this issue), (2) DJFM Tallinn series (Tarand and Nordli
2001), (3) western Baltic winter ice severity index (Koslowski and Glaser 1999) and (b, c)
“summer-half” CEuT series with (4) June–July Bavarian Forest/Austrian Alps series (Wilson
and Topham 2004), (5) June–September Alpine series (Büntgen et al. 2006), (6) JJA Hala
Gąsienicowa (Tatra Mountains) series (Niedźwiedź 2004), (7) April–August Swiss series
(Meier et al. 2007), (8) April–September Western Europe series (Guiot et al. 2005), (9) April–
August Burgundy series (Chuine et al. 2004). The CEuT series are defined for the same
months as the corresponding series (1)–(9) used for comparisons. Correlation coefficients
between the CEuT series and each other series are indicated in parentheses. Horizontal line –
38

critical value of correlation coefficients for α = 0.05 for a one-tailed t-test, assuming no
autocorrelation
Fig. 8. Running 31-year correlation coefficients between temperature series and NAOI: a)
Stockholm JFMA temperatures and NAOI after Luterbacher et al. (2002; data after 2000
updated from www.cru.uea.ac.uk/~timo/projpages/nao_update.htm, a web page of T.
Osborn); b) seasonal CEuT series and NAOI after Luterbacher et al. (2002); c) JFMA
Stockholm and CEuT series and NAOI after Cook et al. (2002); d) JFMA Stockholm and DJF
CEuT series correlated (running 101-year correlation coefficients) against NAOI after Trouet
et al. (2009). Horizontal line – the critical value of correlation coefficients for α = 0.05
according to a one-tailed t-test, assuming no autocorrelation
39
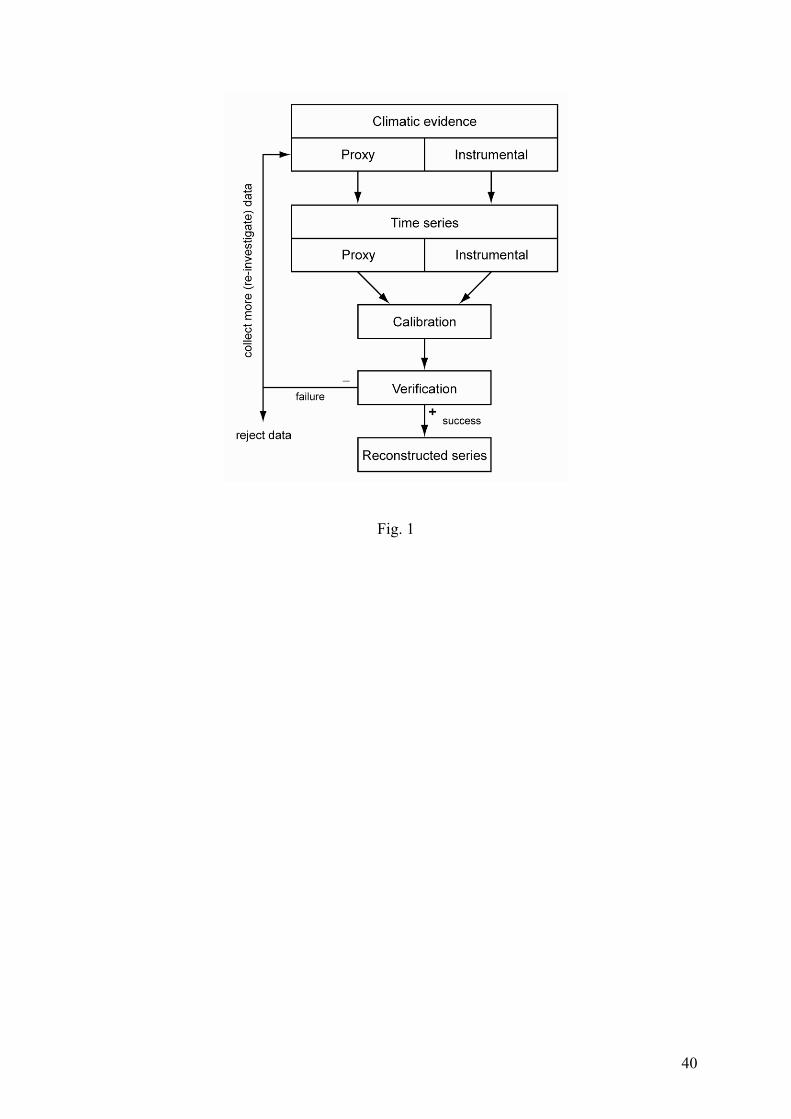
Fig. 1
40

Fig. 2
41

Fig. 3
42

Fig. 4
43
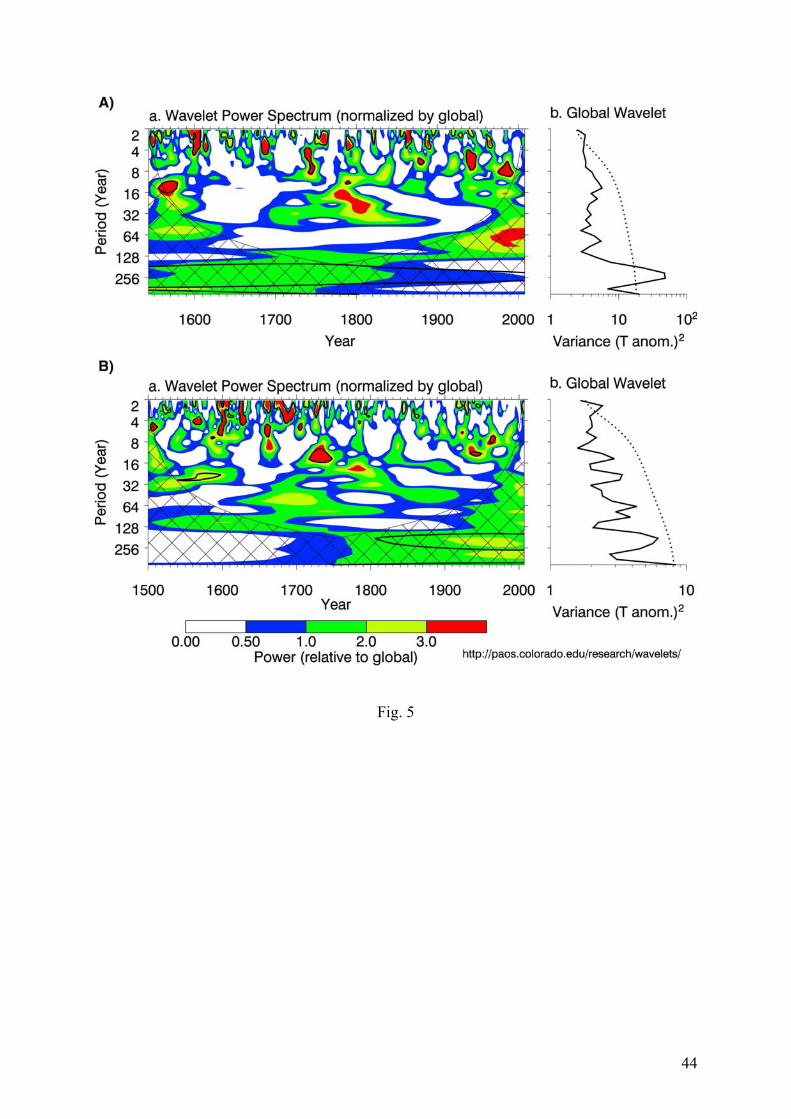
Fig. 5
44

Fig. 6
45

Fig. 7
46

Fig. 8
47