final energy - 2011mospi.nic.in/sites/default/files/reports_and_publication/...the private sector...
TRANSCRIPT
ENERGY STATISTICS - 2011
C E N T R A L S T A T I S T I C S O F F I C E 9
HIGHLIGHTS
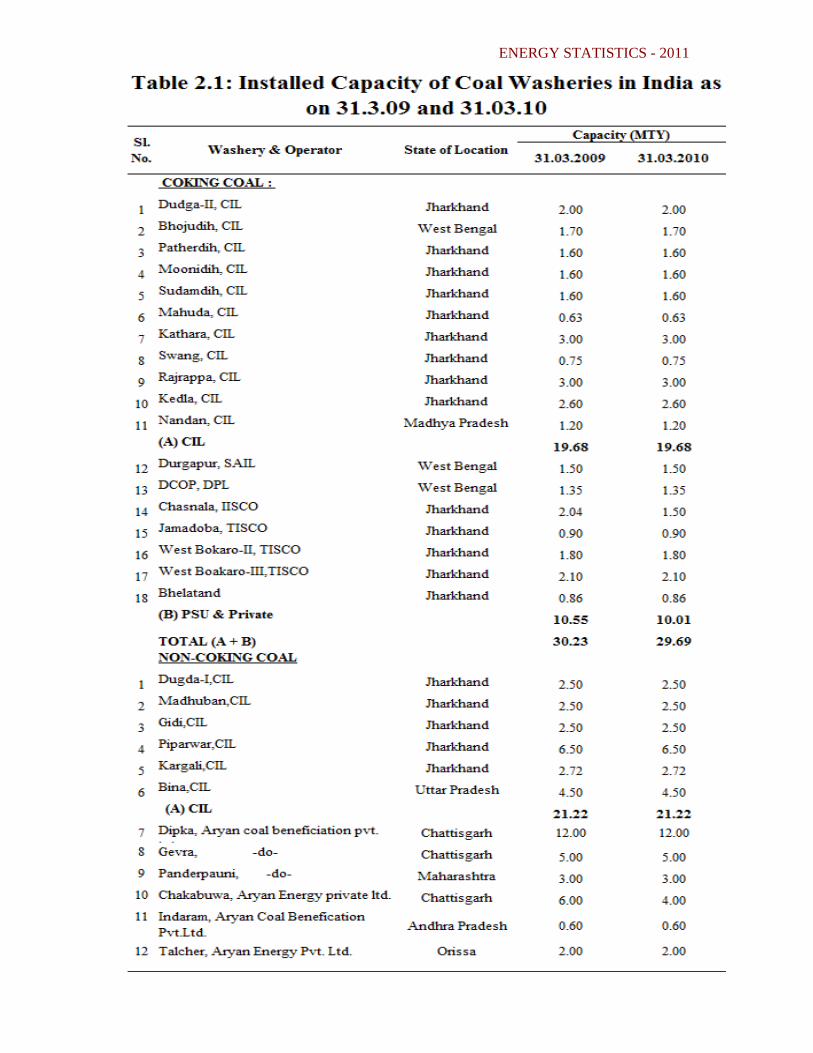
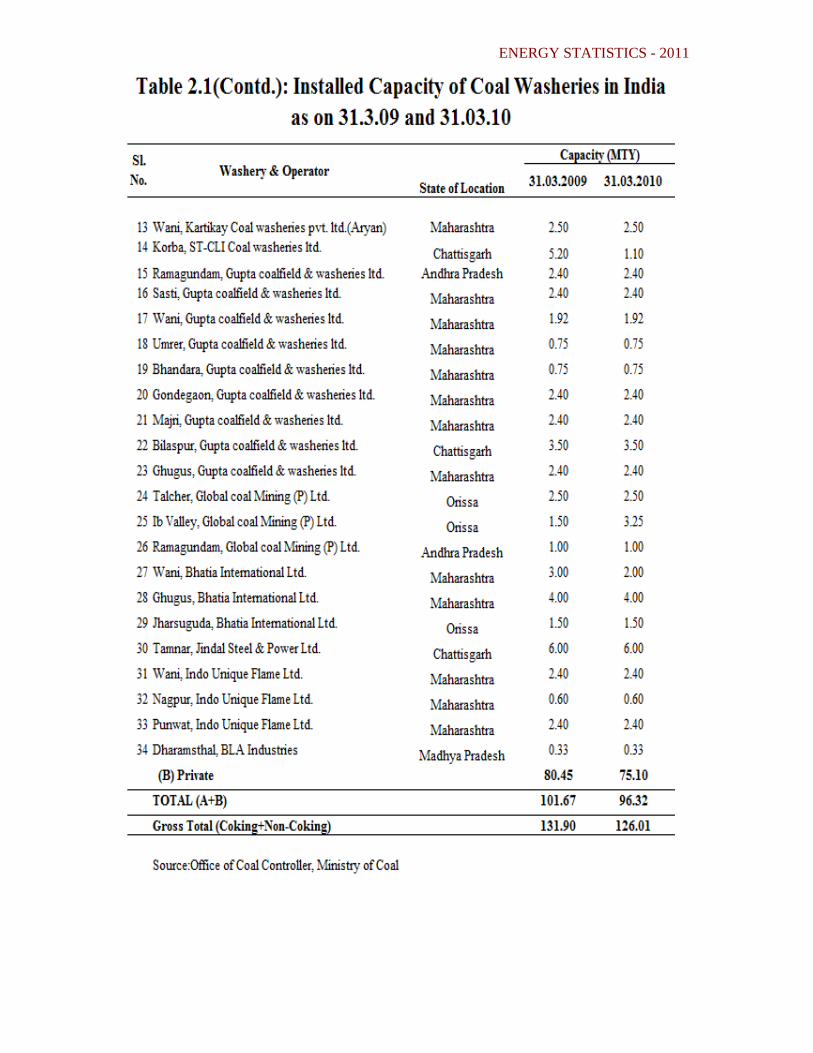
2. Installed Capacity and Capacity Utilization Indicators of installed capacity and capacity utilization throw light on the state of preparedness of the country for generation of the energy it requires and the quality or efficiency of the technology used in the generation, respectively. The dynamics of these indicators prompts the planners and policy makers to take appropriate steps for improvement. 2.1 Coal washeries Coal washing is an integral part of a coal production. Raw coal coming from mines is washed to remove the ash contents to make them fit for feeding into boilers, particularly those of steel plants. Barring a few instances, a coal washery does not form part of a coal mine in India. Total installed capacity of washeries in the country decreased from 131.9 Million tonne per year (MTY) during 2008-09 to 126 MTY during 2009-10(Table 2.1). As on 31.03.10, a total of 52 washeries, both PSUs and Private, were operating in the country. The total installed washing capacity was 126 million tonnes (MT) per annum, for both Coking (29.69 MTY) and Non-Coking Coal (96.32 MTY). Dipak, Aryan Coal Beneficiation Pvt Ltd, Chattisgarh, Piparwar, CIL, Jharkhand and Tamnar, Jindal Steel & Power limited Chattisgarh accounted for 19.4% of the total installed capacity of all the Coal washeries in India. 2.2 Refineries of crude oil As on 31.03.2010 there were a total of 20 refineries in the country(Table 2.2), 17 in the Public Sector and 3 in the private sector. Public sector refineries are located at Guwahati, Barauni, Koyali, Haldia, Mathura, Digboi, Panipat, Vishakapatnam, Chennai, Nagapatinam, Kochi, Bongaigaon, Numaligarh, Mangalore, Tatipaka, and two refineries in Mumbai. The private sector refineries built by Reliance Petroleum Ltd and Essar Oil are in Jamnagar and Vadinar respectively. Total installed crude oil refining capacity in the country at the end of March 2010 was 178 million tonnes per annum. There was an addition of 29 million tonnes per annum to the installed refining capacity due to RPL(SEZ), Jamnagar, Gujarat refinery. Total processing of crude oil in the country decreased from 1,60,772 thousand metric tonnes (TMT) during 2008-09 to 1,60,003 TMT during 2009-10 registering a decline of -0.5 %. Capacity utilization of the refineries was 90.34% during 2008-09 and 89.92 % during 2009-10. The maximum increase (12.3%) was at NRL refinery at

ENERGY STATISTICS - 2011
C E N T R A L S T A T I S T I C S O F F I C E 10
Numalgarh and the highest decrease (-37.2 %) in capacity utilization was at ONGC refinery at Tatipaka. Except RPL(SEZ), Jamnagar, Gujarat (for which production figures are not available), out of 19 remaining refineries there was a decrease in the capacity utilization at 9 refineries. Indian oil corporation, the state owned corporation had highest refining capacity of 49,700 TMTY. All units of IOC processed 50,696 TMT during 2009-10 as compared to 51,367 TMT during 2008-09. The capacity utilization of these refineries was 103.4% during 2008-09 and 102% during 2009-10. All the private refineries taken together processed 48,549 TMT during 2008-09 as compared to 47,916 TMT during 2009-10. The capacity utilization of these refineries during 2008-09 and 2009-10 stood at 67% and 66% respectively. 2.3 Installed generating capacity of electricity The total installed capacity for electricity generation in the country has increased from 16,271 MW as on 31.03.1971 to 1,87,872 MW as on 31.03.2010, registering a compound annual growth rate (CAGR) of 6.1% (Table 2.3). There has been an increase in generating capacity of 12,926 MW over the last one year, which is 7.4% more than the capacity of last year. The highest rate of annual growth (10.7%) from 2008-09 to 2009-10 in installed capacity was for nuclear power followed by thermal power(10.3%). The total Installed capacity of power utilities in the country increased from 14,709 MW in 1970-71 to 1,59,398 MW as on 31.3.2010, with a CAGR of 5.9 % over the period. The highest CAGR (6.7%) was in case of thermal utilities followed by nuclear (5.87%) and hydro (4.48%). At the end of March 2010, thermal power plants accounted for an overwhelming 63% of the total installed capacity in the country, with an installed capacity of 117.9 thousand MW. Hydro power plants come next with an installed capacity of 36.9 thousand MW, accounting for 19.6% of the total installed Capacity. Besides, non-utilities accounted for 15.2% (28.5 Thousand MW) of the total installed generation capacity. The share of Nuclear energy was only 2.43% (4.56 MW). The geographical distribution of Installed generating capacity of electricity as on 31.03.2010(Table 2.4) indicates that Western Region (both central and state sector) accounted for the highest share (30.81%) followed by Southern Region (26.57%), Northern Region (25.88%), Eastern Region (15.35%) and North Eastern Region (1.4%). Region wise growth in the installed capacity during 2009-10 reveals that Southern Region registered the highest growth of about 11%, followed by Western Region(8 %) and Eastern region (6.5%). Among the States in the Southern Region that accounted for the highest growth of 11%, Andhra Pradesh registered the highest(17.3%) closely followed by Karnataka (12.8%). Among all the states

ENERGY STATISTICS - 2011
C E N T R A L S T A T I S T I C S O F F I C E 11
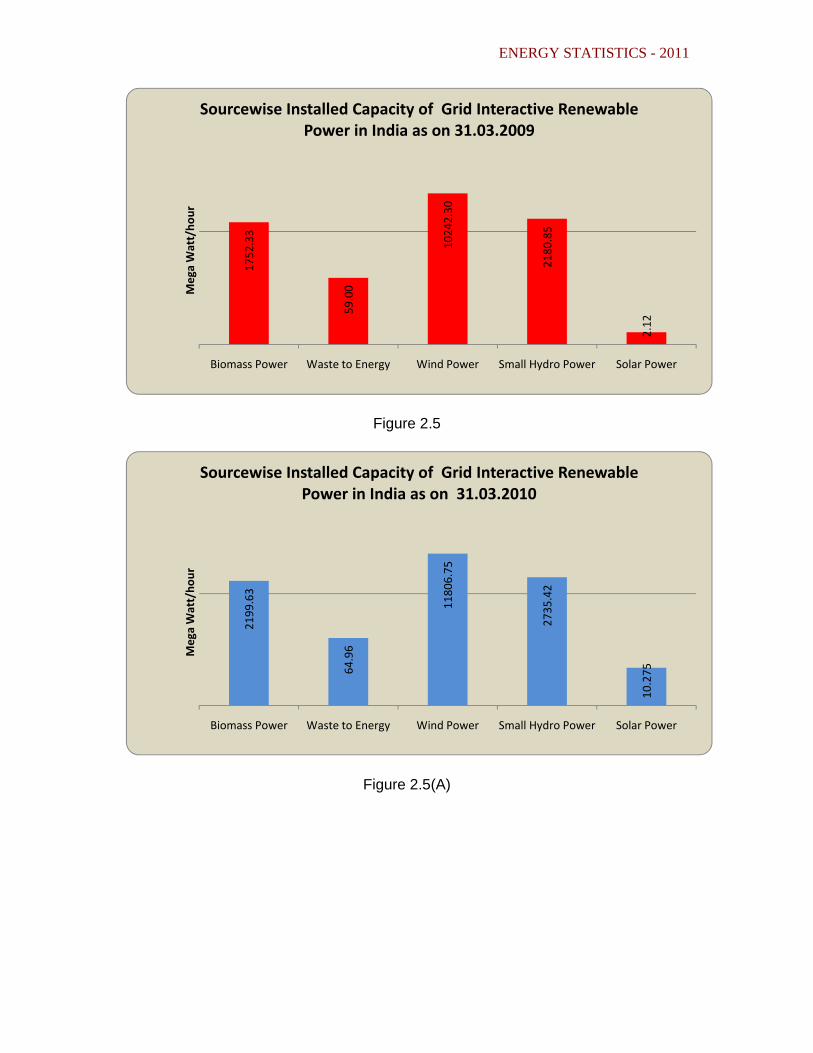
Arunachal Pradesh registered highest growth (36%) in the installed capacity followed by Rajasthan and Chhattisgarh (about 24% each). 2.4 Grid Interactive Renewable Power
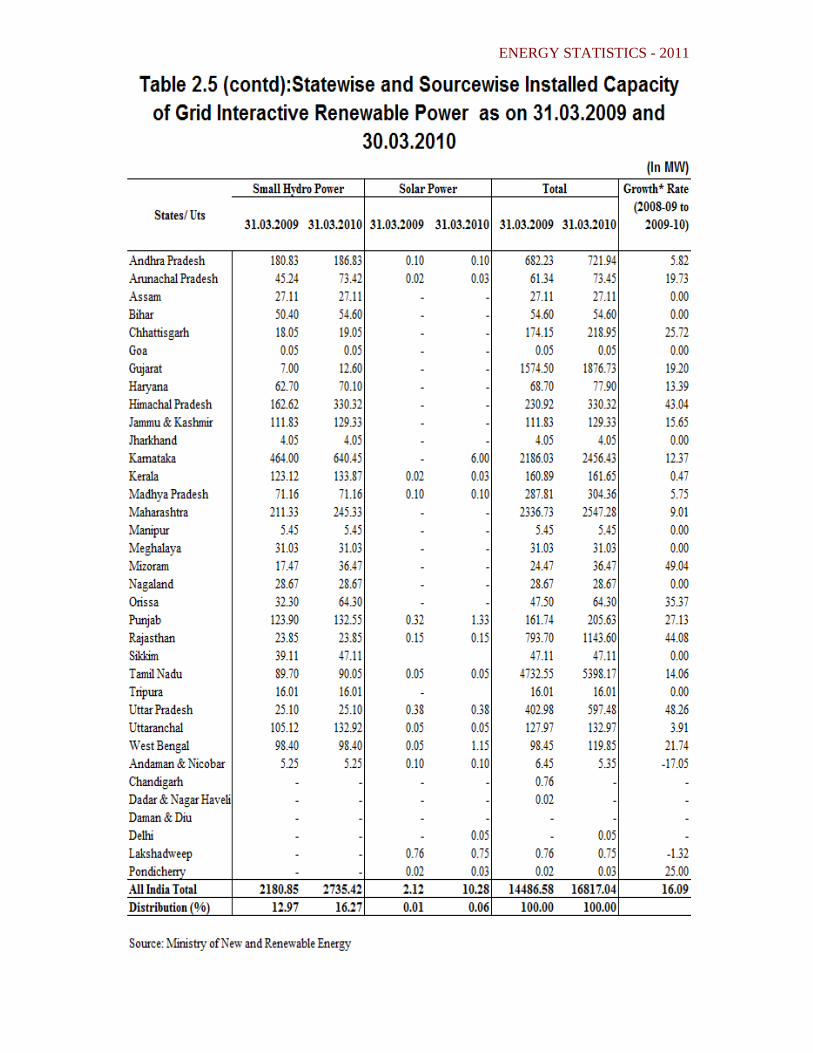
The total installed capacity of grid interactive renewable power, which was 14,486 MW as on 31.03.2009 had gone up to 16,817 MW as on 31.03.2010 indicating growth of 16.1% during the period (Table 2.5). Out of the total installed generation capacity of renewable power as on 31-03-2010, wind power accounted for about 70%, followed by small hydro power(16.3%) and Biomass power (13%). Tamil Nadu had the highest installed capacity of grid connected renewable power (5398 MW) followed by Maharashtra (2547 MW) and Karnataka (2456 MW), mainly on account of wind power.
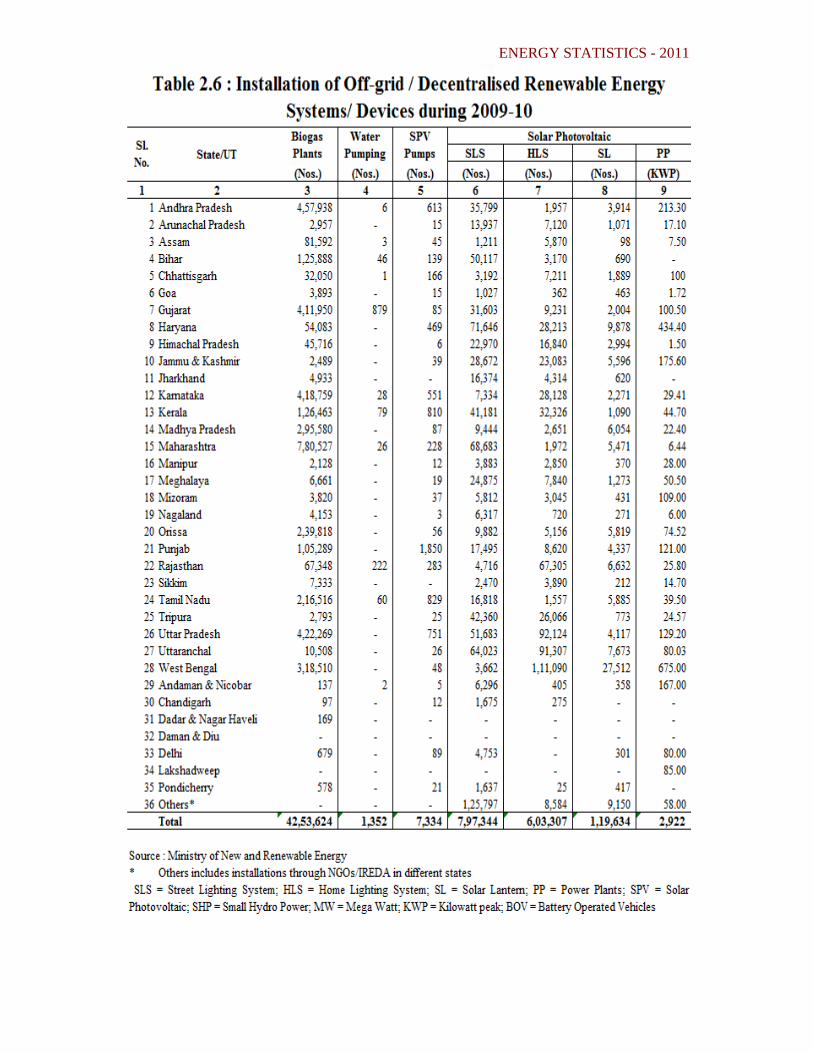
During 2009-10 out of total Biogas plants installed (42.5 lakh) (Table 2.6), maximum number of plants were installed in Maharashtra (7.8 lakh) followed by Andhra Pradesh, Uttar Pradesh, Karnataka and Gujarat each with about 4 lakh biogas plants. Out of about 6.6 lakh Solar Cookers installed in 2009-10, 1.7 lakh were installed in Gujarat and 1.4 lakh were installed in Madhya Pradesh. Further, during 2009-10, 1352 water pumping systems were installed and 5348 remote village and 1408 hamlets were electrified.
ENERGY STATISTICS - 2011
C E N T R A L S T A T I S T I C S O F F I C E 12
ENERGY STATISTICS - 2011
C E N T R A L S T A T I S T I C S O F F I C E 13

ENERGY STATISTICS - 2011
C E N T R A L S T A T I S T I C S O F F I C E 14

ENERGY STATISTICS - 2011
C E N T R A L S T A T I S T I C S O F F I C E 15

ENERGY STATISTICS - 2011
C E N T R A L S T A T I S T I C S O F F I C E 16
Figure 2.3
Figure 2.3(A)
0.0020.0040.0060.0080.00
100.00120.00140.00160.00180.00200.00
1970‐71 1980‐81 1990‐91 2000‐01 2005‐06 2006‐07 2007‐08 2008‐09 2009‐10
Mega Watt
Trends in Installed Electricity Generating Capacity in India as on 31.03.10
Thermal Hydro Nuclear Non‐utilities
0.001.002.003.004.005.006.007.008.00
Thermal Hydro Nuclear Non‐utilities
Percen
tages
Compound Annual Growth Rate of Installed Generating Capacity in India from 1970‐71 to 2009‐10

ENERGY STATISTICS - 2011
C E N T R A L S T A T I S T I C S O F F I C E 17

ENERGY STATISTICS - 2011
C E N T R A L S T A T I S T I C S O F F I C E 18
ENERGY STATISTICS - 2011
C E N T R A L S T A T I S T I C S O F F I C E 19
ENERGY STATISTICS - 2011
C E N T R A L S T A T I S T I C S O F F I C E 20
Figure 2.5
Figure 2.5(A)
1752
.33
59.00
1024
2.30
2180.85
2.12
Biomass Power Waste to Energy Wind Power Small Hydro Power Solar Power
Mega Watt/ho
ur
Sourcewise Installed Capacity of Grid Interactive Renewable Power in India as on 31.03.2009
2199
.63
64.96
1180
6.75
2735
.42
10.275
Biomass Power Waste to Energy Wind Power Small Hydro Power Solar Power
Mega Watt/ho
ur
Sourcewise Installed Capacity of Grid Interactive Renewable Power in India as on 31.03.2010
ENERGY STATISTICS - 2011
C E N T R A L S T A T I S T I C S O F F I C E 21

ENERGY STATISTICS - 2011
C E N T R A L S T A T I S T I C S O F F I C E 22