final report and recommendations to the ...senate.asp.radford.edu/.../081009_final_mgt_report.pdfmgt...
TRANSCRIPT
FINAL REPORT AND RECOMMENDATIONS TO THE JOINT SUBCOMMITTEE ON
HIGHER EDUCATION FUNDING POLICIES
submitted to:
Joint Subcommittee on Higher Education Funding Policies
of theVirginia General Assembly
submitted by:
MGT of America, Inc.2123 Centre Pointe Boulevard
Tallahassee, Florida 32308
January 10, 2001
25 y
ears
of i
nnov
ativ
e m
anag
emen
t res
earc
h an
d co
nsul
ting

TABLE OF CONTENTS
PAGE
EXECUTIVE SUMMARY....................................................................................................... i 1.0 INTRODUCTION......................................................................................................1 2.0 BASE FUNDING GUIDELINES: ISSUES AND PROPOSED FRAMEWORK.........1 2.1 Desired Characteristics of Base Funding Guidelines................................. 1 2.2 Trends in Funding Guideline Usage and Design ........................................ 2 2.3 Overview of Program Areas Covered by Base Funding Guidelines ............................................................................ 3 2.4 Proposed Framework for Base Funding Guidelines................................... 4 3.0 OVERVIEW OF WORK ACTIVITIES COMPLETED.............................................. 5 4.0 BASE FUNDING GUIDELINES: PROCESS AND RECOMMENDATIONS............ 6 4.1 Instruction.....................................................................................................6 4.2 Support Services........................................................................................14 4.3 Recommended Base Funding Adjustments..............................................18 5.0 ISSUES FOR FURTHER REVIEW AND DISCUSSION...................................... 21 5.1 Plant Operations and Maintenance........................................................... 21 5.2 Enrollment Growth Funding ...................................................................... 21 6.0 SUMMARY AND CONCLUSIONS......................................................................... 23 APPENDICES Appendix A: Student/Faculty Ratios by Academic Discipline and Instructional
Level – Selected States and Appendix M Appendix B: Instructional Staffing Level Standards From Selected Accrediting
Organizations Appendix C: Regression Model Results Related to Preliminary Recommenda-
tions for Academic Support, Institutional Support, and Student Services Base Funding Guidelines

EXECUTIVE SUMMARY

MGT of America, Inc. Page i
FINAL REPORT AND RECOMMENDATIONS TO THE JOINT SUBCOMMITTEE ON HIGHER EDUCATION
FUNDING POLICIES
EXECUTIVE SUMMARY
Introduction This final report to the Virginia General Assembly’s Joint Subcommittee on Higher Education Funding policies summarizes the work MGT of America, Inc. completed in conjunction with the staffs of the Senate Finance Committee and House Appropriations Committee in developing a set of base funding guidelines for Virginia’s public colleges and universities. It includes a description of the proposed base funding guidelines for instruction (both for faculty and non-faculty instructional costs) and support services (academic support, institutional support, and student services), and related recommendations. It also includes an outline of issues for further discussion and review by the Subcommittee, including the funding of plant operations and maintenance, as well as enrollment growth funding. Overview of Study MGT’s initial report to the Joint Subcommittee in October, 1999 provided an overview of desired characteristics for base funding guidelines, an overview of guideline usage, design features, and trends among the states, and outlined the proposed framework for Virginia’s base funding guidelines. There are three underlying assumptions inherent in this framework1:
n The new base funding guidelines should complement, and not replace the Commonwealth’s existing higher education funding policies (e.g., the faculty salary benchmark process).
n To the extent possible, the guideline factors would be developed through an assessment of actual experience or “best practices” nationally (e.g., national data sources, standards).
n Not all institutional resource requirements will, or should, be met through these base funding guidelines (e.g., unique institutional activities, medical education).
After first meeting with the Subcommittee in October 1999, MGT and legislative staff conducted various research activities in reference to the initial proposed framework for the base funding guidelines. The results and implications of these research activities were shared and discussed with institutional representatives at various meetings during the past year for the purpose of getting guidance on various guideline design issues and
1 See Exhibit 3 on page 5 of full report for overview of framework.

Executive Summary
MGT of America, Inc. Page ii
other technical issues. In addition, during the latter stage of the study, legislative staff met with each institution to review and discuss the results of the guideline estimates, and related assumptions. Findings and Guideline Recommendations The following funding guideline recommendations are presented to the Subcommittee, based on the results of the research activities and discussions with legislative staff and institutional representatives:
n Instruction – There are two sub-areas within the instruction program for which guidelines were developed: instructional faculty costs and non-faculty instructional costs (support staff and non-personal services)2:
Ø Instructional Faculty Costs – The recommended approach for calculating instructional faculty costs is through the use of student/faculty ratios (differentiated by discipline and instructional level) and institution-specific faculty salary averages. The discipline groupings should be based on instructional intensity.3
Ø Non-Faculty Instructional Costs – Given that there are no nationally collected data on this issue, a special survey was developed and distributed to selected public university and community college systems to collect comparative data on non-faculty instructional support staffing and costs. These systems included institutions that are current peers of Virginia’s four-year institutions and community colleges. After analyzing the survey results, a guideline rate of 40 percent (added on to the guideline estimate for instructional faculty salaries) is recommended.
n Support Services (Academic Support, Institutional Support, and Student Services) – The general methodology used to research the development of guidelines in these three support areas was to conduct statistical analyses of the relationship between institutional costs in each of the three program areas and potential “cost drivers” (e.g., institutional type, enrollment). These analyses resulted in the following recommended guideline approaches:
2 To recognize all elements of instructional cost, fringe benefit rates were also applied to the sum of the calculated faculty instructional salaries and the non-faculty instructional costs. Institution-specific rates were developed from actual FY 2000 expenditure data by calculating fringe benefits as a percent of all expenditures in the instruction program, excluding fringe benefits. This approach recognizes fringe benefit costs for faculty and for the personal services component of non-faculty instructional costs, based on actual institutional patterns. Note: For the support programs, the calculations assume that any fringe benefits associated with personal services in these programs are covered by the guideline-generated calculation. 3 See Exhibits 4 and 5 on pages 10 and 11 of full report for overview of taxonomy.
Executive Summary
MGT of America, Inc. Page iii
Ø Academic Support – a percentage of instruction, research, and public service guideline requirements, plus an adjustment factor.
Ø Institutional Support – a percentage of total educational and general budget guideline requirements, plus an adjustment factor.
Ø Student Services – a per capita (student headcount) amount, plus an adjustment factor.
In all cases, the research also supported the need for these guidelines to be differentiated by institutional type (research, doctoral, masters/comprehensive, baccalaureate, and two-year).
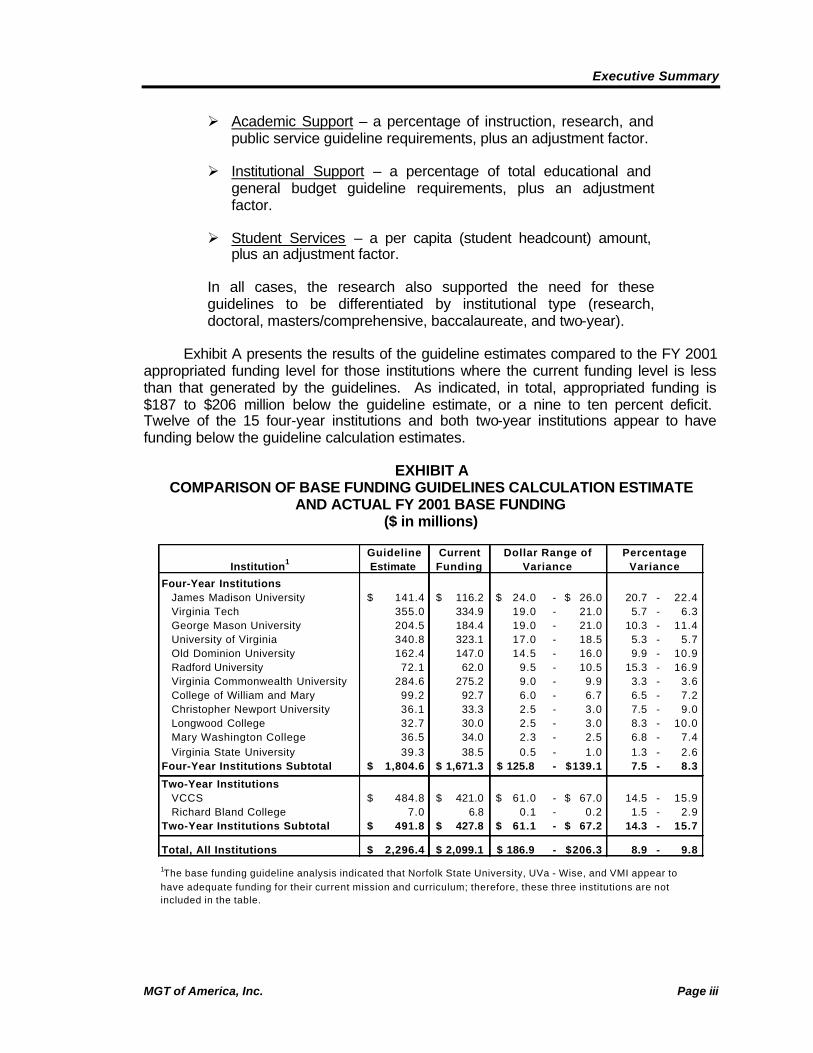
Exhibit A presents the results of the guideline estimates compared to the FY 2001 appropriated funding level for those institutions where the current funding level is less than that generated by the guidelines. As indicated, in total, appropriated funding is $187 to $206 million below the guideline estimate, or a nine to ten percent deficit. Twelve of the 15 four-year institutions and both two-year institutions appear to have funding below the guideline calculation estimates.
EXHIBIT A COMPARISON OF BASE FUNDING GUIDELINES CALCULATION ESTIMATE
AND ACTUAL FY 2001 BASE FUNDING ($ in millions)
Institution1Guideline Estimate
Current Funding
Four-Year InstitutionsJames Madison University 141.4$ 116.2$ 24.0$ - 26.0$ 20.7 - 22.4Virginia Tech 355.0 334.9 19.0 - 21.0 5.7 - 6.3George Mason University 204.5 184.4 19.0 - 21.0 10.3 - 11.4University of Virginia 340.8 323.1 17.0 - 18.5 5.3 - 5.7Old Dominion University 162.4 147.0 14.5 - 16.0 9.9 - 10.9Radford University 72.1 62.0 9.5 - 10.5 15.3 - 16.9Virginia Commonwealth University 284.6 275.2 9.0 - 9.9 3.3 - 3.6College of William and Mary 99.2 92.7 6.0 - 6.7 6.5 - 7.2Christopher Newport University 36.1 33.3 2.5 - 3.0 7.5 - 9.0Longwood College 32.7 30.0 2.5 - 3.0 8.3 - 10.0Mary Washington College 36.5 34.0 2.3 - 2.5 6.8 - 7.4Virginia State University 39.3 38.5 0.5 - 1.0 1.3 - 2.6
Four-Year Institutions Subtotal 1,804.6$ 1,671.3$ 125.8$ - 139.1$ 7.5 - 8.3
Two-Year InstitutionsVCCS 484.8$ 421.0$ 61.0$ - 67.0$ 14.5 - 15.9Richard Bland College 7.0 6.8 0.1 - 0.2 1.5 - 2.9
Two-Year Institutions Subtotal 491.8$ 427.8$ 61.1$ - 67.2$ 14.3 - 15.7
Total, All Institutions 2,296.4$ 2,099.1$ 186.9$ - 206.3$ 8.9 - 9.8
Dollar Range of Variance
Percentage Variance
1The base funding guideline analysis indicated that Norfolk State University, UVa - Wise, and VMI appear to have adequate funding for their current mission and curriculum; therefore, these three institutions are not included in the table.

Executive Summary
MGT of America, Inc. Page iv
Issues for Further Review and Discussion The study process also dealt with issues for which there are no definitive recommendations at this point, but which will be important for further review and discussion by the Subcommittee. The first is the development of a guideline for funding plant operations and maintenance costs which is flexible enough to recognize the wide-ranging diversity in physical plant among Virginia’s institutions of higher education, while equitably funding similar O&M costs. The second issue is the funding of future enrollment growth. The preliminary recommendation is to fund enrollment at a set dollar amount per student that would be less than the average appropriation per student at each institution, adjusted to recognize marginal costs, particularly in the administrative areas. The application of these base funding guidelines should provide a level of base funding adequacy for every Virginia public college and university, provided that the necessary funding is allocated to meet the identified shortfalls in a timely and systematic manner. At the same time, however, it should be recognized that these guidelines will need to be revisited periodically (perhaps every four years) to reflect instructional and other program changes at the institutions that have taken place in the interim, as well as other more technical adjustments that may need to be addressed (e.g., inflation). As such, the Subcommittee may wish to convene periodically in the interim to review and discuss issues regarding base funding adequacy and the recommended funding guidelines.

FINAL REPORT AND RECOMMENDATIONS
TO JOINT SUBCOMMITTEE

MGT of America, Inc. Page 1
FINAL REPORT AND RECOMMENDATIONS TO THE JOINT SUBCOMMITTEE ON HIGHER EDUCATION
FUNDING POLICIES
1.0 Introduction This final report to the Joint Subcommittee on Higher Education Funding Policies summarizes the work completed by MGT of America, Inc. in conjunction with the staffs of the Senate Finance Committee and House Appropriations Committee in developing a set of base funding guidelines for Virginia’s public colleges and universities. This report includes the following:
n an overview of issues considered in the development of the base funding guidelines, including a description of the proposed guideline framework;
n a summary of work activities completed as part of this study;
n a description of the proposed base funding guidelines for instruction, academic support, institutional support, and student services and related recommendations; and,
n an outline of issues for further discussion and review by the Joint Subcommittee, including the funding of plant operations and maintenance, as well as enrollment growth funding.
2.0 Base Funding Guidelines: Issues and Proposed Framework In October 1999, MGT presented a paper to the Subcommittee entitled A Framework for Virginia Higher Education Base Funding Guidelines: Concepts, Structural Issues, and Alternatives. Major topics of the paper included the following:
n desired characteristics of base funding guidelines;
n an overview of guideline usage, design, and trends among the states;
n an overview of the program areas to be covered by Virginia’s base funding guidelines; and
n the proposed framework for the base funding guidelines.
Each of these topics is briefly highlighted below. 2.1 Desired Characteristics of Base Funding Guidelines Over time, a number of researchers in the area of higher education finance have offered their concepts regarding desired characteristics in state higher education funding

Final Report to Joint Subcommittee
MGT of America, Inc. Page 2
models. Frequently, what is offered as the “desired characteristic” is in direct response to a perceived shortcoming of a particular state’s funding model. Fourteen characteristics, listed and summarized in Exhibit 1 in no particular order of importance, often tend to be in opposition to one another. For instance, the desire to have a simple-to-understand funding formula may preclude features that might contribute to a greater degree of equity (e.g., more detailed sub-categories to reflect institutional differences). Similarly, a formula that is responsive to changes in enrollment levels may not be able at the same time to provide the desired level of stability. In keeping with these characteristics, one of the Subcommittee’s goals through this process is to attempt to establish an equitable funding model for all of Virginia’s public colleges and universities, while recognizing the unique aspects of the institutions.
EXHIBIT 1 DESIRED CHARACTERISTICS OF FUNDING GUIDELINES
Goal-Based Simple to UnderstandMission-Sensitive Equitable
Adequacy-Driven Adaptable to Special SituationsSize-Sensitive Reliant on Valid Data
Responsive FlexibleAdaptable to Economic Conditions Incentive-Based
Concerned with Stability Balanced
Desired Characteristics
2.2 Trends in Funding Guideline Usage and Design MGT’s review of current higher education funding guideline usage and design across the states indicates the following:
n more than one-half of the states (27) currently use funding guidelines or formulas;
n states may use funding guidelines for only one or several different program areas; and,
n while there are broad similarities in guideline design among the states, each state’s methodology reflects its own specific situation or needs.
This last point is especially relevant for the Subcommittee’s work in developing base funding guidelines for Virginia’s public institutions of higher education. States may borrow basic guideline design features from other states, however in the end, there is no one best funding guideline methodology. Rather, it is more critical that a state’s guidelines reflect its own context and funding policy goals. Some emerging trends in funding guideline design and usage among the states include the following:

Final Report to Joint Subcommittee
MGT of America, Inc. Page 3
n a search for more simplified and streamlined approaches to funding
models
n greater use of non-guideline funding categories; and
n an increasing focus on quality and performance.
The second trend indicated (i.e., greater use of non-guideline funding categories) reflects a realization that, increasingly, there are unique programs and state policy priorities that cannot be adequately funded solely through the use of mathematical guidelines.
2.3 Overview of Program Areas Covered by Base Funding Guidelines
Four educational and general (E&G) program areas were ultimately included in the base funding guideline development process.1 They are as follows:
n Instruction n Academic Support n Institutional Support n Student Services
Exhibit 2 below provides examples of the types of activities and other expenditures covered under each of these five programs.
EXHIBIT 2 EXAMPLES OF GUIDELINE PROGRAM ACTIVITIES AND EXPENDITURES
InstructionAcademic
SupportStudent Services
Institutional Support
Faculty salaries Academic administration (deans and below)
Admissions officers and registrars
Executive management and planning
Academic department operations
Libraries Guidance and counseling
Fiscal, legal, and personnel operations
Academic computing
Financial aid administration
Public relations and development
Student activities & organizations
Campus safety and security
Instructional technology
1 Note: Plant Operations and Maintenance was initially considered as part of this process, but action was deferred in order to allow for more review and discussion (see Section 5.1 of report).

Final Report to Joint Subcommittee
MGT of America, Inc. Page 4
2.4 Proposed Framework for Base Funding Guidelines The process of designing a set of higher education funding guidelines is not unlike the process an architect goes through in designing a building for a client. There are some basic structural issues common to all funding guidelines (and buildings), which can be taken as a given by the designer. For example, all building designs need to consider the basic laws of physics to ensure structural soundness for the facility. Likewise, the design of funding guidelines needs to consider both the technical (e.g., data systems availability) and practical (e.g., political) considerations (and limitations) within the state to ensure that the guidelines are ultimately workable. Beyond that, however, there is a gray area where the designer and client must work through an iterative process in order to “flesh out” the details. As indicated earlier, there is no one “right” funding guideline methodology just as there is no one “right” building design. As such, the designer must first consult with the client to determine the desired outcome before putting an initial proposal together for review. From that point on, the proposed structure is refined until it becomes a completed product in the eyes of the client and designer. Exhibit 3 presents the initial framework for Virginia’s higher education base funding guidelines first proposed in October 1999. This framework is based on our discussions with legislative staff as well as our own experience. The purpose for such a framework is to provide that starting point for the funding guidelines from which to “flesh out” and refine. There are three underlying assumptions inherent in this framework:
1. The new base funding guidelines should complement, and not replace the Commonwealth’s existing funding policies for higher education (e.g., the faculty salary benchmark process). The Commonwealth has invested considerable time and effort in developing and refining its existing higher education funding policies over the past several years. Thus, any new policy initiative should build upon and not eliminate the prior accomplishments of the state.
2. To the extent possible, the guideline factors would be developed through an assessment of actual experience or “best practices” nationally. Given that Virginia’s colleges and universities compete in a national marketplace for students, faculty, and staff, institutional funding factors should reflect “industry standards” nationally as well.
3. Not all institutional resource requirements will, or should, be met through these base funding guidelines. For example, unique institutional programs (e.g., VIMS at the College of William and Mary, Agricultural Extension at Virginia Tech and Virginia State University), first professional medical education, hospitals, and other areas with special funding needs would continue to be funded outside of the base funding guidelines.
Further discussions with Subcommittee members, staff, and institutional officials during the study process have reinforced the importance of these assumptions.

Final Report to Joint Subcommittee
MGT of America, Inc. Page 5
EXHIBIT 3 INITIAL PROPOSED FRAMEWORK FOR BASE FUNDING GUIDELINES
Program Area Proposed Guideline FactorInstruction
Instructional Faculty Costs Student/Faculty Ratios by Discipline and Level
Non-Faculty Instructional Costs (e.g., support staff, supplies, travel)
Add-on rate to instructional faculty cost amount
Academic Support A model that recognizes the link between academic
support costs and instruction, research, and public service
activities
Student Services Base amount plus $ per headcount student
Institutional Support A model that recognizes the link between institutional
support costs and all other institutional activities
3.0 Overview of Work Activities Completed During this project, MGT and legislative staff conducted various research activities in reference to the development of base funding guidelines for Virginia’s public colleges and universities using the framework that was described previously. Specifically, we have:
n gathered information on student/faculty ratios by discipline and level used by other states in their funding formulas or generated as the result of a special data collection, as well as actual Virginia data and “optimal” student/faculty ratios (i.e., as recommended by academic program accrediting bodies and institutional chief academic officers);
n conducted several statistical analyses of national data on the relationship between institutional expenditures in academic support, institutional support, and student services and related cost drivers for each area (e.g., enrollment levels, academic program array, etc.);
n developed a data request instrument in order to gather supplemental information on “non-faculty” instructional costs from other states;

Final Report to Joint Subcommittee
MGT of America, Inc. Page 6
n held several meetings with institutional representatives (both fiscal and academic officers) in order to review and discuss the results; and
n refined the analyses and guideline framework based on the results of the research and input from institutional representatives to arrive at estimated levels of base funding adequacy for each institution.
The next section of this report presents more detailed descriptions of our work on the guidelines for each of the program areas. 4.0 Base Funding Guidelines: Process and Recommendations This section of the paper presents an overview of the work completed in developing the base funding guidelines and related recommendations for each of the four E & G program areas:
n Instruction n Academic Support n Institutional Support n Student Services
Because the methodology for addressing the development of guidelines for academic support, institutional support, and student services was similar, these three program areas will be discussed together as “support services”. 4.1 Instruction As indicated earlier in section 2.3 of this report, there are two sub-areas within the instruction program for which base funding guidelines were developed: instructional faculty costs and support staff salaries/non-personal services expenses. Both are discussed below. Instructional Faculty Costs. As indicated earlier, the proposed methodology for funding instructional faculty costs for each Virginia institution is as follows:

Final Report to Joint Subcommittee
MGT of America, Inc. Page 7
Sum of (3-year average distribution of student FTE enrollment by Discipline and Level
projected forward to 2000-01/ Student/Faculty Ratios by Discipline and Level)2
Multiplied by
Institution-specific Faculty Salary Averages3
This approach results in an instructional faculty FTE staff number for each Virginia institution (based on its individual mission and program mix) that can be multiplied by the institution’s specific faculty salary rate to arrive at an instructional faculty salary base for the institution. From the beginning, a guiding principle for this approach was that it would recognize differences in instructional staffing needs among the different academic disciplines and levels of instruction (e.g., lower division, upper division, masters, doctoral, first professional). As such, we looked for potential taxonomies of academic disciplines by level used by other states that would help to inform the design process. The initial models included for analysis included both states where pre-determined student/faculty ratios for different disciplines and levels were used in funding formulas (e.g., Connecticut) as well as states that regularly collected data on actual student/faculty ratios by discipline and level (e.g., Wisconsin). In total, there were almost 50 separate discipline areas represented (see data in Appendix A). We also reviewed the related accreditation standards on instructional staffing requirements set forth by several programmatic accreditation organizations, representing the following areas:
n Allied Health n Architecture n Business n Engineering n Law n Teacher Education
The purpose of this review was to determine whether there were minimum student/faculty ratios that were viewed as “industry standards” for certain fields of study (particularly the professional programs). The relevant accreditation standards of those organizations are shown in Appendix B. In general, while some allied health fields have
2 The methodology used for projecting forward enrollment to 2000-01 was to allocate each institution’s actual 1999-2000 FTE enrollment according to the three-year average (1997-98, 1998-99, 1999-00) proportional distribution of FTE enrollment by discipline group and level, and then project the allocated amount forward according to the SCHEV-projected enrollment change rate for each institution from 1999-00 to 2000-01. This approach helped to smooth the year-to-year enrollment fluctuations experienced by institutions among disciplines and levels. 3 Institution-specific salary averages reflect the weighted salary of full-time and part -time faculty and graduate teaching assistants. Calculations of the salary averages use dollars and full-time equivalent positions as reported in the institutions’ FY 2001 operating plans.

Final Report to Joint Subcommittee
MGT of America, Inc. Page 8
specific recommended ratios, most accrediting organizations seem to afford institutions a high degree of discretion in staffing their programs, provided that academic quality is maintained. The materials in Appendix A were reviewed with the various institutional representatives early in the study process. The consensus of the group was that the instructional staffing guidelines for Virginia should be based on a more aggregated grouping of disciplines (i.e., fewer) to reduce complexity in the usage and application of the guidelines. However, the group also desired to maintain discrete levels of instruction in the guidelines (i.e., lower division, upper division, master’s, doctoral, and first professional). Further research found two examples of more aggregated discipline groupings in use in Georgia and Wisconsin (see Appendices A-5 and A-6). As indicated, the Georgia taxonomy has three discipline groupings (plus one for remedial programs), while the Wisconsin taxonomy has six discipline groupings. Further, the Wisconsin taxonomy recognizes the full range of instructional levels (i.e., lower division, upper division, master’s, doctoral, and first professional), while the Georgia approach has only three instructional levels (lower division, upper division, and graduate). The overall results of the research suggested a wide array of possible options, both in terms of discipline groupings and actual ratios. In order to assess the relative appropriateness of these options and also solicit campus input, there was consultation with campus academic officers over several weeks beginning in late spring 2000. Consistent with the previous work conducted, this group was guided by the following principles:
n Discipline groupings and levels are a key component of the guidelines, and the best way to recognize the costs of instruction at each institution.
n The ratios are norms and are not meant to be prescriptive – institutions can use the resources allocated through the guidelines to best meet their individual course delivery needs as well as other faculty responsibilities (e.g., departmental research, service).
n The overall number of discipline groups should be limited.
As opposed to a focus on grouping by discipline type, the campus academic officers recommended that the discipline groups should be developed based on similarities in the intensity of faculty resources needed to deliver instruction as opposed to similarities in content. For example, while the fields of Foreign Language and Computer and Information Sciences are clearly different in terms of content, they are quite similar in the way instruction is delivered (e.g., smaller class sizes paired with intensive laboratory experiences). The discipline groupings would thus range from the less intense (e.g., large lecture experiences) to the more intense (e.g., one-on-one instruction). Based on this initial guidance, MGT and legislative staff developed an initial array of discipline groupings and range of student/faculty ratios according to instructional
Final Report to Joint Subcommittee
MGT of America, Inc. Page 9
intensity. These ratios and groupings were based on the data from other states shown in Appendix A, the ratios from the original “Appendix M” guidelines, recommendations and actual data submitted by Virginia institutions, and accreditation standards on staffing requirements. These initial groupings and ratios were then shared with the campus academic officers for further review and input. Based on this further consultation, a final set of discipline groupings was prepared as well as recommended ratios. The final recommended discipline groupings, ranges, and recommended ratios for the public four-year institutions and the public two-year institutions (VCCS and Richard Bland College) are shown in Exhibits 4 and 5 below. As indicated, the disciplines are grouped according to the level of instructional intensity, with Group 1 being less intensive and Group 4 being more intensive. A few program areas (Pharmacy – First Professional, Law – First Professional, and some technological fields) are unique in their instructional needs and required individual consideration.

Final Report to Joint Subcommittee
MGT of America, Inc. Page 10
EXHIBIT 4 DISCIPLINE GROUPINGS AND RECOMMENDED STUDENT/FACULTY RATIOS
FOR FUNDING INSTRUCTIONAL COSTS AT VIRGINIA’S PUBLIC FOUR-YEAR INSTITUTIONS
Level Range RecommendationLower 22 to 28 24Upper 14 to 18 18
Masters 10 to 13 11Doctoral 8 to 10 9
Group 2 Disciplines: Communications, Education, Home Economics, Letters, Math, Psychology
Level Range RecommendationLower 18 to 24 20Upper 13 to 14 14
Masters 8 to 11 10Doctoral 8 to 8 8
Level Range RecommendationLower 13 to 21 18Upper 11 to 12 11
Masters 7 to 9 9Doctoral 6 to 7 7
Group 3b Disciplines : Biological Sciences, Engineering, Physical Sciences
Level Range RecommendationLower 13 to 21 18Upper 11 to 12 11
Masters 6 to 8 8Doctoral 6 to 7 6
Group 4 Discipline : Health Professions 1
Level Range RecommendationLower 8 to 15 12Upper 8 to 11 10
Masters 6 to 7 7Doctoral 2 to 7 5
Pharmacy (Pharm. D) : 6 (Recommended)
Law : 17 (Recommended)
1Excludes medicine, dentistry, and veterinary medicine.
Group 1 Disciplines: Area Studies, Business & Management, Interdisciplinary Studies, Library Science, Military Science, Public Affairs, Social Sciences, Study Abroad, Theology
Group 3a Disciplines : Agriculture & Natural Resources, Architecture & Environmental Design, Computer & Information Sciences, Fine & Applied Arts, Foreign Languages, Health Services and Paramedical Technologies

Final Report to Joint Subcommittee
MGT of America, Inc. Page 11
EXHIBIT 5 DISCIPLINE GROUPINGS AND RECOMMENDED STUDENT/FACULTY RATIOS
FOR FUNDING INSTRUCTIONAL COSTS AT VIRGINIA’S PUBLIC TWO-YEAR INSTITUTIONS
Level Range RecommendationLower 22 to 28 24
Group 2 Disciplines: Communications, Education, Home Economics, Letters, Math, Psychology
Level Range RecommendationLower 18 to 24 20
Level Range RecommendationLower 13 to 21 18
Group 4 Discipline : Health Services and Paramedical Technologies
Level Range RecommendationLower 8 to 15 10
Mechanical and Engineering Technologies : 13 (Recommended)
Natural Science Technologies: 14 (Recommended)
Group 1 Disciplines: Area Studies, Business & Management, Interdisciplinary Studies, Library Science, Military Science, Public Affairs, Social Sciences, Study Abroad, Theology
Group 3 Disciplines: Agriculture & Natural Resources, Architecture & Environmental Design, Biological Sciences, Business & Commerce Technologies, Computer & Information Sciences, Data Processing Technologies, Foreign Languages, Physical Sciences, Public Service Technologies, Remedial Education
Non-Faculty Instructional Costs. As discussed earlier, the recommendation to fund instructional faculty costs within the base funding guidelines for Virginia’s public colleges and universities is through a combination of student/faculty ratios and blended faculty salary averages. However, the process for funding instructional support staff salaries and instructional non-personal services expenses (referred to as “non-faculty instructional costs” in this paper) proved to be more ambiguous. This is a particular issue of concern to Virginia’s public colleges and universities who feel that these costs have been underfunded in recent years. There is also a belief among these institutions that these costs will continue to grow in the future, driven primarily by a rapidly increasing use of technology in instructional delivery. There are at least six different methods that could be used as guidelines for funding non-faculty instructional costs (none of which are necessarily mutually exclusive):
1. An add-on percentage to total instructional faculty cost requirements generated for the institution (i.e., X% of faculty salary base).
2. Staffing ratios driven by the number of instructional faculty generated through the student/faculty ratios (e.g., 1 support staff FTE for every 4 faculty FTE).

Final Report to Joint Subcommittee
MGT of America, Inc. Page 12
3. A dollars per FTE student approach.
4. A dollars per student credit hour approach.
5. A “base-plus” approach which adjusts the previous year’s non-faculty instructional cost base by an inflation and/or enrollment growth factor.
6. A “zero-based” approach for non-faculty instructional cost components.
Further, from a conceptual standpoint, Methods #1 through #4 could potentially be differentiated by discipline area and/or institutional type, and or include a recognition of fixed costs/economies of scale. Each method has its own relative advantages and disadvantages. Method #1 is quite straightforward, although it suffers from having no direct linkage to instructional workload at an institution. Among Methods #2 - #4 however, the primary advantage is a direct link to instructional workload. However, these methods suffer from a lack of existing actual data with which to calibrate the guidelines. While Methods #5 and #6 are not “guidelines” in the strictest sense of the term, they are alternative budgeting methodologies that the General Assembly could choose to adopt for funding non-faculty instructional costs. There are significant disadvantages inherent in each approach, however. The primary disadvantage in Method #5 is that it may serve to perpetuate past funding inequities and inadequacies among and within institutions. The primary disadvantage to Method #6 is that any “zero-based” budget approach is very time consuming to implement and maintain. An equally important issue to be resolved in establishing base funding guidelines for non-faculty instructional costs is the data to be used in calibrating the guideline. Because there is no central source of data nationally, there are essentially three data sources available in establishing the guideline:
1. Obtain relevant historical data from Virginia’s public colleges and universities.
2. Borrow/adapt guideline factors used by other states
3. Conduct a special survey of institutions and/or systems in other states to collect relevant actual data (or survey current peers)
As with the guideline methods discussed in the previous section, these three data sources are not mutually exclusive (i.e., different data sources could potentially be used for different cost components). The primary advantage of the first two data sources is their availability. Their disadvantages are that they may serve to perpetuate funding inadequacies and inequities (#1), and may not be relevant to the unique needs of Virginia’s public colleges and universities (#2). The primary advantage of the third potential data source is the ability to tailor the data to a desired guideline method, as opposed to “fitting” the

Final Report to Joint Subcommittee
MGT of America, Inc. Page 13
guideline method to available data. Its primary disadvantages are the time involved in data collection (significant), and the ultimate risk of a low response rate from those institutions and systems that are surveyed. After considering the various pros and cons of each alternative, and consulting with institutional representatives, a decision was made to survey other states regarding current funding patterns relative to non-faculty instructional costs. The survey was developed and sent to selected public university and community college systems nationally in February – March, 2000, and collected comparative data on non-faculty instructional support staffing and costs. The systems included institutions that are current peers of Virginia’s four-year institutions and community colleges. Responses were received from nine systems, representing 168 four- and two-year institutions.4 Initial analyses of the survey data indicated a wide range among respondents as to the relationship between non-faculty instructional costs and faculty instructional costs. In order to minimize the impact of outliers in the analyses, the data were further refined to exclude those institutions that were more than one standard deviation (plus/minus) from the mean of the institutions within the data set. The results showing both the total set of institutions and those within the one standard deviation band are shown in Exhibit 6 below.
EXHIBIT 6 NON-FACULTY INSTRUCTIONAL COSTS AS A PERCENT OF
FACULTY INSTRUCTIONAL COSTS ALL SURVEY RESPONDENTS
VariableAll
InstitutionsFiltered*
InstitutionsNumber of Institutions 168 121 Mean: Non-Faculty Instructional Costs as a % of Instructional Faculty Costs
46.1% 42.1%
Median: Non-Faculty Instructional Costs as a % of Instructional Faculty Costs
47.3% 31.5%
Standard Deviation 42.1% 22.8%Mean plus one standard deviation 88.2%Mean less one standard deviation 3.9%
Source: MGT Survey on Non-faculty Instructional Costs, 2000.
*Filtered those institutions for which the value of Non-faculty Instructional Costs as a Percent of Faculty Instructional Costs fell above/below one standard deviation of the mean for this value for all public institutions included in the survey.
Based on the survey findings and refined analyses as shown above in Exhibit 7, and discussions with the technical advisory group, it was determined that an initial guideline rate of 40 percent should be used in calculating non-faculty instructional costs. At the
4 The responding systems included: the Arizona University System, the California State University System, the Illinois Community College Board, the North Carolina Community College System, the State University System of Florida, the University of North Carolina System, the University and Community College System of Nevada, the University of Tennessee System, and the University of Wisconsin System.

Final Report to Joint Subcommittee
MGT of America, Inc. Page 14
same time, it was also recognized that additional work may be needed to further refine and validate this guideline, perhaps through another survey in the future. Fringe Benefit Costs. To recognize all elements of instructional cost, fringe benefit rates were also applied to the sum of the calculated instructional faculty salaries and the non-faculty instructional costs. Institution-specific rates were developed from actual FY 2000 expenditure data by calculating fringe benefits as a percent of all expenditures in the program of instruction, excluding fringe benefits. This approach recognizes fringe benefit costs for faculty and for the personal services component of non-faculty instructional costs, based on actual institutional patterns. (Note: For the support programs, discussed in the next section of this report, the calculations assume that any fringe benefits associated with personal services in those programs would be covered by the guideline-generated calculation.) 4.2 Support Services As indicated earlier, MGT used a similar methodology to research the development of base funding guidelines for academic support, institutional support, and student services. The general methodology used was a statistical analysis of the relationship between unrestricted institutional costs in each of the three support program areas and potential “cost drivers” through linear regression modeling. The cost drivers explored for the three program areas through these models are shown in Exhibit 7. The focus was on unrestricted expenditures in order to exclude those costs that are generally outside of the institution’s discretion (e.g., grant-funded activities). Multiple, iterative regression analyses were conducted during the study process. The ultimate goal in working through the various regression analyses was to generate funding factors that have demonstrated a statistical relationship with each of the three program areas. The data source used for the statistical analyses was the National Center for Education Statistics’ (NCES) Integrated Postsecondary Education Data System (IPEDS). Through IPEDS, NCES surveys approximately 11,000 institutions nationally through a regular data collection cycle on institutional characteristics, student enrollment, staffing, finances, and degrees granted, among others. The data analyses initially focused on two populations of institutions. The first population included all public colleges and universities in the IPEDS universe, excluding specialized institutions such as stand-alone medical schools (approximately 1,300). The second population included all public colleges and universities that are considered “official peers” of Virginia institutions for salary comparison purposes (approximately 370). The reason for looking at the public peers separately was to determine if there were materially different results from all public institutions as a whole. The overall methodology employed involved a three-stage process. The initial stage was to run several different models with various combinations of “cost driver” variables to determine which cost drivers showed up as having the strongest statistical relationships and predictive value in each of the three program areas using the most recent year’s available IPEDS data (1996-97) at the time. The list of initial cost drivers included in the regression analyses for each program area is shown in Exhibit 8. The results of these initial analyses were shared and discussed with the technical advisory group in November 1999.

Final Report to Joint Subcommittee
MGT of America, Inc. Page 15
The second stage was to narrow further analysis to those cost driver variables that appeared the most defensible through the results of the initial statistical analyses, as indicated below:
n Academic Support: Unrestricted Instruction, Research, and Public Service Expenditures.
n Institutional Support: Unrestricted E&G Expenditures (Less Institutional Support).
n Student Services: Total Student Headcount.
Also, these analyses were conducted using the two most recent years worth of data available at the time (1995-96 and 1996-97) in order to see if the initial relationships were consistent across both years.

Final Report to Joint Subcommittee
MGT of America, Inc. Page 16
EXHIBIT 7 COST DRIVERS INCLUDED IN INITIAL STATISTICAL ANALYSES FOR ACADEMIC SUPPORT,
INSTITUTIONAL SUPPORT AND STUDENT SERVICES
Support Program AreaOrganizational Characteristics Financial Characteristics Faculty/Staff Demographics Student Demographics
Academic Support Carnegie Classification Unrestricted Instruction, Research, and Public Service Expenditures
Total Number of Faculty Total Student Headcount
Land Grant Institution (Y/N) Number of Full-time Faculty
Number of Academic Programs by Level
Number of Part-time Faculty
Institutional Support Carnegie Classification Total Unrestricted Educational and General Expenditures (Less Institutional Support)
Total Faculty and Staff Headcount
Land Grant Institution (Y/N) Number of Full-time Faculty and Staff
Medical School (Y/N) Number of Part-time Faculty and Staff
Teaching Hospital (Y/N)
Student Services Carnegie Classification Total Student Headcount
Number of Full-time Students
Number of Part-time Students

Final Report to Joint Subcommittee
MGT of America, Inc. Page 17
The third stage was to further disaggregate the analyses by institutional type. That is, separate regression models were run for the following broad groups of institutions for each of the three support program areas:
n Research n Doctoral n Masters/Comprehensive n Baccalaureate n Two-year
Institutions were generally assigned to each of these groups based on their current Carnegie classification. The purpose of this step was to determine if different funding factors might be justified for the different types of institutions in Virginia. Exhibit 8 below shows the category for each Virginia institution. The results of these analyses indicated that there are statistically significant differences among the various institutional types that should be recognized in developing funding guidelines.
EXHIBIT 8 CLASSIFICATION OF VIRGINIA PUBLIC INSTITUTIONS BY
BROAD CARNEGIE TYPE
Institutional Type Virginia InstitutionsResearch UVa, VCU, VPIDoctoral CWM, ODU, GMUMasters/Comprehensive JMU, RU, NSU, VSU, LC, CNUBaccalaureate VMI, MWC, UVa - WiseTwo-Year RBC, VCCS
The second and third stage results were discussed with the technical advisory group during the early spring 2000. There was consensus within the group based on the regression results, that:
n the appropriate academic support guideline would be academic support as a percent of instruction, research, and public service expenditures (as generated by the base funding guidelines) plus an adjustment factor5, differentiated by institutional type;
n the appropriate institutional support guideline would be institutional support as a percent of total E&G expenditures less institutional support and scholarships & fellowships (as generated by the base funding guidelines) plus an adjustment factor, differentiated by institutional type; and
n the appropriate student services guideline would be a model where each institution received a per capita amount to be applied to the
5 The “adjustment factor” is the result of a statistical function that improves the relationship between the values being measured and predicted. It is also referred to as the “constant” in a linear regression model.

Final Report to Joint Subcommittee
MGT of America, Inc. Page 18
institution’s total headcount enrollment, plus an adjustment factor, differentiated by institutional type.
It was also the consensus of the technical advisory group that the statistical analyses should include all public institutions, and not just the public peers of the Virginia institutions. This is because a larger number of observations generally improves the stability and applicability of the statistical analyses. Further, the statistical analyses generally did not indicate wide disparities in the results for the two groups. The recommended base funding guideline methodology recommendations for the three support program areas are outlined in Exhibit 9 below.
EXHIBIT 9 PROPOSED SUPPORT PROGRAM BASE FUNDING GUIDELINE METHODOLOGIES
Support Program Area Recommended Guideline Approach
Differentiation by Institutional
TypeAcademic Support A Percentage of Unrestricted Instruction,
Research, and Public Service Guideline Requirements, plus an Adjustment Factor
Yes 1
Institutional Support A Percentage of Total Educational and General Budget Guideline Requirements (less institutional support), plus an adjustment factor.2
Yes 1
Student Services Dollar amount per headcount student, plus an adjustment factor.
Yes 1
1Research, Doctoral, Master's/Comprehensive, Baccalaureate, and Two-Year.
2For purposes of calculating total E&G budget guideline requirements for the institutional support guideline, the methodology included actual FY 2000 expenditures for operation and maintenance of plant. When a guideline for operation and maintenance of plant is developed, the results of that guideline would be included in the institutional support guideline.
Further analyses were conducted throughout the course of the study in order to refine the guideline rates for each of the three program areas, including the replication of the three relevant regression models using the most recent IPEDS data (1997-98). Further adjustments were also made during these regression analyses to improve the “fit” of the model by excluding outliers from the data set. The final regression results for 1997-98 used for the support services guideline rates are included in Appendix C at the end of this report. 4.3 Recommended Base Funding Adjustments The ultimate goal for the development of the base funding guidelines is to compare the current level of appropriated funds received by Virginia’s public colleges and universities with the amount generated by the guidelines. The amounts generated by the guidelines represent, in theory, a minimum level of base funding adequacy for Virginia’s institutions of higher education, relative to their individual mission and program array.

Final Report to Joint Subcommittee
MGT of America, Inc. Page 19
To develop this comparison, the guideline estimate was calculated for each institution using 2000-01 projected enrollments for instruction (both faculty and non-faculty costs), academic support, institutional support, and student services. The guideline estimates were adjusted for each institution to arrive at a figure that would provide an “apples to apples” comparison with the FY 2001 appropriation. Examples of these adjustments included adding back in the appropriated amounts for medical, dental, and veterinary medicine for the University of Virginia, Virginia Commonwealth University, and Virginia Tech, given that the instructional guidelines did not address those particular program areas. Legislative staff then met with representatives from each institution to review the estimates and the assumptions used in the calculations, and refine the assumptions if justified. Exhibit 10 presents the results of the guideline estimates and the FY 2001 appropriated funding level for those institutions where the current funding level is less than that generated by the guidelines. As indicated, in total, appropriated funding is $187 to $206 million below the guideline estimate, or a nine to ten percent deficit. Twelve of the 15 four-year institutions and both two-year institutions appear to have funding below the guideline calculation estimates. The wide differences in the percentage variances shown for the individual institutions is reflective of the fact that Virginia has not had funding guidelines for higher education in effect for several years, as well as the fact that enrollment growth at some institutions has been much greater than at other institutions. Funding has not been allocated on the basis of curricular needs or changes in program mix over time, which when combined with varying rates of enrollment growth (or decline), leads to a structural imbalance in institutional funding needs and base budgets. At the same time, however, the analysis indicated that three of the four-year institutions (Norfolk State University, UVa – Wise, and VMI), appear to have adequate funding for their current mission and curriculum.

Final Report to Joint Subcommittee
MGT of America, Inc. Page 20
EXHIBIT 10 COMPARISON OF BASE FUNDING GUIDELINES CALCULATION ESTIMATE
AND ACTUAL FY 2001 BASE FUNDING ($ in millions)
Institution1Guideline Estimate
Current Funding
Four-Year InstitutionsJames Madison University 141.4$ 116.2$ 24.0$ - 26.0$ 20.7 - 22.4Virginia Tech 355.0 334.9 19.0 - 21.0 5.7 - 6.3George Mason University 204.5 184.4 19.0 - 21.0 10.3 - 11.4University of Virginia 340.8 323.1 17.0 - 18.5 5.3 - 5.7Old Dominion University 162.4 147.0 14.5 - 16.0 9.9 - 10.9Radford University 72.1 62.0 9.5 - 10.5 15.3 - 16.9Virginia Commonwealth University 284.6 275.2 9.0 - 9.9 3.3 - 3.6College of William and Mary 99.2 92.7 6.0 - 6.7 6.5 - 7.2Christopher Newport University 36.1 33.3 2.5 - 3.0 7.5 - 9.0Longwood College 32.7 30.0 2.5 - 3.0 8.3 - 10.0Mary Washington College 36.5 34.0 2.3 - 2.5 6.8 - 7.4Virginia State University 39.3 38.5 0.5 - 1.0 1.3 - 2.6
Four-Year Institutions Subtotal 1,804.6$ 1,671.3$ 125.8$ - 139.1$ 7.5 - 8.3
Two-Year InstitutionsVCCS 484.8$ 421.0$ 61.0$ - 67.0$ 14.5 - 15.9Richard Bland College 7.0 6.8 0.1 - 0.2 1.5 - 2.9
Two-Year Institutions Subtotal 491.8$ 427.8$ 61.1$ - 67.2$ 14.3 - 15.7
Total, All Institutions 2,296.4$ 2,099.1$ 186.9$ - 206.3$ 8.9 - 9.8
Dollar Range of Variance
Percentage Variance
1The base funding guideline analysis indicated that Norfolk State University, UVa - Wise, and VMI appear to have adequate funding for their current mission and curriculum; therefore, these three institutions are not included in the table.

Final Report to Joint Subcommittee
MGT of America, Inc. Page 21
5.0 Issues For Further Review and Discussion The study process also dealt with issues for which there are no definitive recommendations at this point, but which will be important for further review and discussion by the Subcommittee. These include the funding of plant operations and maintenance as well as the funding of enrollment growth for the future. Both issues are outlined below, with recommendations for future action. 5.1 Plant Operations and Maintenance The development of base funding guidelines for plant operations and maintenance poses a number of complexities when compared to the other support program areas previously described. First, perhaps more than other support areas, Virginia’s public colleges and universities are exceptionally diverse in their physical plants, in terms of structure, utilization, and operating costs (e.g., utilities). Secondly, compared to funding the support program areas described in the previous section, national data on specific costs and cost drivers related to plant operations and maintenance is relatively sparse. Different strategies were employed in an attempt to develop initial base funding guidelines for plant operations and maintenance. One approach was a proposal from the institutional representatives based on a number of factors, including plant replacement value and staffing ratios related to total space and acreage. Another approach involved the application of norms from an annual survey conducted by the Association of Physical Plant Administrators (APPA). Both approaches resulted in widely divergent funding needs depending on the institution when compared to current funding levels, suggesting that a purely formulaic approach similar to those used in the other guideline areas may not fully account for the unique needs related to each campus’ physical plant. Recommendation for Future Action. Legislative staff should continue to work with the technical advisory group over the next several weeks to develop a guideline for plant operations and maintenance. This guideline should be based on national norms where applicable and appropriate to provide equitable funding of similar costs, but should also allow for significant flexibility in order to capture the key factors that are unique to each institution. 5.2 Enrollment Growth Funding As noted previously, part of the reason that the results of the base funding guideline calculations varied greatly by institution was that there have been no guidelines in place to recognize enrollment growth during the past several years. Thus, it is important that a mechanism to fund enrollment growth for Virginia’s public colleges and universities be established for future years in order prevent further erosion of base funding adequacy. At its October 2000 meeting, the Joint Subcommittee directed MGT and legislative staff to develop an enrollment growth funding guideline based on the following principles:

Final Report to Joint Subcommittee
MGT of America, Inc. Page 22
n the guideline should recognize enrollment growth, but should not provide incentives to grow merely for more funding; and,
n the guideline should recognize the concept of “marginal cost” in providing funding for additional students.
The latter principle reflects the phenomenon that as enrollment grows at an institution, the overall unit costs borne by the institution are generally less than the average cost per student, especially in the short run. This is due to the fact that there are economies of scale and other efficiencies that can be realized as enrollment grows, particularly in administrative and other support areas. MGT conducted a search of the literature to determine if there was any guidance in past research or any other models to inform the development of an enrollment growth funding guideline. There is very little published research on this topic, due in part to the technical and practical difficulties of deriving marginal costs in an educational setting. Perhaps the only consistent and applicable finding of the research is that the ratio of marginal cost/average cost is typically higher for instructional and related programs than it is for administrative support programs. The California State University (CSU) System currently utilizes this principle in funding enrollment growth, by funding each additional student at a set dollar amount with varying discount factors in place depending on the program to recognize marginal costs as follows:
n Instruction – Fully Funded n Academic Support – Discounted by 15 percent n Student Services – Discounted by 20 percent n Institutional Support – Discounted by 35 percent
It should be noted, however, that these discount rates were developed in negotiation between the CSU System, the California legislature, and the governor’s office, rather than a purely empirical approach, perhaps reflecting the inherent imprecision in calculating marginal costs.6 Recommendation for Future Action. Enrollment growth should be funded at a set dollar amount per student, based on the average appropriation per student at each institution (post-base funding adequacy adjustment). This amount should also be adjusted to recognize marginal cost. Further, not all programs (instruction, academic support, institutional support, and student services) should be funded at the same relative level. Funding should be concentrated on those programs where the impact of additional enrollment is most apparent (i.e., instruction, academic support, student services), with more significant discount factors applied to institutional support and plant operations and maintenance. Legislative staff should work with the technical advisory group over the next several weeks to develop the relative discount factors for each program area.
6 Source: California State University 2000-01 Support Budget Documentation, www.calstate.edu/tier3/Budget/2000_01BudIndex

Final Report to Joint Subcommittee
MGT of America, Inc. Page 23
6.0 Summary and Conclusions This report has presented base funding guideline recommendations for the Joint Subcommittee on Higher Education Funding Policies relative to the funding of Virginia’s public colleges and universities. The guidelines encompass four E & G program areas: instruction, academic support, institutional support, and student services. The results of the recommended guideline estimates indicate that, in total, appropriated funding for Virginia’s public colleges and universities is $187 to $206 million below the guideline estimate, or a nine to ten percent deficit. Twelve of the 15 four-year institutions and both two-year institutions appear to have funding below the guideline calculation estimates. At the same time, however, the analysis indicated that three of the four-year institutions (Norfolk State University, UVa-Wise, and VMI) appear to have adequate funding for their current mission and curriculum. There are two related areas that will require further review and consideration by the Subcommittee. The first is the development of a guideline for funding plant operations and maintenance costs that should be flexible enough to recognize the wide-ranging diversity in physical plant among Virginia’s institutions of higher education, while equitably funding similar O & M costs. The second issue is the funding of future enrollment growth. The preliminary recommendation is to fund enrollment at a set dollar amount per student that would be less than the average appropriation per student at each institution, adjusted to recognize marginal costs, particularly in the administrative areas. In conclusion, the application of these base funding guidelines should provide a level of base funding adequacy for every Virginia public college and university, assuming that the necessary funding is allocated to meet the identified shortfalls in a timely and systematic manner. At the same time, however, it should be recognized that these guidelines will need to be revisited periodically (perhaps every four years) to reflect instructional and other program changes at the institutions that have taken place in the interim, as well as other more technical adjustments that may need to be addressed (e.g., inflation). As such, the Subcommittee may wish to convene periodically in the interim to review and discuss issues regarding base funding adequacy and the recommended funding guidelines.

MGT of America, Inc. Page 24
APPENDICES
APPENDIX A: STUDENT/FACULTY RATIOS BY ACADEMIC DISCIPLINE AND INSTRUCTIONAL LEVEL – SELECTED STATES AND APPENDIX M
APPENDIX B: INSTRUCTIONAL STAFFING LEVEL STANDARDS FROM
SELECTED ACCREDITING ORGANIZATIONS
APPENDIX C: REGRESSION MODEL RESULTS RELATED TO PRELIMINARY RECOMMENDATIONS FOR ACADEMIC SUPPORT, INSTITUTIONAL SUPPORT, AND STUDENT SERVICES GUIDELINES

Appendices
MGT of America, Inc. Page 25
Discipline AreaUW
System1 PSSHE2 Connecticut3 Mississippi4 Illinois5 Average Median
Virginia (Appendix M)6
AGR. BUSINESS AND PRODUCTION 19 16 27 21 19 16AGRICULTURE/AGR. SCIENCES 19 16 27 21 19 16AGRICULTURE/NATURAL RESOURCES 23 19 16 27 21 21 16ARCHITECTURE/ENV. DESIGN 16 19 14 16 16 16 16AREA/ETHNIC STUDIES 22 26 17 22 22 22COMMUNICATION/JOURNALISM 21 20 23 21 21 21 22COMPUTER SCIENCE 16 18 14 23 18 17 22EDUCATION 27 20 23 19 22 21 22TEACHER EDUCATION 21 21 21 22ENGINEERING 16 19 14 17 17 16 16ENGINEERING TECHNOLOGY 15 14 13 14 14 12/16FOREIGN LANGUAGES 17 20 23 21 20 20 16HOME ECONOMICS 28 20 16 27 23 23 22LAW/LEGAL STUDIES 23 15 19 19 22ENGLISH 18 23 20 20 22LETTERS 18 18 18 22LIBERAL ARTS 18 15 16 16 22LIBRARY SCIENCE 33 18 20 10 20 19 22BIOLOGY/LIFE SCIENCES 24 19 22 22 22 22LIFE SCIENCES 23 23 23 22MATH/STATISTICS 23 19 23 23 22 23 22MILITARY TECHNOLOGIES 26 26 26 22INTERDISCIPLINARY STUDIES 49 26 24 33 26 22LEISURE STUDIES/RECREATION 23 27 25 25PHYSICAL EDUCATION 22 22 22 22PHILOSOPHY & RELIGION 26 26 23 26 25 26 22PHYSICAL SCIENCES 26 34 30 30 22CHEMISTRY 17 22 20 20 20 22GEOLOGY 25 25 25 25 22PHYSICS 18 22 17 19 18 22PSYCHOLOGY 32 23 37 30 32 22PROTECTIVE SERVICES 14 28 21 21PUBLIC AFFAIRS 27 26 23 22 24 24 22SOCIAL WORK 18 18 18 22SOCIOLOGY/ANTHROPOLOGY 30 23 31 28 30 22ECONOMICS 27 30 28 28 22GEOGRAPHY 29 39 34 34 22HISTORY 24 28 26 26 22INTERNATIONAL RELATIONS 20 20 20 22POLITICAL SCIENCE/URBAN STUDIES 26 19 25 23 25 22INDUSTRIAL TECHNOLOGY 23 20 8 17 20 12THEATRE ARTS 12 11 19 14 12 16ART/FINE & STUDIO 19 18 11 20 17 19 16MUSIC 12 22 13 16 13 16HEALTH SCIENCES 11 19 8 26 16 15 10NURSING 8 13 10 10 10PHARMACY 8 8 8 8 10BUSINESS 27 26 23 37 28 27 22ALL LOWER DIVISION 22 23 22 22OTHER 26 26 26
1Source: University of Wisconsin System, 1997-98. Report CS0611 (Actual data)2Source: Pennsylvania State System of Higher Education formula (Formula rates)3Source: Connecticut Department of Higher Education formula (Formula rates)
4Source: Mississippi Institutions for Higher Learning formula (Formula rates)5Source: Illinois Board of Higher Education 1997-98 Public University Cost Study (Actual data)6Note: Ratios shown for comparison purposes only for actual or similar discipline areas.
APPENDIX A-1LEVEL 1 (FRESHMAN-SOPHOMORE) STUDENT-FACULTY RATIOS BY DISCIPLINE AREA
SELECTED STATES

Appendices
MGT of America, Inc. Page 26
Discipline AreaUW
System 1 PSSHE2 Connecticut3 Mississippi4 Illinois5 Average Median
Virginia
(Appendix M)6
AGR. BUSINESS AND PRODUCTION 12 13 21 15 13 11AGRICULTURE/AGR. SCIENCES 12 13 23 16 13 11AGRICULTURE/NATURAL RESOURCES 14 12 13 23 15 14 11ARCHITECTURE/ENV DESIGN 13 12 12 11 12 12 11AREA/ETHNIC STD 20 10 15 15 14COMMUNICATION/JOURNALISM 13 14 13 19 15 14 14COMPUTER SCIENCE 16 16 12 21 16 16 14EDUCATION 16 14 21 19 17 17 14TEACHER EDUCATION 18 18 18 14ENGINEERING 11 12 12 13 12 12 11ENGINEERING TECHNOLOGY 12 12 14 13 12 11FOREIGN LANGUAGE 14 14 13 17 15 14 11HOME ECONOMICS 15 14 14 18 15 15 14LAW/LEGAL STUDIES 23 13 18 18 14ENGLISH 15 13 14 14 14LETTERS 14 17 16 16 14LIBERAL ARTS 14 13 13 13 14LIBRARY SCIENCE 19 20 10 16 19 14BIOLOGY/LIFE SCIENCES 14 12 11 12 12 14LIFE SCIENCES 12 16 14 14 14MATH/STATISTICS 17 16 13 20 17 17 14MILITARY TECHNOLOGY 14INTERDISCIPLINARY STUDIES 24 26 25 25 14LEISURE STUDIES/RECREATION 16 22 22 20 22PHYSICAL EDUCATION 15 16 22 18 16 14PHILOSOPHY & RELIGION 19 16 13 21 17 18 14PHYSICAL SCIENCES 12 24 18 18 14CHEMISTRY 12 11 15 13 12 14GEOLOGY 13 17 15 15 14PHYSICS 14 11 17 14 14 14PSYCHOLOGY 17 16 13 23 17 17 14PROTECTIVE SERVICES 16 14 23 18 16PUBLIC AFFAIRS 18 16 13 18 16 17 14SOCIAL WORK 16 13 14 14 14SOCIAL SCIENCES 15 15 15 14SOCIOLOGY/ANTHROPOLOGY 20 16 13 23 18 18 14ECONOMICS 18 13 22 18 18 14GEOGRAPHY 18 13 23 18 18 14HISTORY 18 13 22 18 18 14INTERNATIONAL RELATIONSPOLITICAL SCIENCE/URBAN STUDIES 19 13 17 16 17 14INDUSTRIAL TECHNOLOGY 17 14 6 12 14TRANSPORTATIONTHEATRE ARTS 9 11 8 14 11 10 11ART/FINE & STUDIO 12 11 8 13 11 12 11MUSIC 8 10 9 9 11HEALTH SCIENCES 11 12 8 17 12 12 8SPEECH/LANGUAGE PATHOLOGY 12 12 12NURSING 8 8 10 9 8 8PHARMACY 8 8 8 8BUSINESS 21 16 20 24 20 20 14ALL UPPER DIVISION 19 18 18 18
1Source: University of Wisconsin System, 1997-98. Report CS0611 (Actual data)2Source: Pennsylvania State System of Higher Education formula (Formula rates)3Source: Connecticut Department of Higher Education formula (Formula rates)
4Source: Mississippi Institutions for Higher Learning formula (Formula rates)5Source: Illinois Board of Higher Education 1997-98 Public University Cost Study (Actual data)
6Note: Ratios shown for comparison purposes only for actual or similar discipline areas.
APPENDIX A-2LEVEL 2 (JUNIOR-SENIOR) STUDENT-FACULTY RATIOS BY DISCIPLINE AREA
SELECTED STATES

Appendices
MGT of America, Inc. Page 27
Discipline AreaUW
System1 PSSHE2 Connecticut3 Mississippi4 Illinois5 Average Median
Virginia (Appendix M)6
AGR. BUSINESS AND PRODUCTION 10 9 13 11 10 7AGRICULTURE/AGR. SCIENCES 10 9 12 10 10 7AGRICULTURE/NATURAL RESOURCES 9 10 9 12 10 10 7ARCHITECTURE/ENV. DESIGN 10 10 8 10 9 10 7AREA/ETHNIC STUDIES 7 16 10 11 10 10MARKETING 16 13 15 15 10COMMUNICATION/JOURNALISM 9 12 13 18 13 13 10COMPUTER SCI 11 14 8 13 12 12 10EDUCATION 12 12 15 18 14 14 10TEACHER EDUCATION 17 17 17 10ENGINEERING 7 10 8 13 9 9 7ENGINEERING TECHNOLOGY 10 8 12 10 10 7FOREIGN LANGUAGE 7 12 13 12 11 12 7VETERINARY MEDICINE 8 8 8 7.8HOME ECONOMICS 7 12 11 14 11 12 10LAW/LEGAL STUDIES 16 21 20 19 20 10/20ENGLISH 8 13 11 11 10LETTERS 16 13 13 14 13 10LIBERAL ARTS 16 13 9 13 13 10LIBRARY SCIENCE 14 11 11 12 11 10BIOLOGY/LIFE SCIENCES 9 10 8 9 9 7LIFE SCIENCES 11 11 11 7MATH/STATISTICS 10 14 13 14 13 13 10MILITARY TECHNOLOGY 10INTERDISCIPLINARY STUDIES 19 16 16 17 16 10LEISURE STUDIES/RECREATION 16 15 13 15 15PHYSICAL EDUCATION 8 16 15 13 13 14 10PHILOSOPHY & RELIGION 6 16 13 9 11 11 10PHYSICAL SCIENCES 10 8 11 10 10 7CHEMISTRY 11 8 15 11 11 7GEOLOGY 4 8 5 6 5 7PHYSICS 4 8 8 7 8 7PSYCHOLOGY 10 14 13 13 13 13 10PROTECTIVE SERVICES 16 14 15 15 15PUBLIC AFFAIRS 13 16 13 16 15 15 10SOCIAL WORK 16 13 10 13 13 10SOCIOLOGY/ANTHROPOLOGY 7 16 13 13 12 13 10ECONOMICS 14 13 17 15 14 10GEOGRAPHY 9 13 13 12 13 10HISTORY 9 13 14 12 13 10INTERNATIONAL RELATIONSPOLITICAL SCIENCE/URBAN STUDIES 9 13 10 11 10 10INDUSTRIAL TECHNOLOGY 15 12 1 9 12TRANSPORTATIONTHEATRE ARTS 6 9 8 10 8 9 7ART/FINE & STUDIO 8 9 8 9 9 9 7MUSIC 4 9 8 7 7 8 7HEALTH SCIENCES 7 16 7 15 11 11 6SPEECH/LANGUAGE PATHOLOGY 10 10 10NURSING 8 7 9 8 8 6PHARMACY 7 7 7 6BUSINESS 15 16 13 20 16 16 10ALL MASTER'S LEVEL 17 14 16 16OTHERTHESIS/DISSERTATION SUPERVISION 8 8 8
1Source: University of Wisconsin System, 1997-98. Report CS0611 (Actual data)2Source: Pennsylvania State System of Higher Education formula (Formula rates)3Source: Connecticut Department of Higher Education formula (Formula rates)4Source: Mississippi Institutions for Higher Learning formula (Formula rates)5Source: Illinois Board of Higher Education 1997-98 Public University Cost Study (Actual data)6Note: Ratios shown for comparison purposes only for actual or similar discipline areas.
APPENDIX A-3LEVEL 3 (MASTER'S) STUDENT-FACULTY RATIOS BY DISCIPLINE AREA
SELECTED STATES

Appendices
MGT of America, Inc. Page 28
Discipline Area UW System1 PSSHE2 Connecticut3 Mississippi4 Illinois5 Average MedianVirginia
(Appendix M)6
AGR. BUSINESS AND PRODUCTION 8 9 15 11 9 7AGRICULTURE/AGR. SCIENCES 8 9 16 11 9 7AGRICULTURE/NATURAL RESOURCES 9 8 9 16 10 9 7ARCHITECTURE/ENV. DESIGN 7 8 8 5 7 8 7AREA/ETHNIC STUDIES 4 8 5 6 5 8ART/FINE & STUDIO 12 7 8 10 9 9 7BIOLOGY/LIFE SCIENCES 11 8 8 9 8 7BUSINESS 5 16 13 11 11 12 8CHEMISTRY 10 8 21 13 10 7COMMUNICATION/JOURNALISM 10 8 13 10 10 10 8COMPUTER SCIENCE 12 8 8 18 12 10 8ECONOMICS 6 13 9 9 9 8EDUCATION 8 8 15 13 11 11 8TEACHER EDUCATION 12 12 12 8ENGINEERING 7 8 8 13 9 8 7ENGINEERING TECHNOLOGY 8 8 14 10 8 7ENGLISH 7 13 10 10 8FOREIGN LANGUAGE 6 8 13 9 9 9 7GEOGRAPHY 7 13 9 10 9 8GEOLOGY 8 8 9 8 8 7HEALTH SCIENCES 6 8 7 6 7 7 6HISTORY 9 13 11 11 11 8HOME ECONOMICS 6 8 11 12 9 10 8INDUSTRIAL TECHNOLOGY 8 10 9 9INTERDISCIPLINARY STUDIES 27 3 15 15 8INTERNATIONAL RELATIONSLETTERS 8 13 11 11 11 8LIBERAL ARTS 8 13 3 8 8 8LAW/LEGAL STUDIES 18 21 0 13 18 8LIBRARY SCIENCE 18 11 4 11 11 8LIFE SCIENCES 14 14 14 7MARKETING 16 13 15 15 8MATH/STATISTICS 8 8 13 9 10 9 8MILITARY TECHNOLOGIESMUSIC 7 7 8 8 8 8 7NURSING 8 7 8 8 8 6LEISURE STUDIES/RECREATION 15 6 11 11PHARMACY 7 7 7 6PHILOSOPHY & RELIGION 10 12 13 8 11 11 8PHYSICAL EDUCATION 7 16 15 6 11 11 8PHYSICAL SCIENCES 8 8 7 8 8 7PHYSICS 8 9 8 8 7POLITICAL SCIENCE/URBAN STUDIES 4 12 13 9 9 10 8PSYCHOLOGY 7 13 10 10 10 8PROTECTIVE SERVICES 14 8 11 11PUBLIC AFFAIRS 7 13 15 12 13 8SOCIAL WORK 12 13 13 13 8SPEECH/LANGUAGE PATHOLOGYOTHERSOCIOLOGY/ANTHROPOLOGY 11 13 9 11 11 8TRANSPORTATIONTHEATRE ARTS 14 7 8 8 9 8 7VETERINARY MEDICINE 2 2 2ALL DOCTORAL LEVEL 12 11 11 11THESIS/DISSERTATION SUPERVISION 8 8 8
1Source: University of Wisconsin System, 1997-98. Report CS0611 (Actual data)2Source: Pennsylvania State System of Higher Education formula (Formula rates)3Source: Connecticut Department of Higher Education formula (Formula rates)4Source: Mississippi Institutions for Higher Learning formula (Formula rates)5Source: Illinois Board of Higher Education 1997-98 Public University Cost Study (Actual data)6Note: Ratios shown for comparison purposes only for actual or similar discipline areas.
APPENDIX A-4LEVEL 4 (DOCTORAL) STUDENT-FACULTY RATIOS BY DISCIPLINE AREA
SELECTED STATES

Appendices
MGT of America, Inc. Page 29
Discipline GroupingLevel I
(Fr.-So.)Level II (Jr.-Sr.)
Level III (Masters)
Level IV (Doctoral)
First Professional
(Law)Social and Behavioral Sciences 27 18 12 10 13Humanities 20 13 8 9 ---Engineering and Physical Sciences 21 14 8 10 ---Agricultural and Life Sciences 25 14 8 14 ---Non-Clinical Health Sciences 20 12 6 7 ---Clinical Health Sciences 13 10 8 7 ---Health Sciences Blended Average 15 11 7 7 ---
Source: University of Wisconsin System Administration.
ACTUAL FTE STUDENT/FTE INSTRUCTIONAL STAFF RATIOS BY DISCIPLINEUNIVERSITY OF WISCONSIN SYSTEM, WEIGHTED AVERAGE OF FALL 97 AND 98
APPENDIX A-5

Appendices
MGT of America, Inc. Page 30
Discipline Group Lower Upper GraduateGroup 1a 37 28 19Group 2b 34 27 17Group 3c 26 18 9Group 4d 26 --- ---
aLaw, Letters, Library Science, Psychology, and Social Sciences.
dRemedial and Developmental Programs.
Source: University System of Georgia.
APPENDIX A-6
bArea Studies, Business, Communications, Education, Home Economics, Mathematics, Public Affairs, and Interdisciplinary Studies.cAgriculture, Architecture, Biological Sciences, Computer Science, Engineering, Fine and Applied Arts, Foreign Languages, Health Professions, Physical Sciences, and Technologies.
UNIVERSITY SYSTEM OF GEORGIA INSTRUCTIONALPRODUCTIVITY RATIOS USED IN INSTRUCTIONAL FORMULA
(Annualized and Converted to FTE Student Equivalent)

Appendices
MGT of America, Inc. Page 31
APPENDIX B
INSTRUCTIONAL STAFFING LEVEL STANDARDS FROM SELECTED ACCREDITING ORGANIZATIONS
Key: NLNAC – Nursing; AACSB – Business; ABET – Engineering; ABA – Law; CAAHEP – Health; NAAB - Architecture; NCATE - Education A. NLNAC
n Number and utilization of full- and part-time faculty meet the needs of the nursing unit to fulfill its purposes.
From National League for Nursing – Standards & Criteria – Standard II: Faculty http://www.nlnac.org/am_page3.htm
B. AACSB
n IN.1: The school should provide and manage resources to meet the instructional responsibilities created by the programs offered.
From AACSB – Business Accreditation Standards – Instructional Resources & Responsibilities http://www.aacsb.edu/stand6.html
n FD.4.a: The school should maintain a full-time faculty sufficient to
provide stability and ongoing quality improvement for the degree programs offered.
FD.4.b: The deployment of faculty resources should reflect the school's mission and degree programs. Students in all programs, majors, areas of emphasis, and locations should have the opportunity to receive instruction from appropriately qualified faculty.
From AACSB – Business Accreditation Standards – Faculty Composition & Development – FD.4 Faculty Size, Composition, & Deployment http://www.aacsb.edu/stand4.html
C. ABET
n c.)A program at the basic level must have no fewer than three-full-time faculty members (i.e., the fractions of time devoted to the basic-level program by each faculty member must add to at least three.) This statement shall not be interpreted to preclude the accreditation of programs offered primarily by part-time faculty members. The institution must demonstrate that effective mechanisms are in place to assure adequate levels of student-faculty interaction, student

Appendices
MGT of America, Inc. Page 32
advising, and faculty concern for and control over the curriculum, as would be expected in programs offered primarily by full-time faculty members. If the faculty has additional obligations, such as graduate teaching and/or research, additional faculty members must be present to ensure that at least three full-time-equivalent faculty members are devoted to each basic-level program. Under no circumstances should a program be critically dependent on one individual. e.)Teaching loads must be consistent with the stated program objectives and expectations for research and professional development. Engineering faculty members, regardless of their individual capabilities, cannot function effectively either as teachers or seekers of new understanding if they are too heavily burdened with classroom assignments. Stimulation of student minds presupposes continuing professional growth of the faculty through study of new developments in areas of technology and science and in areas of instructional innovation.
From ABET – EAC Criteria for 1999 – General Basic Level Criteria – Section I - Faculty http://www.abet.org/eac/EAC_99-00_Criteria.htm
D. ABA
n Interpretation 402-2: Student/faculty ratios are considered in determining a law school's compliance with the Standards. (1) A ratio of 20:1 or less presumptively indicates that a law school complies with the Standards. However, the educational effects shall be examined to determine whether the size and duties of the full-time faculty meet the Standards.
(2) A ratio of 30:1 or more presumptively indicates that a law school does not comply with the Standards.
(3) At a ratio of between 20:1 and 30:1 and to rebut the presumption created by a ratio of 30:1 or greater, the examination will take into account the effects of all teaching resources on the school's educational program, including such matters as quality of teaching, class size, availability of small group classes and seminars, student/faculty contact, examinations and grading, scholarly contributions, public service, discharge of governance responsibilities, and the ability of the law school to carry out its announced mission. (August 1996)
From ABA Standards for Approval of Law Schools – Chapter 4: The Faculty http://www.abanet.org/legaled/chapter4.html

Appendices
MGT of America, Inc. Page 33
E. CAAHEP
n Supervised clinical experiences should involve daily personal contact between the clinical instructor and the student in the same clinical setting. Clinical instructors should be readily accessible to students for on-going instruction and guidance on a daily basis. An effective ratio of students to clinical instructors should be maintained. Determination of an effective student-clinical instructor ratio should be based upon consideration of the total work load of clinical instructors, availability and adequacy of clinical facilities, and the number and nature of athletic programs being covered. A ratio that does not exceed eight (8) students to one (1) clinical instructor during the course of an academic year is recommended
From Allied Health – Athletic Trainer http://www.caahep.org/standards/at-st.htm
n Resources must be adequate to support the number of students who
are admitted to the program. The instructor/student ratio shall be adequate to achieve the stated objectives of the curriculum.
Clinical training should, wherever possible, be on a one-to-one ratio. Clinical faculty should be responsible for scheduling, supervising, and testing of no more than 10 students per instructor per course of instruction.
From Allied Health – Cardiovascular Technologist http://www.caahep.org/standards/cvt-st.htm
n Resources shall be adequate to support the number of students
admitted to the program. Maximum student enrollment shall be commensurate with the volume and variety of sonographic procedures, equipment, and personnel available for educational purposes. The instructor/student ratio shall be adequate to achieve the stated objectives of the curriculum…
The number of students assigned to the clinical education center should be determined by a student/clinical staff ratio not greater than one-to-one.
From Allied Health – Diagnostic Medical Sonographer http://www.caahep.org/standards/dms-st.htm
n (3) Number
There shall be sufficient faculty to provide students with adequate attention, instruction, and supervised practice to acquire the knowledge and competence needed for entry to the occupation. Resources must be adequate to support the number of students admitted to the program. The instructor/student ratio shall be adequate to achieve the stated objectives of the curriculum.

Appendices
MGT of America, Inc. Page 34
From Allied Health – Electroneurodiagnostic Technology http://www.caahep.org/standards/end-st.htm
n d. Supervision
Supervision shall be provided by program instructors or medical preceptors, such as physicians or nurses, if they have been trained and approved by the program to function in such roles. The ratio of students to instructors shall be adequate to assure effective learning.
From Allied Health – Emergency Medical Technician – Paramedic http://www.caahep.org/standards/emtp-st_99.htm
n The instructor ratio should be adequate to achieve the stated
objectives of the curriculum. Class sizes can differ widely depending upon the instructional methodology employed; however, the school must be able to justify class size as conducive to effective student learning. The student must be able to maintain personal contact with instructors when needed.
From Allied Health – Medical Assistant http://www.caahep.org/standards/ma-st_99.htm
n The instructor ratio should be adequate to achieve the stated
objectives of the curriculum.
From Allied Health – Ophthalmic Medical Technician / Technologist http://www.caahep.org/standards/omt-st.htm
n General Resources
Resources must be adequate to support the number of students admitted to the program. The instructor/student ratio shall be adequate to achieve the stated objectives of the curriculum.
From Allied Health – Perfusionist http://www.caahep.org/standards/perf-st.htm
n The number of students enrolled in each class should be
commensurate with effective learning and teaching practices, and should be consistent with appropriate student/instructor ratio for respiratory care education.
From Allied Health – Respiratory Therapy Technician and Respiratory Therapist http://www.caahep.org/standards/rt-st.htm
n The ratio of students to faculty will vary according to the learning
objectives and teaching methods used in any given instructional period. Of principle concern is that the students receive not only the group and individualized instruction required to accomplish the defined learning opportunities, but also that tutorial/ individualized

Appendices
MGT of America, Inc. Page 35
instructional services should be available for students requiring assistance in attaining the stated objectives of the program. Determination of faculty teaching loads should be consistent with institutional policy for other faculty.
From Allied Health – Surgical Technology http://www.caahep.org/standards/st-st.htm
F. NAAB
n Condition 5: Human Resources The program must demonstrate that it provides adequate human resources for a professional degree program in architecture, including a sufficient faculty complement, an administrative head with enough time for effective administration, administrative and technical support staff, and faculty support staff. Student enrollment in, and scheduling of, design studios must assure adequate time for an effective tutorial exchange between the faculty member and the student. The total teaching load should be such that faculty members have adequate time to pursue research, scholarship, and practice to enhance their professional development.
From NAAB – The Conditions for Accreditation http://www.naab.org/information1726/information_show.htm?doc_id=15290
G. NCATE
n Standard III.C: Professional Assignments of Faculty The unit ensures that policies and assignments allow faculty to be involved effectively in teaching, scholarship, and service. From NCATE Standards – Professional Education Faculty http://www.ncate.org/about/stdiii.html
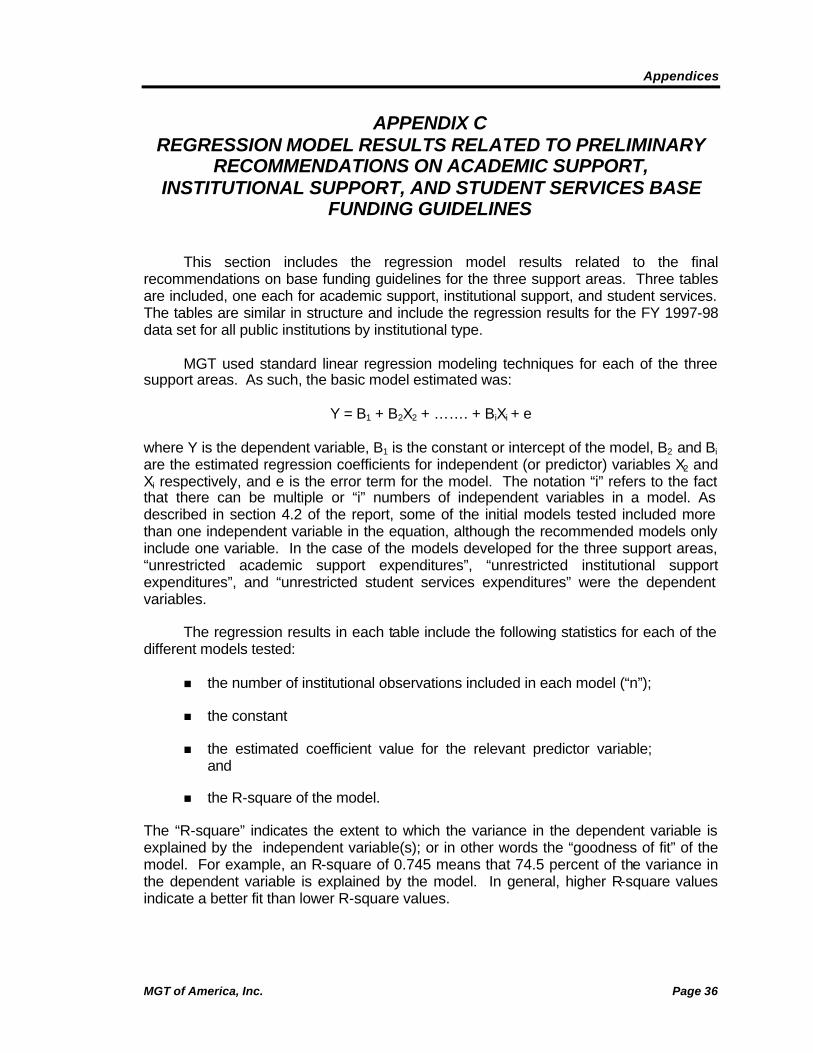
Appendices
MGT of America, Inc. Page 36
APPENDIX C REGRESSION MODEL RESULTS RELATED TO PRELIMINARY
RECOMMENDATIONS ON ACADEMIC SUPPORT, INSTITUTIONAL SUPPORT, AND STUDENT SERVICES BASE
FUNDING GUIDELINES This section includes the regression model results related to the final recommendations on base funding guidelines for the three support areas. Three tables are included, one each for academic support, institutional support, and student services. The tables are similar in structure and include the regression results for the FY 1997-98 data set for all public institutions by institutional type. MGT used standard linear regression modeling techniques for each of the three support areas. As such, the basic model estimated was:
Y = B1 + B2X2 + ……. + BiXi + e where Y is the dependent variable, B1 is the constant or intercept of the model, B2 and Bi are the estimated regression coefficients for independent (or predictor) variables X2 and Xi respectively, and e is the error term for the model. The notation “i” refers to the fact that there can be multiple or “i” numbers of independent variables in a model. As described in section 4.2 of the report, some of the initial models tested included more than one independent variable in the equation, although the recommended models only include one variable. In the case of the models developed for the three support areas, “unrestricted academic support expenditures”, “unrestricted institutional support expenditures”, and “unrestricted student services expenditures” were the dependent variables. The regression results in each table include the following statistics for each of the different models tested:
n the number of institutional observations included in each model (“n”);
n the constant
n the estimated coefficient value for the relevant predictor variable; and
n the R-square of the model.
The “R-square” indicates the extent to which the variance in the dependent variable is explained by the independent variable(s); or in other words the “goodness of fit” of the model. For example, an R-square of 0.745 means that 74.5 percent of the variance in the dependent variable is explained by the model. In general, higher R-square values indicate a better fit than lower R-square values.

Appendices
MGT of America, Inc. Page 37
APPENDIX C-1 REGRESSION RESULTS
UNRESTRICTED ACADEMIC SUPPORT EXPENDITURES AS DEPENDENT VARIABLE
UNRESTRICTED INSTRUCTION, RESEARCH, AND PUBLIC SERVICE EXPENDITURES AS PREDICTOR VARIABLE
Institution Type $ Qualifiers1997-98 Results
Research n=64Constant Unr. Academic Support < $80M 5,043,897Coefficient I,R,PS < $300M 0.178R-square 0.494
Doctoral n=54Constant Unr. Academic Support < $30M -1,745,972Coefficient I,R,PS < $100M 0.250R-square 0.748
Comprehensive n=244Constant Unr. Academic Support < $20M 481,711Coefficient I,R,PS < $55M 0.196R-square 0.665
Baccalaureate n=67Constant Unr. Academic Support < $4M -16,296Coefficient I,R,PS < $15M 0.218R-square 0.625
Two-Year n=780Constant No Qualifiers 243,534Coefficient 0.152R-square 0.570

Appendices
MGT of America, Inc. Page 38
APPENDIX C-2 REGRESSION RESULTS
UNRESTRICTED INSTITUTIONAL SUPPORT EXPENDITURES AS DEPENDENT VARIABLE
UNRESTRICTED EDUCATIONAL & GENERAL (LESS INSTITUTIONAL SUPPORT AND SCHOLARSHIPS & FELLOWSHIPS) EXPENDITURES AS
PREDICTOR VARIABLE
Institution Type $ Qualifiers1997-98 Results
Research n=50Constant Unr. Institutional Sppt. < $40M 9,492,698Coefficient E&G less Inst. Sppt. < $400M 0.061R-square 0.305
Doctoral n=58Constant Unr. Institutional Sppt. < $30M 1,399,141Coefficient E&G less Inst. Sppt. < $200M 0.117R-square 0.728
Comprehensive n=245Constant Unr. Institutional Sppt. < $20M 791,554Coefficient E&G less Inst. Sppt. < $100M 0.144R-square 0.691
Baccalaureate n=55Constant Unr. Institutional Sppt. < $4M 82,903Coefficient E&G less Inst. Sppt. < $25M 0.148R-square 0.776
Two-Year n=780Constant No Qualifiers -40,729Coefficient 0.202R-square 0.716

Appendices
MGT of America, Inc. Page 39
APPENDIX C-3 REGRESSION RESULTS
UNRESTRICTED STUDENT SERVICES EXPENDITURES AS DEPENDENT VARIABLE
TOTAL STUDENT HEADCOUNT AS PREDICTOR VARIABLE
Institution Type $ Qualifiers1997-98 Results
Research n=64Constant Unr. Student Services < $25M 5,900,898Coefficient Total Headcount < 40k 349.20R-square 0.241
Doctoral n=59Constant Unr. Student Services < $25M 2,674,468Coefficient Total Headcount < 28k 393.63R-square 0.303
Comprehensive n=229Constant Unr. Student Services < $10M 982,050Coefficient Total Headcount < 15k 463.49R-square 0.416
Baccalaureate n=63Constant Unr. Student Services < $3M 757,128Coefficient Total Headcount < 5k 337.05R-square 0.334
Two-Year n=782Constant No Qualifiers 354,144Coefficient 278.35R-square 0.743
J:/1421/final report /report.doc