final report - ccrpc · final report travel demand modeling for a small sized mpo using transims...
TRANSCRIPT


Final Report
Travel Demand Modeling for a Small Sized MPO Using TRANSIMS
Table of Contents
Table of Contents
List of Figures xList of Tables xx
1. Introduction 1 1.1 Objectives 1 1.2 Report Organization 2
2. Literature Review 3
3. Travel Demand Modeling Status in Small to Medium Sized MPOs in Illinois 12 3.1 MPO Surveys 12 3.2 TDM in MPOs 13 3.3 Details of TDM Tools 15 3.4 TDM Validation 17 3.5 Special Requirements of TDM 17
4. Functional Requirements for TRANSIMS 18 4.1 TRANSIMS Track 1 Implementation Needs 20 4.2 TRANSIMS Methodologies and Software 20 4.3 Input Data 21 4.4 Utility Programs 22
5. Data Requirements and Conversion Techniques 23 5.1 Network Conversion 24 5.2 Trip Table Conversion 28 5.3 Total Trips by Purpose 29 5.4 Data Smoothing 30 5.5 Model Feedback Process and Convergence 32
6. TRANSIMS Model Calibration and Validation 34 6.1 Calibration and Validation Steps 34 6.2 Traffic Assignment 38 6.3 Using Screenlines 41 6.4 Critical Links Comparisons 43

Final Report
Travel Demand Modeling for a Small Sized MPO Using TRANSIMS
Table of Contents
Table of Contents (cont.)
7. TRANSIMS Model Sensitivity Analysis 47 7.1 Model Sensitivity Analysis with Network Changes 47 7.2 Traffic Assignment Comparison 52
8. Four-Step Travel Demand Model and TRANSIMS 53 8.1 Four-Step Model Limitations and TRANSIMS 53 8.2 Components of Four-Step Models and TRANSIMS 54 8.3 Input Data 55 8.4 Model Output 57 8.5 Cost, Skill and Support 57 8.6 Traffic Flow Modeling 57
9. Conclusion and Opportunities for Future Work 59 9.1 Opportunities for Future Work 59
References 60

Final Report
Travel Demand Modeling for a Small Sized MPO Using TRANSIMS
Table of Contents
List of FiguresFigure 1: TRANSIMS Architecture 8Figure 2: Four-Step Modeling and TRANSIMS Steps 10Figure 3: EL-Paso TRANSIMS Study Methodology 11Figure 4: Applications of TDM Tools 14Figure 5: TDM Software Packages 14Figure 6: Components of TDM Packages 15Figure 7: Trip Generation Data Source 15Figure 8: In-House Data Availability 16Figure 9: Trip Purposes 16Figure 10: Base Years for TDM Validations 17Figure 11: Data Sources for TDM Validations 17Figure 12: TDM Functional Requirements 18Figure 13: TRANSIMS Implementation Steps 19Figure 14: TRANSIMS Methodologies and Tools for Small/Medium MPOs 20Figure 15: Data, Methodologies and Software Tools for Track 1 Implementation 23Figure 16: TRANSIMS Network Conversion Procedure 24Figure 17: Champaign-Urbana Urbanized Area Highway Network 26Figure 18: Trip Table Conversion Procedure 28Figure 19: Trips by Purpose 29Figure 20: HBW (unsmooth) Production-Attraction Diurnal Distribution 30Figure 21: HBW (Smooth) Production-Attraction Diurnal Distribution 30Figure 22: Diurnal Distribution (smoothed) by Trip Purpose (Production-Attraction) 31Figure 23: Diurnal Distribution (smoothed) by Trip Purpose (Attraction-Production) 31Figure 24: CUUATS TRANSIMS Model Feedback Strategy 32Figure 25: Home-Based Work Trips Diurnal Distribution 37Figure 26: Roadway Functional Classification 39Figure 27: Observed and Estimated Traffic Volume in the Network 39Figure 28: Screenline Volumes and Maximum Desirable Deviation 41Figure 29: Screenlines 42Figure 30: Observed and Estimated Traffic Flow (Neil St Northbound) 43Figure 31: Observed and Estimated Traffic Flow (Neil St Southbound) 43Figure 32: Observed and Estimated Traffic Flow (Bradley Ave Eastbound) 44Figure 33: Observed and Estimated Traffic Flow (Bradley Westbound) 44Figure 34: Observed and Estimated Traffic Flow (Kirby Eastbound) 45Figure 35: Observed and Estimated Traffic Flow (Kirby Westbound) 45Figure 36: Critical Links and Important Traffic Generators 46Figure 37: Aerial View of the I-57 and Curtis Road Interchange (2008) 47Figure 38: TRANSIMS Highway Network (Base Condition without Interchange) 48Figure 39: TRANSIMS Highway Network with the Curtis Road Interchange 49Figure 40: Curtis Road 50Figure 41: TRANSIMS Network with Curtis Interchange and Closed Segments 51Figure 42: Four-Step Model and TRANSIMS Modules 54Figure 43: Four-Step Modeling Steps 55Figure 44: TRANSIMS Modules 56Figure 45: Champaign-Urbana Roadway Network in NEXTA 58
x

Final Report
Travel Demand Modeling for a Small Sized MPO Using TRANSIMS
Table of Contents
List of Tables
Table 1: Details on Surveyed MPOs 12Table 2: TDM Application Status 13Table 3: TRANSIMS Track 1 Implementation Data Requirements 19Table 4: TRANSIMS Input Data 21Table 5: TRANSIMS Utility Programs 22Table 6: Network Conversion Input Data and Source 25Table 7: Link Input Table (Partial) 27Table 8: Model Stabilization Process 33Table 9: Population Growth 34Table 10: Person per Household Data Comparison 35Table 11: Trip Rates Comparisons 35Table 12: Trips by Purpose Percentages for Metropolitan Areas 35Table 13: Daily Person Trips by Purpose Comparisons 36Table 14: Trip Lengths for Different Metropolitan Areas 36Table 15: Estimated and Observed (Field Counts) Comparisons by Volume Level 38Table 16: Estimated and Observed (Field Count) Comparisons by Functional Class 38Table 17: Percent Differences by Functional Class 40Table 18: Region-Wide Calibration-Validation Statistics 40Table 19: Screenline Summary Analysis 41Table 20: Major and Minor Arterial Links for Comparisons 43Table 21: Comparison between Observed and Estimated Traffic Volumes 52
xx

Final Report
Travel Demand Modeling for a Small Sized MPO Using TRANSIMS 1
1 Introduction
1 Introduction
This study was focused on developing a travel demand model for a small sized Metropolitan Planning Organization (MPO) using the Transportation Analysis and Simulation System (TRANSIMS), which is a set of software tools initially developed at the Los Alamos National Laboratory (LANL) to analyze transportation systems. This system of tools was developed under the NASA open source agreement v1.3, which makes the software’s source code and changes to the source code publicly available. Under the open source license, the TRANSIMS system is available to anyone at no cost. This presents a very good opportunity for small and medium sized MPOs to develop a travel demand model without spending limited financial resources on commercially available software.
The study sought to determine whether TRANSIMS would be able to provide the necessary tools to achieve the functional requirements of travel demand modeling for small and medium sized MPOs. It also looked into other resources needed for implementing a travel demand model in TRANSIMS and also the accuracy of the results. Furthermore, the study looked into issues and opportunities in implementing such a model.
In this study, a travel demand model was developed for a small sized MPO using TRANSIMS. The model was calibrated and validated and the results were analyzed. The study documented issues, advantages and future opportunities for small sized MPOs in developing a travel demand model using TRANSIMS. This study was complimentary to another study titled “Illinois Travel Demand Modeling Technical Support Group”, conducted by the Champaign Urbana Urbanized Area Transportation Study (CUUATS) in cooperation with the University of Illinois at Chicago, and funded by the Illinois Center for Transportation (ICT). The findings of the study would provide a better understanding of the TRANSIMS tools and also will be a valuable input to the ICT study. The results could be used to encourage small sized MPOs in Illinois to consider TRANSIMS as a viable alternative to other travel demand modeling packages which are commercially available in the market.
1.1 ObjectivesThe objectives of the study were:
• To promote better understanding of travel behavior and transportation systems through the development, calibration, validation, and analysis of a travel demand model for a small sized MPO using TRANSIMS.
• To develop improved methods for applying TRANSIMS technology to evaluate transportation policies and issues related to planning agencies (especially small MPOs) as identified in the SAFETEA-LU 5512.
• To extend TRANSIMS technology by identifying issues and opportunities of using TRANSIMS to develop a travel demand model by a small sized MPO.

Final Report
Travel Demand Modeling for a Small Sized MPO Using TRANSIMS2
1 Introduction
1.2 Report OrganizationThis report is organized into the following chapters:
• Chapter Two - Literature Review – This chapter presents a literature review of previous studies on theory, development and implementation of TRANSIMS methodologies and software tools.
• Chapter Three - Travel Demand Modeling Status in Small and Medium Sized MPOs in Illinois – This chapter highlights the results of a comprehensive survey of existing practices and needs of transportation planning and travel demand modeling among 12 small and medium sized MPOs in Illinois.
• Chapter Four - Functional Requirements for TRANSIMS Implementation – This chapter discusses the functional requirements for TRANSIMS Track 1 implementation in a small or medium sized MPO.
• Chapter Five - Data Requirements and Conversion Techniques for Implementing TRANSIMS Methodologies - This chapter focuses on the data requirements and conversion steps for Track 1 implementation of TRANSIMS.
• Chapter Six - TRANSIMS Model Calibration and Validation Steps – This chapter describes the calibration and validation steps utilized for the TRANSIMS Track 1 model.
• Chapter Seven - TRANSIMS Model Sensitivity Analysis with Highway Network Changes This chapter focuses on TRANSIMS model’s sensitivity due to changes in the input highway network.
• Chapter Eight - Four-Step Travel Model and TRANSIMS - This chapter discusses issues with traditional four-step travel models and opportunities with the TRANSIMS Track 1 implementations for a small or medium sized MPO.
• Chapter Nine - Conclusions and Opportunities for Future Work – This chapter presents the conclusions derived from this study and provides suggestions for future work.

Final Report
Travel Demand Modeling for a Small Sized MPO Using TRANSIMS 3
2 Literature Review
2 Literature Review
This chapter provides a review of relevant studies on theory, development and implementation of TRANSIMS methodologies and software tools.
TRANSIMS Fundamentals, Antoine Hobeika, Virginia Polytechnic University, July 2005
As the name suggests, this document gives an introduction to the overall framework of the TRANSIMS software and its main modules. This document was written in 2005 and has not been updated since. Therefore, it does not reflect the changes in the newer versions of the TRANSIMS software. There are seven chapters in this document. Chapter 1 gives an overview of the background, framework, inputs, and descriptions of the important modules. The rest of the chapters delve the network conversion, population synthesizer, activity generator, route planner, micro simulator, and feedback processes.
Chapter 2 looks in detail at the network data file structures and coding. There are 19 different data tables for the TRANSIMS network and 4 data tables for transit data. Each input data file describes a feature of the transportation network such as parking, turn lanes, signal timing, etc. TRANSIMS uses a very detailed network data input. This chapter explains in detail the attributes in each of the data table with examples. In TRANSIMS, each mode of travel (walk, bike, auto, and transit) is coded as a separate network layer and the intermodal connections between different network layers occurs at the nodes (activity locations, parking lots and transit stops) through the process links. Different transit modes (buses, rail) are coded in different network layers.
Chapter 3 deals with the first major module in the TRANSIMS modeling process, Population Synthesizer. This section explains in detail the major data inputs, outputs, module interfaces, configuration files, and algorithms involved in the population synthesizer process. The population synthesizer module builds population demographic data from census data, such that they match the real population. This module uses the Census STF3 data, PUMS data and the MABLE/Geocorr data to synthesize households and their demographics, such that they match the census data at the block group level. The Census STF3 data contains limited information for all households, whereas the PUMS data contains detailed information for a sample of the households. The population synthesizer module uses these data to synthesize detailed information for all households. Additional modules are available to locate these synthesized households on the transportation network and generate auto ownership and their characteristics for each household. A forecast marginal file is used to synthesize households for forecast years. TRANSIMS generates three types of households: family households, non-family households and group quarters. It uses the Iterative Proportional Fitting (IPF) methodology to synthesize households and demographic information from the census STF-3A and PUMS data file.
Chapter 4 deals with the Activity Generator module. The activity generator module synthesizes activities for each individual in the population over a 24-hour period. As in the previous

Final Report
Travel Demand Modeling for a Small Sized MPO Using TRANSIMS4
2 Literature Review
chapter, this chapter deals with all aspects (input, output etc.) of the activity generation process. The activity generator module uses a travel activity survey to build the activity table for the entire synthetic population. The activity table contains the activity type, start, end, and duration times, travel mode, vehicle preference, possible locations for activity, and accompanying household members. The inputs to the activity generator module include survey households, synthetic households, network data, and land use data. The activity generator module uses the ‘Classification And Regression Tree’ (CART) algorithm to build a classification tree of the household demographic data based on which synthetic households are classified and matched and a discrete destination zone choice model to locate the activities. The activity generator also takes into account the interactions between household members.
Chapter 5 covers the Route Planner module. The Route Planner module assigns trips to the network based on travel time and mode types. This type of assignment is referred to as the Time-Dependent Label-Constrained Shortest Path Problem (TDLSP), and TRANSIMS uses a modified version of the Dijkstra’s shortest path algorithm to solve this problem. The major inputs for the Route Planner module include the activity table and the network data file. Based on these files, the route planner creates a single trip request file and the internal network file. The single trip request file contains a starting location, destination location, starting time, maximum finish time, and the mode type for an individual trip. The internal network file consists of the nodes, links, travel time functions on the links, and mode types allowed on the link. The travel time functions are time dependent and therefore vary in a 24 hr time period. Additional information such as the delay on a link comes as a feedback from the traffic Microsimulator module. The route planner module outputs a trip path, travel time on links and the total travel time.
Chapter 6 of this document describes in detail the final major module in the TRANSIMS modeling process, the Microsimulator. The Microsimulator simulates the movement of travelers on the transportation network over the 24 hour time period. The inputs to the Microsimulator include: the TRANSIMS network, the travel plans from the route planner and the vehicle data. The Microsimulator module uses the cellular automata approach for simulation. The cellular automata approach divides each link on the TRANSIMS network into cells of standard length. The Microsimulator checks for the presence or absence of vehicles in each cell for every second and moves the vehicle based on a set of rules. The Microsimulator can handle trips with more than one mode and travelers, multiple trips for a traveler and different vehicle characteristics. The Microsimulator simulates movements such as lane changing, passing of slow moving vehicles and interaction of vehicles at intersections. The Microsimulator outputs, event data, snapshot of the transportation system with vehicle locations for each second, summary data of the link, and network characteristics over a period of time. The Microsimulator also allows the use of multiple processors to parallel process the microsimulation of large TRANSIMS networks. A small section in this chapter also describes the use of the output visualizer to read Microsimulator output data.
The final chapter in this document, Chapter 7, delves into the feedback processes involved with TRANSIMS modeling. The feedback processes control the feedback of data between the activity generator, route planner and the microsimulator. The feedback module uses the iterative feedback approach which facilitates multiple iterations between the TRANSIMS modules. The
Final Report
Travel Demand Modeling for a Small Sized MPO Using TRANSIMS 5
2 Literature Review
feedback process involves three modules: Collator, Stratifier and the Selector. The Collator collects the data from input files and the output files from other modules. The Stratifier classifies the traveler trips and the selector selects a subset of trips for further processing. The outputs from the feedback process are activity generator feedback files and the route planner feedback files.
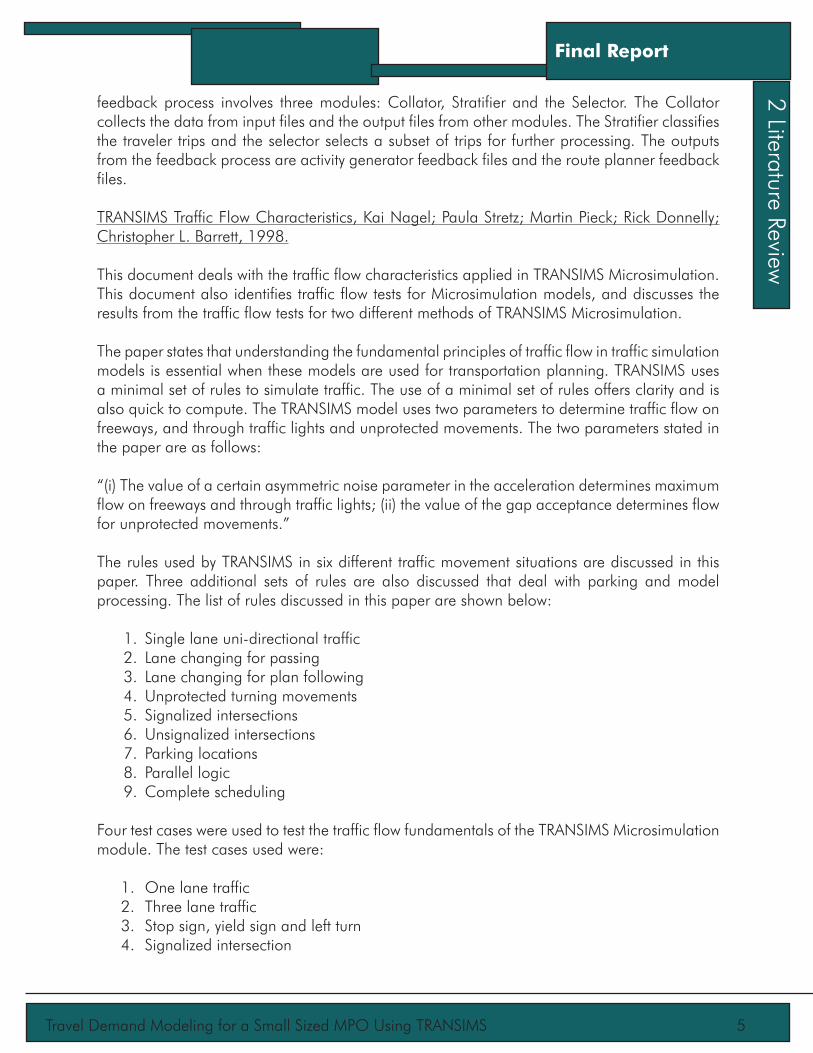
TRANSIMS Traffic Flow Characteristics, Kai Nagel; Paula Stretz; Martin Pieck; Rick Donnelly; Christopher L. Barrett, 1998.
This document deals with the traffic flow characteristics applied in TRANSIMS Microsimulation. This document also identifies traffic flow tests for Microsimulation models, and discusses the results from the traffic flow tests for two different methods of TRANSIMS Microsimulation.
The paper states that understanding the fundamental principles of traffic flow in traffic simulation models is essential when these models are used for transportation planning. TRANSIMS uses a minimal set of rules to simulate traffic. The use of a minimal set of rules offers clarity and is also quick to compute. The TRANSIMS model uses two parameters to determine traffic flow on freeways, and through traffic lights and unprotected movements. The two parameters stated in the paper are as follows:
“(i) The value of a certain asymmetric noise parameter in the acceleration determines maximum flow on freeways and through traffic lights; (ii) the value of the gap acceptance determines flow for unprotected movements.”
The rules used by TRANSIMS in six different traffic movement situations are discussed in this paper. Three additional sets of rules are also discussed that deal with parking and model processing. The list of rules discussed in this paper are shown below:
1. Single lane uni-directional traffic2. Lane changing for passing3. Lane changing for plan following4. Unprotected turning movements5. Signalized intersections6. Unsignalized intersections7. Parking locations8. Parallel logic9. Complete scheduling
Four test cases were used to test the traffic flow fundamentals of the TRANSIMS Microsimulation module. The test cases used were:
1. One lane traffic2. Three lane traffic3. Stop sign, yield sign and left turn4. Signalized intersection

Final Report
Travel Demand Modeling for a Small Sized MPO Using TRANSIMS6
2 Literature Review
Four quantities (flow, density, velocity, and lane usage) were measured to check for reasonableness. The results from the test were compared with the HCM curves for flow vs. density, flow vs. speed and speed vs. density.
TRANSIMS Model Design Criteria as Derived from Federal Legislation, Jack Morrison, Verne Loose, 1995.
This document looks into the planning requirements given in the Intermodal Surface Transportation Efficiency Act (ISTEA) and Clean Air Act Amendments (CAAA), and how these requirements shaped the TRANSIMS model design.
The planning provisions in the ISTEA and CAAA required Metropolitan Planning Organizations to add additional capabilities in quantifying and analyzing congestion and air quality standards, which were beyond the abilities of the models and methodologies available at that time. Title I and III (congestion management and air quality improvement programs and management of transit programs) of ISTEA generated specific direct requirements for TRANSIMS. The requirements of the state and metropolitan transportation plans require major transportation investment studies to evaluate the effectiveness and cost-benefits of solutions to transportation problems. TRANSIMS had to provide an analytical framework to conduct these studies. Therefore, these studies served as high level guidelines for TRANSIMS design.
ISTEA required that states develop six transportation management systems and one traffic monitoring system to satisfy the three federally mandated objectives. The necessity to develop and maintain data, to develop measures of performance and measures of effectiveness in order to analyze the effectiveness of the management systems against the federally mandated objectives directly affected the design of the TRANSIMS system. The Congestion Management System, Safety Management System, Public Transportation Management System, and Intermodal Management System demanded that TRANSIMS be capable of analyzing the impact of facility improvements on system capacity.
The Congestion Management System (CMS) involves monitoring and evaluation of performance measures, evaluation of alternatives for congestion reduction and monitoring the impacts of the implemented alternatives. The strategies to reduce congestion include transportation demand management strategies such as car pooling, operational strategies such as coordination of traffic signals, strategies to improve usage of High Occupancy Vehicle (HOV) lanes, public transit improvements such as additional routes and fare reductions, strategies to encourage the use of active modes of transportation such as biking and walking, and the use of intelligent transportation systems. ISTEA required all Transportation Management Areas (TMAs) to include a CMS in their planning process.
The Safety Management System (SMS) demanded that all safety strategies be considered and implemented in aspects of planning, design, construction, and maintenance of transportation systems. Even though the elements of SMS were out of the analytic field of travel demand models, the capability of TRANSIMS to deal with congestion in an exclusive and at a detailed level provides the opportunity to connect the level of congestion to crash prediction and the impacts of crashes and crash recovery on non-recurring congestion.

Final Report
Travel Demand Modeling for a Small Sized MPO Using TRANSIMS 7
2 Literature Review
ISTEA requires that Public Transportation Management Systems (PTMS) be included in all state and metropolitan transportation plans. The inclusion of PTMS demands the evaluation of transit alternatives available to reduce congestion and to promote intermodal transportation systems. Therefore, states and metropolitan agencies should develop methodologies to evaluate the impacts of both improvements in system capacities and operations.
The Intermodal Transportation Systems (IMS) deals with identifying the connections between different modes of travel, strategies to improve these connections and evaluate the effectiveness of these strategies on the efficiency of the whole transportation system. The performance measures to evaluate the strategies include travel time, system capacity, quality of service, etc.
Title I of the 1990 CAAA placed attainment standards on four transportation related pollutants. CAAA required that the State DOTs incorporate Transportation Control Measures (TCMs) so that the aggregate impacts of all the projects in the state transportation plans do not exceed the emission levels set in the State Implementation Plans (SIPs). These requirements necessitated a detailed and accurate estimation of the travel demand in the future, the increase in the emissions and the effects of the TCMs proposed in the SIPs to control emissions. Also Title II of the CAA placed requirements on vehicle design and fuel sources. Any travel demand modeling tool should be sensitive enough to measure the impacts of these alternatives.
The ISTEA and CAAA standards required TRANSIMS to address in detail the travel behavior of individual travelers. At the same time, TRANSIMS should also be easily applicable to local planning practices and constraints. The transportation system data component consisted of four different data sources of information: land use, traveling population, intermodal transportation system, and atmospheric conditions. The transportation simulation component consisted of four sub components: household and commercial activity disaggregation, trip/travel planner, travel network simulation, and air quality simulation.
The household and disaggregation component produces a complete list of travel activities for each household in the region based on the demographic and land use characteristics of the region. The trip/travel planner component generates travel plans for individuals based on the travel activities produced by the household and disaggregation component. The trip/travel planner takes into account the transportation system characteristics, traveler preferences and the space and time constraints of each trip. The travel network and air quality simulation components generate detailed traffic and air quality simulations. These components complete the requirements from ISTEA and CAAA to integrate a regional aggregate travel forecasting to more detailed traffic and air quality simulations.
TRANSIMS: TRansportation ANalysis and SIMulation System: Project Summary and Status, LaRon Smith, Richard Beckman, Keith Baggerly, Doug Anison, Michael Williams, 1995.
This document gives a summary of the TRANSIMS project development up to 1995 and improvements proposed for the future. The development of TRANSIMS was funded by the U.S. Department of Transportation and the Environmental Protection Agency to satisfy the planning requirements of the ISTEA and CAAA. The Los Alamos National Laboratory was the lead

Final Report
Travel Demand Modeling for a Small Sized MPO Using TRANSIMS8
2 Literature Review
developer of this project. The goal of the TRANSIMS project was to develop an integrated set of models and simulation tools which use advanced analysis and computational techniques to model the transportation system in detail, providing transportation planners and engineers with an effective tool to analyze emissions, congestion, safety, etc.
Figure 1 shows the TRANSIMS architecture developed at the time of this study.
As seen in the Figure 1, the major modules of TRANSIMS are clearly defined. The Household and Commercial Activity Disaggregation module synthesizes population, households and demographic data for the region and travel activities for each individual. The Intermodal Route Planner develops travel plans for each activity based on space, time and travel preferences of the traveler. The Travel Microsimulation generates the travel patterns onto the detailed transportation network and the Environmental Models and Simulation performs the air quality simulations and analysis.
As a part of this project summary and status, six MPOs (Dallas-Fort Worth, Boston, Portland, Oakland, Chicago, and Denver) were visited. These MPOs were presented with the TRANSIMS architecture and obtained feedback to develop detailed requirements for the TRANSIMS tools. A new approach was developed to create Interim Operational Capabilities (IOC) for each major module of TRANSIMS during a five year program. A case study, with the help of MPOs, will be conducted at the end of each IOC to evaluate its features. The traffic simulation was the first IOC planned to be developed followed by the air quality analysis. The first case study for the traffic simulation IOC was conducted in Dallas-Fort Worth region with the North Central Texas Council of Governments (NCTCOG).
The Dallas-Ft. Worth Case Study, R.J. Beckman, Los Alamos National Laboratory, 1997.
This study is the first case study of the Interim Operation Capability (IOC) of the first module developed in the TRANSIMS architecture; Traffic Microsimulation. This case study used the entire metropolitan planning area for route planning, and a smaller 25 square mile region for traffic microsimulation. The Production/Attraction trip matrices and the transportation network
Figure 1: TRANSIMS Architecture
Source: TRANSIMS: TRansportation ANalysis and SIMulation System: Project Summary and Status, LaRon Smith, Richard Beckman, Keith Baggerly, Doug Anison, Michael Williams, 1995.

Final Report
Travel Demand Modeling for a Small Sized MPO Using TRANSIMS 9
2 Literature Review
from the NCTCOG travel demand model was used for generating travel plans and the traffic microsimulation. Since TRANSIMS traffic microsimulation deals with detailed individual travel preferences, additional local streets were added to the existing network.
Three areas of investigation were conducted in this case study; network changes, travel plan changes and equity analysis. Three different networks were tested in the traffic microsimulation module. The different networks included a base case with the existing network, a change in number of lanes to the freeway and changes to the local arterial streets. The base case was then simulated for four different travel plans and travel activity analyses. The equity analysis consisted of two sets of populations. Four measures of effectiveness were used: vehicle miles traveled, vehicle hours traveled, travel time, and speed.
This study was done as a demonstration of the first IOC of TRANSIMS. The study concluded that travel time feedback to trip planner is important. The study also identified the TRANSIMS model sensitivity in following order: assignment, feedback and microsimulation randomness. It also identified that travel time reliability can be analyzed using TRANSIMS.
Assessing The Feasibility Of Using TRANSIMS In North Carolina: The Fayetteville-Fort Bragg Case, John R. Stone, Nagui M. Rouphail, Brandon L. Nevers, Dibyendu Sengupta, North Carolina State University, Alan F. Karr, Byung Ku Park, National Institute of Statistical Sciences, 2000.
This study considered the feasibility of using TRANSIMS in North Carolina in terms of the data, computational and staff resources. The objectives of this study were:
• Assess the state-of-the-art of TRANSIMS development• Assess the resource requirements necessary to apply TRANSIMS• Estimate advantages and disadvantages, costs and benefits of doing a TRANSIMS study• Facilitate a possible future implementation of TRANSIMS in North Carolina
The Fayetteville-Fort Bragg was chosen for this case study. This study concluded that the Fayetteville-Fort Bragg region meets all the TRANSIMS requirements in terms of data, computational resources and costs. But lack in terms of staffing requirements and constraints from other modeling requirements. This study concluded that while TRANSIMS is capable of macro level regional modeling and micro level traffic simulation, other hybrid options using CORSIM with other modeling tools provide competitive alternatives for the short term until TRANSIMS is fully developed. This study also developed a prototype internet based evaluate tool called the TRANSIMS Feasibility Assessment Tool (TFAT). This tool would help the agencies compare the existing model versus the resources needed to develop a TRANSIMS model for the region.

Final Report
Travel Demand Modeling for a Small Sized MPO Using TRANSIMS10
2 Literature Review
El Paso TRANSIMS Case Study, Rilett L., KUMAR A., Doddi S., Texas Transportation Institute, Texas Department of Transportation, Federal Highway Administration, 2003
This case study compares and contrasts the TRANSIMS approach to modeling to the traditional four-step travel demand model, and also applies the TRANSIMS microsimulation and emission analysis modules to the El Paso region.
TRANSIMS generates each traveler’s activities across the entire day as a chain of events. TRANSIMS are microscopic in nature, generating individual travel behavior which is not possible with the macroscopic traditional four-step travel demand model. Figure 2 compares the four- step modeling process with that of TRANSIMS.
One of the important distinguishing aspects of TRANSIMS is that roadway capacity is an output from the traffic microsimulation, whereas in a traditional four-step model, capacity is input to the modeling process. The TRANSIMS microsimulation was also comparable with the CORSIMS microsimulation. This study also suggests that the underlying theory behind the TRANSIMS architecture needs to be well understood by transportation planners. The El Paso case study had three objectives: to develop a methodology to implement TRANSIMS in Texas, to assess the additional resources needed to implement a TRANSIMS model and to model the travel demand and supply in the El Paso region using TRANSIMS. The methodology used in the El Paso case study is shown in Figure 3. It consisted of using the existing four-step travel demand model trip matrices and using the TRANSIMS microsimulation.
Figure 2: Four-Step Modeling and TRANSIMS Steps
Source: Transportation Institute, Texas Department of Transportation, Federal Highway Administration, 2003

Final Report
Travel Demand Modeling for a Small Sized MPO Using TRANSIMS 11
2 Literature Review
The case study concluded that the resources, in terms of data required, for TRANSIMS are substantially different than for the four-step travel demand model. These data requirements need additional estimation techniques for data that are not collected. This study used TRANSIMS 1.1 and recommended that additional error checking capabilities be developed. Future data forecasts should be more sophisticated for TRANSIMS because of the detailed network used in the microsimulation. Also, this study concluded that TRANSIMS can be implemented in an incremental manner in Texas.
Source: El Paso TRANSIMS Case Study, Rilett L., KUMAR A., Doddi S., Texas Transportation Institute, Texas Department of Transportation, Federal Highway Administration, 2003
Figure 3: El-Paso TRANSIMS Study Methodology

Final Report
Travel Demand Modeling for a Small Sized MPO Using TRANSIMS12
3 TDM
in Illinois MPO
s
3 Travel Demand Modeling Status in Small and Medium Sized MPOs in Illinois
The Champaign County Regional Planning Commission with the support of the University of Illinois at Chicago through a grant provided by the Illinois Center for Transportation (ICT) is conducting a research project for the Illinois Department of Transportation to establish the framework necessary for the development, maintenance, and application of small and medium size MPO’s urban travel demand models in several communities in Illinois, which will constitute the foundation for a Statewide Travel Demand Model. One aspect of this study was aimed at identifying the travel demand model functional requirements of small and medium sized Metropolitan Planning Organizations (MPOs) in the state of Illinois. A comprehensive survey on the existing practices and needs of transportation planning and travel demand modeling existing practices and needs was conducted among the twelve small and medium sized MPOs in Illinois. This chapter contains a summary of survey responses and lists travel demand modeling functional requirements most suitable for the small and medium sized MPOs in Illinois.
3.1 MPO SurveysThe survey was sent to twelve small and medium sized MPOs in Illinois in February 2009. The survey response rate was 100%. Table 1 shows the name and a brief description of each MPO surveyed.
Table 1: Details on Surveyed MPOs
Name Population LRTP Update DateStates Involved in Planning Process
Danville Area Transportation Study
53,223 Summer 2010 Illinois
DeKalb Sycamore Area Transportation Study
55,085 July 2010 Illinois
Stateline Area Transportation Study
58,000 September 2011 Illinois & Wisconsin
Kankakee Area Transportation Study
65,000 October 2009 Illinois
East Central Intergovernmental Association
77,018 October 2011 Illinois & Iowa
Decatur Urbanized Area Transportation Study
105,420 November 2009 Illinois
McLean County Regional Planning Commission
118,000 Spring 2011 Illinois
Champaign County Regional Planning Commission
123,885 December 2009 Illinois
Springfield Area Transportation Study
160,000 June 2010 Illinois
Peoria/Pekin Urban Area Transportation Study
247,000 May 2010 Illinois
Rockford Metropolitan Agency for Planning
270,414 June 2010 Illinois
Bi-State Regional Commission 292,577 March, 2011 Illinois & Iowa

Final Report
Travel Demand Modeling for a Small Sized MPO Using TRANSIMS 13
3 TDM
in Illinois MPO
s
3.2 Travel Demand Modeling Status in MPOsTable 2 shows the application status of Travel Demand Modeling (TDM) tools in different MPOs. Of the MPOs surveyed, ten out of twelve MPOs have utilized TDM tools developed and maintained either in-house or by consultants to fulfill their long-range and/or short-range transportation planning needs.
Table 2 also shows that only five MPOs have in-house staff maintaining and updating the TDM. Three MPOs receive TDM technical assistance from the Iowa and Wisconsin State Departments of Transportation for development and maintenance purposes.
Name of the MPO PopulationTDM
AvailabilityTDM Type
Development & Maintenance Responsibility
No. of In-House TDM Staff
Danville Area Transportation Study
53,233 No N/A Consultant None
DeKalb Sycamore Area Transportation Study
55,085 Yes Trip Based Consultant None
Stateline Area Transportation Study
58,000 Yes Trip Based State (WI) None
Kankakee Area Transportation Study
65,000 No N/A Consultant None
East Central Intergovernmental Association
77,018 Yes Trip BasedMPO (in house),
State (IA)1
Decatur Urbanized Area Transportation Study
105,420 Yes Trip Based Consultant None
McLean County Regional Planning Commission
118,000 Yes Trip BasedConsultant,
MPO (in house)1
Champaign County Regional Planning Commission
123,885 Yes Trip Based MPO (in house) 1
Springfield Area Transportation Study
160,000 Yes Trip BasedConsultant,
MPO (in house)2
Peoria/Pekin Area Transportation Study
247,000 Yes Trip BasedConsultant,
MPO (in house)1
Rockford Metropolitan Agency for Planning
270,414 Yes Trip Based MPO (in house) 1
Bi-State Regional Commission
292,577 Yes Trip BasedMPO (in house),
State (IA)1
Table 2: TDM Application Status

Final Report
Travel Demand Modeling for a Small Sized MPO Using TRANSIMS14
3 TDM
in Illinois MPO
s
The most common application of Travel Demand Models is for the development of the Long Range Transportation Plan followed by evaluating the Transportation Improvement Programs and major corridor studies. Other applications of TDM in MPOs are new starts projects and NEPA analysis.
Figure 5 shows types of TDM packages utilized by the surveyed MPOs. Among the twelve Metropolitan Planning Organizations in Illinois with populations between 100,000 and 250,000, Cube and TransCAD are the most popular TDM software packages.
Figure 4 shows common applications of TDM tools by each of the MPOs surveyed.
0
1
2
3
4
5
6
7
8
9
10
11
New
Sta
rts
and/
or S
mal
lS
tart
sP
roje
cts
Maj
or C
orrid
orS
tudy
Pro
ject
s
Con
form
ityA
naly
sis
Long
Ran
geT
rans
port
atio
nP
lann
ing
Tra
nspo
rtat
ion
Impr
ovem
ent
Pro
gram
s(T
IP)
NE
PA
Ana
lysi
s
Study
# o
f M
PO
s
Figure 4: Applications of TDM Tools
Figure 5: TDM Software Packages
0
1
2
3
4
Tra
npla
n
TP
+
CU
BE
/Voy
ager
Tra
nsC
AD
EM
ME
TR
AN
SIM
S
VIS
UM
QR
S II
TM
OD
EL
Oth
ers
Software
# o
f M
PO
s

Final Report
Travel Demand Modeling for a Small Sized MPO Using TRANSIMS 15
3 TDM
in Illinois MPO
s
3.3 Details of TDM ToolsAll existing TDMs utilized by the MPOs surveyed are trip-based. Figure 3 shows the different components of these TDM packages. Figure 6 shows Trip Generation, Trip Distribution and Highway Assignment are the most important components of the TDM packages. The percentage of transit, bike, and walk trips are negligible for the majority of the MPOs surveyed. Thus, only two of the MPOs have Mode-Choice models in place as part of their TDM.
Input Data for Travel Demand ModelsOnly the Champaign County Regional Planning Commission conducted a Household Travel Survey to use the survey results as input in its TDM. In general, the other eleven small and medium sized MPOs in Illinois utilize data from different national data sources. Figure 7 shows trip generation input data sources for the MPOs surveyed.
0
1
2
3
4
5
6
7
8
9
10
Trip
Gen
erat
ion
Trip
Dis
trib
utio
n
Mod
e C
hoic
e
Tra
nsit
Ass
ignm
ent
Hig
hway
Ass
ignm
ent
Tra
vel T
ime
Fee
dbac
k
Pos
t-pr
oces
s fo
rS
peed
s
Pos
t-pr
oces
s fo
rD
esig
n V
ol.
Em
issi
onA
naly
sis
Oth
ers
Component
# o
f M
PO
s
Figure 6: Components of TDM Packages
Figure 7: Trip Generation Data Sources
0123456789
2000
Cen
sus
Cen
sus
Tra
ns. P
lan.
Pac
kage
(CT
PP
)
Pub
lic U
se M
icro
-Sam
ple
Dat
a(P
UM
S)
Nat
. Hou
se. T
rave
l Sur
vey
Hou
se. T
rave
l Sur
vey
Lice
nse
Pla
te S
urve
y,R
oads
ide
Inte
rvie
ws
Sta
ted-
Pre
fere
nce
Sur
vey
Tra
nsit
On-
Boa
rd S
urve
y
Oth
ers
Data
# o
f M
PO
s

Final Report
Travel Demand Modeling for a Small Sized MPO Using TRANSIMS16
3 TDM
in Illinois MPO
s
Figure 8 shows in-house data availability for the MPOs surveyed. The majority of the MPOs maintain and update the socio-economic data (e.g., population, employment) in-house.
Trip PurposesGenerally, the most common trip purposes include work, family, personal business (including shopping, running errands), and social and recreational activities. Figure 9 shows trip purposes included in TDMs of the MPOs surveyed.
Figure 8: In-House Data Availability
Figure 9: Trip Purposes
0
1
2
3
4
5
6
7
8
9
10
11
12
Popula
tion
Emplo
ymen
t
Househo
lds
Worke
rs in
House
holds
Househo
ld inc
ome
Vehicl
e Owne
rship
Other
In-House Data
# o
f M
PO
s
0
1
2
3
4
5
6
7
8
9
Ho
me
Ba
sed
Wo
rk
Ho
me
Ba
sed
Re
tail
Ho
me
Ba
sed
no
n-
Re
tail
Ho
me
Ba
sed
Sch
oo
l
Ho
me
Ba
sed
Co
lleg
e/U
niv
ers
ity
No
n-H
om
e B
ase
d
Ho
me
Ba
sed
Oth
er
Oth
ers
Trip Purpose
# of
MP
Os

Final Report
Travel Demand Modeling for a Small Sized MPO Using TRANSIMS 17
3 TDM
in Illinois MPO
s
3.4 Travel Demand Model ValidationTDM validation is very important to ensure reliable traffic forecasts. Eight out of the twelve MPOs surveyed validated their travel demand models. Figure 10 shows base years of model validation for the surveyed MPOs.
Figure 11 shows the different data sources used for TDM validation. Only a few MPOs used local data for TDM validations.
3.5 Special Requirements of Travel Demand ModelingOnly one of the twelve MPOs surveyed had special requirements built into their TDM. The Rockford Metropolitan Agency for Planning included toll roads in its TDM.
0
1
2
3
4
20
00
20
04
20
05
20
06
20
07
20
09
Year
# o
f M
PO
sFigure 10: Base Years for TDM Validation
Figure 11: Data Sources for TDM Validation
0
1
2
3
4
5
6
7
Trip
Gen
erat
ion
Trip
Dis
trib
utio
n
Mod
e C
hoic
e
Trip
Ass
ignm
ent
TDM Steps
# o
f M
PO
s
Decennial Census
Census TransportationPlanning Package (CTPP)
Public Use Micro sampleData (PUMS)
National Household TravelSurvey
Traffic Counts
Transit Counts

Final Report
Travel Demand Modeling for a Small Sized MPO Using TRANSIMS18
4 TRANSIM
S Requirements
4 Functional Requirements for TRANSIMS Implementation
In general, travel demand modeling functional requirements include input data, appropriate TDM methodologies and software tools. These required elements are critical to successfully implement the travel demand modeling steps. Figure 12 shows the TDM functional requirements and associated steps.
As discussed in Chapter 3, all the small and medium sized MPOs in Illinois that have developed a travel demand model are utilizing trip-based TDMs to fulfill their long-range and/or short-range transportation planning needs. TRANSIMS modules can be customized to the particular needs and available data of an MPO. TRANSIMS has the following beneficial characteristics:
• TRANSIMS is a complete Travel Demand Modeling Package and available at no cost (supported by FHWA)
• TRANSIMS has established user and technical support groups• TRANSIMS modules can be utilized separately
Figure 13 shows TRANSIMS implementation steps. TRANSIMS is capable of working with trip-based data, commonly referred to as “Track 1” implementation. This makes TRANSIMS an appropriate TDM software package for the MPOs currently utilizing trip-based TDM.
Figure 12: TDM Functional Requirements

Final Report
Travel Demand Modeling for a Small Sized MPO Using TRANSIMS 19
4 TRANSIM
S Requirements
Figure 13: TRANSIMS Implementation Steps
Input Data Purpose Source
Roadway (Node, Link)Network Preparation &
Editing
MPO (Transportation planning/GIS department)
Traffic Analysis ZoneMPO (Transportation planning/GIS
department)Trip Table Route Planning MPO (Transportation planning department)
Vehicle Type Microsimulation MPO (Transportation planning department)
Traffic and Transit Volumes Calibration & ValidationMPO (Transportation planning department),
Cities, Transit Authority
The blue rectangles in Figure 13 show Track 1 implementations steps. The functional requirements of Track 1 implementation of TRANSIMS are similar to those of a trip-based TDM implementation. Table 3 shows the required data for TRANSIMS Track 1 implementation.
Table 3: TRANSIMS Track 1 Implementation Data Requirements

Final Report
Travel Demand Modeling for a Small Sized MPO Using TRANSIMS20
4 TRANSIM
S Requirements
4.1 TRANSIMS Track 1 Implementation Needs for Small/Medium MPOsSmall and medium sized MPOs generally utilize TDM tools for the following purposes:
• Long-Range Transportation Planning Needs (e.g., traffic forecasting)• Short-Range Transportation Planning Needs (e.g., effects of roadway capacity changes)• Major Corridor Studies• Transportation Improvement Program (TIP) project selection and evaluation• New Starts/Small Starts Projects
The TRANSIMS Track 1 implementation integrates the existing land use, trip generation, distribution, and mode choice models with the TRANSIMS traffic assignment modules (Router and Microsimulator). This can fulfill all the above-mentioned transportation planning needs and tasks for small and medium sized MPOs. Typical four-step TDMs are static assignment models, where as TRANSIMS Track 1 model is a dynamic network simulation model. Thus, TRANSIMS Track 1 model implementation may help small and medium sized MPOs in the following ways:
• Providing better Measures of Effectiveness (MOEs) for comparison. • Providing tools for more consistent evaluations of operations improvements with capacity
expansions.• Helping in evaluating special needs/scenarios:
* Work zone traffic analysis* Evaluating different event scenarios (e.g., football games, roadway closures, etc.)* Emergency evacuation (e.g., floods, hazardous material spills, etc.)
• Helping in evaluating HOT lanes (applicable for MPOs with HOT lanes e.g., Rockford Metropolitan Agency for Planning).
4.2 TRANSIMS Methodologies and Software ToolsFigure 14 shows the TRANSIMS methodologies and software tools required to satisfy the functional requirements of small and medium sized MPOs’ TDM needs.
Figure 14: TRANSIMS Methodologies and Tools for Small and Medium Sized MPOs

Final Report
Travel Demand Modeling for a Small Sized MPO Using TRANSIMS 21
4 TRANSIM
S Requirements
Figure 14 shows input data in light blue rectangles and TRANSIMS implementation steps in purple rectangles. The required utility programs for the implementation of TRANSIMS modules are also shown in the purple rectangles.
4.3 Input DataTable 4 shows details on input data for the implementation of TRANSIMS modules.
The majority of the small and medium sized MPOs in Illinois have access to the required input data shown in Table 4. However, a few of the MPOs surveyed neither have qualified staff nor funding sources to work with the TRANSIMS modules.
Input Data Purpose Source
Roadway (Node, Link)Network Preparation &
Editing
MPO (Transportation planning/GIS department)
Traffic Analysis ZoneMPO (Transportation planning/GIS
department)Trip Table Route Planning MPO (Transportation planning department)
Vehicle Type Microsimulation MPO (Transportation planning department)
Traffic and Transit Volumes Calibration & ValidationMPO (Transportation planning department),
Cities, Transit Authority
Table 4: TRANSIMS Input Data
Final Report
Travel Demand Modeling for a Small Sized MPO Using TRANSIMS22
4 TRANSIM
S Requirements
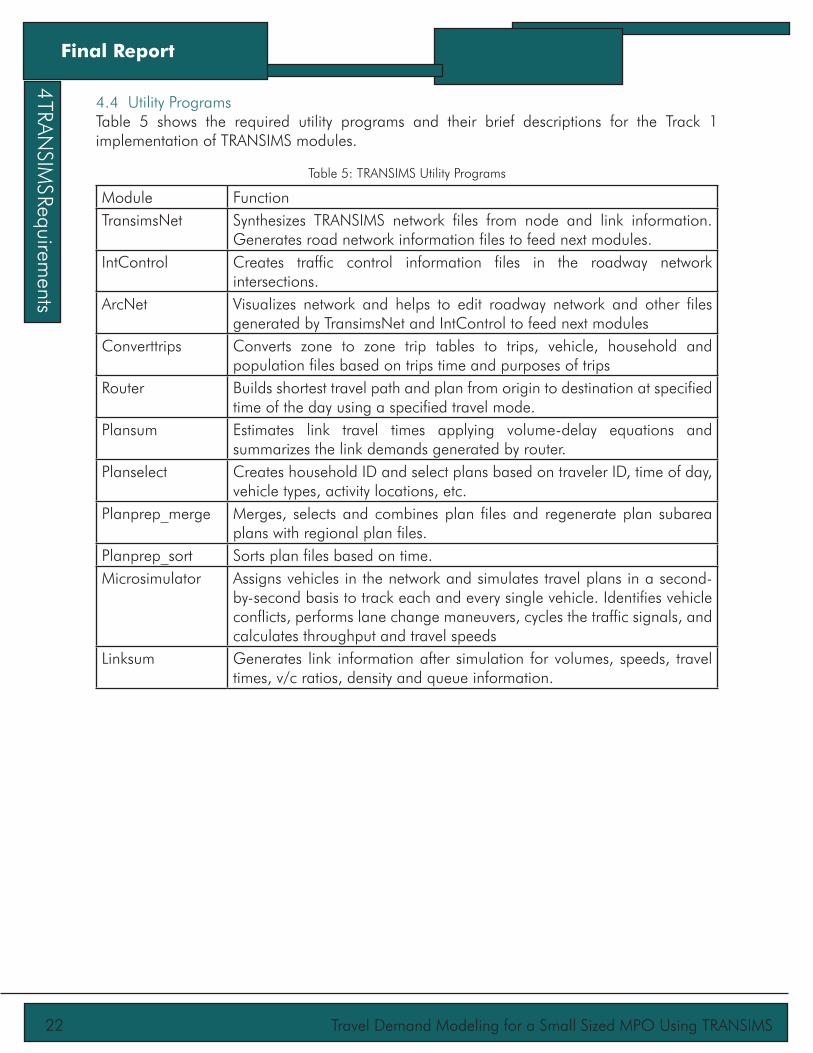
Module FunctionTransimsNet Synthesizes TRANSIMS network files from node and link information.
Generates road network information files to feed next modules.IntControl Creates traffic control information files in the roadway network
intersections.ArcNet Visualizes network and helps to edit roadway network and other files
generated by TransimsNet and IntControl to feed next modulesConverttrips Converts zone to zone trip tables to trips, vehicle, household and
population files based on trips time and purposes of tripsRouter Builds shortest travel path and plan from origin to destination at specified
time of the day using a specified travel mode.Plansum Estimates link travel times applying volume-delay equations and
summarizes the link demands generated by router.Planselect Creates household ID and select plans based on traveler ID, time of day,
vehicle types, activity locations, etc.Planprep_merge Merges, selects and combines plan files and regenerate plan subarea
plans with regional plan files.Planprep_sort Sorts plan files based on time.Microsimulator Assigns vehicles in the network and simulates travel plans in a second-
by-second basis to track each and every single vehicle. Identifies vehicle conflicts, performs lane change maneuvers, cycles the traffic signals, and calculates throughput and travel speeds
Linksum Generates link information after simulation for volumes, speeds, travel times, v/c ratios, density and queue information.
Table 5: TRANSIMS Utility Programs
4.4 Utility ProgramsTable 5 shows the required utility programs and their brief descriptions for the Track 1 implementation of TRANSIMS modules.

Final Report
Travel Demand Modeling for a Small Sized MPO Using TRANSIMS 23
5 Data Requirem
ents
5 Data Requirements and Conversion Techniques for Implementing TRANSIMS Methodologies
This chapter focuses on the data requirements and conversion steps for Track 1 implementation of TRANSIMS for a small or medium sized MPO. TRANSIMS Track 1 implementation integrates the existing land use, trip generation, trip distribution, and mode choice models with the TRANSIMS traffic assignment modules (Router and Microsimulator). Figure 15 shows input data, TRANSIMS methodologies, and software tools to fulfill small and medium sized MPOs’ travel demand modeling needs.
Figure 15 shows input data in light blue rectangles and TRANSIMS implementation steps in purple rectangles. The required utility programs for the implementation of TRANSIMS modules are also shown in the purple rectangles, but in red font.
Figure 15: Input Data, Methodologies and Software Tools for Track 1 Implementation

Final Report
Travel Demand Modeling for a Small Sized MPO Using TRANSIMS24
5 Data Requirem
ents
5.1 Network Conversion A TRANSIMS network consists of streets and highways, the signage and the signals controlling traffic, and other features like parking barriers. TRANSIMS network files are the most critical basic files as these provide inputs to the various modules of TRANSIMS. Figure 16 shows the TRANSIMS network conversion procedure.
Figure 16: TRANSIMS Network Conversion Procedure

Final Report
Travel Demand Modeling for a Small Sized MPO Using TRANSIMS 25
5 Data Requirem
ents
Table 6 shows details on the input data required for network conversion.
Network Conversion StepsThe following steps were used while converting the highway network data for the Champaign-Urbana area. TRANSIMS reference documents were used as resources for this purpose (e.g., How-To documents, user manuals etc.). The following is the list of steps used to convert the highway network data:
• Street and highway network files were exported from the CUBE travel demand model package (currently utilized by Champaign-Urbana Travel Demand Model).
• ArcGIS software was utilized to perform all necessary conversions on the exported data (e.g., coordinate system conversion, measuring unit conversion for link length and travel speed).
• Three network input files (*.txt format) were created. These files include: Node, Link, and Zone data.
• The TransimsNet utility program was utilized for synthesizing the TRANSIMS highway network. The printout file (*.prn) was checked for warning messages.
• The IntControl utility program was utilized to create sign and signal control files required for network synthesizing. The printout file (*.prn) was checked for warning messages.
• The ArcNet utility program was utilized to create the ArcView shape files from the TRANSIMS network files.
• Activity Location, Process link, Parking, Pocket Lane, Signalized Node, Unsignalized Node, Phasing Plan, Detector, Timing Plan, and Signal Coordinator files were edited to make the TRANSIMS network consistent with the existing network.
Input Data Purpose Source
Roadway (Node, Link) Network Preparation & Editing
Existing in-house Four-Step TDM (CUBE Platform)
Traffic Analysis ZoneExisting in-house Four-Step
TDM (CUBE Platform)
Table 6: Network Conversion Input Data and Source

Final Report
Travel Demand Modeling for a Small Sized MPO Using TRANSIMS26
5 Data Requirem
ents
Figure 17 shows the Champaign-Urbana area highway network created utilizing the TRANSIMS tools.
Figure 17: Champaign-Urbana Area Highway Network

Final Report
Travel Demand Modeling for a Small Sized MPO Using TRANSIMS 27
5 Data Requirem
ents
Notes on Network Conversion and Editing• TRANSIMSNet utility program assigned activity locations, process links and parking at
some inappropriate locations of the network (e.g., along highway overpass). These records were removed from the network during the network editing process.
• IntControl utility program assigned traffic signals and all other related features at a few
unsignalized intersections in the network. These signals and related records (phasing, detector, etc.) were removed while editing the network.
• The link input file must show the links connected with the external stations as “EXTERNAL” under the “FUNCTCLASS” attribute (as shown in Table 7). The value of the FIRST_EXTERNAL_ZONE_NUMBER key was assigned 221 in the TRANSIMSNet control file.
NODEA NODEB FUNCTCLASS221 1111 EXTERNAL222 1916 EXTERNAL223 1128 EXTERNAL224 1906 EXTERNAL225 1913 EXTERNAL226 1914 EXTERNAL227 1645 EXTERNAL228 1664 EXTERNAL229 1654 EXTERNAL230 1657 EXTERNAL231 1980 EXTERNAL232 1461 EXTERNAL233 1463 EXTERNAL234 1593 EXTERNAL235 1579 EXTERNAL236 1582 EXTERNAL237 1512 EXTERNAL238 1178 EXTERNAL239 1575 EXTERNAL240 1542 EXTERNAL241 1477 EXTERNAL242 1630 EXTERNAL243 1122 EXTERNAL244 1631 EXTERNAL245 1640 EXTERNAL246 1174 EXTERNAL
Table 7: Link Input Table (Partial)

Final Report
Travel Demand Modeling for a Small Sized MPO Using TRANSIMS28
5 Data Requirem
ents
5.2 Trip Table ConversionThe Champaign-Urbana area’s existing Four-Step Travel Demand Model utilizes trip tables based on a Household Travel Survey conducted in 2002 in the Champaign-Urbana area. The following trip tables were utilized in TRANSIMS Track 1 implementation, as well as in the existing Four-Step TDM (CUBE based).
• Home Based Work (HBW)• Home Based Other (HBO)• Home Based School (HBSC)• Home Based Shopping (HBSH)• Non-Home Based (NHB)• External-External (EE)
Figure 18 shows the trip table conversion procedure for TRANSIMS Track 1 implementation. TRANSIMS utility programs are shown in light grey rectangles.
Figure 18: Trip Table Conversion Procedure

Final Report
Travel Demand Modeling for a Small Sized MPO Using TRANSIMS 29
5 Data Requirem
ents
5.3 Total Trips by PurposeFigure 19 shows trips by purpose as percentages of total daily trips.
0
5
10
15
20
25
30
35
Home-BasedWork
Home-Based-School
Home-Based-Shop
Home-Based-Other
Non-HomeBased
Trip Purpose
% o
f T
ota
l D
aily
Tri
ps
Figure 19: Trips by Purpose

Final Report
Travel Demand Modeling for a Small Sized MPO Using TRANSIMS30
5 Data Requirem
ents
5.4 Data SmoothingThe travel survey data were smoothed using the TRANSIMS SmoothData utility program. Figures 20 and 21 show unsmooth and smoothed Home Based Work (HBW) Production-Attraction trips diurnal distribution data.
0.00%
1.00%
2.00%
3.00%
4.00%
5.00%
6.00%
7.00%
8.00%
9.00%
10.00%0.
25
1.25
2.25
3.25
4.25
5.25
6.25
7.25
8.25
9.25
10.2
5
11.2
5
12.2
5
13.2
5
14.2
5
15.2
5
16.2
5
17.2
5
18.2
5
19.2
5
20.2
5
21.2
5
22.2
5
23.2
5
Time of Day (15 minute Increments)
Sh
are
(%)
0.00%
1.00%
2.00%
3.00%
4.00%
5.00%
6.00%
7.00%
8.00%
9.00%
10.00%
0.251.50
2.754.00
5.256.50
7.759.00
10.2511.50
12.7514.00
15.2516.50
17.7519.00
20.2521.50
22.7524.00
Time of Day (15 minute Increments)
Shar
e (%
)
Figure 20: HBW (unsmooth) Production-Attraction Diurnal Distribution
Figure 21: HBW (smooth) Production-Attraction Diurnal Distribution

Final Report
Travel Demand Modeling for a Small Sized MPO Using TRANSIMS 31
5 Data Requirem
ents
Figure 22 shows the diurnal distribution (smoothed) of trips by purpose (production-attraction) for the Champaign-Urbana area.
Figure 23 shows the diurnal distribution (smoothed) of trips by purpose (attraction-production) for the Champaign-Urbana area.
0.00%
1.00%
2.00%
3.00%
4.00%
5.00%
6.00%
0.25
1.25
2.25
3.25
4.25
5.25
6.25
7.25
8.25
9.25
10.25
11.25
12.25
13.25
14.25
15.25
16.25
17.25
18.25
19.25
20.25
21.25
22.25
23.25
Time of Day
Per
cen
tag
e o
f T
rip
s
HBW_PA HBSC_PA HBSH_PA HBO_PA
0.00%
1.00%
2.00%
3.00%
4.00%
5.00%
6.00%
0.25
1.25
2.25
3.25
4.25
5.25
6.25
7.25
8.25
9.25
10.25
11.25
12.25
13.25
14.25
15.25
16.25
17.25
18.25
19.25
20.25
21.25
22.25
23.25
Time of Day
Per
cen
tag
e o
f T
rip
s
HBW_AP HBSC_AP HBSH_AP HBO_AP
Figure 22: Diurnal Distribution (smoothed) by Trip Purpose (Production-Attraction)
Figure 23: Diurnal Distribution (smoothed) by Trip Purpose (Attraction-Production)

Final Report
Travel Demand Modeling for a Small Sized MPO Using TRANSIMS32
5 Data Requirem
ents
5.5 Model Feedback Process and ConvergenceTrack 1 implementation of TRANSIMS consists of two processes: Router and Microsimulator. The Router locates a route for each vehicle and the Microsimulator follows the exact travel plans determined by the Router for each individual traveler. Common feedback strategies for modeling typical day conditions include the following4:
Router Stabilization• Distributes vehicle loads sufficiently in the network to begin using the Microsimulator.
Microsimulator Stabilization• Distributes vehicles on the network and merges estimated travel plan times with the
Microsimulator travel times.
Dynamic User Equilibrium • Requires iterations between the Router and the Microsimulator (or PlanSum), for selecting
trips with shorter travel plan options until only a few travel plans could be improved and an acceptable “gap” is achieved. The “gap” refers to the total travel time between the current route choice and the best available routes for all travelers.
TRANSIMS Track 1 implementation for the Champaign-Urbana urbanized area followed a feedback strategy based on average link travel times across iterations. This strategy is shown in Figure 24.
Figure 24: CUUATS TRANSIMS Model Feedback Strategy
Source: FHWA

Final Report
Travel Demand Modeling for a Small Sized MPO Using TRANSIMS 33
5 Data Requirem
ents
During the model convergence process, a selected portion of assigned trips were reassigned in the subsequent iteration. Table 8 shows the number of iterations in each phase, rerouting selection criteria and threshold values for time differences between subsequent iterations.
Table 8: Model Stabilization Process
Process Iterations% Time
DifferenceMin. Time Difference
Max. Time Difference
Selection %
Max. % Selected
Router Stabilization (Travel Time Change)
1 - 5 4 2 min 30 min 50 10
Router Stabilization (V/C Avoidance)
6 -10 V/C = 2.0 2 min 30 min 50 10
Microsimulator Stabilization
11 - 15 4 2 min 30 min 50 10
Convergence 16 -25 4 2 min 30 min 50 5

Final Report
Travel Demand Modeling for a Small Sized MPO Using TRANSIMS34
6 Calibration and Validation
6 TRANSIMS Model Calibration and Validation
Model calibration is the process of changing model parameters of the different model steps to match existing trip making behavior. Model validation is the application of the models and comparisons of the results against other data not used for estimation or calibration1. The TRANSIMS model for the Champaign-Urbana area was calibrated to a typical weekday (Tuesday, Wednesday or Thursday) for the year 2006 (the same year of calibration for the CUUATS Four-Step TDM).
6.1 Calibration and Validation StepsThe following steps were followed during the calibration and validation process for the model:
• Testing the following model components:* Network* Socio-economic data* Trip Generation* Trip Distribution* Traffic Assignment◊ A network-wide validation comparison to field counts utilizing Validate utility
program◊ Using screenlines◊ Critical links comparison using major and minor arterials
The calibration steps included thorough checks of network links, nodes and traffic controls. Some of the link attributes were updated (e.g., free flow speed) through this process.
NetworkThe network links, nodes, traffic control types and locations, and one-way links were thoroughly checked. Some of the link attributes were updated (e.g., free flow speed).
Socio-Economic DataTable 9 shows the population growth in the model study area.
Year (Source) Population GrowthAnnual
Growth Rate (%)
1990 (Census) 122,440 2000 (Census) 128,882 6,442 0.51
2005 (Projected) 135,128 6,246 0.95
Table 9: Population Growth

Final Report
Travel Demand Modeling for a Small Sized MPO Using TRANSIMS 35
6 Calibration and Validation
Population per household data was compared with the National Household Travel Survey (NHTS) data shown in Table 10. The NHTS data provides the national averages.
Trip GenerationTable 11 shows a comparison between trip rates obtained from the in-house travel survey and the NHTS (2001) data.
The NHTS 2001 results were transferred to small geographical areas (e.g., Census Tracts or TAZ) through the 2001 NHTS Transferability Study2. The average person trips per household per weekday for the Champaign-Urbana TAZs was 8.46 (obtained from the NHTS Transferability Study). This trip rate is very close to the trip rate obtained through the CUUATS in-house household travel survey.
Table 12 shows the percentage of person trips by purpose for different metropolitan areas3. Champaign-Urbana trips by purpose percentages are shown in the last column.
NHTS 1995 NHTS 20011990
Census2000
Census2005
(Projected)Persons per Household
2.63 2.58 2.48 2.49 2.49
Table 10: Persons per Household Data Comparison
Table 11: Trip Rate Comparisons
Table 12: Trips by Purpose Percentages for Metropolitan Areas
Trip Rate
2001 NHTS 2002 CUUATS In-House
Household Travel Survey
Including Children Age 4
and Above
Including Children of
all AgesDaily Person
Trips per Household
9.7 10.4 8.7
Daily Person Trips per Person
3.7 4.0 4.2
Purpose
HoustonDallas/Ft.
WorthDenver
San Francisco
AtlantaMinneap/St. Paul
Champaign-Urbana
1985 Models (%)
1984 Travel Survey (%)
1985 Travel Survey (%)
1985 Travel Survey (%)
1980 Travel Survey (%)
1982 Travel
Survey (%)
2002 Travel Survey (%)
HBWa 18.1 27.0 26.0 23.6 23.6 17.9 15.3HBNWb 50.6 47.7 47.0 49.7 53.8 53.7 52.6NHBc 31.3 25.3 27.0 26.7 22.6 28.4 32.1Total 100 100 100 100 100 100 100
aHome-Based Work; bHome-Based Non-Work, accounts for all home-based trip purposes except HBW; c Non-Home-Based Work, includes combined purposes for NHB Work and NHB Non-work

Final Report
Travel Demand Modeling for a Small Sized MPO Using TRANSIMS36
6 Calibration and Validation
Daily person trips by purpose percentages for the Champaign-Urbana TAZs obtained from the NHTS Transferability Study were very similar to the percentages obtained from the CUUATS Travel Survey. These comparisons can be seen in Table 13.
Trip DistributionTable 14 shows the average trip length in minutes for different metropolitan areas3. Travel times for different trips by purpose for Champaign-Urbana are highlighted in the table.
Table 13: Daily Person Trips by Purpose Comparisons
Table 14: Trip Lengths for Different Metropolitan Areas
PurposeNHTS
Transferability Study
CUUATS Survey
HBW 13.6 15.3HBNW 57 52.6NHB 29.4 32.1
CityYear of Survey
Average Trip Length in MinutesHBW HBSH HBSC HBO HBNW NHB
San Juan 1991 35.4 14.2 15.5 16.1 -- 16.2Denver 1985 22.7 -- -- -- 12.9 13.8
Northern N.J. 1986 23.2 14.4 -- -- 15.3 17.1Phoenix 1988 19.3 10.6 -- -- 13.0 13.6
Charleston, WV 1993 20.7 18.7 15.9 17.3 -- 15.7Reno 1990 11.2 8.6 9.3 10.4 -- 8.1
CUUATS Survey 2002 13.8 13.4 11.4 11.9 -- 11.0Houston 1985 20.9 9.4 8.9 11.7 10.6 12.7

Final Report
Travel Demand Modeling for a Small Sized MPO Using TRANSIMS 37
6 Calibration and Validation
Trip distributions for different trip purpose over 24-hour period were smoothened by utilizing SmoothData TRANSIMS control file. Figure 25 shows smoothed and unsmoothed HBW Production-Attraction trips distribution over 24-hour period.
0
1
2
3
4
5
6
7
8
9
10
0.25
1.25
2.25
3.25
4.25
5.25
6.25
7.25
8.25
9.25
10.2
511
.25
12.2
513
.25
14.2
515
.25
16.2
517
.25
18.2
519
.25
20.2
521
.25
22.2
523
.25
Hour
% o
f T
rip
s
HBW_PA_Smooth HBW_PA_Unsmooth
Figure 25: Home-Based Work Trips Diurnal Distribution (Smoothed and Unsmoothed)

Final Report
Travel Demand Modeling for a Small Sized MPO Using TRANSIMS38
6 Calibration and Validation
6.2 Traffic AssignmentTables 15 and 16 show a network wide validation comparison to field counts using the Validate TRANSIMS utility program.
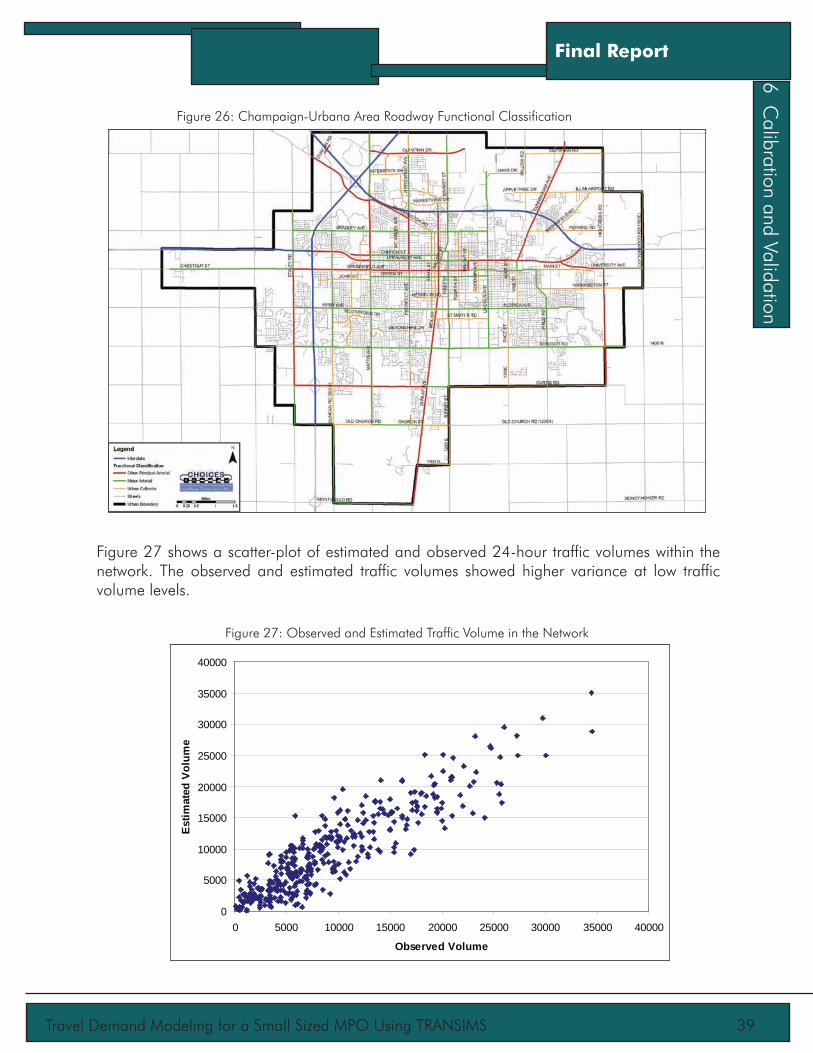
As shown in Table 16, the difference between estimated and observed 24-hour traffic counts on freeways, major arterials and minor arterials was 2.8%, -1.8% and 8.4%, respectively. The percent error by facility type indicates how well the model assignment loads the trips on the roadway links by functional classification. Figure 26 shows the Champaign-Urbana roadway functional classification4.
Table 15: Estimated and Observed (Field Counts) Comparisons by Volume Level
Table 16: Estimated and Observed (Field Counts) Comparisons by Functional Class
Final Report
Travel Demand Modeling for a Small Sized MPO Using TRANSIMS 39
6 Calibration and Validation
Figure 27 shows a scatter-plot of estimated and observed 24-hour traffic volumes within the network. The observed and estimated traffic volumes showed higher variance at low traffic volume levels.
0
5000
10000
15000
20000
25000
30000
35000
40000
0 5000 10000 15000 20000 25000 30000 35000 40000
Observed Volume
Est
imat
ed V
olu
me
Figure 26: Champaign-Urbana Area Roadway Functional Classification
Figure 27: Observed and Estimated Traffic Volume in the Network

Final Report
Travel Demand Modeling for a Small Sized MPO Using TRANSIMS40
6 Calibration and Validation
Table 17 shows the FHWA recommended percent differences by roadway functional class and the percent differences obtained from the CUUATS Four-Step model and TRANSIMS model. The percent differences obtained from the TRANSIMS model were well within the FHWA guidelines.
Table 18 shows region wide calibration statistics for the CUUATS Four-Step and TRANSIMS model. The Correlation Coefficient value of the CUUATS TRANSIMS model was very close to the FHWA recommended value.
Facility TypeFHWA
Guideline3 (+/-)
CUUATS Four-Step
Model
CUUATS TRANSIMS
ModelFreeway 7% -3.10% 2.80%
Major Arterial 10% 1.60% -1.20%Minor Arterial 15% -13.80% 8.40%
Collector 25% -42.60% 4.30%
Table 17: Percent Differences by Functional Class
Table 18: Region-Wide Calibration-Validation Statistics
MeasureFHWA
Guideline
CUUATS Four-Step
Model
CUUATS TRANSIMS
ModelCorrelation Coefficient 0.88 0.88 0.901Percent Diff. Reg. Wide 5% 12% 4.3%

Final Report
Travel Demand Modeling for a Small Sized MPO Using TRANSIMS 41
6 Calibration and Validation
6.3 Using ScreenlinesEight screenlines were used to check the traffic flow across the model region. Four screenlines were oriented in the north-south direction and four were oriented in the east-west direction. The screenline volumes were compared to observed volumes using the percent deviation. The percent deviations were compared with the maximum desirable deviations recommended in the NCHRP 255 Report5. Table 19 shows a summary of the screenline analysis. Figure 28 shows the relative positions of the screenline volumes with respect to FHWA’s recommended maximum desirable deviation line.
ScreenlineNo of Obs.
Volume Difference Standard Deviation
% RMSE R-SquareEstimated Observed Volume %
1 16 52,526 40,778 11,748 28.8 1,533 68.2 0.9962 30 18,200 185,890 -3,890 -2.1 1,125 30.7 0.9353 30 205,053 186,241 18,812 10.1 1,515 36.5 0.8494 14 78,604 65,472 13,132 20.1 1,512 48.3 0.9835 22 113,722 92,936 20,786 22.4 1,638 48.7 0.986 28 202,543 199,548 2,995 1.5 1,747 35.3 0.867 20 106,264 91,932 14,932 16.3 1,170 40.9 0.8818 10 54,270 46,310 7,960 17.2 1,624 44.4 0.991
Table 19: Screenline Summary Analysis
1
2
3
45
6
78
0
10
20
30
40
50
60
0 50 100 150 200 250
24-Hr Base Year Count (Thousands)
Per
cen
t D
evia
tio
n
Maximum Desirable Deviation
Figure 28: Screenline Volumes and Maximum Desirable Deviation

Final Report
Travel Demand Modeling for a Small Sized MPO Using TRANSIMS42
6 Calibration and Validation
Figure 29 shows the locations of the north-south and east-west screenlines.
Figure 29: Screenlines

Final Report
Travel Demand Modeling for a Small Sized MPO Using TRANSIMS 43
6 Calibration and Validation
6.4 Critical Links ComparisonsField traffic counts and simulation results over a 24-hour period were compared for each link shown in Table 20. Freeway links were not compared because hourly traffic volumes on freeways were not available. The 24-hour traffic volumes at links were collected by in-house staff.
Figures 30 and 31 show the differences between the observed and estimated traffic flow patterns on Neil Street, north of Springfield Avenue. Figure 30 shows the differences in patterns for northbound traffic over the 24-hour period, while Figure 31 shows the differences for the southbound traffic.
RoadwayFunctional
Class24-Hour Volume
% DifferenceEstimated Observed
Neil St. North of Springfield Ave.
Major Arterial 23,209 22,036 5.32
Kirby Ave. West of Neil St.
Minor Arterial 18,492 18,644 -0.82
Bradley Ave. East of Mattis Ave.
Minor Arterial 17,491 17,171 1.86
Table 20: Major and Minor Arterial Links for Comparison
0
100
200
300
400
500
600
700
800
900
1000
1:00
AM
2:00
AM
3:00
AM
4:00
AM
5:00
AM
6:00
AM
7:00
AM
8:00
AM
9:00
AM
10:0
0 AM
11:0
0 AM
12:0
0 PM
1:00
PM
2:00
PM
3:00
PM
4:00
PM
5:00
PM
6:00
PM
7:00
PM
8:00
PM
9:00
PM
10:0
0 PM
11:0
0 PM
12:0
0 AM
Hour
Tra
ffic
Vo
lum
e
Observed Estimated
0
200
400
600
800
1000
1200
1:00
AM
2:00
AM
3:00
AM
4:00
AM
5:00
AM
6:00
AM
7:00
AM
8:00
AM
9:00
AM
10:0
0 AM
11:0
0 AM
12:0
0 PM
1:00
PM
2:00
PM
3:00
PM
4:00
PM
5:00
PM
6:00
PM
7:00
PM
8:00
PM
9:00
PM
10:0
0 PM
11:0
0 PM
12:0
0 AM
Hour
Tra
ffic
Vo
lum
e
Observed Estimated
Figure 30: Observed and Estimated Traffic Flow (Neil Street Northbound)
Figure 31: Observed and Estimated Traffic Flow (Neil Street Southbound)
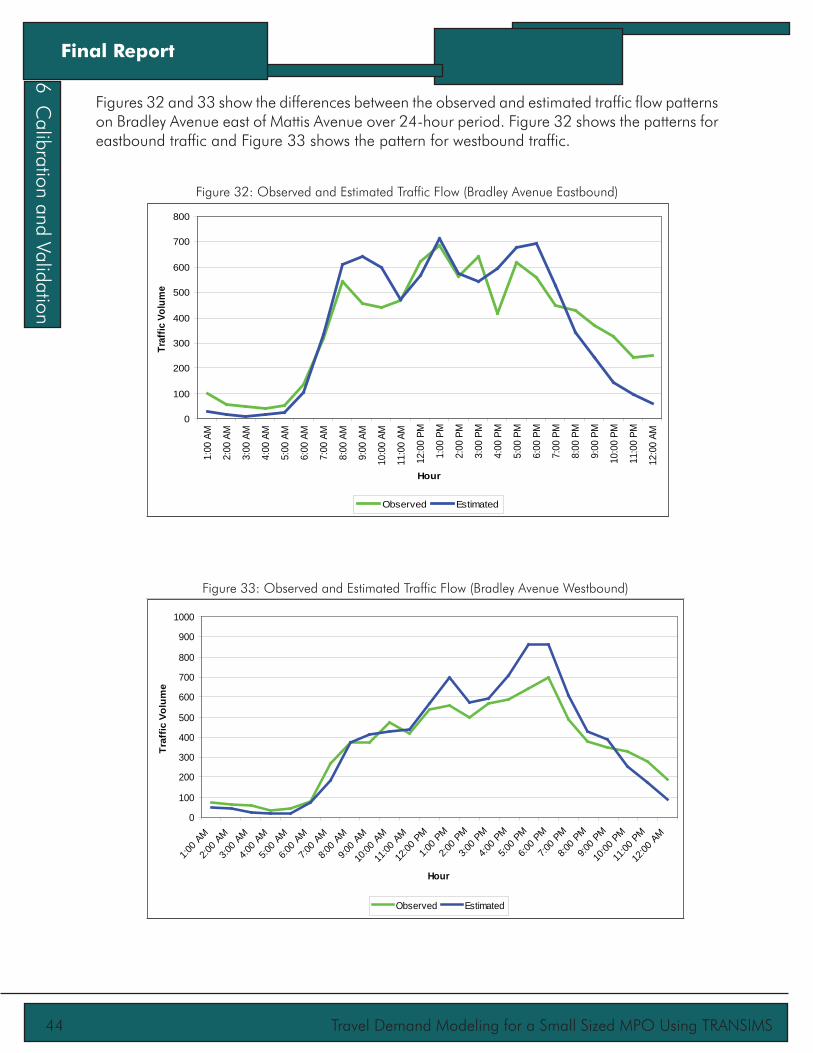
Final Report
Travel Demand Modeling for a Small Sized MPO Using TRANSIMS44
6 Calibration and Validation
Figures 32 and 33 show the differences between the observed and estimated traffic flow patterns on Bradley Avenue east of Mattis Avenue over 24-hour period. Figure 32 shows the patterns for eastbound traffic and Figure 33 shows the pattern for westbound traffic.
Figure 32: Observed and Estimated Traffic Flow (Bradley Avenue Eastbound)
Figure 33: Observed and Estimated Traffic Flow (Bradley Avenue Westbound)
0
100
200
300
400
500
600
700
8001:
00 A
M
2:00
AM
3:00
AM
4:00
AM
5:00
AM
6:00
AM
7:00
AM
8:00
AM
9:00
AM
10:0
0 A
M
11:0
0 A
M
12:0
0 P
M
1:00
PM
2:00
PM
3:00
PM
4:00
PM
5:00
PM
6:00
PM
7:00
PM
8:00
PM
9:00
PM
10:0
0 P
M
11:0
0 P
M
12:0
0 A
M
Hour
Traf
fic V
olum
e
Observed Estimated
0
100
200
300
400
500
600
700
800
900
1000
1:00
AM
2:00
AM
3:00
AM
4:00
AM
5:00
AM
6:00
AM
7:00
AM
8:00
AM
9:00
AM
10:0
0 AM
11:0
0 AM
12:0
0 PM
1:00
PM
2:00
PM
3:00
PM
4:00
PM
5:00
PM
6:00
PM
7:00
PM
8:00
PM
9:00
PM
10:0
0 PM
11:0
0 PM
12:0
0 AM
Hour
Tra
ffic
Vo
lum
e
Observed Estimated

Final Report
Travel Demand Modeling for a Small Sized MPO Using TRANSIMS 45
6 Calibration and Validation
0
200
400
600
800
1000
1200
1:00
AM
2:00
AM
3:00
AM
4:00
AM
5:00
AM
6:00
AM
7:00
AM
8:00
AM
9:00
AM
10:0
0 AM
11:0
0 AM
12:0
0 PM
1:00
PM
2:00
PM
3:00
PM
4:00
PM
5:00
PM
6:00
PM
7:00
PM
8:00
PM
9:00
PM
10:0
0 PM
11:0
0 PM
12:0
0 AM
Hour
Tra
ffic
Vo
lum
e
Observed Estimated
Figures 34 and 35 show the differences between the observed and estimated traffic flow patterns on Kirby Avenue, west of Neil Street over 24-hour period. Figure 34 shows the patterns for eastbound traffic and Figure 35 shows the pattern for westbound traffic.
Figure 34: Observed and Estimated Traffic Flow (Kirby Avenue Eastbound)
Figure 35: Observed and Estimated Traffic Flow (Kirby Avenue Westbound)
0
100
200
300
400
500
600
700
800
900
1000
1:00
AM
2:00
AM
3:00
AM
4:00
AM
5:00
AM
6:00
AM
7:00
AM
8:00
AM
9:00
AM
10:0
0 AM
11:0
0 AM
12:0
0 PM
1:00
PM
2:00
PM
3:00
PM
4:00
PM
5:00
PM
6:00
PM
7:00
PM
8:00
PM
9:00
PM
10:0
0 PM
11:0
0 PM
12:0
0 AM
Hour
Tra
ffic
Vo
lum
e
Observed Estimated

Final Report
Travel Demand Modeling for a Small Sized MPO Using TRANSIMS46
6 Calibration and Validation
Figure 36 shows locations of the links listed in Table 20, as well as some important traffic generators in the modeling area.
Figure 36: Critical Links and Important Traffic Generators
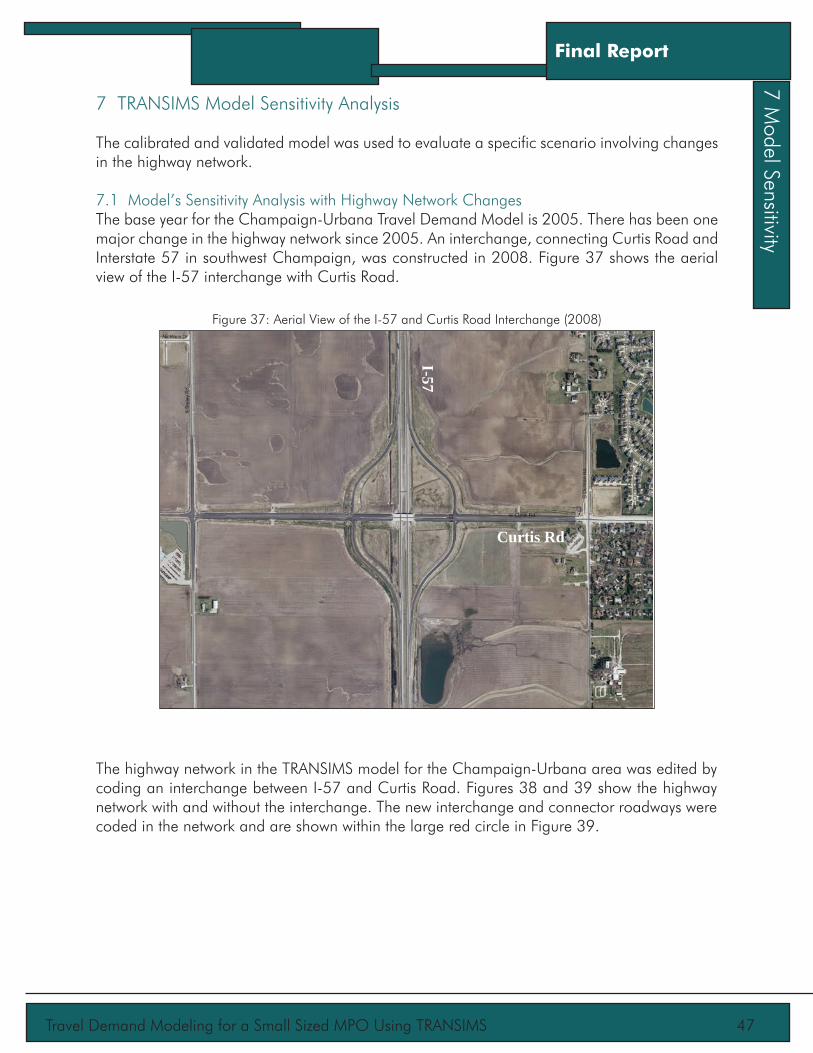
Final Report
Travel Demand Modeling for a Small Sized MPO Using TRANSIMS 47
7 Model Sensitivity
7 TRANSIMS Model Sensitivity Analysis
The calibrated and validated model was used to evaluate a specific scenario involving changes in the highway network.
7.1 Model’s Sensitivity Analysis with Highway Network ChangesThe base year for the Champaign-Urbana Travel Demand Model is 2005. There has been one major change in the highway network since 2005. An interchange, connecting Curtis Road and Interstate 57 in southwest Champaign, was constructed in 2008. Figure 37 shows the aerial view of the I-57 interchange with Curtis Road.
The highway network in the TRANSIMS model for the Champaign-Urbana area was edited by coding an interchange between I-57 and Curtis Road. Figures 38 and 39 show the highway network with and without the interchange. The new interchange and connector roadways were coded in the network and are shown within the large red circle in Figure 39.
Curtis Rd
I-57
Figure 37: Aerial View of the I-57 and Curtis Road Interchange (2008)

Final Report
Travel Demand Modeling for a Small Sized MPO Using TRANSIMS48
7 Model Sensitivity
Figure 38: TRANSIMS Highway Network (Base Condition without Interchange)

Final Report
Travel Demand Modeling for a Small Sized MPO Using TRANSIMS 49
7 Model Sensitivity
Figure 39: TRANSIMS Highway Network with the Interchange

Final Report
Travel Demand Modeling for a Small Sized MPO Using TRANSIMS50
7 Model Sensitivity
Curtis Road provides convenient and fast access to the major employment centers in Champaign-Urbana (e.g., University of Illinois Research Park). Currently, a major segment of Curtis Road between Mattis Avenue to Prospect Avenue has been closed off to through traffic in order to facilitate a complete reconstruction of the roadway. This roadway segment is scheduled to be closed for a long period of time, which will directly affect regional travel patterns. Figure 40 shows the location of the closed section of Curtis Road.
Figure 40: Curtis Road

Final Report
Travel Demand Modeling for a Small Sized MPO Using TRANSIMS 51
7 Model Sensitivity
For the purpose of scenario testing, the Champaign-Urbana TRANSIMS highway network was edited accordingly by removing the closed segment of Curtis Road from the network. The edited network is shown in Figure 41.
Figure 41: TRANSIMS Network with Curtis Road Interchange and Closed Segments

Final Report
Travel Demand Modeling for a Small Sized MPO Using TRANSIMS52
7 Model Sensitivity
7.2 Traffic Assignment ComparisonThe TRANSIMS modules were run with the edited highway network (Curtis Road segment removed) and model outputs (link traffic volumes) were compared with field data obtained from the Illinois Department of Transportation. Table 21 shows a comparison between observed and estimated traffic volume data for the I-57 and Curtis Road interchange ramps, as well as corresponding connecting roadways.
As shown in Table 21, observed and estimated traffic volumes had a strong correlation (correlation coefficient value is 0.99). The 2009 traffic volume data was collected by IDOT between July 23 and 24, 2009. The University of Illinois was not in regular session (Fall Semester started in mid-August) during that time. Therefore, observed traffic volumes on the study interchange ramps should be reasonably more than that shown in Table 21.
Roadway24-Hour Volume
Observed (Year)Estimated
(TRANSIMS Output)I-57 South of Curtis Road 28,980 (2005) 29,586I-57 North of Curtis Road 28,980 (2005) 29,749
Curtis Road to I-57 SB 650 (2009) 692I-57 NB to Curtis Road 750 (2009) 2,011I-57 SB to Curtis Road 1,370 (2009) 1,105Curtis Road to I-57 NB 1,375 (2009) 1,760
Curtis Road E of I-57 Ramps No data 2,916Curtis Road W of I-57 Ramps No data 1,613
Table 21: Comparison of Observed and Estimated Traffic Volumes

Final Report
Travel Demand Modeling for a Small Sized MPO Using TRANSIMS 53
8 Four-Step Model
8 Four-Step Travel Demand Model and TRANSIMS
Four-step travel demand models have been used extensively for travel demand forecasting by regional transportation planning agencies for more than 25 years. This modeling technique is not without deficiencies which were addressed through newer travel modeling approaches (e.g., activity-based modeling). This chapter describes the differences between implementing a four-step model and a TRANSIMS model, including issues related to input data, outputs, methodologies, modeling skills, cost, and technical support.
8.1 Four-Step Model’s Limitations and TRANSIMSA typical four-step model is based on the assumption that the actual trip ends (trip generation) do not change as travel time changes. The lack of rigorous iterations for the various components of a travel model is a major weakness of the four-step model. Common iteration procedures for a typical four-step model include6:
• Congested highway travel times and costs resulting from traffic assignment iterated back into the trip distribution and mode-choice models.
• Transit times (where transit is on the highway network) and costs iterated back into the mode-choice model.
• Transit times and costs iterated back to the trip-distribution model in the case where travel times are a composite of highway and transit intrazonal times and costs (composite impedance).
Whereas, preferable iteration procedures should include the following: • Highway and transit intrazonal travel times and costs iterated back to the zonal socio-
economic data-residential and employment location models. • Automobile occupancy iterated back into the time-of-day.• Highway and transit intrazonal travel times and costs iterated back to the automobile
ownership models used to predict trip generation rates.
TRANSIMS modeling involves individual travelers and their multi-modal transportation based on synthetic populations and their activities. It is capable of modeling the stochastic and dynamic attributes of the transportation system. TRANSIMS modules are connected with feedback loops (Activity Generator, Router and Microsimulator) to achieve the above stated preferable iteration procedures. Although, for Track 1 implementation of TRANSIMS, the Population Synthesizer and Activity Generator modules are not required.

Final Report
Travel Demand Modeling for a Small Sized MPO Using TRANSIMS54
8 Four-Step Model
8.2 Components of Four-Step Models and TRANSIMS ModulesThe steps associated with traditional four-step models and the five TRANSIMS modules are not directly analogous to each other. Generally, tasks completed in trip generation, trip distribution, and mode-choice steps in the four-step model also occur in the Activity Generator and Router modules of TRANSIMS7. Figure 42 shows a comparison between four-step and TRANSIMS modeling steps.
The Router module generates routes for each individual travel plan from a trip file (for trips resulting from activities or trip tables for Track 1 implementation). The interaction of demand (traveler’s route plan) and supply (transportation network) occurs in the Microsimulator module. This process is multi-modal, dynamic and disaggregate in nature. In a four-step model, aggregate route choice (demand) and roadway network (supply) occur during the traffic assignment step. For this reason, Figure 41 shows a similarity of tasks for traffic assignment in the four-step model and Router and Microsimulator modules of TRANSIMS.
As the traditional four-step modeling approach is aggregate in nature, it does not track behavior of individuals and cannot make any analysis based on individual traveler characteristics. In the mode-choice step of four-step modeling, transit user’s income or distances to or from a bus stop generally cannot be taken into consideration. Currently, it is very difficult to include these individual traveler characteristics in four-step modeling. In the traffic assignment step of four-step modeling, the supply to a link is dependent on the static link performance functions and does not represent the time-dependent queue buildup from bottlenecks or sequential chaining
Figure 42: Four-Step Model and TRANSIMS Modules

Final Report
Travel Demand Modeling for a Small Sized MPO Using TRANSIMS 55
8 Four-Step Model
of trips. During this step, information is unavailable for the demographic characteristics of travelers. That is why analysis by sub-population is currently difficult to perform8. In TRANSIMS, travelers are considered individual agents who can make decisions about their actions, including short-term decisions from acceleration, lane changing and planning daily activities.
Four-step travel models provide an origin-destination (OD) matrix between different TAZs and are loaded into the transportation network. Typically, the outputs from four-step models are not readily suitable for traffic operational analysis.
The Track 1 implementation of TRANSIMS for the Champaign-Urbana area utilized the trip table obtained from the in-house four-step travel model. Moreover, only the auto trips were modeled as the transit network was underdevelopment at the time of this study.
8.3 Input DataFigures 43 and 44 show the input data required for both the four-step model and TRANSIMS model. As shown in Figure 43, input data for a typical four-step travel model includes socio-economic data (e.g., population, employment, household travel survey results: #of person/HH, # of vehicles/HH, etc.) and transportation network data.
Figure 43: Four-Step Modeling Steps

Final Report
Travel Demand Modeling for a Small Sized MPO Using TRANSIMS56
8 Four-Step Model
Figure 44 shows the input data for the TRANSIMS modules. The pink colored ovals are the input data for the TRANSIMS modules. TRANSIMS modules require detailed demographic information (source: STF-3A, PUMS) for the Population Synthesizer module. Household activity travel survey data (recorded continuously for 24+ hours for all the household members of the representative sample of the population) is required for the Activity Generator module. Conducting an activity based travel survey in a community is a cost, time and labor intensive process. Therefore, input data for TRANSIMS can be more laborious and expensive to prepare. However, the Router and Microsimulator modules can be implemented utilizing trip tables obtained from the traditional trip based models. Also, a few Population Synthesizer and Activity Generator models are available in the market which can be utilized instead of conducting an activity-based survey. Strong GIS capabilities are recommended for implementing TRANSIMS modules.
Figure 44: TRANSIMS Modules9

Final Report
Travel Demand Modeling for a Small Sized MPO Using TRANSIMS 57
8 Four-Step Model
8.4 Model OutputFour-step model outputs generally include daily aggregate person trips by mode, vehicle trips and loaded network by periods. TRANSIMS outputs include individual level (disaggregate) trip and tour information and the loaded network. The TRANSIMS Microsimulator simulates individual trips on a specific path.
8.5 Cost, Skill and SupportFour-step models are developed and maintained by utilizing travel demand modeling packages available on the market. The cost of the software package can be the biggest initial cost for any agency. Skill development for operating the software (training) and maintenance costs are also significant. Input data for four-step modeling are relatively cheap and easy to obtain. Generally, most of the four-step modeling packages have their own technical support groups and software user groups.
TRANSIMS modules are available for any agency or individual free of cost. Software training and maintenance are also available free of cost. TRANSIMS modules require strong GIS capabilities, and obtaining and maintaining a GIS license(s) can be expensive. Input data for the Activity Generator module requires activity-based survey results, which involves a costly and labor intensive process. TRANSIMS also has technical and user support groups. Employee training time can be significant depending on the type of TRANSIMS implementation.
For this study, three staff members received a three-day long training on TRANSIMS modules. Also, staff spent a significant amount of time studying the “How To” documents and other related literature.
8.6 Traffic Flow ModelingLoaded transportation network data from four-step travel models can be utilized by simulation modules supported by the corresponding travel demand modeling package. Generally, the users have to buy separate licenses for utilizing those simulation modules.
TRANSIMS has a simulation data visualizer, called NEXTA, available at no cost. Figure 45 shows the Champaign-Urbana roadway network utilizing the NEXTA Visualizer.

Final Report
Travel Demand Modeling for a Small Sized MPO Using TRANSIMS58
8 Four-Step Model Figure 45: Champaign-Urbana Roadway Network in NEXTA

Final Report
Travel Demand Modeling for a Small Sized MPO Using TRANSIMS 59
9 Conclusion
9 Conclusions and Opportunities for Future Work
This study developed a travel demand model for a small sized MPO utilizing the Track 1 implementation modules of TRANSIMS. Trip tables obtained from the in-house four-step travel model were utilized with the Router and Microsimulator modules of TRANSIMS. The model outputs showed satisfactory results in validation tests.
This study showed strong potential for utilizing TRANSIMS modules for a small sized MPO. Initial costs for software procurement and training are relatively lower then with a four-step model. Data collection can be costly if an activity survey is conducted for the Activity Generator module. However, it is not necessary for the Track 1 implementation of TRANSIMS.
9.1 Opportunities for Future WorkAs a product of this study, there are several potential opportunities for future work. These include:
• Implementing TRANSIMS for small MPOs which do not have a travel demand model in place by considering both Track 1 implementation and integrating other Population Synthesizer and Activity Generator models blended with the Router and Microsimulator modules of TRANSIMS.
• Utilizing the TRANSIMS travel model for emergency evacuation planning for small urbanized areas. TRANSIMS can model multiple modes of transportation such as cars, buses, walking, etc. This level of detail captures individual movements and makes it a suitable tool for modeling emergency evacuation scenarios where other common four-step travel demand models fail. Currently, TRANSIMS is being used to analyze emergency evacuation scenarios for big metropolitan areas like the City of Chicago. It can also be used in small urbanized areas for emergency evacuation scenario evaluation purposes.

Final Report
Travel Demand Modeling for a Small Sized MPO Using TRANSIMS60
References
REFERENCES
1. Federal Highway Administration- Travel Model Validation Practices Peer Exchange White Paper, FHWA, December, 2008.
2. http://nhts-gis.ornl.gov/trasferability
3. Federal Highway Administration- Model Validation and Reasonableness Checking Manual, FHWA, June 2001.
4. Champaign County Regional Planning Commission- Choices 2035, Long Range Transportation Plan, CCRPC, September 2009.
5. Transportation Research Board- Highway Traffic Data for Urbanized Area Project Planning, NCHRP Report 255, TRB, December 1982.
6. Transportation Research Board- Travel Estimation Techniques for Urban Planning NCHRP Report 365, Transportation Research Board, Washington DC, 1998.
7. Texas Transportation Institute- El Paso TRANSIMS Case Study, Texas Transportation Institute, TTI, College Station, TX 2003.
8. National Institute for Advanced Transportation Technology- Applying the TRANSIMS Modeling Paradigm to the Simulation and Analysis of Transportation and Traffic Control Systems, National Institute for Advanced Transportation Technology, University of Idaho, Moscow, ID, 2007.
9. TRANSIMS Reference Manual, downloaded from www.transims-opensource.net.