final report - ccrpc road transportation study phase 1—initial technical evaluation final report...
TRANSCRIPT

Williston Road Transportation StudyPhase 1—Initial Technical Evaluation
FINAL REPORT
Prepared for Chittenden County Regional Planning CommissionCity of South Burlington, Vermont
Prepared by VHB

Williston Road Transportation Study
Phase 1 – Initial Technical Evaluation
Prepared for
Chittenden County Regional Planning Commission
City of South Burlington, Vermont
Prepared by
VHB South Burlington, Vermont
November 2015

The preparation of this report has been financed in part through grant[s] from the Federal Highway Administration and Federal Transit Administration, U.S. Department of Transportation, under the State Planning and Research Program, Section 505 [or Metropolitan Planning Program, Section 104(f)] of Title 23, U.S. Code. The contents of this report do not necessarily reflect the official views or policy of the U.S. Department of Transportation.

Table of Contents
Executive Summary………………………………………………………………………………………. 1
Introduction ……………………………………………………………………………………….……….. 3
Existing Conditions …………………………………………………………………………………..….. 4
Future Conditions ………………………………………………………………………………………..12
Alternatives Evaluation…………………………………………………………………………………13
Findings ……………………………………………………………………………………………………….19

List of Figures
Figure No. Description
1 Study Area 2 Monthly Traffic Variations 3 Daily Traffic Variations 4 Hourly Traffic Variations 5 Existing Weekday Morning Peak Hour Volumes 6 Existing Weekday Evening Peak Hour Volumes 7 Crash Summary 8 Existing Conditions 9 Potential Future Williston Road Cross-section 10 Conceptual Improvement Plan 11 2025 No Build Weekday Morning Peak Hour Volumes 12 2025 No Build Weekday Evening Peak Hour Volumes 13 2025 Build Weekday Morning Peak Hour Volumes 14 2025 Build Weekday Evening Peak Hour Volumes 15 2035 No Build Weekday Morning Peak Hour Volumes 16 2035 No Build Weekday Evening Peak Hour Volumes 17 2035 Build Weekday Morning Peak Hour Volumes 18 2035 Build Weekday Evening Peak Hour Volumes 19 2035 Build (with Exit 12B) Weekday Morning Peak Hour Volumes 20 2035 Build (with Exit 12B) Weekday Evening Peak Hour Volumes
Executive Summary
Study Purpose
The purpose of the study is to conduct an initial (Phase 1) technical evaluation to identify potential transportation improvements for the segment of Williston Road that extends from Dorset Street to Hinesburg Road. The objective is to identify actions that can accommodate the anticipated future build-out of the area while still meeting the City of South Burlington’s multi-modal vision of a walkable community.
This initial technical evaluation is being provided to the Chittenden County Regional Planning Commission (CCRPC) and City of South Burlington at a technical planning evaluation level. Prior to advancing any of the potential actions described in this report, the City would proceed to a more detailed (Phase 2) scoping level study. The Phase 2 study would include a public outreach component, including soliciting input from corridor property owners.
The Need
The segment of Williston Road between Dorset Street and Hinesburg Road is an important transportation corridor that is heavily travelled and often congested. There are two principal influences that contribute to the operational and safety related deficiencies. The first factor is the Williston Road/Dorset Street intersection, which is capacity constrained - currently operating at a volume-to-capacity (v/c) ratio of 0.98 (98% of capacity) with vehicle queues often extending back to the adjacent Windjammer/DoubleTree signalized intersection. The Williston Road/Dorset Street intersection is also a high crash location.
The second factor is the lane configuration of Williston Road, which provides four general purpose lanes (two lanes per direction). The absence of exclusive left-turn lanes in combination with the numerous uncontrolled driveways and wide curb-cuts result in motorists stopping in the inside through lane while waiting to turn left into a driveway. This condition results in added delay to through vehicles while creating a potentially hazardous condition as motorists shift from one lane to another to avoid the stopped vehicles.
In addition to the traffic congestion and safety-related deficiencies, the existing layout of the corridor is not as conducive to the City’s multi-modal walkable community vision as it could be. The absence of bike lanes force bicyclists to either use the high volume travel lanes or travel along the sidewalks, which has the potential to create conflicts with pedestrians. Walking across the four-lane cross-section of Williston Road, even at pedestrian actuated traffic signals, can be a daunting task for pedestrians.
Findings
To meet the City’s multi-modal walkable community vision, the results of this initial investigation suggests that any proposed improvements should focus on actions that enhance the safe and efficient movement of people – that is all users of the transportation system, not just automobiles.
In general, these actions would look to introduce access management, improve connectivity, and enhance sidewalks, crosswalks, bike lanes, bike paths, and transit service. Specific actions that should be considered and evaluated in greater detail under the Phase 2 scoping study include:
1

• Providing a full or partial connector roadway north of the corridor
• Improving parcel connectivity south of the corridor
• Maintaining two through lanes per direction on Williston Road, but providing exclusive left-turn lanes at signalized intersections
• Installing a raised center median that extends between signalized intersections
• Ensuring that all properties have access to all least one traffic signal, so that all left-turns can be made at signalized intersections.
• Planning for the installation of an additional future traffic signal on Williston Road approximately half way between the existing DoubleTree intersection and the soon to be realigned Garden Street/White Street intersection
• Installing bike lanes along Williston Road
• Providing well-defined pedestrian crosswalks at each of the signalized intersections
• Upgrading and widening sidewalks
• Coordinating with and supporting the Chittenden County Transportation Authority (CCTA) in the CCTA’s vision for expanded service along the corridor, including new technologies that provide real time passenger information and traffic signal priority systems.
It is important to note that the results of the evaluation show that the Williston Road/Dorset Street intersection, without some type of
major reconstruction to the Exit 14 interchange or some other major regional transportation upgrade such as the construction of Exit 12B, would continue to operate over capacity with long delays. Nevertheless, the capacity deficiency at the Dorset Street intersection should not preclude the City from advancing the access management, improved connectivity, and pedestrian, bicycle, and transit enhancements identified in this report. These actions will benefit corridor operations while more regional solutions are being considered and will complement any long-term regional transportation solutions.
Additional detailed evaluation, however, should be conducted under the Phase 2 study to determine whether the identified connector roadway should extend to the Dorset Street intersection. Substantially increasing the volume of left-turns from Williston Road onto the new connector at that location would exacerbate the capacity deficiency at Dorset Street.
2

Introduction
Study Purpose
The City of South Burlington is in the midst of a transition away from the automobile-dependent suburban development patterns of the past to a more multi-modal urbanized vision of the future. A prime example of this new development pattern is the planned City Center project. City Center is a walkable downtown core development plan for the land located south of Williston Road, east of Dorset Street, and west of Hinesburg Road. To support the development of the new walkable downtown core, the City has established a Tax Increment Finance (TIF) District and has initiated the engineering and design of the supporting roadway infrastructure. Given the proximity of Williston Road (US Route 2) to the new planned downtown core, it is vital that the look, feel, and operation of Williston Road complement the City’s multi-modal vision.
The purpose of the study is to conduct an initial (Phase 1) technical evaluation to identify potential transportation improvements to the Williston Road corridor, from Dorset Street to Hinesburg Road, that can accommodate the potential build-out of the area and complement the City’s multi-modal vision of a walkable community. The City’s objective is to realize this vision while avoiding “old school” solutions such as providing additional through lanes along Williston Road. The study corridor is depicted in Figure 1.
Study Process
Unlike other transportation planning studies, which would include a public outreach element, this initial screening of potential strategies, is being prepared for the Chittenden County Regional Planning Commission (CCRPC) and City officials, at a technical
planning evaluation level. Prior to advancing any of the actions presented in this report, the City will proceed to a more detailed (Phase 2) scoping level study, which would include an extensive public outreach component.
This study included an initial data collection effort consisting of a field reconnaissance to observe traffic flow patterns, traffic operational issues, pedestrian and bicycle activity, multi-modal facilities, traffic control and physical roadway characteristics. This was followed by a review of available traffic volume counts as well as the receipt of updated counts conducted by the CCRPC. Crash data available through the Vermont Agency of Transportation (VTrans) were also compiled and reviewed. In addition to the existing transportation data collection effort, available information such as the locations of existing utilities, topography, and various environmental resources and constraints were compiled and mapped.
Having assessed the existing conditions, the study included an evaluation of future operations. A sub-area traffic model, based on the CCRPC’s regional traffic model, was used to project future travel demand based on the City’s anticipated land development build-out including the build-out assumed in the City’s TIF District.
Lastly, recognizing the City’s multi-modal vision for the future, a range of alternatives were evaluated to determine which actions and strategies best meet the vision and which should be pursued as part of the more detailed scoping study.
Throughout the course of the study, a series of coordination/progress meetings were held with CCRPC and City staff. These meeting included:
• July 15, 2014 – Project Kick-off
3

Williston Road Network Transportation Study, South Burlington, VTData Source: South Burlington, VTGIS
DO
RS
ET S
TR
EE
T
MA
RY S
TR
EE
T
WILLISTON ROAD
WHIT
E S
TREET
DRIVEEXECUTI
VE
JAYCEE PARK
0 300 600 Feet
RO
AD
PA
TC
HE
N
MID
AS D
RIV
E
HIN
ES
BU
RG R
OA
D
Figure 1
Study Area

• August 19, 2014 – Land Use Assumptions • November 13, 2014 – Brainstorming Session • March 3, 2015 – Preliminary Findings
Report Overview
The report includes an assessment of Existing and Future Conditions. This information provides the basis for identifying both existing and future issues and opportunities that should be addressed. The evaluation considers actions or strategies aimed at addressing defined issues while meeting the City’s multi-modal vision. Note that the operational analyses presented in this report is a multi-modal analysis that allows the City to consider the operational quality of service from the perspective of the user. Multimodal users of Williston Road include pedestrians, bicyclists, transit riders, and motorists. Lastly, the identified actions are those that best meet the City’s vison and should be considered for advancement to the scoping level study for further evaluation.
This report is presented in a concise, easy-to-read summary report format. The back-up material is being provided to in a separate technical appendix.
Existing Conditions
Williston Road
Williston Road (US Route 2) in South Burlington is classified by the Vermont Agency of Transportation (VTrans) as an Urban Principal Arterial. US Route 2 is the primary east-west connection between Williston and Burlington with access to I-89 at a full cloverleaf interchange (Exit 14) located immediately west of the study area. Within the project corridor, from Dorset Street to Hinesburg Road, Williston Road is a four-lane roadway (two travel lanes in each
direction), with a posted speed limit of 35 miles per hour. Left-turn and right-turn lanes are only provided at the intersection of Dorset Street, while turn movements along the remainder of the corridor are made from the through travel lanes. In addition to a general lack of turn lanes along the corridor, there are numerous cub-cuts providing access and egress to a variety of commercial and residential land uses. The absence of defined turn lanes coupled with the numerous curb-cuts create an environment where mobility for all users of the corridor (motorists, pedestrians, bicyclists, and transit riders) is inefficient.
Traffic Volumes
A traffic volume count program was conducted to determine the existing traffic volume demands and flow patterns along the Williston Road corridor as well as the surrounding project study area. The count data conducted outside the Williston Road corridor was used to develop the sub-area traffic model, which is based on the CCRPC’s regional traffic model. Recent counts conducted by VTrans and the City (the City’s consultant Stantec) were supplemented with weekday morning (7:00 – 9:00 AM) and weekday evening (4:00 – 6:00 PM) peak period manual turning movement counts conducted by the Chittenden County Regional Planning Commission (CCRPC) during June, July, and August of 2014.
Historical traffic data from the closest VTrans permanent count station (P6D061), which is located on US Route 2 in Williston approximately 2.3 miles east of Hinesburg Road, was reviewed to identify monthly, daily, and hourly traffic variations.
An examination of the 2014 monthly data revealed that traffic volumes are highest along US Route 2 during the summer months. Count data from a typical week during the peak month of June reports fairly consistent weekday traffic with slightly higher volumes
4

on Friday and substantially lower volumes on Saturday and Sunday. An examination of the hourly data from a Wednesday in June shows a typical commuting pattern with a peak in the morning followed be slightly lower volumes throughout the midday and the highest peak in the early evening. The monthly, daily, and hourly traffic variations along US Route 2 just east of the study area are shown in Figures 2 through 4.
Figure 2 – Monthly Variations 2014 Average Weekday Traffic US Route 2 Williston, VT
Figure 3 – Daily Variations June 2014 US Route 2 Williston, VT
Figure 4 – Hourly Variations June 2014 US Route 2 Williston, VT
9,500
10,000
10,500
11,000
11,500
12,000
12,500
13,000
-
2,000
4,000
6,000
8,000
10,000
12,000
14,000
-
200
400
600
800
1,000
1,200
1,400
12:00AM
2:00AM
4:00AM
6:00AM
8:00AM
10:00AM
12:00PM
2:00PM
4:00PM
6:00PM
8:00PM
10:00PM
5

The unit of measure used to evaluate and design roadway facilities is an hourly traffic volume measured in vehicles per hour (vph). However, because hourly traffic volumes can vary during the course of a day, and throughout the year, it is necessary to select an appropriate design hour volume (DHV) condition. The hourly traffic volume used for the purpose of design should not be exceeded very often or by very much. However, it should not be so high that the traffic volume would rarely be high enough to make full use of the facility. It is wasteful to design a facility based on the maximum peak hour traffic of the design year, yet the use of the average hourly traffic may result in an inadequate design. For this reason, VTrans guidelines recommend the use of the 30th highest hour volume.
Historical data from the three closest VTrans permanent traffic count stations (P6D001 - VT Route 127 in Burlington, P6D040 - US Route 7 in Colchester, and P6D061 - US Route 2 in Williston) were reviewed to establish an appropriate DHV condition. Listings of the 200 highest hours at these three permanent counts stations were reviewed to identify what peak periods best represent a DHV condition (30th highest hour).
Both Weekday morning and weekday evening peak hours were consistently identified within the highest 60 hours at the Burlington count station and weekday evening peak hours were identified within the highest 60 hours at the Colchester and Williston count stations; indicating that both the weekday morning and a weekday evening peak hours are reflective of a DHV condition. Therefore, the average adjustment factor calculated from the three stations was used to estimate the DHV conditions. The following DHV adjustments were applied to the weekday morning and weekday evening raw turning movement counts:
• A 1.03 DHV adjustment was applied to the June data; • A 1.09 DHV adjustment was applied to the July data; and • A 1.06 DHV adjustment was applied to the August and
September data. Detailed calculations for the Design Hour Volume adjustments are provided in the Appendix.
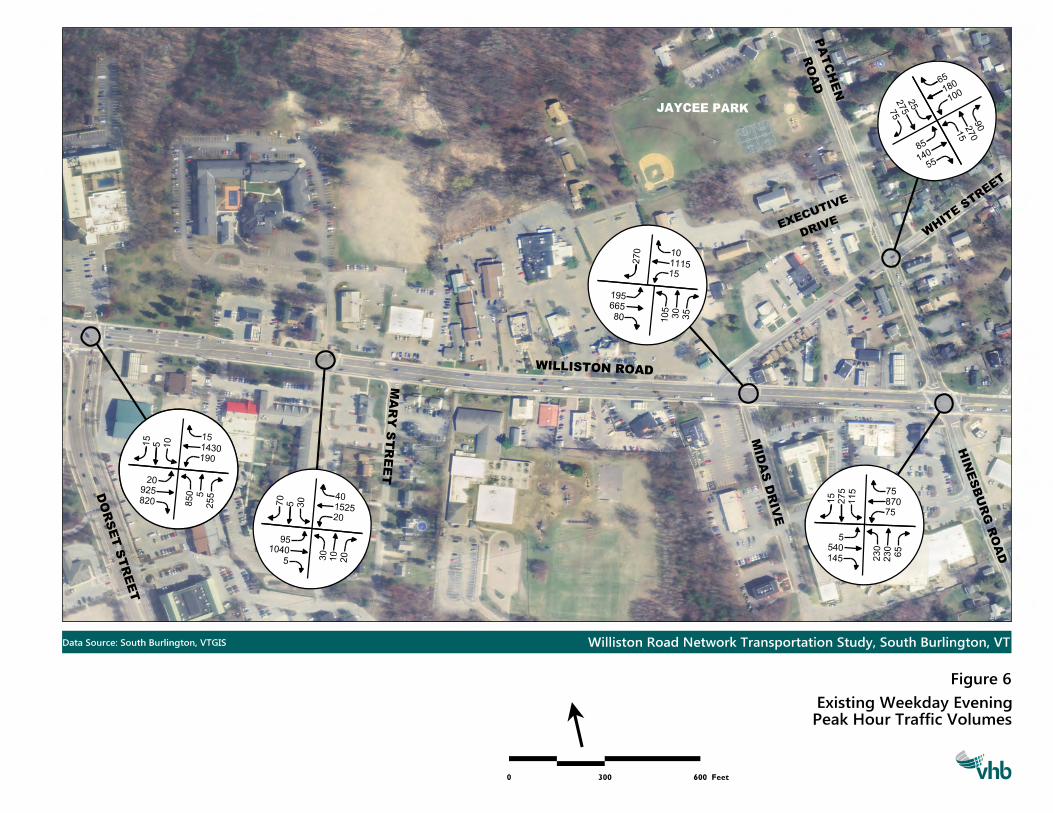
The 2014 weekday morning and weekday evening peak hour traffic volume networks were developed by applying the DHV adjustments to the raw traffic volumes and applying an average annual growth rate of 1.0 percent per year, which was based on regression analysis for the urban highway group conducted by VTrans. Eastbound and westbound volumes along the corridor were compared at adjacent intersections and balancing adjustments were made only where appropriate. The 2014 weekday morning and weekday evening peak hour traffic volumes, which were used in both the intersection and multimodal operational analyses, are shown in Figures 5 and 6.
Crash Research
Crash data was compiled from the records of the Vermont Agency of Transportation (VTrans) for the most recent 5-year period extending from 2009 to 2013. A review of the data revealed a total of 491 crashes occurring along Williston Road from Dorset Street through Hinesburg Road for the 5-year period. Of the 491 total crashes, 203 (41 percent) were reported as rear-end crashes, 134 (27 percent) were sideswipes crashes, 101 (21 percent) were broadside crashes, 13 (3 percent) were head-on crashes, and the remaining 40 crashes were classified as other/unknown crashes (including one angular and 8 single vehicle crashes). A summary of the crash types is depicted graphically in Figure 7.
Note that VTrans has identified the intersections of Williston Road at Dorset Street, White Street/Midas Drive, and Patchen
6

Williston Road Network Transportation Study, South Burlington, VTData Source: South Burlington, VTGIS
Peak Hour Traffic Volumes
Existing Weekday Morning
DO
RS
ET S
TR
EE
T
MA
RY S
TR
EE
T
WHIT
E S
TREET
DRIVEEXECUTI
VE
JAYCEE PARK
125
195
5
5
30 5
10
65
770
785
10
125
265
145
40
515230 45
15
80
35600
270
15
5175
10
85
125
95
45
40
75
20
1050
55
5
10
107035 20
45
5 30 5
20
950
655
20
5
365
145
100510 5
135
15
5
0 300 600 Feet
HIN
ES
BU
RG R
OA
D
MID
AS D
RIV
E
WILLISTON ROAD
RO
AD
PA
TC
HE
N
Figure 5
Williston Road Network Transportation Study, South Burlington, VTData Source: South Burlington, VTGIS
Peak Hour Traffic Volumes
Existing Weekday Evening
DO
RS
ET S
TR
EE
T
MA
RY S
TR
EE
T
WHIT
E S
TREET
DRIVEEXECUTI
VE
JAYCEE PARK
0 300 600 Feet
275
65
100
140
15
270
180
25
75
85
55
90
665
195
270
105
15
1115
10
80 30
35
540
145
15
115
230
230
75
870
75
275
5
65
925
820
15
5
850
255
143010 15
190
20
5
1040
70
5
20
152530 40
95
5 30
10
20
HIN
ES
BU
RG R
OA
D
MID
AS D
RIV
E
WILLISTON ROAD
RO
AD
PA
TC
HE
N
Figure 6

Road/Hinesburg Road as High Crash Locations (HCL) with 95, 63, and 48 reported crashes respectively over the 5-year period. The intersections of Williston Road at Best Western Windjammer Inn/DoubleTree and Mary Street recorded 13 and 32 crashes respectively, between 2009 and 2013. The remaining 240 crashes occurred along segments of Williston Road between these intersections.
Figure 7 – Crash Summary 5-Year Period from 2009 to 2013
Transit
Chittenden County Transportation Authority (CCTA) provides bus service along the Williston Road corridor in South Burlington. The primary existing CCTA route that services Williston Road is the
Williston/Williston-Essex/Williston Village (Route No. 1/1E/1V). This route currently makes four runs during the weekday morning peak hour and five runs during the weekday evening hour. Information provided by CCTA indicating that this primary route typically runs at occupancy rates of between 13 and 20 percent. The route also runs on-time (within 6 minutes of schedule) between 80 and 98 percent of the time.
Other secondary routes that serve the Williston Road corridor include the South Burlington Circulator (Route No. 12), and the 116 Commuter (Route No. 46). The South Burlington Circulator makes two runs during the weekday morning peak hour and three runs during the weekday evening hour. The 116 Commuter makes one run during each of the morning and evening peak hours.
The CCTA’s Transit Development Plan (TDP) identified the replacement of the Cherry Street Station by a new Downtown Transit Center as the most needed facility investment in the CCTA system. Based on other case studies throughout Chittenden County this improvement could lead to a 30 percent jump in ridership. More details on all route schedules can be found at: http://cctaride.org/bus-routes-schedules/.
Multimodal Operations Analysis
As described previously, it is important to evaluate transportation services along Williston Road from a multimodal perspective. Improvements to non-automobile modes will help the City move toward a multimodal urbanized vision consistent with the City Center project. As such, planning level multimodal analyses were performed for the Williston Road corridor within the study area between Dorset Street and Hinesburg Road.
203
119
8 7
66
32
3 6 5 1 1 1 831
0
50
100
150
200
250
7
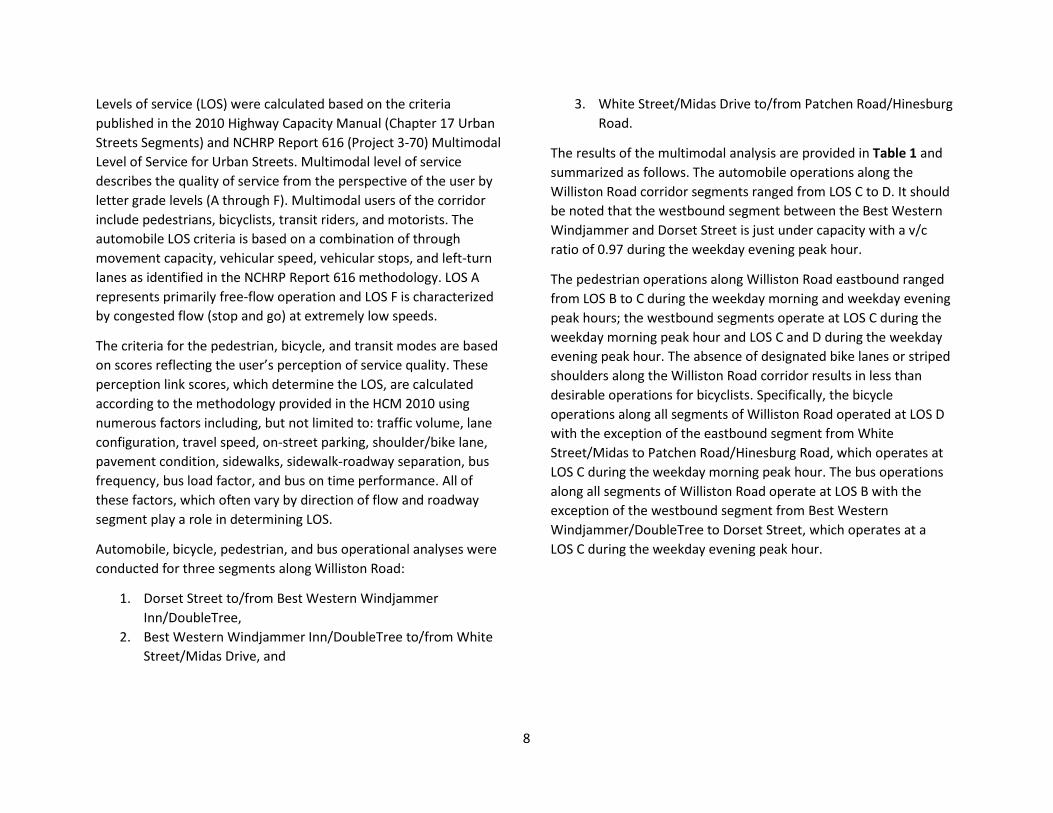
Levels of service (LOS) were calculated based on the criteria published in the 2010 Highway Capacity Manual (Chapter 17 Urban Streets Segments) and NCHRP Report 616 (Project 3-70) Multimodal Level of Service for Urban Streets. Multimodal level of service describes the quality of service from the perspective of the user by letter grade levels (A through F). Multimodal users of the corridor include pedestrians, bicyclists, transit riders, and motorists. The automobile LOS criteria is based on a combination of through movement capacity, vehicular speed, vehicular stops, and left-turn lanes as identified in the NCHRP Report 616 methodology. LOS A represents primarily free-flow operation and LOS F is characterized by congested flow (stop and go) at extremely low speeds.
The criteria for the pedestrian, bicycle, and transit modes are based on scores reflecting the user’s perception of service quality. These perception link scores, which determine the LOS, are calculated according to the methodology provided in the HCM 2010 using numerous factors including, but not limited to: traffic volume, lane configuration, travel speed, on-street parking, shoulder/bike lane, pavement condition, sidewalks, sidewalk-roadway separation, bus frequency, bus load factor, and bus on time performance. All of these factors, which often vary by direction of flow and roadway segment play a role in determining LOS.
Automobile, bicycle, pedestrian, and bus operational analyses were conducted for three segments along Williston Road:
1. Dorset Street to/from Best Western Windjammer Inn/DoubleTree,
2. Best Western Windjammer Inn/DoubleTree to/from White Street/Midas Drive, and
3. White Street/Midas Drive to/from Patchen Road/Hinesburg Road.
The results of the multimodal analysis are provided in Table 1 and summarized as follows. The automobile operations along the Williston Road corridor segments ranged from LOS C to D. It should be noted that the westbound segment between the Best Western Windjammer and Dorset Street is just under capacity with a v/c ratio of 0.97 during the weekday evening peak hour.
The pedestrian operations along Williston Road eastbound ranged from LOS B to C during the weekday morning and weekday evening peak hours; the westbound segments operate at LOS C during the weekday morning peak hour and LOS C and D during the weekday evening peak hour. The absence of designated bike lanes or striped shoulders along the Williston Road corridor results in less than desirable operations for bicyclists. Specifically, the bicycle operations along all segments of Williston Road operated at LOS D with the exception of the eastbound segment from White Street/Midas to Patchen Road/Hinesburg Road, which operates at LOS C during the weekday morning peak hour. The bus operations along all segments of Williston Road operate at LOS B with the exception of the westbound segment from Best Western Windjammer/DoubleTree to Dorset Street, which operates at a LOS C during the weekday evening peak hour.
8
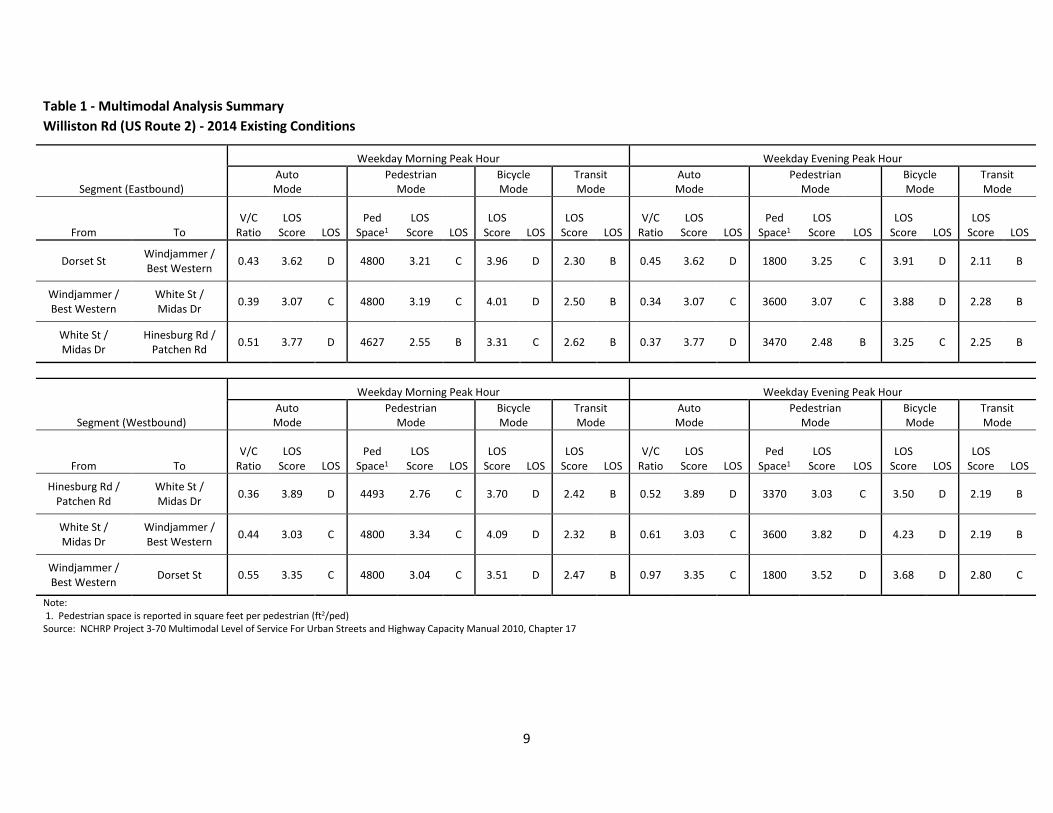
Table 1 - Multimodal Analysis Summary Williston Rd (US Route 2) - 2014 Existing Conditions
Segment (Eastbound)
Weekday Morning Peak Hour Weekday Evening Peak Hour Auto Mode
Pedestrian Mode
Bicycle Mode
Transit Mode
Auto Mode
Pedestrian Mode
Bicycle Mode
Transit Mode
From To V/C
Ratio LOS
Score LOS Ped
Space1 LOS
Score LOS LOS
Score LOS LOS
Score LOS V/C
Ratio LOS
Score LOS Ped
Space1 LOS
Score LOS LOS
Score LOS LOS
Score LOS
Dorset St Windjammer / Best Western 0.43 3.62 D 4800 3.21 C 3.96 D 2.30 B 0.45 3.62 D 1800 3.25 C 3.91 D 2.11 B
Windjammer / Best Western
White St / Midas Dr 0.39 3.07 C 4800 3.19 C 4.01 D 2.50 B 0.34 3.07 C 3600 3.07 C 3.88 D 2.28 B
White St / Midas Dr
Hinesburg Rd / Patchen Rd 0.51 3.77 D 4627 2.55 B 3.31 C 2.62 B 0.37 3.77 D 3470 2.48 B 3.25 C 2.25 B
Segment (Westbound)
Weekday Morning Peak Hour Weekday Evening Peak Hour Auto Mode
Pedestrian Mode
Bicycle Mode
Transit Mode
Auto Mode
Pedestrian Mode
Bicycle Mode
Transit Mode
From To V/C
Ratio LOS
Score LOS Ped
Space1 LOS
Score LOS LOS
Score LOS LOS
Score LOS V/C
Ratio LOS
Score LOS Ped
Space1 LOS
Score LOS LOS
Score LOS LOS
Score LOS
Hinesburg Rd / Patchen Rd
White St / Midas Dr 0.36 3.89 D 4493 2.76 C 3.70 D 2.42 B 0.52 3.89 D 3370 3.03 C 3.50 D 2.19 B
White St / Midas Dr
Windjammer / Best Western 0.44 3.03 C 4800 3.34 C 4.09 D 2.32 B 0.61 3.03 C 3600 3.82 D 4.23 D 2.19 B
Windjammer / Best Western Dorset St 0.55 3.35 C 4800 3.04 C 3.51 D 2.47 B 0.97 3.35 C 1800 3.52 D 3.68 D 2.80 C
Note: 1. Pedestrian space is reported in square feet per pedestrian (ft2/ped) Source: NCHRP Project 3-70 Multimodal Level of Service For Urban Streets and Highway Capacity Manual 2010, Chapter 17
9
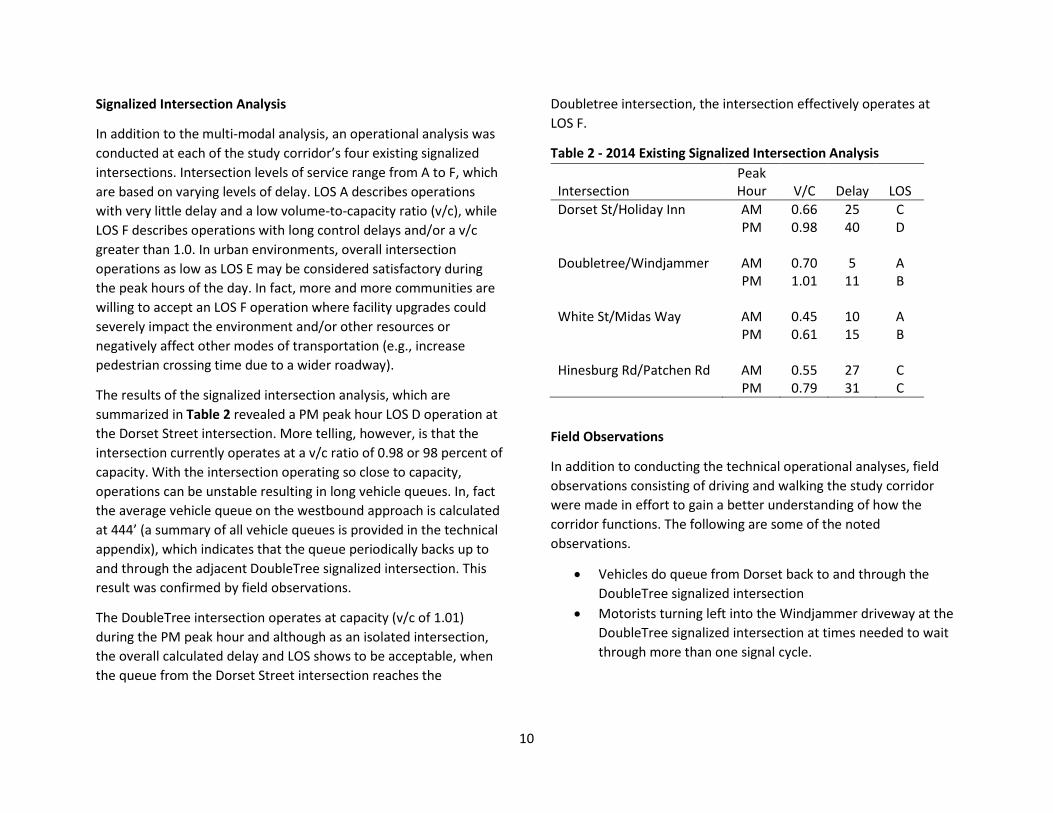
Signalized Intersection Analysis
In addition to the multi-modal analysis, an operational analysis was conducted at each of the study corridor’s four existing signalized intersections. Intersection levels of service range from A to F, which are based on varying levels of delay. LOS A describes operations with very little delay and a low volume-to-capacity ratio (v/c), while LOS F describes operations with long control delays and/or a v/c greater than 1.0. In urban environments, overall intersection operations as low as LOS E may be considered satisfactory during the peak hours of the day. In fact, more and more communities are willing to accept an LOS F operation where facility upgrades could severely impact the environment and/or other resources or negatively affect other modes of transportation (e.g., increase pedestrian crossing time due to a wider roadway).
The results of the signalized intersection analysis, which are summarized in Table 2 revealed a PM peak hour LOS D operation at the Dorset Street intersection. More telling, however, is that the intersection currently operates at a v/c ratio of 0.98 or 98 percent of capacity. With the intersection operating so close to capacity, operations can be unstable resulting in long vehicle queues. In, fact the average vehicle queue on the westbound approach is calculated at 444’ (a summary of all vehicle queues is provided in the technical appendix), which indicates that the queue periodically backs up to and through the adjacent DoubleTree signalized intersection. This result was confirmed by field observations.
The DoubleTree intersection operates at capacity (v/c of 1.01) during the PM peak hour and although as an isolated intersection, the overall calculated delay and LOS shows to be acceptable, when the queue from the Dorset Street intersection reaches the
Doubletree intersection, the intersection effectively operates at LOS F.
Table 2 - 2014 Existing Signalized Intersection Analysis Intersection
Peak Hour
V/C
Delay
LOS
Dorset St/Holiday Inn AM 0.66 25 C PM 0.98 40 D Doubletree/Windjammer AM 0.70 5 A PM 1.01 11 B White St/Midas Way AM 0.45 10 A PM 0.61 15 B Hinesburg Rd/Patchen Rd AM 0.55 27 C PM 0.79 31 C
Field Observations
In addition to conducting the technical operational analyses, field observations consisting of driving and walking the study corridor were made in effort to gain a better understanding of how the corridor functions. The following are some of the noted observations.
• Vehicles do queue from Dorset back to and through the DoubleTree signalized intersection
• Motorists turning left into the Windjammer driveway at the DoubleTree signalized intersection at times needed to wait through more than one signal cycle.
10
• Although some bicyclists were observed traveling in the travel lane along Williston Road, most bicyclists chose to ride their bicycles along the sidewalk.
• Pedestrians crossing Williston Road at signalized intersections experienced long wait times for the pedestrian actuated phase to be called. Some crossed without waiting for the pedestrian phase.
• Motorists turning left onto one of the many driveways and curb cuts often stopped in the inside through lane while waiting for a gap in the stream of traffic. This frequently resulted in through vehicles queuing behind the stopped vehicle while others shifted lanes to avoid the delay.
Mapped Resources
In addition to the existing transportation data collection effort, available base mapping resources were compiled to support the study efforts. The information, which is depicted on Figure 8, includes the location of study area utilities, topographic information, and various environmental resources and constraints. Specifically, the mapped information includes:
• Property lines • 2’ topographic contours • Water lines • Storm water lines • River/streams • Wildlife habitat • Floodplain • Wetlands • Hazardous waste sites
This information was used when considering various physical modifications, such as locating a potential connector roadway. Note the steep slopes and wetland area to the rear of the properties located on the north side of Williston Road that can influence the location of any future connector roadway. This information will provide a useful base for the more detailed environmental evaluation to be conducted under the Phase 2 scoping study.
11

!<
!<
!<
!<
!<
!<
!<
!<
!<
!<
!<
!<
!<
!<
!<
!<
!<
!<
!<
!<
!<
!<
!<
!<
!<
!<
!<
!<
!<
!<
!<
!<
!<
!<
!<
!<
!<
!<
!<
!<
!<
!<
!<
!< !<
!<
!<
!<
DORSET STREET
MARY STREET
MIDAS DRIVE
HINESBURG ROAD
WHITE STREET
PATCHEN ROAD
CHARLES STREET
EXECUTIVE
DRIVE
WILLISTON ROAD
JAYCEE PARK
Williston Road Network Transportation Study, South Burlington, VT
Figure 8
Existing Conditions
Data Source: South Burlington, VTGIS
0 300 600 Feet
Water LineStormwater LineSanitary Sewer LineRiver/Stream (VCGI)NHI Uncommon Species Location (Wandering Glider, observed 1968)VT Habitat Blocks and Ecological CorridorsFEMA 500-Yr Floodplain
Wetland Resource Area (South Burlington)!< Hazardous Waste Sites!< Facilities Generating Hazardous Waste
Property Lines2-ft Contours10-ft Index Contour
l

Future Conditions
To evaluate future travel demands within the study area, future year 2025 and 2035 traffic volume conditions were developed for both the weekday morning peak hour and the weekday evening peak hour. The future year traffic volume projections were developed through the use of the CCRPC’s regional traffic model and the development of a sub-area traffic model for the immediate study area.
Working closely with CCRPC and City staff, a comprehensive land use build-out review was conducted in order to estimate future travel demand and consider future needs along the study corridor. For the purpose of this evaluation traffic volumes were estimated for the 2025 and 2035 future year conditions. The estimates were determined by first reviewing and then updating the land use assumptions included in the CCRPC’s regional traffic model. Once any needed adjustments were made, a sub-area traffic model reflecting the immediate study area was developed.
The development of the subarea traffic model included the incorporation of greater roadway network detail and the incorporation of more and smaller traffic analysis zones (TAZs).
The additional roadway network detail that was not included in the regional model, but was incorporated into the subarea model included the following streets and driveways:
• Richard Terrace, Hanover Street and Dumont Ave • Driveways along the north side of Williston Road • Mary Street
The approach and exiting volumes were calculated for each intersection and the links were then connected directly to the
TransCAD geographic file. Additional available counts (not from study area intersections) were also included in the calibration to help confirm that the correct number of trips entered, exited and traveled through the sub-area model. The sub-area model was calibrated for both the weekday morning and evening peak hours.
The following projects were added to the future networks:
• Midas Drive / White Street intersection realignment – Future
• Garden Street Extension - Future • Central School Road between Williston Road and Garden
Street Extension
Once the future no-build models were run and resulting turn movements were created the model was run for three build alternatives for both 2025 and 2035. The alternatives consisted of:
• New 12B Interchange • New parallel road north of Williston Road connecting Hilton
Driveway to Patchen Road. • New parallel road and New 12B Interchange
In addition to the above improvements a connection between Tilley Drive and Community Drive was also included in the scenarios with the new 12B interchange.
The weekday morning and evening, 2025 and 2035, No Build and Build traffic volume networks can be found at the end of the report in Figures 11 through 20. The No Build conditions reflect only the anticipated future traffic growth by either the year 2025 or 2035 with no modifications to the roadway network. The Build condition reflects the identified potential actions that are being evaluated. An additional condition (2035 Build with Exit 12B) was developed to reflect the additional traffic diversions if Exit 12B was constructed.
12
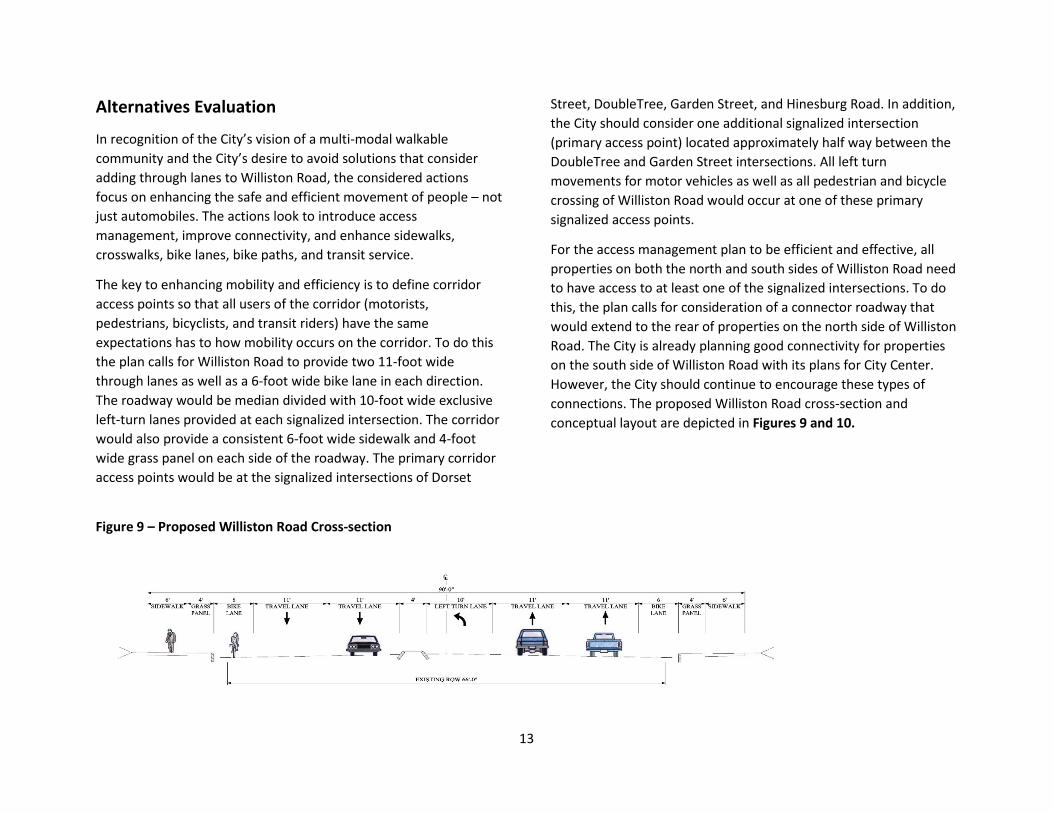
Alternatives Evaluation
In recognition of the City’s vision of a multi-modal walkable community and the City’s desire to avoid solutions that consider adding through lanes to Williston Road, the considered actions focus on enhancing the safe and efficient movement of people – not just automobiles. The actions look to introduce access management, improve connectivity, and enhance sidewalks, crosswalks, bike lanes, bike paths, and transit service.
The key to enhancing mobility and efficiency is to define corridor access points so that all users of the corridor (motorists, pedestrians, bicyclists, and transit riders) have the same expectations has to how mobility occurs on the corridor. To do this the plan calls for Williston Road to provide two 11-foot wide through lanes as well as a 6-foot wide bike lane in each direction. The roadway would be median divided with 10-foot wide exclusive left-turn lanes provided at each signalized intersection. The corridor would also provide a consistent 6-foot wide sidewalk and 4-foot wide grass panel on each side of the roadway. The primary corridor access points would be at the signalized intersections of Dorset
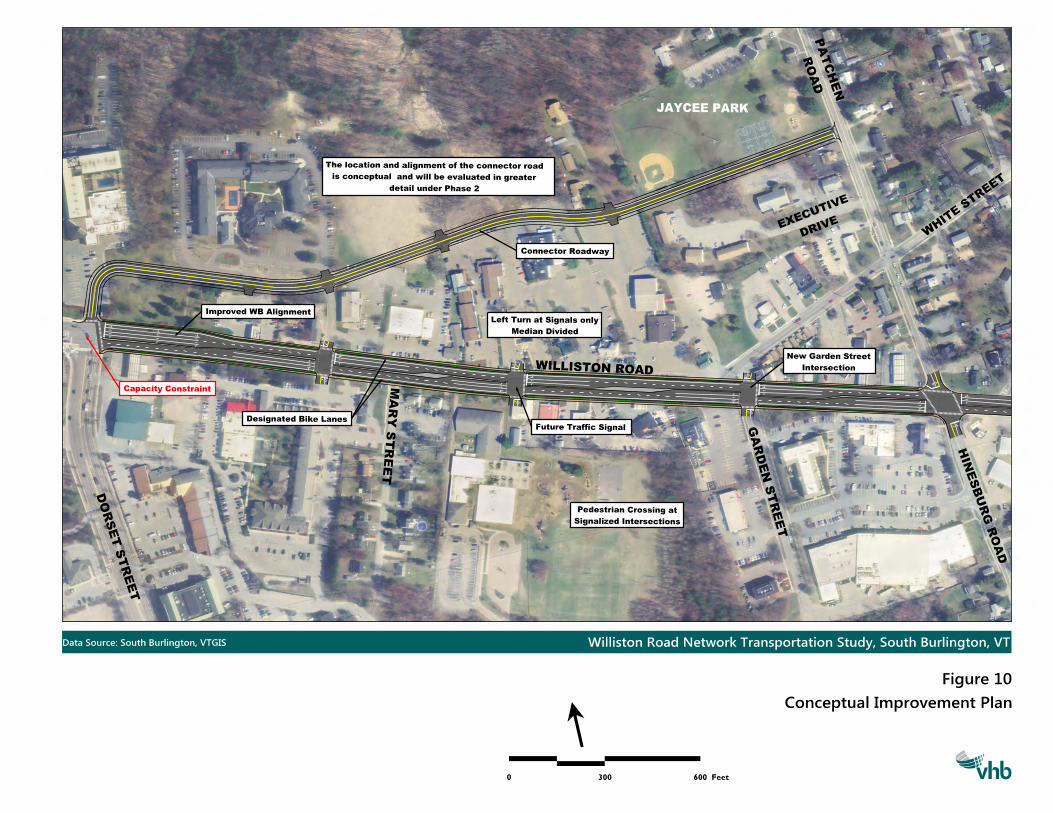
Street, DoubleTree, Garden Street, and Hinesburg Road. In addition, the City should consider one additional signalized intersection (primary access point) located approximately half way between the DoubleTree and Garden Street intersections. All left turn movements for motor vehicles as well as all pedestrian and bicycle crossing of Williston Road would occur at one of these primary signalized access points.
For the access management plan to be efficient and effective, all properties on both the north and south sides of Williston Road need to have access to at least one of the signalized intersections. To do this, the plan calls for consideration of a connector roadway that would extend to the rear of properties on the north side of Williston Road. The City is already planning good connectivity for properties on the south side of Williston Road with its plans for City Center. However, the City should continue to encourage these types of connections. The proposed Williston Road cross-section and conceptual layout are depicted in Figures 9 and 10.
Figure 9 – Proposed Williston Road Cross-section
13
Williston Road Network Transportation Study, South Burlington, VTData Source: South Burlington, VTGIS
DO
RS
ET S
TR
EE
T
MA
RY S
TR
EE
T
WILLISTON ROAD
WHIT
E S
TREET
DRIVEEXECUTI
VE
JAYCEE PARK
0 300 600 Feet
RO
AD
PA
TC
HE
N
HIN
ES
BU
RG R
OA
D
Conceptual Improvement Plan
Figure 10
GA
RD
EN S
TR
EE
T
detail under Phase 2
is conceptual and will be evaluated in greater
The location and alignment of the connector road
Improved WB Alignment
Designated Bike LanesFuture Traffic Signal
Signalized Intersections
Pedestrian Crossing at
Capacity Constraint
Intersection
New Garden Street
Connector Roadway
Median Divided
Left Turn at Signals only
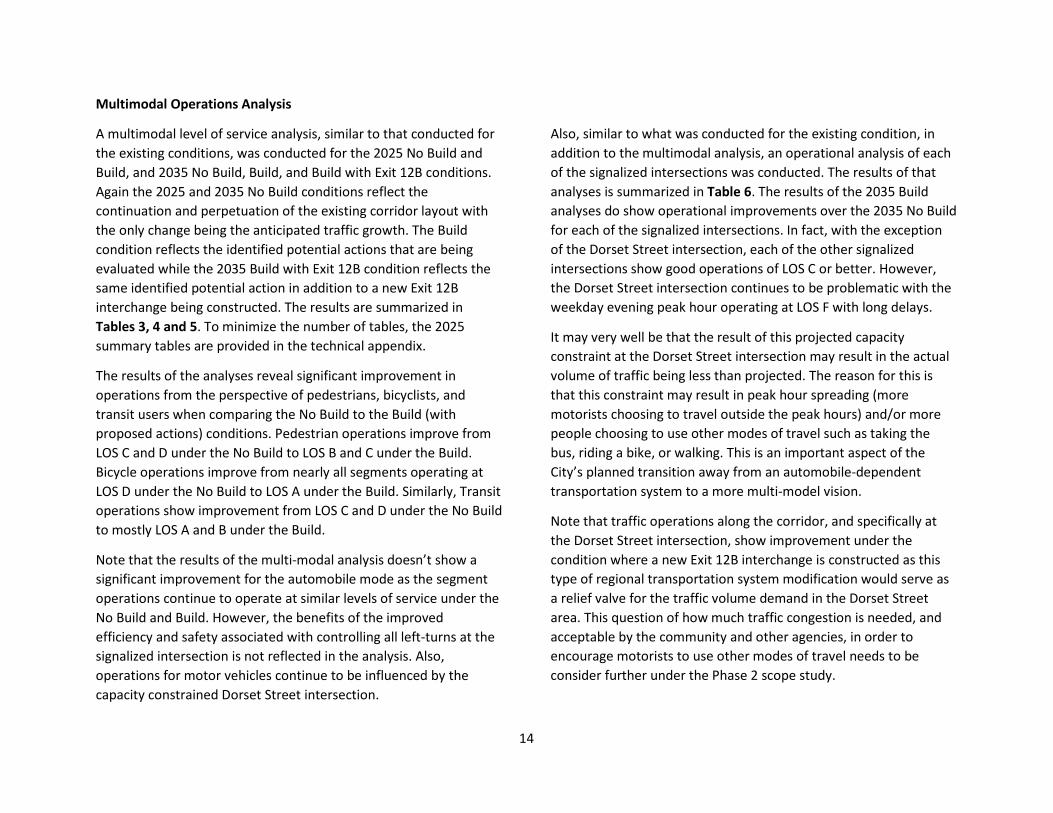
Multimodal Operations Analysis
A multimodal level of service analysis, similar to that conducted for the existing conditions, was conducted for the 2025 No Build and Build, and 2035 No Build, Build, and Build with Exit 12B conditions. Again the 2025 and 2035 No Build conditions reflect the continuation and perpetuation of the existing corridor layout with the only change being the anticipated traffic growth. The Build condition reflects the identified potential actions that are being evaluated while the 2035 Build with Exit 12B condition reflects the same identified potential action in addition to a new Exit 12B interchange being constructed. The results are summarized in Tables 3, 4 and 5. To minimize the number of tables, the 2025 summary tables are provided in the technical appendix.
The results of the analyses reveal significant improvement in operations from the perspective of pedestrians, bicyclists, and transit users when comparing the No Build to the Build (with proposed actions) conditions. Pedestrian operations improve from LOS C and D under the No Build to LOS B and C under the Build. Bicycle operations improve from nearly all segments operating at LOS D under the No Build to LOS A under the Build. Similarly, Transit operations show improvement from LOS C and D under the No Build to mostly LOS A and B under the Build.
Note that the results of the multi-modal analysis doesn’t show a significant improvement for the automobile mode as the segment operations continue to operate at similar levels of service under the No Build and Build. However, the benefits of the improved efficiency and safety associated with controlling all left-turns at the signalized intersection is not reflected in the analysis. Also, operations for motor vehicles continue to be influenced by the capacity constrained Dorset Street intersection.
Also, similar to what was conducted for the existing condition, in addition to the multimodal analysis, an operational analysis of each of the signalized intersections was conducted. The results of that analyses is summarized in Table 6. The results of the 2035 Build analyses do show operational improvements over the 2035 No Build for each of the signalized intersections. In fact, with the exception of the Dorset Street intersection, each of the other signalized intersections show good operations of LOS C or better. However, the Dorset Street intersection continues to be problematic with the weekday evening peak hour operating at LOS F with long delays.
It may very well be that the result of this projected capacity constraint at the Dorset Street intersection may result in the actual volume of traffic being less than projected. The reason for this is that this constraint may result in peak hour spreading (more motorists choosing to travel outside the peak hours) and/or more people choosing to use other modes of travel such as taking the bus, riding a bike, or walking. This is an important aspect of the City’s planned transition away from an automobile-dependent transportation system to a more multi-model vision.
Note that traffic operations along the corridor, and specifically at the Dorset Street intersection, show improvement under the condition where a new Exit 12B interchange is constructed as this type of regional transportation system modification would serve as a relief valve for the traffic volume demand in the Dorset Street area. This question of how much traffic congestion is needed, and acceptable by the community and other agencies, in order to encourage motorists to use other modes of travel needs to be consider further under the Phase 2 scope study.
14

Table 3 - Multimodal Analysis Summary Williston Rd (US Route 2) - 2035 No Build Conditions
Segment (Eastbound)
Weekday Morning Peak Hour Weekday Evening Peak Hour Auto Mode
Pedestrian Mode
Bicycle Mode
Transit Mode
Auto Mode
Pedestrian Mode
Bicycle Mode
Transit Mode
From To V/C
Ratio LOS
Score LOS Ped
Space1 LOS
Score LOS LOS
Score LOS LOS
Score LOS V/C
Ratio LOS
Score LOS Ped
Space1 LOS
Score LOS LOS
Score LOS LOS
Score LOS
Dorset St Windjammer / Best Western 0.52 3.62 D 4800 3.40 C 3.62 D 2.41 B 0.54 3.62 D 1800 3.50 C 3.68 D 3.45 C
Windjammer / Best Western
White St / Midas Dr 0.58 2.83 C 4800 3.20 C 3.57 D 2.34 B 0.61 2.83 C 3600 3.17 C 3.58 D 2.21 B
White St / Midas Dr
Hinesburg Rd / Patchen Rd 0.53 3.77 D 4627 2.76 C 3.41 C 2.60 B 0.44 3.77 D 3470 2.79 C 3.41 C 2.25 B
Segment (Westbound)
Weekday Morning Peak Hour Weekday Evening Peak Hour Auto Mode
Pedestrian Mode
Bicycle Mode
Transit Mode
Auto Mode
Pedestrian Mode
Bicycle Mode
Transit Mode
From To V/C
Ratio LOS
Score LOS Ped
Space1 LOS
Score LOS LOS
Score LOS LOS
Score LOS V/C
Ratio LOS
Score LOS Ped
Space1 LOS
Score LOS LOS
Score LOS LOS
Score LOS
Hinesburg Rd / Patchen Rd
White St / Midas Dr 0.73 3.62 D 4493 2.65 B 3.38 C 2.74 B 0.99 3.62 D 3370 2.96 C 3.52 D 3.02 C
White St / Midas Dr
Windjammer / Best Western 0.54 3.03 C 4800 3.54 D 4.14 D 2.34 B 0.71 3.03 C 3600 4.03 D 4.24 D 2.22 B
Windjammer / Best Western Dorset St 0.91 3.35 C 4800 3.33 C 3.63 D 2.83 C 1.45 3.35 F 1800 3.90 D 3.79 D 3.80 D
Note: 1. Pedestrian space is reported in square feet per pedestrian (ft2/ped) Source: NCHRP Project 3-70 Multimodal Level of Service For Urban Streets and Highway Capacity Manual 2010, Chapter 17
15

Table 4 - Multimodal Analysis Summary Williston Rd (US Route 2) - 2035 Build Conditions
Segment (Eastbound)
Weekday Morning Peak Hour Weekday Evening Peak Hour Auto Mode
Pedestrian Mode
Bicycle Mode
Transit Mode
Auto Mode
Pedestrian Mode
Bicycle Mode
Transit Mode
From To V/C
Ratio LOS
Score LOS Ped
Space1 LOS
Score LOS LOS
Score LOS LOS
Score LOS V/C
Ratio LOS
Score LOS Ped
Space1 LOS
Score LOS LOS
Score LOS LOS
Score LOS
Dorset St Windjammer / Best Western 0.48 3.35 C 5184 3.00 C 2.03 B 1.94 A 0.50 3.35 C 1944 3.29 C 2.25 B 1.86 A
Windjammer / Best Western
New Signalized Intersection 0.63 3.86 D 5184 2.68 B 1.57 A 2.21 B 0.63 3.86 D 3888 2.62 B 1.54 A 2.07 B
New Signalized Intersection
White St / Garden St 0.59 3.51 D 5184 2.69 B 1.57 A 1.95 A 0.66 3.51 D 3888 2.67 B 1.57 A 1.79 A
White St / Garden St
Hinesburg Rd / Patchen Rd 0.71 3.78 D 5184 2.71 B 1.80 A 1.99 A 0.68 3.78 D 3888 2.68 B 1.79 A 1.83 A
Segment (Westbound)
Weekday Morning Peak Hour Weekday Evening Peak Hour Auto Mode
Pedestrian Mode
Bicycle Mode
Transit Mode
Auto Mode
Pedestrian Mode
Bicycle Mode
Transit Mode
From To V/C
Ratio LOS
Score LOS Ped
Space1 LOS
Score LOS LOS
Score LOS LOS
Score LOS V/C
Ratio LOS
Score LOS Ped
Space1 LOS
Score LOS LOS
Score LOS LOS
Score LOS
Hinesburg Rd / Patchen Rd
White St / Garden St 0.52 3.51 D 5184 2.60 B 1.75 A 1.90 A 0.86 3.51 D 3888 2.93 C 1.88 A 1.68 A
White St / Garden St
New Signalized Intersection 0.64 3.51 D 5184 2.89 C 1.87 A 1.78 A 0.89 3.51 D 3888 3.37 C 2.02 B 1.71 A
New Signalized Intersection
Windjammer / Best Western 0.65 3.86 D 5184 2.70 B 1.58 A 2.09 B 1.04 3.86 F 3888 3.22 C 1.76 A 2.01 B
Windjammer / Best Western Dorset St 0.98 3.35 C 5184 2.90 C 1.64 A 2.01 B 1.63 3.35 F 1944 3.28 C 1.80 A 3.07 C
Note: 1. Pedestrian space is reported in square feet per pedestrian (ft2/ped) Source: NCHRP Project 3-70 Multimodal Level of Service For Urban Streets and Highway Capacity Manual 2010, Chapter 17
16
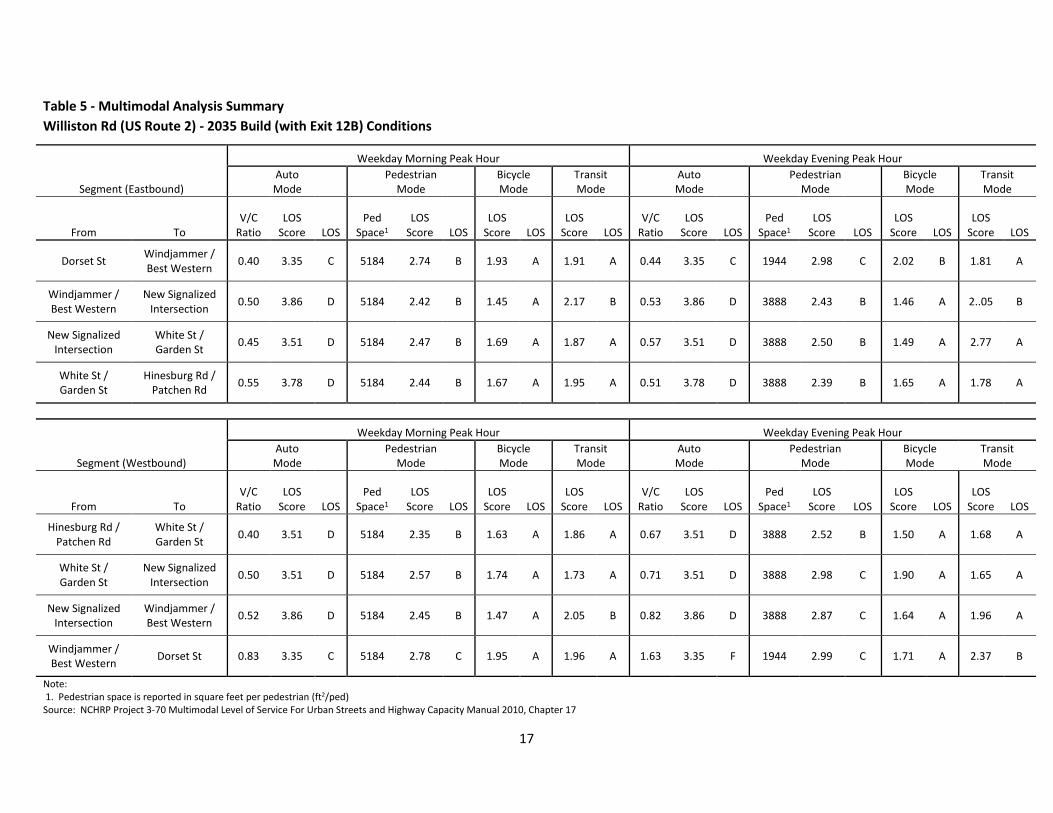
Table 5 - Multimodal Analysis Summary Williston Rd (US Route 2) - 2035 Build (with Exit 12B) Conditions
Segment (Eastbound)
Weekday Morning Peak Hour Weekday Evening Peak Hour Auto Mode
Pedestrian Mode
Bicycle Mode
Transit Mode
Auto Mode
Pedestrian Mode
Bicycle Mode
Transit Mode
From To V/C
Ratio LOS
Score LOS Ped
Space1 LOS
Score LOS LOS
Score LOS LOS
Score LOS V/C
Ratio LOS
Score LOS Ped
Space1 LOS
Score LOS LOS
Score LOS LOS
Score LOS
Dorset St Windjammer / Best Western 0.40 3.35 C 5184 2.74 B 1.93 A 1.91 A 0.44 3.35 C 1944 2.98 C 2.02 B 1.81 A
Windjammer / Best Western
New Signalized Intersection 0.50 3.86 D 5184 2.42 B 1.45 A 2.17 B 0.53 3.86 D 3888 2.43 B 1.46 A 2..05 B
New Signalized Intersection
White St / Garden St 0.45 3.51 D 5184 2.47 B 1.69 A 1.87 A 0.57 3.51 D 3888 2.50 B 1.49 A 2.77 A
White St / Garden St
Hinesburg Rd / Patchen Rd 0.55 3.78 D 5184 2.44 B 1.67 A 1.95 A 0.51 3.78 D 3888 2.39 B 1.65 A 1.78 A
Segment (Westbound)
Weekday Morning Peak Hour Weekday Evening Peak Hour Auto Mode
Pedestrian Mode
Bicycle Mode
Transit Mode
Auto Mode
Pedestrian Mode
Bicycle Mode
Transit Mode
From To V/C
Ratio LOS
Score LOS Ped
Space1 LOS
Score LOS LOS
Score LOS LOS
Score LOS V/C
Ratio LOS
Score LOS Ped
Space1 LOS
Score LOS LOS
Score LOS LOS
Score LOS
Hinesburg Rd / Patchen Rd
White St / Garden St 0.40 3.51 D 5184 2.35 B 1.63 A 1.86 A 0.67 3.51 D 3888 2.52 B 1.50 A 1.68 A
White St / Garden St
New Signalized Intersection 0.50 3.51 D 5184 2.57 B 1.74 A 1.73 A 0.71 3.51 D 3888 2.98 C 1.90 A 1.65 A
New Signalized Intersection
Windjammer / Best Western 0.52 3.86 D 5184 2.45 B 1.47 A 2.05 B 0.82 3.86 D 3888 2.87 C 1.64 A 1.96 A
Windjammer / Best Western Dorset St 0.83 3.35 C 5184 2.78 C 1.95 A 1.96 A 1.63 3.35 F 1944 2.99 C 1.71 A 2.37 B
Note: 1. Pedestrian space is reported in square feet per pedestrian (ft2/ped) Source: NCHRP Project 3-70 Multimodal Level of Service For Urban Streets and Highway Capacity Manual 2010, Chapter 17
17

Table 6 - 2014 Existing Signalized Intersection Analysis 2025 No Build 2025 Build 2025 Build w/ Exit 12 B Intersection Hour V/C Delay LOS V/C Delay LOS V/C Delay LOS Dorset St/Holiday Inn AM 0.85 26 C 0.84 28 C - - - PM 1.25 100 F 1.34 133 F - - - Doubletree/Windjammer AM 1.12 21 C 0.55 18 B - - - PM 1.55 95 F 0.78 22 C - - - New Intersection AM - - - 0.47 19 B - - - PM - - - 0.73 26 C - - - White St/Garden St AM 0.60 25 C 0.53 27 C - - - PM 0.86 44 D 0.70 33 C - - - Hinesburg Rd/Patchen Rd AM 0.55 26 C 0.67 31 C - - - PM 0.83 29 C 0.69 34 C - - - 2035 No Build 2035 Build 2035 Build w/ Exit 12B Intersection Hour V/C Delay LOS V/C Delay LOS V/C Delay LOS Dorset St/Holiday Inn AM 0.93 32 C 0.94 34 C 0.77 28 C PM 1.35 131 F 1.41 154 F 1.18 82 F Doubletree/Windjammer AM 1.34 59 E 0.60 21 C 0.53 21 C PM 1.66 122 F 0.85 34 C 0.75 25 C New Intersection AM - - - 0.50 19 B 0.43 22 C PM - - - 0.76 27 C 0.63 26 C White St/Garden St AM 0.68 27 C 0.60 31 C 0.52 31 C PM 0.93 52 D 0.76 34 C 0.68 34 C Hinesburg Rd/Patchen Rd AM 0.62 27 C 0.74 32 C 0.58 30 C PM 0.93 36 D 0.73 31 C 0.64 32 C
18
Findings
The purpose of this study is to conduct an initial (Phase 1) technical evaluation to identify potential transportation improvements to the Williston Road corridor, from Dorset Street to Hinesburg Road, that can accommodate the potential build-out of the area and complement the City’s multi-modal vision of a walkable community. The City’s objective is to realize this vision while avoiding “old school” solutions such as providing additional through lanes along Williston Road.
This initial technical evaluation is being provided to the Chittenden County Regional Planning Commission (CCRPC) and City of South Burlington at a technical planning evaluation level. Prior to advancing any of the potential actions described in this report, the City would proceed to a more detailed (Phase 2) scoping level study. The Phase 2 study would include a public outreach component, including soliciting input from corridor property owners.
The segment of Williston Road between Dorset Street and Hinesburg Road is an important transportation corridor that is heavily travelled and often congested. There are two principal influences that contribute to the operational and safety related deficiencies. The first factor is the Williston Road/Dorset Street intersection, which is capacity constrained - currently operating at a v/c ratio of 0.98 (98% of capacity) with vehicle queues often extending back to the adjacent Windjammer/DoubleTree signalized intersection. The Williston Road/Dorset Street intersection is also a high crash location.
The second factor is the lane configuration of Williston Road, which provides four general purpose lanes (two lanes per direction). The absence of exclusive left-turn lanes in combination with the
numerous uncontrolled driveways and wide curb-cuts result in motorists stopping in the inside through lane while waiting to turn left into a driveway. This condition results in added delay to through vehicles while creating a potentially hazardous condition as motorists shift from one lane to another to avoid the stopped vehicles.
In addition to the traffic congestion and safety-related deficiencies, the existing layout of the corridor is not as conducive to the City’s multi-modal walkable community vision as it could be. The absence of bike lanes force bicyclists to either use the high volume travel lanes or travel along the sidewalks, which has the potential to create conflicts with pedestrians. Walking across the four-lane cross-section of Williston Road, even at pedestrian actuated traffic signals, can be a daunting task for pedestrians.
To meet the City’s multi-modal walkable community vision, the results of this initial investigation suggests that any proposed improvements should focus on actions that enhance the safe and efficient movement of people – that is all users of the transportation system, not just automobiles.
In general, these actions would look to introduce access management, improve connectivity, and enhance sidewalks, crosswalks, bike lanes, bike paths, and transit service. Specific actions that should be considered and evaluated in greater detail under the Phase 2 scoping study include:
• Providing a full or partial connector roadway north of the corridor
• Improving parcel connectivity south of the corridor
19
• Maintaining two through lanes per direction on Williston Road, but providing exclusive left-turn lanes at signalized intersections
• Installing a raised center median that extends between signalized intersections
• Ensuring that all properties have access to all least one traffic signal, so that all left-turns can be made at signalized intersections.
• Planning for the installation of an additional future traffic signal on Williston Road approximately half way between the existing DoubleTree intersection and the soon to be realigned Garden Street/White Street intersection
• Installing bike lanes along Williston Road
• Providing well-defined pedestrian crosswalks at each of the signalized intersections
• Upgrading and widening sidewalks
• Coordinating with and supporting the Chittenden County Transportation Authority (CCTA) in the CCTA’s vision for expanded service along the corridor, including new technologies that provide real time passenger information and traffic signal priority systems.
It is important to note that the results of the evaluation show that the Williston Road/Dorset Street intersection, without some type of major reconstruction to the Exit 14 interchange or some other major regional transportation upgrade such as the construction of Exit 12B, would continue to operate over capacity with long delays. Nevertheless, the capacity deficiency at the Dorset Street
intersection should not preclude the City from advancing the access management, improved connectivity, and pedestrian, bicycle, and transit enhancements identified in this report. These actions will benefit corridor operations while more regional solutions are being considered and will complement any long-term regional transportation solutions.
Additional detailed evaluation, however, should be conducted under the Phase 2 study to determine whether the identified connector roadway should extend to the Dorset Street intersection. Substantially increasing the volume of left-turns from Williston Road onto the new connector at that location would exacerbate the capacity deficiency at Dorset Street.
The technical evaluation presented in this study identifies keys issues at a conceptual basis and should not be interpreted as a conclusive study of impacts or as a set of recommended actions. If accepted by the CCRPC and the City, the actions described in the study will next need to go through a formal scoping process.
The purpose of the scoping process is to arrive at safe and effective alternatives that are based on documented rational that meet the stated purpose and need while minimizing environmental impacts. The scoping process will result in a recommendation of a preferred alternative, which has local, regional and VTrans support. Steps in scoping process include the following:
• Collect background information The first step in scoping is to collect pertinent information such as site features, environmental conditions, social features, traffic and accident data, intersection evaluations, right of way limits, and other information relevant to the project. Note that much of the data and information
20
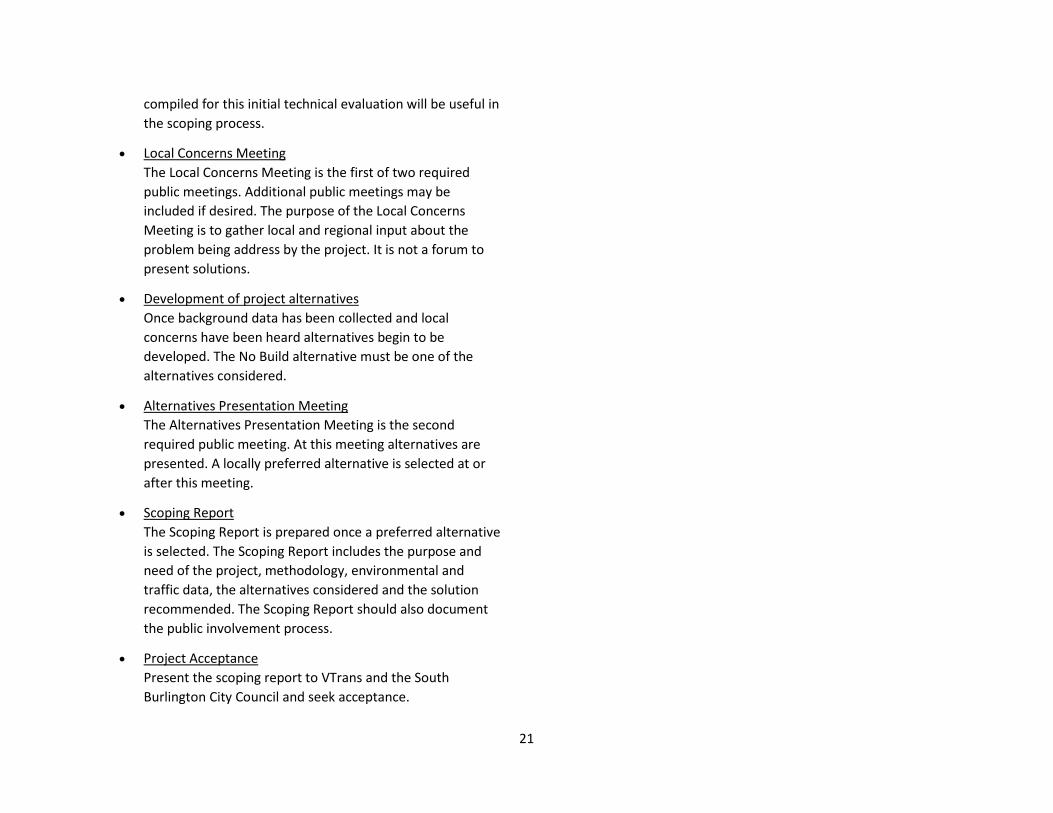
compiled for this initial technical evaluation will be useful in the scoping process.
• Local Concerns Meeting The Local Concerns Meeting is the first of two required public meetings. Additional public meetings may be included if desired. The purpose of the Local Concerns Meeting is to gather local and regional input about the problem being address by the project. It is not a forum to present solutions.
• Development of project alternatives Once background data has been collected and local concerns have been heard alternatives begin to be developed. The No Build alternative must be one of the alternatives considered.
• Alternatives Presentation Meeting The Alternatives Presentation Meeting is the second required public meeting. At this meeting alternatives are presented. A locally preferred alternative is selected at or after this meeting.
• Scoping Report The Scoping Report is prepared once a preferred alternative is selected. The Scoping Report includes the purpose and need of the project, methodology, environmental and traffic data, the alternatives considered and the solution recommended. The Scoping Report should also document the public involvement process.
• Project Acceptance Present the scoping report to VTrans and the South Burlington City Council and seek acceptance.
21

Williston Road Network Transportation Study, South Burlington, VTData Source: South Burlington, VTGIS
DO
RS
ET S
TR
EE
T
MA
RY S
TR
EE
T
WHIT
E S
TREET
DRIVEEXECUTI
VE
JAYCEE PARK
700
5
5
0 300 600 Feet
Peak Hour Traffic Volumes
2025 No Build Weekday Morning
40
5 124570
301270
820 525 0
65
95
10
40 45
122510
1251180
10 35
10
15
375
5
15
800
30
200
810
130 100
75
75
75
70
600
40
10
180
165
0
125 200
200
50
20
220
60
40195
10
15
255
230
110
145
35
1150
25
30
20
10
10
40
10
60
50
1210
25
WILLISTON ROAD
RO
AD
PA
TC
HE
N
HIN
ES
BU
RG R
OA
D
Figure 11
GA
RD
EN S
TR
EE
T

Williston Road Network Transportation Study, South Burlington, VTData Source: South Burlington, VTGIS
DO
RS
ET S
TR
EE
T
MA
RY S
TR
EE
T
WHIT
E S
TREET
DRIVEEXECUTI
VE
JAYCEE PARK
700
5 10
5
0 300 600 Feet
Peak Hour Traffic Volumes
2025 No Build Weekday Evening
400
5
25
105040
250
750
135 175
85
1100
20
50
40
10
20
10
75
1570
20
30 10
177575
401320
960
1130
135
135
10
20 40
170015
2351225
15 45
15
10
125
150
250
125
10
230
125 150
900
100
0
150 175
200
50
60
265
60
90290
25
30
240
160
175
255
70
WILLISTON ROAD
HIN
ES
BU
RG R
OA
D
RO
AD
PA
TC
HE
N
Figure 12
GA
RD
EN S
TR
EE
T
Williston Road Network Transportation Study, South Burlington, VTData Source: South Burlington, VTGIS
DO
RS
ET S
TR
EE
T
MA
RY S
TR
EE
T
WILLISTON ROAD
WHIT
E S
TREET
DRIVEEXECUTI
VE
JAYCEE PARK
0 300 600 Feet
20
130
90
50175
5
15
195
25
760
50
620
40
10
210
105
0
185 280
210
40
175
5
15
850
80
870
145
970
50
30
25
30
55
40
15
60
50
1010
30
60 35
103510
195
980
10 35
35
15
115
15
112530
1160
730 455
30
15
5
310
210
285
190
RO
AD
PA
TC
HE
N
HIN
ES
BU
RG R
OA
D
260
25
230 105
65
60
70 50
45
80
30
65
50
80
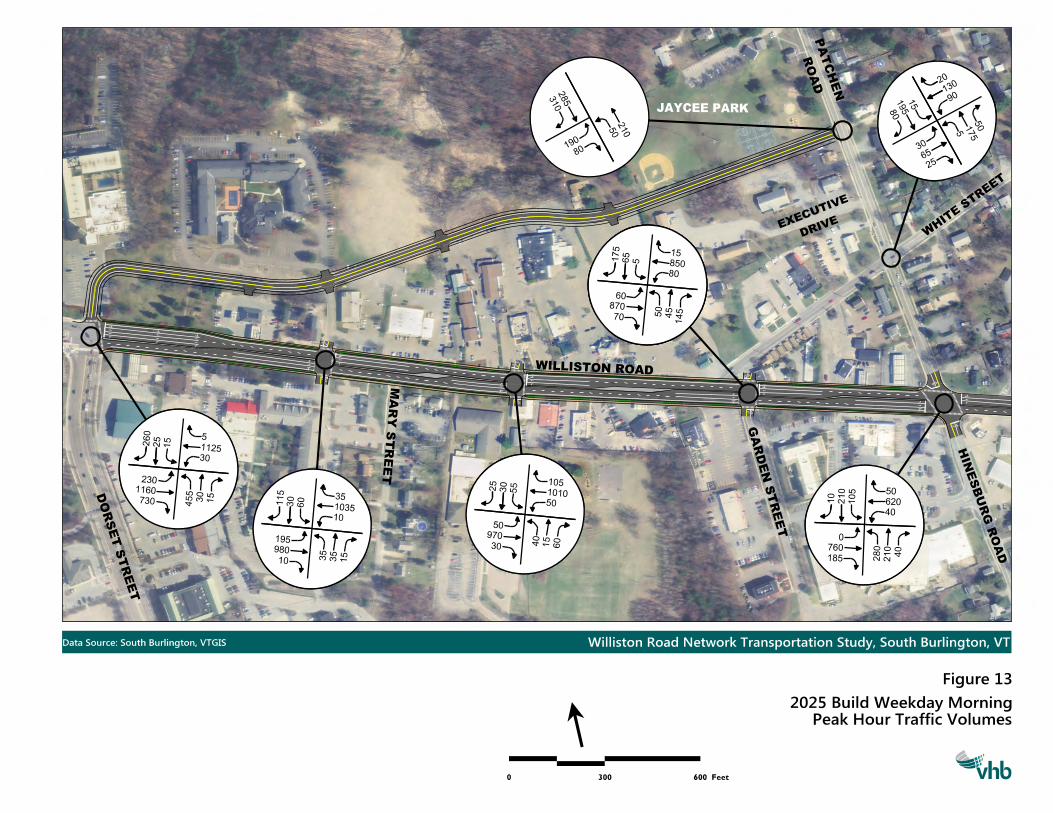
Figure 13
GA
RD
EN S
TR
EE
T
Peak Hour Traffic Volumes
2025 Build Weekday Morning

Williston Road Network Transportation Study, South Burlington, VTData Source: South Burlington, VTGIS
DO
RS
ET S
TR
EE
T
MA
RY S
TR
EE
T
WILLISTON ROAD
WHIT
E S
TREET
DRIVEEXECUTI
VE
JAYCEE PARK
0 300 600 Feet
50
175
190
25
30
180
155
50
750
940
90
10
230
0
210 225
200
50
150
5
25
110080
740
105 150
140
235
840
55
50
45
50
75
70
75
1345
20
60 90
145015
285
950
15 45
65
10
150
20
157545
1145
860
1055
55
85
10
RO
AD
PA
TC
HE
N
HIN
ES
BU
RG R
OA
D
345
175
155
360
105
370
15
365 140
145
150
60
50
95
110
100
140
50
50
125
Figure 14
GA
RD
EN S
TR
EE
T
Peak Hour Traffic Volumes
2025 Build Weekday Evening

Williston Road Network Transportation Study, South Burlington, VTData Source: South Burlington, VTGIS
DO
RS
ET S
TR
EE
T
MA
RY S
TR
EE
T
WHIT
E S
TREET
DRIVEEXECUTI
VE
JAYCEE PARK
0 300 600 Feet
Peak Hour Traffic Volumes
2035 No Build Weekday Morning
20
240
70
40195
10
15
285
240
110
150
35
775
75
650
50
10
210
180
0
150 225
200
50
400
5
25
825
40
225
850
155 120
100
100
100
1200
25
40
20
10
10
40
10
60
60
1275
25
15
40 40
127510
1651250
10 45
15
15
125
550
5 137575
351325
945 600 0
85
5
WILLISTON ROAD
HIN
ES
BU
RG R
OA
D
RO
AD
PA
TC
HE
N
Figure 15
GA
RD
EN S
TR
EE
T
Williston Road Network Transportation Study, South Burlington, VTData Source: South Burlington, VTGIS
DO
RS
ET S
TR
EE
T
MA
RY S
TR
EE
T
WHIT
E S
TREET
DRIVEEXECUTI
VE
JAYCEE PARK
775
5
0 300 600 Feet
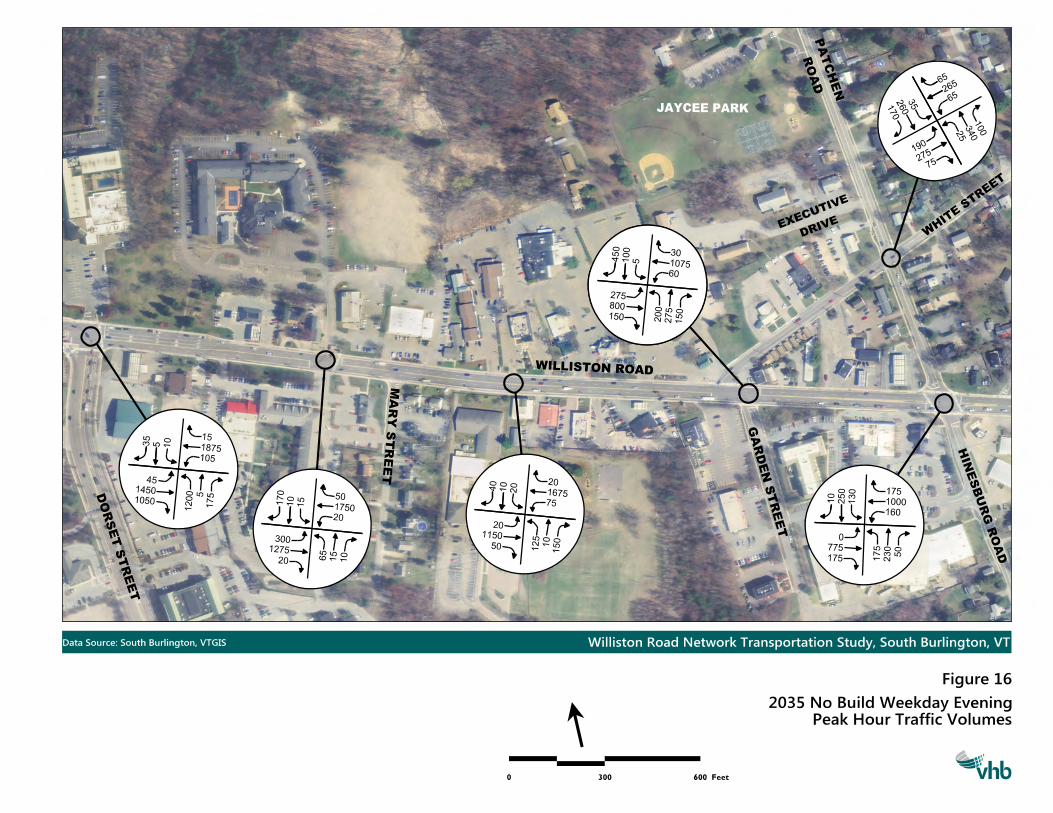
Peak Hour Traffic Volumes
2035 No Build Weekday Evening
35
10
1875
4514501050
1200 5
10
15 50
175020
3001275
20 65
15
10
450
5
30
107560
275
800
150 200
100010
250
130
0
175 175
230
50
65
265
65
340
25
35
260
170
190
275
75
1150
20
50
40
10
20
10
75
1675
20
15
170
100
275
150
105
175
125
150
100
175
160
RO
AD
PA
TC
HE
N
WILLISTON ROAD
HIN
ES
BU
RG R
OA
D
Figure 16
GA
RD
EN S
TR
EE
T

Williston Road Network Transportation Study, South Burlington, VTData Source: South Burlington, VTGIS
DO
RS
ET S
TR
EE
T
MA
RY S
TR
EE
T
WILLISTON ROAD
WHIT
E S
TREET
DRIVEEXECUTI
VE
JAYCEE PARK
0 300 600 Feet
20
150
50175
5
15
225
25
835
55
670
50
10
240
120
0
210 305
210
40
200
5
25
875
90
910
170
1020
50
40
25
30
55
40
15
60
60
1075
35
60 30
108510
2351050
10 45
40
15
145
15
125535
1215
855 530
30
35
5
HIN
ES
BU
RG R
OA
D
RO
AD
PA
TC
HE
N
325
210
315
200
270
25
235 105
90
85
95 70
70
100
30
7090
50
80
Peak Hour Traffic Volumes
2035 Build Weekday Morning
Figure 17
GA
RD
EN S
TR
EE
T

Williston Road Network Transportation Study, South Burlington, VTData Source: South Burlington, VTGIS
DO
RS
ET S
TR
EE
T
MA
RY S
TR
EE
T
WILLISTON ROAD
WHIT
E S
TREET
DRIVEEXECUTI
VE
JAYCEE PARK
0 300 600 Feet
55
175
240
25
35
200
175
55
825
1040
90
10
250
100
0
235 225
230
50
200
5
30
1125
790
120 175
165
260
890
55
50
45
50
75
70
75
1450
20
55
150020
3501000
20 65
75
10
185
20
167575
1275
950
1125
55
15
RO
AD
PA
TC
HE
N
HIN
ES
BU
RG R
OA
D
125
355
240
130
370
375
15
370
125 100
140
145
150
75
100
75
135
105
150
60
65
105
Figure 18
Peak Hour Traffic Volumes
2035 Build Weekday Evening
GA
RD
EN S
TR
EE
T

Williston Road Network Transportation Study, South Burlington, VTData Source: South Burlington, VTGIS
DO
RS
ET S
TR
EE
T
MA
RY S
TR
EE
T
WILLISTON ROAD
WHIT
E S
TREET
DRIVEEXECUTI
VE
JAYCEE PARK
0 300 600 Feet
10
165
40215
10
10
245
25
665
85
560
45
10
220
160
0
150 195
220
40
210
5
25
675
70
690
150
760
50
40
25
30
50
40
35
60
60
850
95
35
50 20
895
10
235
825
10 45
40
15
155
15
105050
985
670 425
25
60
5
Peak Hour Traffic Volumes
2035 Build (With Exit 12B) Weekday Morning
RO
AD
PA
TC
HE
N
265
235
355
175
45
HIN
ES
BU
RG R
OA
D
250
25
185
90
65
85 80
75
100
95
35
7570
GA
RD
EN S
TR
EE
T
Figure 19

Williston Road Network Transportation Study, South Burlington, VTData Source: South Burlington, VTGIS
DO
RS
ET S
TR
EE
T
MA
RY S
TR
EE
T
WILLISTON ROAD
WHIT
E S
TREET
DRIVEEXECUTI
VE
JAYCEE PARK
HIN
ES
BU
RG R
OA
D
0 300 600 Feet
55
175
15
270
15
25
210
185
50
700
8105 250
120
0
175 170
235
55
225
5
30
865
70
100
675
100 150
190
200
745
45
30
35
50
70
65
75
1125
20
45 70
120020
370
845
20 65
60
10
195
20
137585
1130
810 925
50
15
Peak Hour Traffic Volumes
2035 Build (With Exit 12B) Weekday Evening
105
280
300
225
310
RO
AD
PA
TC
HE
N
265
15
320
125
125
125
150
75
155
105
150
65
50
85
Figure 20
GA
RD
EN S
TR
EE
T

ww
w.v
hb.c
om