final report district lucknow
TRANSCRIPT

7/26/2019 Final Report District Lucknow
http://slidepdf.com/reader/full/final-report-district-lucknow 1/86
BASE LINE SURVEY IN THE MINORITYCONCENTRATED DISTRICTS OF UTTAR PRADESH
(Report Of The District Lucknow)
Sponsored by
Ministry of Minority Affairs
Government of IndiaNew Delhi
Study conducted by
Nomita P. Kumar
Giri Institute of Development Studies
Sector ‘O’ Aliganj Housing SchemeLucknow 226024May 2008

7/26/2019 Final Report District Lucknow
http://slidepdf.com/reader/full/final-report-district-lucknow 2/86
2
CONTENTS
Map of Lucknow District i
Executive Summary ii-iv
CHAPTER I BACKGROUND OF THE STUDY 1-4
CHAPTER I I SOCIO-ECONOMIC STATUS OF 4-17DISTRICT BARABANKI
CHAPTER III SITUATIONAL ANALYSIS OF SAMPLE 18-35 VILLAGES IN DISTRICT BARABANKI
CHAPTER I V SOCIO-ECONOMIC STATUS OF RURAL 36-71HOUSEHOLDS IN DISTRICT BARABANKI
CHAPTER V DEVELOPMENT GAPS AND REMEDIES 72-75THEREOF

7/26/2019 Final Report District Lucknow
http://slidepdf.com/reader/full/final-report-district-lucknow 3/86
ii
List of Tables
Chapter I : Background of the Studyi. List of Selected Sample Villages in District Lucknow
Chapter II: Socio-Economic Profile of Lucknow District
Table 1: Demographic FeaturesTable 2: Distribution of Population by ReligionTable 3: Housing AmenitiesTable 4: Employment Structure of the WorkforceTable 5: Land use PatternTable: 6. Irrigation Coverage and Sources (2003 - 04)Table: 7. No. of Operational Holdings and Area according to Agricultural Census 1995-96.Table 7: Cropping Pattern in the DistrictTable 8: Productivity of Major Crops (2004 - 05)
Table 9: Livestock Population in Lucknow District- (17th
Census-2003)Table 10: Industrial Development (2003-04)Table 11: Indicators of Economic InfrastructureTable 12: Indicators of Social DevelopmentTable 13: Income and Poverty in Lucknow District and Uttar PradeshChapter III: Socio Economic Status of Sample V illages in DistrictLucknow
Table 1: Religion-wise populationTable 2: Occupational PatternTable 3: Land Use Pattern
Table 4: Sources of Irrigation
Table 5: Non-Agricultural Activities in the village or near by:Table 6: Artisan/Handicraft activities in the village:Table 7: Hospitals and DispensariesTable 8: Facilities at the Sub-centre or PHC (number of villages)Table 9: Frequency of visit of Health Staff in the VillageTable 10: Conditions of PHC/sub-centre in the villageTable 11: Private Medical FacilitiesTable 16: Aanganwadi/ICDS CentreTable 12: Educational Facilities ( number of villages)Table 13: Average School EnrolmentTable 14: Physical Structure of the Schools
Table 15: Private Schools and Preference of People for SchoolsTable 17: Electricity FacilitiesTable 18: Drinking waterTable 19: Toilet FacilitiesTable 20: Other Facilities:Table 21: Individual Beneficiary Oriented ProgrammesTable 22: Public Distribution SystemTable 23: Self-help GroupsTable 24: Village Organization

7/26/2019 Final Report District Lucknow
http://slidepdf.com/reader/full/final-report-district-lucknow 4/86
iii
Chapter IV: Socio Economic Status of Rural Households in DistrictLucknow
Table 1: Distribution of Sample Households by Religion
Table 2: Distribution of Sample Households by caste
Table 3: Number of Sample Households Reporting their Mother Tongue
Table 4: Distribution of Sample households by size of family
Table 5: Composition of Sample HH members
Table 6: Age Composition of Family Members
Table 7: Classification of Population by Level of Education among Different ReligiousGroupsTable 8: Educational Status of Children in the Age of 5 to 15 yearsTable 9: Aspirations of Parents of Current Students
Table 10: Working Status of Family MembersTable 11: Occupational Classification of Working Family Members
Table 12: Status of Employment by Industrial Categories of Working Family MembersTable 13 : Preference of Households for Additional employment
Table 14: Distribution of working family members by their main occupation
Table 15:Distribution of households by size category of Land holdings (owned land)(In Acres)Table-16: Characteristics of Land Owned by Different Religious Groups
Table 17:Distribution of Household by value of own land
Table 18: Distribution of Average Livestock per household
Table 19 : Distribution of households by value of livestock
Table 20: Classification of Households by Sources of Income
Table 21: Average household income from various sources
Table 22: Distribution Households by size of family income (yearly)
Table 23: Average Household Expenditure on different heads
Table 24: Distribution of households by size of Expenditure (Annual)
Table 25: Distribution of household by Value of Productive and other Assets
Table 26: Distribution of Households by Ownership of Agricultural ImplementsTable 27: Distribution of Households by Ownership of Non-Agricultural ImplementsTable 28: Distribution of Households by Ownership of Means of Transport
Table 29: Distribution of Households by Ownership of Modern Household Assets

7/26/2019 Final Report District Lucknow
http://slidepdf.com/reader/full/final-report-district-lucknow 5/86
iv
Table 30: Distribution of Households by the Type of Financial Assets
Table 31: Per Household Value of Productive and Other Assets
Table 32: Distribution of HH by outstanding Amount of loan
Table 33: Migration characteristics of working family members
Table 34: Interest in training of families
Table 35 : Details of Training Described by Households
Table 36 : Duration of training Described by Families
Table 37: Households reporting about Public Distribution System
Table 38: Awareness about Government Programmes (%)
Table 39: Most Useful Programmes in Order of Preferences of the Respondents
Table 40: Health and Family WelfareTable 41: Place of Treatment of Diseases
Table 42: Immunization of Children(5 years of age)
Table 43: Distribution of Households by the Type of Ownership of Houses
Table 44: Distribution of Households by the Type of HousesTable 45: Distribution of Households by the Number of Rooms
Table 46: Classification of Households According to the Area of Houses
Table 47: Classification of Households According to the Value of their Houses
Table 48: Distribution of Households according to Sources of HomesteadTable 49: Distribution of Households by the Electrification and Sources of Lighting
Table 50: Classification of Households According to Sources of Drinking WaterTable 51: Classification of Households According to Distance from Sources of Drinking
Water
Table 52: Classification of Households According to Toilet facilityTable 53: Classification of Households According to Type of Cooking Fuel UsedTable 54: Participation of HH in Administrative Community
Table 55: Problem and losses Reported by HH during communal violence
Table 56: Households with Access to Media and Communication
Table 57: Households Reporting Three important Facilities which are lacking in village
Table 58: Households Reporting three most important deprivations in their families
Chapter V: Development Gaps and Remedies Thereof
Remedial Measures

7/26/2019 Final Report District Lucknow
http://slidepdf.com/reader/full/final-report-district-lucknow 6/86
v
Agriculture and Allied Activities
Industrial Activities
Socio-Economic Conditions

7/26/2019 Final Report District Lucknow
http://slidepdf.com/reader/full/final-report-district-lucknow 7/86
ii
Lucknow- A District Profile

7/26/2019 Final Report District Lucknow
http://slidepdf.com/reader/full/final-report-district-lucknow 8/86
EXECUTIVE SUMMARY
LUCKNOW DISTRICT
The purpose of the Baseline Survey was to assess the
development deficits in the concerned districts and
thereafter identification of the priority areas for policy
intervention and plan formulation. To carry forward these
goals set in mind the Ministry of Minority Affairs,
Government of India after identifying minority concentrated districts across the
country chalked out various indicators for assessing the back wardness of the district
with the national figures at the back of mind. The indicators or the pointers thus
selected were:
• Religion Specific Socio-Economic Indicators
i. Rate of Literacy
ii. Female Literacy
iii. Work Participation rates
iv. Female Participation rates
• Indicators of Basic Amenities
i. Percentage of Households with pucca houses
ii. Percentage of households with safe drinking water
iii. Percentage of households with Electricity
iv. Percentage of households with W/C latrines.
• Besides these two more indicators were specified to take care of
health in the particular area i.e.
i. Percentage of fully vaccinated children
ii. Percentage of Institutional deliveries.
Based on these indicators The Ministry of Minority Affairs, New Delhi,
therefore, aims at developing suitable measures during the Eleventh Plan to develop
these districts. In order to identify the gaps in the development, a baseline survey was
conducted in 19 districts of U.P. by the Giri Institute of Development Studies,
Lucknow and Lucknow is one of them. Taking deficit as weight, the indicators from
various sectors are ranked accordingly on a 10 point scale in which the rank 1 indicates
highest deficit. Thus an indicators is accorded highest rank if the value of deficit
between the survey result and the estimate for the All India is the highest. The other
5 TOP P r i o r i t i es
v Sanitation
v Housingv Electricityv Employment v Health

7/26/2019 Final Report District Lucknow
http://slidepdf.com/reader/full/final-report-district-lucknow 9/86
iii
indicators are ranked in descending order of their deficits. On the other hand if the
indicators conforms to deficit with positive value (survey result higher than the
estimate for All India) the lower rank is assigned to the indicator which has lower
positive value and higher rank is given to higher positive value. Hence very easily all
the selected indicators are ranked on ten point scale with the underlying assumption
of assigning priorities for the indicators for designing the Multi Sectoral District
Development Plan in various selected district and so for Lucknow.
Development Deficits in Lucknow District, Uttar Pradesh.
Indicators
Survey
Results-2008
All
India(20 05)
Gap between
All India andDistrict
PriorityRanking
Socio-economic Indicators
Rate of Literacy 61 .3 1 67. 3 -5.99 6
Rate of Female Literacy 51 .6 5 57 .1 -5.45 7
Work Participation Rate 30.64 38.0 -7. 36 5
Female Work Participation Rate 9 . 2 2 21 .5 -12 .2 8 4Basic Amenities Indicators
Percentage of Pucca Houses 15.89 59.4 -43.5 1 2
Percentage of Households with access toSafe Drinking Water 96.11 87.9 8.21 8
Percentage of Households withsanitation facilities 11.7 8 67. 9 -56.12 1
Percentage of Electrified Households 19 .0 39 .2 -20.2 3
Health Indicators
Percentage of Fully vaccinatedChildren(NFHS-3) 52.68 43.5 9.18 -
Percentage of InstitutionalDeliveries(NFHS-3) 20.9 38.7 -17. 8 -
Note: 1) Survey data of the District pertains to rural areas only, 2) Col 2 pertains to total
Keeping in mind some of the priority areas indicated in the Table above and
some major findings of the survey highlighted in it the following aspects need special
attention whenever a Multi Sectoral Development Plan of the district is attempted.
To sum up, therefore, the areas which need to be given special attention by the
planners and policy makers are:
Ø The top priority is attracted (rank 1) by the availability of sanitation facilities
in the rural households. The number of households having sanitation facilities
is extremely low. Keeping in mind hygiene and sanitation as well as
convenience, availability of latrines is essential. This can be achieved if the
subsidy amount given under Total Sanitation Campaign is suitably increased.

7/26/2019 Final Report District Lucknow
http://slidepdf.com/reader/full/final-report-district-lucknow 10/86
iv
Ø Second rank is given to percentage of households having pucca houses. The
households survey highlighted that there is dearth of pucca houses in area and
hence the Indira Awas Yojana needs to be extended to minority families falling
in the BPL category.
Ø The 3 indicator on the third rung of the ladder is electrification of households
which needs proper planning and implementation at the rural areas level. Mere
quantity doesn’t fulfills the demand quality of its provision also has to be
ensured for rural areas to develop fast.
Ø The district is emphatically in need of employment generation for females.
Since land holdings are small, the cultivators can be educated to diversify their
activities where possible. Thus, depending on area, suitability and people’s
preference activities such as dairying, poultry farming and cultivation of fruits
and vegetables can be promoted in various blocks of the district. It has been
encountered that the employment generation is the critical lacuna in the district
and especially for female population. The ongoing programme to improve the
productivity and diversification needs to be revamped and revitalized to fulfill
the laid goals of development. Similarly other non-farm activities can be
identified by the Directorate of Industries and on their basis a cluster
development approach can be taken up as it may not be feasible to promote
these activities in each village. Some of the activities which are already being
undertaken include Chikan Embroidery, Achar making, basket and ceramic
pottery making, etc.
Ø The literacy level in the district has not shown any concern as it ranked low on
the scale. The district is in need of schools and colleges beyond the elementary
level especially for girls.
Ø Our survey had revealed that a high proportion of the respondents are desirous
of receiving vocational training. Thus, the government should ensure that such
training programmes be conducted on a regular basis.
Ø
The percentage of institutional deliveries is also reported very low in thedistrict which calls for the sub-centres and PHCs to be upgraded and revamped
so that they can provide services effectively. This will reduce the dependence of
the rural people on unqualified doctors as is the case presently.

7/26/2019 Final Report District Lucknow
http://slidepdf.com/reader/full/final-report-district-lucknow 11/86
1
CHAPTER I
BACKGROUND OF THE STUDY
1.0 Introduction
In Uttar Pradesh the share of Muslim population is about 18.5 per cent (2001),
which is the largest minority as the other religious minority groups are quite negligible
and combining them all it accounts to 19.5 percent of the total population. Overall
minorities are forming almost one-fifth of the state population and mostly they are
considered deprived class. Ministry of Minority Affairs keeping the objective of
balanced development has undertaken the task to understand the real situation of
minorities in the country, so that accordingly measures may be chalked out to
eradicate the impediments for overall balanced development. One of the latest efforts
in this direction has been in the form of constituting an expert Committee by the
Ministry to identify those districts, which have a minority concentration and are also
relatively backward. The Expert Committee at the centre has tried to locate relatively
backward minority concentrated districts and selected indicators for the identification
on the following criterion:
(a) Religion-Specific Socio-Economic Indicators
(i) Literacy Rate
(ii) Female Literacy Rate
(iii) Work Participation Rate, and
(iv) Female Work Participation Rate
(b) Indicators of Basic Amenities
(i) Proportion of households with pucca walls
(ii) Proportion of households with safe drinking water
(iii) Proportion of households with electricity, and
(iv) Proportion of households with W/C latrines.
As many as 53 districts were found to have values below the National level
average for both sets of indicators while another 37 had values below the National
average for one or the other set of indicators. Thus, total 90 district from the country
as a whole were selected in which 21 districts were from Uttar Pradesh. The Ministry

7/26/2019 Final Report District Lucknow
http://slidepdf.com/reader/full/final-report-district-lucknow 12/86
2
aims at devising suitable policy measures during the Eleventh Plan in order to develop
these districts. The Ministry then identified several institutions in different parts of the
country to carry out a baseline survey of these districts. Giri Institute of Development
Studies, Lucknow has been entrusted to carry out the study of these 21 identified
districts.
1.1 Objectives of the Study
(i) To conduct a gap analysis of availability of infrastructure such as schools,
health, ICDS centres and drinking water supply;
(ii) To find out the gaps in housing and sanitary facilities;
(iii) To identify the income generating activities such as artisan/handicrafts in
which villagers have a comparative advantage;
(iv) To identify the existing gaps in other infrastructural facilities such as roads,
ITIs, banking and marketing facilities, etc.
1.2 Methodology and Sample Design
To identify 30 villages, the Tehsil of the district where first grouped into the
strata in terms of minority population after arranging them in descending order of
minority population. The first stratum consisted of 20 per cent of the Tehsils and the
second and third stratum constituted 50 and 30 per cent Tehsils respectively. Tehsil
was used for stratification because religion-wise data is available at Tehsil level in
2001 Census. The number of villages selected from each stratum was directly
proportional to the share of each stratum and were selected as per the probability
proportional to size with replacement method.
After identification of 30 villages, house listing was conducted by door-to-door
survey in the villages having a population upto 1200. In case of villages with higher
population the different hamlets were considered and 2 hamlets were selected. The
first hamlet was the one where the concentration of minority population was highest
and the other hamlet was selected randomly.
From each village 30 households were selected by listing the households
according to their religion. The samples selected were in proportion to the population
in each religious category according to the systematic random sampling without
replacement method. Thus, the sample of 30 villages and 900 households were
identified and surveyed.

7/26/2019 Final Report District Lucknow
http://slidepdf.com/reader/full/final-report-district-lucknow 13/86
3
The report has been prepared in three parts. The first part includes the socio-
economic status of the district. For this, information was collected from district
statistics officer, CDO, District Minority Welfare Office, NABARD, district Lead Bank
and Census records. The second part consists of village study for which quite
substantial data was collected from Tehsil, Block Development Office, CDO and from
Census records besides primary data from fieldwork in the village. The third part of
study is based upon household information for which door-to-door survey of selected
households was conducted by a team of field staff under strict supervision. The list of
selected sample villages where survey was conducted is as follows:
List of Selected Sample Villages in District Lucknow
District Tehsil Code Tehsi l Name Village Code Villag e Name
12 12.1 Malihabad Tehsil 12. 1.1 Gahndo
12.1 12.1.2 Tirangava
12.1 12.1.3 Azadnagar12.1 12.1.4 Dilawarnagar
12.1 12.1. 5 Mandauli
12.1 12.1.6 Sultanpur
12.1 12.1 .7 Aunt
12.1 12.1.8 Gagan Barauli
12.1 12.1.9 Ishapur
12.2 Lucknow Tehsil
12.2 12.2 .1 Baragoan
12 .2 12.2. 2 Behta
12.2 12.2. 3 Mirzapur Lutova
12.2 12.2. 4 Bahdanamau
12.2 12.2 .5 Bhokapur12.2 12.2.6 Pahar Pur
12.2 12. 2.7 Makhdoompur Kaithi
12.2 12. 2.8 Muzaffarnagar Ghusaval
12.3 Bakshi Ka Talab Tehsil
12.3 12. 3.1 Bhagautapur
12.3 12.3. 2 Akbarpur
12.3 12.3.3 Mampur Bana
12.3 12.3. 4 Bahargaun
12.3 12.3.5 Dinkarpur Jhalava
12.3 12.3. 6 Para
12.3 12.3.7 Purwa
12.4 Mohanlalganj Tehsil
12.4 12.4.1 Salauli
12.4 12. 4.2 Hardoey a
12.4 12.4.3 Daudnagar
12.4 12. 4.4 Dharamgad Khera
12.4 12.4.5 Bhajmar Mau
12.4 12.4. 6 Kushmaura

7/26/2019 Final Report District Lucknow
http://slidepdf.com/reader/full/final-report-district-lucknow 14/86
4
CHAPTER II
SOCIO-ECONOMIC PROFILE OFDISTRICT LUCKNOW
2.1 Introduction
Lucknow, the capital of Uttar Pradesh is situated 23 Mts. above sea level. It is
situated on 26.30 & 27.10 North latitude and 80.30 & 81.13 East longitude. Lucknow
covers an area of 2528 sq.km. It is surrounded on the eastern side by District
Barabanki, on the western side by district Unnao, on the southern side by Raebareli and
on the northern side by Sitapur and Hardoi districts. River Gomti flows through the city.
Some of the tributaries of this river are Kukrail, Loni, Beta etc. Sai river flows from the
south of the city and in the east enters district Raebareli. Lucknow is accessible from
every part of India through Air, Rail and Road. It is directly connected with New Delhi,
Patna, Calcutta, Mumbai, Varanasi and other major cities by Amausi airport. Similarly city
is linked to north, east, south and west through rail and road links. In fact rail link joins
Lucknow to Pakistan via Amritsar in the west and to Bangladesh railways in the east. The
population of district Lucknow as per census 2001 is 36,47,834 lacs.
2.2 Climate, Flora and Fauna
District Lucknow has almost uniformed tropical climate. The temperature varies
from 45 celcius maximum in summer to 5 celcius minimum in winter season. Rainfall is
100 cm. per annum. The forest area is negligible in the district. Shisham, Dhak, Mahua,
Babul, Neem, Peepal, Ashok, Khajur, Mango and Gular trees are grown here. In fact
different varieties of mangoes specially Dashari are grown in Malihabad block of the
district and exported to other countries too. The main crops are wheat, paddy, sugarcane,
mustard, potatoes, and vegetables such as cauliflower, cabbage, tomato, brinjals are grown
here. Similarly sunflowers, roses, and marigold are cultivated on quite a large area of the
land. Apart from this many medicinal and herbal plants are also grown here.
2.3.1. Demographic Status
As reported in the Census of India 2001 the total population of the district stood at
36.47 lac persons of whom 19.32 lac were males and 17.15 lac were female. Between 1991
and 2001 the population registered a decadal growth of 32.03 percent which was much
less than the 37.14 percent which was registered between 1981 and 1991 decade. The
density per square kilometer registered a substantial increase from 1093 to 1456 between

7/26/2019 Final Report District Lucknow
http://slidepdf.com/reader/full/final-report-district-lucknow 15/86
5
1991 and 2001. However, the density of population was much above that obtained at the
state level (690 persons per sq. km.). The SC population of the state at 21.3 percent to total
population is above the state average (21.15 percent). A very high percentage of the total
population (36.37 percent) resides in rural areas which means that barely around 63.3
percent is urban in nature. These are very high figure as compared to the state as whole,
where urban population constitutes around 21 percent only of the total state population.
Even in terms of the sex ratio the district with the sex ratio of 888 is below the average
obtained at the state level (890 during 2001). Yet another indicator where the district
leads ahead of the state is in terms of literacy. Total literacy level is 68.7 percent as
compared to 56.3 percent in U.P. as a whole. Similarly male and female literacy rates were
found to be 76.0 and 60.5 percent respectively as compared to the corresponding figure of
68.8 and 42.2 percent in U.P. However, there has been a marked improvement in the
literacy rate in the district as compared to 1991. Despite the fact that the overall work
participation rate in the district (32.24 percent) is higher than the state average (23.7
percent), the work participation rate among females in Lucknow is very low at 5.6 percent
which has registered a decline from 1991 status of 5.9 percent (for details see Table no 1).
Table 1: Demographic Features
Features 1991 2001Geographical Area (Sq.km.) 2544 2528Number of Tehsils 3 4Number of Blocks 8 8Number of Inhabited Villages 824 822
Average size of the Household
Population (in Lakh)Total 27.62 36.48Male 14.81 19.32Female 12.82 17.16Sex Ratio 827 888Density of Population 1093 145 6Decadal Growth of Population (1981-91 and 1991-2001)% 37.14 32.03SC Population (%) 21.88 21.30Rural Population (%) 37.34 36.37Urban Population (%) 62.66 63.63ST Population (%) 0.04 0.10Literacy (%)Total 57.5 68.70
Male 66.5 76.00Female 46.9 60.50
Work Participation Rate (Nos. & %)Person 32.24Male 48.39 41.8Female 5.9 5.6
Source: Census of India, 2001.

7/26/2019 Final Report District Lucknow
http://slidepdf.com/reader/full/final-report-district-lucknow 16/86
6
2.3.2 Demographic Status by Religion
Table 2: Distribution of Population by ReligionProportion to Total
PopulationLiteracy Rate
Work ParticipationRateReligion
Number Percentage Number Percentage Number Percentage
Hindu 2852721 78.2 0 170 327 1 70.25 8617 04 23.62
Muslim 7486 87 20.52 389542 61.49 209 937 5.7 6Christian 1228 6 0.34 10018 90.05 44 79 0.12
Sikh 23110 0.63 1928 2 91.83 692 5 0.19
Buddhist 43 27 0.12 2 56 4 70.23 1343 0.04
Jain 41 18 0.11 35 90 94.97 1255 0.03
Others 2585 0.07 3 62 14.2 3 13 3 0.00
Source: Census of India, 2001
If we look at the distribution of the population according to religion Hindus constitute
a little over three-fourth of the total population and this is below the share found in the state
as a whole (80.6 percent). However, Lucknow has a slightly higher share of Muslim population
(20.52 percent) and also of the other religious categories. In fact Sikh population constitutes
only 0.63 percent which is little higher as compared to the state average of 0.4 percent (Table
no 2).
2.3.3 Housing Amenities
Table 3: Housing Amenities
Percentage Distribution ofHouseholds
Percentage Distribution ofHouseholds Amenity
Rural Urban Rural Urban
Total Number of Households 224391 38 30 71 100.00 100.00
Type of House
Permanent 8393 3 34521 9 37 .4 0 90.12
Semi Permanent 25758 20 89 0 11. 48 5.4 5Serviceable 105 930 112 88 47 .2 1 2. 95
Non-Serviceable 8 7 6 1 5655 3. 90 1. 48
Unclassifiable 9 19 0.00 4 0.0 05
Number of Dwelling Rooms
One Room 7484 9 10384 0 33 .36 27.11
Two Rooms 7313 3 12 132 0 32.59 31.67
Three Rooms 36894 761 27 16.4 4 19.87
Four Rooms 17601 43615 7.84 11.39
Five Rooms 6 6 4 9 1 4982 2.96 3 . 91No exclusive room 85 67 8509 3.8 2 2. 22
Source of Drinking Water
Tap 15938 294 833 7.10 76.97Handpump/Tubewell 17 98 24 80567 80.14 21.03
Well 2 933 5 2 0 1 8 13.07 0.5 3River/Canal 14 43 0.01 0.0 1 Any other 7 0 1 3 6 9 0.03 0.36
Source of Cooking
Firewood 15039 8 6054 8 67 .02 15.81
Crop residue 20 245 57 71 9.02 1 .51
Cow-dung Cake 4136 7 468 9 18. 44 1. 22
Kerosene 1 81 7 45 231 0.81 11.81LPG 110 39 26 70 38 4.92 69. 71
Any other 53 4 6 4 6 0. 24 0.17Source: Census of India, 2001

7/26/2019 Final Report District Lucknow
http://slidepdf.com/reader/full/final-report-district-lucknow 17/86
7
At this juncture it is pertinent to look into the different housing amenities
enjoyed by the people of Lucknow district. Table 3 reveals that in the district as whole
only around 70 percent households reside in permanent houses. The condition is poor
in the rural areas, where majority of the population is concentrated but only 37
percent of the households reside in permanent houses. However, in urban areas
almost 90 percent of the households have a permanent house. The poor living
condition of the people can be gauged from the fact that around one third of the
households are living in one room house and another one third has only two rooms.
The two categories together account for almost two third of the total households. In
this connection the situation is similar both in rural and urban areas.
As far as the source of drinking water is concerned the maximum number of
households (above 80 percent) obtains water from hand pump/tube wells in rural
areas and only 21 percent use this source in urban areas. The next important source is
tap water. This facility is enjoyed by merely 76.9 percent urban households while
among their rural counterparts this percentage was around 7.1 percent.
In the rural areas the main fuel used for cooking is fire wood with almost 67.02
percent households being dependent on this source. The next in importance is cow-
dung cakes (18.44 percent) and crop-residue (9.02 percent). In the urban areas the
situation is much different. Although fire wood continues to remain the most
important fuel the dependence on it is much lower at around 15.81 percent and the
most important source is LPG with around 69.71 percent of the total households using
it as the source of fuel. These variations between rural and urban areas are also quite
understandable.
3. Structure and Growth in Employment
The distribution of main workers in 2001 by different categories reveals that
almost 21 percent are cultivators while another 6 percent are agricultural laborers.
This is quite understandable in the district where rural population percentage is low as
37 percent (Table no 3). What is remarkable is that the share of population in rural
areas has registered a decline from about 37 percent in 1991 to 36 percent in 2001. Inthe same row cultivators declined from 29.73 percent in 1991 to 21.06 percent and
agricultural labourers declined from 8.70 percent to 6.50 percent in 2001. Agricultural
fervor of the workforce shows a decline in favour of non-agricultural activities in the
state.

7/26/2019 Final Report District Lucknow
http://slidepdf.com/reader/full/final-report-district-lucknow 18/86

7/26/2019 Final Report District Lucknow
http://slidepdf.com/reader/full/final-report-district-lucknow 19/86
9
Table: 6. Irrigation Coverage and Sources (2003 - 04)
Lucknow Uttar Pradesh
Area Irrigated Area Irrigated
Source (in hectares) % (in hectares) %
Canal 20703 3.93 27 67 23 3 20.92
Government Tubewell 6186 1.23 379 122 2.87
Private Tubewell 970 83 67 .26 8978 021 67.87
Others 1252 27.58 11029 62 8.3 4Total 125 224 100 13 22 73 38 100
Year 1991-92 (%) 200 4-05 (%)
Canal 52507 46.49 2 7 9 1 6 22.65
Tubewellsa. Public 9 1 6 3 8.11 7 7 9 3 6.32
b. Private 4 7 2 7 7 41.86 86 97 5 70.58
Wells 6 3 1 0.56 2 75 0.22
Ponds 2032 1.80 2 2 6 0.18
Others 1328 1.18 4 0 0.03
Total 112938 100.00 123225 100.00
Source: District Sankhyaki Patrika, Lucknow, 2005
Statistical Dairy, Uttar Pradesh 2005
Now focusing on irrigation on a source wise basis the single most important
source of irrigation that emerges is private tube well and they account for 70.58
percent of the total irrigated area in 2004 -05 which have registered an increase from
41.86 percent in 1991-92. The only other source that has gained popularity is canal
irrigation whose contribution is merely around 22.65 percent in 2004-05 which have
declined from the 1991-92, 46.49 percent (See Table no 6). Popularity of public
tubewells have declined over the years could be established from the data so available.
Table: 7. No. of Operational Holdings and Area according to Agricultural Census 1995-96.
Size of Land Holding No. of Land Holdings % Area %
Less than 0.5 Hectare 1111385 91.45 36605 21.01
0.5 - 1 Hectare 56018 4.61 40859 23.45
1 - 2 Hectare 32604 2.68 47037 26.99
2 - 4 Hectare 12591 1.04 33564 19.26
4 - 10 Hectare 2540 0.21 13766 7.90
10 Hectare & Above 142 0.01 2437 1.40
Total 1215280 100.00 174268 100.00
Another characteristic of the district is the heavy concentration of the
cultivators in the lowest land holding size (below 0.5 hectares). Around 91.45 percent
cultivators are in this category. However, between them they posses barely 21.01
percent of the total area under land holdings. The next lowest land holding size is
between 0.5 to 1 hectare and over 4.61 percent of 23.45 percent of the total cultivated
land.

7/26/2019 Final Report District Lucknow
http://slidepdf.com/reader/full/final-report-district-lucknow 20/86
10
5. Cropping Pattern
Table 7: Cropping Pattern in the District
Indicators1999-
002000-
012001-
022002-
032003-
042004-
052005-
06
1 Percent of Forests to tot al Reported area 4.5 8.3 8.3 8.3 4.6 4. 7 -
2 Net Sown Area to Total Reported Area 56.5 56.5 55.5 53. 1 54.8 54. 9 -
3 Cropping Intensity 151. 1 157 .3 154. 4 14 9. 5 150.9 158.0 -
4 Area under Commercial Crops to Gross
Cropped Area5.2 4.6 4.6 10.5 9.5 9.4 -
5 Foodgrain Production (Average in qtl.) 19. 3 18 .9 19. 5 19 .8 19 .9 19 .8 19 .5
6 Fertilizer Consumption per Ha (in Kg.) 14 2 13 8. 4 143 .3 13 4. 4 141.7 135.7 -
7 Per capita Output
7. 1 Foodgrains 88. 0 88 .6 83 .7 74.5 78.5 77. 9 68.9
7.2 Pulses 4.0 3.4 3.4 3 2.6 4.0 2.6
Source: District Sankhyaki Patrika, Lucknow, 2005 Statistical Dairy, Uttar Pradesh 2005
6. Productivity of Major Crops
Average productivity of major crops like wheat, paddy, potato and sugarcane indistrict Lucknow is less as compared to the state’s average productivity, excepting
average productivity of paddy, which is 18.75 quintal per hectare in the district, and
18.13 quintal per hectare in the state. Despite higher productivity of cereals, potato
and sugarcane, majority of farmers in the district are facing acute problems due to
small land holdings and irregular payment by sugarcane factory owners.
Table 8: Productivity of Major Crops (2004 - 05)(Production in quintal per hectare)
Crop Lucknow Uttar Pradesh
Wheat 24.2 25.0Paddy 18.75 18.13
Potato 162.47 223.83
Oilseeds 7.4 9.92
Sugarcane 541.24 608.07Source: District Sankhyaki Patrika, Lucknow, 2005
Statistical Dairy, Uttar Pradesh 2005.
7. Livestock
It is evident from the table 9 that the district has sizeable number of livestockspecially the milch animals, which offers great potential to develop dairy and its
related activities in the district. The data shows that in the year 1997 total livestock in
the district was 619720 and in 2003 it stands at 655097 which shows a decline of 5.7
percent.

7/26/2019 Final Report District Lucknow
http://slidepdf.com/reader/full/final-report-district-lucknow 21/86
11
Table 9: Livestock Population in Lucknow District-
(17th Census-2003)
Luc kno w Uttar Pradesh o. of Animal per 100a. Of Net Sown AreType of Animal
No. % No. % Lucknow UttarPradesh
Drought Animals
Bullock 2204 0.34 56 03 87 8 9.2 1.60 33.46
Buffalo 431 81 6.59 1608 809 2.64 31.26 9.61
Milch Animals
Cow 7209 1.10 61 87 67 2 10.16 5.22 36.94
Buffalo 876 81 13.38 11194 710 18.38 63.47 66.84
You ng Ani ma ls
Cattle 225 93 3.45 675 9210 11.09 16.35 40.35
Buffalo 196 33 3.00 101 101 81 16.5 9 14.21 60.36
Others
Sheep 5 7 1 0.09 1436731 2.36 0.41 8.58
Goat 141937 21.67 12941013 21.24 10 2. 74 77.2 6
Horse 1905 0.29 154049 0.25 1.38 0.92
Pig 4210 9 6.43 260213 0 4.27 30.48 15.54
Others Animals 0 0.00 2324 997 3.82 13.88
Total Livestock 65 509 7 100.00 60923380 100 474 .20 363 .7 3
Poultry Birds 16 87 21 - 121 9396 4 - 122. 13 72.8Source: 17 th Livestock Census of Uttar Pradesh, 2003.
In Lucknow district, number of livestock population per 100 hectare of netsown area is higher than that of state average thus indicating the potential of the
district to develop its livestock and extract benefits thereof. Even if the same livestock
is made more productive, it may add to the economy of the district, which can reduce
the carrying capacity of land. Number of poultry farms is also less in the district as
compare to the state, as shown in table 9.
8. Industrial Development
The industrial development in Lucknow district has been not been very
promising. It is evident from table 10 that number of registered factories per lakh of
population by 2005-06 were around 5.2 only and out of these only 3.2 factories were
in operation and remaining were closed. The working factories provided employment
to 296 persons and produced out put to the tune of rupees 4788 per capita. The
development of industries was also very much tardy in the district. There were just 186
registered working units with 9875 persons employed in 2002-03.

7/26/2019 Final Report District Lucknow
http://slidepdf.com/reader/full/final-report-district-lucknow 22/86

7/26/2019 Final Report District Lucknow
http://slidepdf.com/reader/full/final-report-district-lucknow 23/86

7/26/2019 Final Report District Lucknow
http://slidepdf.com/reader/full/final-report-district-lucknow 24/86
14
important means of facilitating investment. In the absence of such opportunity people
are forced to take non-institutional options and end up paying unusually high rates of
interest.
Percent of villages electrified show a positive trends as in 2001 were 97.81
percent and it increased to 98.91 percent in the year 2006 (Sankhiyki Patrika, 2006).
Lucknow being the capital hub of the state has this privilege of being electrified to the
utmost.
Population per ration shop is 8.1 thousand in 2003-04 which has registered an
increase from 6.7 thousand in 1999-00.
9.2 Social Infrastructure
Table 12: Indicators of Social Development
Indicators 1999-00 2000-01 2001-02 2002-03 2003-04Number of Schools per Lakh of Population Number of Primary Schools 52.2 51.9 52 54.8 53.1
Number of Upper Primary Schools 16.2 17.5 18.9 19.3 21.4
High School/Intermediate Colleges 5.7 5.5 5.4 13.8 12.9
Degree Colleges 0.7 0.5 0.5 0.5 0.5PG Colleges 0 0.2 0.3 0.3 0.3Industrial Training Institute 0.1 0.1 0.1 0.1 0.1
Teacher Pupil Ratio
Primary Schools 78.8 69.7 68.9 90.1 92.6
Upper Primary schools 116.6 127.1 110.2 208.3 213.7High School/Intermediate Colleges 17.2 21.6 21.8 54.8 332.7Degree Colleges 123.9 65.7 74.4 71.9 77 .1
PG Colleges - - 68 1055.3 6 9
Industrial Training Institute - - - 11.6 11.6
Medical Facility
Per Lakh of Population Allopathic Hospital /CHC and Delivery Centres
0 0 0 2 1.9
Per Lakh of Population beds in AllopathicHospital /CHC and Delivery Centres
117.2 127.7 125.1 118.3 110.9
Number of Child/Women Welfare Centres
per lakh population.
10 97 5 14610 15036 11728 12513
Source: District Sankhyaki Patrika, Lucknow, 2005 Statistical Dairy, Uttar Pradesh 2005
The main indicators of social development are facilities related to educationand health. As far as education is concerned there were almost 68 primary schools per
lac of population while the corresponding figure for upper primary schools was around
26.6. Lucknow is one of the leading district in the number of institutions including 7
universities, 1 technical universities and a large number of polytechnics, engineering
institutes and industrial training institutes. The district has several reputed
educational institutions like IIM Lucknow, Engineering University (recently ranked

7/26/2019 Final Report District Lucknow
http://slidepdf.com/reader/full/final-report-district-lucknow 25/86

7/26/2019 Final Report District Lucknow
http://slidepdf.com/reader/full/final-report-district-lucknow 26/86
16
Table 13: Income and Poverty in Lucknow District and
Uttar Pradesh
Details Lucknow District Uttar Pradesh
Per capita income at 1993-94 prices (2003-0 4 ) 10 38 9 5 9 7 5
Per capita income at current prices (2003 -04) 18 91 6 10 63 7Total number of rural households (BPL census 2002) 2 7 2 7 1 7 2 4 0 2 6 1 7 6
Total Rural Population (BPL census 2002) 13 49 07 3 12 71 91 12 2Total number of BPL households (BPL census 2002) 13 48 09 99 56 38 4
Total number of BPL population (BPL census 2002) 6 6 1 8 6 0 4 9 6 0 6 61 6
Percentage of BPL households 49.0 6 27 .5
11. Gaps in Amenities and Facilities at the District Level
Although various problems are found in the district because of which it is
lagging behind in the process of development some efforts, as suggested below, could
prove useful in stepping up the pace of economic development and help in placing
Lucknow in the list of the developed districts:
Ø The myths prevailing amongst the population regarding family planning should
be taken care of by the government so that the unprecedented growth of
population leading to high population density could be checked so that its
adverse impact on the employment and income prospects of the people are also
taken care of. The literacy level has also found to be lower in the district and
especially amongst the female population, which if tapped properly could be
very helpful in curbing the growth of population in extraordinary numbers.
Ø The literacy level and work participation rate among the Muslims of the district
has been found to be low when we compare it with Hindus of the district.
Perhaps low literacy and low work participation rates are driving the Muslim
population to live in extreme poverty. The gap between Muslims and Hindus in
terms of literacy and employment is to be abridged if balanced social
development is to be achieved.
Ø According to Census 2001 total cultivators in the district stood at 189279,
58384 agricultural labourers, 39970 are in household industries and 612548 inothers category. Total main workers were 900181. Marginal workers were
186219 in numbers hence making the total workers to be 1086400 which were
29.78 percent of the total population.
Ø The agriculture is still the mainstay of livelihood in the district. Crop intensity
of the diversification is still low despite larger area being brought under
cultivation and irrigation. The productivity of major crops is still lower and

7/26/2019 Final Report District Lucknow
http://slidepdf.com/reader/full/final-report-district-lucknow 27/86

7/26/2019 Final Report District Lucknow
http://slidepdf.com/reader/full/final-report-district-lucknow 28/86
18
CHAPTER III
SOCIO-ECONOMIC STATUS OFSAMPLE VILLAGES IN DISTRICT LUCKNOW
Previous Chapter highlighted the issue that our study is confined to 30 village
sample spread over four tehsils of Lucknow district viz; Bakshi ka talab, Malihabad,
Lucknow tehsil and Mohanlalganj. In this chapter an effort has been attempted to
focus on the socio-economic condition existing in the selected villages. We shall here
try to highlight the socio-economic conditions on various indicators such as
demographic features, existing educational and medical facilities, public amenities etc.
to pin point the loopholes for policy formulation.
3.1 Demographic Status
3.1.1 Status of Households, Population and Size of Family
Overall 30 sample villages were surveyed in district Lucknow in which 4759
households were recorded. About 84.68 per cent households belonged to Hindu
community, 15.19 per cent Muslims and 0.13 per cent of Sikh community. About
26210 population belongs to Hindus, 5100 Muslims and 39 Sikhs. Community -wise
average size of households was 6.50 Hindus, 7.05 Muslims and 6.50 Sikhs. Overall
average size of households was 6.59 persons (See Table 1).Table 1: Religion-wise population
Religion Number ofhouseholds
Percentage Totalpopulation
Averagefamily size
Hindu 4030 84.68 26210 6.50Muslim 723 15.19 5100 7.05Sikh 6 0.13 39 6.50Christian 0 0.00 0 0Buddhist 0 0.00 0 0Total 47 59 100.00 31349 6.59Source: Based on the Primary data.
3.2 Status of Economic Activities
3.2.1 Occupational Status
Maximum workers were engaged as cultivators 55.8 per cent followed by
agricultural labourers 17.99 and other workers 21.07 percent. Overall in primary
activity 73.79 per cent, in secondary activity 5.14 per cent and in tertiary activity 21.07
per cent people are engaged (See Table 2).

7/26/2019 Final Report District Lucknow
http://slidepdf.com/reader/full/final-report-district-lucknow 29/86
7/26/2019 Final Report District Lucknow
http://slidepdf.com/reader/full/final-report-district-lucknow 30/86
7/26/2019 Final Report District Lucknow
http://slidepdf.com/reader/full/final-report-district-lucknow 31/86

7/26/2019 Final Report District Lucknow
http://slidepdf.com/reader/full/final-report-district-lucknow 32/86
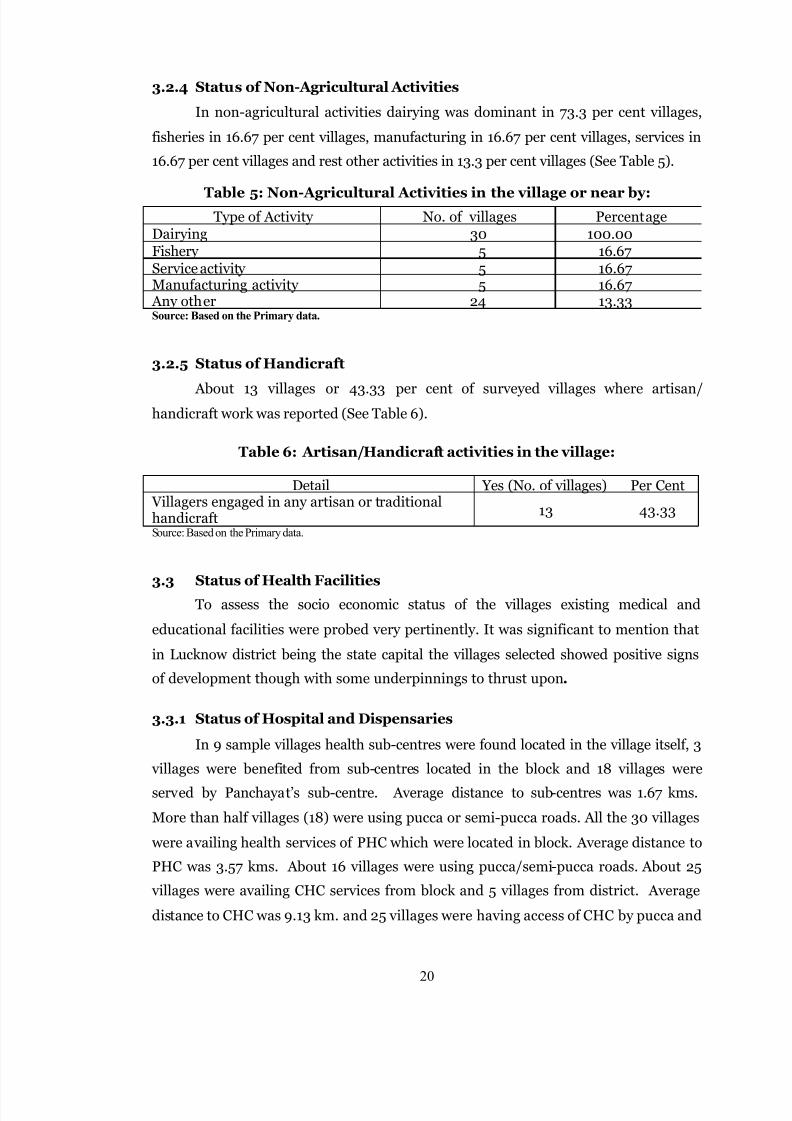
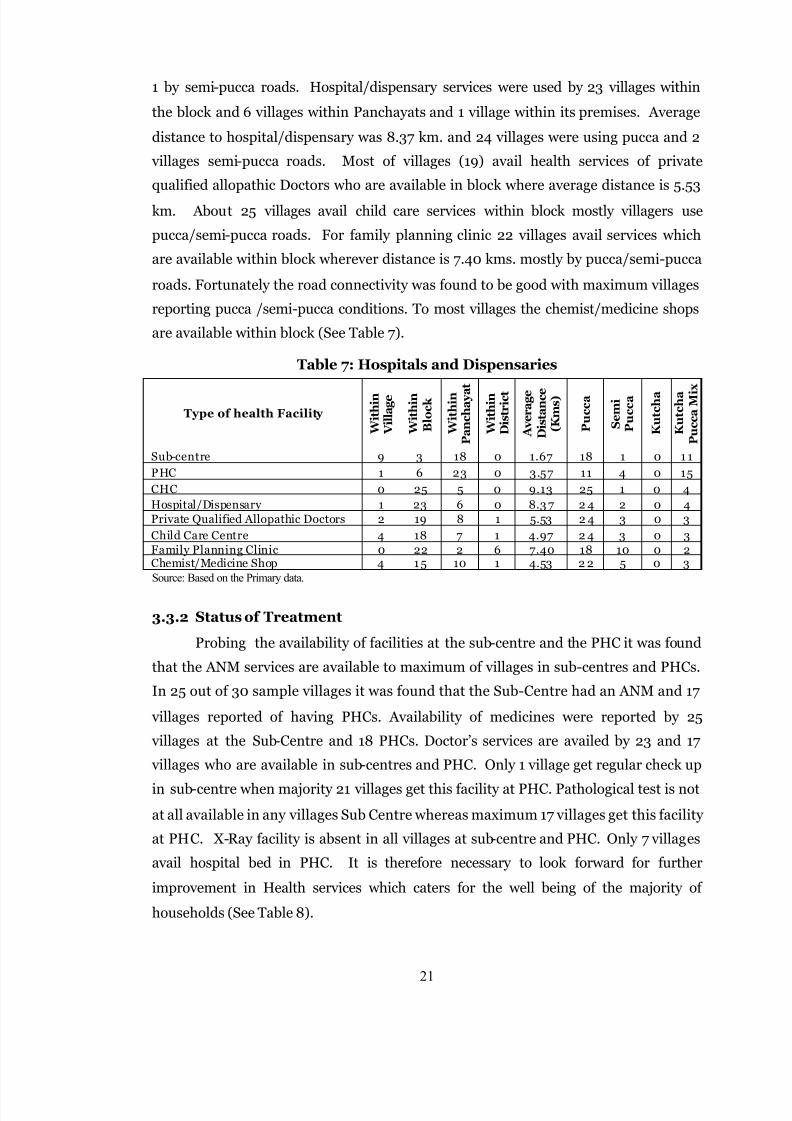
22
Table 8: Facilities at the Sub-centre or PHC (number of villages)
Facilities Sub Centres PHC ANM 25 17Medicines 25 18Doctor 23 17
Regular Checkup 1 21Pathological Tests 0 17X-Ray 0 0Beds 0 7 Any Other 0 0Source: Based on the Primary data.
3.3.3 Status of Availability of Health Services
Looking into the frequency of visit of health staff in the village highlights the
fact that the ANM and ASHA are regularly visiting the villages. Except Lady Health
Visitor/ASHA or ANM no other health services are reported covering most of the
villages (See Table 9). These Health providers are the milestone in spreading
awareness among the people regarding importance of sanitation and hygiene and also
to provide health awareness within the precincts of the villages itself. The table 9 is self
explanatory as we can find that other health/ medical staff are visiting the villages
twice in a village only to embark upon there official duty.
Table 9: Frequency of visit of Health Staff in the Village
Frequency
Type of staff Regularly Weekly Monthly Quarterly Half YearlyMedical Officer 1 4 7 0 18Lady Health Visitor 2 5 10 0 13 ANM 17 12 1 0 0Malaria Inspector 0 5 5 0 20Health Educator 0 4 3 1 22 Vaccinator 0 18 9 0 3 ASHA 23 2 0 0 5Others 0 3 0 0 28Source: Based on the Primary data.
To further analyse the health facilities we tried to assess the condition of PHC
building in terms of good, satisfactory, poor and bad. About condition of PHC and
Sub-Centre, good condition was reported by 50.00 per cent villages, satisfactory 50.00
per cent and poor by none villages. For availability of doctor was in 74.01 per cent
villages, their availability for some time was in 33.33 per cent villages and their rare
availability was in 11.1 per cent villages. Medicines were available in 37.0 per cent
villages, occasional problem in availing medicines in 59.3 per cent villages and only in

7/26/2019 Final Report District Lucknow
http://slidepdf.com/reader/full/final-report-district-lucknow 33/86

7/26/2019 Final Report District Lucknow
http://slidepdf.com/reader/full/final-report-district-lucknow 34/86

7/26/2019 Final Report District Lucknow
http://slidepdf.com/reader/full/final-report-district-lucknow 35/86
25
respectively . Average distance was 1.7 km. However, when it comes to High
School/Higher Secondary School for boys and girls none of the villages had the
privilege of having this category of schools within the village. Some 22 villages avail
High/Higher Secondary (Boys) education in block, while girls of 26 villages also go to
block. Girls of 4 villages go to district schools for secondary education. Average
distance to Secondary Schools is 7.00 kms. and most of the villages are having access
to schools by Pucca and Semi-Pucca roads, except 5 villages by Kutcha road.
Education of religious schools is available within 5 villages and 1 villages avail
education in block, 1 in Panchayat and 25 in district. Average distance is about 2.1
kms. and accessibility is mostly by Kutcha- pucca mix road. In 1 village non-formal
education is available and average distance is 6.13 km through Kutcha-pucca mix
roads. The details related to availability of educational infrastructure, distance which
children slog to school and the nature of connectivity whether Pucca, Kutcha pucca -
Kutcha mix are all provided in the Table below:
Table 12: Educational Facilities ( number of villages)
Place Type of road
Type
W i t h i n V i l l a g e
W i t h i n B l o c k
W i t h i n
P a n c h a y a t
W i t h i n
D i s t r i c t
D i s t a n c e
( a v e r a g e )
( k m s )
P u c c a
S e m i P u c c a
K u t c h a
K u t c h a P u c c a
M i x
Primary School 25 1 4 0 0.27 21 4 3 2
Middle School 12 5 13 0 1. 70 23 2 3 2High/Higher Secondary (Boys) 0 2 2 8 0 6.1 7 25 1 0 4
High/Higher Secondary (Girls) 0 2 6 4 0 7.00 24 1 0 5Religious School 5 1 1 25 2.1 0 5 1 0 24
Non Formal Education Centre 1 0 0 29 6.13 0 0 0 30
Others 0 1 0 29 6.13 1 0 0 29Source: Based on the Primary data.
3.4.2 Status of Availability of Educational Institutions
Table 13 highlights the average enrolment of school children on a sex-wise basis
and in different classes upto primary level. Overall average school enrolment in
primary schools (Class I to V) is about 69 and 68 for boys and girls respectively.
Average enrolment in a class is 14 students. The enrollment seems to be lower in all
the classes in view of the fact that each primary school average number of teachers
should be 5 and the teacher-student’s ratio should be 40. It is estimated that at quiet a
number of school going age children are not yet enrolled in any school (see Table 13).

7/26/2019 Final Report District Lucknow
http://slidepdf.com/reader/full/final-report-district-lucknow 36/86

7/26/2019 Final Report District Lucknow
http://slidepdf.com/reader/full/final-report-district-lucknow 37/86

7/26/2019 Final Report District Lucknow
http://slidepdf.com/reader/full/final-report-district-lucknow 38/86

7/26/2019 Final Report District Lucknow
http://slidepdf.com/reader/full/final-report-district-lucknow 39/86

7/26/2019 Final Report District Lucknow
http://slidepdf.com/reader/full/final-report-district-lucknow 40/86
30
kms. In 1 village Government Procurement Centre is located where as 19 villages are
linked with Block and 10 within Panchayat. Average distance to procurement centre is 6
km. In 25 villages Panchayat Ghar is located, while for 5 it is in Panchayat. Average
distance to Government Procurement Centre is 1 km. (see Table 20).
Table 20: Other Facilities:
Type Within village
WithinBlock
WithinPanchayat
WithinDistrict
AverageDistance
(km)Block HQ 1 26 3 0 11Nearest Town 0 18 6 6 12Nearest Bus Stop 2 20 7 1 7Nearest Regular Market 2 18 9 1 5Nearest Rail Station 1 15 10 4 8Nearest Post Office 5 1 0 14 1 3Commercial Bank 2 17 10 1 5
Gram Panchayat Office 23 0 7 0 2Fair Price Shop 20 4 6 0 2Other General Shops 15 8 7 0 2
Veterinary 4 14 12 0 4Govt. Procurement Centre 1 19 10 0 6Panchayat Ghar 25 0 5 29 1Others 1 26 3 0 11Source: Based on the Primary data.
3.6 Status of Government Programmes
3.6.1 Status of SGSY
Table 21 shows the information regarding beneficiaries through various
government programmes. In Sarva Gramin Swarozgar Yojana (SGSY) 65 were total
beneficiaries in which 30.76 per cent SCs were benefited, 23.6 per cent Minorities and
46.15 per cent others were benefited. In National Rural Employment Guarantee Agency
(NREGA) none of the respondents reported with being benefited under this programme of
the government. In Indra Awas Yojana total 288 beneficiaries were there, in which 61.8
per cent SCs, 9.2 per cent Minorities and 29.1 per cent others were benefited. In Old Age
Pension Scheme total 767 beneficiaries were recorded out of which 61.16 per cent went to
SCs, 10.13 per cent to Minorities and 28.71 per cent to Others. In Widow Pension Schemetotal 404 beneficiaries were reported in which 62.13 per cent wee SCs, 12.38 per cent
minorities and others 25.50 per cent (see Table 21).
Table 21: Individual Beneficiary Oriented Programmes
Programme Total SC % Minorit % Others %SGSY 65 20 30.77 15 23.08 30 46.15NREGA 0 0 0 0 0.00 0 0.00IAY 288 196 68.06 0 4.94 35 12.15

7/26/2019 Final Report District Lucknow
http://slidepdf.com/reader/full/final-report-district-lucknow 41/86

7/26/2019 Final Report District Lucknow
http://slidepdf.com/reader/full/final-report-district-lucknow 42/86

7/26/2019 Final Report District Lucknow
http://slidepdf.com/reader/full/final-report-district-lucknow 43/86
33
8. Youth Mandal 1 29 1
9. Women Mandel 0 30 0
10. Flood Relief Village Security Force 0 30 0Source: Based on the Primary data.
4. Development Constraints in the VillagesDevelopment constraints as perceived by the responsible citizens (Pradhans
and Sarpanch) of the selected villages were very pertinently laid out in front of the
survey team are as follows despite the fact that 30 villages covering as many as 4
Tehsils were visited by us and the central problem are by and large common all over
these villages:
Ø In all villages without any exception the people have demanded that the road
network should be developed properly. The average distance covered before
reaching the main road was 4.98 km and walking through kutcha or kharanja laidpath is a great nuisance particularly during the monsoons. Moreover, every village
should have a proper link road.
Ø The existing medical infrastructure has its own tale to relate. The ill equipped sub-
centres and also the PHCs to some extent cause problems for the village
community in fulfilling their needs to meet medical care. Even the private
practitioners in the villages are ‘ Jhola Chap’ doctors. On the whole, therefore, the
community is of the opinion that better medical services should be provided to
them by the government.
Ø The irregular power supply is yet another aspect which has been reiterated by
Pradhans. This is one of the reasons why people are reluctant to take electrical
connections whether it is for domestic, agricultural or commercial purposes. The
average daily power supply of 9.58 hours is sufficient to meet the requirements of
the people. The problem becomes more acute considering the fact that most of the
times power su pply is not available at the time when it is needed the most.
Ø The problem of water is prevalent in the areas with most of the handpumps being
non-functional. Only 80 percent of public handpumps are functional and 54
percent private are functional. Even those who have their own hand pump or
tubewell do not have sufficient resources to afford deep boring to get water for
usage. Public tubewells are dysfunctional to the extent that irrigation is a problem
reported by the villagers. The general opinion is that the government can play an
active role in providing a suitable water facility.
Ø As far as public distribution system is concerned Public Distribution System (PDS)
was available in 14 out of 30 villages selected i.e. only 46.67 per cent villages

7/26/2019 Final Report District Lucknow
http://slidepdf.com/reader/full/final-report-district-lucknow 44/86

7/26/2019 Final Report District Lucknow
http://slidepdf.com/reader/full/final-report-district-lucknow 45/86

7/26/2019 Final Report District Lucknow
http://slidepdf.com/reader/full/final-report-district-lucknow 46/86

7/26/2019 Final Report District Lucknow
http://slidepdf.com/reader/full/final-report-district-lucknow 47/86

7/26/2019 Final Report District Lucknow
http://slidepdf.com/reader/full/final-report-district-lucknow 48/86

7/26/2019 Final Report District Lucknow
http://slidepdf.com/reader/full/final-report-district-lucknow 49/86
39
4.1.5 Educational Status of Households.
Table 7: Classification of Population by Level of Education amongDifferent Religious Groups
Level of Education Hindu % Muslim % Sikh % Total %
illeterates 14 78 36.52 4 70 4 6.59 5 11.36 18 93 38.08
Below Primary 62 8 15.52 206 23.4 1 5 11.36 839 16.88
Primary 570 14.08 130 14.77 7 15.91 707 14.22Upper Primary 509 12.58 7 3 8. 30 3 6.82 585 11. 77
Matric-Hs 34 6 8.55 2 1 2. 39 10 22 .7 3 3 7 7 7.58
Hs-Pre University -Inter 151 3 . 7 3 8 0.91 6 13. 64 16 5 3. 32
Technical Diploma 8 0. 20 1 0. 11 0 0.00 9 0. 18
Technical Professional Degree 4 0. 10 0 0. 00 1 2.2 7 5 0. 10
Graduate-General 8 4 2. 08 3 0. 34 5 11. 36 92 1.8 5
PG 29 0. 72 2 0.23 1 2.27 32 0.64
Others 24 0 5.93 26 2.95 1 2.27 267 5.37
Total Educated 2569 63 .48 4 70 53.41 3 9 88. 64 3 07 8 61.9 2
Total HH members 40 47 100.00 88 0 100.00 4 4 100.00 4 9 7 1 100.00Source: Based on the Primary data.
A cursory look at the educational status of the family members show that 38.08
percent of the family memb ers reported to be illiterate. Around 1/5 rth of the family
members were in the category of below Primary education (16.88 percent). Another 14.22
percent reported to Literate upto Primary, followed by 11.77 percent in Upper Primary
category. The level of Literacy among Muslims is very remarkable to notice by the fact that
23.41 percent were in Below Primary status. There was not much of difference between the
different religious communities. In rural areas as it is education is not very stressed upon
is well highlighted in the table as only a small proportion reported of being technically
trained or having post graduation degree. The table clearly shows that overall educationallevel is very low and Muslims are lagging behind the series of laggered.
Table 8: Educational Status of Children in the Age of 5 to 15 yearsSchooling Status Hindu Muslim Sikh Grand Total
Total Children 1084 255 8 13 47
Non School going children 74 36 0 110
Never Enrolled 33 6 39
Left after enrolment 36 23 59
Enrolled but irregular 5 7 12
Enrolled and regular 10 10 21 9 8 1 23 7
Total Children Enrolled 1051 24 9 8 130 8
Characteristics of enrolled children
Enrolled in Class 1 18 3 50 1 23 4
Enrolled in Class 2 157 48 1 206
Enrolled in Class 3 16 8 52 2 22 2
Enrolled in Class 4 13 3 31 1 16 5
Enrolled in Class 5 10 1 18 2 12 1
Enrolled in Class 6 11 2 23 1 13 6
Enrolled in Class 7 83 12 95

7/26/2019 Final Report District Lucknow
http://slidepdf.com/reader/full/final-report-district-lucknow 50/86
40
Enrolled in Class 8 57 9 66
Enrolled in Class 9 39 3 42
Enrolled in Class 1 0 1 8 3 21
Grand Total 1051 2 4 9 8 13 08
Type of School
Government 718 180 2 900
Private 32 2 61 6 389
Madarsa 9 7 16
Missionary 0 0
Non-formal 2 2
Others 0 1 1
Grand Total 1051 2 4 9 8 13 08
Distance of School (Km
Within 1 651 181 832
1-2 281 38 2 321
2 -4 77 16 4 97
4 and above 42 14 2 58
Grand Total 1051 2 4 9 8 13 08
Medium of instruction
Hindi 657 146 0 803
English 36 4 2 42
Hindu & English both 358 87 6 451
Urdu 0 12 0 12
Regional Language 0 0 0 0
Other 0 0 0 0
Grand Total 1051 2 4 9 8 13 08
Learning of Minority Language
Yes 1 19 98 0 217
No 93 2 151 8 109 1
Grand Total 1051 2 4 9 8 13 08
Reason for Drop out Work at home 1 1 2
Need to earn 6 4 10
Far distance of School 2 2
Lack facility in School
Teacher Beat
Teacher do not teach
Failed in Examination
Fees/Expenditure not afford 2 2 9 31
Not interested in reading 4 9 13
Marriage
Other 1 0 1
Grand Total 36 23 0 59Source: Based on the Primary data.
If we focus our attention on the children of school going age i.e. 5-15 years of
age we find that the total children in this category is around 2.9 percent of them are
not enrolled mainly because their parents do not approve of their education. About
4.38 percent dropped out after being enrolled and it is quiet interesting to note that
91.83 percent are happily enrolled and very regular at the time of survey been

7/26/2019 Final Report District Lucknow
http://slidepdf.com/reader/full/final-report-district-lucknow 51/86
41
conducted. Table 8 highlights the fact that large proportion of children are reported in
the category of Class I (18.34 percent) followed by Class II (15.67 percent) and Class III
(15.36 percent) are further reduction if one moves up the ladder thus pointing to the
fact the children in rural areas very enthusiastically joins school but later drop out due
various hazards. Large proportions of children are seen going to Government schools
(68.62 percent) and only 29.56 percent report of going to private schools. High
concentration of children in government schools points towards inability of their
parents to bear the burden of education in rural areas.
4.1.6 Status of Aspiration of Parents for their Children
About 6.22 per cent parents wanted their sons to get education upto High
School, 29.78 per cent wanted upto Intermediate, 16.89 per cent upto Graduate, 8.00
per cent upto Post-Graduate and only 4.0 per cent Technical Degree. In case of girl’s
parents 16.22 per cent wanted their daughters to get educated upto High School, 26.44
per cent upto Intermediate and 11.1 per cent upto Graduate. In case of Muslim parents
who wanted their daughter’s education upto High School, i.e. 19.73 per cent and upto
Intermediate level were 28.57 percent. What is interesting to note is that none of the
Muslim households shown any keenness for technical education for girls whereas 0.68
percent showed such education for boys(see Table 53).
Table 9: Aspirations of Parents of Current Students
Hindu % Muslim % Sikh %GrandTotal %
Boys Desired LevelHigh School 44 5.9 0 1 2 8.1 6 0 0.00 56 6. 22
Intermediate 21 8 29. 22 50 34.01 0 0.00 268 29 .7 8
Pre-Graduation/ Diploma 20 2. 68 1 0.6 8 0 0.00 21 2. 33
Bachelor’s Degree 13 0 17. 43 2 1 14.2 9 1 14.2 9 152 16 .8 9
Post Graduation 66 8.8 5 6 4. 08 0 0.00 7 2 8.0 0
Technical Degree 29 3. 89 1 0.6 8 6 85 .7 1 36 4. 00
(blank) 23 9 32.04 56 38.10 0 0.00 29 5 32.7 8
Boys (Total) 74 6 100 .0 0 147 100 .0 0 7 10 0.0 0 90 0 100 .0 0
Girl
High School 11 6 15.55 2 9 19 .7 3 1 14.2 9 146 16 .2 2
Intermediate 196 26.2 7 4 2 28.57 0 0.00 23 8 26 .4 4
Pre-Graduation/ Diploma 9 1. 21 2 1. 36 0 0.00 11 1. 22
Bachelor’s Degree 91 12 .20 9 6. 12 0 0.00 100 11 .1 1
Post Graduation 43 5. 76 5 3. 4 0 1 14. 29 49 5.4 4
Technical Degree 12 1. 61 0 0.00 3 42 .8 6 15 1. 67
(blank) 2 7 9 37. 40 6 0 40.82 2 28.57 341 37. 89
Girl (Total) 74 6 100 .0 0 147 100 .0 0 7 10 0.0 0 90 0 100 .0 0Source: Based on the Primary data.
4.2 Economic Status
4.2.1 Status of Employment

7/26/2019 Final Report District Lucknow
http://slidepdf.com/reader/full/final-report-district-lucknow 52/86
42
The working status of surveyed household population is that 28.8 per cent are
employed, 2.45 per cent unemployed, 21.82 per cent work as domestic workers, 29.48
per cent students, 1.31 per cent retired, 13.3 per cent are too old and children
(unemployable).
Table 10: Working Status of Family Members
Working Status Hindu % Muslim % Sikh % Grand Total %
Employed 114 8 29.19 227 27.15 11 25.00 1386 28.80
Unemployed 97 2 .47 2 0 2.39 1 2 .2 7 118 2 .45
Domestic Work 857 21.79 186 22.25 7 15.91 1050 21.82
Students 1184 30.1 218 26.08 17 38.64 141 9 29.48
Retired 54 1.37 7 0.84 2 4.55 63 1 .31
Old/Child 514 13.07 120 14.35 6 13.6 4 64 0 13.3
Others 79 2.01 58 6.94 0 0 137 2.85
Total 3933 100 836 100 44 100 4813 100Source: Based on the Primary data.
The figure related to status of work shows that around 27-29 percent persons in
the total population are employed and not much difference could be observed between
Hindus and Muslims. However among the Sikhs it is slightly less i.e. about 25 percent
are employed and more are in the category of students. In household of Sikh
community domestic work category have large number of people more than the
Hindus and Muslims (see Table 9).
Table 1 1: Occupational Classification of Working Family Members
Data Hind % Muslim % Si k %GrandTotal
%
Self-Employed 33 4 8. 49 7 4 8.85 10 22 .7 3 41 8 8.68Govt. Service 50 1.2 7 1 0.12 0 0 51 1.06
Regular Salaried 83 2. 11 15 1. 79 0 0 9 8 2.04
Non-Agriculture 44 0 11 .1 9 101 12.0 8 0 0 541 11 .2 4
Agricultural Labour 1 9 0 4.83 22 2.63 0 0 2 1 2 4.4
Unemployed 97 2. 47 20 2.3 9 1 2. 27 11 8 2. 45
Household work 857 1 . 7 9 18 6 22 .2 5 7 15.91 1050 21 .8 2
Household work other incomeactivities 51 1.3 14 1.67 1 2.2 7 6 6 1.37
Students 11 84 30.1 218 26.08 17 38.64 1419 29.4 8
Retired/pensioner 54 1. 37 7 0.84 2 4.55 6 3 1. 31
Old age 514 3. 07 12 0 14 .3 5 6 13.6 4 640 13.3
Others 7 9 2.01 58 6.9 4 0 0 13 7 2.8 5
Total 3933 100 836 100 44 100 4813 100Source: Based on the Primary data.
If we analyse in detail the overall employment and occupation we find that
maximum proportion are in student category (29.48 percent) followed by household
workers (21.82 percent) and Non-agricultural employment with 11.24. People employed as
self employment category are much higher than the percent in regular salaried and

7/26/2019 Final Report District Lucknow
http://slidepdf.com/reader/full/final-report-district-lucknow 53/86

7/26/2019 Final Report District Lucknow
http://slidepdf.com/reader/full/final-report-district-lucknow 54/86

7/26/2019 Final Report District Lucknow
http://slidepdf.com/reader/full/final-report-district-lucknow 55/86

7/26/2019 Final Report District Lucknow
http://slidepdf.com/reader/full/final-report-district-lucknow 56/86

7/26/2019 Final Report District Lucknow
http://slidepdf.com/reader/full/final-report-district-lucknow 57/86

7/26/2019 Final Report District Lucknow
http://slidepdf.com/reader/full/final-report-district-lucknow 58/86

7/26/2019 Final Report District Lucknow
http://slidepdf.com/reader/full/final-report-district-lucknow 59/86

7/26/2019 Final Report District Lucknow
http://slidepdf.com/reader/full/final-report-district-lucknow 60/86
50
Now focusing our attention to expenditure pattern of the selected households is
very pertinently correlated to their level of income. Consequently the average annual
expenditure per household is around Rs. 38198. Average per household annual
expenditure is worked out to be Rs.38198, which among Hindu, Muslim and Sikh
households, it was Rs.34068, Rs.45556 and Rs.109126 respectively. Expenses in Sikh
household were more than double of other communities. Maximum expenditure was
on cereal and pulses followed by vegetable, meat, milk, spices, sugar, etc., however, on
these items Hindu household expenses were comparatively less than other
communities. Sikh households were comparatively spending more on education while
Hindu were spending more on medical. Payment of Loans and interest was done more
by Muslims households and hence show that they are the most indebted ones
compared to other communities (see Table 23).
Table 23: Average Household Expenditure on different heads
Expenditure HeadsHindu Muslim Sikh Total
Cereal And Pulse (Total) 8383.86 10127. 99 16476.19 8744.24
% 24.61 22.23 15.1 22.89
Purchased 4357. 40 5741. 66 6133 .33 4592.02
Own Produce 4026. 46 43 86 .3 2 10342.86 4152.21
Vegetable, Meal, Milk, Spices,Sugar etc (Total) 5410.64 5861. 44 14502.38 5645.16
% 15.88 12.87 13.29 14.78
Purchased 3259.06 3265 .98 6085 .71 3282 .17
Own Produce 2151.58 2595.4 5 841 6.6 6 236 2. 99
Cloths Footwear Beddings 1165 .08 12 91 .2 5 4500 .0 12 11 .6 8
% 3.42 2.83 4.12 3.17
Education 1624.51 1107. 19 923 3.3 3 1623.87
% 4.77 2.43 8.46 4.25
Medical 2744.83 3153.41 7457.1 4 2848.3 6
% 8.06 6.92 6.83 7.46
Ceremonies 106 7.3 3 128 2. 27 4000.0 1125.60
% 3.13 2.81 3.67 2.95
Fuel 1261.69 1607.91 7566.66 1404.97
% 3.7 3.53 6.93 3.68
Telephone 1090.9 6 952 .00 200.00 1061.87
% 3.2 2.09 0.18 2.78
House 3185.11 39 79 .7 3 10000.00 3401 .97
% 9.35 8. 74 9.16 8.91Payment of loans and interest 38 42.00 11 49 4. 12 24500.00 66 40. 92
% 11.28 25.23 22.45 17.39
House repairing / construction 94 6. 64 10 73 .0 2 1550 97 0. 68
% 2.78 2.36 1.42 2.54
Recreation 422. 26 365. 81 1 66 0.00 433 .26
% 1.24 0.8 1.52 1.13
Marriage and other ceremonies 1794.56 251 7. 12 38 14. 28 1936.57
% 5.27 5.53 3.5 5.07

7/26/2019 Final Report District Lucknow
http://slidepdf.com/reader/full/final-report-district-lucknow 61/86
7/26/2019 Final Report District Lucknow
http://slidepdf.com/reader/full/final-report-district-lucknow 62/86
52
50-75 20 1 0 21
% 2.6 8 0.68 0 2. 33
75-100 9 2 0 11
% 1.21 1.36 0 1.22
100 & above 21 1 6 28
% 2.8 2 0.68 85.71 3.11
Grand Total 7 4 6 1 4 7 7 9 00
% 100 100 100 100
Source: Based on the Primary data.
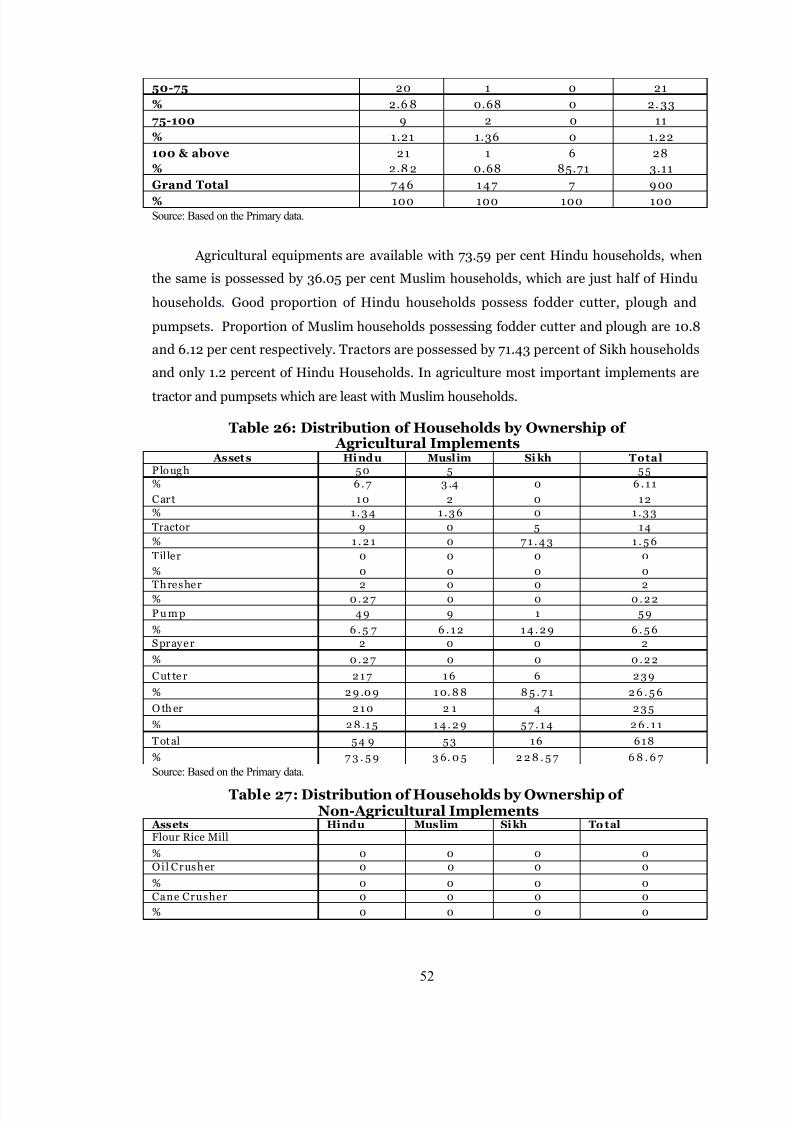
Agricultural equipments are available with 73.59 per cent Hindu households, when
the same is possessed by 36.05 per cent Muslim households, which are just half of Hindu
households. Good proportion of Hindu households possess fodder cutter, plough and
pumpsets. Proportion of Muslim households possessing fodder cutter and plough are 10.8
and 6.12 per cent respectively. Tractors are possessed by 71.43 percent of Sikh households
and only 1.2 percent of Hindu Households. In agriculture most important implements are
tractor and pumpsets which are least with Muslim households.
Table 26: Distribution of Households by Ownership of Agricultural Implements
Asset s Hind u Muslim Si kh TotalP lo ug h 5 0 5 5 5
% 6 . 7 3 .4 0 6 . 1 1
C ar t 1 0 2 0 1 2
% 1 . 3 4 1 . 3 6 0 1 . 3 3
Tractor 9 0 5 1 4
% 1 . 2 1 0 7 1 . 4 3 1 . 5 6
Til ler 0 0 0 0
% 0 0 0 0
Thresher 2 0 0 2% 0 . 2 7 0 0 0 . 2 2
P u m p 4 9 9 1 5 9
% 6 . 5 7 6 . 1 2 1 4 . 2 9 6 . 5 6
Sprayer 2 0 0 2
% 0 . 2 7 0 0 0 . 2 2
C ut te r 2 1 7 1 6 6 2 3 9
% 2 9 .0 9 1 0. 8 8 8 5 . 7 1 2 6 . 5 6
O th er 2 1 0 2 1 4 2 3 5
% 2 8 .1 5 1 4 . 2 9 5 7 . 1 4 2 6 . 1 1
T ot al 5 4 9 5 3 1 6 6 1 8
% 7 3 . 5 9 3 6. 0 5 2 2 8 . 5 7 6 8 . 6 7
Source: Based on the Primary data.
Table 27: Distribution of Households by Ownership ofNon-Agricultural Implements
Assets Hindu Muslim Sikh To talFlour Rice Mill
% 0 0 0 0
Oil Crusher 0 0 0 0
% 0 0 0 0
Cane Crusher 0 0 0 0
% 0 0 0 0

7/26/2019 Final Report District Lucknow
http://slidepdf.com/reader/full/final-report-district-lucknow 63/86
53
Handloom 0 1 0 1
% 0 0 . 6 8 0 0 .1 1
Powerloom 0 0 0 0
% 0 0 0 0
We ld in g 0 0 0 0
% 0 0 0 0
EleRepaire 0 0 0 0
% 0 0 0 0Motor Repair 0 0 0 0
% 0 0 0 0
S ew in g 1 7 1 5 0 3 2
% 2 . 2 8 1 0 .2 0 3 . 5 6
NonAgOthers 39 5 0 44
% 5 . 2 3 3 .4 0 4 . 8 9
T ot al 5 6 2 1 0 7 7
% 7 . 5 1 1 4 . 2 9 0 8 . 5 6
Source: Based on the Primary data.
With certain variation, both Hindu Muslim and Sikh households are in possession of
cycle i.e. 78.69, 70.75 and 85.71 per cent respectively. Income generating non-agricultural
equipments is maximum with Muslim households (14.29 percent) and that too 10 percent are
having sewing machines depicting that they are tailors. Saving bank/post office account is with
85.7 per cent Sikhs, 57.91 percent Hindus while only 47.52 per cent Muslim households have
it. About 51 per cent Hindu households have fixed deposit when only 37 per cent Muslim
households have it (see Table 30).
Table 28: Distribution of Households by Ownership of Means of Transport
Asset s Hind u Muslim Si kh TotalJeep 1 2 3
% 0 . 1 3 0 2 8 . 5 7 0 . 3 3
Truck 0 0 0 0
% 0 0 0 0Bu s 0 0 0 0
% 0 0 0 0C ar 5 1 0 6
% 0 . 6 7 0 . 6 8 0 0 . 6 7
Mcycle 4 4 7 5 5 6% 5 .9 4 . 7 6 7 1 . 4 3 6 . 2 2
Scooter 3 1 0 4% 0 .4 0 . 6 8 0 0 . 4 4
C yc le 5 8 7 1 0 4 6 6 9 8
% 7 8 . 6 9 7 0 . 7 5 8 5 . 7 1 7 7 . 5 6T ot al 6 4 0 1 1 3 1 3 7 6 7
% 8 5 . 7 9 7 6 . 8 7 1 8 5 . 7 1 8 5 . 2 2
Source: Based on the Primary data.
Different transport vehicles are available with 85.7 per cent Hindu households, while
76.87 per cent Muslim households. Modern household assets are available with 27.35 per cent
Hindu households while it is only 19.7 per cent with Muslim households. Financial assets are
available with 85.8 per cent Sikh households 59.9 per cent Hindus and 47 percent Muslim
households.
Table 29: Distribution of Households by Ownership ofModern Household Assets

7/26/2019 Final Report District Lucknow
http://slidepdf.com/reader/full/final-report-district-lucknow 64/86
54
Asset s Hind u Muslim Si kh Total
Fan 1 1 6 3 2 6 1 5 4% 1 5 . 5 5 2 1 . 7 7 8 5 . 7 1 1 7 . 1 1
Cooler 8 5 2 15
% 1 . 0 7 3 .4 2 8 . 5 7 1 . 6 7T V 1 0 8 1 8 6 1 3 3
% 1 4 . 48 1 2 . 2 4 8 5 . 7 1 1 4 . 7 8
Refrigerator 14 2 5 2 1
% 1 . 8 8 1 . 3 6 7 1 . 4 3 2 . 3 3CD 3 1 3 5 3 9% 4 . 1 6 2 . 0 4 7 1 . 4 3 4 . 3 3
LPG 4 6 9 5 6 0
% 6 . 1 7 6 . 1 2 7 1 . 4 3 6 . 6 7Phone 8 2 1 11
% 1 .0 7 1 . 3 6 1 4 . 2 9 1 . 2 2
Mobile 88 2 1 4 113
% 1 1 . 8 1 4 . 2 9 5 7 . 1 4 1 2 . 5 6
F ur ni t ur e 2 4 6 5 0 5 3 0 1% 3 2 . 9 8 3 4 .0 1 7 1 . 4 3 3 3 . 4 4
HHothers 20 4 29 1 23 4
% 2 7 . 3 5 1 9 . 7 3 1 4 .2 9 2 6
Source: Based on the Primary data.
Table 30: Distribution of Households by the Type of Financial Assets Assets Hindu Muslim Sikh TotalSavings 43 2 70 6 508% 57.91 47.62 85.71 56.4 4Gold Silver 282 72 1 355% 37.8 48.98 14.29 39.44Financial Other 385 55 5 44 5% 51.61 37.41 71.43 49. 44Total 7 46 14 7 7 900Source: Based on the Primary data.
4.2.6 (b.) Value of Productive and Other AssetsEvaluation of per household value of productive and Other assets show Sikhs are
the most privileged class amongst the selected religious household categories. Muslims
show grim picture of their living status as they are o n the lowest rung of the ladder.
Table 31: Per Household Value of Productive and Other Assets
Asset Hindu Muslim Sikh Grand Total
Agricultural Imp lements 3158 .67 6 7 4 . 9 7 257942.86 4 7 3 4 . 6 5
Non-Agricultural Implements 119 .34 26. 87 0.00 1 0 3 .31
Transport 47 36 .2 6 58 67 .3 5 110800.00 574 6. 39
Modern Household Assets 217 9.0 6 1619 .59 346 57. 14 23 42 .2 8
Financial assets 8070 .44 497 7.5 5 73 214 .29 807 1. 94Total 12915 680 2371280 3842000 19 12 89 60
Per household value of productive andother Assets
18263 .7 7 13166.33 47661 4.29 20998.58
Source: Based on the Primary data.
Ta bl e 31 shows the cost of all productive assets, which the different communities
possess. Overall, the cost of agricultural inputs is high (Rs.4734). The value of financial
assets is Rs.8071, followed by modern assets like T.V., radio, mobile etc. Rs.2342, non-

7/26/2019 Final Report District Lucknow
http://slidepdf.com/reader/full/final-report-district-lucknow 65/86

7/26/2019 Final Report District Lucknow
http://slidepdf.com/reader/full/final-report-district-lucknow 66/86
56
7 5-9 0 1 0 0 1
% 0.13 0 0 0.11
90 & above 5 1 2 8
% 0.67 0.68 28.57 0.89
Grand Total 74 6 14 7 7 900
% 100 100 100 100Source: Based on the Primary data.
4.2.7 Status of Migration
Table 33 presents characteristics of migration of family members in surveyed
households in the district Lucknow. Out of total population of 900 households, 111 or
12.33 per cent people are reported to have migrated, in which the percentage of Hindu
migrants is higher (78 or 11.39 per cent) than that of Muslims (25 or 17.68 per cent).
Maximum migrants are of 20 - 40 years of age group, in which the proportion of Hindus is
higher (57 or 87.69 per cent) as compared to Muslims (15 or 23.0 per cent).
For livelihood 85 or 11.39 Hindus and 26 or 17.68 per cent Muslims have migrated outof their villages. None of the Sikhs have migrated out from their family in our surveyed
villages. Seven females from Hindus and 1 Female from Muslim community has migrated out.
Maximum Hindu and Muslim households have migrated for manual labour work, they are 60
and 18 in number respectively. From Hindus 6 and 11 persons have migrated for
sales/business work and professional, managerial and administrative work respectively. While
from Muslims 3 workers have migrated for caste occupation (see Table 32).
Most of the Hindus and Muslims migrated either within the district in rural or urban
areas. Few Hindus and Muslims have also migrated within the state (urban) and outside state
(urban). It was found during the survey that there were many young aspirants who were eager
to migrate outside the villages for work to earn their livelihood and to upgrade their family’s
economic status. Among Muslims 52.0 per cent were daily commuters, 32.0 per cent were
long term migrants and 20.0 per cent were short-term migrants. Among Hindus the pattern
and trend of migration is a bit different from Muslim migrants (see Table 32).
Table 33: Migration characteristics of working family membersMigrant Sex Hindus Muslim Sikh Grand Total
Men 78 2 5 0 103
Women 7 1 0 8
Total Migrants 85 26 0 111
Age of Migrants belo w 20 22 8 0 30
20-4 0 57 15 0 65
40-6 0 11 2 0 13
60 & above 2 1 0 3
Grand Total 85 2 6 0 11 1
Migrants Occupation
Professional/Managerial and Administrative work 11 0 0 1 1
Clerk/ Supervisor/ Accountants (Total) 4 0 0 4
Sales/ Business (Total) 6 5 0 1 1

7/26/2019 Final Report District Lucknow
http://slidepdf.com/reader/full/final-report-district-lucknow 67/86

7/26/2019 Final Report District Lucknow
http://slidepdf.com/reader/full/final-report-district-lucknow 68/86

7/26/2019 Final Report District Lucknow
http://slidepdf.com/reader/full/final-report-district-lucknow 69/86

7/26/2019 Final Report District Lucknow
http://slidepdf.com/reader/full/final-report-district-lucknow 70/86
60
PDS trader
4. Others 1 3 2 1 3 2 6 7 .6 9 1 1 4 5. 83 3 1 00 .0 0 1 4 6Total 1 95 1 95 100.00 2 4 100.0 3 100.00 2 22
Note: Figures in brackets indicate percentages.Source: Primary data based.
Households reported that they get average around 6 kg wheat, 8 kg rice, less than 1
kg sugar and 3 litres of kerosene per month. Among Hindu and Muslim communities the
quantity of ration is about the same. Overall 84 per cent sample households reported that
they are able to get their share of ration from PDS, however 16 per cent households were
not able to receive it. Those households who were not able to receive their share of ration
from PDS reported various problems like 10.81 per cent due to lack of money, 9.46 per
cent due to lack of supply of PDS, 13.96 per cent due to discrimination by PDS trader and
65.77 per cent due to many other reasons. Among Hindu and Muslim households more or
less the same situation was found.
4.3.2 Status and Awareness of SGSY
Overall less than half(44.56 percent) of the total 900 sample surveyed
households reported that they are aware about the SGSY government programmes,
except Muslim households were slightly lacking behind as 10.67 per cent reported to
be aware. In SGSY overall 5 households were benefited which are only 1.25 per cent of
the total aware households. Households belonging to Hindu and Muslim communities
were almost proportionately benefited with 4 and 1 household respectively. Most of
the selections for Hindu households were made by NGO/SHGs, Sarpanch and
Secretary while Muslim households were mostly selected by Sarpanch. Out of 26
Hindu households beneficiaries, 3 reported that they paid the commission. All the
beneficiary households reported that their families are benefited by the programme.
Table 38: Awareness about Government Programmes (%)
SGSY Hindu Muslim Sikh Total
Awareness Yes 2 9 3 39.28 96 65.31 7 100.00 3 9 6 44.00
Benefited Yes 4 1.37 1 1.04 0 0.00 5 1.26
Did you pay commission: Yes 1 25 0 0 0 0 1 20
NREGS Awareness Yes 2 60 34.85 46 31.29 3 42.86 309 34.33
Benefited Yes 1 0.38 0 0.00 0.00 1 0.32
IAY
Awareness Yes 568 76.14 94 63.95 7 100.00 669 74.33
Benefited Yes 4 8 8.45 8 8.51 0 0.00 56 8.37
Did you p ay c ommission: Yes 3 6.25 0 0 0 0 3 5.36
Old age /widowPension

7/26/2019 Final Report District Lucknow
http://slidepdf.com/reader/full/final-report-district-lucknow 71/86
61
Awareness Yes 598 80.16 10 3 70.07 7 100.0 70 8 78.67
Benefited Yes 114 19.06 15 14.56 1 14.3 130 18.36
Did you pay commission Yes 1 4 12.28 4 26.67 0 0.0 18 13.85
TSC/Swjaldhara
Awareness Yes 4 9 7 66.62 90 61.22 7 100.0 594 66.00
Benefited Yes 3 4 2 68.81 51 56.67 2 28.6 395 66.50
Did you pay commission Yes 5 1.46 0.00 0 0.0 5 1.27
_ARWSP
Awareness Yes 4 4 9 60.19 93 63.27 6 85.7 548 60.89
Benefited Yes 2 9 9 66.59 81 87.10 0 0.0 380 69.34
Did you pay commission Yes 1 1 3.68 1 1.23 0 0.0 12 3.16
Sarvasikhsa
Awareness Yes 6 6 1 88.61 130 88.44 7 100.0 7 9 8 88.67
Benefited Yes 353 53.40 82 63.08 1 14.3 4 3 6 54.64
Did you pay commission Yes 1 4 3.97 2 2.44 0 0.0 16 3.67Source: Based on the Primary data.
4.3.3 Status and Awareness of NREGA
Almost one third of the sample surveyed households informed that they are aware
about the NREGA programme. Hindu community seems to be well aware of the
programme and much ahead of Muslim community. Overall 0.32 per cent households
who were aware about the programme were benefited by NREGA. Only one household
reported benefit from the programme. None of the Muslims or the Sikhs reported availing
the benefit from the prevailing programme.
4.3.4 Status and Awareness of IAY
More than 74 per cent of all the surveyed households were found aware about theIndra Awas Yojana and even among the communities. In all 669 household were benefited
by IAY programme, in which 568 were Hindu and 94 were Muslim households. Mostly
Sarpanch and Secretary selected the Hindu household when Muslims were selected by
Sarpanch and NGO/SHGs. Among Hindus 3 and none Muslim households reported for
paying the commission for getting the IAY benefits. All the beneficiaries reported that
their families were benefited.
Another scheme of Old Age/Widow Pension is known among more than 78.67 per
cent households in our survey. Among 708 aware households about the scheme, only 130
or 18.36 per cent households reported benefited. Among Hindu and Muslim communities
114 and 15 households respectively reported benefited. Most of the beneficiaries were
selected by Sarpanch. Among beneficiaries, 14 Hindus and 4 Muslims reported paying
commission. All the beneficiaries reported their families were benefited.
4.3.5 Status and Awareness of TSC Swajaldhara

7/26/2019 Final Report District Lucknow
http://slidepdf.com/reader/full/final-report-district-lucknow 72/86

7/26/2019 Final Report District Lucknow
http://slidepdf.com/reader/full/final-report-district-lucknow 73/86

7/26/2019 Final Report District Lucknow
http://slidepdf.com/reader/full/final-report-district-lucknow 74/86
64
Among total 1202 sick persons 315 persons reported were admitted in hospital.
Among overall total 258 Hindu patients 26.35 per cent, among 52 Muslim patients
24.30 per cent and out of total 1202 patients 26.21 per cent patients were hospitalized.
It was found that due to lack of health services, the patients with serious diseases
could not get admission in hospitals. Average expenditure incurred by the patients is
more amongst Sikhs followed by Muslims and Hindus (see Table 41).
4.4.3 Status of Immunization among Children
Overall proportion of immunization among Hindu children is higher than the
children of Muslim community. Among Hindu and Muslim children the immunization
against polio is highest followed by BCG, small pox/chicken pox DPT/Diphtheria and
the least for hepatitis (see Table 42). The respondents were enquired about the
immunization of their children up to the age of 5 years. It was reported that maximum
(87.99 percent) children were given polio drops. It was higher in case of children of
Hindus (91.53 per cent) as against the Children of Muslims (73.53 percent). The
percentage of immunization of Muslim children was found to be lower to that of
Hindu children in case of entire four major diseases (Table 42).
With regard to the place of immunization we come across the fact that
Asha/Midwife are the favourite source for immunization amongst the villagers
followed by government hospitals for the 24.95 percent of the vaccinations.
Table 42: Immunization of Children(5 years of age)
Details of Vaccination Hindu % Muslim % Sikh % All %
Polio 40 0 91.53 7 5 73.53 1 50.00 4 7 6 87.99
Diphtheria 32 3 73.91 6 1 59.80 1 50.00 385 71.16
BCG 388 88.79 6 8 66.67 1 50.00 457 84.47
Small pox 34 1 78.03 6 3 61.76 1 50.00 405 74.86
Hepatitis 251 57.44 52 50.98 1 50.00 304 56.19
Total No. of Children
below 5 years 437 - 102 - 2 - 541 -
Where Vaccinated
Govt Hospital 89 20.37 44 43.14 2 100.00 135 24.95
Private Hospital 19 4.35 9 8.82 0 0.00 28 5.18
Midwife/ASHA 326 74.60 48 47.06 0 0.00 374 69.13
Untrained Dai 3 0.69 1 0.98 0 0.00 4 0.74
Others 0 0.00 0 0.00 0 0.00 0 0.00Source: Based on the Primary data.

7/26/2019 Final Report District Lucknow
http://slidepdf.com/reader/full/final-report-district-lucknow 75/86
65
4.6 Status of Housing and Amenities
4.6.1 Housing Status
The ownership of houses is of two types in rural areas of Lucknow district.
One is the self ownership and other is the houses provided under the Indira Awas
Yojana. It is to be recorded here that the percentage of Muslims who have been given
houses under the Indira Awas Yojana is higher to that of the Hindus in the district
(Table 43). Among surveyed Hindu and Muslim households 92.23 and 91.16 per cent
are respectively owners of their houses, while 7.51 and 6.8 per cent have Indra Awas or
government houses.
Table 43: Distribution of Households by the Type of Ownership of Houses
Ownership Hindu Muslim Sikh Grand Total
Ow n 688 134 7 82 9
% 92.23 91.1 6 100 92.11
Indira Awas/Govt. 56 10 66% 7.51 6.8 0 7.33
Rented 2 3 5
% 0.2 7 2.04 0 0.56
Grand Total 7 4 6 147 7 900
% 100 100 100 100
Source: Based on the Primary data. Table 44: Distribution of Households by the Type of Houses
Hindu % Muslim % Sikh %GrandTotal
%
Thatched 218 29.22 4 6 31.29 0 26 4 29.33
Khaprail/Khaprail 92 12. 33 14 9.52 0 106 11. 78
Semi-Pucca 303 40.62 56 38.1 1 14.29 36 0 40Pucca 114 15.28 2 3 15.65 6 85.71 14 3 15.89
Others 19 2.55 8 5.44 0 27 3
Grand Total 7 4 6 100 147 100 7 100 900 100Source: Based on the Primary data.
About one-third houses are thatched, in which Muslim’s proportion is higher.
Similarly more than 15 percent houses are pucca but here pucca houses belonging to
Hindus and Muslims are comparatively less than Sikhs. Semi-pucca are 40 percent.
About 40 per cent houses have only one room, among Hindus 38.47 and Muslims
40.82 per cent. About 36.86 per cent houses belonging to Hindu and 39.46 per cent belonging to Muslims are with two rooms. Houses with 6 and above rooms a re 1.47 per
cent with Hindus and 0.68 per cent with Muslims.
Table 45: Distribution of Households by the Number of Rooms
Hindu % Muslim % Sikh %Grand
Total%
One 287 38.47 60 40.82 0 0.00 347 38.56
Two 275 36.86 58 39.46 2 28.57 335 37.22

7/26/2019 Final Report District Lucknow
http://slidepdf.com/reader/full/final-report-district-lucknow 76/86
66
Three 116 15.55 17 11.56 0 0.00 133 14.78
Four 44 5.90 8 5.44 5 71.43 57 6.33
Five 13 1.74 3 2.04 0 0.00 16 1.78
Six & Above 11 1.47 1 0.68 0 0.00 12 1.33
Total 746 100.00 147 100.00 7 100.00 900 100.00
Source: Based on the Primary data.
Classification of Households according to the area of houses we find that 81.11
percent of households are in the category of below 500 sq. ft of area. Amongst Sikhs
we have that 57.14 percent of their households have area 1000-5000 sq. ft of area.
Situation of Hindus and Muslims are not stated to be much different.
Table 46: Classification of Households According to the Area of Houses
Coverd Area Hindu % Muslim % Sikh %GrandTotal
%
Below 500 6 0 3 8 0. 83 1 2 4 8 4. 35 3 4 2 .8 6 7 3 0 8 1 .1 1
1000-5000 3 2 4.2 9 5 3.4 4 57.14 41 4.56500-1000 109 14.61 18 12.24 0 12 7 14.1 1
5000 & above 2 0.2 7 0 0 2 0.22
Grand Total 7 4 6 100 14 7 100 7 1 00 900 100Source: Based on the Primary data.
Table 47 demarcates the value of the houses of the respondents. It is
interesting to note that the rural households fall in the category of have nots as their
house’s valuation stands in the category of below Rs. 50,000. 57.14 percent Sikhs
claimed that the value of their house is 200,000 and above category thus proclaiming
to be the richer lot amongst the respondents.
Table 47: Classification of Households According to the
Value of their Houses
Value (000Rs) Hindu % Muslim % Sikh %GrandTotal
%
Below 50 515 69.03 101 68 .7 1 2 28.57 61 8 68.67
50-100 163 21.85 2 5 17.01 1 14 .29 189 21
100-200 4 5 6.03 13 8.84 0 58 6.4 4
200 & above 2 1 2.82 4 2 . 7 2 4 5 7 .14 2 9 3 . 2 2
Rented House 2 0.27 4 2. 7 2 0 6 0.6 7
Grand Total 74 6 100 14 7 10 0 7 100 900 100Source: Based on the Primary data.
Table 48: Distribution of Households according to Sources of Homestead
Homeland Hindu % Muslim % Sikh %GrandTotal
%
own 681 91.29 132 89.8 6 85.71 819 91

7/26/2019 Final Report District Lucknow
http://slidepdf.com/reader/full/final-report-district-lucknow 77/86
67
Provided by Government
Panchayat 54 7.24 9 6.12 1 14.29 64 7.11
Landlords Land 8 1.07 5 3. 4 13 1.4 4
Others 3 0.4 1 0.68 4 0.44
Grand Total 74 6 100 147 100 7 100 900 100Source: Based on the Primary data.
The table 47 shows that around 91 per cent of total homestead are owned. Around 7.11 per cent has been provided by government. There is no major difference
across the religious groups of Hindu and Muslim as far the ownership of homestead is
concerned.
4.6.2 Status of Housing Amenities
More than 81 per cent houses have no electric connection. Sikh houses are the most
electrified households with 85.71 percent being electrified, followed by Muslims (25.85
percent) and Hindus (17.02 percent).
Table 49: Distribution of Households by the Electrification and
Sources of Lighting
Hindu % Muslim % Sikh %GrandTotal
%
Electrified: Yes 127 17.02 3 8 25.85 6 85.71 17 1 19.00
Electrified: No 619 82.98 109 74. 15 1 14. 2 9 729 81.00
Total 74 6 100 147 100 7 100 900 100.00
Oil lamp 556 74.53 105 71 .43 0 0 661 73.44
Lantern 4 5 6.03 3 2.04 1 14 .29 4 9 5.44
Petromax 1 0.13 1 0.68 0 0 2 0.22
Others 17 2. 28 0 0 0 0 17 1.8 9
Grand Total 74 6 100 14 7 100 7 100 900 100.00Source: Based on the Primary data.
The majority of houses are still using Kerosene oil lamp for lighting of their
houses (Table 50). This is true also in case of Muslim and Hindu houses but it has
been reported that 71.43 per cent of Muslim houses are using oil lamp while 74.53 per
cent of the Hindu households use oil lamp.
Table 50: Classification of Households According to Sources ofDrinking Water
Hindu % Muslim % Sikh %GrandTotal
%
Own Hand-pump 197 26.41 3 3 22.4 5 3 42.8 6 23 3 25.89
Public Hand-pumps 495 66. 35 9 9 67 .3 5 2 28.57 596 66 .2 2
Tap in dwelling 2 4 3.22 10 6.8 0 2 28.57 36 4.00
Own protected well 4 0.54 0. 00 0.00 4 0. 44

7/26/2019 Final Report District Lucknow
http://slidepdf.com/reader/full/final-report-district-lucknow 78/86
68
Own Unprotected wel l 13 1.74 1 0.68 0.00 14 1.56
Public Unprotected wel l 9 1. 21 1 0.68 0.00 10 1.11
Public Protected well 1 0.13 2 1. 3 6 0.00 3 0. 33
Public tab 0.00 0. 00 0.00 0.00
Pond/River/Stream 1 0.13 0. 00 0.00 1 0. 11
Others 1 0.13 0.00 0.00 1 0.11
(blank) 1 0.13 1 0.6 8 0.00 2 0.22
Grand Total 74 6 100. 00 1 4 7 100.00 7 100.00 90 0 10 0.00Source: Based on the Primary data.
More than 25 per cent houses either owned hand pumps. Highest proportion of
the household (66.22 percent) depends on Public hand pumps. About little less than
half of houses have drinking water source within the premises and about 66.22 per
cent households got water at a distance upto 100 metres. Only 25 percent households
have the privilege of having water facility within house premises.
Table 51: Classification of Households According to Distance from Sourcesof Drinking Water
Distance Hindu % Muslim % Sikh % All %
With in House 197 26.41 33 22.45 3 42.86 233 25.89
Up to 100 meters 495 66.35 99 67.35 2 28.57 596 66.22
100-250 meters 46 6.17 7 4.76 2 28.57 55 6.11
Above to 250 meters 8 1.07 8 5.44 0 0.00 16 1.78
Total 746 100.00 147 100.00 7 100.00 900 100.00Source: Based on the Primary data.
About 91.82 per cent Hindus and 71.43 per cent Muslims don’t have toilet
within their premises. About 76.0 per cent households either use wood or cow-dung as
source of fuel. (see Table 51).
Table 52: Classification of Households According to Toilet facility
Toilet Facility Hindu % Muslim % Sikh %GrandTotal
%
In house 61 8.18 4 2 28.57 6 85.71 109 12.11
Outside House 685 91.82 105 71 .4 3 1 14 .2 9 79 1 87. 89
Grand Total 7 46 100 147 100 7 100 900 100.00
Toilet Type 0 0 0 0.00
1 Septic tank latrine 20 2.68 7 4. 76 2 28.57 29 3.222 In the dwelling/ water-sealed 26 3.4 9 15 10.2 4 57.1 4 4 5 5.00
3 Pit latrine 28 3. 75 19 12.9 3 0 0 47 5.22
4 Covered dry latrine 2 0.2 7 3 2.04 0 0 5 0.56
5 In the community/ water sealed 3 0.4 0 0 0 3 0.33
6 In the field 660 88.47 10 1 68.71 1 14 .2 9 762 84.67
7 Others 7 0.94 2 1.3 6 0 0 9 1.00
Grand Total 74 6 100 147 100 7 100 900 100.00Source: Based on the Primary data.

7/26/2019 Final Report District Lucknow
http://slidepdf.com/reader/full/final-report-district-lucknow 79/86

7/26/2019 Final Report District Lucknow
http://slidepdf.com/reader/full/final-report-district-lucknow 80/86

7/26/2019 Final Report District Lucknow
http://slidepdf.com/reader/full/final-report-district-lucknow 81/86
71
Employment 103 13. 81 32 21. 77 0 0.0 135 15.00
Sanitation 459 61.53 81 55.10 1 14.3 541 60. 11
Total 7 4 6 100.00 147 100.00 7 100.0 900 100.00Source: Based on the Primary data.
In another following table three major deprivations of families was asked in
which maximum 83.67 per cent told for employment followed by 52.67 per cent forhealth facilities, 47.33 per cent for house, 32.0 per cent for education, 29.56 per cent
for land and 26.0 per cent for skill. These orders of deprivations should be the
priorities in the agenda of government planning and policy formulation (see Table 58).
Table 5 8: Households Reporting three most important deprivations intheir families
Data Hindu % Muslim % Sikh % Grand Total %
Land 23 0 30.83 36 24.49 0 0.0 266 29.56House 366 49.06 59 40.14 1 14.3 426 47. 33
health 380 50.94 90 61.22 4 57.1 474 52.67
Education 234 31.37 51 34.69 3 42.9 288 32.00
Employment 624 83.65 12 4 84.35 5 71.4 753 83.67
Skill 199 26.68 3 1 21.09 4 57.1 234 26.00
Electricity/Water 12 1.61 2 1. 36 1 14.3 15 1.6 7
Others 189 25.34 4 5 30.61 3 42.9 237 26.33
Total 74 6 100.00 147 100.00 7 100.0 900 100.00Source: Based on the Primary data.

7/26/2019 Final Report District Lucknow
http://slidepdf.com/reader/full/final-report-district-lucknow 82/86
72
CHAPTER V
DEVELOPMENT GAPS AND REMEDIES THEREOF
In the preceding chapters, socio-economic development status has been
examined at the three levels: Firstly at the district level, secondly at the village level
and finally at the household level to fully articulate the constraints and chalk out
policies for eradication of such constraints thereof. In this chapter, critical
development gaps have been identified in relation to three spatial levels, i.e. (I)
Lucknow District as a whole; (II) Village level and (III) Household level.
Ø The first and probably among the most significant aspects which needs to be
taken care of is the fact that the condition of housing has been found to be quite
unsatisfactory and receives top priority. Although IAY has contributed to
certain extent the larger section of people living below poverty line has not yet
been covered by any housing programme.
Ø To top the list is the problem of employment. As most of the population is
reported in the age group of 0-14 i.e. child or 15-30 age group the working age
population. With increase in education the so called educated lot hesitates to
take up farming activities and roam about in search of job.
Ø The issue that needs top priority based on our field survey is the problem of
employment and th is was highlighted by 82 percent of the respondents and the
leading issue to be handled.
Ø Health services are not properly developed in the area. Most of the child births
takes place within household premises and hence needs proper attention. The
number of both PHCs and CHCs are much below the prescribed norm. Because
the sick are not getting proper medical attention in the government hospitals,
they are forced to be dependent on private practitioners and even the jhola
chap doctors. Because the income levels are low a sizeable number of
households who are indebted to meet their medical requirements. It is,
therefore, a matter of top priority that the PHCs and CHCs should be properly
manned and the facilities, which they are supposed to offer, should be available
all the year round in general and specifically during period when seasonal
ailments are common. In this connection it is equally important to ensure the
availability of safe drinking water and ensure proper drainage facilities.

7/26/2019 Final Report District Lucknow
http://slidepdf.com/reader/full/final-report-district-lucknow 83/86

7/26/2019 Final Report District Lucknow
http://slidepdf.com/reader/full/final-report-district-lucknow 84/86

7/26/2019 Final Report District Lucknow
http://slidepdf.com/reader/full/final-report-district-lucknow 85/86

7/26/2019 Final Report District Lucknow
http://slidepdf.com/reader/full/final-report-district-lucknow 86/86
Ø Plantation of trees should be encouraged by government as well as private
parties to enhance environmental balance.
Ø Chemical fertilizer usage should be replaced by compost fertilizers and
awareness regarding its usefulness should be spread.