final report: issues in the design and implementation of ... · pdf fileissues in the design...
TRANSCRIPT

FINAL REPORT:
Issues in the Design and Implementation of Drug Formularies and Therapeutic Classes
NORC PROJECT NO. 6270 SEPTEMBER 28, 2005
TASK ORDER #04EASPE00902 / CONTRACT #100-03-0020
SUBMITTED TO: STEVE SHEINGOLD OFFICE OF THE ASSISTANT SECRETARY FOR PLANNING AND EVALUATION US DEPARTMENT OF HEALTH AND HUMAN SERVICES 200 INDEPENDENCE AVE., SW ROOM 443E WASHINGTON, DC 20201 PRESENTED BY: NATIONAL OPINION RESEARCH CENTER (NORC) AT THE UNIVERSITY OF CHICAGO 1350 CONNECTICUT AVENUE, N.W., SUITE 500 WASHINGTON, D.C. 20036 (202) 223-6040
STAFF WORKING ON THIS PROJECT: THE NORC-GEORGETOWN PROJECT TEAM NORC Katie Merrell, Co-Project Director Elizabeth Hargrave, Project Manager Nicole Brunda Sreelata Kintala Michael Wittie Georgetown University Jack Hoadley, Co-Project Director Harriet Komisar Ellen O’Brien Andrea Kastin Lauren Klugherz Consultants Cathy Harrington Robert Rubin

TABLE OF CONTENTS
EXECUTIVE SUMMARY 1
1. INTRODUCTION 3
2. CLASSIFICATION SYSTEMS AND FORMULARIES 5 BACKGROUND 5 METHODOLOGY 5 ROLE, STRUCTURE, AND CONTENT OF CLASSIFICATION SYSTEMS 6 THE P&T COMMITTEE PROCESS 7 POLICY IMPLICATIONS: CLASSIFICATION SYSTEMS, FORMULARIES, AND P&T COMMITTEES 9
3. THE USP CLASSIFICATION SYSTEM 10 BACKGROUND: HOW DOES THE USP CLASSIFICATION SYSTEM WORK? 10 POLICY IMPLICATIONS: THE USP SYSTEM 13
4. THE CMS RULES FOR FORMULARIES 16 BACKGROUND: HOW DO THE CMS FORMULARY RULES WORK? 16 COVERAGE OF COMMONLY USED DRUGS UNDER CMS RULES 17 POLICY IMPLICATIONS: ADEQUACY OF COVERAGE UNDER THE CMS RULES 19 WOULD “REAL WORLD” FORMULARIES MEET CMS RULES? 19 POLICY IMPLICATIONS: WILL “REAL WORLD” FORMULARIES PASS THE CMS TESTS? 21
5. FORMULARY ANALYSIS MODEL 22 BACKGROUND 22 METHODOLOGY: THE FORMULARY SIMULATION MODEL 25 PROTOTYPE FORMULARIES IN THE MODEL 30 POLICY IMPLICATIONS: ANALYZING PROTOTYPE FORMULARIES 31 “REAL WORLD” FORMULARIES IN THE MODEL 32 POLICY IMPLICATIONS: POTENTIAL FOR RISK SELECTION 32 POTENTIAL FOR REFINING THE MODEL 32
6. CONCLUSIONS AND POSSIBLE FUTURE RESEARCH 34
APPENDICES 37 CLASSIFICATION SYSTEMS AND FORMULARIES 37
Appendix A: Tables describing classification systems and formularies 37 Appendix B: Crosswalks showing drugs as classified by different systems 37 Appendix C: Information from plan interviews 37
USP CLASSIFICATION SYSTEM AND CMS RULES 37 Appendix D: MCBS utilization by USP class and category 37 Appendix E: Commonly used drugs 37 Appendix F: Do “real world” formularies meet CMS tests? 37
FORMULARY ANALYSIS MODEL 37 Appendix G: Additional information on elasticity 37 Appendix H: Elasticity panel members 37 Appendix I: Additional information on model 37 Formulary Simulation Model 37

EXECUTIVE SUMMARY As part of the Medicare Part D pharmacy benefit scheduled for implementation in 2006 by the Medicare Prescription Drug, Improvement, and Modernization Act (MMA), beneficiaries will have a choice of private plans administering the benefit. Although plans are required to provide access to needed drugs, the law does not require plans to provide equal coverage for all drugs. Instead, it is expected that plans will offer a variety of packages that cover different drugs at different levels of cost-sharing. The Secretary may develop policies around drug classification systems, formularies, or cost tiers to enforce the statutory provision that allows him to disallow arrangements that discriminate against certain beneficiaries. This would be particularly important if there is evidence that plans use these design elements as ways to avoid enrolling high-risk beneficiaries or that beneficiaries cannot effectively shop in this market. In preparation for implementation of the pharmacy benefit, ASPE asked a team from NORC and Georgetown University to research current formularies and classification schemes, and to model how beneficiaries might react to formularies under the Part D benefit. Health plans and other users of prescription drug data use a wide variety of schemes for organizing information about the thousands of drugs on the market. The MMA asked the US Pharmacopeia (USP) to develop a benchmark classification scheme that can be used as the basis of comparison for formularies submitted by prospective private drug plans (PDP). We found that the USP scheme has a level of detail that falls in the middle of a continuum, with some schemes having more classes and levels, and some having fewer. We also found that the USP scheme leaves out some commonly used drugs, most notably combination drugs. Plans are required to establish their formularies with the assistance of Pharmacy and Therapeutics (P&T) Committees. In interviews with pharmacy directors, we found that some of the MMA requirements for the structure and operations of P&T Committees are already common practice, while others will require changes. In particular, most plans we spoke with will have to make the decisions of their P&T Committees more binding, and many will have to increase their committees’ independence. Under Part D, plans can establish their own formularies and classification systems, subject to CMS’ verification that they are not discriminatory. Plans will have “safe harbor” if they follow several rules relating to the USP classification system, such as: 1. At least one drug in each USP key drug type must be covered. 2. At least two drugs in each USP class must be covered. 3. All or substantially all drugs in the antidepressants, antipsychotics, anticonvulsants, antiretrovirals, immunosuppressants, and antineoplastics classes must be covered. 4. There should be appropriate access to drugs listed in widely accepted national treatment guidelines. 5. Drugs should only be on a higher tier only when therapeutically similar drugs are available on a lower tier.
1

In addition, CMS will check drug lists against risk adjustment categories to avoid drug selection and discrimination. Although these rules seem straightforward, there are many nuanced policy issues surrounding how drugs are counted, such as how to treat differing forms or strengths of the same drug. To analyze how these CMS rules will affect plan choices about which drugs to cover, we ran two tests. First, we asked whether drugs commonly used by Medicare beneficiaries would be covered by a plan that tried to cover only two drugs per class and one drug per key type. In 28 of the 146 classes, a minimally acceptable formulary would not cover all drugs that had at least 500,000 prescriptions filled by Medicare beneficiaries in 2001. Second, we compared four sample formularies to these rules. The plans failed the minimum requirement for about one third of all classes. They consistently failed to list all of the drugs in the list of classes in which all drugs must be covered. These results indicate plans will need to adjust current formularies to participate in Part D, or make arguments to CMS about why their existing formularies are adequate. Finally, we constructed a model that simulates beneficiaries’ responses to plan decisions about formulary placement and cost sharing. This model is based on a theoretical understanding of how beneficiaries are likely to respond to price incentives, as well as expert clinical opinion about the likelihood that beneficiaries will change drugs in response to price. We included six classes of drugs with a range of price levels and generic availability, accounting for nearly half of all prescriptions filled by Medicare beneficiaries. Tests of the simulation model with prototype formularies show that coinsurance provides more behavioral incentives than copayments, and that tiered cost sharing can further strengthen those incentives. In addition, a closed formulary will cause some beneficiaries to change to an on-formulary drug, but others will continue taking the off-formulary drug and face higher out-of-pocket costs. When we compared real-world formularies in the model, we saw similar results. In addition, the model provides a tool for identifying the potential for risk selection: one plan in our study was relatively expensive for all classes except cholesterol drugs, leading to the possibility that it might attract beneficiaries who only take one of those drugs.
2

1. INTRODUCTION The Medicare Prescription Drug, Improvement, and Modernization Act (MMA) created a new outpatient drug benefit for Medicare beneficiaries, designated as Medicare Part D. The MMA relies on competition among private drug plans (PDPs) and Medicare Advantage (MA) plans as the basis for offering the Part D benefit. The plans are at risk for the cost of the benefit (although the risk is tempered through reinsurance and risk sharing mechanisms), and thus plans have a significant incentive to control costs. The MMA expects private plans to provide a drug benefit of an acceptable quality to beneficiaries, so includes several provisions to ensure that beneficiaries maintain access to needed drugs. In general, plans are expected to offer beneficiaries all needed drugs, and the standard benefit presented in the statute would cover those drugs with a fixed 25 percent coinsurance. But the law does not require plans to use a predetermined drug classification system, formulary, or cost sharing. Instead, plans have flexibility to limit the drugs they cover through a formulary and to provide incentives to use preferred drugs through tiered cost sharing. It is likely that most plans will offer a variety of packages that cover different drugs at different levels of cost sharing. Plans can use formularies – lists of preferred or covered drugs -- to control costs by steering enrollees to use lower-cost drugs. In addition, plans can negotiate manufacturer rebates on a particular drug in exchange for demonstrating the ability to shift consumers to that drug and away from the drug’s competitors. The use of formularies has grown dramatically in the private sector. According the Kaiser/HRET survey of employer health benefits, 71 percent of employees in 2003 were enrolled in a plan that used formularies, compared to just 43 percent of employees in 2000.1
Formularies can be either “closed” – in which there is no coverage at all for non-formulary drugs – or “open” – in which non-formulary drugs are covered, but plans use incentives to encourage their enrollees to use the preferred drugs on the formulary. Most private sector plans have responded to their enrollees’ desire for more choice by creating open formularies.2 There is some evidence that in Medicare+Choice plans, closed formularies have been more common. In 2002, about 37 percent of M+C enrollees were in a plan with a closed formulary.3 The Veterans Health Administration began using a closed formulary for some drug classes in 1997. To give enrollees clear incentives to follow the formulary or use cheaper drugs, plans often use tiered cost sharing. A common incentive structure used with open formularies (accounting for 63 percent of covered workers in 2003) 4 is a three-tier copay. These employees pay a low copay (e.g., $9) for generics, more (e.g. $19) for “preferred,” on-formulary brand name drugs, and the most (e.g. $29) for “non-preferred,” off-formulary drugs. Closed formularies may also use tiered cost-sharing for covered drugs, for example, by creating a different copay for brands vs. generics. 1 Kaiser Family Foundation and Health Research and Education Trust, Employer Health Benefits: 2003 Annual Survey. Menlo Park and Chicago, 2003. 2 Takeda Prescription Drug Benefit Cost and Plan Design Survey Report, 2001 edition. Pharmacy Benefit Management Institute, Inc., 2002. 3 Achman, Lori, and Marsha Gold, Trends in Medicare+Choice Benefits and Premiums, 1999-2002, The Commonwealth Fund, November 2002. 4 Kaiser Family Foundation and Health Research and Education Trust, Employer Health Benefits: 2003 Annual Survey. Menlo Park and Chicago, 2003.
3

Other incentives that plans can use to steer enrollees to use drugs on the formulary or on preferred tiers of that formulary include the following: Prior authorization: The pharmacist or physician must obtain authorization from the plan before an enrollee can fill a prescription for a drug. Step therapy: Enrollees must try a less expensive drug before receiving coverage for a more expensive drug. For example, they must try ibuprofen first, then naproxen sodium, and only if neither of those works would coverage be approved for a Cox-2 inhibitor. Therapeutic substitution: The pharmacist contacts the prescribing physician when an enrollee tries to fill a prescription for a non-formulary drug, and asks to switch the enrollee to an on-formulary drug. Patient and prescriber education: Some plans contact patients and prescribers to let them know a lower-cost drug is available. The Secretary has statutory authority to disallow arrangements that discriminate against certain beneficiaries. Through regulations and regulatory guidance, HHS has developed policies around formularies, cost sharing, and other utilization management practices to enforce this statutory provision. This oversight could be particularly important if plans use design elements as ways to avoid enrolling high-risk beneficiaries, or if beneficiaries can not effectively shop in this market. A number of issues may arise with regard to formularies and benefit design under the new benefit. Plans face competing incentives toward offering broader or more restrictive formularies, within the bounds of the regulatory provisions that a formulary must meet. Broad formularies would ensure better access to many drugs and potentially make the plan more attractive to potential enrollees. But more restrictive formularies may enhance plans’ leverage in obtaining price concessions from manufacturers, thus making it easier for them to balance their books and to offer an attractive premium in the competitive marketplace. Restrictive formularies, however, increase the chance of disputes with beneficiaries and place more reliance on an effective exceptions and appeals process. Plans offering broad formularies may rely more on cost management tools such as sharply tiered cost sharing, step therapy, or prior authorization to limit the use of more expensive drugs. Some observers speculate that plans may prefer to offer broad formularies in the first years of the benefit in order to attract enrollment and survive in a marketplace that may have a large number of players. But those that achieve strong market shares may turn to more restrictive formularies or more tiered cost sharing in later years to control costs. In preparation for implementation of the pharmacy benefit, ASPE asked a team from NORC and Georgetown University to research current formularies and classification schemes, and to model how beneficiaries might react to formularies under the Part D benefit. The goal was to understand better current formulary practice in the private sector, with an eye toward learning whether the rules developed to enforce the MMA are generally consistent with current practice. The project further aims to understand the range of formularies that might be permissible under the MMA rules and to shed light on the potential degree to which beneficiaries might need to switch medications as a result of allowable formularies. Still, it is important to recognize that, although the findings of this project are based roughly on a set of private-sector formularies, they are not based on formularies that may be offered by Medicare Part D plans. Thus, they provide a framework for thinking about the role formularies may play in Part D but cannot project actual behavior under the new Medicare benefit.
4

2. CLASSIFICATION SYSTEMS AND FORMULARIES Background Classification systems and formularies are intertwined features of the way health plans establish what drugs are available to their enrollees. Formularies are essentially lists of covered drugs, and they are rarely presented without some type of classification system. But classification systems often serve other purposes for their users. This section describes classification systems and formularies, as well as the pharmacy and therapeutic (P&T) committees that insurers and pharmacy benefit managers (PBMs) use to make decisions. To make order out of the thousands of pharmaceutical products on the market, insurers, hospitals, and other entities find it helpful to organize drugs into hierarchical classification systems. Systems are organized around a mix of therapeutic mechanisms, organ systems, diseases, and chemical structure. Every system is different, and there is little consensus about which methodology is best. While classification schemes organize drugs into categories, the important function of formularies is to describe which drugs are covered by a health plan and how much enrollees must pay for those drugs. Payers ranging from private plans to the Veterans’ Administration have relied on formularies and tiered pricing to manage pharmacy costs. Technically, Medicaid programs cannot use a formulary, but quite a few states have developed preferred drug lists (PDLs) that provide them a basis for negotiating supplemental rebates with manufacturers. Methodology In this project, we studied six classification schemes: USP Model Guidelines Redbook (based on AHFS) VA National Drug File FDA (based on AMA Drug Evaluation) IMS Health Uniform System of Classification CMS Drug Card Guidance In addition, we studied publicly available formularies from ten entities: Blue Cross/Blue Shield Federal Employees’ Plan Pacificare Federal Employees’ Plan Kaiser Permanente Mid-Atlantic Federal Employees’ Plan Medco “Preferred Prescription” plan Presbyterian Health Plan Connecticare VA’s Core Formulary Florida Medicaid Michigan Medicaid Oregon Medicaid
5
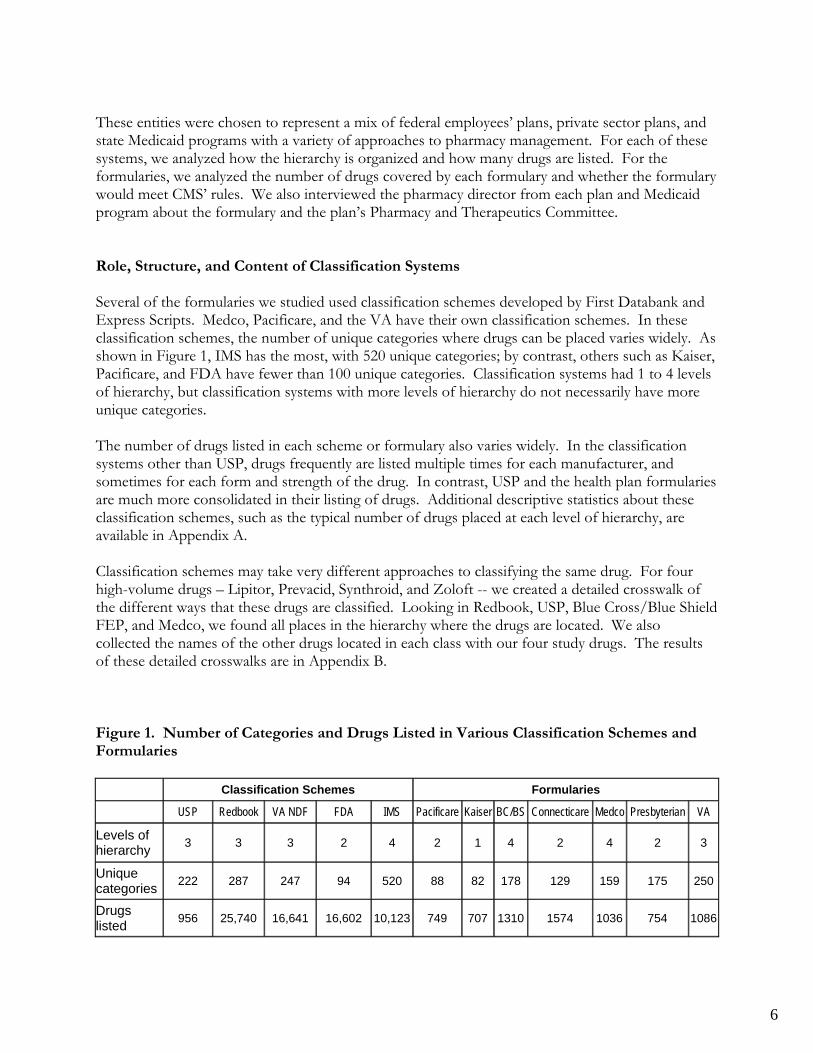
These entities were chosen to represent a mix of federal employees’ plans, private sector plans, and state Medicaid programs with a variety of approaches to pharmacy management. For each of these systems, we analyzed how the hierarchy is organized and how many drugs are listed. For the formularies, we analyzed the number of drugs covered by each formulary and whether the formulary would meet CMS’ rules. We also interviewed the pharmacy director from each plan and Medicaid program about the formulary and the plan’s Pharmacy and Therapeutics Committee. Role, Structure, and Content of Classification Systems Several of the formularies we studied used classification schemes developed by First Databank and Express Scripts. Medco, Pacificare, and the VA have their own classification schemes. In these classification schemes, the number of unique categories where drugs can be placed varies widely. As shown in Figure 1, IMS has the most, with 520 unique categories; by contrast, others such as Kaiser, Pacificare, and FDA have fewer than 100 unique categories. Classification systems had 1 to 4 levels of hierarchy, but classification systems with more levels of hierarchy do not necessarily have more unique categories. The number of drugs listed in each scheme or formulary also varies widely. In the classification systems other than USP, drugs frequently are listed multiple times for each manufacturer, and sometimes for each form and strength of the drug. In contrast, USP and the health plan formularies are much more consolidated in their listing of drugs. Additional descriptive statistics about these classification schemes, such as the typical number of drugs placed at each level of hierarchy, are available in Appendix A. Classification schemes may take very different approaches to classifying the same drug. For four high-volume drugs – Lipitor, Prevacid, Synthroid, and Zoloft -- we created a detailed crosswalk of the different ways that these drugs are classified. Looking in Redbook, USP, Blue Cross/Blue Shield FEP, and Medco, we found all places in the hierarchy where the drugs are located. We also collected the names of the other drugs located in each class with our four study drugs. The results of these detailed crosswalks are in Appendix B. Figure 1. Number of Categories and Drugs Listed in Various Classification Schemes and Formularies Classification Schemes Formularies
USP Redbook VA NDF FDA IMS Pacificare Kaiser BC/BS Connecticare Medco Presbyterian VA
Levels of hierarchy 3 3 3 2 4 2 1 4 2 4 2 3
Unique categories 222 287 247 94 520 88 82 178 129 159 175 250
Drugs listed 956 25,740 16,641 16,602 10,123 749 707 1310 1574 1036 754 1086
6

Figure 2. Multiple Classifications for Zoloft
USP instance 1
USP instance 2 Redbook BCBS
instance 1 BCBS
instance 2 Medco
Level 1 Antidepressants Anxiolytics Central Nervous System Agents Psychiatric Psychiatric Autonomic & CNS,
Neurology & Psych
Level 2 Reputake Inhibitors Antidepressants Psychotherapeutic Agents
Depression/ Obsessive Compulsive Disorders Anxiety Psychotherapeutic
Drugs
Level 3 SSRIs Antidepressants Antidepressant Agents
Level 4 SSRIs As one example, Figure 2 shows the many ways that Zoloft is classified in these four schemes. This example shows differences in the fundamental nature of the classification systems: some are based on diagnosis (depression, anxiety), while others are based on body systems (central nervous system). Some systems put the drug in more than one place based on uses of the drug for different diagnoses, while others select just one location, based on the most common use (antidepressant). Finally, we note that some classification systems create a class specifically for SSRIs, while others stop at a less detailed classification. In general, plans indicated that they used their classification schemes as a way to organize discussions about which drugs to include on their formulary. Most plans review coverage decisions on a class-by-class basis, coming back to each class once every year or two. They may also use classifications as a way to organize utilization data for review. With the exception of expensive drugs requiring prior authorization, however, plans do not track whether drugs are being used in the way described by the classification scheme. Some plans choose an organizational scheme by default – they use the scheme that their pharmacy benefits manager (PBM) or their claims processor uses. Others have put in the time and effort to develop their own classification scheme, indicating that at one point the plan found value in controlling how drugs are classified. But in most cases the classification system is not a major consideration that drives decision-making about formularies. The P&T Committee Process The MMA includes several requirements for how plans develop their formularies through the P&T Committee process:
• A majority of members must be practicing physicians or pharmacists • The committee must include two experts in care of elderly or disabled • At least one physician and one pharmacist must be independent • The committee’s decisions must be binding as to which drugs are on the formulary • The committee’s role may be advisory on tier placement and utilization management
approaches • Decision-making must be based on evidence
7

Although not a comprehensive, nationally representative sample, our interviews with plan pharmacy directors provide some insights into how these rules relate to current P&T practice. Physicians and Pharmacists. A majority (8/10) of plans have both doctors and pharmacists on their committees; the remaining two use only physicians. Independence. Most plans stated that their committees are entirely independent (6/10). Presbyterian has a partially independent committee. The VA, Kaiser Permanente, and Connecticare have committees made up entirely of plan providers, and most likely would have to make a change to their committee if they had to meet the new rules. Binding vs. Advisory Role. The large majority of P&T committees serve in an advisory role to plan managers. Managers often expressed that they reserve the right to override the committee’s decision, even if that right is almost never used. The exception was Kaiser Permanente, in which staff physicians truly have final control over the formulary, and the health plan provides only technical support. Making the committee’s role binding on which drugs must be on formulary may be a change for many plans in policy if not in daily practice. Evidence-based Decision-making. Overall, P&T committees make their decisions based on therapeutic knowledge. Committees are usually not given cost data when they are evaluating a drug. Once committee clinical evaluations are given to plans, then plan managers take cost into consideration when making final coverage decisions. However, there are some exceptions where cost is considered simultaneously with clinical factors. Plans gather evidence in a variety of ways:
• Kaiser creates tables and monographs from literature for physicians both on and off the committee. Physicians who are not on the committee may make recommendations about these drugs, which then go to the P&T committee for consideration.
• Oregon and Michigan Medicaid are involved with the multi-state Drug Effectiveness Review Project, which conducts evidence-based reviews to determine differences among drugs in a given class. These reviews serve as inputs to the states’ decisions on which drugs go on the preferred list.
• Florida Medicaid works with a vendor (Provider Synergies) to bring evidence into its P&T committee meetings.
• BCBS FEHBP works with Clinical Pharmacy Associates, Inc. instead of with PBMs in order to obtain unbiased research and drug presentations for its P&T Committee.
• Presbyterian has two full-time pharmacists on staff whose sole responsibility is to gather evidence-based literature for its committee.
Committee Process. Committee size varies considerably. Among those that provided specifics, the smallest committee had 7 members (FL Medicaid) and the largest had 50 members (Connecticare). Meetings typically occur on a regular basis. Private plan meetings tend not to be open to the public, but Medicaid committee meetings are. One plan noted that they keep the identity of committee members secret to shield them from intense lobbying from manufacturers.
8

Plans tend to update coverage decisions within each class on a regular schedule. Two plans told us they update coverage decisions within each class every two years, and four told us they update coverage decisions within each class annually. Discussions about a new drug happen almost immediately after market entry. More than half of plans (6/10) specifically stated that they had an ongoing review of new drugs on the market. Additional information gathered from plan pharmacy directors is available in Appendix C. The Appendix describes, for each plan we interviewed, additional detail on the questions outlined above about the P&T Committee process as well as structural questions about how each formulary is organized. Policy Implications: Classification Systems, Formularies, and P&T Committees The findings of this project suggest that classification systems are less substantively important to the plans and PBMs than the formularies themselves. Health plans and PBMs may use classification systems as a technical tool to organize their formularies, but they do not seem to be critical to the design of the formularies. Classification can be important in displaying formularies for use by enrollees and providers, but it may not be the case that they use the full detail of their classification system for this purpose. Classification systems, however, are important in applying the rules determined by the MMA in whether plan formularies are adequate to ensure that they do not discriminate against certain groups of beneficiaries. The empirical findings of this project on P&T committees are based on interviews with only ten pharmacy directors, so they may not provide definitive findings. But there are indications that current practice is in compliance with some of the MMA and CMS requirements, but not others. Current practice would generally support the MMA requirements for including physicians and pharmacists and would even allow stronger requirements. But committees may not have as much independence as required by the statute. Most plans do use evidence in making formulary decisions, although they have different ways of employing evidence.
9

3. THE USP CLASSIFICATION SYSTEM Background: How Does the USP Classification System Work? Under the MMA, plans can establish their own formularies, as long as they do not use this flexibility to design formularies that would discourage high-cost beneficiaries from enrolling. Within each therapeutic category in the plan’s system, at least two drugs must be on the formulary. Thus, for example, if Cox-II inhibitors (e.g., Celebrex) are grouped in the same class as other nonsteroidal anti-inflammatory drugs (NSAIDs) for relief of pain in a plan’s formulary, then the plan can exclude these costly drugs from its formulary by including two NSAIDs that are not Cox-II inhibitors. However, if the Cox-II drugs are their own class, at least two must be on the formulary. CMS has moved beyond this basic rule in establishing regulatory guidelines, as described below. The MMA required that United States Pharmacopeia (USP) develop a model classification system for use in describing plan formularies. This model system, once ratified by CMS, provides plans that follow it a “safe harbor”: their classification systems will be deemed not to be discouraging high-cost beneficiaries, though the actual formulary must still be reviewed. The MMA authorized USP to draw upon their private-sector experience to create a classification scheme (rather than choosing from one of the existing classification schemes) that would be universally applied to all evaluations of PDP formularies. It is not known to what extent plans will follow the final USP model. Some plans may choose to use the approved classification system because it provides them a “safe harbor” guaranteeing approval of their system. Other plans may choose to use a different system if they believe it gives them greater opportunities to achieve cost containment goals. Figure 3 shows two examples of the way the USP system organizes drugs into a hierarchy. The boxes with solid lines (analgesics and antidepressants) indicate two of USP’s 41 therapeutic categories. In the USP system, these therapeutic categories are typically based on diseases or symptoms that drugs are used to treat – such as pain and depression. Most therapeutic categories are broken into pharmacologic classes (represented by the boxes with broken lines), primarily based on drugs’ mechanisms of action. The combination of these classes and the therapeutic categories that are not subdivided into classes create 146 unique groupings. For each of these unique classes, CMS rules state that a plan must cover at least two drugs (where there are at least two) if it chooses to use the model guidelines as the basis of its formulary. For example, under this rule, a plan would have to cover 2 drugs in the class of MAO inhibitors. Classes are sometimes, but not always, further subdivided into key drug types to illustrate drug groups that would further ensure beneficiary access to needed drugs. In Figure 3, the key drug types are represented by the boxes with dotted lines. Note that while both of the pharmacologic classes of analgesics are broken into key drug types, only one of the classes of antidepressants includes key drug types. The 118 key drug types in the USP scheme are not part of the official classification system. However, they are recognized through the CMS formulary guidelines: for each of these key drug types, a plan must cover at least one drug. Thus, for example, in the class of reuptake inhibitors, a plan must cover at least one SSRI, one SNRI, and one tricyclic.
10

Figure 3. USP Classification System for Two Therapeutic Classes
Therapeutic Category: Analgesics
Pharmacologic Class:Opioids
Pharmacologic Class: Non-opioids
Key Drug Type:Long-acting
Key Drug Type:Short-acting
Key Drug Type:Cox-2 Inhibitors
Key Drug Type:Nonspecific NSAIDs
Therapeutic Category: Analgesics
Pharmacologic Class:Opioids
Pharmacologic Class: Non-opioids
Key Drug Type:Long-acting
Key Drug Type:Short-acting
Key Drug Type:Cox-2 Inhibitors
Key Drug Type:Nonspecific NSAIDs
Therapeutic Category:Antidepressants
Pharmacologic Class:MAO
Inhibitors
Pharmacologic Class:Reuptake Inhibitors
Pharmacologic Class:Other
Antidepressants
Key Drug Type: SSRIs
Key Drug Type: SNRIs
Key Drug Type: Tricyclics
Therapeutic Category:Antidepressants
Pharmacologic Class:MAO
Inhibitors
Pharmacologic Class:Reuptake Inhibitors
Pharmacologic Class:Other
Antidepressants
Key Drug Type: SSRIs
Key Drug Type: SNRIs
Key Drug Type: Tricyclics
Utilization of drugs is not distributed evenly across these classes and categories. Based on data from the 2001 Medicare Current Beneficiary Survey (MCBS), the top 10 of the 41 USP therapeutic categories contain two thirds of all utilization by Medicare beneficiaries (Figure 4). 5 In fact, the cardiovascular category alone represents nearly 30% of the overall drug volume. It should be noted that two of the larger categories (autonomic drugs and anti-inflammatories) are substantially overlapping with two other categories. Most autonomic drugs are also categorized as cardiovascular drugs, and most anti-inflammatories are also analgesics. The distribution of drugs is uneven at the class level and key drug type level as well. Over half of drug volume falls in just 15 of the 146 unique classes (Figure 5). Some of the classes in the cardiovascular category are actually as big as most of the other categories. A quarter of the volume is in the top ten key drug types (Figure 6). Appendix D gives a further breakdown of utilization by USP class, category, and key type.
5 As discussed below, the USP fails to list drugs that account for approximately 15 percent of utilization as reported in the 2001 MCBS. The numbers in Figures 4, 5, and 6 are shown as percentages of all MCBS volume, including utilization of drugs excluded from the USP scheme. If these excluded drugs were removed from the denominator, the percentages in these tables would be higher.
11

Figure 4. Top Ten USP Categories
Therapeutic Category
% 2001 MCBS
Volume Cardiovascular Agents 29.95 Hormonal Agents, Stimulant/ Replacement/Modifying 6.13 Autonomic Agents 5.87 Respiratory Tract Agents 5.68 Gastrointestinal Agents 3.64 Blood Glucose Regulators 3.37 Antidepressants 3.20 Blood Products/Modifiers/ Volume Expanders 3.12 Analgesics 2.88 Anti-Inflammatories 2.57
Figure 5. Top Ten USP Classes
Pharmacologic Class
% 2001 MCBS
Volume Renin-Angiotensin-Aldosterone System Inhibitors 5.71 Sympatholytics 5.54 Dyslipidemics 4.63 Beta-Adrenergic Blocking Agents 4.23 Diuretics 4.01 Calcium Channel Blocking Agents 3.88 Hypoglycemics, Oral 3.30 Antiarrhythmics 3.12 Reuptake Inhibitors 2.67 Nonsteroidal Anti-Inflammatory Drugs (NSAIDs) 2.57
Figure 6. Top Ten USP Key Drug Types
Key Drug Type
% 2001 MCBS
Volume Beta-Adrenergic Blocking Agents 4.36 Angiotensin-Converting Enzyme (ACE) Inhibitors 4.26 3-Hydroxy-3-Methylglutaryl Coenzyme A (HNG COA) Reductase Inhibitors 4.16 Cardioselective Beta-Adrenergic Blocking Agents 3.38 Loop Diuretics 2.51 Anticoagulants, Oral 2.31 Dihydropyridines 2.18 Antiarrhythmics - Class IV 1.93 Estrogens 1.71 Calcium Channel Blocking Agents (Non-Dihydropyridines) 1.71
12

The numbers above are based on the number of prescriptions for each category, class, and key drug type. An analysis of dollar volumes yields similar, though not identical, results. For example, immunological and gastrointestinal drugs have higher dollar volume than prescription volume because some of the most commonly used drugs in these categories are expensive drugs. Technically, the USP system does not place drugs into the classification system. Because it is difficult to understand the system without showing what drugs fall into what category, the USP has displayed a list of drugs in each category and class. Although this list does not have the official imprimatur of CMS, it has been used throughout this project. In creating this new classification system, USP made a number of decisions, such as which drugs and which forms of those drugs to include. These decisions bear policy implications that are discussed below. Policy Implications: The USP System How drugs are defined can have a significant impact on formulary rules and standards. Two products may be considered the same drug by one system, while they are treated as separate entities by another system. The FDA’s National Drug Codes (NDC) are extremely exact, for example, and give a separate code for every possible combination of chemical ingredients, strength (e.g., number of milligrams), form, package size (how many doses are typically included in one container used by the pharmacy), and the firm that manufactures or distributes the drug. USP coding, on the other hand, is more general and lists only chemical ingredients. Considerations such as brand vs. generic, strength, and (in most cases) form are absent from the USP scheme. What Drugs Are Included. The absence of a clear-cut definition of which drug products should be considered different entities makes it considerably more difficult to interpret the statutory requirement that two drugs be covered in a given category or class. Some of the considerations that complicate this determination include the following:
• Should oral and topical forms be counted separately, especially if they are used to treat different conditions? It appears that the answer could be different for different drugs, since some appear in separate places in the USP classification and others do not.
• Should all versions of a drug (i.e., all NDC codes) be covered if at least one is covered? In their June guidance to plans, CMS stated that they will not require all dosages to be included, or all manufacturers’ versions of a multi-source product to be included. In addition, CMS’ guidance on displaying plan formularies makes it clear that plans may place different strengths of a drug on different cost-sharing tiers.
• How should extended-release versions of a drug be treated? It appears that CMS will neither require plans to cover extended-release versions of drugs, nor count them as an additional drug toward the coverage requirements. However, there may be instances where the extended-release version of a drug has specific medical indications that go beyond simply being more convenient for the patient.
• Should two chemically similar, but not identical, drugs count as two drugs? In the case of Celexa and Lexapro (two chemically similar anti-depressants with rather different treatment indications), CMS has allowed an exception to the requirement that plan formularies include all anti-depressants. The manufacturer of Lexapro and several clinical groups have raised strong objections to this decision.
13

Policymakers will undoubtedly continue to confront the policy implications of these apparently technical questions. For the purposes of the analysis in this project, however, we made certain assumptions that allowed us to proceed unambiguously, although differences among various databases made this a programming challenge. In this project, we attempted to follow the USP classification scheme on the inclusion of drugs. The USP list became our master list against which all other formularies were compared. The exception is that for many analyses, we maintained a distinction between brand and generic drugs, while the USP does not. We have treated all forms, strengths, and extended release versions associated with a drug name to be one drug for the purposes of simplifying our analyses. Combination Drugs and Other Omitted Drugs. There are a number of drugs excluded from the USP system. Some types of drugs are systematically excluded, while others seem to be more random. The total volume in the MCBS of the drugs not represented in the USP classification scheme is approximately 15% of all drug volume. Unlike any other system that we studied, USP leaves out most combination products, including many that are heavily used. At the same time, about two dozen combination drugs are included in USP’s list – representing a seemingly random list that includes AIDS drugs that are essential components of treatment and some common drugs for treatment of relatively minor conditions. It is difficult to deduce a reason why some are included and others are not. Should a combination drug be counted as one of the two drugs per class? At present, CMS has determined that it should not, but this removes some incentive for plans to include these drugs on their formulary. Since a PDP will receive no credit toward meeting CMS standards if they cover these excluded combination drugs, PDPs have a reduced incentive to cover them. Careful analysis of the prevalence of these excluded drugs and their importance in clinical practice may suggest the need for USP’s classification scheme to be modified in MMA’s second year to better accommodate the needs of Medicare beneficiaries. The USP system also excludes drugs that will not be covered under Part D. These include drugs covered by Part B as well as benzodiazepines, barbiturates, drugs for weight gain and weight loss, and over the counter drugs. The focus on Part D drugs makes sense in the context for which the USP system is intended, but it may limit the usefulness of the USP system for other applications. Finally, the USP scheme omits some single-ingredient drugs for no readily apparent reason. These may simply represent errors. However, until such omissions are corrected or justified, these drugs may be less likely to appear on plan formularies. Drugs in Multiple Categories. Like some (but not all) systems, USP lists some drugs in more than one category. Sometimes these multiple listings appear to be for different forms of a drug. Approximately 50 drugs on the USP list treat different ailments when ingested in different forms and thus are listed in more than one category or class. For instance, doxepin may be used as an oral medication to treat depression, or as a topical cream to relieve itching. Other drugs (112 on the USP list) may be used to treat various ailments, but in the same form. Compazine (prochlorperazine) may be prescribed in pill form as an anti-emetic or an anti-psychotic. Again, these drugs are listed in multiple categories or classes corresponding to these different uses.
14

Some drugs can be administered in different forms, but treat the same ailment regardless of which form is used. For example, Diclofenac is listed in four places in the USP scheme: analgesics, anti-inflammatories, dermatological agents, and ophthalmic agents. PDP formularies may not necessarily mirror USP’s classification of these drugs. About half of all the formularies we studied classify drugs in multiple classes because they have multiple uses, while the remaining formularies force each individual drug into only one class. In most cases, a covered drug will be covered in any form for any use, even when it is listed in only one therapeutic category. USP’s decision to classify drugs in multiple categories in some cases but not in others can affect how and whether a formulary meets CMS requirements. A PDP may choose to cover two forms of a particular drug that would enable the formulary to meet CMS standards in a certain class, but disregard the fact that those forms are less commonly prescribed in that class. For instance, a plan that includes Compazine on its formulary presumably gets credit for one of its anti-emetic drugs and one of its anti-psychotics, but this coverage ignores the fact that other anti-emetic drugs may be more important clinically. Furthermore, if a PDP decides to cover two of the least commonly used forms of a particular drug, they might still be fulfilling CMS coverage requirements, but leaving a large gap in coverage for beneficiaries and increasing both switching rates and out-of-pocket (OOP) costs. These considerations are important since the use of a particular drug is not indicated on the prescription. If a plan wishes to draw such distinctions (covering a drug for one use but not another), it must resort to something like prior authorization to enforce its intent. Clustering of Drugs into Categories. Since drug utilization is heavily concentrated in a few categories and classes in general, formulary decisions for these heavily used drugs will have a disproportionate influence on the overall need for switching from one drug to another or paying out of pocket to continue using an off-formulary drug. The class of renin-angiotensin-aldosterone system inhibitors (one class of the larger category of cardiovascular agents) that is used for hypertension represents 6 percent of all prescription volume, but carries with it the same requirement of two drugs as other classes – such as alpha-adrenergic agents, another class of cardiovascular drugs – that have extremely small prescription volumes. One formulary could fail the statutory test based on alpha-adrenergic agents, while another could pass despite omitting many commonly used renin-angiotensin-aldosterone system inhibitors. This result may, in fact, be the intent of the CMS and statutory requirements since those obscure drugs are important to the limited number of people who need them. But while the CMS-compliant formularies may do a better job of covering a wide breadth of drugs, they may also force a great number of people using common drugs to switch products. These issues may require future policy consideration and perhaps modification of USP classification or CMS regulations.
15

4. THE CMS RULES FOR FORMULARIES Background: How Do the CMS Formulary Rules Work? Under Part D, plans can establish their own formularies and classification systems, subject to CMS’ verification that they are not discriminatory. The MMA established the base requirement that at least two drugs be covered in each category and class. In regulations, CMS has stated that formularies must provide adequate coverage of the types of drugs most commonly needed by enrollees, as recognized in national treatment guidelines, and that they most offer complete treatment options for a variety of medical conditions. This general principle has been interpreted in a CMS guidance document that established the following rules: 1. At least one drug in each USP key drug type must be covered. 2. At least two drugs in each USP class must be covered. 3. All or substantially all drugs in the antidepressants, antipsychotics, anticonvulsants, antiretrovirals, immunosuppressants, and antineoplastics classes must be covered (originally stated as a majority of drugs in these categories). 4. There should be appropriate access to drugs listed in widely accepted national treatment guidelines. 5. Drugs should only be on a higher tier only when therapeutically similar drugs are available on a lower tier. In addition, CMS will check drug lists against risk adjustment categories to avoid drug selection and discrimination. Although these rules seem straightforward, there are many nuanced policy issues surrounding how drugs are counted. As described in the previous section, how differing forms or strengths of the same drug are treated can effect whether plans meet the formulary rules. The sample list of drugs in the USP classification system includes 1134 separate pharmaceutical preparations. To meet CMS’ requirements to cover two drugs in every pharmacologic class and one drug in every key drug type, a plan would have to cover 315 drugs. To also meet the requirement to cover “most or all” drugs in certain categories, plans will have to cover a total of about 425 drugs – just over a third of the drugs in USP’s list. The two tasks we addressed in this segment of the project are to consider how thoroughly these rules require plans to cover the drugs most commonly used by beneficiaries and whether formularies currently used in the private sector seem to meet the guidelines. We examined these questions in terms of four of CMS’ minimum requirements (for the other requirements, CMS has not provided sufficient information to operationalize them for this analysis):
1. One drug per key drug type 2. Two drugs per drug class 3. Most or all of the drugs in certain categories (e.g., drugs to treat AIDS, atypical anti-
psychotic drugs, and anti-depressants) 4. Cover at least some drugs on lower tiers
16
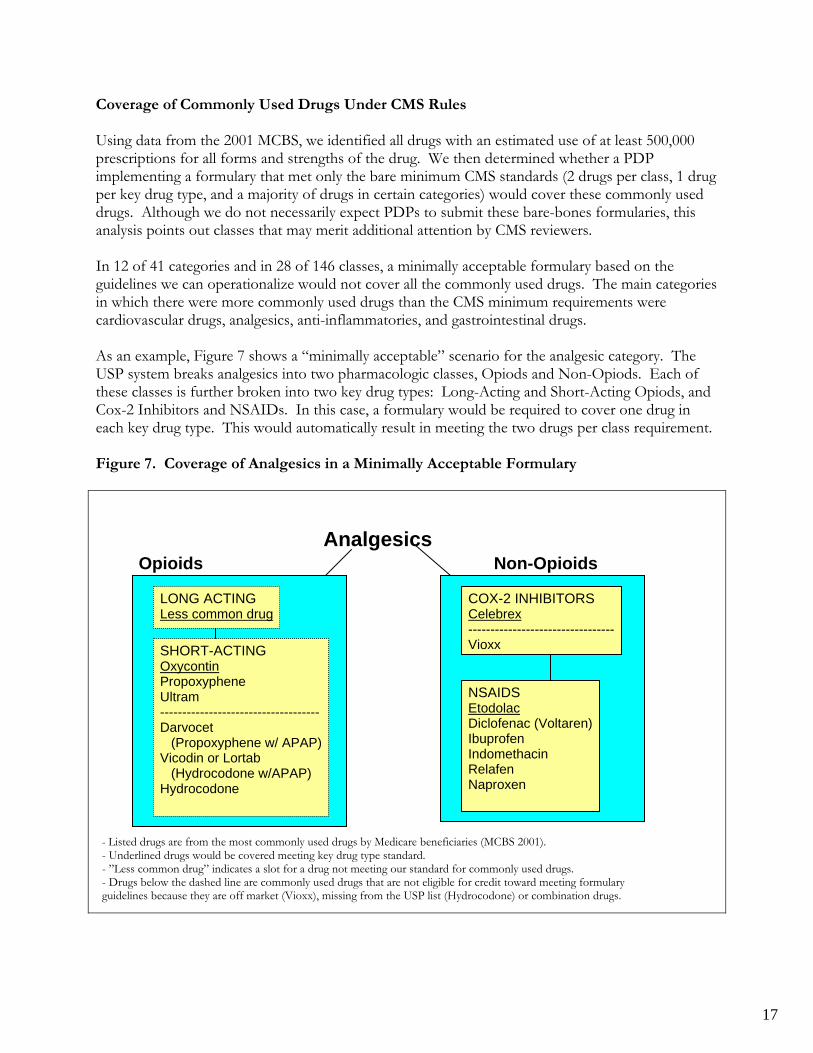
Coverage of Commonly Used Drugs Under CMS Rules Using data from the 2001 MCBS, we identified all drugs with an estimated use of at least 500,000 prescriptions for all forms and strengths of the drug. We then determined whether a PDP implementing a formulary that met only the bare minimum CMS standards (2 drugs per class, 1 drug per key drug type, and a majority of drugs in certain categories) would cover these commonly used drugs. Although we do not necessarily expect PDPs to submit these bare-bones formularies, this analysis points out classes that may merit additional attention by CMS reviewers. In 12 of 41 categories and in 28 of 146 classes, a minimally acceptable formulary based on the guidelines we can operationalize would not cover all the commonly used drugs. The main categories in which there were more commonly used drugs than the CMS minimum requirements were cardiovascular drugs, analgesics, anti-inflammatories, and gastrointestinal drugs. As an example, Figure 7 shows a “minimally acceptable” scenario for the analgesic category. The USP system breaks analgesics into two pharmacologic classes, Opiods and Non-Opiods. Each of these classes is further broken into two key drug types: Long-Acting and Short-Acting Opiods, and Cox-2 Inhibitors and NSAIDs. In this case, a formulary would be required to cover one drug in each key drug type. This would automatically result in meeting the two drugs per class requirement. Figure 7. Coverage of Analgesics in a Minimally Acceptable Formulary
Analgesics
Opioids Non-Opioids
LONG ACTING Less common drug
SHORT-ACTING Oxycontin Propoxyphene Ultram ------------------------------------ Darvocet (Propoxyphene w/ APAP) Vicodin or Lortab (Hydrocodone w/APAP) Hydrocodone
COX-2 INHIBITORS Celebrex --------------------------------- Vioxx
NSAIDS Etodolac Diclofenac (Voltaren) Ibuprofen Indomethacin Relafen Naproxen
- Listed drugs are from the most commonly used drugs by Medicare beneficiaries (MCBS 2001). - Underlined drugs would be covered meeting key drug type standard. - ”Less common drug” indicates a slot for a drug not meeting our standard for commonly used drugs. - Drugs below the dashed line are commonly used drugs that are not eligible for credit toward meeting formulary guidelines because they are off market (Vioxx), missing from the USP list (Hydrocodone) or combination drugs.
17

In the Long-Acting Opioids key drug type, there are no drugs that meet our definition of a commonly used drug. A minimally acceptable formulary would have to cover one “less common” drug in this key drug type. In the Short-Acting Opioids, there are three commonly used drugs on the USP list (Oxycontin, Propoxyphene, and Ultram). In this example, we assume our minimally acceptable formulary would cover only one of these drugs. In addition, there are three drugs that meet our definition of a commonly used drug that are widely considered to be short-acting opioids, but that are not on the USP list. Two (Darvocet and Vicodin) are combination drugs, and Hydrocodone is not on the list for an unexplained reason. If a plan chose to cover these drugs, they would not count toward the minimum coverage requirements. In the Cox-2 Inhibitors key drug type, Celebrex is the only commonly used drug on the USP list (not including Vioxx, which is now off the market). We assume that the minimally acceptable formulary would cover this drug. In the NSAIDs key drug type, there are six commonly used drugs (Etodolac, Diclofenac, Ibuprofen, Indomethacin, Relafen, and Naproxen). Again, a minimally acceptable formulary would have to cover only one of these drugs to meet CMS’ most basic rules. If PDPs actually implemented such a formulary on a widespread basis, millions of beneficiaries might either have to change the drug they take or pay the full price of their drug out of pocket. As a second example, we considered drugs used to treat high cholesterol (Figure 8). This is a pharmacologic class which is broken into five key drug types. The most heavily used key drug type in this class is Statins. Six statins meet our definition of a commonly used drug, but a minimally acceptable formulary in our example would only cover one of these six drugs. Figure 8. Coverage of Cholesterol Drugs in a Minimally Acceptable Formulary
Cholesterol Drugs
BILE ACID SEQUESTRANTS Less common drug
NICOTINIC ACID Niaspan
FIBRATES Tricor Gemfibrozil
LIPID ABSORPTION INHIBITORS Less common drug
HMG CoA REDUCTASEINHIBITORS (STATINS) Lipitor Lescol Mevacor Prevachol Zocor ---------------------------------- Baycol
- Listed drugs are from the most commonly used drugs by Medicare beneficiaries (MCBS 2001). - Underlined drugs would be covered meeting key drug type standard. - ”Less common drug” indicates a slot for a drug not meeting our standard for commonly used drugs. - One drug listed below the dashed line is off market (Baycol).
18

In the Fibrate key drug type, there are two commonly used drugs; a minimally acceptable plan would cover only one of these drugs. The Nicotinic key drug type has only one commonly used drug; a plan in our minimally acceptable scenario would cover this drug. Two of the key drug types (Bile Acid Sequestrants and Lipid Absorption Inhibitors) do not have any commonly used drugs; a plan would have to cover one less common drug in each of these classes. Our analysis of several additional drug classes is available in Appendix E. In each, there are examples of classes or key drug types in which a minimally acceptable formulary would be able to meet the basic CMS rules but leave a commonly used drug uncovered. If plans regularly implemented such minimally acceptable formularies, there would be considerable impact on beneficiaries, either in terms of changing drugs or paying out of pocket to continue taking an off-formulary drug. However, as discussed below, there are reasons to believe such minimally acceptable formularies will not be widespread. Policy Implications: Adequacy of Coverage under the CMS Rules As this analysis shows, CMS’s minimum coverage requirements could allow PDPs to omit many commonly used drugs from their formularies. However, there are several reasons why these commonly used drugs may be still be covered. First, further guidelines submitted by CMS may ensure coverage of additional drugs. For example, in June CMS clarified its policy on coverage of
ental health and AIDS drugs. The original guideline said that a majority of drugs must be covered,
o expand coverage in classes here drugs are not considered similar enough to be direct substitutes for one another.
. h
ould “Real World” Formularies Meet CMS Rules?
e examined four of the formularies in our study for whether they would meet four of CMS’ r
chosen ed.
or each plan, we matched the drug names listed in the formulary to drug names in the USP. g
FDA’s NDC files and the Redbook. Once this match was complete, we determined whether the
mwhile the new guideline says that “most or all” drugs in these classes must be covered. Secondly, the broader CMS requirements would require that a therapeutically similar drug be covered in place of the off-formulary drug under the principle that drugs must be included to treat all diseases and health conditions. In some cases, this may lead plans tw Finally, in order to ensure a higher market share, PDPs may choose to cover more than the minimum number of required drugs. For instance, in hopes of attracting more cholesterol patients, and thus covering its fixed costs, a plan may opt for more generous cholesterol drug coverageNevertheless, some drugs will inevitably not be covered, forcing some beneficiaries to either switcdrugs or to bear the full cost of their medication. W Wminimum requirements. These formularies are based loosely on four of those studied in the earliephase of this project – two FEHBP plans and two other private-sector formularies. We have not to identify these formularies by name since we made adaptations to the actual formularies usFor example, as noted below, we have modified an open three-tier formulary to be a closed two-tierformulary with the third-tier drugs considered to be off formulary. FBecause the USP lists only generic ingredient names, not brand names, this required translatinbrand names listed on each formulary into their generic equivalents. To do this we used both the
19

formulary had listed two drugs in each of USP’s pharmacologic classes, one drug in each key drug type, and a majority of the drugs in the special classes highlighted by CMS. Figure 9 shows some of the results from this analysis. The plans we studied fail to list one dkey type for about a fifth to a quarter of all key drug types. They fail to list two drugs per class (or one when there is only one in the class) for about a quarter to a third of all classes.
rug per
igure 9. How Do Four Formularies Fare Under CMS Formulary Requirements?
# of Key Drug % of Key Drug # of Classes % of Classes
F
Types Failed Types Failed Failed Failed
Plan A 24 20% 49 34%
Plan L 26 22% 33 23%
Plan O 31 26% 58 40%
Plan I 31 26% 50 34% There are two important caveats to this analysis. First, Plan A and Plan I are open 3-tier formularies. Plan A claims to explicitly place all drugs on a tier, but there are 75 drugs on the USPlist that are not on the Plan A list. Plan I does not list any drugs on Tier 3; instead, all unlisted druare presumed to be on Tier 3. However, we did not automatically assign unlisted drugs to Tier 3 foeither of these formularies. In effect, we tested CMS’ fourth requirement by
gs r
noting the classes in
n addition, there were several hard-to-match categories where our analysis may have missed drugs. or example, dermatologics and ophthalmics include many drugs that come in multiple forms and
drugs in nly one place, without s
t drug with its ma S an nutrd ferent names in fo ing to matc SP if they w ted at all. Beyo caveats, important patterns do emerge in the typ f classes and ug types that plans failed. Many of the failed classes and types were clustere a few catego cluding antibacterials, antidementi ardiovascular, etabolic drugs. These are classes that may warrant specia ion from for ary reviewers.
addition, many of the commonly-failed key types and classes include only one drug. This ss into
which these plans did not name any covered drugs. Although these plans actually do cover drugs in these classes, they are only at higher tiers. The plan would effectively fail CMS’ rule that drugs can only be on a higher tier if a therapeutically similar drug is listed on a lower tier. IFaore listed in multiple places in the USP scheme. To the extent that a formulary listed these
pecifying which forms of tch in the USP.rmularies, mak
the drugs it covered, we may have failed to link imilarly, vaccines them difficult
heif
d therapeutich to U
ients were listed by ere lis
nd these es o key drd in ries, in
a, c and ml attent mul
Inhighlights the importance of USP’s decisions about whether to subdivide a category or clavery specific groups. In some cases, these specific groupings may provide important protection for beneficiaries who need access to a particular drug. In other cases, further review may be warranted to determine whether the subdivision is necessary.
20

Figure 10. Do Formularies Cover All Drugs in Required Classes?
% of USP Drugs Listed on Formulary
Drugs in USP Plan A Plan L Plan O Plan I
Anticonvulsants 18 78% 89% 44% 50% Antidepressants 24 75% 79% 67% 75% Antineoplastics 53 6% 38% 36% 9% Antipsychotics 18 72% 78% 61% 78% Antiretrovirals 37 95% 73% 65% 68% Immune Suppressants 16 56% 69% 19% 31%
The plans we studied also failed to list “all or substantially all” the drugs in required classes on their
rmularies (Figure 10). Even in Plan A, which claims to list all drugs, coverage exceeds 90% in only ulary
e on a lower tier. Plan A is the only formulary our study that explicitly lists Tier 3 drugs on its formulary. In the Plan A formulary, two USP
lasses and six USP key drug types have drugs only on tier 3. As discussed above, Plans A and I ough drugs to meet CMS’
les. Policy Implications: Will “Real World” Formularies Pass the CMS Tests? A r analysis, formu es in u day w not m the CMS tests for adequacy without some adjustments. Presumably, it will not be too difficult for these plans to make the n stments by adding w dru their formularies, or moving them to lower tiers.
Since utilization is heavily concentrated in a few categories and classes, formulary decisions for these ecific groups of drugs have a disproportionate influence on beneficiaries’ need to switch drugs or
ay more out-of-pocket costs. Even if a plan meets CMS’ minimum rules in these classes, large umbers of beneficiaries may be affected when other drugs are uncovered. In addition, some
r a few rarely-used drugs. Lack of coverage r these rarer drugs can still cause a formulary to “fail.” Although these cases may not affect a lot
foone category. In some cases, particularly anti-neoplastics, drugs may not be listed on the formbecause they are typically covered as inpatient drugs. This analysis also gives some insight into CMS’ fourth rule, that plans may only cover drugs on a third tier if a therapeutically equivalent drug is availablincwould also fail this test in the classes above in which they failed to list enru
ccording to ou lari se to ould eet
ecessary adju a fe gs to
sppncategories and classes are quite diverse; the rule requiring just two to be covered may not adequately ensure all needs are satisfied. Conversely, some categories and classes have just one ofoof beneficiaries, the intent is to protect beneficiaries whose drugs are not commonly used.
21

5. FORMULARY ANALYSIS MODEL
nse
ients in reaction to a plan’s formulary can vary, reflecting a mix of
r ifferent drugs. Prescribing physicians are also influenced by a variety of factors, including their revious clinical experience, their reading of the research, experiences with formularies of multiple
payers, and detailing by manufacturer representatives. The physician’s lack of involvement with the formulary can dampen a patient’s ability or willingness to be price-sensitive, because many patients do not want to second-guess their doctor’s prescriptions. Overall, however, the use of a closed formulary or an open formulary with financial incentives (such as a three-tier copay) or administrative incentives (such as prior authorization or therapeutic substitution) can change spending patterns in three ways: Reduced utilization. Some consumers use fewer drugs because of higher costs or administrative barriers. The extent to which the utilization of prescription drugs drops when copayments increase or other barriers are imposed is referred to as the elasticity of demand. Changes in the mix of drugs. Some consumers switch from drugs in a non-preferred category to preferred or generic drugs. This also reduces spending for the health plan and the consumer. The extent to which consumers will switch between similar drugs because of a difference in price or other barriers is known as the cross-elasticity of demand. Higher enrollee copayments. Some consumers absorb the higher copayments when the drugs they use are placed in a higher tier. This shifts costs from the health plan to the consumer. Consumers who do not change their utilization patterns despite a change in price or other barriers are considered to have inelastic demand. In a study of a PPO population by researchers at Express Scripts, the addition of a 3-tier copay ($8/15/25) caused health plan costs to drop 17.1 percent, with 5.3 percent attributed to reduced utilization, 1.9 percent attributed to substitution of lower-priced drugs, and 9.9 percent attributed to enrollees paying higher copayments to continue taking the same drugs.6
Background As the final part of this project, the NORC-Georgetown team developed a model that simulates beneficiaries’ responses to plan decisions about formulary placement and cost sharing. This model is based on a theoretical understanding of how beneficiaries are likely to respond to price incentives, as well as expert clinical opinion about the likelihood that beneficiaries will change drugs in respoto price. The behavior of individual patfactors such as wealth, knowledge about the underlying health condition, knowledge about (and experience with) alternatives, advertising, the price of alternatives, and comorbid conditions and therapies. Furthermore, prescriptions are written by physicians who usually face no financial incentive to follow a plan’s formulary; most are not aware of the prices their patients face fodp
6 Motheral, Brenda, and Kathleen Fairman, “Effect of Three-Tier Prescription Copays on Pharmaceutical and Other Medical Utilization,” Medical Care 39(12): 1293-1304, December 2001.
22

Kamal-Bahl and Briesacher studied anithypertensive use in a variety of health plans and found that ($10) between the prices of generics and brand
ame drugs were least likely to use angiotensin II receptor blockers (ARBs), which had no generic he time of the study. Their study suggests shifting between drugs caused a decrease
total spending, rather than a simple shift in costs from the plan to the consumer. In contrast,
the relationship between price and amount of medication consumed, or the price elasticity f demand, were first undertaken thirty years ago.8 When considering the behavioral effects of
of
bly,
in c. After introduction of the policy, use of
ssential” drugs decreased by 9.12% and use of “non-essential” drugs decreased by 15.14%.10 se of
rease,
we rease in overall demand for drugs. Rather, we
old overall utilization constant, and focus instead on the cross-elasticity of demand.
dies on the cross-elasticity of demand for prescription drugs – the extent to hich consumers will switch from one drug to another in response to differences in price or other
enrollees in two-tier plans with the largest differencenalternatives at tinenrollees in three-tier plans were not less likely to use ARBs, but the copayment structure shifted more costs to them.7
Elasticity of Demand Studies of oformulary changes, we are most interested in the extent to which elasticity can vary among classesdrugs. In theory, consumers should have less elastic demand for essential items, so that a price change has a smaller effect on utilization of drugs that are more essential to the consumer. Researchers have found that the elasticity of demand does differ across classes of drugs. Notathe first such study, published in 1985, found that elasticity varied not by the long-term medical benefit of the drugs, but by the short-term, obvious benefit to the consumer. Thus, new copayments had no effect on the use of painkillers and sedative/hypnotic drugs, while there were clear reductions in the use of cardiovascular, diuretic, and psychotherapeutic agents when copayments were imposed.9 Other studies have attempted to group drugs into “essential” and “non-essential” categories, finding that price increases affect these two categories differently. A peer-reviewed study, published 2001, focused on increased cost sharing imposed in Quebe“eSimilarly, Medco Health estimates that a 10% increase in cost sharing can slow growth in the u“essential” medications from about 7% to about 1%, while slowing growth in “less essential” medicines from 14% to -3%.11
While most studies have considered the reduction in demand that occurs after copayments incthe opposite case will also be important in implementation of the Part D drug benefit. It is likely that among beneficiaries who currently have no coverage, utilization will increase. In our model,do not attempt to simulate either an increase or a dech
Cross-Elasticity of Demand In response to the relatively recent introduction of formularies in the management of health care costs, there are now stuw 7 Kamal-Bahl, Sachin, and Becky Briesacher, “How Do Incentive-Based Formularies Influence Drug Selection and Spending for Hypertension?” Health Affairs 23(1): 227-36, January/February 2004. 8 For example, Phelps, Charles E., and Joseph P. Newhouse, “Coinsurance, the Price of Time, and the Demand for Medical Service,” Review of Economics and Statistics 56(3): 334-342, August 1974. 9 Reeder, C.E. and Arthur A. Nelson, “The Differential Impact of Copayment on Drug Use in a Medicaid Population,” Inquiry 22:396-403, Winter 1985. 10 Tamblyn, Robyn, et al., “Adverse Events Associated With Prescription Drug Cost-Sharing Among Poor and Elderly Persons,” Journal of the American Medical Association 285(4): 421-429, January 24/31, 2001. 11 Medco Health. Drug Trend Report. 2002.
23

barriers. In general, consumers are more willing to switch to another drug in response to price when there are more substitutes available and when substitutes are very similar. Huskamp et al. studied ACE inhibitors, proton pump inhibitors, and statins, three drug classes in which there are several very closely related, substitutable drugs. When an employer switched from a flat $7 copay toa three-tier system in which employees paid $8 for generic drugs, $15 for brand name drugs, and for non-preferred brand name drugs, 35% to 49% of employees using these drugs switched to a drug in a lower tier afte 12
$30
r the cost-sharing changes were implemented.
nistration (VA) has used a closed formulary for some drug classes in recent
ket
. r
nvironments should be done with caution. Most notably, the VA uses staff physicians who are
drug class.
ns (e.g., ratic and that bad fits can be very disruptive, making physicians and
atients reluctant to change from a proven therapy even when given a significant incentive to do so.
nse
ses, ring for nonsteroidal anti-inflammatory drugs (NSAIDs) and
tihistamines. The smallest reductions were for drugs to treat diabetes, hypertension, and
to
versus
generic drugs. Appendix G provides additional information drawn from the literature on cross-arious drugs in the model.
The Veterans Admiyears, resulting in substantial shift in market share to the covered drugs and savings in the range of 15 percent for the classes analyzed.13 Where a class of drugs was closed, 85% to 97% of the marwent to the on-formulary drug (up from 16% to 47% before the class was closed); by contrast, use for the preferred drug in a class where the formulary was not closed rose from 15% to only 23% 14
There are some unique features to the use of drugs in the VA system, so generalizing to otheewell-educated about the VA formulary and are expected to prescribe on-formulary drugs. There is some evidence that the response to formulary decisions can vary considerably by One article found that the use of formularies for psychotropic drugs was relatively price inelastic.15
The evidence suggests that good fits between patients and drugs for mental health conditiodepression) are more idiosyncpThey are more likely to choose higher copayments or go through prior authorization procedures to maintain the drug that has been working for them. Psychotropic drugs may present an extreme case, but other evidence supports the idea that respovaries by drug class. A study published in 2004 looks at effects across several major classes of drugs.The research team found that doubling copayments led to reduced use in eight therapeutic claswith the largest decreases occurandepression. They suggest that the smallest reductions occurred for drugs with greater consequences for missed doses, whereas the largest reductions corresponded to medications taken intermittentlyreduce symptoms. This finding is accentuated by looking at those patients receiving ongoing care for a chronic illness, for whom drug use was less responsive to copayment changes. There were alsohigher responses for drugs which had over-the-counter substitutes and for brand drugs
16
elasticity of demand for v
12 Huskamp, Haiden A., Patricia A. Deverka, Arnold M. Epstein, Robert S. Epstein, Kimberly A. McGuigan, and Richard G. Frank. “The Effect of Incentive-Based Formularies on Prescription-Drug Utilization and Spending.” New England Journal of Medicine 349(23):
f the VA National Formulary,” Institute of Medicine,
nthal, “The Impact of a National Prescription Drug Formulary on
n A., “Managing Psychotropic Drug Costs: Will Formularies Work?” Health Affairs 22(5): 84-96,
efits and the Use of Drugs by the Chronically Ill,” (19): 2344-2350, May 19, 2004.
2224-2232, December 4, 2003. 13 Blumenthal, David, and Roger Herdman, “Description and Analysis oDivision of Health Care Services, VA Pharmacy Analysis Committee, 2000. 14 Huskamp, Haiden A., Arnold M. Epstein, and David BlumePrices, Market Share, and Spending: Lessons for Medicare?” Health Affairs 22(3): 149-158, May/June 2003. 15 Huskamp, HaideSeptember/October 2003. 16 Goldman, Dana P., Geoffrey, F. Joyce; Jose J. Escarce; et al., “Pharmacy BenJournal of the American Medical Association 291
24

If a consumer has found a single drug that works, after having adverse reactions or ineffective results from other drugs, then that consumer will be very price inelastic and so be unlikely to switdrugs. The inclusion of an exceptions process in the presence of formularies is an effort by plans tallow certain patients with highly price inelastic demand for a non-preferred drug to receive the drug. Exceptions are granted in the case of compelling medical reasons for a patient’s unwillingness to substitute away from the preferred drug, such as known allergies to alternative medications, buare dismissed if they are based only on taste or tradition. In fact, fail-first
ch o
t requirements (step
erapy) are explicit efforts to test whether there are compelling reasons for a particular patient to be t be
E.
hich Drugs Are Included?
volume in the 2001 MCBS. The largest mber are in the group of hypertension drugs (over half of the total), while the other groups are
s. For ption
e
ategory
Drug Catego
Chemical Entities With a
thprice inelastic relative to a drug that he prefers. This approach requires that a preferred productried (and fail) prior to the patient receiving permission to use a non-preferred product. Methodology: The Formulary Simulation Model This section describes the organization and workings of the model we have developed for ASPThe model is presented in an Excel workbook in a file that accompanies this report.
WFor purposes of developing this model, we chose to include six groups of commonly used drugs: anti-depressants, cholesterol drugs, ulcer drugs, diabetes drugs, analgesics, and hypertension drugs. Together, these six groups represent 157 chemical entities (roughly one-sixth of all the drugs on the USP list). They include 149 brand-name drugs and 108 generic drugs. For this analysis, 25 drugs from these groups were excluded because no volume is available in the 2001 MCBS and the drug did not appear on lists of the 200 most commonly used drugs in 2003. The drugs in these six groups represent nearly half (about 49%) of the prescription nugenerally equally represented. In addition, we did not include combination drugs because these drugs are not included on the USP list. The groups of drugs represent some significant variation with respect to several characteristicexample, of the chemical entities listed in the cholesterol category, only 38% have a generic oavailable (Figure 11). By contrast, 97% of the drugs in the analgesic category have a generic option. The varying availability of generic alternatives creates different market situations. While these variations may not affect our substitution model directly, it is important to test the model with thesdiffering situations. Figure 11. Generic Availability by Therapeutic C
ry Chemical Entities Generic Option Anti-Depressants 23 65% Cholesterol Drugs 13 38% Ulcer Drugs 11 64% Diabetes Drugs 13 46% Analgesics 33 97% Hypertension Drugs 64 70%
25

Figure 12. Average AWP for 30 Units, By Drug Category Drug Category All Brands Generics Anti-Depressants $52 $66 $15 Cholesterol Drugs $97 $103 $38 Ulcer Drugs $113 $125 $73 Diabetes Drugs $36 $45 $13 Analgesics $65 $88 $22 Hypertension Drugs $28 $39 $15 The drug groups also vary in terms of the pricing levels for the drugs involved (Figure 12). Ulcer rugs and cholesterol agents tend to be the most expensive, averaging $97 and $113 for a 30-day
le nsion
medications have the lowest average prices ($36 and $28, respectively). Anti-depressants appear to en the brand and generic alternatives. This seems to reflect the difference
h
ution groups,” based largely on the USP classification ystem. We asked our panel of experts to identify groups of drugs within the USP classification
and the input of our experts. Each of these larger categories comprises one heet of the Excel workbook. In many cases, our panel of experts indicated that it was often ossible, but less likely, for physicians to consider different substitution groups within the same
elow, the model allows utilization to hift among drugs in the same substitution group or among related substitution groups located on e same sheet of the spreadsheet.
des several importan riables that are co ed fixed:
s. Each drug is identified by its brand name and generic name. A separate ndicates whether the drug is available in generic form. Although they are
dsupply, respectively. The generic versions of the ulcer drugs are also relatively expensive ($73), whithe generic cholesterol drugs are less expensive ($38). The diabetes drugs and hyperte
have the largest gap betwebetween the SSRIs (which are mostly sold in brand versions) and the much cheaper tricyclics (whicare mostly sold in generic versions). These differences not only demonstrate the various situations that we are testing with this model, but they also show how this type of analysis can reveal the differences in the different drug categories.
Organization of Drugs Into Groups The model is organized by “drug substitsscheme that were close equivalents – those that physicians would regularly consider as potential substitutes for each other. In some cases, substitution groups were second-level pharmacologic classes within the USP scheme; more frequently, they were third-level “key drug types.” We have grouped these drug substitution groups into larger categories, also based on the USP classification schemespcategory as possible substitutes for each other. As described bsth
Fixed Input Data The model inclu t va nsider
Drug namegeneric flag i
26

presented on the same line to connote their chemical equivalence, the model includes separate pricing and utilization information for brands and generics.
es. For each drug, we use Redbook to generate it price by taking the median price for all ths and for e multiply this unit price by 30 to make the
more comparable er-prescrip pay. This d ot reflect the fact that some e typically taken tiple times a
scope of this projec ake an adju nt for the number of pills typically taken in one
To reflect the relative imprecision of the AWP, we round the approximated per-prescription
ilization
ost e user must input two key types of data about the formulary:
tutory model and cover all drugs with 25% ly, a plan may specify different dollar copays or different percentage
s d s as 20
ets
ll brand-name drugs are covered on tier 2.
The model uses the cost sharing rules and tier placement to generate the e beneficiary will face for each generic drug and each brand name drug. A
is on a tier with a opayment higher than the drug’s actual cost, the model assumes the beneficiary would pay the
actual c
Drug pric a unAWP unit streng ms. Wprice to a p tion co oes ndrugs ar mul day; it would require additional resources outside the t to m stmeday.
price to the nearest $5. This causes drugs with roughly equivalent prices to be treated as though their prices are equal. Utilization. For each drug, we use the 2001 MCBS to generate utilization. These utnumbers have not been updated to reflect more recent changes in utilization, such as use of new drugs or shifts to new generics, with the exception of a few new, high-volume drugs for which we imputed utilization (Lexapro, Zetia, and Benicar).
Formulary Data and OOP Prices The model can accommodate either a closed or an open formulary, with up to four tiers of csharing. Th
Cost Sharing Rules. A plan may follow the stacost sharing. Alternativecoinsurance for different tiers of coverage in an effort to steer utilization to certain drugand lower overall costs. The user describes the plan’s tiering structure on the sheet labele“RULES.” On this sheet, the user inputs cost sharing amounts for as many coverage tierthe plan has. These cost sharing amounts can be entered as either a dollar amount (i.e., $per prescription) or as coinsurance (i.e., 20% of the cost of each prescription).
Tier Placement. The user must also input the tier placement for each drug, on the shededicated to individual drug classes. If a drug is not covered at all, the user enters “0”, andthe OOP faced by the beneficiary is the full price of the drug.
As a default, we have entered a simple two-tier coverage scheme into the model. The copayments are $10 for the first tier (generics) and $25 for the second tier (brands). In this default scheme, all generics are covered on tier 1, and a
Out-of-Pocket Cost. OOP cost that thbeneficiary’s OOP cost is limited by the actual cost of the drug: if the drug c
ost, not the higher copayment.
27

ElasticitFigure s in the model. These include three different categories of elasticities
Although substitution groups are defined as groups of drugs that
ll response to price, while they agreed that up to 90% of patients
ight switch from one PPI to another if the price difference were large enough. Within any
le, they agreed that up to 50% of patients taking a PPI or an H2 Blocker might switch from one group to the other to
itution group, the likelihood of switching out e for all drugs.
proportion of patients ho might switch. We have incorporated this concept into our data by generating a substitution
curve anumberto actua e model ipanel. Figure 13. Elasticities Used in Formulary Simulation Model for Cholesterol Category
Drug
SubstituGrou s-Group Elasticity
ies 13 provides an example of the elasticities we used for one of the classe
that we asked our expert panel to generate:
Brand-to-generic switches. Our expert panel generally agreed that with a large enough difference in price, up to 90% of users might switch to a generic version of the drug they take. We have used 90% as the elasticity for all brand-to-generic switches where a generic is available. The panel identified no exceptions to this generic substitution policy. Within-group switches. are good substitutes for each other, our expert panel agreed that the likelihood of switching varies from group to group. For example, they agreed that patients would not switch at afrom one SNRI to another in mgiven substitution group, this elasticity is the same for all drugs. Across-group switches. The panel agreed that across-group switches were less likely than within-group switches, but that they are possible. For examp
achieve a large savings. Within any given substof the group is the sam
In general, the panel responded to these questions in terms of the maximumw
long which no patients switch when there is no difference in price, and the maximum of users switch when the cheapest drug is free. In practice, because no drugs are expected lly be free, the maximum number of actual switchers when any formulary is entered into ths likely to be less than the maximum possible number of switchers indicated by our expert
tion p
Brand Name Drugs
Generic Drugs
Brand Names
Brand-to-Generic
Elasticity
Within-Group
Elasticity Cros
S Mevacor To high statins: 50% tatins (Low) 2 1 Pravachol 90% 75% To Zetia: 30%
SZocor
o low statins: 50% tatins (High) 4 0
Crestor Lescol Lipitor No generics 75% T
BS
ile Acid equestrants 3 1
Colestid Questran Welchol
90% 90% None
ibrates 2 2 Tricor Lopid 90% 90% None F
LAInhibitors
tia No generics Only 1 drug To low statins: 30% To nicotinic acid: 10%
ipid bsorption 1 0 Ze
Nicotinic Acid 1 1 Niacin 90% Only 1 drug To Zetia: 10%
28

Outcomes and Summary Measures
tion roup level on the sheets labeled “cov”, “vol”, and “spend.”
l.
pending. The model generates a “spending” number that provides an estimate of volume
to
g out of
equivalence rules.
There are a number of key caveats and limitations , th el ttem o po eriod after beneficiaries meet their nd th the hole no y c othe imes w bene may fa ferent in ves.
The total number of prescriptions is fixed within each class. The model does not simulate people of a drug alto her be e co h. S ly, we d
new users who might begin taking a cause they now face a lower price.
not constrained by any measures of actuarial equivalence. The user can input any ation of cost sharing rules and tier placement. However, in the examples we have created,
e 25% t.
The model generates summary measures of coverage, volume, and spending (both total and out-of-pocket). These are presented at the class level on the “summary” sheet, and at the substitug
Coverage. The model summarizes the tier placements that the user input at the drug leveThis information can be helpful in analyzing the different results of formularies with different coverage policies.
Volume. The model generates a summary of how many drugs are on each drug. The modelalso shows the percentage change in volume. To provide context, we also show the volume for each group as a percentage of the class and as a percentage of all drugs in the model, both before and after switching. In addition, the model displays the percentage of drugs that have a generic option, and the percentage of volume that is in generic drugs. Sthat is weighted by the price of each drug. We have not calibrated these spending figures to any available data on actual spending; they are based on the AWP, which we know is an inaccurate measure of spending. However, these weighted estimates are useful as a tool see the relative magnitude of changes in spending, which can be quite different from changes in volume.
The model generates a weighted average total price per prescription based on this AWP-based price, and the average OOP cost per prescription based on the formulary cost sharinrules. The model estimates the share of total spending that beneficiaries would spend pocket. In addition, the model includes a measure of on-formulary OOP spending as a share of on-formulary spending. This amount, which is called “True Out-of-Pocket” (TrOOP) spending by the MMA, must be equal to 25 percent under the actuarial
Caveats and Limitations in our development and analysis of the model.
rtray the p.” We do
For exampledeductible a
e modbefore
is only aey reach
pting t “donut t model an hanges in behavior or
spending for
r t hen ficiaries ce dif centi
dropping use get cause th st is too hig imilar o not estimate anydrug be
The model iscombinwe have used cost sharing rules that result in TrOOP spending that would meet threquiremen
29

Our baseline utilization data include some generics that were new at the time the 2001 MCBS was
ddition, our use of 2005 prices with 2001 utilization can cause some inconsistencies, although we ave im
Prototy del
sing tfor a nuswitchi
Cost ShWe examined the effects of using a flat co-payment ($14) versus a flat coinsurance rate (25%), as well as In all foequaled As shocoinsurance (18% versus 39%) because flat co-payments induce less price sensitivity than coinsurance. Individuals who are responsible for only a flat co-payment of $14, regardless of a drug’s aresponsoccurreto a con 35% ra In all cost sharing scenarios, both total spending and the average OOP spending decrease as the mount of switching increase. Plans that induce more switching may be attractive to both PDPs and
consumers as a result of these lower overall costs.
ost Sharing % of Brand % of Total Average Total Average OOP
collected, and thus have very low utilization. This sometimes results in very large switches from brand to generic. The baseline data also fail to include some new products that have been introduced since 2001 and includes products that have been withdrawn from the market. In ah puted data for a few of the more extreme cases.
pe Formularies in the Mo
U he model, we analyzed the variations in: 1) cost sharing and 2) the number of drugs covered
mber of different hypothetical formularies. Our analysis focused on the amount of ng and total spending that each formulary’s distinct design produced.
aring
the effects of varying the tiered cost sharing rates for brand and generic drugs (15% vs. 35%).rmularies, we assumed that all drugs were covered and that the cost sharing expenditures 25% of the overall spending (in accordance with the MMA specifications).
wn in Figure 14, our analysis found that flat co-payments produce less switching than
ctual costs, have less incentive to switch to a cheaper drug than individuals who are ible for a certain portion of a drug’s actual costs. The only exception to this finding d in circumstances when there was only a brand (and no generic) drug available. Compared stant coinsurance rate of 25%, varying coinsurance to a 15% rate for generic drugs and a
te for brand names results in still more switching.
a
Figure 14. Model Results for Varying Cost Sharing Scenarios C
Switching to Own Generic
Switching to New Chemical
Price per Prescription
per Prescription
$14 for all drugs 2% 18% $43 $11 25% for all drugs 13% 39% $33 $8 15% generics, 35% brand 30% 42% $31 $8
30

Number of Drugs Covered To determine the effects of altering a formulary’s scope, we analyzed five separate prototypicaformularies, varying from extremely broad (covering all drugs) to extremely narrow (covering only the CMS minimum). We assumed that all plans had a sing
l
le coinsurance rate of 25%.
ans that covered fewer drugs produced more switching. owever, some consumers in our model refuse to switch from their off-formulary drugs, resulting
OP lary drugs.
odel Results for Formularies Covering Varying Numbers of Drugs
n Prescription
As shown in Figure 15, we found that plHin those consumers paying the full cost of the drug. Thus, while more stringent plans managed to lower the average total cost per prescription through switching, they also raised the average Ocosts for consumers, because some had to pay the full cost of their off-formu
Figure 15. M
ormulary Drugs covered
% of Brand Switching to Own Generic
% of Total Switching to New Chemical
Prescriptions Remaining Off Formulary
Average Total Cost per Prescriptio
Average OOP per
FAll Covered 257 13% 39% 0 $33 $8 Plan A 182 10% 38% 2% $34 $9 Plan L 150 29% 39% 5% $33 $9 Generics Only 120 36% 44% 13% $31 $14
CMS Minimum 56 25% 45% 20% $31 $14
Policy Implications: Analyzing Prototype Formularies This analysis of simplified prototype formularies offers some insight into how formulary variations
ill affect beneficiaries and drug utilization. Thus, we provide some indicatiw on that the use of insurance, compared to flat copayments, retains more differences in prices and thus lead to more itching of drugs. Furthermore, more switching results when brands and generics are assigned
es, both total spending and out-
f drug ry m As f coprescriptions are swi so h fo as brand loyalty, some
pay for ull cost of off ulary drugs. Overall costs go down with tighter ome of at the expen higher averag s paid by bene ries out of
ets. Whil ial TrOOP spending will be held at 25% by design under the MMA, pocket spending goes up when more drugs are excluded from a formulary.
None of these results are unexpected and some have been seen in some of the cited literature. But this additional verification is helpful and further analysis should reveal more nuances.
coswdifferent cost sharing amounts. As the amount of switching increas
f-pocket spending go down. o The number o s on a formula
tched. Becauseatters as well.
me do not switcewer drugs are r reasons such
vered, more
beneficiaries may the f -formformularies, but s that is se of e cost ficiatheir own pocktotal out-of-
e offic
31

“Real World” Formularies in the Model
to analyze two formularies—Plan A and Plan L—that are loosely based on
n tiers: 10%
nd 40%.
t, occurred
ecause some off-formulary drugs are actually cheaper than the on-formulary cost sharing rate
The greater amount of swit n results in a greater reduction in total spending (a 35% reduction versus Pla . A tim in r n Plan A (24% versus 32%). Plan L also results in lower TrOOP spending than Plan A (21% versus
gh a la g MM at eed O ma m of
plicat : Poten for Risk tion
comparing the two formularies by drug class, we ered that P costs mo r every g exc choleste rugs, making Plan A attra r those wh
edication. Alternatively, our prototypical Minimum Plan is substantially more expensive for holesterol drugs, making this plan very unattractive for cholesterol patients (although the Minimum lan is a prototype, it demonstrates the capacity for severe price differentials that actual stringent
ost only one-fifth as much as Plan A’s
However, these differences may also be masked when a consumer
f
icare-eligible opulation, by expanding our panel of experts and using them to assess and refine our elasticity
assumptions. Also, the model could be expanded to include a both wider range of drug classes (it
We also used our modeltwo actual commercial formularies currently on the market. Plan A excludes 75 drugs (out of a possible total of 257 drugs in the model), and has 3 cost sharing tiers: $10, $25, and 50%. Plan L, othe other hand, excludes 106 drugs (out of a possible 257), and has only 2 cost sharing a Our results indicated that Plan L’s more stringent design fostered a greater amount of switching, especially to generic drugs. Thus, even though Plan A initially covered both a greater number and higher volume of drugs, Plan L covered more volume than Plan A after switching occurred. In facthe amount of volume that Plan A covered was actually diminished by the switching that b(especially the 50% coinsurance rate for Plan A’s Tier 3).
ching that Plan A’s 19%)
ry meetin
L generatest the same
A specific
e, OOP spend
ions would n
g is lower fo
to maintain Tr
Plan L tha
OP 31%), althoug at a
ny formuspendin ximu 25%. Policy Im
ions tial Selec
Whenclass of dru
discovctive fo
lan Ao take only cholesterol
re foept rol d
mcPplans may create). Moreover, Plan L’s hypertension drugs c($2 versus $10), making Plan L particularly attractive those taking hypertension medication. Hence, each plan has the potential to create risk selection among consumers. Our model may be helpful in identifying these types of situations. What this looks like in actual practice is less clear, however. Consumers are unlikely to have access to such specific detailed formulary information, such as average cost by drug class, but they may see these price differences when looking at the cost of their particular medications. takes more than one class of drug. Potential for Refining the Model Our model can be further refined in various ways. Some of these are relatively simple expansions othe model, while others attempt to incorporate more complex behavioral assumptions. To make this tool as relevant and accurate as possible, we could make the baseline drug volumes specific to the Medicare-eligible population. This would require a more intensive analysis of survey data. Similarly, we could further adjust our elasticities, perhaps specifically for the Medp
32

currently covers only six classes, which equals approximately 50 percent of total drug volume for 001), and combination drugs, which we estimate account for about 15% of Medicare beneficiaries’
s switch to an on-formulary alternative or continue taking the off-formulary version, paying
s full cost. In reality, however, a patient may be unwilling to switch brands and unable to pay for
l
inally, our model could be made more dynamic by allowing prices to fluctuate in response to
s
2drug usage/volume. The assumptions behind our model could also be expanded to allow for increases and decreases in overall volume. Our model currently assumes that if a medication becomes off-formulary, its userwill either itthe full cost, and decide to stop taking the medication entirely. Similarly, a previously uninsured individual may decide to begin taking a new medication now that it is covered by insurance. Decisions such as these to stop or start taking medications will affect the volume of each individual drug, as well as the overall drug volume being consumed in the United States. Modifying our modeto account for this behavior will improve its accuracy. Fvolume shifts (a higher volume will result in a reduced unit price). This enhancement would reflect the expectation that manufacturers would normally offer a lower price (often through a larger rebate) in response to an increased market share. This would also improve our model’s exactness, a“switchability” output becomes more precise.
33

6. CONCLUSIONS AND POSSIBLE FUTURE RESEARCH This report includes both descriptive and analytic information that will help understand and improve implementation of the new Medicare drug benefit. As described at the outset, health plans and PBMs may use classification systems as a technical tool simply to organize their formularies, but they do not seem to be essential to plan decisions about which drugs to include on their formularies. In applying the rules determined by the MMA to determine whether plan formularies are adequate, however, the USP classification system has become a critical tool that could have important implications for plans’ coverage decisions. Formulary Decisions In our analysis, there are 28 classes in the USP classification scheme in which a minimally accepformulary would be able to meet the basic CMS rules but leave commonly used drugs uncovered. Ifplans regularly implemented such minimally acceptable formularies, there would be considerable impact on beneficiaries, either in terms of changing drugs or paying out of pocket to continue taking an off-formulary drug. While plans may have competing incentives to cover additional drugs, these 28 classes may warrant additional review to ensure that beneficiaries’ needs will be met.
table
According to our analysis, even real-world formularies in use today would not meet the CMS tests for adequacy without some adjustments. Presumably, it will not be too difficult for these plans to make the necessary adjustments by adding a few drugs to their formularies, or moving them to lower tiers. However, CMS may also want to pay attention to the classes that were commonly failed by current formularies to ensure that plans are providing adequate access to the drugs that Medicare beneficiaries need. We also that modeling plans at the drug class level may offer a way to look for risk selection behavior. In the real world formularies we looked at in our model, one plan was cheaper than another for beneficiaries who take only cholesterol-lowering drugs, but more costly for beneficiaries who take other types of drugs. While this is not likely driving enrollee choices in private sector health plans, such situations might lead to risk selection in a situation where beneficiaries are choosing among plans that cover only prescription drugs. During this project, we identified several questions about how drugs are defined that will have important implications for interpretations of the USP classification system and the CMS rules. Decisions about whether different forms, strengths, and extended-release versions of a drug should be considered as one drug will affect beneficiary access and plan costs. In general, CMS appears to have decided that form, strength, and extended-release cannot be used to create two versions of a drug that would count toward meeting the requirement of two drugs per class. The different versions of a drug can be treated differently, however, in terms of coverage and cost sharing. We also identified several drugs excluded from the USP system that collectively account for approximately 15% of all utilization by Medicare beneficiaries. While some of these exclusions are for policy reasons, such as drugs not covered by Part D, other exclusions appear to be oversights. Until such omissions are corrected or justified, these drugs may be less likely to appear on plan formularies.
34

cts, including
any that are heavily used. CMS has determined that combination drugs should not count toward
A PDP may choose to cover two forms of a ld enable the formulary to meet CMS standards in a certain class, but
isregard the fact that those forms are less commonly prescribed in that class. Continued
plans cover only a fraction of the available drugs, he full
rly
ay nly
aring
Unlike any other system that we studied, USP leaves out most combination produmthe two drugs per class rule. This removes some incentive for plans to include these drugs on their formulary, but retains more incentive for them to continue to cover the single-ingredient drugs in the same categories. Careful analysis of the prevalence of these excluded drugs and their importance in clinical practice may suggest the need for USP’s classification scheme to be modified in MMA’s second year to better accommodate the needs of Medicare beneficiaries. USP’s decision to classify drugs in multiple categories in some cases but not in others can affect how
d whether a formulary meets CMS requirements.anparticular drug that woudmonitoring of the classes that include drugs listed in multiple categories may help determine whether there are plans attempting to game the classification system in this way. Beneficiary Impact The burden on beneficiaries when plans do not cover the drugs they take varies by class. First, sincetilization is heavily concentrated in a few categories and classes, formulary decisions for these few u
groups of drugs can have a broad-ranging impact. Even if a plan meets CMS’ minimum rules in these classes, large numbers of beneficiaries may be affected when other drugs are uncovered. In addition, the substitutability and price of drugs in different classes affects how burdensome coverage decisions are for beneficiaries. Some categories and classes are quite diverse; the rule requiring just two to be covered may not adequately ensure all needs are satisfied. If there are lasses where drugs are not easily substitutable, but c
beneficiaries may be faced with difficult decisions about whether to change a drug or to pay tcost of an off-formulary drug. The effectiveness of plans’ exceptions processes will be particulaimportant in these cases. In fact, if drugs in particular classes are frequently the subject of an exception request, it might reveal this type of situation and suggest the need for additional formularyguidance.
onversely, some categories and classes have just one or a few rarely-used drugs. Lack of coverage Cfor these rarer drugs can still cause a formulary to “fail” the CMS rules. Although these cases mnot affect a lot of beneficiaries, the intent is to protect beneficiaries whose drugs are not commoused when they have no close substitutes for their drugs. In addition to decisions about whether a drug is on or off a plan’s formulary, decisions about cost sharing levels will also be critical to beneficiaries’ ability to get the drugs they need and to overall program costs. We provide some indication that the use of coinsurance, compared to flat opayments, retains more differences in prices and thus leads to more switching of drugs. c
Furthermore, more switching occurs when brands and generics are assigned different cost shamounts. As the amount of switching increases, both total spending and out-of-pocket spending godown. As long as beneficiaries are still receiving drugs that treat their conditions well, this is a win-win-win situation for beneficiaries, plans, and the Medicare program.
35

However, when beneficiaries decide to pay the full cost to take an off-formulary drug, their cost but
.
ome
l to fill a
verage. In this case, total rogram spending may not drop as predicted, even if new users pick the lowest-cost alternative.
otential for Future Research
me
hown for the classes included in the model, we have built the capability of using the database to ll rugs e
much
makers better understand and anticipate the specific implications of such regulation, such what percent of drug volume could be off-formulary in each drug class when minimum coverage
d at the class level, providing more etailed descriptive and “switchability” measures, giving policymakers an indication of likely
sharing is considered outside the Part D system. Overall costs go down with tighter formularies, some of that is at the expense of higher average costs paid by beneficiaries out of their own pocketsWhile official TrOOP spending will be held at 25% by design under the MMA, total out-of-pocket spending goes up when more drugs are excluded from a formulary. It could be important to track which drugs beneficiaries seek out even though they are off-formulary, to determine whether revisions are needed to the USP system or the formulary rules that would provide better access to the drugs beneficiaries need. Our results reflect a partially artificial system in which we have held the total number of prescriptions constant. Total spending and out-of-pocket spending may also be affected if the useof cost tiers affects the number of beneficiaries who take a given type of drug. For example, sbeneficiaries faced with taking a drug on a higher cost tier or an off-formulary drug may faiprescription rather than paying the higher cost out of pocket. Conversely, beneficiaries may start using additional prescription drugs given the newly available insurance cop P Follow-up projects could address a number of issues, including risk selection, the implications of CMS’s “non-discrimination” requirements, and the results of using actual Part D formularies. Sofuture work could offer additional baseline analysis of how the various drug categories differ. Assshow the balance of generic and brand drugs by category, as well as average prices – both overaand separately for generics and brands. If more information on the relative substitutability of din different categories becomes available, this information could be incorporated in this baselinanalysis as well. Although we touched upon the possibility of risk selection in this project, a more comprehensive and detailed study that focused solely on the potential for risk selection by drug class would bemore insightful. A study that systematically analyzed the “non-discrimination” requirements would help policyasrequirements are met. Finally, a study that analyzed actual PDP formularies would reveal likely volume and on- and off-formulary spending amounts. Analysis could be performedoutcomes and potential problems that could accompany the full implementation of the MMA.
36

APPENDICES Classification Systems and Formularies
Appendix A: Tables describing classification systems and formularies
itional information on model
Appendix B: Crosswalks showing drugs as classified by different systems
Appendix C: Information from plan interviews USP Classification System and CMS Rules
Appendix D: MCBS utilization by USP class and category
Appendix E: Commonly used drugs
Appendix F: Do “real world” formularies meet CMS tests? Formulary Analysis Model
Appendix G: Additional information on elasticity
Appendix H: Elasticity panel members
ppendix I: AddA
Formulary Simulation Model
37