final report of the proficiency testing in vehicles...
TRANSCRIPT

Final Report of the Proficiency Testing in Vehicles Emissions
8th Round

May 9th, 2017 Page 1 of 42
PROFICIENCY TESTING IN VEHICLES EMISSIONS – 8th
ROUND
Registration period: From 09/05/16 to 13/05/16
FINAL REPORT N° 002/17
PROFICIENCY TESTING ORGANIZATION
Instituto Nacional de Metrologia, Qualidade e Tecnologia - Inmetro
Diretoria de Metrologia Científica e Tecnologia - Dimci
Endereço: Av. Nossa Senhora das Graças, 50 - Xerém - Duque de Caxias
RJ - Brasil - CEP: 25250-020
E-mail para contato: [email protected]
ORGANIZING COMMITTEE
Adelcio Rena Lemos (Inmetro/Dimci/GT-PEP)
Janaina Marques Rodrigues Caixeiro (Inmetro/Dimci/ Dimqt)
José Ricardo Bardellini da Silva (Inmetro/Dimci/GT-PEP)
Neivaldo Silva Nonato (Inmetro/Dimci/GT-PEP)
Paulo Roberto da Fonseca Santos (Inmetro/Dimci/GT-PEP) - Coordinator PEP- Inmetro
Paulo Roque Martins Silva (Inmetro/Dimci/Dimqt/Lafiq)
Valnei Smarçaro da Cunha (Inmetro/Dimci/Dimqt)
TECHNICAL COMMITTEE
Danilo Torres (AEA)
Gabriel Fonseca Sarmanho (Inmetro/Dimci/Dimqt)
Janaina Marques Rodrigues Caixeiro (Inmetro/Dimci/ Dimqt)
Luiz Henrique da Conceição Leal (Inmetro/Dplan/Dgcor)
Paulo Roque Martins Silva (Inmetro/Dimci/ Dimqt /Lafiq)
Valnei Smarçaro da Cunha (Inmetro/Dimci/ Dimqt)

Final Report of the Proficiency Testing in Vehicles Emissions – 8th
round
Page 2 of 42
SUMMARY
1. Introduction ............................................................................................................................ 3
2. Materials and Methods ........................................................................................................... 4
2.1. Test Item ............................................................................................................................. 4
2.2. Methodology ....................................................................................................................... 4
3. Test Item Conditions .............................................................................................................. 5
4. Performance Evaluation ......................................................................................................... 5
4.1. Z-score ........................................................................................................................... 5
5. Assigned Values .................................................................................................................... 6
6. Dispersion Results ................................................................................................................. 8
6.1. Urban Cycle Emissions....................................................................................................... 8
6.2. HOT Cycle Emissions ....................................................................................................... 14
6.3. Road Cycle Emissions ...................................................................................................... 18
7. Laboratories’ Results ............................................................................................................ 21
7.1. Urban Cycle Emissions..................................................................................................... 21
7.2. Hot Cycle Emissions ......................................................................................................... 29
7.3. Road Cycle Emissions ...................................................................................................... 33
8. Analysis Testimony .............................................................................................................. 37
8.1. Urban Cycle Emissions..................................................................................................... 37
8.2. Hot Cycle Emissions ......................................................................................................... 38
8.3. Road Cycle Emissions ...................................................................................................... 39
9. Confidentiality....................................................................................................................... 40
10. Conclusions .................................................................................................................. 40
11. Participating Laboratories ............................................................................................. 41
12. References ................................................................................................................... 42

Final Report of the Proficiency Testing in Vehicles Emissions – 8th
round
Page 3 of 42
1. Introduction
Air pollution problem is a serious threat to human health decreasing the quality of human life.
Automotive vehicles are potential agents of pollution worldwide as their gas emissions carry several
toxic substances which, in some cases, in contact with the respiratory system, can produce several
negative health effects and cause traffic accidents due to decreased visibility.
The analysis of pollutants is one of the most delicate items of a vehicle or an engine emission test.
The Proficiency Testing Schemes (PT Scheme) of automotive emissions evaluate laboratories by the
determination of the compound amounts in vehicle emissions, providing then subsidies to laboratories
to identify and solve analytical problems, contributing to the harmonization of emission measurements
in the country.
Proficiency testing scheme is a quality tool for the identification of interlaboratory differences, but the
assessment is punctual. A PT Scheme aims to compare measurement results from different
laboratories, performed under similar conditions, and then to obtain an assessment of the technical
competence of participating laboratories in order to demonstrate the reliability of their measurement
processes. The participating laboratories, in their turn, have the opportunity to review their analysis
procedures and to implement improvements in their processes, if necessary.
In this round, the following vehicle emission parameters were evaluated: (CO, CO2, THC, NOx,
NMHC, ETOH, NMHC-ETOH and Total aldehydes (formaldehyde + acetaldehyde)) in g/km, and
urban autonomy and road autonomy in km/L for urban cycle. CO, CO2, THC, NOx, NMHC in g/km for
hot cycle and CO, CO2, THC, NOx, NMHC in g/km for road cycle. These parameters were evaluated
with participation of seventeen laboratories, one more than the last round.
This report presents the results of the performance evaluation of participants, the methodology used
in the tests and the procedure used for the statistical analysis.
The objectives of this PT scheme were:
To determine the performance of laboratories for the proposed tests;
To monitor the ongoing performance of the analytical vehicle emissions laboratories;
To increase the confidence of the measuring emission process of the vehicle emission
laboratories;
To continuously improve the measurement techniques of vehicle emissions laboratories.

Final Report of the Proficiency Testing in Vehicles Emissions – 8th
round
Page 4 of 42
2. Materials and Methods
2.1. Test Item
The test item was a vehicle supplied by General Motors Brazil having the following characteristics:
Model Chevrolet ONIX LTZ, black, identification code BR028273, engine 1.4 LSPE/4, 6 speed
automatic transmission, FlexPower, equivalent inertia of 1247 kg. The test vehicle was correlated
without the purge system of the blow-by gas canister and exhaust (the test item was supplied with the
needed adjustments), as there wasn´t, in this edition, evaporative emission measurement.
Each participating laboratory should use its own fuel (Reference Hydrated Ethanol according to
current ABNT NBR 8689).
2.2. Methodology
The standard methods used for emission measurements were ABNT NBR 6601, 7024, 12026 and
15598. The tests defined by these standard methods are complementary and were carried out
simultaneously. The values of deceleration times (coast down) were provided by GM Brazil emission
laboratory, vehicle owner, to the participants in order to adjust their dynamometers and reproduce the
deceleration times. The laboratories should replicate the deceleration times in the dynamometer
informed by GM emission lab.
Three different tests were performed:
THC; NMHC, ETOH, NMHC-ETOH, Total Aldehydes, NOx, CO, CO2, Urban and Road
Autonomy determination , according to ABNT NBR 6601, 7024, 12026 and 15598.
THC, NMHC, NOx, CO e CO2 determination according to the third phase of ABNT NBR 6601
– HOT 505 cycle.
THC, NMHC, NOx, CO e CO2 determination in road cycle according to ABNT NBR 7024
standard.
Participants should have followed the test flow chart presented below and they preferably should have
started the test at a 25 ºC temperature in order to minimize the effects of the cold start in the results.

Final Report of the Proficiency Testing in Vehicles Emissions – 8th
round
Page 5 of 42
Figure 1- Measurement activities flow chart of the Proficiency Testing
3. Test Item Conditions
The results of GM emission laboratory performed in the beginning, in the middle and in the end of the
round were used to statistically evaluate the integrity of the test item.
For the 10 analyzed parameters (CO, CO2, THC, NOx, NMHC, ETOH, NMHC-ETOH, Total
Aldehydes, urban Autonomy and Road Autonomy), for urban cycle, the 5 parameters for the hot cycle
(THC, NMHC, NOx, CO e CO2) and the last five for road cycle (THC, NMHC, NOx, CO e CO2), the
results were the same, with p-value greater than 0.05. Therefore, it can be stated that there is no
statistically significant difference between the means at a confidence level of 95% and the sample
data can be regarded as arising from the same population. Thus, the vehicle remained intact during
the course of this Proficiency Test for the different tests.
Due to the confidentiality of the results, as GM has participated in the PT, these results are not
shown.
4. Performance Evaluation
4.1. Z-score
For performance evaluation of the individual participant results, one of the criteria described in ABNT
NBR ISO/IEC 17043:2011 was carried out, the z-score (measure of the relative distance of the
participant measurement result from the PT assigned value), that was calculated according to
equation 1.
ˆ
Xxz i
i (1)
Thermic conditions stabilization:
12 to 36 h
Emission tests according to ABNT
NBR 6601 (urban cycle)
Emission tests according to ABNT
NBR 7024 (road cycle)
Preconditioning according to ABNT
NBR 6601 standard (item 5.4.3)
Final Report of the Proficiency Testing in Vehicles Emissions – 8th
round
Page 6 of 42
Where:
xi is the average result of each participant;
X is the assigned value for this PT;
ˆ is the standard deviation for the PT, which was calculated in this round based on ISO 13528:2015,
i.e., a robust standard deviation based on the results of the participants.
The interpretations of the z-score are presented as follows:
|z| ≤ 2,0 - Indicates “satisfactory” performance and generates no signal;
2,0 < |z| <3,0 - Indicates “questionable” performance and generates a warning signal;
|z| ≥ 3,0 - Indicates “unsatisfactory” performance and generates an action signal.
5. Assigned Values
According to the available procedures to establish assigned values in ABNT NBR
ISO/IEC 17043:2011, the assigned values of this PT were calculated using statistical methods
described in item 5.6 of ISO 13528:2015 standard, i.e., consensus values of participants.
ISO 13528:2015 describes the robust analysis involving the use of the “A” estimation algorithm for the
calculation of the assigned value and the standard deviation. Robust statistical techniques are used to
minimize the influence that extreme results can have on the average and standard deviation.
Initially, all values object of the analysis (values sent by the participants) were placed in ascending
order. Then, values of robust average and robust standard deviation of these data by (x*) and (s*)
were denoted. The initial values of (x*) and (s*) were calculated according to the following equations:
ixofmedian*x (2)
s* = 1,483 x median |xi – x*| (3)
The values of (x*) e (s*) were updated as follows:
*s,51 (4)
For each xi (i = 1, 2,..., p), it was calculated:
otherwise,x
xxif,x
xxif,x
x
i
*i
*
*i
*
*i
--
(5)
new values of (x*) e (s*) should be calculated from the equations:
p/xx *i
* (6)

Final Report of the Proficiency Testing in Vehicles Emissions – 8th
round
Page 7 of 42
)1p(2)*x*ix(134,1*s (7)
Where the summation is over i.
The robust estimations (x*) and (s*) can be obtained by an iterative calculation, i.e., by updating the
values of (x*) and (s*) several times using the modified data, until the process converges.
Convergence may be assumed when there is no change from one iteration to the next in the third
significant figure of the robust standard deviation and of the equivalent figure in the robust average.
The results out of 2 standard deviation intervals after the robust average and robust standard
deviation calculation were considered as outliers and new assigned values as well new robust
standard deviation results were calculated for each parameter of the PT, removing those outliers.
The tables below present the assigned values and the robust standard deviation for all parameters,
including all PT participants, as well as the new robust average and standard deviation values after
removal of the outlier results.014
Table 01 - Assigned Values and standard deviation of the PT – Urban Cycle.
Parameter Assigned
Value Standard Deviation
Outliers (Participants)
Recalculated Assigned
Value
Recalculated Standard Deviation
CO (g/km) 0.948 0.108 55 0.958 0.100
CO2(g/km) 155.2 3.2 45 154.9 2.9
THC (g/km) 0.127 0.019 51 0.125 0.018
NOx (g/km) 0.017 0.004 27.86 0.016 0.003
NMHC (g/km) 0.098 0.017 51 0.096 0.016
ETOH (g/km) 0.1626 0.0349 - - -
NMHC-ETOH (g/km)
0.033 0.022 86 0.028 0.016
Total Aldehydes (g/km)
0.0088 0.0018 39 0.0091 0.0014
Urban Autonomy
(km/L) 9.15 0.20 45 9.17 0.19
Road Autonomy (km/L)
12.45 0.23 45 12.47 0.21

Final Report of the Proficiency Testing in Vehicles Emissions – 8th
round
Page 8 of 42
Table 02 - Assigned Values and standard deviation of the PT – HOT Cycle
Parameter Assigned
Value Standard Deviation
Outliers (Participants)
Recalculated Assigned
Value
Recalculated Standard Deviation
CO (g/km) 0.407 0.078 - - -
CO2(g/km) 143.4 3.2 - - -
THC (g/km) 0.013 0.003 5 0.013 0.002
NOx (g/km) 0.016 0.005 - - -
NMHC (g/km) 0.001 0.001 1 0.001 0.001
Table 03 - Assigned Values and standard deviation of the PT – Road Cycle
Parameter Assigned
Value Standard Deviation
Outliers (Participants)
Recalculated Assigned
Value
Recalculated Standard Deviation
CO (g/km) 0.162 0.039 75 0.158 0.033
CO2(g/km) 115.4 2.4 13. 26 114.9 2.0
THC (g/km) 0.004 0.001 71 0.004 0.001
NOx (g/km) 0.008 0.002 30.75 0.008 0.001
NMHC (g/km) 0.001 0.001 - - -
6. Dispersion Results
In the presented graphs for all tested parameters, a continuous line represents the assigned value
and each laboratory is identified by its identification code. Dotted lines are representations of Ref ± 1s
and ± 2s, where "Ref" is the assigned value (robust average) and "s" is the robust standard deviation.
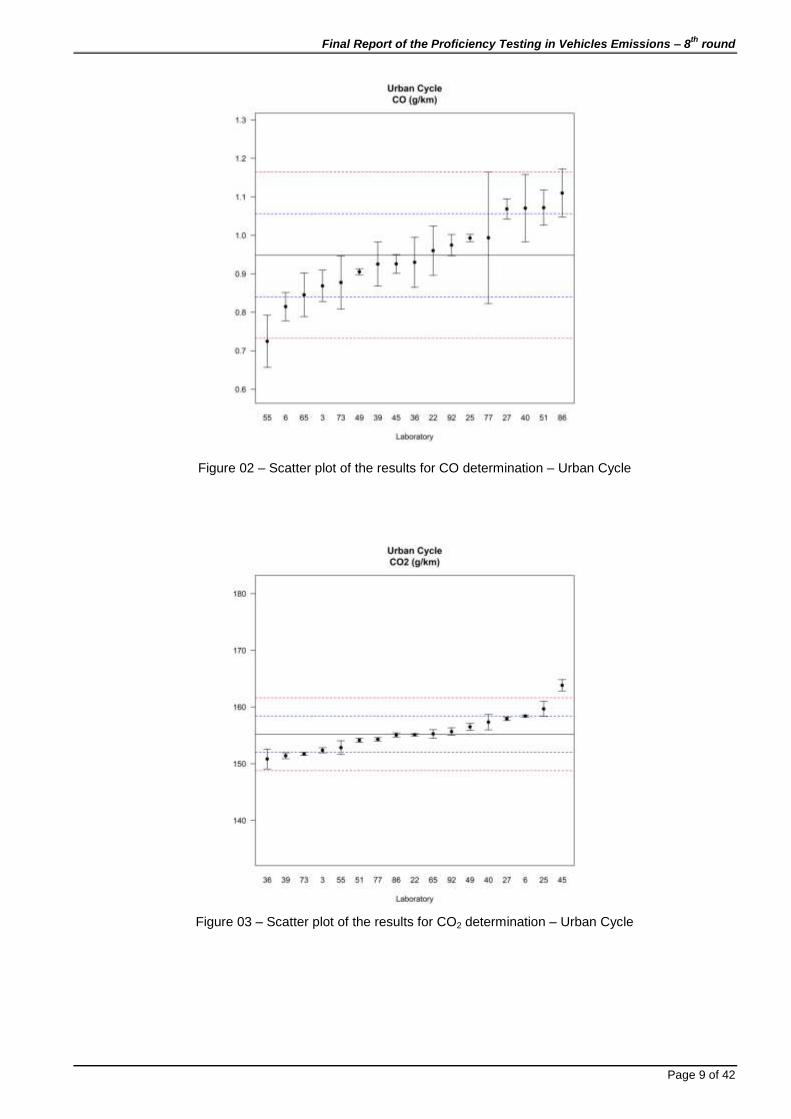
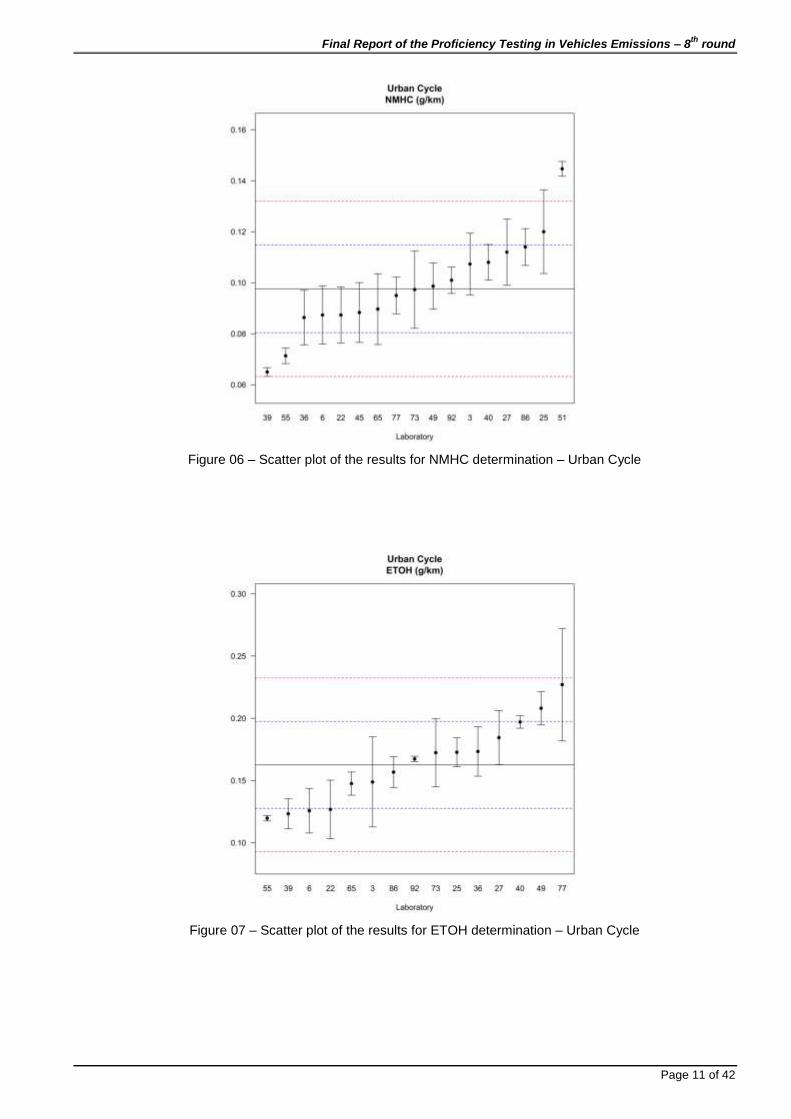
6.1. Urban Cycle Emissions
Figures 02 to 11 present graphically the means and standard deviations of the emission results
reported by the laboratories for each analyzed parameter.
Final Report of the Proficiency Testing in Vehicles Emissions – 8th
round
Page 9 of 42
Figure 02 – Scatter plot of the results for CO determination – Urban Cycle
Figure 03 – Scatter plot of the results for CO2 determination – Urban Cycle

Final Report of the Proficiency Testing in Vehicles Emissions – 8th
round
Page 10 of 42
Figure 04 – Scatter plot of the results for THC determination – Urban Cycle
Figure 05 – Scatter plot of the results for NOx determination – Urban Cycle
Final Report of the Proficiency Testing in Vehicles Emissions – 8th
round
Page 11 of 42
Figure 06 – Scatter plot of the results for NMHC determination – Urban Cycle
Figure 07 – Scatter plot of the results for ETOH determination – Urban Cycle

Final Report of the Proficiency Testing in Vehicles Emissions – 8th
round
Page 12 of 42
Figure 08 – Scatter plot of the results for NMHC-ETOH determination – Urban Cycle
Figure 09 – Scatter plot of the results for Total Aldehydes determination – Urban Cycle

Final Report of the Proficiency Testing in Vehicles Emissions – 8th
round
Page 13 of 42
Figure 10 – Scatter plot of the results for Urban Autonomy determination – Urban Cycle
Figure 11 – Scatter plot of the results for Road Autonomy determination – Urban Cycle
Final Report of the Proficiency Testing in Vehicles Emissions – 8th
round
Page 14 of 42
Through the graphs, it can be seen that:
CO (g/km): 11 participants presented results between the range of Ref ± 1s and the participants 6,
27, 40, 51 and 86 presented results between the range of Ref ± 1s and Ref ± 2s. Participant 55
presented result out of Ref ± 2s limits, considered an outlier.
CO2 (g/km): 12 participants presented results between the range of Ref ± 1s and the participants
25, 36, 39 and 73 presented results between the range of Ref ± 1s and Ref ± 2s. Participant 45
presented result out of Ref ± 2s limits, considered an outlier.
THC (g/km): among the 17 participants, 11 of them presented results between the range of Ref ±
1s and the participants 25, 39, 55 and 86 presented results between the range Ref ± 1s and Ref ±
2s. Only the participant 51 had a result outside the range Ref ± 2s, considered an outlier.
NOx (g/km): 12 participants presented results between the range of Ref ± 1s and the participants
39, 55, 73 and 86 presented results between the range Ref ± 1s and Ref ± 2s. Participants 27 and
86 presented results outside the range of Ref ± 2s, considered outliers.
NMHC (g/km): 13 of the 17 participants presented results between the range of Ref ± 1s and the
participants 25, 39 and 55 presented results between the range Ref ± 1s and Ref ± 2s. Only
participant 51 had a result outside the range of Ref ± 2s, considered an outlier.
ETOH (g/km): 15 participants reported valid results, among them 10 presented results between the
range of Ref ± 1s and 5 presented results between the range Ref ± 1s and Ref ± 2s. There were
no outliers.
NMHC-ETOH (g/km): among the 15 participants that reported valid results, 10 presented results
between the range of Ref ± 1s and participants 25, 27, 36 and 49 presented results between the
range Ref ± 1s and Ref ± 2s. Participant 86 presented result out of Ref ± 2s limits, considered an
outlier.
Total Aldehydes (g/km): The majority of the participants (10) presented results between the range
of Ref ± 1s and the participants 25, 45, 49 and 92 presented results between the range of Ref ± 1s
and Ref ± 2s. Participant 39 presented result out of Ref ± 2s limits, considered an outlier.
Urban Autonomy (km/L): 13 of 17 valid results for this parameter presented results between the
range of Ref ± 1s and participants 25, 36 and 39 presented results between the range of Ref ± 1s
and Ref ± 2s. Participant 45 presented result out of Ref ± 2s limits, considered an outlier.
Road Autonomy (km/L): Most of participants presented results between the range of Ref ± 1s and
participants 22, 39, 40, 77 and 92 presented results between the range of Ref ± 1s and Ref ± 2s.
Participant 45 presented result out of Ref ± 2s limits, considered an outlier.
6.2. Hot Cycle Emissions
Figures 12 to 16 present graphically the means and standard deviations of the results reported by the
laboratories for each analyzed parameter of Hot Cycle.

Final Report of the Proficiency Testing in Vehicles Emissions – 8th
round
Page 15 of 42
Figure 12 – Scatter plot of the results for CO determination – Hot Cycle
Figure 13 – Scatter plot of the results for CO2 determination – Hot Cycle

Final Report of the Proficiency Testing in Vehicles Emissions – 8th
round
Page 16 of 42
Figure 14 – Scatter plot of the results for THC determination – Hot Cycle
Figure 15 – Scatter plot of the results for NOx determination – Hot Cycle

Final Report of the Proficiency Testing in Vehicles Emissions – 8th
round
Page 17 of 42
Figure 16 – Scatter plot of the results for NMHC determination – Hot Cycle
Through the graphs, it can be seen that:
CO (g/km): All the reported results for this parameter are in the range Ref ± 2s. Among them 14
presented results between the range of Ref ± 1s and the participants 2, 28 and 84 presented
results between the range of Ref ± 1s and Ref ± 2s.
CO2 (g/km): 11 participants presented results between the range of Ref ± 1s and the participants 4,
41, 58, 59, 69 e 83 presented results between the range of Ref ± 1s and Ref ± 2s. There was no
result out of the Ref ± 2s limits for this parameter.
THC (g/km): 11 among the 17 participants presented results between the range of Ref ± 1s and
participants 2, 15, 58, 59 and 84 presented results between the range Ref ± 1s and Ref ± 2s. Only
participant 5 presented result out of the Ref ± 2s limits, considered an outlier.
NOx (g/km): Most of the participants (11) presented results between the range of Ref ± 1s and
participants 2, 4, 15, 28, 34 and 69 presented results between the range Ref ± 1s and Ref ± 2s.
There was no result out of the Ref ± 2s limits for this parameter.
NMHC (g/km): The reported concentrations for this parameter are very low and the results
dispersion is high. 11 participants presented results between the range of Ref ± 1s and the
participants 2, 4, 5, 58 and 59 presented results between the range Ref ± 1s and Ref ± 2s. Only
participant 1 presented result out of Ref ± 2s limits, considered an outlier.

Final Report of the Proficiency Testing in Vehicles Emissions – 8th
round
Page 18 of 42
6.3. Road Cycle Emissions
Figures 17 to 21 present graphically the means and standard deviations of the results reported by the
laboratories for each analyzed parameter of Road Cycle.
Figure 17 – Scatter plot of the participants results for CO determination – Road Cycle
Figure 18 – Scatter plot of the participants results for CO2 determination – Road Cycle

Final Report of the Proficiency Testing in Vehicles Emissions – 8th
round
Page 19 of 42
Figure 19 – Scatter plot of the participants results for THC determination – Road Cycle
Figure 20 – Scatter plot of the participants results for NOx determination – Road Cycle

Final Report of the Proficiency Testing in Vehicles Emissions – 8th
round
Page 20 of 42
Figure 21 – Scatter plot of the participants results for NMHC determination – Road Cycle
Through the graphs, it can be seen that:
CO (g/km): Most of the participants presented results between the range of Ref ± 1s and the
participants 13, 30, 66 and 74 presented results between the range of Ref ± 1s and Ref ± 2s.
Participant 75 presented result out of Ref ± 2s limits, considered an outlier.
CO2 (g/km): Most of the participants presented results between the range of Ref ± 1s and the
participants 10, 48 and 61 presented results between the range of Ref ± 1s and Ref ± 2s.
Participants 13 and 26 presented results out of Ref ± 2s limits, considered outliers. Participant 13
showed a very high standard deviation compared to the other participants.
THC (g/km): 13 participants presented results between the range of Ref ± 1s and participants 10,
30 and 67 presented results between the range Ref ± 1s and Ref ± 2s. Participant 71 presented
result out of Ref ± 2s limits, considered an outlier. The presented average was 8 times higher than
the calculated robust average and the variation coefficient for the measurement was 100 %.
NOx (g/km): 13 out of 17 participants presented results between the range of Ref ± 1s and the
participants 13 and 66 presented results between the range Ref ± 1s and Ref ± 2s. Participants 30
and 75 presented results out of Ref ± 2s limits, considered outliers.
NMHC (g/km): 16 participants reported valid results for this parameter that shows low
concentration levels and a high dispersion of the results. 14 participants presented results between
the range of Ref ± 1s and participants 30 and 71 presented results between the range Ref ± 1s
and Ref ± 2s.
Final Report of the Proficiency Testing in Vehicles Emissions – 8th
round
Page 21 of 42
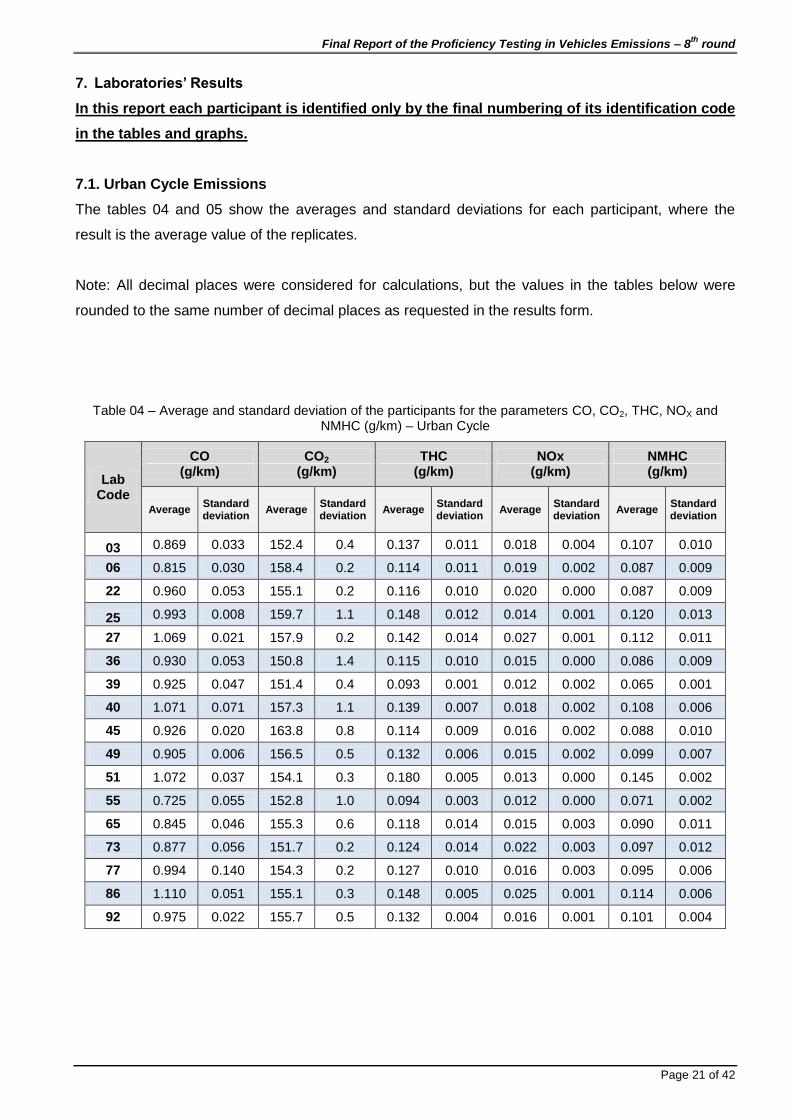
7. Laboratories’ Results
In this report each participant is identified only by the final numbering of its identification code
in the tables and graphs.
7.1. Urban Cycle Emissions
The tables 04 and 05 show the averages and standard deviations for each participant, where the
result is the average value of the replicates.
Note: All decimal places were considered for calculations, but the values in the tables below were
rounded to the same number of decimal places as requested in the results form.
Table 04 – Average and standard deviation of the participants for the parameters CO, CO2, THC, NOX and NMHC (g/km) – Urban Cycle
Lab Code
CO CO2 THC NOx NMHC (g/km) (g/km) (g/km) (g/km) (g/km)
Average Standard deviation
Average Standard deviation
Average Standard deviation
Average Standard deviation
Average Standard deviation
03 0.869 0.033 152.4 0.4 0.137 0.011 0.018 0.004 0.107 0.010
06 0.815 0.030 158.4 0.2 0.114 0.011 0.019 0.002 0.087 0.009
22 0.960 0.053 155.1 0.2 0.116 0.010 0.020 0.000 0.087 0.009
25 0.993 0.008 159.7 1.1 0.148 0.012 0.014 0.001 0.120 0.013
27 1.069 0.021 157.9 0.2 0.142 0.014 0.027 0.001 0.112 0.011
36 0.930 0.053 150.8 1.4 0.115 0.010 0.015 0.000 0.086 0.009
39 0.925 0.047 151.4 0.4 0.093 0.001 0.012 0.002 0.065 0.001
40 1.071 0.071 157.3 1.1 0.139 0.007 0.018 0.002 0.108 0.006
45 0.926 0.020 163.8 0.8 0.114 0.009 0.016 0.002 0.088 0.010
49 0.905 0.006 156.5 0.5 0.132 0.006 0.015 0.002 0.099 0.007
51 1.072 0.037 154.1 0.3 0.180 0.005 0.013 0.000 0.145 0.002
55 0.725 0.055 152.8 1.0 0.094 0.003 0.012 0.000 0.071 0.002
65 0.845 0.046 155.3 0.6 0.118 0.014 0.015 0.003 0.090 0.011
73 0.877 0.056 151.7 0.2 0.124 0.014 0.022 0.003 0.097 0.012
77 0.994 0.140 154.3 0.2 0.127 0.010 0.016 0.003 0.095 0.006
86 1.110 0.051 155.1 0.3 0.148 0.005 0.025 0.001 0.114 0.006
92 0.975 0.022 155.7 0.5 0.132 0.004 0.016 0.001 0.101 0.004

Final Report of the Proficiency Testing in Vehicles Emissions – 8th
round
Page 22 of 42
Table 05 – Average and standard deviation of the participants for the parameters ETOH, NMHC-ETOH, Total Aldehydes (g/km), Urban Autonomy (km/L) and Road Autonomy (km/L) – Urban Cycle
Lab Code
ETOH (g/km)
NMHC-ETOH (g/km)
Total Aldehydes (g/km)
Urban Autonomy (km/L)
Road Autonomy (km/L)
Average Standard deviation
Average Standard deviation
Average Standard deviation
Average Standard deviation
Average Standard deviation
03 0.1488 0.0296 0.043 0.003 0.0101 0.0014 9.35 0.03 12.61 0.03
06 0.1257 0.0146 0.029 0.002 0.0085 0.0007 9.02 0.01 12.44 0.05
22 0.1268 0.0192 0.038 0.003 0.0087 0.0023 9.12 0.01 12.21 0.04
25 0.1727 0.0095 0.071 0.015 0.0053 0.0011 8.90 0.06 12.32 0.07
27 0.1844 0.0177 0.069 0.006 0.0094 0.0015 9.00 0.01 12.27 0.02
36 0.1733 0.0162 0.009 0.002 0.0092 0.0009 9.43 0.09 12.47 0.09
39 0.1233 0.0098 0.017 0.004 0.0048 0.0004 9.41 0.03 12.71 0.09
40 0.1970 0.0041 0.022 0.001 0.0105 0.0015 9.02 0.06 12.73 0.03
45 NM NM NM NM 0.0063 0.0004 8.70 0.04 11.75 0.03
49 0.2080 0.0109 0.009 0.002 0.0112 0.0007 9.04 0.03 12.31 0.05
51 NM NM NM NM NM NM 9.00 0.01 12.46 0.07
55 0.1197 0.0018 0.024 0.003 0.0089 0.0002 9.32 0.07 12.29 0.09
65 0.1475 0.0076 0.020 0.009 0.0085 0.0009 9.23 0.03 12.58 0.05
73 0.1723 0.0224 0.025 0.005 NM NM 9.32 0.02 12.52 0.03
77 0.2270 0.0369 0.031 0.003 0.0085 0.0005 9.21 0.00 12.74 0.04
86 0.1567 0.0100 0.087 0.005 0.0093 0.0007 9.16 0.02 12.62 0.09
92 0.1673 0.0017 0.026 0.005 0.0107 0.0024 9.13 0.03 12.19 0.05
NM - Not Measured
For the performance evaluation of the participants, z-score values were calculated, after the exclusion
of the outlier results, using the robust average and robust standard deviation of the results for each
parameter as assigned value and its standard deviation. Tables 06 and 07 and figures 22 to 31 show
these results.
Table 06 – z-score values for the parameters CO, CO2, THC, NOX and NMHC – Urban Cycle
CO (g/km) CO2 (g/km) THC (g/km) NOX (g/km) NMHC (g/km)
Lab Z score Lab Z score Lab Z score Lab Z score Lab Z score
03 -0.90 03 -0.86 03 0.69 03 0.63 03 0.71
06 -1.44 06 1.20 06 -0.65 06 0.96 06 -0.55
22 0.02 22 0.07 22 -0.50 22 1.38 22 -0.55
25 0.35 25 1.63 25 1.29 25 -0.76 25 1.52
27 1.10 27 1.04 27 0.97 27 3.52 27 1.01
36 -0.28 36 -1.38 36 -0.59 36 -0.22 36 -0.62
39 -0.33 39 -1.19 39 -1.84 39 -1.19 39 -1.97
40 1.12 40 0.84 40 0.76 40 0.74 40 0.76
45 -0.33 45 3.05 45 -0.65 45 -0.11 45 -0.49
49 -0.53 49 0.55 49 0.39 49 -0.44 49 0.17
51 1.14 51 -0.26 51 3.10 51 -1.08 51 3.08
55 -2.34 55 -0.70 55 -1.78 55 -1.19 55 -1.57
65 -1.13 65 0.13 65 -0.39 65 -0.22 65 -0.40
73 -0.81 73 -1.07 73 -0.07 73 2.03 73 0.08
77 0.35 77 -0.20 77 0.10 77 -0.11 77 -0.07
86 1.52 86 0.06 86 1.27 86 2.99 86 1.14
92 0.16 92 0.27 92 0.39 92 0.10 92 0.31
Highlighted in blue: questionable values. In red: unsatisfactory values

Final Report of the Proficiency Testing in Vehicles Emissions – 8th
round
Page 23 of 42
Table 07 – z-score values for the parameters ETOH, NMHC-ETOH, Total Aldehydes (g/km), Urban Autonomy (km/L) e Road Autonomy (km/L)– Urban Cycle
ETOH (g/km)
NMHC-ETOH (g/km)
Total Aldehydes (km/L)
Urban Autonomy (km/L)
Road Autonomy (km/L)
Lab Z score Lab Z score Lab Z score Lab Z score Lab Z score
03 -0.39 03 0.95 03 0.72 03 0.96 03 0.66
06 -1.06 06 0.02 06 -0.43 06 -0.79 06 -0.13
22 -1.03 22 0.64 22 -0.26 22 -0.23 22 -1.23
25 0.29 25 2.77 25 -2.69 25 -1.45 25 -0.70
27 0.63 27 2.62 27 0.18 27 -0.91 27 -0.94
36 0.31 36 -1.25 36 0.04 36 1.39 36 0.01
39 -1.13 39 -0.75 39 -3.04 39 1.30 39 1.17
40 0.99 40 -0.39 40 1.00 40 -0.77 40 1.23
45 NM 45 NM 45 -1.94 45 -2.50 45 -3.43
49 1.30 49 -1.25 49 1.46 49 -0.66 49 -0.73
51 NM 51 NM 51 NM 51 -0.91 51 -0.02
55 -1.23 55 -0.30 55 -0.12 55 0.84 55 -0.83
65 -0.43 65 -0.54 65 -0.45 65 0.36 65 0.55
73 0.28 73 -0.19 73 NM 73 0.84 73 0.26
77 1.85 77 0.19 77 -0.40 77 0.25 77 1.28
86 -0.17 86 3.81 86 0.13 86 -0.02 86 0.74
92 0.14 92 -0.13 92 1.14 92 -0.21 92 -1.30
Highlighted in blue: questionable values. In red: unsatisfactory values, NM = Not Measured
Figure 22 – z-score graph for CO measurement – Urban cycle

Final Report of the Proficiency Testing in Vehicles Emissions – 8th
round
Page 24 of 42
Figure 23 – z-score graph for CO2 measurement – Urban Cycle
Figure 24 – z-score graph for THC measurement – Urban Cycle

Final Report of the Proficiency Testing in Vehicles Emissions – 8th
round
Page 25 of 42
Figure 25 – z-score graph of for NOx measurement - Urban Cycle
Figure 26 – z-score graph for NMHC measurement – Urban Cycle

Final Report of the Proficiency Testing in Vehicles Emissions – 8th
round
Page 26 of 42
Figure 27 – z-score graph for Total Aldheydes measurement – Urban Cycle
Figure 28 – z-score graph for NMHC-ETOH measurement – Urban Cycle

Final Report of the Proficiency Testing in Vehicles Emissions – 8th
round
Page 27 of 42
Figure 29 – z-score graph for Total Aldehydes measurement – Urban Cycle
Figure 30 – z-score graph for Urban Autonomy measurement – Urban Cycle

Final Report of the Proficiency Testing in Vehicles Emissions – 8th
round
Page 28 of 42
Figure 31 – z-score graph for Road Autonomy measurement – Urban Cycle
Through z-score analysis, it can be seen that:
CO (g/km): Participant 55 result was considered an outlier and it was excluded from the robust
average calculation. The observed variation coefficient around 10% makes the acceptation limit lower
and, even considered an outlier, the presented result is considered questionable. If there was no
exclusion of the results, this one would be considered satisfactory.
CO2 (g/km): Participant 45 had its result removed from the robust mean, as it was out of the Ref ±
2s limits. In this case, as the mean result is discrepant compared to the other participants, the result is
considered unsatisfactory.
THC (g/km): Only participant 51 showed unsatisfactory result.
NOx (g/km): Participants 73 and 86 showed questionable results and participant 27 showed
unsatisfactory result.
NMHC (g/km): Only participant 51 showed unsatisfactory result.
ETOH (g/km): All 15 participants that presented valid results, showed satisfactory results.
Participant 45 didn’t reported valid results, while participant 51 didn’t report results for this parameter.
NMHC-ETOH (g/km): Participants 45 and 49 didn´t report their results. Participants 25 and 27
showed questionable results, while participant 86 showed unsatisfactory result.
Total Aldehydes (g/km): Participants 51 and 73, participant 25 showed a questionable result and
participant 39 showed an unsatisfactory result.
Urban Autonomy (km/L): Participant 45 showed a questionable result.
Road Autonomy (km/L): Participant 45 showed unsatisfactory result.

Final Report of the Proficiency Testing in Vehicles Emissions – 8th
round
Page 29 of 42
7.2. Hot Cycle Emissions
Table 08 shows the averages and standard deviations for each participant, where the result is the
average value of the replicates.
Note: All decimal places were considered for calculations, but the values in the tables below were
rounded to the same number of decimal places as requested in the results form.
Table 08 – Average and standard deviation of the participants for the parameters CO, CO2, THC, NOX and NMHC (g/km) – Hot Cycle
Lab Code
CO CO2 THC NOx NMHC (g/km) (g/km) (g/km) (g/km) (g/km)
Average Standard deviation
Average Standard deviation
Average Standard deviation
Average Standard deviation
Average Standard deviation
01 0.458 0.034 145.9 0.8 0.014 0.002 0.015 0.001 0.004 0.002
02 0.561 0.039 143.2 0.5 0.017 0.003 0.024 0.000 0.003 0.002
04 0.354 0.020 146.7 0.7 0.012 0.001 0.010 0.002 0.000 0.000
05 0.469 0.031 145.7 2.5 0.020 0.003 0.019 0.005 0.003 0.001
15 0.331 0.031 143.0 0.7 0.016 0.005 0.010 0.000 0.002 0.000
16 0.359 0.049 141.4 0.6 0.014 0.002 0.011 0.002 0.001 0.000
28 0.298 0.034 144.0 0.4 0.012 0.003 0.010 0.000 0.001 0.000
33 0.438 0.017 143.5 1.1 0.012 0.001 0.013 0.002 0.001 0.001
34 0.366 0.006 144.5 0.4 0.013 0.001 0.025 0.001 0.001 0.000
41 0.384 0.021 139.0 1.3 0.014 0.002 0.017 0.001 0.001 0.000
50 0.481 0.052 142.8 0.5 0.013 0.001 0.016 0.002 0.002 0.000
58 0.371 0.038 139.0 0.1 0.009 0.000 0.020 0.001 0.000 0.000
59 0.445 0.012 139.8 1.4 0.010 0.000 0.014 0.001 0.000 0.000
69 0.479 0.023 147.5 0.6 0.012 0.002 0.023 0.004 0.001 0.000
83 0.395 0.010 148.5 0.7 0.015 0.002 0.013 0.001 0.002 0.000
84 0.295 0.010 141.6 0.2 0.009 0.000 0.013 0.002 0.001 0.000
85 0.469 0.008 141.6 0.6 0.012 0.001 0.018 0.002 0.001 0.000
For the performance evaluation of the participants, z-score values were calculated, after the exclusion
of the outlier results, using the robust average and robust standard deviation of the results for each
parameter as assigned value and its standard deviation. Table 09 and figures 32 to 36 show these
results.
Final Report of the Proficiency Testing in Vehicles Emissions – 8th
round
Page 30 of 42
Table 09 – z-score values for the parameters CO, CO2, THC, NOX and NMHC – Hot Cycle
CO (g/km) CO2 (g/km) THC (g/km) NOX (g/km) NMHC (g/km)
Lab Z score Lab Z score Lab Z score Lab Z score Lab Z score
01 0.65 01 0.78 01 0.42 01 -0.17 01 2.46
02 1.98 02 -0.06 02 1.82 02 1.42 02 1.46
04 -0.68 04 1.06 04 -0.28 04 -1.09 04 -1.18
05 0.79 05 0.72 05 3.22 05 0.56 05 2.13
15 -0.97 15 -0.12 15 1.40 15 -1.15 15 0.80
16 -0.61 16 -0.62 16 0.56 16 -0.84 16 0.14
28 -1.40 28 0.20 28 -0.14 28 -1.09 28 0.14
33 0.40 33 0.04 33 -0.28 33 -0.48 33 -0.19
34 -0.52 34 0.37 34 0.00 34 1.67 34 -0.52
41 -0.29 41 -1.38 41 0.42 41 0.14 41 -0.19
50 0.95 50 -0.17 50 0.14 50 0.01 50 0.47
58 -0.46 58 -1.38 58 -1.68 58 0.81 58 -1.18
59 0.49 59 -1.13 59 -1.26 59 -0.35 59 -1.18
69 0.93 69 1.29 69 -0.14 69 1.30 69 -0.52
83 -0.15 83 1.61 83 0.84 83 -0.48 83 1.13
84 -1.43 84 -0.56 84 -1.40 84 -0.54 84 -0.19
85 0.79 85 -0.54 85 -0.28 85 0.44 85 -0.52
Highlighted in blue: questionable values. In red: unsatisfactory values.
Figure 32 – z-score graph for CO measurement – Hot Cycle

Final Report of the Proficiency Testing in Vehicles Emissions – 8th
round
Page 31 of 42
Figure 33 – z-score graph for CO2 measurement – Hot Cycle
Figure 34 – z-score graph for THC measurement – Hot Cycle

Final Report of the Proficiency Testing in Vehicles Emissions – 8th
round
Page 32 of 42
Figure 35 – z-score graph for NOx measurement – Hot Cycle
Figure 36 – z-score graph for NMHC measurement – Hot Cycle
Through z-score graph analysis, it can be seen that:
CO (g/km): All participants showed satisfactory results.
CO2 (g/km): All participants showed satisfactory results.

Final Report of the Proficiency Testing in Vehicles Emissions – 8th
round
Page 33 of 42
THC (g/km): Only participant 05 showed unsatisfactory result.
NOx (g/km): All participants showed satisfactory results.
NMHC (g/km): Participants 01 and 05 showed questionable results.
7.3. Road Cycle Emissions
Table 10 shows the averages and standard deviations for each participant, where the result is the
average value of the replicates.
Note: All decimal places were considered for calculations, but the values in the tables below were
rounded to the same number of decimal places as requested in the results form.
Table 10 – Average and standard deviation of the participants for the parameters CO, CO2, THC, NOX and NMHC (g/km) – Road Cycle
Lab Code
CO CO2 THC NOx NMHC (g/km) (g/km) (g/km) (g/km) (g/km)
Average Standard deviation
Average Standard deviation
Average Standard deviation
Average Standard deviation
Average Standard deviation
10 0.137 0.006 112.8 0.3 0.006 0.000 0.008 0.001 0.002 0.000
11 0.164 0.029 117.8 0.5 0.005 0.002 0.008 0.000 0.002 0.001
13 0.120 0.018 129.5 18.5 0.003 0.000 0.006 0.000 0.001 0.000
19 0.193 0.027 117.0 0.4 0.004 0.000 0.009 0.001 0.001 0.000
26 0.183 0.011 122.4 0.2 0.004 0.000 0.009 0.000 0.001 0.000
30 0.103 0.004 114.1 0.3 0.006 0.000 0.005 0.000 0.004 0.000
48 0.167 0.004 112.8 0.4 0.005 0.000 0.007 0.001 0.002 0.000
61 0.153 0.011 112.6 0.6 0.004 0.001 0.008 0.001 0.002 0.000
66 0.103 0.002 115.0 0.4 0.003 0.000 0.007 0.002 0.001 0.000
67 0.150 0.013 117.1 0.2 0.002 0.001 0.008 0.001 0.000 0.000
70 0.174 0.015 116.7 0.8 0.003 0.000 0.008 0.000 0.000 0.000
71 0.186 0.026 113.9 0.8 0.023 0.023 0.010 0.001 0.004 0.001
72 0.142 0.002 114.0 0.3 0.003 0.000 0.010 0.001 0.000 0.000
74 0.237 0.004 116.4 0.6 0.004 0.000 0.008 0.000 NM NM
75 0.240 0.026 115.5 0.5 0.005 0.000 0.017 0.002 0.001 0.000
80 0.159 0.010 115.1 0.8 0.004 0.000 0.010 0.000 0.001 0.000
99 0.171 0.011 113.1 0.8 0.003 0.000 0.010 0.001 0.000 0.000
NM = Not Measured
For the performance evaluation of the participants, z-score values were calculated, after the exclusion
of the outlier results, using the robust average and robust standard deviation of the results for each
parameter as assigned value and its standard deviation. Table 11 and figures 37 to 41 show these
results.
Final Report of the Proficiency Testing in Vehicles Emissions – 8th
round
Page 34 of 42
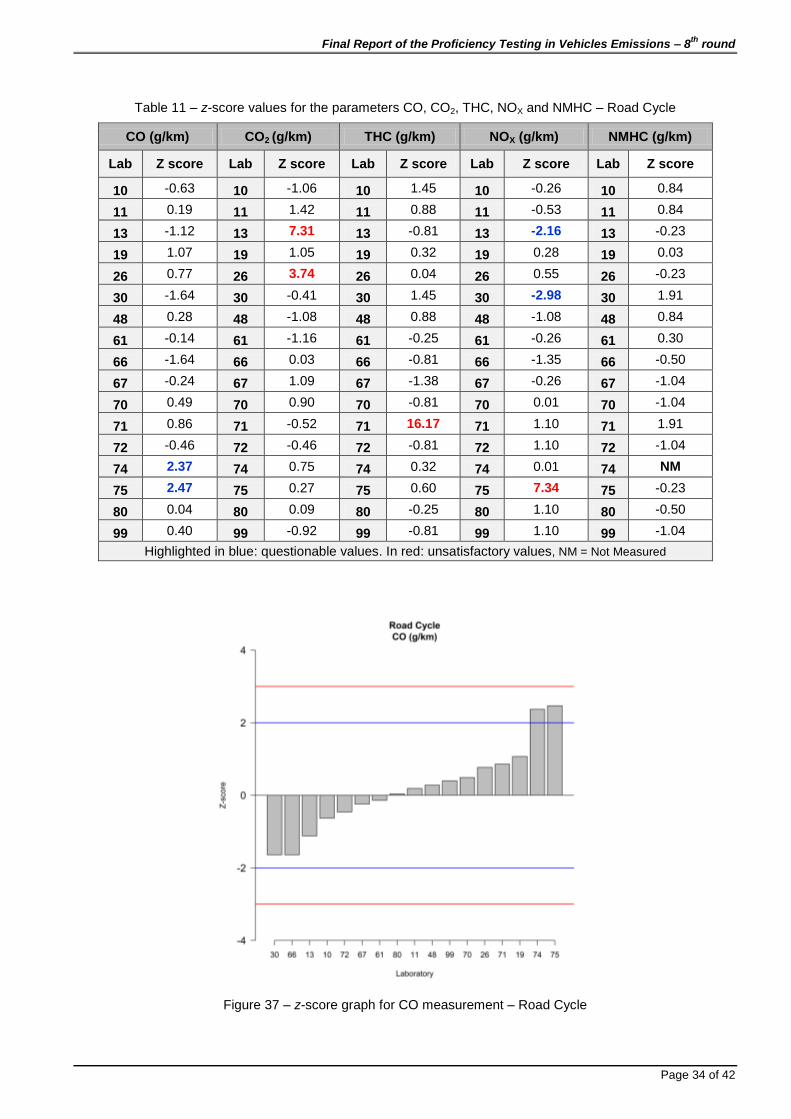
Table 11 – z-score values for the parameters CO, CO2, THC, NOX and NMHC – Road Cycle
CO (g/km) CO2 (g/km) THC (g/km) NOX (g/km) NMHC (g/km)
Lab Z score Lab Z score Lab Z score Lab Z score Lab Z score
10 -0.63 10 -1.06 10 1.45 10 -0.26 10 0.84
11 0.19 11 1.42 11 0.88 11 -0.53 11 0.84
13 -1.12 13 7.31 13 -0.81 13 -2.16 13 -0.23
19 1.07 19 1.05 19 0.32 19 0.28 19 0.03
26 0.77 26 3.74 26 0.04 26 0.55 26 -0.23
30 -1.64 30 -0.41 30 1.45 30 -2.98 30 1.91
48 0.28 48 -1.08 48 0.88 48 -1.08 48 0.84
61 -0.14 61 -1.16 61 -0.25 61 -0.26 61 0.30
66 -1.64 66 0.03 66 -0.81 66 -1.35 66 -0.50
67 -0.24 67 1.09 67 -1.38 67 -0.26 67 -1.04
70 0.49 70 0.90 70 -0.81 70 0.01 70 -1.04
71 0.86 71 -0.52 71 16.17 71 1.10 71 1.91
72 -0.46 72 -0.46 72 -0.81 72 1.10 72 -1.04
74 2.37 74 0.75 74 0.32 74 0.01 74 NM
75 2.47 75 0.27 75 0.60 75 7.34 75 -0.23
80 0.04 80 0.09 80 -0.25 80 1.10 80 -0.50
99 0.40 99 -0.92 99 -0.81 99 1.10 99 -1.04
Highlighted in blue: questionable values. In red: unsatisfactory values, NM = Not Measured
Figure 37 – z-score graph for CO measurement – Road Cycle

Final Report of the Proficiency Testing in Vehicles Emissions – 8th
round
Page 35 of 42
Figure 38 – z-score graph for CO2 measurement – Road Cycle
Figura 39 – z-score graph for THC measurement – Road Cycle

Final Report of the Proficiency Testing in Vehicles Emissions – 8th
round
Page 36 of 42
Figura 40 – z-score graph for NOx measurement – Road Cycle
Figura 41 – z-score graph for NMHC measurement – Road Cycle
Through z-score graph analysis, it can be seen that:
CO (g/km): Participants 74 and 75 showed questionable results.
CO2 (g/km): Participants 13 and 26 showed unsatisfactory results.
THC (g/km): Participant 71 showed unsatisfactory result.

Final Report of the Proficiency Testing in Vehicles Emissions – 8th
round
Page 37 of 42
NOx (g/km): Participants 13 and 30 showed questionable results and participant 75 showed
unsatisfactory result.
NMHC (g/km): Participant 74 didn´t report properly the results for this parameter. All others showed
satisfactory results.
8. Analysis Testimony
As established in the Proficiency Testing protocol, a CETESB representative witnessed one of the PT
three measurements at each laboratory participant and sent the results to the PT coordination. After
finishing the tests, each participant sent their results to the coordination for statistical treatment.
Tables 12 to 15 show the comparison between the results sent by CETESB and those sent by the
participants to PT coordination for all cycles. It is worth saying that all the sent values by CETESB
were previously discussed with each one of the participants after the testimony.
8.1. Urban Cycle Emissions
Table 12– Comparison between testimony results sent by CETESB to PT coordination and those sent by the participants for the parameters CO, CO2, THC, NOX and NMHC (g/km) – Urban Cycle
Lab Code
CO CO2 THC NOx NMHC (g/km) (g/km) (g/km) (g/km) (g/km)
CETESB PEP CETESB PEP CETESB PEP CETESB PEP CETESB PEP
03 0.904 0.904 152.8 152.8 0.153 0.153 0.022 0.022 0.121 0.121
06 0.857 0.857 158.4 158.4 0.128 0.128 0.021 0.021 0.100 0.100
22 0.897 0.897 155.1 155.1 0.103 0.103 0.020 0.020 0.076 0.076
25 0.983 0.983 161.1 161.1 0.159 0.159 0.015 0.015 0.134 0.134
27 1.048 1.048 158.2 158.2 0.153 0.153 0.026 0.026 0.120 0.120
36 0.967 0.967 148.8 148.8 0.122 0.122 0.015 0.015 0.093 0.093
39 0.978 0.978 151.7 151.8 0.094 0.094 0.015 0.015 0.064 0.064
40 1.010 1.010 158.9 158.9 0.141 0.141 0.016 0.016 0.111 0.111
45 0.935 0.935 163.9 163.9 0.120 0.120 0.015 0.015 0.093 0.093
49 0.899 0.899 156.9 156.9 0.127 0.127 0.017 0.017 0.092 0.092
51 1.028 1.028 154.5 154.5 0.174 0.174 0.012 0.012 0.143 0.143
55 0.796 0.796 154.1 154.1 0.095 0.095 0.012 0.012 0.072 0.072
65 0.844 0.845 154.0 154.4 0.136 0.136 0.019 0.019 0.105 0.105
73 0.857 0.857 151.9 151.9 0.107 0.107 0.018 0.018 0.081 0.081
77 0.805 0.805 154.6 154.6 0.115 0.115 0.011 0.011 0.089 0.089
86 1.097 1.097 155.5 155.5 0.141 0.141 0.024 0.024 0.106 0.106
92 0.975 0.975 154.9 154.9 0.137 0.137 0.015 0.015 0.107 0.107

Final Report of the Proficiency Testing in Vehicles Emissions – 8th
round
Page 38 of 42
Table 13– Comparison between testimony results sent by CETESB to PT coordination and those sent by the PT participants for the parameters ETOH, NMHC-ETOH, Total Aldehydes (g/km), Urban Autonomy (km/L)
and Road Autonomy (km/L) – Urban Cycle
Lab Code
ETOH (g/km)
NMHC-ETOH (g/km)
Aldeídos Totais (g/km)
Autonomia urbana (km/L)
Autonomia estrada (km/L)
CETESB PEP CETESB PEP CETESB PEP CETESB PEP CETESB PEP
03 0.1900 0.1900 0.039 0.039 0.0120 0.0121 9.31 9.31 12.64 12.64
06 0.1456 0.1456 0.032 0.032 0.0095 0.0095 9.02 9.02 12.36 12.37
22 0.1010 0.1001 0.037 0.037 0.0059 0.0060 9.13 9.13 12.19 12.19
25 0.1760 0.1761 0.084 0.084 0.0037 0.0037 8.82 8.82 12.23 12.23
27 0.1970 0.1970 0.074 0.074 0.0110 0.0110 8.98 8.98 12.29 12.29
36 0.1835 0.1835 0.011 0.011 0.0102 0.0102 9.55 9.55 12.57 12.57
39 0.1308 0.1308 0.012 0.012 0.0045 0.0045 9.38 9.38 12.69 12.70
40 0.1946 0.1946 0.021 0.021 0.0129 0.0127 8.94 8.94 12.70 12.70
45 0.6994 0.6994 - -0.239 0.0063 0.0063 8.69 8.69 11.76 11.76
49 0.1935 0.1935 0.007 0.007 0.0113 0.0113 9.02 9.02 12.27 12.27
51 - - - - - - 8.98 8.98 12.54 12.54
55 0.1176 0.1176 0.026 0.026 0.0090 0.0090 9.24 9.24 12.24 12.24
65 0.1529 0.1529 0.033 0.033 0.0096 0.0096 9.28 9.28 12.54 12.54
73 0.1478 0.1478 0.019 0.019 0.0045 - 9.32 9.32 12.57 12.57
77 0.2790 0.2790 0.030 0.030 0.0079 0.0079 9.22 9.21 12.79 12.79
86 0.1427 0.1427 0.081 0.081 0.0083 0.0083 9.14 9.14 12.66 12.67
92 0.1649 0.1649 0.033 0.033 0.0137 0.0137 9.17 9.17 12.13 12.13
Discrepancies were found in 13 of 170 sent results (7,6 %) for the urban cycle. 10 among 17
participants of this PT round showed any discrepancy between the values sent by CETESB and those
informed by the participants to the PT coordination. These discrepancies are mainly due to rounding
or digitation errors by the participant when sending the results to PT coordination.
8.2. Hot Cycle Emissions
Table 14 – Comparison between testimony results sent by CETESB to PT coordination and those sent by the PT participants for the parameters CO, CO2, THC, NOX and NMHC (g/km) – Hot Cycle
Lab Code
CO CO2 THC NOx NMHC (g/km) (g/km) (g/km) (g/km) (g/km)
CETESB PEP CETESB PEP CETESB PEP CETESB PEP CETESB PEP
01 0.463 0.463 146.9 146.9 0.017 0.017 0.016 0.016 0.006 0.006
02 0.598 0.598 143.8 143.9 0.015 0.015 0.023 0.023 0.001 0.001
04 0.327 0.327 146.8 146.8 0.013 0.013 0.010 0.010 0.000 0.000
05 0.430 0.430 149.1 149.1 0.025 0.025 0.013 0.013 0.005 0.005
15 0.319 0.319 143.3 143.3 0.012 0.012 0.010 0.010 0.002 0.002
16 0.391 0.391 142.1 142.1 0.016 0.016 0.009 0.009 0.001 0.001
28 0.288 0.288 144.2 144.2 0.010 0.010 0.010 0.010 0.001 0.001
33 0.416 0.416 144.3 144.3 0.013 0.013 0.011 0.011 0.002 0.002
34 0.375 0.375 144.6 144.6 0.013 0.013 0.026 0.026 0.001 0.001
41 0.389 0.389 137.2 137.2 0.015 0.015 0.015 0.015 0.001 0.001

Final Report of the Proficiency Testing in Vehicles Emissions – 8th
round
Page 39 of 42
Lab Code
CO CO2 THC NOx NMHC (g/km) (g/km) (g/km) (g/km) (g/km)
CETESB PEP CETESB PEP CETESB PEP CETESB PEP CETESB PEP
50 0.440 0.440 142.7 142.7 0.013 0.013 0.014 0.014 0.002 0.002
58 0.384 0.384 139.1 139.1 0.009 0.009 0.019 0.019 0.000 0.000
59 0.446 0.446 137.8 137.9 0.010 0.010 0.016 0.016 0.000 0.000
69 0.502 0.502 148.4 148.3 0.013 0.013 0.021 0.021 0.001 0.001
83 0.385 0.385 148.7 148.7 0.014 0.014 0.013 0.013 0.002 0.002
84 0.308 0.308 141.9 141.9 0.009 0.009 0.016 0.016 0.001 0.001
85 0.464 0.464 141.3 141.3 0.011 0.011 0.016 0.016 0.001 0.001
Discrepancies were found in 3 of 85 sent results (3.5 %) for the hot cycle. 3 among 17 participants of
this PT round showed any discrepancy between the values sent by CETESB and those informed by
the participants to the PT coordination.
8.3. Road Cycle Emissions
Table 15 – Comparison between testimony results sent by CETESB to PT coordination (PEP) and those sent by the PT participants for the parameters CO, CO2, THC, NOX and NMHC (g/km) – Road Cycle
Lab Code
CO CO2 THC NOx NMHC (g/km) (g/km) (g/km) (g/km) (g/km)
CETESB PEP CETESB PEP CETESB PEP CETESB PEP CETESB PEP
10 0.133 0.133 113.1 113.1 0.006 0.006 0.010 0.010 0.003 0.003
11 0.154 0.154 118.4 118.4 0.003 0.003 0.008 0.008 0.001 0.001
13 0.124 0.124 116.5 116.5 0.003 0.003 0.006 0.006 0.001 0.001
19 0.156 0.156 117.3 117.3 0.005 0.005 0.007 0.007 0.002 0.002
26 0.172 0.172 122.2 122.2 0.004 0.004 0.009 0.009 0.001 0.001
30 0.096 0.097 113.8 113.8 0.006 0.006 0.004 0.004 0.003 0.004
48 0.165 0.165 112.3 112.3 0.005 0.005 0.006 0.006 0.003 0.003
61 0.141 0.141 112.0 112.0 0.003 0.003 0.009 0.009 0.001 0.001
66 0.105 0.105 115.4 115.4 0.003 0.003 0.009 0.009 0.000 0.000
67 0.138 0.138 116.9 116.9 0.003 0.003 0.007 0.007 0.000 0.000
70 0.194 0.194 117.2 117.2 0.003 0.003 0.008 0.008 0.000 0.000
71 0.176 0.176 113.5 113.5 0.005 0.055 0.008 0.008 0.003 0.003
72 0.139 0.139 113.6 113.6 0.003 0.003 0.009 0.009 0.000 0.000
74 0.241 0.241 117.3 117.3 0.005 0.005 0.009 0.009 NM NM
75 0.217 0.217 116.2 116.2 0.005 0.005 0.019 0.019 0.001 0.001
80 0.159 0.159 114.2 114.2 0.004 0.004 0.009 0.009 0.001 0.001
99 0.168 0.168 113.2 113.3 0.003 0.003 0.009 0.009 0.000 0.000
Discrepancies were found in 4 of 85 sent results (4.7 %) for the road cycle. 3 among 17 participants of
this PT round showed any discrepancy between the values sent by CETESB and those informed by
the participants to the PT coordination, as one participant reported two discrepant results.

Final Report of the Proficiency Testing in Vehicles Emissions – 8th
round
Page 40 of 42
9. Confidentiality
Each participant was identified by an individual code which is only known by the participant and the
PT coordination. As stated on the registration form, the identification of accredited laboratories and
laboratories in stage of accreditation will be forwarded for information of Accreditation General
Coordination (Cgcre). The participant received, by email, his own identification code corresponding to
the participation in this PT. This code was used to identify the participant in the results registration
form. The results may be used in studies and publications by INMETRO respecting the confidentiality
of each participant.
As established in section 4.10.4 of ABNT ISO/IEC 17043:2011, in exceptional circumstances, a
regulatory authority may require the results and the identification of the participants to the PT
provider. If this occurs, the provider will notify the PT participants about this action.
10. Conclusions
Proficiency Testing Schemes in vehicle emissions is a type of study carried out only in Brazil and,
considering the particular features of such study, we can conclude that the results are very
satisfactory and this initiative is very important to the industry and society along these eight rounds
held in collaboration between Inmetro and AEA.
In this round, 3 Proficiency Testing Schemes were carried out, involving a large number of variables
and the testimony of a regulation body (CETESB). This large numbers of variables in the vehicle
emissions PT certainly have influence in the reported results. Therefore it is recommended that
participants that showed questionable performance to critically evaluate their measurement methods.
Some discrepancies between the reported results during CETESB testimony and those sent to PT
coordination were observed. They were digitation or round errors that did not influence the quality of
the results, but these discrepancies denote a checking problem before sending the results to PT
coordination. It is an opportunity to improve the data checking procedures after the analysis.
It is worth saying that for this round the acceptance limits were lowered, as those results out of Ref ±
2s limits were considered outliers. In other rounds these results could be considered as satisfactory
and they became questionable or unsatisfactory due to the new criteria.
It was observed then a slight decrease on measurement performance compared to last rounds, as for
urban cycle 88.1 % of the reported results were satisfactory, six results not correctly reported or not
measured (3.5 %), seven questionable results (4.1 %) and 7 others unsatisfactory (4.1 %).
Final Report of the Proficiency Testing in Vehicles Emissions – 8th
round
Page 41 of 42
For the Hot cycle, 94 % of the reported results were satisfactory, 2 were questionable (4 %) and 1
was unsatisfactory (2 %).
For road cycle, 76 results were considered satisfactory (89 %), one did not report the result or did not
measure the parameter (2 %), 4 questionable results (4.5 %) and other 4 unsatisfactory results (4.5
%)
It should be emphasized the importance of different laboratory participation in a proficiency test
scheme, since it constitutes an useful tool to monitor the procedures in routine analysis and to
evaluate the laboratory measurement results, enabling the improvement of the results quality and
ensuring greater reliability of the measurements.
It is up to PT participant to carry out a critical analysis of the results, where the entire process and
laboratory experience must be considered. Therefore, the continuous participation in a proficiency test
can assure information to the laboratory about the measurement capability and it is of great
importance for monitoring the validity of the results.
11. Participating Laboratories
Nineteen laboratories were registered in the 8th round of the Car Emissions Proficiency Test and
seventeen attended to it because two of them had equipment problems and informed the
coordination. The list of laboratories that sent results to this PT coordination is presented in Table 16.
It is important to note that the numbering of the laboratories in the table only indicates the number of
participants in the PT, under no circumstances it is associated to laboratory identification in presenting
their results.
Table 16 – Participating Laboratories
Institution
1. CAOA Montadora de Veículos Centro de Pesquisas e Eficiência Energética
2. Continental Brasil Indústria Automotiva Ltda Laboratório de Emissões Veiculares – Centro Tecnológico “Geraldo Negri Rangel”
3. Delphi Automotive Systems do Brasil Ltda.
4. FCA Fiat Chrysler Automóveis Brasil Ltda Laboratório de Emissões e Consumo
5. Ford Motor Company Brasil Ltda Laboratório de Emissões do Campo de Provas de Tatuí
6. General Motors do Brasil Ltda Laboratório de Emissões do Campo de Provas de Cruz Alta
7. Honda Automóveis do Brasil Ltda Laboratório de Emissões Honda Automóveis
8. Instituto de Tecnologia para o Desenvolvimento – Institutos LACTEC LEME – Laboratório de Emissões Veiculares
9. Magneti Marelli Sistemas Automotivos Indústria e Comércio Ltda

Final Report of the Proficiency Testing in Vehicles Emissions – 8th
round
Page 42 of 42
Institution
10. Peugeot Citroen do Brasil Automotive Ltda
11. Petróleo Brasileiro S.A. Laboratório de Ensaios Veiculares - CENPES
12. Renault do Brasil S/A LEV – Laboratório de Emissões Veiculares
13. Robert Bosch Ltda Laboratório de emissões veiculares – Robert Bosch
14. SENAI – Serviço Nacional de Aprendizagem Industrial Laboratório de Emissões Veiculares – IST AUTO
15. Toyota do Brasil Ltda Laboratório de Emissões Indaiatuba
16. Umicore Brasil Ltda Laboratório de Emissões Veiculares - Umicore
17. Volkswagen do Brasil Ltda Laboratório de Emissões Veiculares da Volkswagen do Brasil Ltda
Total participants: 17 laboratories.
12. Bibliographic References
ABNT NBR ISO/IEC 17025:2005: Requisitos gerais para a competência de laboratórios de ensaio
e calibração.
ABNT NBR ISO/IEC 17043:2011: Avaliação de conformidade – Requisitos gerais para ensaios de
proficiência.
ISO 13528:2015 (E), “Statistical methods for use in proficiency testing by interlaboratory
comparisons”.
Vocabulário Internacional de Metrologia: Conceitos fundamentais e gerais e termos associados
(VIM 2012). Duque de Caxias, RJ: INMETRO, 2012. Portuguese version of “International
Vocabulary of Metrology - Basic and general concepts and associated terms JCGM 200:2012. 3rd.
ed. 2012”.
_______________
